Embed Size (px)
Citation preview

University of Northern ColoradoScholarship & Creative Works @ Digital UNC
Dissertations Student Research
12-1-2012
Professional basketball consumer behavior: ananalysis of the NBA servicscape, atmospheric musicand attendee attitudes, emotional responses, andbehaviorsCrystal Southall
Follow this and additional works at: http://digscholarship.unco.edu/dissertations
This Text is brought to you for free and open access by the Student Research at Scholarship & Creative Works @ Digital UNC. It has been accepted forinclusion in Dissertations by an authorized administrator of Scholarship & Creative Works @ Digital UNC. For more information, please [email protected].
Recommended CitationSouthall, Crystal, "Professional basketball consumer behavior: an analysis of the NBA servicscape, atmospheric music and attendeeattitudes, emotional responses, and behaviors" (2012). Dissertations. Paper 255.

UNIVERSITY OF NORTHERN COLORADO
Greeley, Colorado
The Graduate School
PROFESSIONAL BASKETBALL CONSUMER BEHAVIOR: AN ANALYSIS OF THE NBA SERVICESCAPE,
ATMOSPHERIC MUSIC AND ATTENDEE ATTITUDES, EMOTIONAL RESPONSES
AND BEHAVIORS
A Dissertation Submitted in Partial Fulfillment of the Requirement for the Degree of
Doctor of Philosophy
Crystal Southall
College of Natural and Health Sciences School of Sport and Exercise Science
Sport Administration
December 2012

ii
This dissertation by: Crystal Southall Entitled: Professional Basketball Consumer Behavior: An Analysis of the NBA Servicescape, Atmospheric Music and Attendee Attitudes, Emotional Responses and Behaviors has been approved as meeting the requirement for the Degree of Doctor of Philosophy in College of Natural and Health Sciences in School of Sport and Exercise Science, Program of Sport Administration
Accepted by the Doctoral Committee ____________________________________________________ Dianna P. Gray, Ph.D., Chair ____________________________________________________ David K. Stotlar, Ph.D., Committee Member ____________________________________________________ Bob Brustad, Ph.D., Committee Member ____________________________________________________ Susan R. Hutchinson, Ph.D., Committee Member
Date of Dissertation Defense __May 4, 2012_______________ Accepted by the Graduate School
_________________________________________________________ Linda L. Black, Ed.D., LPC
Acting Dean of the Graduate School and International Admissions

iii
ABSTRACT
Southall, Crystal. Professional basketball consumer behavior: An analysis of the NBA servicescape, atmospheric music and attendee attitudes, emotional responses, and behaviors. Published Doctor of Philosophy dissertation University of Northern Colorado, 2012
Sport is a unique product within the domain of entertainment and leisure services.
Although the sport industry continues to grow, sport spectatorship has changed
dramatically, with fans consuming sport through a variety of media outlets such as
television and the Internet. Sport consumers can now watch live, delayed, or recorded
sporting events when and where they choose, therefore sport organizations must focus
their attention on sustainability through the creation of a competitive advantage in the
staging of live sporting events. The National Basketball Association product is consumed
in an increasingly stimulating consumptive landscape and therefore was the focus of the
present study.
The purpose of the present study was to examine the extent to which professional
basketball involvement influences attitudes toward the home team. This study also
investigated the relationship between NBA involvement and team loyalty on emotional
responses the servicescape and interpretation of atmospheric music. Data collection for
this study took place during the 2010-2011 NBA season. Utilizing a cluster sampling
procedure, 800 surveys were distributed during two separate games. A total of 425
participants completed the 42-item instrument, resulting in a 53% response rate.
iv
To analyze the relationship between NBA involvement and loyalty to the home
team an independent samples t test was utilized. The results revealed a positive
relationship. One-way MANOVA analyses revealed significant main effects for both
involvement and loyalty on the servicescape variables (arousal and pleasure) grouped
together. Further, significant main effects were revealed for involvement and loyalty on
the linear composite of music interpretation scores (liking, congruency, and distraction).
Lastly, a cluster analysis was performed using Ward’s (1963) method of hierarchical
agglomeration to better understand which explanatory variables cluster participants into
discernible and meaningful groups. Results revealed four meaningful clusters of
participants.
The present study revealed a positive relationship between NBA involvement and
team loyalty. Further, heightened emotional responses and increasingly positive
perceptions of atmospheric music were experienced by highly involved and loyal
participants. Results support the significant impact the servicescape has on the live sport-
consumption experience. Since the goal of sport marketers is to attract and retain highly
involved and loyal fans, sport marketers should work to control the service environment
in order to increase sport-consumers’ levels of pleasure and arousal, thereby increasing
the frequency of purchase and repurchase intentions.

v
TABLE OF CONTENTS
CHAPTER PAGE
I. INTRODUCTION…………………………………………………. 1
Purpose Research Questions and Hypotheses Rationale for the study Delimitations Limitations Definitions of terms
II. REVIEW OF LITERATURE……………………………………… 14 The Sport Product, Sport Consumer and Branding Sport Consumer Behavior The Production and Presentation of Sport Conclusion
III. METHODOLOGY……………………………………………….. 51 Sample Instrumentation Design and Procedures Statistical Techniques and Data Analysis
IV. AN ANALSYSIS OF NBA INVOLVEMENT AND TEAM LOYALTY ON CONSUMER ATTITUDES AND EMOTIONAL RESPONSES ……………………………………………………... 79 Review of Literature Purpose and Hypotheses Method Results Discussion

vi
CHAPTER PAGE
V. AN INVESTIGATION OF NBA INVOLVEMENT AND
LOYALTY TO THE HOME TEAM…………………………..... 105 Introduction Review of literature Method Results Discussion
REFERENCES……………………………………………………….. 132
APPENDIX A – SURVEY INSTRUMENT.………………………….. 146 APPENDIX B – INFORMED CONSENT FOR PARTICIPATION IN RESEARCH…………………………………………… 151 APPENDIX C – IRB APPROVAL LETTER...………………………. 153

vii
LIST OF TABLES
TABLE PAGE
1. Summary of Adapted Scales………………………….………… 56
2. PCM Facet Scoring …………….……………………………….. 61
3. Demographic Information of Current sample…………………… 92
4. Mean Arousal and Pleasure Scores by Involvement group...….... 94
5. Mean Arousal and Pleasure Scores by Loyalty Group ……….…. 95
6. Atmospheric Music Interpretation Scores by Involvement Group.. 96
7. Atmospheric Music Interpretation Scores by Loyalty Group……... 98
8. Cluster Means, Standard Deviations and Z-scores……………..…. 118
9. Cluster Purchase Intentions and Behaviors……………………….. 119
10. Select Demographic Information of NBA Cluster ………...……… 120
11. Select Demographic Information of Model Cluster………………. 121
12. Cluster Atmospheric Music Interpretation Scores………….…….. 123

1
CHAPTER I
INTRODUCTION
Estimates of the economic worth and impact of the sport industry continue to
grow. In 1995 it was estimated that the sport industry in the United States was a $62
billion business (Meek, 1997). More recent estimates, place the value of the sport
industry, including both the production and consumption of the sport product, in excess
of $152 billion (Broughton, Lee, & Netheny, 1999), with some estimates as high as $410
billion (Plunkett Research, 2009), with estimates of annual consumer spending alone
exceeding $250 billion (Crompton, 2004). Milano and Chelladurai (2011), in an
investigation of the 2005 Gross Domestic Sport Product (GDSP), provided similar
estimates (between $168billion to $207billion). Further, according to Trail and James
(2008) the U.S. sport-fan population is estimated at 200 million.
Although the sport industry continues to grow and expand (Masteralexis, Barr, &
Hums, 2008; Pedersen, Miloch, & Laucella, 2007), sport organizations must focus their
attention on sustainability through the creation of a competitive advantage. In today’s
marketplace sport organizations not only compete for consumers within their league, but
also organizations in other sports or industry segments. In addition alternate forms of
leisure and entertainment such as theatre, film, recreational activities, and theme parks
are also direct competitors for sport-consumers’ discretionary income. Further, sport
spectatorship has changed dramatically, with fans consuming sport through a variety of

2
media outlets such as television and the Internet. As a result, sport consumer can now
watch live, delayed, or recorded sporting events when and where they choose.
According to Nielsen (2010; 2012) data, there were over 43,700 hours of live
sporting events broadcast in 2009 on both cable and network television, which increased
to 42,500 hours of live sporting events that were broadcast in 2011. The National
Basketball Association (NBA) also saw television revenues increase dramatically, from
$275 to $365 million annually, during the decade between 1995 and 2005 (Ourand &
Lombardo, 2007). These estimates do not include rebroadcasts of events nor highlight
shows dedicated to recapping recent action. Additionally, with the advent of digital video
recorders (DVRs) such as TiVo, sport consumers are no longer constrained by scheduled
start times.
Even though today’s sport consumer has many viewing options, attendance at live
sporting events continues to be a significant source of revenue generation for sport
organizations. Ticket sales are the life-blood of the industry, the foundation upon which
all other sources of revenue (e.g., sponsorships, media contracts) depend (Southall &
Dick, 2011), with the NBA alone typically generating 35% of its revenue from gate
receipts (Schnietz, 2005). Within the United States recent estimates place the amount of
money spent on attending sporting events at over $11 billion annually (Howard &
DeSchriver, 2005). Further, in the three decades between 1970 and 2000 overall
attendance figures for the four major professional sport leagues in the United States
increased 163% from 49 million to 128 million spectators annually (Moag & Company,
2002).

3
With the continued growth of the sport industry, as well as the various modes of
sport consumption, the creation of a highly involved and loyal fan base has increased
significance for sport organizations, as the creation and maintenance of such a foundation
is essential for sustainability at the organizational level. Similar to any other industry and
product, sport consumption is the result of choices made by individual consumers.
According to Funk (2008), within the context of sport, consumer behavior stems from
individuals’ desire to seek out a consumption experience in order to satisfy internal needs
and obtain associated benefits. Thus, it is essential for sport organizations and sport
marketers to identify and understand significant influencers of consumer attitudes related
to the sport consumption experience, and thus what drives sport consumption behaviors.
Given the unique nature of sport and the sport product, there is a need for sport
specific consumer behavior research to examine the relationship between involvement
with a specific sport league and loyalty to a specific franchise. Further, there is also a
need for research to examine the experiential sport environment, in order to investigate
how sport organizations may use elements in the space surrounding the presentation of
the sport product to enhance both the experience of spectators, as well as their brand,
thereby influencing consumer attitudes and behaviors which are antecedents of
involvement, and thus by extension loyalty.
Purpose
The purpose of the present study was to examine the relationship between
spectators’ involvement with the NBA and the level of attitudinal loyalty to a particular
NBA team. Involvement is conceptually defined for the present study as an unobservable
state of interest, arousal or motivation toward the attendance of NBA games, that is
4
induced by stimuli within a particular environment that mediates resultant sport consumer
attitudes and behavior (Havitz & Dimanche, 1997; Rothschild, 1984). Attitudinal loyalty
to a particular NBA team exists when an individual forms a psychologically meaningful
connection and attachment to a team that is enduring and resistant to change when
presented with alternatives or negative change (Heere & Dickson, 2008). Thus,
involvement can be situational or change over time, while loyalty persists over time and
is possible only when high levels of involvement have been achieved by an individual.
Sport spectators’ purchase intentions and purchasing behaviors were also
examined in the present study. Behavioral purchase intentions and actual purchasing
behaviors have been used in past research as an indicator of both involvement and loyalty
(e.g., Gladden & Milne, 1999; Howard & Crompton, 1995; Mullin, Hardy, & Sutton,
2007). According to Day (1969) the repeated purchase of a product does not indicate
loyalty unless the consumer is highly involved with the product, thus displaying a
psychological commitment to the brand through loyalty. Given that high levels of
involvement are precursors of loyalty, a multidimensional concept that includes both
behavioral and attitudinal components, it is necessary to fully understand both sport
consumer involvement and loyalty in the present context. Additionally, participants’
purchasing and attendance behaviors were investigated to better understand the degree to
which they are correlated to emotional responses elicited by the servicescape, as well as
the interpretation of the atmospheric music within the consumptive sport environment.
Today’s sport marketplace has become increasingly cluttered and therefore,
increasingly competitive for the time, money, and emotional investment of consumers
(CITE?). Given the nature of the sport industry as well as the unpredictable nature of the

5
sport product, the establishment of a loyal fan base is of increasing importance to sport
organizations. Franchises, or teams, are individual brands of their particular sport.
Enhancing the value of the team’s brand, through the creation of brand equity in the
minds’ of sport consumers, is essential in the creation of team loyalty. According to
Amis, Slack, and Barrett (1999) the establishment of a foundation of loyal consumers is
important as it can help to insulate an organization from external threats, as the revenue
they generate can be relied upon, thus giving the organization time to react to
environmental pressures.
Emotional responses to the environment, within which the sport product is both
produced and consumed, were also investigated in the present study. The consumption of
live sporting events takes place within an experiential service environment referred to as
the servicescape (Bitner, 1992). Atmospheric music within the servicescape provides
aural cues to sport consumers while they are in attendance of events. Sport organizations
are in control of the atmospheric music being played, and therefore can use the music to
create meaningful memories and associations with the consumptive experience and the
sport brand in the minds’ of consumers. Thus, responses to the servicescape and
atmospheric music may result in both positive and negative brand associations and thus
increase, or decrease, brand equity. The present study examined the extent to which
attendee’s levels of involvement with the NBA and attitudinal loyalty to team were
related to the emotional responses elicited by stimuli presented in the servicescape during
an NBA game.

6
Research Questions and Hypotheses
Q1 To what extent is the level of NBA involvement related to participants’ loyalty to the home team?
H1.1 A participant’s level of involvement with professional basketball will be
positively related to a participant’s level of loyalty to the home team.
Q2 To what extent are NBA involvement and team loyalty levels related to participants’ emotional responses to the servicescape?
H2.1 Participants’ level of involvement with professional basketball will be
positively related to their reported levels of arousal and pleasure experienced while in attendance of the game.
H2.2 Participants’ level of loyalty to the home team will be positively related to
their reported levels of arousal and pleasure experienced while in attendance of the game.
Q3 To what extent are levels of NBA involvement and NBA team loyalty related to
the interpretation of the atmospheric music played during the game?
H3.1 Participants’ level of involvement with professional basketball will be positively related to the music interpretation scores of liking, congruency and distraction.
H3.2 Participants’ level of loyalty to the home team will be positively related to
the music interpretation scores of liking, congruency and distraction.
Q4 Which explanatory variables cluster participants into discernible and meaningful groups?
Rationale for the Study
Consumer behavior research is vital in all industries, as it makes it possible for
organizations to enhance their understanding of the wants and needs of consumers,
thereby allowing for the construction and implementation of strategic marketing

7
initiatives that resonant with consumers. In the sport industry, consumer behavior
research is of particular importance given the nature of sport and the dynamic sport
product that is unpredictable and dependent on the success of the team (Mullin, Hardy, &
Sutton, 2007). The sport consumer is also unique as the motives behind consumption
fulfill both individual and social needs through attainment of intangible attributes and
benefits of the sport brand (Keller, 1993). Further, research that focuses on the attitudes
and behaviors of the sport spectator is needed as the consumption of sport continues to
change, while at the same time spectators still represent the foundation from which
organizations create an involved and loyal fan base.
Within the sport marketing literature there is a lack of agreement and consistency
among researchers as to operational definitions of involvement and loyalty, as well as the
constructs and processes that underlie the achievement of both within sport. Although
inconsistencies exist, there is a general understanding that in order to remain competitive
in an ever changing and expanding sport industry, sport organizations must create loyalty
among their fans that is resistant to external pressures as well as poor performance (Funk
& Pastore, 2000; Heere & Dickson, 2008). Loyalty is formed over time as a result of
increased psychological and behavioral involvement. Further, according to Funk and
James’ (2001, 2006) Psychological Continuum Model the highest level of involvement
(allegiance) is synonymous with definitions of attitudinal loyalty presented in the
literature. Thus, the present study attempts to bridge the knowledge gap between sport
involvement and loyalty by examining the relationship between NBA-league
involvement and loyalty to a particular NBA team. Thus, the present study will add to the
sport marketing literature by providing a significant link between the constructs of
8
involvement and loyalty, through the interaction between NBA involvement and NBA
team loyalty.
In addition, this study also provides crucial information regarding the influence
the sport environment, or servicescape, can have on consumer attitudes and behaviors.
The interpretation and valuation of the servicescape by consumers can either enhance or
detract from an organization’s brand. Atmospheric music is a controllable form of
stimuli within the experiential sport servicescape that can be used by sport marketers to
create positive and meaningful brand associations in the minds’ of consumers, thereby
mediating resultant attitudes and behaviors (Gladden & Funk, 2002). Therefore, this
study attempts to provide empirical support for the relative impact environmental stimuli
and atmospheric music have on sport consumers.
Finally, the present study provides insight into the purchase intentions and
behavioral purchasing behaviors of NBA attendees at varying levels of league
involvement and team loyalty. The consumer’ level of involvement with a particular
product, or service, has been shown to directly impact attitudes and behaviors, as a result
of increased relevance and importance of and commitment to the product (Kyle, Absher,
Norman, Hammitt, & Jodice, 2007; Zaichkowsky, 1985). Attitudinal product loyalty is
achieved when importance of the product has been confirmed and a psychological
commitment has also been forged with the product over time. This enduring connection
has also been shown to affect attitudes and behaviors, as the consumption of the product
satisfies internal psychological needs (Havitz & Howard, 1995). Thus, results of this
study will provide additional insight into the use of such traditional indicators of success
with respect to varying involvement and loyalty levels within the sport domain.

9
In summary, sport is a unique product that is produced and consumed within a
highly competitive and rapidly changing marketplace. Consumption of sport is no longer
limited to live event attendance. The sport product can now be consumed via traditional
media outlets, as well as emergent television and internet outlets dedicated solely to the
presentation of sport content. In a marketplace full of alternatives and substitutes, sport
managers must understand the motives of spectators. Further, managers must also
recognize the importance of the environment in enhancing the experience of certain
consumer segments in order to add value to the sport brand, thereby creating meaningful
brand associations which will have a marked impact on consumer attitudes and
repurchase intentions. Adding value to the sport brand will also aid in the creation of a
loyal base of sport consumers, which is necessary to create a sustainable competitive
advantage. Sport managers must focus on creating meaningful connections with
consumers who are not yet loyal fans, in order to move them up the involvement
continuum. Thus, the current investigation will provide valuable insight into the
relationship between involvement at the league level and team loyalty, and consequently
the effect this interaction has on resultant attitudes and behaviors. Additionally, a more in
depth understanding of the important elements and stimuli that influence the consumption
of the experiential NBA sport product will be gained.
Delimitations
The present study examined the relationship between sport consumer involvement
and loyalty, and how varying levels of the two constructs impact and influence consumer
attitudes and behaviors, as well as responses to the servicescape Data were collected
through self-administered surveys given to home-game attendees of a NBA team while

10
inside the team’s respective arena. The results of the study therefore cannot be assumed
to be representative of all organizations within the NBA. Further, it cannot be assumed
that the results can be generalized to other professional sport leagues such as:
professional football, professional hockey and professional baseball. However, according
to Schnietz and colleagues (2005) the construction of the sample is representative of
NBA attendees, or fans, and therefore, some of the consumer involvement information
generated from the data may be generalizable to the population of NBA consumers.
The variables and instrument used to measure involvement and loyalty were
selected after a comprehensive review of the business, leisure, and sport literature
respectively. The use of the selected measures does not imply that they are the only
indicators of sport involvement and attitudinal loyalty. Variables used to gauge
participants’ attitudes toward atmospherics in the servicescape were also selected after a
thorough review of relevant consumer behavior and psychology literature. Similarly, it is
not the intention of the study to imply that the selected variables are the only indicators of
team loyalty, consumer attitudes and reactions to the servicescape and therefore, the only
antecedents of purchase or attendance intentions.
Limitations
1. Due to time, cost, and convenience constraints of both the researcher and participants,
only one instrument was used to gauge participants’ level of involvement. Alternative
instruments which could be employed to measure consumer sport involvement were
therefore excluded.
2. Due to time, cost, and convenience constraints of both the researcher and participants,
only one scale was used to measure participants’ level of attitudinal loyalty.

11
Alternative instruments which could be used to measure the construct of attitudinal
loyalty were therefore not included in the present study.
3. This study utilized a survey instrument that was administered using a face-to-face
mode of dissemination as the primary method of data collection. As such, response
errors may exist, such as: not knowing the answer, providing socially desirable
responses, ambiguity in instructions or definition of terms, and intentionally
providing the incorrect answer or leaving an item blank (Raj, 1972).
4. The study relied heavily on quantitative methods by which to explain the effects of
the servicescape on professional sport involvement, consumer attitudes and
behaviors. Alternative methods, such as qualitative research methods may have been
utilized; thereby presenting a more in depth understanding of participant attitudes and
thus the phenomena under investigation.
5. This study employed cluster sampling techniques in order to create a sampling frame
by which to generate parameter estimates to represent the target population. This
method was used due to time, cost, and logistical constraints given the design of the
study. Alternative sampling methods which could be used to create a sampling frame
were therefore not utilized in the present study. As such, the general increase in
sampling error that is associated with cluster sampling (Som, 1973) must be taken
into consideration when interpreting results.
Definitions of Terms
Atmospherics: Aspects of the in-store environment that are created and present
cues, which are processed and interpreted by consumers (Kotler, 1973). Cues are in-turn

12
used by consumers to create attitudes and resultant behaviors toward products and
services.
Attitudinal Loyalty: The process of forming a psychologically meaningful
connection and attachment to a team that is enduring and resistant to change.
Behavioral Loyalty: The amount, frequency, and duration of purchasing behavior
related to a particular team.
Consumer Behavior: Attitudes, beliefs and emotional responses to products and
services which elicit marked responses by consumers; as indicated by repeat purchase or
attendance behaviors.
Consumptive Environment: The space within which consumers actively purchase,
and thus consume, a product or service.
Emotional States: Core set of responses that occur in reaction to the physical
environment, which includes: arousal, dominance, and pleasure. According to Mehrabian
and Russell (1974) these three emotional dimensions constitute parsimonious descriptors
that can be used to measure emotional responses to environments, as well as stimuli
located and experienced within environments. A modified version of Mehrabian and
Russell’s Approach-Avoidance self-report model was used in this study to measure the
emotional dimensions of arousal and pleasure within the professional sport consumptive
environment.
Involvement: In general, definitions of involvement are rooted in Rothchild’s
(1984) definition which describes involvement as a state of motivation, attraction to,
arousal by, or interest in a particular event or object. Involvement research originated in
the psychology domain and has evolved and been applied to studies performed to

13
investigate consumer behavior, leisure, and more recently sport. The Psychological
Continuum Model (PCM; Funk, 2001) was used in the present study to measure
professional sport involvement.
Servicescape: The servicescape, as defined by Bitner (1992), encompasses all of
the physical factors and elements contained within the service or consumer setting.
Further, the physical factors can be controlled by an organization in order to elicit
preferred consumer responses.
Sport Consumption: The active consumption of the sport product and has many
forms such as the live, televised, or computer-based viewing of a sporting event. Sport
consumption can also connote the purchase of memorabilia and merchandise, as well as
engaging in fantasy sporting leagues, betting pools or gambling. In the present study
sport consumption is understood to denote one’s presence at a live sporting event.
14
CHAPTER II
REVIEW OF LITERATURE
The review of literature for the present study is divided into three main sections.
The first section is dedicated to the distinct nature of the sport product, sport consumers,
as well as the importance of the sport brand. Additionally, the concept of sport
consumption is reviewed as well as the idea that sport is branded entertainment that is
packaged by sport organizations and presented to sport consumers via multiple outlets to
maximize profits and attract fans. The second section is centered on the concept of sport
consumer behavior. The origins of both the involvement and loyalty constructs are
examined. Additionally, relevant literature is presented highlighting the impact varying
levels of involvement and loyalty have on consumer attitudes and behaviors. The third
and final section’s focus is on the production and presentation of sport as a form of
entertainment that is both produced and consumed within the servicescape. The
presentation and production of professional basketball within the NBA as a branded
experiential entertainment product is discussed. Further, the use of the servicescape and
atmospheric music as tools to enhance the entertainment value of the branded sport-
product are examined.
The Sport Product, Sport Consumer, and Branding
Brooks (1994) defined the sport product as “any form of physical activity that pits
one’s talents against an opponent’s” (p. 88). Sport is also a unique product within the

15
domain of leisure services; as sport is an unpredictable experiential and intangible
service-product that is simultaneously produced and consumed. According to Bitner
(1992) given the simultaneous production and consumption of services the total
experience of the consumer has increased relevance. Therefore the environment, or
servicescape, within which the sport product is presented, will have a significant impact
on overall perceptions and opinions formed about the sport consumption experience.
Another salient aspect of sport is limited control of the performance of the core
product. Sport organizations are able to control who is on the roster; while at the same
time injuries, individual and team performance, and game outcomes are unpredictable
and out of the organizations’ direct control. According to Mullin and colleagues (2007)
the limited control of the sport product is a distinguishing feature of sport marketing.
Therefore it is imperative for sport marketers to create and increase levels of involvement
and loyalty among sport consumers to provide a consistent customer base in times of
change, uncertainty, or poor performance.
Sport Consumers
Even though there is considerable competition and choice for today’s sport
consumer, attendance of sporting events continues to be a significant source of revenue
generation for sport organizations. Within the United States recent estimates place the
amount of money spent on attending sporting events at over $11 billion annually
(Howard & DeSchriver, 2005). Estimates for all of North America increase the total to
$26.17 billion when other elements, such as parking, concessions, and merchandise, are
included (King, 2002). Further, in the three decades between 1970 and 2000 the NBA
saw the largest increase in attendance figures among the four major US sport leagues,

16
with an average NBA fan being a white (67%; 18% African American, 15% Hispanic)
male (59%) between the ages of 18-34 (37%), who attended or graduated college (62%)
and earns more than $50,000 annually (48%) (Schnietz et al., 2005). During this
timeframe annual attendance increased by 362%, with the introduction of expansion
teams, as well as an increase in the total number of sport consumers (Moag & Company,
2002). Further, during times of economic decline the NBA has continued to grow an
average of 3.4%, or 424,000 fans, annually (Moag & Company, 2002). This ability to
withstand economic instability is of considerable importance to the league and NBA
franchises given the inevitable fluctuations that are bound to occur in the economy.
Although attendance figures have historically been encouraging for the NBA,
today’s sport fan has increasingly more options and modes by which to consume sport.
According to a recent Nielsen (2012) report there were over 42,500 hours of live sporting
events broadcast in 2011 on both cable and network television. This was an increase of
5% from the number of broadcast hours dedicated to sports programming in 2010.
Further, sport is also increasingly being consumed via the internet. In an earlier Nielsen
report (2010), each month in 2009 an average of 81 million people in the US logged-on
to websites dedicated to sport to either follow their favorite team, follow their fantasy
team, or catch-up on the latest sport related news. In October of 2011 alone, over 450
million video streams occurred on various sports websites that were viewed by more than
35 million people (Nielson, 2012). With the continued growth and increased competition
within the sport industry, as well as the influx and proliferation of various modes of sport
consumption, the creation of a highly involved and loyal base of spectators has increased

17
significance for sport organizations, as the creation and maintenance of such a foundation
is essential for sustainability at the organizational level.
Today’s sports fan has limitless options and opportunities by which to consume
sport. The ability of sport organizations to attract and activate attendance of live events
still remains vital to an organization’s long term viability and success in the industry
(Funk, Filo, Beaton, & Pritchard, 2009). Given the availability of alternatives and
substitutes, motives for the consumption of live sport have changed. The consumption
and presentation of live sport is no longer solely about the game being played. Sport in
today’s society is a “brazenly commercial enterprise, that makes no pretense as to the
paramount importance of delivering entertaining products designed to maximize profit
margins” (Andrews, 2001, p. 154). Additionally, the expectations of the sport consumers
that their hedonistic entertainment needs be met have also increased significantly. As
Rein, Kotler, and Shields (2006) state, in their book The Elusive Fan, “it is no longer
reasonable to expect fans to automatically appear because they either have nothing better
to do or they are so addicted to the sport that they will put up with backless seats and rude
ticket takers” (p.13)
Similar to any other industry and product, sport consumption is the result of
choices made by individual consumers. According to Funk (2008), within the context of
sport, consumer behavior stems from individuals’ desire to seek out a consumption
experience in order to satisfy internal needs and obtain associated benefits. Thus, it is
essential for sport organizations and sport marketers to identify and understand
significant influencers of consumer attitudes related to the sport consumption experience,
and thus what drives sport consumption behaviors.

18
Branding
Given the unique and unpredictable nature of sport, as well as the shift in both the
production and consumption of sport, the creation of a strong brand holds increased
significance for professional sport organizations. Further, given the hypercompetitive
nature of the sport industry, the maintenance of a strong brand is also vital for long-term
sustainability. Establishing a strong sport brand will work to differentiate an organization
in an increasingly cluttered marketplace (Rein et al., 2006), thereby working to create and
maintain a competitive advantage.
The creation of a strong sport brand is based upon the creation of brand
associations. According to Aaker (1991) brand associations are any thoughts, images, or
experiences located in a consumer’s mind that are linked to a specific brand. Brand
associations with the sport product include all of the experiential attributes and emotional
benefits that consumers incur as part of the sport consumption experience (Gladden &
Funk, 2002). The cumulative effect of brand associations is the establishment of a
brands’ image and the creation of brand equity in consumers’ minds (Bauer, Stokburger-
Sauer, & Exler, 2008).The difficulty in quantifying and understanding consumer brand
associations is twofold. First, consumer reactions to experiences are not uniform; that is
the reaction of one consumer to the same experience may differ from that of other
consumers (Bagozzi, Gopinath, & Nyer, 1999). Secondly, brand associations, in addition
to most of the benefits received from the sport product, are intangible, as they reside in
the mind of the consumer (Mullin et al., 2007).
Given the intangible nature of the sport product and the benefits derived from its
consumption, the experience of the consumer has taken on greater importance in the

19
development and management of the sport brand. According to Rein and colleagues
(2006) “teams that can transform themselves into brands that offer fans a distinctive
experience, one not dependent upon wins and losses, will remain competitive in the
marketplace” (p. 99). Further, if a team is able to create a unique experience in support of
its brand, they will be able to capitalize on the three main benefits of possessing a strong
sports brand: permanence, connectivity, and premium.
Establishment of a sports brand also helps to counteract many of the short term
issues that arise in relation to poor performance (Rein et al., 2006). A strong brand is also
able to help sustain an organization when there are personnel changes, such as trades,
injuries and the retirement of star players. The brand helps to provide a sense of
permanence to consumers; that is, a more meaningful connection with the organization.
This connectivity is thus able to sustain the organization, in terms of attendance and
revenue, when faced with the inevitable ups and downs associated with sport. Consumers
thus have a strong connection with the team; a connection that goes beyond a star player,
event or facility. Ultimately, a strong brand will hold a premium position in the minds of
consumers, and thus, command a premium price.
The creation of a strong sport brand can also be used by organizations to increase
levels of involvement. As strong brand associations result in an increase in the meaning,
significance and value attributed to the brand in consumers’ minds; essential factors in
boosting involvement levels are established (Funk, 2008; Gladden & Funk, 2002).
Further, effective branding strategies can also work to create team loyalty among
consumers (Bauer et al., 2008; Gladden & Funk, 2002). Both increased involvement and
loyalty are essential to the establishment of a strong and enduring fan base.

20
The live consumption of professional sport has emerged as an entertainment
experience, where valuations of the sporting event are based more on the holistic
consumption experience than the game being played. Additionally, the hypercompetitive
nature of the current sport marketplace has made it necessary for sport organizations to
transform the conventional competition-focused delivery of the sport product into a sport
brand in order to meet the needs of the contemporary sport consumer. One important
element in the transformation of an organization into a brand is the establishment of a
brand’s ethos.
Ethos is defined as “the character of the communicator as understood and
believed by the audience” (Rein et al., 2006, p. 112). Ethos is the foundation of a sport
brand’s credibility. The establishment of credibility is essential for a brand to create a
meaningful connection with consumers. According to Rein and colleagues (2006) this is
of particular importance in sport as consumers must believe that the sport brand has
integrity and therefore, they can trust it. Credibility is established by consumers and is the
result of an organization meeting various expectations related to the production and
consumption of sport (e.g., fair prices, accessibility, crowding aesthetics, etc.), as well as
the core sport product (e.g., fair play, equal opportunity, following the rules, and
maximum effort exerted by players, etc.).
One way a team can help to communicate, enhance, and establish a credible sport
brand is through non-product related attributes. Non-product related attributes are
external to the core sport product and that do not directly affect team performance.
Further, they are also relevant to the consumption of the sport product and directly
influence perceptions of the sport brand (Bauer et al., 2008). The servicescape is an

21
important non-program element that is central to an organization’s brand (Bauer et al.,
2008; Gladden & Funk, 2001), as elements in the servicescape can be used to meet and
exceed consumer expectations (Rein et al., 2006). Additionally, atmospheric music, as a
controllable element of the servicescape, has been repeatedly shown in service settings to
influence consumer attitudes and behaviors (e.g., Chebat, Gelinas-Chebat, & Filiatrault,
1993; Jacob, 2006; Guégen et al., 2008; Milliman, 1982, 1986; North et al., 1999).
Therefore atmospheric music can be integral in the creation, communication, and
enhancement of the sport brand.
Sport Consumer Behavior
Consumer behavior research has provided a framework by which to gain a deeper
understanding of why people consume products and services. Additionally, it is also the
study of what and how certain factors influence resultant attitudes and behaviors.
Consumer behavior, and in general all behavior, is produced as the result of the impact of
three classes of influencers: individual characteristics, environmental surroundings, and
inherited biological genetic indicators (Chaudhuri, 2006). Thus, in the marketing
literature, it is the manipulation of stimuli in the environment that may produce emotional
responses within the individual’s mind, thereby leading to desired behavioral responses
(Chaudhuri, 2006).
Consumer research in the realm of sport seeks to gain a better understand of the
attitudes and behaviors of sport consumers and fans. The goal of this type of research is
to understand consumers’ attitudes toward a particular sport, event or team in order to
gauge behaviors and behavioral intentions. Consumer behavior research also seeks to
identify key elements within the presentation of the sport product that influence attitudes

22
and behaviors. This information will thus enable sport managers and marketers to
effectively package and present the sport product in order to successfully attract and
retain sport consumers (Funk & James, 2006), by increasing the level of consumer
involvement and thus, loyalty.
Involvement
Involvement, for the purposes of the present study, draws upon both Havitz and
Dimanche’s (1997) definition of leisure involvement and Rothschild’s (1984) definition
of consumer involvement to be understood as an unobservable state of interest, arousal or
motivation toward an event, that is induced by stimuli within a particular environment
that mediates resultant sport consumer behavior. Further, it has also been proposed that
there are three areas that influence an individual’s level of involvement (Houston &
Rothschild, 1978). The first of the three areas is an individual’s personal values, interests,
and needs. The remaining two areas speak to the stimulus object. The last two areas are
any physical characteristics that may be present, and finally any situational attributes that
work to increase interest or awareness in the object.
The ego is also central to understanding individuals and their resultant responses
(Sherif & Cantril, 1974). The ego is the foundation of an individual, as it is the
“constellation of the social and personal values one has acquired and which determine the
enduring nature of one’s identity” (Laaksonen, 1994, p.3). Thus, involvement occurs
when an object, service or entity is conveyed to an individual, thereby evoking an
emotional response and connection to the ego (Laaksonen, 1994). Ego involvement is
therefore central to understanding the complex construct that is involvement.

23
An individual’s level of involvement is also assumed to be a direct result of their
attitudinal levels of acceptance, rejection, and non-commitment with respect to a given
stimulus (Sherif & Hovland, 1961). Commitment is the ability of a persuasive message to
influence levels of acceptance or rejection. As the level of involvement increases, so too
do levels of rejection of alternatives. That is, as one becomes increasingly involved with
an object or service the less likely they are to be persuaded to consider or be influenced
by alternatives (Laaksonen, 1994). According to Sherif and Cantril (1974) the foremost
characteristic of a highly involved individual is their resultant increased levels of
rejection and resistance to persuasion. Thus, it follows that an individual who is
characterized as having low levels of involvement will also have higher levels of
acceptance of alternatives and non-commitment, while a highly involved individual will
display increased levels of commitment and rejection of alternatives.
There are four key components of involvement: commitment to a position, social
support, salience of the issue, and frequent espousal of arguments to support one’s
position (Laaksonen, 1994). The highly involved individual will possess all four of these
elements with respect to the object, product or service in question. The individual will
thus possess high levels of rejection to alternatives, as characterized by their level of
commitment. A heightened position of involvement will also have value and meaning in
both the personal and social domains, as indicated by the increased levels of salience and
social support commitment to the object or product provides (Laaksonen, 1994).
Individuals are also involved at multiple levels, with various products and
services, as well as in multiple domains. Involvement in such an array of areas and at
numerous levels can lead to divergent responses on scales formulated to measure the

24
involvement construct across domains (Zaichkowsky, 1985). Zaichkowsky constructed
the Personal Involvement Inventory (PII) to measure an individual’s state of enduring
involvement with a particular product or brand. Involvement with a given product was
determined to be either high or low based on scores generated on the 20-item semantic
differential scale. The PII was constructed to address concerns presented in the
involvement literature as to the lack of a consistent and multi-item measure of
involvement that could be applied to a variety of consumer products. Based on the scores
generated on the PII, consumers who were highly involved were shown to have a
preferred brand in a given product category. Highly involved consumers were also more
interesting in seeking out information about the product as well as associate greater
differences between their preferred brand and alternatives. Thus the product as well as the
preferred brand held a positive and meaningful place of significance in the mind of the
consumer, ahead of all alternatives.
Given the length of the PII, Munson and McQuarrie (1987) created Modified
Personal Involvement Inventory (MPII) as an alternative instrument with the hopes that it
would prove to be a more concise measure of involvement. The purpose of the research
was to create a scale that would be easier to understand and shorter in length to
adequately analyze and measure the involvement construct (Munson & McQuarrie,
1987). The MPII was tested using 16-items to analyze the involvement scores of college-
age participants with respect to 12 diverse products from multiple categories (e.g., cars,
soft drinks, business suits, etc.). The items included in the MPII were found to be
consistent with the PII in signifying and predicting the level of consumer involvement
across various product categories. These results also revealed that involvement is a

25
multidimensional and exceedingly complex construct. An individual is involved with
multiple products, brands, and services at a given time. Further, involvement levels may
change over time, given the level of exposure, information, and relevance of the product
to the individual, as well as the ability of the product to fulfill specific needs, at a given
point in time (Funk, 2008).
Leisure involvement. Within the leisure domain involvement has been defined
“as an unobservable state of motivation, arousal or interest toward a recreational activity
or associated product” (Havitz & Dimanche, 1997, p. 246). Therefore it is of critical
importance as leisure involvement helps to make sense of the way in which leisure and
recreation are viewed with respect to attitudes, as well as in understanding and predicting
behaviors. An understanding of leisure involvement research conducted, and scales
devised to measure the construct, is necessary to provide insight into involvement within
the leisure domain.
McIntyre (1989) presented a modification of Laurent and Kapferer’s (1985)
consumer involvement profile (CIP) to investigate leisure involvement. McIntyre’s
investigation revealed three key dimensions central to understanding leisure involvement,
in contrast to general consumer involvement. The three dimensions are attraction,
centrality, and self-expression. Consequently, Kyle, Absher, Norman, Hammitt, and
Jodice (2007) constructed a modified involvement scale (MIS), based on McIntyre’s
(1989) scale to measure enduring leisure involvement. The MIS consists of five
dimensions: attraction, centrality, social bonding, identity affirmation, and identity
expression. The unique element presented in the MIS by Kyle and colleagues was the
26
presentation of the identity construct as two distinct dimensions of affirmation and
expression.
Kyle and Mowen (2005) investigated the relationship between leisure
involvement and leisure agency commitment among subscribers to a public-metropolitan
leisure provider publication. The authors postured, and found, that the level of
involvement with a particular leisure activity will translate, over time, into commitment
to a particular service provider. The findings add to similar studies in the leisure literature
(e.g., Kyle et al., 2007) which found that for certain leisure activities the setting within
which the activity takes place holds greater significance to the individual than the activity
itself in generating the desired experience of the leisure participant (Kyle & Mowen,
2005).
In Havitz and Dimanche’s (1997) review of relevant leisure involvement
literature, the authors found that nearly all of the studies conducted lent support to
Zaichkowsky’s (1985) contention that involvement levels vary among individuals. That
is, any given individual’s involvement levels will vary depending on the particular
product or service that is presented to them. Further, their review revealed that there has
been much support for the assertion that different products elicit disparate types, as well
as varying degrees of involvement among consumers (Havtiz & Dimanche, 1997;
Zaichkowsky, 1985).
Sport involvement. Research related to sport involvement, and in particular team
sport spectator involvement, has not been as prevalent as that in the general consumer
behavior and leisure domains. There are, however, some parallels and extensions that can
be drawn from the latter to the realm of sport. Similar to leisure involvement, team sport

27
involvement provides individuals with the opportunity to express their true selves
through active participation or immersion in an experiential environment (Havitz &
Dimanche, 1999). Consumption has been conceptualized as experiential, whereby
“symbolic meanings associated with more subjective characteristics“(Madrigal, 2006,
p.267) are consumed. Further, highly involved consumers of sport seek out and consume
a service within an experiential service setting, similar in many respects to the settings in
which consumers dine, shop, travel, vacation, and participate in experiential leisure
activities. As such, the impact of involvement within the sport domain on sport-consumer
attitudes and behaviors should be of significance to sport marketers and managers just as
they are to marketers and managers in other respective experiential retail/service
environments.
Kerstetter and Kovich (1997) substantiated the multidimensional nature of the
involvement construct among women’s college basketball spectators as measured by the
CIP. The results also revealed two main dimensions of sport involvement: enjoyment and
sign. Attendance duration was directly related to increased levels of enjoyment, which
was shown to be a positive predictor of involvement. The results also revealed that risk
factors, or costs, were also shown to be of little consequence to sport spectators’ level of
involvement. The authors suggested that this finding may be a consequence of there
being no actual risks associated with the attendance of sporting events as, “the monetary
cost is low, the time investment is minimal, there is no threat of physical danger, there is
limited social risk, and there isn’t any performance risk” (Kerstetter & Kovich, 1997,
p.245). Additionally, the results suggest that the facet of enjoyment is more important
than the second facet of sign when investigating team sport involvement. Further, the
28
principal determinant of involvement with basketball attendance may be linked to social
dimensions (Kerstetter & Kovich; McIntyre, 1989).
Funk and James (2001) developed the Psychological Continuum Model (PCM) in
an effort to investigate sport fan and spectator involvement. The PCM also introduced
three facets, or factors, that may mediate an individual’s level of involvement within the
sport domain (Funk and James, 2001). The three facets introduced by the PCM are
attraction, sign and centrality. Further, within the PCM there are four levels of
psychological connection that exist along a continuum, which translate into an
individual’s level of involvement. The four levels, presented in ascending order of
relative connection, are: awareness, attraction, attachment, and allegiance. According to
the PCM, as individuals’ progress up the aforementioned stages, they display increased
levels of psychological commitment (Funk & James, 2001). Further, increased levels of
psychological commitment can be translated into an increased level of involvement. The
PCM will be explained in greater detail in the following sub-section.
Involvement with professional sport teams was also investigated by Funk,
Ridinger, and Moorman (2004). In particular, the study focused on the spectating facet of
sport involvement in the development of the team sport involvement (TSI) model. As a
result the authors presented and validated a conceptual model, based on relevant behavior
and involvement literature, to measure spectator involvement with a professional sport
organization. The results revealed, in line with previous literature (Kerstetter & Kovich,
1997; Munson & McQuarrie, 1987; Zaichkowsky, 1985) that involvement is a complex
construct that must be examined holistically. Further, the facets of attraction, self-
expression, centrality, and risk were found to be the main determinants, or origins, of
29
involvement within the context of sport spectators (Funk et al., 2004). The latter three
facets were also shown to be more useful in differentiating between high and low
frequency segments, which is essential to understanding enduring involvement (Funk &
James, 2001).
NBA involvement. The present study employed Funk and James’ (2001) PCM to
measure participants’ level of involvement with the NBA. More specifically, the PCM
was used to measure the level the unobservable state of motivation, arousal or interest in
the live consumption NBA games (Funk, 2008; Havitz & Dimanche, 1997; Rothschild,
1984). Questions were reworded from the original instrument to reflect this emphasis on
NBA spectator, or attendee, involvement (i.e., Attending NBA games plays a central role
in my life). The PCM was chosen in an effort to use a parsimonious and easy to
understand measure of involvement. The PCM uses only nine questions and the language
used in the construction of the questions is easy to understand; therefore all participants
should be able to answer the questions accurately and without difficulty.
The PCM measures three distinct facets of involvement. The three facets being:
pleasure, centrality, and sign. Pleasure relates to the enjoyment gained through
participation or attendance, centrality is associated with the extent to which the activity or
event plays a central role in the life of the individual, and sign is representative of the
amount of self-expression or value derived from participation or attendance (Funk, 2008).
Three questions for each facet are included in the instrument. Each facet is then given a
combined score based on the responses to each question, which results in the creation of
an involvement profile. This profile is then used to place an individual into one of four
stages along the involvement continuum.

30
According to Funk and James (2001) the four stages represent a continuum of
psychological connection, which is representative of one’s level of involvement. The four
stages, presented in ascending order of relative connection, are: awareness, attraction,
attachment, and allegiance. The awareness stage is characterized by low levels of
cognition and attitude formation with respect to a particular sport, activity, or event
(Funk, 2008). At the attraction stage psychological evaluation and engagement are
present creating a cursory emotional response (Funk, 2008). Attachment indicates that a
meaningful connection has been created, resulting in symbolic, emotional or functional
significance relayed upon the sport or event (Filo, Funk, & O’Brien, 2009; Funk, 2008).
Allegiance, the highest stage along the continuum, is achieved when there is
psychological commitment to a sport or event. The three involvement facet scores are
used to determine an individual’s associated level of involvement along the psychological
connection continuum. According to the PCM, as an individual’s level of psychological
connection to a sport or event increases they will progress up the continuum, which can
be translated into an increased level of involvement (Funk & James, 2001).
Loyalty
Loyalty to a brand is defined as a “biased (i.e., nonrandom), behavioral response
(i.e., purchase) expressed over time by some decision making unit with respect to one or
more alternative brands as a function of psychological (decision making, evaluate)
processes” (Jacoby & Kyner, 1973, p. 2). Further, according to Day (1969) true loyalty
can only exist in the presence of both a meaningful, positive attitude toward the product
and repeated purchasing behaviors. In the sport domain this is of considerable importance
given the limited control organizations have over the core sport product; therefore the
31
connections made with fans have increased importance in creating positive and
meaningful valuations of the consumptive sport experience. In an increasingly cluttered
and competitive marketplace, the ability of sport organizations to establish loyalty among
consumers is of increasing importance.
In order to create and maintain a loyal core of customers, the construct of loyalty
must first be understood. Loyalty within the sport and leisure literature has also been
characterized as a multidimensional construct (e.g., Funk & James, 2006; Funk &
Pastore, 2000; Mahony, Madrigal, & Howard, 2000; Park & Kim, 2000; Trail, Anderson,
& Fink, 2000). Within the multidimensional construct the two main aspects of loyalty are
behavioral loyalty and attitudinal loyalty. Sport consumer research has focused on better
understanding attitudes and behaviors in response to the sport product as indicated by the
two dimensions of loyalty in order to effectively enhance the production of the sport
product.
Behavioral indicators, such as purchases and frequency of attendance, have
traditionally been relied upon as indicators of loyalty in consumer research as well as in
sport research (Mahony et al., 2000). Behavioral loyalty is the degree to which an
individual repeatedly purchases a particular product, service, or brand. A consumer’s
level of loyalty toward a product or service has been shown to mediate their intention to
repurchase that product or service in the future (Howard & Thompson, 1984; Mahony et
al., 2000).
The attitudinal component of loyalty for the purposes of this study is based upon
Heere and Dickson’s (2008) conceptualization, and extension of Pritchard, Havitz, and
Howard’s (1999) definition of loyalty, and is presented as an individual’s resistance to

32
change their level of psychological commitment. Thus loyalty is not psychological
commitment itself, but rather the persistence of the strength of commitment to a
particular team. Attitudinal loyalty is also the result of the interaction between internal
psychological processes and connections, and any negative external changes that may
occur (Heere & Dickson, 2008).
Team Loyalty
The first attempt to create a measure of team loyalty in the sport management and
marketing literature was undertaken by Mahony and colleagues (2000) who created the
Psychological Commitment to Team (PCT) scale. The PCT scale incorporated elements
of conventional marketing literature to create a measure of loyalty as a multidimensional
construct consisting of both attitudinal and behavioral elements. Scores on the resulting
scale placed consumers in one of four quadrants within a two-dimensional loyalty matrix
(Backman & Crompton, 1991) based on a combination of the behavioral consistency
(high/low) and psychological commitment (strong/weak). Based on their placement
within the loyalty matrix, consumers’ team loyalty is categorized as either: high,
spurious, latent, or low.
The validity of the PCT as a measure of loyalty has been questioned in subsequent
research (Kwon & Trail, 2003). Additionally, within the sport marketing and
management literature the terms allegiance, commitment, and loyalty have all been used
to explain sport consumer attitudes and behaviors toward a particular sport team. The
lack of consistency and agreement among sport researchers has made it difficult to
understand and gauge consumer loyalty within the sport domain. In response to both of

33
the above concerns, Heere and Dickson (2008) created the Attitudinal Loyalty to Team
Scale (ALTS).
To measure loyalty to a particular NBA team, Heere and Dickson’s (2008) ALTS
was used in the present study. The ALTS is a parsimonious 4-item measure of the
psychological connection an individual has to a specific team. As such, the scale is a
unidimensional measure that separates internal psychological connections from
behavioral responses in order to measure attitudinal loyalty. According to the authors it
was necessary to use a unidimensional approach in order to separate the constructs of
affective commitment from attitudinal loyalty in order to create a reliable and valid scale
from which to measure attitudinal loyalty. Further, loyalty to a team represents an
individuals’ resistance to change when presented with alternatives, the team is in a slump,
or changes are made to the team’s lineup. Thus, loyalty represents a predictor of future
behavioral intentions, regardless of the team’s performance; which is significant given
the unpredictable nature of sport and the sport product.
In the sport management literature allegiance has been used interchangeably with
loyalty (e.g., Funk & James, 2001, 2006; Funk & Pastore, 2000). Within the PCM (Funk
& James, 2001), as discussed previously, allegiance is presented as the highest level of
involvement along a continuum. Thus allegiance signifies the highest level of
psychological commitment to an organization. This definition of high level involvement
is the same as the definition of loyalty presented by Heere and Dickson (2008) that is
used as the framework for the present study. Therefore, loyalty can only be achieved after
a consumer progresses up the four stages of the involvement continuum. Thus
involvement can be understood as being a determinant of loyalty. For the purposes of the
34
present study the relationship between the constructs of involvement and loyalty were
investigated using the PCM and ALTS. In particular the relationship between
involvement with the NBA and loyalty to a particular NBA team.
The Production and Presentation of Sport
Consumers today have seemingly limitless choices for how and when they spend
their time, energy and money. According to Rein and colleagues (2006) at no other time
in history have sports fans had so many options, alternatives, opportunities, venues and
events to choose from. Thus, given the hypercompetitive nature of the sport industry,
organizations must work to differentiate themselves in order to appeal to and connect
with consumers is critical to long term viability and success. Adding value to sport
attendance, through the creation of a sport entertainment experience, is one way in which
sport organizations have chosen to attract consumers.
Sport as Entertainment
According to Kellner (2002) the presentation of professional basketball best
signifies the space sport holds within contemporary American society. The sport product
is no longer confined to the competition between teams and athletes on the court; it also
includes the venue and environment that surrounds the game. The NBA has embraced the
notion that sport is more than a game and according to Andrews (2006) has “successfully
blurred the boundaries between the sport, media, and entertainment industries” (p.13). As
a result the production surrounding the presentation of NBA games works to create an
experience for game attendees; thereby adding value in the minds of consumers to the
cost of attendance. Additionally, the creation of an NBA game experience is meant to
attract the largest number of consumers possible. The ultimate goal of such an approach

35
is to maximize profits by appealing to a diverse cross section of the market; thereby
beating out other entertainment and leisure options for the time and money of consumers.
Thus the NBA has “been transformed into a multifaceted media entertainment enterprise
with the game of basketball as its intertextual core” (Andrews, 2006, p.18).
The Servicescape
Bitner (1992) defined the servicescape as all of “the dimensions of the physical
surroundings include[ing] all of the objective physical factors that can be controlled by
the firm to enhance (or constrain) employee and customer actions” (p.65). The
servicescape can also be broken down into four dimensions, each of which contains
specific elements. The four dimensions presented by Bitner are: ambient conditions,
spatial layout and functionality, signs, symbols, and artifacts, and the service typology
and environmental dimensions. Each of the four dimensions lend to the creation of a
framework by which to gain a deeper understanding of the impact the constructed
environment can have on consumer responses.
Consumers make decisions which impact attitudes and behaviors through the
processing of information regarding a specific product or service. An external search
occurs in the minds of consumers as they seek knowledge, beyond that which is in their
memories, to assess the value and quality of product alternatives (Baker, 1998).
Additionally, the interpretation of cues presented to the consumer in the consumptive
environment are used in the decision making process. As marketplaces become
increasingly complex cues in the environment are of greater significance. Consumers
navigating such an intricate landscape may not be able, inclined, or want to take the time
to gather relevant information pertaining to the underlying characteristics and qualities of
36
a particular product or service. As such, easily accessible cues in the environment will be
relied upon as a significant source of information when interpreting, making inferences
about, and ultimately making judgments regarding product/service quality and value
(Baker, 1998). The servicescape, and more importantly the cues presented within it, can
thus be shaped to provide pertinent information to consumers about the quality of the
product and experience. This staging of cues, thereby will contribute to the creation of
immediate and lasting consumer attitudes and behaviors.
Semiotics, within the servicescape, is the framework within which cues are
understood and are given meaning. The underlying element of importance within
semiotics is sign. Sign is defined as “something that stands for something else and, more
technically, as a spoken or written word, a drawn figure, or a material object unified in
the mind with a particular cultural concept” (Gottdiener, 1998, p.31). Signs are presented
to consumers within the servicescape as verbal and visual cues which are then interpreted
and given particular meaning by consumers. Thus, the construction of the consumptive
environment, and the signs within said environment, can result in the purposeful
presentation of distinct signs that can result in the creation of particular responses and
ascription of particular meaning by consumers as they interpret the experiential cues
within the environment (Gottdiener, 1998).
According to Gottdiener (1998) there has been a change in the way that
commercial spaces are shaped today. That is, there has been a shift towards the creation
of themed milieus. Additionally, according to Aubert-Gamet and Cova (1999), this shift
can also be seen as signifying a societal, as well as commercial, shift from modernism to
postmodernism. The postmodern consumer actively seeks, and is drawn to, service

37
environments for their ability to create links with others and less for their functional
utility (Cova, 1997). The service setting is therefore no longer solely a spatial
environment, but also a social environment within which consumers are afforded the
opportunity to interact with not only other consumers but also the environment itself
(Aubert-Gamet & Cova, 1999). Therefore the ability of elements within the servicescape
to create salient social links between consumers is of great significance in the postmodern
experiential consumer context.
Consumers also interpret their environment in total, or holistically; as they take
into account all of the various elements present within a given setting (Bitner, 1992; Falk,
Sockel, & Warren, 2005; Namaslvayam & Mattila, 2007). Therefore, elements within the
servicescape do not exist as a single entity, but as an interrelated whole working together
to create the total service environment. This has particular importance in industries, such
as sport, where the product is both produced and consumed simultaneously within a
highly stimulating environment. Such an environment can also be thought of as being
part of the experience industry (Mossberg, 2008) where a business is built around a story
that is presented to consumers to enhance the meaning and value of their experience.
According to Mossberg, storytelling in the servicescape can be used to create an
advantage over competitors through the creation of a salient link in consumers’ minds
between a particular brand and the consumer. Further, if a particularly good story is
communicated, it may lead to consumers becoming involved with the product as well as
the creation of the service experience itself (Mossberg, 2008).
The servicescape in the service industry. Within the restaurant service
environment the servicescape has been shown to have a significant impact on the
38
experience of the consumer. Namaslvayam and Mattila (2007) in a study of non-fast-food
restaurants found that the servicescape influenced levels of consumer satisfaction during
the service exchange. The ability of the service environment to reinforce or detract from
individual consumers’ preexisting mood states during the service exchange were shown
to impact resultant levels of satisfaction (Namaslvayam & Mattila, 2007). Further, if the
servicescape is able to reinforce positive mood states a higher level of satisfaction will be
attributed to the service exchange, thereby have a positive impact on the frequency and
duration of behavioral intentions.
In a similar study, Harris and Ezeh (2008) focused on UK restaurants and the
effect of servicescapes on purchase and loyalty behaviors. The study led to the
development of a multidimensional conceptual model to understand the impact of the
servicescape on loyalty intentions. The model proposes that there is a linear relationship
between loyalty intentions and four categories of servicescape variables. The four
servicescape variable categories being: ambient conditions, design factors, staff behavior,
and staff image. Further, loyalty intentions were shown to be moderated by both personal
and environmental factors (Harris & Ezeh, 2008). The study also revealed that the
servicescape directly impacts consumer loyalty and purchase intentions. Further, through
the incorporation of a multidimensional model that evaluated the moderating effects of
personal and environmental factors on loyalty, the findings also underscore the
importance of a holistic approach to conducting servicescape research in order to gain a
deeper understanding of the complex nature of servicescapes and their effect on
consumer attitudes and behaviors.

39
The servicescape in the sport industry. The construction of multimillion dollar
venues, as well as technological advances, has made it possible for organizations to
customize the environment to enhance the entertainment value of the sport product.
According to Westerbeek and Smith (2003) it is the ability of sport organizations to
package the consumption of the sport product into customized entertainment experiences
that meet the individual needs and expectations of consumers that will determine their
success or failure in today’s sport marketplace. Therefore the servicescape must be taken
into consideration when evaluating sport consumer attitudes and behaviors.
Within the sport domain Wakefield and Blodgett (1994), investigated satisfaction
levels and repurchase intentions with respect to perceptions of the servicescapes of two
Major League Baseball (MLB) stadiums. The study evaluated perceptions of stadiums’
servicescapes including the spatial layout/functionality and aesthetic appeal. Spatial
layout and functionality elements included: length of concession and restroom lines,
arrangement of seats, aisles and walkways, accessibility of concessions, restrooms,
entrances and exits. Elements related to the aesthetic appeal of the stadium included:
cleanliness, scents, architectural design, external environment, signage, upkeep, and
physical condition of the stadium. The authors found that the perceived quality of the
stadium’s servicescape features were positively related to heightened levels of excitement
and increased repurchase intentions. Excitement levels were related to increased levels of
satisfaction with the servicescape, while increased purchase intentions related to an
increased likelihood of attending future MLB games in the stadium with a positively
perceived servicescape.

40
In a study of collegiate football stadiums, Wakefield and Sloan (1995)
investigated the influence of certain stadium features on spectators’ intentions to stay in
the stadium. The elements investigated by the authors included: parking, cleanliness,
crowding, fan control, and food service. The results revealed that spectators who were
satisfied with the servicescape were likely to stay in the stadium as well as return in the
future. The data also revealed that perceptions of crowding had the greatest influence on
spectators desire to stay, while fan control had the weakest effect. Crowding goes beyond
the size of the crowd, but also relates to crowding in concourses, concession and restroom
lines, as well as seating areas.
Based on the elements of the servicescape (Bitner, 1992) presented in the
literature Wakefield and Blodgett (1996) investigated the effect of the servicescape on
consumer behavior across three distinct leisure service settings: major college football,
minor league baseball, and casinos. The servicescape elements of layout accessibility,
aesthetics, seating comfort, cleanliness, and electronic equipment and displays were
investigated by the authors. The study revealed that satisfaction with the servicescape,
across leisure settings and in line with previous research (e.g., Wakefield & Blodgett
1994; Wakefield & Sloan, 1995), has a consistent and significant effect on repatronage
intentions and the amount of time spent in the service setting. The results support the
authors’ assertion of the importance of the servicescape as a determinant of consumer
behavior, particularly when the service is experiential and consumed primarily for
hedonistic reasons (Wakefield & Blodgett, 1996). Thus the study added to the
servicescape literature by showing support for the contention that the controlled elements
of the service environment have a direct, consistent, and significant impact on consumer
41
behaviors. This is of particular interest for the present study given that sport is classified
as a hedonic service that is produced and consumed in an experiential environment.
In another study within minor league baseball, the impact of a newly constructed
stadium’s servicescape on behavioral intentions was investigated (Hightower, Brady, &
Baker, 2002). The authors attempted to holistically investigate how attitudes regarding
the servicescape shape perceptions of quality and satisfaction and by extension
behavioral intentions. The data revealed, in keeping with previous research in sport
settings (Wakefield & Blodgett, 1994, 1996; Wakefield & Sloan, 1995) that the
servicescape had a significant influence on behavioral intentions; which included
repurchase and attendance intentions as well as intended positive word-of-mouth
(Hightower et al., 2002). The servicescape was also shown to positively influence
positive affect as well as perceptions of quality and value; which all in-turn act to
positively impact behavioral intentions. Further, increased levels of involvement were
significantly and positively related to perceptions of the servicescape. The final finding
holds particular significance for sport marketers as it suggests that organizations can use
the servicescape, or elements within the servicescape, as a tool to increase involvement
levels among spectators (Hightower et al., 2002)
Approach-avoidance. Within the sport industry, the servicescape is of particular
importance given the extended amount of time consumers spend within the service
setting while in attendance of a sporting event. According to Mehrabian and Russell
(1974, 1976) any demonstrated response to a physical setting, or environment, can be
categorized as being either an approach or avoidance behavior. All approach and
avoidance behaviors can be attributed to emotional states, which are the intervening

42
variables between stimuli present in the environment and approach or avoidance
behaviors toward the environment (Hines & Mehrabian, 1979; Mehrabian & Russell,
1974). Approach behaviors include an increase in the length of time spent in an
environment and increased affiliation, contact, verbal and nonverbal communication with
those who are present in the environment (Hines & Mehrabian, 1979; Magnini & Parker,
2009; Booms & Bitner, 1980). Conversely, avoidance behaviors are characterized by
decreased time spent in the environment, as well as evading contact and communication,
both verbal and nonverbal, with others in the environment (Donovan & Rossiter, 1982).
According to Mehrabian and Russell (1974; 1976) all approach-avoidance
behaviors are related to the two emotional states of arousal and pleasure. Within any
given environment, approach-avoidance behaviors are related to resultant levels of
pleasure-displeasure felt by consumers as a result of stimuli in the environment.
Increased levels of pleasure result in approach behaviors that are directly correlated to
increased levels of arousal (Hines & Mehrabian, 1979). Further, as pleasure decreases,
approach behaviors are inversely related to arousal. Emotional responses to the
environment occur regardless of the type of stimuli that is present in the environment or
how the stimuli are introduced into the environment. Further, emotional responses are a
result of a consumers’ reaction to the environment as a whole; that is taking into account
all of the various elements present in a given setting (Mehrabian & Russell, 1974, 1976).
In the present study levels of arousal and pleasure among NBA game attendees
were measured using an adapted version of Mehrabian and Russell’s (1974) Semantic
Differential Measures of Emotional Response to Environments. Drawing upon
Mehrabian and Russell’s (1975, 1976) arousal-pleasure hypothesis, the third emotional
43
state of dominance was not measured. Resultant arousal and pleasure scores are
representative of approach-avoidance behaviors among game attendees in response to the
NBA servicescape. The present study employed a holistic approach to investigating the
servicescape; as consumer attitudes and their link to behaviors and behavioral intentions
were measured in response to the entire servicescape.
The approach taken in the present study is a departure from previous servicescape
research in the field of sport marketing and management which identified and measured
responses to traditional elements of the servicescape, such as cleanliness, aesthetics and
electronic equipment (e.g., Hightower et al., 2002; Wakefield & Blodgett, 1994, 1996;
Wakefield & Sloan, 1995). It is understood that there are a multitude of elements within
the professional basketball servicescape that work together to create the NBA experience.
In the present study all of the elements of the servicescape were investigated as a
collective whole in order to better understand consumer attitudes and behaviors. This
approach allowed the researcher to gauge responses to the entire servicescape and
therefore the entire consumption experience. According to Mehrabian and Russell (1974)
a holistic approach is necessary when investigating the servicescape as elements within
the servicescape do not occur in isolation and therefore are not interpreted alone. All of
the elements of the environment are interrelated and therefore their effect on consumers
should be investigated by looking at the environment in total.
Atmospheric Music
Given that emotional responses to the environment influence consumer attitudes
and behaviors, the influence and utility of certain elements within the environment may
be greater than others. Although there are numerous influential elements contained within

44
the sport servicescape, atmospheric music is a particularly important aspect of the
consumptive sport environment given its functionality and potential as a form of stimuli
to influence and enhance the consumer experience. Further, atmospheric music has been
investigated in various service settings (e.g., hotels, banks, malls, restaurants, bars) as
part of countless consumer behavior studies, with results revealing music’s effect on a
variety of consumer attitudes and behaviors. Given the dearth of research in various
service settings the present study attempted to fill the gap in the sport marketing and
management literature by investigating consumer perceptions of the atmospheric music
within the NBA servicescape. Atmospheric music was also investigated due to the strong
presence this non-program element has in the production and presentation of NBA
games.
Atmospherics exist within the servicescape and can be used to create, evoke, or
manipulate responses, in the form of consumer attitudes and behaviors (Kotler, 1973).
Based on Kotler’s (1973) definition of atmospherics, atmospheric music is a stimulating
facet of the in-store environment that presents cues to consumers that are processed and
interpreted by consumers. The resultant information is then used by consumers in the
formulation of attitudes and the demonstration of behaviors within the consumptive
environment. It thus follows that the manipulation of atmospheric music can lead to the
creation of consumer responses that are beneficial to the organization; such as repeat
purchase and attendance intentions.
The impact of atmospheric music has been studied in regard to a wide variety of
consumer behaviors. Music has been shown to influence the amount of time and money
spent in various service settings. North, Shilcock, and Hargreaves (2003) in a study of

45
393 restaurant patrons found that the style of music being played impacted the amount of
money spent. In the authors study, the presence of classical background music resulted in
an increase in the amount of money spent by customers. The results were consistent with
previous studies (Areni & Kim, 1993; North & Hargreaves, 1998) that also found that
classical music increased purchasing behavior. Contextual congruency was presented in
all three studies as a reasonable explanation for the behavioral impact of the atmospheric
music. That is, classical music is considered to be upscale and its presence helps to create
an upscale atmosphere (North et al., 2003). Therefore, consumers displayed congruent
behavior, as displayed by their increase in the amount of money spent.
Congruency of atmospheric music with the service environment has also been
shown to be important in gauging its impact on consumer behavior. Congruency theory
states that consumers spend more money when the perception of the music being played
is consistent with consumer perceptions’ of the service setting (Jacob, 2006). In a study
that analyzed purchasing behaviors of customers in a wine store North, Hargreaves, and
McKendrick (1999) found that the type of music being played influenced the type of
wine purchased. In the study the authors manipulated the type of music being played.
When French music was played there was a significant increase in the amount of French
wine sold. The same results were found when German music was played. The results
suggest that when the music being played is congruent with the product being presented
or service setting within which it is being sold, it can positively impact purchasing
behaviors.
Atmospheric music has also been shown to influence the amount of time spent in
a service setting. Milliman (1982) in a study of grocery store shoppers found that the

46
tempo of music influenced the amount of time spent in the store. Slower-paced music
lead to an increase in the amount of time spent shopping. Similarly, slow-tempo music
was also shown to increase the amount of time spent dining within among customers of a
restaurant (Milliman, 1986). The result also revealed that the amount of time spent in the
restaurant decreased when fast-paced music was played.
Further, increases in the amount of beverage consumption have also been shown
to occur as a result of atmospheric music. Jacob (2006) found that when drinking songs
were played in a pub, there was a marked increase in the amount of drinks consumed.
McElrea and Standing (1992) reported that when fast-paced music was played the
amount of time spent drinking a single beverage decreased. Similar results were found in
a bar setting with respect to the sound level of music played (Guégen, Jacob, Hélène,
Morineau, & Lourel, 2008). The amount of time it took patrons to drink a glass of beer
was significantly less when the atmospheric music was played at a higher sound level.
Thus, the literature supports the assertion that atmospheric music in the consumptive
service environment influences multiple aspects of consumer behavior.
Studies have also shown that atmospheric music can have a distracting effect on
consumers. Borling (1981) in a study of the effect of soothing music on alpha rhythms in
the brain found that soothing music helped to focus attention on a task. Further, when
presented with both visual and auditory stimuli, in the form of music, the very presence
of aural cues act to distract from visual cues (Chebat et al., 1993). Thus, in a highly
stimulating environment where multiple forms of stimuli are present, the insertion of
atmospheric music can distract or divide consumers’ attention.
47
Given that music can work to distract attention, the type of music played may
lessen the distracting effect. Drawing on the advertising literature, when music is used as
part of a visual advertisement, it should be used to attract attention to as well as enhance
the core message (Hecker, 1984). Further, according to Macklin (1988) consumers can
become so aware of music being played that they ignore or are unaware of the message
being sent. This is particularly true when the music is unrelated or inconsistent with the
message. Atmospheric music is most effective when it is used to enhance the experience
and not compete for consumers’ attention. Therefore, it follows that music played during
a sporting event should be congruent with the sport and the environment as well as work
to enhance the experience while drawing attention to the core sport product being
presented on the court.
The influence of atmospheric music in eliciting preferred responses has also been
shown to be related to involvement levels. Consumer behavior research has found that
when consumers’ have low levels of involvement with a product, positive feelings and
associated attributes are more likely to be created by the introduction of stimuli, such as
music (Kotler, 1973). When there is little cognitive investment in the product, in the form
of involvement, atmospheric music can be used to create responses and associations with
the product in the mind of the consumer. Therefore, atmospheric music presented as part
of the live sport experience may be more useful in creating positive associations and
memories related to the sporting event in consumers who display lower levels of
involvement.
The present study examined participants’ perceptions of the atmospheric music
presented at an NBA game based on the perceived congruence, distracting effect, and

48
overall liking of the music. Given that organizations may not be able to control all aspects
of the service environment; one aspect of the environment that organizations can control
is the atmospheric music that is presented to consumers as part of the game experience.
Therefore, it is important for sport marketers to understand the impact atmospheric music
can have on consumer attitudes and behaviors. Additionally, the influence music can
have in packaging the sport entertainment product also needs to be understood by sport
marketers as they work to create and present a unique sport brand.
Conclusion
Consumer behavior research has provided a framework by which to gain a deeper
understanding of why people consume products and services. The servicescape, and the
atmospheric elements contained within it, have been shown to directly impact consumer
attitudes and behaviors (e.g., Chebat et al., 1993; Guégen et al., 2008; Hecker, 1984;
Kotler, 1973; North et al., 1999). Further, consumer involvement and loyalty have also
been shown to directly impact purchase behaviors and intentions (Hightower et al., 2002;
Rein et al., 2006). Despite the depth of research consumer behavior research, as well as
the prominence of the sport industry, there is limited information linking the experiential
sport-servicescape to involvement, loyalty, and consumer behaviors.
Sport is unique, as it both a product and a service. Today’s sport marketplace has
become increasingly cluttered and therefore, increasingly competitive for the time,
money, and emotional investment of consumers. Further, sport can also be thought of as a
hedonic service that is consumed more for emotional satisfaction (Kempf, 1999) than for
its utility (Hightower et al., 2002). As such sport organizations, may be able to bolster
their central product of sport through the manipulation of the service environment

49
(Hightower et al., 2002) in order to create and maintain a competitive advantage within
the hypercompetitive sport industry.
Given the nature of the sport industry as well as the unpredictable nature of the
sport product, the establishment of highly involved and loyal fan base is also of
increasing importance to sport organizations. The establishment of a foundation of loyal
consumers is important as it can help to insulate an organization from external threats, as
the revenue they generate can be relied upon, thus giving the organization time to react to
environmental pressures (Amis et al., 1999). Additionally, increased levels of consumer
involvement are an antecedent of consumer loyalty. Involvement occurs as a product or
service begins to hold an increased place of significance in the life of consumers, while
alternatives have less influence and significance for their time, energy, and money
(Laaksonen, 1994). Thus, it is essential for sport organizations and sport marketers to
identify and understand significant influencers of consumer attitudes related to the sport
consumption experience, and thus what drives sport consumption behaviors (Funk, 2008)
in order to establish a highly involved and loyal fan base.
Given the intangible nature of the sport product and the benefits derived from its
consumption, the experience of the consumer has taken on greater importance in the
development and management of the sport product and brand. The present study will
provide a closer examination of consumer attitudes and emotional responses, which will
help to provide insight into sport consumer behaviors. Further, it will also examine the
relationship between involvement and attitudinal loyalty and the way in which these two
constructs impact responses and attitudes toward the servicescape, as well as purchasing
behaviors. Consequently, the present investigation will not only provide a significant

50
contribution to the sport management literature but it will also provide relevant
information to sport managers in the production and presentation of sport in an
experiential environment.

51
CHAPTER III
METHODOLOGY
The primary purpose of the present study was to examine the relationship between
involvement with the NBA and loyalty to a specific NBA team. NBA game attendees
were also surveyed to gain a better understanding of the range of emotional reactions that
occur in response to the consumptive sport environment. Individual interpretations and
assessments of the atmospheric music played during the game were also analyzed. The
experiential NBA environment provides an optimal setting to investigate how sport
organizations may use elements in the space surrounding the presentation of the sport
product to enhance both the experience of spectators, as well as their brand; thereby
influencing consumer attitudes and behaviors which are antecedents of involvement, and
thus by extension loyalty. Further, surveying attendees allowed for an investigation into
which variables are significantly correlated to varying levels of NBA involvement and
team loyalty.
The methodology utilized in the present study is separated into four main
sections. The sections are organized as follows: (1) sample, (2) instrumentation, (3)
design and procedures, and (4) statistical techniques and data analysis. The first section
provides information regarding the target population, sampling frame, and sample size.
The second section describes the variables, constructs, and scales that were used in the
construction of the survey used to collect data in the present study. The next section is
dedicated to the presentation of the framework that was used to design the present study

52
as well as the methods used in the collection of data. The final section presents
information on the statistical techniques and data analysis procedures used to answer the
research questions and hypotheses posed in Chapter I.
Sample
Population
The target population for the present study was individual National Basketball
Association game attendees over the age of 18. The age restriction was employed to help
ensure that participants would be able to understand, interpret, and properly complete the
survey instrument used in the study. This helped to decrease the likelihood of
participants’ encountering common problems in answering survey questions, such as:
misinterpretation, failure to follow instructions, problems configuring a response, and
flawed judgment (Groves et al., 2004). Professional basketball games, and in particular
games played in the NBA, were chosen due to the presence of a unique servicescape (i.e.,
unique event atmosphere and music incorporated into the staging of the game)
surrounding the production of the traditional game form.
Participants were randomly selected from attendees of two NBA games in the
southeastern region of the United States. The venues selected for the study represented
the arenas of two eastern conference teams from among the 30-team league. Average
attendance figures for the two teams’ home games during the 2010-2011 season were
16,791 and 15,846, respectively (ESPN, 2011). The professional basketball organizations
were also intrigued by the subject matter as well as the potential insights the data could
reveal with respect to their fans and game-day operations. As a result, organizations
provided open entry into their arenas and therefore access to potential participants.

53
Sampling Frame
A sampling frame was used in the present study in order to establish the group of
target population members who would constitute potential participants in the study.
According to Raj (1972) the sample frame is “the list or map or any other acceptable
material from which the sample is selected” (p.12). Restriction of the target population,
through the use of a sampling frame, was also necessary due to both practical and
financial considerations (Biemer & Lyberg, 2003), given the considerable size of the
target population. Cluster sampling, using upper and lower seating levels, was thus used
to construct the sample frame.
A cluster sample is a sample comprised of sampling units representing groups of
population units (Lohr, 2008). Cluster sampling is useful, as part of a research design, to
obtain a sample from a target population, which is often large in size, therefore making it
extremely difficult to randomly sample individual members of the population (Huck,
2008). Clusters that contain members of the population are used in order to create an
accessible sampling frame. Clusters can be naturally occurring or they can be constructed
by the researcher based on proximity or convenience (Som, 1973). Clusters for the
present study were constructed utilizing seating sections, which were already present and
easily identifiable, within the selected data collection sites (i.e., professional basketball
arenas).
The frame for the present study consisted of clusters of seating sections located in
both the upper and lower arena bowls in an effort to include a representative cross-section
of the target population in the sample frame. Inclusion of sections in the frame was based
upon the random selection of sections in the two levels of each arena in order to include

54
the requisite number of seats necessary to meet set sample size guidelines. In order to
include a representative sample from both upper and lower seating sections, 38% (n = 10)
of the sections included in the sample frame each game were located in the upper level
and 62% (n = 18) were located in the lower level; which represented the approximate
distribution of upper and lower seating sections within the arenas.
Each seating section was assigned a numeric identifier, thereby renaming each
section in the arena. Private luxury boxes, or suites, were not included in the assignment
of numeric identifiers, and therefore, attendees seated in these areas were not included in
the sample. Assigned numeric identifiers were not related to the location of the section, as
the values were used for identification purposes only and not for selection (Orcher,
2005). Sections were randomly selected through the use of Stat Trek’s electronic random
number generator (Stattrek, n.d.). Surveys were then randomly placed in cup holders
within each seating section. The above process was used to help ensure the selection of
random participants and sections for data collection.
Sample Size
The sample size for the present study was constructed based on criteria set forth in
three distinct methods of determining sample size in research. First, Krejcie and
Morgan’s (1970) table of suggested sample sizes, for use in educational and
psychological research, was consulted. The table presents suggested sample sizes for
populations with various sizes. Average home game attendance figures for the selected
data collection sites, during 2010-2011 NBA season, were used to determine the
estimated size of the target population. Based on average attendance figures of any given
home game, the size of the target population was N ≈ 32,000. Based on the estimated size

55
of the target population, a total sample size of approximately 380 was suggested by the
table (Krejcie & Morgan, 1970). Given that MANOVA was one of the main statistical
procedures used in the analysis of data, a second table was also consulted to determine
the recommended sample size given specified levels of confidence and power (Guilford
& Frunchter, 1978). For a four-group MANOVA, the table indicated the smallest
suggested sample, to achieve desired levels of confidence (α = .01) and power (.90), was
n = 370.
Daniel and Terrel’s (1992) formula for determining sample size on a fixed
research budget for a particular study was also utilized. The fixed-budget formula utilized
was: n = C – Cf / Cv (n = 400 – 285 / .42), where C is the total budgeted cost of the study,
Cf are the fixed costs, and Cv are the variables costs per questionnaire (Daniel & Terrel,
1992). Utilizing the above equation, for the current study, the sample size required was
determined to be approximately 274.
Based on the approximations described above, a sample size of n = 375 was
selected for the present study. A conservative response rate of 50% was assumed;
therefore, 800 surveys were distributed. According to Hox and de Leeuew (1994), in an
analysis of 45 studies that compared response rates across face-to-face, mail, and
telephone survey methodologies, the face-to-face method of data collection resulted in
the highest rate of response among participants. They found average response rate for in-
person surveys to be 70.3% (Hox & de Leeuw, 1994). Although response rates for paper-
based self-administered surveys tend to be higher than similar telephone and web-based
surveys (Groves et al., 2004), increasing the number of participants contacted in the

56
administration of the survey allowed for a conservative estimate of nonresponse, while
still ensuring the attainment of an adequate sample size.
Instrumentation
The survey instrument used in the present study was comprised of six distinct
sections, for a total of 42 items (See Appendix A). The main sections were: approach-
avoidance (12 word-pairs), involvement (9 items), team loyalty (4 items), perception of
atmospheric music (4 items), purchase intentions and behaviors (4 items), and
demographic information (9 items). Participants were also asked to provide their email
address as a means of entry into the random drawing for the chance to win one of the
incentives described previously. Those participants who were randomly selected were
also contacted via the email address they provided. Approach-avoidance, involvement,
and team loyalty were all measured using adapted versions of scales used in previous
research.
Table 1
Summary of Adapted Scales
Name of Scale Variable Measure Authors
Semantic Differential Measures of Emotional Response to Environments Scale
Approach Avoidance
Arousal Pleasure
Mehrabian and Russell (1974)
Psychological Continuum Model (PCM)
Involvement Pleasure Centrality
Sign
Funk and James (2001)
Attitudinal Loyalty to Team Scale (ALTS)
Loyalty Attitudinal Loyalty Heere and Dickson (2008)

57
Emotional Responses Scale
All approach and avoidance behaviors can be attributed to emotional states, which
are the intervening variables between stimuli present in the environment and approach or
avoidance behaviors toward the environment (Hines & Mehrabian, 1979; Mehrabian &
Russell, 1974). Approach behaviors include an increase in the length of time spent in an
environment and increased affiliation, contact, verbal and nonverbal communication with
those present in the environment (Hines & Mehrabian, 1979). Conversely, avoidance
behaviors are characterized by decreased time spent in the environment, as well as
evading contact and communication, both verbal and nonverbal, with others in the
environment.
According to Mehrabian and Russell (1974; 1976) all approach-avoidance
behaviors are related to the two emotional states of arousal and pleasure. Within any
given environment, approach-avoidance behaviors are correlated to levels of pleasure-
displeasure induced by stimuli in the environment, regardless of the type of stimuli or
how it is introduced into the environment. Increased levels of pleasure result in approach
behaviors that are directly correlated to increased levels of arousal (Hines & Mehrabian,
1979). Further, as pleasure decreases, approach behaviors are also affected resulting in an
inverse relationship with arousal levels. In order to gauge arousal and pleasure in the
present study an adapted version of Mehrabian and Russell’s (1974) Semantic
Differential Measures of Emotional Response to Environments was used. Based upon
Mehrabian and Russell’s (1974; 1976) arousal-pleasure hypothesis the third emotional
state of dominance, which was included in the original instrument, was not measured.

58
Twelve adjective pairs, six each, were used to measure arousal and pleasure. Each
emotional state was gauged by responses to six corresponding adjective pairs. The final
scale included the best six items for each of the two dimensions, with item order
randomized and three items for each dimension inverted to control for response bias
(Mehrabian and Russell, 1974). Each word-pair consisted of dichotomous adjective
choices presented in the form of a semantic differential scale (+3 to -3 numerical score)
and average scores for each dimension were obtained. The 12 adjective pairs used in the
present study were cross-validated by Mehrabian and Russell (1974) in a three-stage
study with over 5,500 observations from 511 undergraduate students, whereby factor
analysis revealed through cross-validation that pleasure and arousal accounted for just
over 50% of the total variance in participants’ emotional responses to their environment
(Mehrabian & Russell, 1974).
The present study utilized an adapted version of Mehrabian and Russell’s (1974)
Semantic Differential Measures of Emotional Response to Environments scale. Cronbach
alpha reliability analysis was used to measure the internal consistency using inter-item
correlation coefficients. Results revealed, for the present sample, reported arousal and
pleasure scores were internally consistent, α = .86.
Involvement Scale
The involvement construct is of distinct interest when examining consumer
attitudes and behaviors as it is an unobservable motivational state that directs energy
toward an identified activity or product (Havitz & Dimanche, 1997, p. 246). Funk and
James’ (2001) Psychological Continuum Model (PCM) was chosen as the instrument to
measure involvement in the present study. The PCM’s foundation is based on an
59
understanding of involvement as being an unobservable state of motivation, arousal or
interest in a sport or the consumption of sport (Funk, 2008; Havitz & Dimanche, 1997;
Rothschild, 1984). The PCM was designed to investigate sport participation involvement
as well as sport spectator involvement. The PCM has also been adapted and successfully
utilized as a measure of participants’ motives for participation in both competitive and
charity sporting events (Filo et al., 2009; Funk, Toohey, & Bruun, 2007). Further, the
validity of scores obtained from the PCM has also been confirmed by Beaton and Funk
(2008), in an analysis of leisure participation frameworks.
In order to gauge involvement, individuals were presented with nine questions
designed to measure three involvement facets. The three facets being: pleasure, centrality,
and sign. Pleasure relates to the enjoyment gained through participation or attendance,
centrality is associated with the extent to which the activity or event plays a central role
in the life of the individual, and sign is representative of the amount of self-expression or
value derived from participation or attendance (Funk, 2008). Three questions for each
facet were included in the instrument. Each facet is assigned an average score based on
scores gleaned from responses to three questions for each involvement facet presented in
the PCM (See Table 2). Average facet scores are next rated as being either low
(M < 4.49), medium (M = 4.50 – 5.74), or high (M >5.75). All three ratings (L, M, or H)
are then used to create an individuals’ involvement profile. The involvement profile is
then used to place an individual into one of four stages along the psychological
continuum based on the use of a staging algorithm tool created by the instrument’s
authors, which categorizes individuals as belonging to one of the four involvement stages
based on the involvement profile constructed from the three average facet scores (Funk,

60
2008; Funk & James, 2001). The four stages, in ascending order of relative connection,
are: awareness, attraction, attachment, and allegiance. For example, if an individual
rated Low (L) on all three facets, she would be placed at the awareness stage of
psychological connection. Further, if a second individual rated Medium (M) on pleasure,
and High (H) on both centrality and sign, she would be placed in the allegiance stage.
According to Funk and James (2001), these four stages represent a continuum of
psychological connection, which is representative of one’s level of involvement. The
awareness stage is characterized by low levels of cognition and attitude formation with
respect to a particular sport, activity, or event (Funk, 2008). At the attraction stage
psychological evaluation and engagement are present creating a cursory emotional
response. Attachment indicates that a meaningful connection has been created, resulting
in symbolic, emotional, or functional significance relayed upon the sport or event (Filo et
al., 2009; Funk, 2008). Allegiance, the highest stage along the continuum, is achieved
when there is psychological commitment to a sport or event. As measured by the PCM,
as individuals’ level of psychological connection to a sport or event increases they will
progress up the continuum, which can be translated into an increased level of
involvement (Funk & James, 2001).
In the present study the PCM was used to measure participants’ level of
professional basketball involvement; and in particular their level of involvement with the
NBA. Items were reworded from the original instrument to reflect an emphasis on an
NBA attendee’s involvement. For example, participants were asked to rate their level of
agreement with the following statement: Attending NBA games plays a central role in my
life. Involvement facet scores were used to create an involvement profile, which was then

61
used to identify participants’ associated level of involvement along the psychological
connection continuum. Participants were labeled as being either high or low involved
based on their progression up the continuum. The high-involved group contained
participants whose combined average facet scores, or involvement profile, identified
them as being at either the attachment or allegiance stage. Low-involved participants
included participants whose involvement profile placed them at either the awareness or
attraction level along the psychological connection continuum.
Table 2 PCM Facet Scoring Pleasure
Facet Score
Centrality
Facet Score
Sign
Facet Score
Question 7 (P1)
= ____ Question 8 (C1)
= ____ Question 3 (S1)
= ____
Question 2 (P2)
= ____ Question 4 (C2)
= ____ Question 5 (S2)
= ____
Question 6 (P3)
= ____ Question 1 (C3)
= ____ Question 9 (S3)
= ____
Total Score Average
= ____ Total Score Average
= ____ Total Score Average
= ____
Note. Facet scoring table adapted from Step 2: Involvement Facet Calculation Table in D. C., Funk, 2008, Sport Consumer Behavior, p.81.
The PCM was also chosen in an effort to use a parsimonious measure of
involvement; that is a relatively straightforward and concise measure. The PCM uses
only nine questions to measure the involvement construct. Therefore, it can be completed
by participants while in attendance of a basketball game without causing an unnecessary
burden or intrusion on their experience. Further, the language used in the construction of
the questions is easy to understand, and therefore participants are able to answer

62
questions accurately, thus increasing the reliability of the responses. Further, the PCM’s
Cronbach’s alpha reliability was measured for the present sample. Results revealed
reported scores were internally consistent (α = .86) and alpha would decrease if any of
the nine items were removed from the scale
Team Loyalty Scale
To measure loyalty to the home team, Heere and Dickson’s (2008) Attitudinal
Loyalty to Team Scale (ALTS) was used in the present study. The ALTS measures the
psychological connection an individual has to a specific team. The scale is a
unidimensional measure that gauges internal psychological connections as opposed to
behavioral responses in order to measure attitudinal loyalty (Heere & Dickson, 2008).
Further, according to the authors, it was necessary to use such a unidimensional approach
thereby separating the constructs of affective commitment from attitudinal loyalty in
order to create a scale that could elicit reliable and valid scores to measure attitudinal
loyalty.
Heere and Dickson (2008) created a 4-item scale to measure attitudinal loyalty, or
resistance to change. The parsimonious scale has been shown by the authors to produce
reliable responses among 303 undergraduate students (Cronbach’s alpha reliability
estimate of .87). Validity of responses to the scale, as a measure of attitudinal loyalty,
was also determined based upon the average variance extracted (AVE) score of .614 in
the same study. Pilot study results for the scale also revealed convergent validity of the
scale (AVE = .599). Cronbach’s alpha reliability analysis, using the present sample,
revealed reported ALTS scores were internally consistent, α = .88.

63
Responses to the four loyalty measures were rated using a 7-point Likert-type
scale (1 = strongly disagree and 7 = strongly agree). Participants’ total scores on the four
loyalty items reflected levels of attitudinal loyalty. Further, average loyalty scores were
used to place each participant into one of four loyalty groups (absent [M = 1.0 – 1.5], low
[M = >1.5 – 3.5], medium [M = >3.5 – 5.5], and high [M = >5.5 – 7.0]). In the present
study the team of interest was the home team. Questions were reworded from the original
scale to include the home teams’ name. For example, participants were asked to rate their
level of agreement with the following statement: I would still be committed to the (home
team name) regardless of the lack of any star players.
Perceptions of Atmospheric Music
Emotional responses evoked by atmospheric music in the servicescape have been
shown to influence consumer attitudes and behaviors (Kotler, 1973). Further,
involvement levels have also been shown to moderate the impact of atmospheric music in
creating positive emotional responses (Alpert & Alpert, 1990). As such, low involved
individuals are more likely to be influenced by atmospheric music in creating positive
cognitive associations and memories of their attendance experience; thereby evoking the
desired consumer attitudes and behaviors of the sport organization.
In an effort to measure participants’ attitudes toward the atmospheric music
played during professional basketball games four questions were included in the survey
to assess participants’ perceptions of the atmospheric music. Items in this section
measured perceived congruency, distraction, and liking of the music. Construct scores
were based on participants’ responses to questions rated on a 7-point Likert-type scale

64
(1 = strongly disagree and 7 = strongly agree). Each construct is operationally defined
below.
Congruency. Congruency suggests that the style of music presented is in-line
with the expressed image of the organization or event. Further, the style of the music is
also in keeping with the type of music consumers’ associate with the organization, or the
image of the organization. The congruency of atmospheric music with the service setting
has been shown in the literature to influence consumer attitudes and behaviors (Jacob,
2006; North et al., 2003; North, Hargreaves, & McKendrick, 1999). Music has also been
shown to have the most significant impact on consumer purchasing behavior when
atmospheric music is congruent with the experiential environment (Jacob, 2006; North et
al., 1999). In order to gauge participants’ perceptions of atmospheric music congruency
with the environment, participants were asked to rate their level of agreement with the
following statement: The music played during the game was the type I associate with the
NBA.
Distraction. It has been shown in the advertising literature that when atmospheric
music is used to attract the attention of listeners, it should be done so as to direct attention
toward the central message or product being presented (Hecker, 1984). It has also been
revealed that atmospheric music is most effective when it is used to enhance the message
or product being presented. According to Chebat and colleagues (2000), if listeners focus
too much attention on atmospheric music, it can have a distracting effect, thus taking
away from the cognitive processing of the message central to the product. Further, when
music and visual stimuli are presented simultaneously, the very presence of auditory

65
stimuli is likely to have a distracting effect from the processing of visual stimuli (Chebat
et al., 1993; 2000).
Given that atmospheric music can work to enhance or distract attention, in the
experiential sport setting atmospheric music should be used to enhance the experience of
the sport consumer, so as not to compete with the sport product and thus be characterized
as a distraction. Participants thus were asked to report the extent to which they felt that
the atmospheric music was a distracting element of the consumptive environment. For
example participants were asked to rate their level of agreement, utilizing a 7-point
Likert-type scale (1 = strongly disagree and 7 = strongly agree), with the following
statement: The music interfered with my ability to interact and converse with those
around me.
Liking. It has been posited in the atmospheric music literature that individuals’
musical preference may influence emotional responses to the service setting (e.g.,
Guégen, Hélène, & Jacob, 2004). Given that individual musical preferences, or whether
or not one likes the atmospheric music, can influence responses this variable should be
considered when trying to explain consumer attitudes and behaviors within the
experiential sport setting. Therefore, participants were asked to report the degree to which
they liked the music being played during the event. For example, participants were asked
to rank there level of agreement, with the following statement: I liked the type of music
being played during the game (1=strongly disagree and 7=strongly agree).
Purchase Intentions and Behavior
There has been a considerable amount of research that has shown the marked
effect atmospheric elements within the service environment can have on consumer

66
purchasing behaviors (e.g., Alpert & Alpert, 1990; Areni & Kim, 1993; Morrin &
Chebat, 2005; North et al., 2003). Further, atmospheric music is effective at eliciting
responses and enhancing behavioral responses in experiential hedonic environments
(Morrin & Chebat, 2005). Therefore increases in actual purchasing behaviors from
intentions may be triggered by stimuli, presented here in the form of atmospheric music,
within the servicescape.
Concessions. In an effort to gauge the impact of the servicescape on consumer
purchasing behaviors, four questions were included in the survey instrument to measure
the total amount of money participants intended to spend during the game they were
attending. The total amount of money participants both intended to spend and actually
spent on alcoholic beverages was also gauged in addition to, and separate from, the total
amount of money spent on other types of concessions while in attendance of the event.
Participants were first asked to provide the amount of money they intended to
spend when they arrived at the game. For example, participants were asked to self-report,
in dollars, the amount of money they intended to spend by responding to the following
question: When you arrived at the arena today, how much money (in dollars) did you
intend to spend on alcoholic beverages? Given that atmospheric music has been shown to
affect consumer-purchasing behavior, participants were then prompted to divulge the
actual amount spent on alcoholic beverages during the event. The above information was
collected in an effort to investigate the influence of atmospheric music within the NBA
servicescape on the consumptive behaviors of game attendees.

67
Demographic Information
Demographic variables were included in the present study in order to gain a better
understanding of the characteristics of professional basketball attendees included in the
sample. Further, demographic variable responses were also used to gauge how well
respondents represented the average NBA fan. Participants were asked to provide
information regarding their age, gender, educational background, occupation, income
level, marital status, ethnicity, and zip code. Participants were also asked to reveal how
many games of the home team, on average, they attend during a typical season.
Respondents were also asked to provide an email address so that the researcher could
contact them if they were amongst the randomly selected respondents, who provided a
completed survey, to receive one of the incentives offered by the researcher.
Design and Procedures
Design
The present research was nonexperimental in design. In studies that utilize a
nonexperimental design, levels of independent variables are not controlled, manipulated
or assigned by the researcher (Tabachnick & Fidell, 2001). According to Tabachnick and
Fidell (2001) survey research is a common example of nonexperimental research. The
purpose of the present study was to gauge the extent to which relationships existed
between variables. Therefore, a correlational research design was employed to allow for
an investigation into the degree of such relationships; thereby providing a deeper
understanding into the nature of said relationships (Orcher, 2005)

68
Pilot Study
Items were included in the final survey-instrument based on results of a pilot
study. The pilot study utilized a bounded system case-study approach that focused on one
NBA game (event) and the attitudes and behaviors of the individuals (n = 11) who were
in attendance of the particular game. Multiple sources of data collection were employed,
in line with the tenets of the case study methodological approach (Creswell, 1998). Data
were collected through the administration of surveys, audio-recorded semi-structured
interviews, and participant observations. Data gained through observation served to
corroborate the significance of constructs which emerged from an analysis of the
interview and survey data; thus, supporting inclusion in the final survey instrument.
Observations thus were used to “provide [further] knowledge of the context [and] provide
specific incidents, behaviors, and so on that [were] used as reference points” for analysis
and development of the survey instrument used in the current study (Merriam, 1998,
p.96).
Procedures
Self-administered surveys were distributed and completed by participants while
in-attendance of two professional basketball games during the 2010-2011 NBA-season.
Both the organizations and the games were selected as a result of access, time, and cost
considerations, in addition to the availability of the lead researcher and the supporting
research team. I was onsite to distribute and collect surveys. A research team, consisting
of four individuals, also aided in the dissemination and collection of the survey. Access to
research sites was gained by seeking and gaining approval of the arenas’ professional
basketball organization.

69
Surveys, along with a writing instrument, were distributed to potential participants
seated in the randomly selected sections, based on the stratified cluster sampling
procedure described above. Surveys were randomly placed in cup holders of seats within
selected sections prior to fans entering the arena. Instructions, clearly displayed on the
front of the survey booklet, informed participants to complete their survey during the
second half of the game and to leave completed surveys in their cup holder. The
instructions also advised participants of the option of returning completed surveys to
designated guest services locations within the arena. Two announcements were made
during the game informing potential participants of presence and purpose of the surveys.
Surveys left in cup holders were collected at the end of the game, after attendees had left
the arena, from both locales (i.e., cup holders and guest services).
Each survey booklet also contained an introduction which presented the purpose
of the study to each potential participant. The introduction also contained the anticipated
time requirement to complete the survey (approximately 10 minutes), language ensuring
confidentiality of disclosed information, as well as the appreciation of the researcher for
respondents’ voluntary participation (See Appendix B). Language was also included
explaining to participants that both the completion and submission of the survey would
act as entry into a drawing for a chance to receive an incentive (i.e., signed jersey or pair
of tickets) procured by the researcher and provided by the organizations. Participants who
successfully completed all sections of the survey were eligible for inclusion in the
random drawing for said incentives. Two emails were randomly selected and winners
were contacted via email to claim their prize. All of the above elements, along with the
70
instrument and research design, were created in compliance with, and approval of, the
University of Northern Colorado’s Institutional Review Board (See Appendix C).
Statistical Techniques and Data Analysis
Descriptive Analysis
The first step in the data analysis was to conduct descriptive analyses. Descriptive
statistics are used as a compulsory analysis of the data to determine if the basic
assumptions were met in order to run subsequent statistical analyses. Further, general
information is revealed regarding the nature of the data, such as variable mean, median,
frequency, and variance.
Descriptive statistics as defined by Tabachnick and Fidell (2001) “describe
samples of subjects in terms of variables or combination of variables” (p. 7). Descriptive
analysis can also be used to organize as well as gain a compulsory understanding of data.
This type of analysis can be used in the categorization of both continuous and categorical
measures of variables as a method for “describing and summarizing, and reducing to
manageable form the properties of an otherwise unwieldly mass of data” (Glass &
Hopkins, 1996, p.2).
Reliability Analysis
Reliability analyses were next conducted, prior to running ensuing statistical
analyses, to estimate the internal consistency of scores on the three scales used in the
collection and analysis of data. Analysis concerning the reliability of items used to
measure variables is standard practice in the social sciences. According to Groves and
colleagues (2004) reliability is the “consistency of measurement across occasions or
across items designed to measure the same constructs” (p. 262). Scores from any

71
instrument used to gauge responses must have some degree of reliability if they are to
support score validity (Glass & Hopkins, 1996).
Given that the current study utilized a cross-sectional approach to administer a
multi-item survey instrument to gauge participant scores on various constructs (Groves et
al., 2004) Cronbach’s alpha coefficients were used to report reliability. Reliability was
estimated using inter-item correlation coefficients for the three primary scales (ALTS,
PCM and Emotional Response to Environments) used in the present. Scores for a
particular scale were considered reliable if the observed item scores were highly
correlated with each other (Glass & Hopkins, 1996). Each scale was analyzed to
determine the internal consistency of responses among participants on the scale. The
closer each Cronbach’s alpha coefficient was to 1.0 represented a greater degree of
internal consistency (Tabachnick & Fidell, 2001), with .80 generally regarded as a
reasonable benchmark.
Research Question 1
In order to examine the relationship between NBA involvement and participants’
attitudinal loyalty to the home team, an independent samples t test was performed.
Homogeneity of variance was determined based upon an examination of Levene’s test for
the equality of variance. The test was not significant (α > 0.5), suggesting that the
assumption was met. The t test statistic was computed to determine if high and low
involved participants differed in their amount of attitudinal loyalty to the home team.
Further, a predetermined alpha level of .01 was used to determine if there was a
significant difference between group means.

72
A t-test is a parametric statistical analyses that are used to determine if a
statistically significant difference exists between the sample means of two groups (Li,
Pitts, & Quarterman, 2008), and was therefore used to address the first research question.
This technique is applicable when there is an interval or ratio dependent variable and an
independent variable with two categories of membership. Independent samples t test is
the most frequently used t test method. This method is used to establish if a significant
difference between two sample means exists (Thomas & Nelson, 2001).
There are three major assumptions that must be met in order for an independent
samples t-test to be considered as an appropriate statistical technique: (1) independence
of the sample observations drawn from the population (2) homogeneity of variance, and
(3) normal distribution of the population (Glass & Hopkins, 1996). Further, according to
Glass and Hopkins the independence of observations is of supreme importance in order to
ensure the accuracy of probability assertions related to an inflated risk of type-I error.
Therefore, a conservative alpha level of .01 was utilized in the present study to account
for the increased possibility of type-I error associated with cluster sampling.
Research Questions 2 and 3
One-way MANOVA was the statistical technique used to analyze the data and test
the hypotheses presented for both research question 2 and research question 3.
MANOVA is an extension of ANOVA that is appropriately employed in situations where
there is more than one dependent variable. When a set of conceptually and empirically
related dependent variables is present on which to compare groups, multivariate analysis
of variance, or MANOVA, is the preferred statistical method of analysis as MANOVA
may expose differences not seen in any of the univariate ANOVA designs (Tabachnick &
73
Fidell, 2001). Further, MANOVA may be employed when a design presents more than
one independent variable as well as multiple dependent variables (Tabachnik & Fidell,
2001). The analysis allows the researcher to determine if a relationship exists between
groups of dependent variables based on the presence of specified independent variables
(Hyllegard, Mood, & Morrow, 2000).
As is the case with other techniques, there are certain assumptions in MANOVA
that must be met in order to properly apply this type of analysis. The main assumptions
associated with MANOVA are: homogeneity of variance-covariance matrices,
multivariate normality within each group, independence of observations, and linearity of
relations between dependent variables (Tabachnik & Fidell, 2001). The Box’s test of
equality of covariance matrices was examined for each MANOVA, revealing that the
first assumption was not violated, p > .05. Visual analyses of histograms were relied upon
to determine normality. Given that the current sample is greater than 200, formal testing
of normality may reject the null hypothesis when only small deviations from the normal
distribution exist (Tabachnick & Fidell, 2001). Histograms for each MANOVA revealed
relatively symmetrical distributions, suggesting the assumption of normality was not
violated. Dependence of observations within seating-section clusters may exist, given that
attendance of sporting events is an increasingly social experience. Thus, the experience of
an individual sport fan is not truly independent of the other attendees surrounding them
and enjoying the same experience. In order to account for the chance of dependence of
observations a more rigorous alpha, .01, was used to account for the increased chance of
type-I error as well as retain desired power, .90 (Stevens, 2002).

74
Scatterplots of the DVs for each MANOVA were also analyzed. Scatterplots of
the servicescape variables (arousal and pleasure) reflected homoscedastic positive linear
relationships between the DVs and levels of both involvement and loyalty (Glass &
Hopkins, 1996). Arousal was shown to have the strongest correlation to both involvement
(r = .221, p < .001) and loyalty (r = .289, p < .001), with pleasure also appearing to be
significantly correlated to levels of involvement (r = .147, p < .002) and loyalty (r = .201,
p < .001). Scatterplots of the atmospheric music variables (distraction, liking, and
congruency) were revealed significant positive correlations (α < .01) between both
congruency and liking and levels of both involvement and loyalty. The strongest music
factor correlation was between liking and levels of involvement (r = .154, p < .001) and
loyalty (r = .149, p < .002). There was also a negative correlation between levels of
involvement (r = -.054, p > .01) and music distraction, as well as a weak correlation to
loyalty (r = .027, p > .01).
Participants’ level of NBA involvement (high v. low involved), as determined by
responses to the PCM (Funk & James, 2001), was used as the independent variable of
interest in hypothesis 2.1. The dependent variables used were participants’ arousal and
pleasure scores as determined by responses to Mehrabian and Russell’s (1974) Semantic
Differential Measures of Emotional Response to Environments. Hypothesis 2.2 was
tested using participants’ attitudinal loyalty (high, medium, low, or absent), as
determined by scores on the ALTS (Heere & Dickson, 2008), as the independent
variable; while the dependent variables of arousal and pleasure remained the same as
those in hypothesis 2.1.

75
The third research question was also analyzed using MANOVA. Participants’
level of NBA involvement served as the independent variable in the test of hypothesis
3.1. The dependent variables employed were participants’ atmospheric interpretation
scores as indicated by congruency, distraction, and liking of music. The second
hypothesis (3.2) utilized the independent variable of ALTS (Heere & Dickson, 2008)
scores with the same dependent variables (congruency, distraction, and liking of music)
as those used to test hypothesis 3.1.
Descriptive discriminant analysis (DDA) was then utilized as a follow-up
procedure to MANOVA for both research questions. DDA was used to determine
whether or not the dependent variables of interest from the MANOVA (i.e., emotional
responses to environment and music interpretation scores) significantly discriminated
between levels of the MANOVA independent variable (i.e., involvement and loyalty
groupings) which became the dependent variables in the descriptive discriminant analysis
(Hyllegard et al., 2000). F to remove values were utilized to identify which variables
contributed the most to differences in loyalty and involvement group membership. Higher
F values indicated that a variable contributed more to differences in either loyalty or
involvement depending on the particular analysis. Pearson coefficients, presented in the
structure matrix, were also used to identify variables defining the music interpretation
and emotional responses to the servicescape linear discriminant functions (Tabachnick &
Fidell, 2001). A structure coefficient (i.e., loading) of .33 or higher was used to identify
salient variables, as this is generally accepted as the cut-off between prime and non-prime
variable loadings (Tabachnick & Fidell, 2001).

76
Research Question 4
The fourth research question was analyzed using cluster analysis. Cluster analysis
is utilized to separate a group of participants into homogenous subgroups based on shared
characteristics (Kachigan, 1991). The objective of this type of statistical analysis is to
maximize the variation found between groups in relation to the variation found within
groups (Kachigan, 1991). As such, cluster analysis is conceptually an exploratory
procedure used to identify individuals who form groups based on the similarity of scores
on a set of variables. Another objective of cluster analysis is to identify groups within a
given set of data that might be generalizable to a target population.
The success of cluster analysis is primarily dependent upon the variables being
measured and the algorithm used to generate clusters (Lorr, 1983). With respect to the
first factor, the scales used to measure each variable will impact the amount of variability
detected on each variable. Therefore standardized scores, or z-scores, were used to
measure variables in order to stabilize the amount of variability across measures and thus
aid in the creation of meaningful group clusters (Lorr, 1983). When z-scores are used to
transform raw data, the group mean is fixed at zero and one standard deviation from the
mean is 1.0. The transformation allows scores obtained from multiple scales to be
compared based on an analysis of standard deviations from the group mean (Huck, 2008).
There are two basic types of clustering methods, hierarchical and non-hierarchical
clustering. Hierarchical clustering methods have been the most commonly used approach
in research settings (Aldenderfer & Blashfield, 1984). Further, there are four common
hierarchical clustering methods: single linkage, complete linkage, average linkage, and
Ward’s method. Ward’s (1963) method has been a preferred method in the social

77
sciences, as this method was designed to maximize the minimum variance within clusters
by combining clusters for which the increase in the total within-cluster variation is the
smallest (Lorr, 1983).
Given that cluster analysis is a statistical technique performed to investigate
whether meaningful groups exist amongst data, in the present study a cluster analysis was
used to reveal whether or not discernible groups of participants existed based upon the
homogeneity of scores on a set of specified variables. This analysis also worked to
provide insight into which explanatory variables, or characteristics, were shared by
participants who displayed high levels of involvement, as well as those who scored high
on the ALTS (Heere & Dickson, 2008).
Due to the exploratory nature of cluster analysis there were no hypotheses
included in the formation of research question 4. There are no clear-cut, or distinct,
guidelines for determining the number or composition of clusters, as cluster analysis
includes a set of various methodological approaches (Punj & Stewart, 1983). Therefore,
the research question did not include any assumptions as to how many meaningful
clusters would or should be formed as a result of the analysis. Multiple iterations of the
analysis were performed in order to determine the most appropriate number of
interpretable and discernible clusters. Thus, multiple cluster solutions were created and
analyzed to determine the best possible groupings necessary to provide a deeper
understanding of the characteristics related to, and shared by, participant game-attendees.
Ward’s (1963) method of hierarchical agglomeration was used in the present
study. Ward’s method has been widely used in the behavioral and social sciences to
produce discernible and meaningful clusters (Borgen & Barnett, 1987; Lorr, 1983;

78
Milligan, 1981). This method detects clusters by joining groups of participants whose
scores represent the minimum increase in the within-cluster sum of squares (Everitt,
1980). Thus, the total within-cluster variation is computed and the two clusters with the
smallest increase in variance are combined. Resultant clusters are then interpreted to
discern the formation of meaningful groups of participants based upon observed scores
used to measure the variables of interest in the present study. A dendogram was also
produced and analyzed in the interpretation of the data and construction of a final cluster
solution. Multiple cluster solutions were analyzed; however, only solutions with 2 to 8
clusters were considered for practical purposes.

79
CHAPTER IV
AN ANALYSIS OF NBA INVOLVEMENT AND TEAM LOYALTY ON CONSUMER ATTITUDES AND
EMOTIONAL RESPONSES
Review of Literature
Sport is a unique product within the domain of entertainment and leisure services,
as it is an unpredictable experiential and intangible service-product that is simultaneously
produced and consumed. Given this simultaneous production and consumption, the total
experience of the consumer has increased relevance (Bitner, 1992). Therefore the
environment, or servicescape, within which the sport product is presented, holds
significant relevance upon consumers’ overall perceptions and opinions formed about the
sport consumption experience.
Another salient aspect of sport is the limited amount of control marketers and
other event management personnel have over the performance of the core sport product,
or the game itself. Sport organizations control who is on the roster; however injuries,
individual and team performance, and game outcomes are unpredictable and out of the
organizations’ direct control. According to Mullin and colleagues (2007) the limited
control of the sport product is a distinguishing feature of sport marketing. Therefore it is
imperative for sport marketers to create and increase levels of involvement and loyalty
among sport consumers to provide a consistent customer base in times of change,

80
uncertainty, or poor performance (Funk & Pastore, 2000; Heere & Dickson, 2008;
Mahoney, Madrigal, & Howard, 2000).
Involvement
According to Sherif and Cantril (1974) the foremost characteristic of a highly
involved individual is increased levels of resistance to persuasion. Thus, it follows that an
individual who is highly involved will display increased levels of commitment as well as
be more likely to reject alternatives. Involvement is also a multidimensional and
exceedingly complex construct. An individual can be involved, simultaneously, with
multiple products, brands, and services at a given time (Havitz & Dimanche, 1999;
Kerstetter & Kovich, 1997; Zaichowsky, 1985). Further, involvement levels may change
over time, given the level of exposure, information, and relevance of the product to the
individual, as well as the ability of the product to fulfill specific needs, at any given point
in time (Funk, 2008).
Consumer involvement has been investigated considerably in both the marketing
and leisure literature (Havitz & Dimanche, 1997; Munson & McQuarrie, 1987; Sherif &
Cantril, 1974; Zaichkowsky, 1985). Research related to sport involvement, and in
particular team sport spectator involvement, however is not as prevalent. Given that the
relationship between involvement and sport-consumer attitudes and behaviors is of
considerable import to sport marketers and managers, just as it is to marketers and
managers in other respective experiential retail, service or leisure environments, Funk
and James (2001) developed the Psychological Continuum Model (PCM) to measure
sport fan and spectator involvement (Filo, Funk, & O’Brien, 2009; Funk, 2008).
81
The PCM measures three distinct facets of involvement: pleasure, centrality, and
sign. Each facet is given a score, which works to create an involvement profile, which is
then used to place an individual along a continuum of psychological connection; or one’s
level of involvement (Funk & James, 2001). The lowest end of the spectrum is
awareness, which is characterized by low levels of cognition and attitude formation. At
the high end of the continuum, allegiance occurs, whereby there is psychological
commitment to a sport or event. Therefore, as an individual’s level of psychological
connection to a sport or event increases they will progress up the continuum, which is
understood to represent an increased level of involvement (Funk & James, 2001).
Loyalty
For the purposes of this study, the attitudinal component of loyalty is presented as
an individual’s resistance to alterations in the level of psychological commitment (Heere
& Dickson, 2008; Pritchard, Havitz, & Howard, 1999). Specific to a team-sport setting,
loyalty is not psychological commitment itself, but rather the persistence and strength of
commitment to a particular team and therefore is contingent upon the creation of
increased levels of involvement (Heere & Dickson, 2008). Attitudinal loyalty is also the
result of the interaction between internal psychological processes and connections, and
any negative external changes that may occur (Heere & Dickson, 2008).
To measure team loyalty, Heere and Dickson’s (2008) Attitudinal Loyalty to
Team Scale (ALTS) was used in the present study. The ALTS is a parsimonious 4-item
measure of the psychological connection an individual has to a specific team. As such,
the scale is a unidimensional measure that separates internal psychological connections
from behavioral responses in order to measure attitudinal loyalty (Heere & Dickson,

82
2008). Further, loyalty to a team represents an individual’s resistance to change when
presented with alternatives, such as if the team is in a slump, or changes are made to the
team’s lineup. Thus, loyalty is a predictor of future behavioral intentions, regardless of
the team’s performance, which is significant given the unpredictable nature of sport and
the sport product.
Emotional Responses to the Servicescape
Bitner (1992) defined the servicescape as all of the aspects of a service
environment that can be controlled by the firm. Within the servicescape easily accessible
environmental cues are relied upon as a significant source of information when
interpreting, making inferences about, and ultimately making judgments regarding
product/service quality and value (Baker, 1998). In addition consumer behavior
researchers (Bitner, 1992; Falk, Sockel, & Warren, 2005; Namaslvayam & Mattila, 2007)
contend consumers holistically interpret their environment, taking into account all of the
various elements present within a given setting. Therefore, elements within the
servicescape do not exist as a single entity, but rather as interrelated components working
together to create the total service environment.
Emotional responses to the environment occur regardless of the type of stimuli
that is present in the environment or how the stimuli are introduced. Specific to
consumers’ emotional responses, Mehrabian and Russell (1974; 1976) noted such
responses are a result of a consumers taking into account all of the various elements
present in a given setting. According to Mehrabian and Russell (1974, 1976) any
demonstrated response to a physical setting, or environment, can be categorized as being
either an approach (e.g., increased time or affiliation) or avoidance (e.g., decreased

83
contact or evasion) behavior. Further, all behaviors can be attributed to emotional states,
which are the intervening variables between stimuli present in the environment and
approach or avoidance behaviors toward the environment (Hines & Mehrabian, 1979;
Mehrabian & Russell, 1974). Therefore, levels of arousal and pleasure were measured in
the present study using an adapted version of Mehrabian and Russell’s (1974) Semantic
Differential Measures of Emotional Response to Environments. Drawing upon
Mehrabian and Russell’s (1975, 1976) arousal-pleasure hypothesis, which posits that all
approach-avoidance behaviors are related to the two emotional states of arousal and
pleasure. Therefore, the third emotional state of dominance, which was included in the
original scale (Mehrabian & Russell, 1974), was not measured in the present study.
Within the sport setting a consumer’s perceptions of a servicescape have been
shown to be a determinant of their behavior, particularly when the service is experiential
and consumed primarily for hedonistic reasons (Wakefield & Blodgett, 1996). Within the
minor league baseball system, Hightower, Brady, and Baker (2002) investigated the
relationship between a newly constructed stadium’s servicescape and behavioral
intentions. Consistent with previous research (Wakefield & Blodgett, 1994, 1996;
Wakefield & Sloan, 1995) the authors found the servicescape to have a significant
influence on behavioral intentions, including repurchase and attendance intentions, and
intended positive word-of-mouth (Hightower et al., 2002). The servicescape was also
shown to significantly influence positive affect, in other words arousal and pleasure.
Further, increased levels of involvement were significantly and positively related to
perceptions of the servicescape (Hightower et al., 2002). These findings suggest that
84
organizations should analyze their servicescape and strategically manipulate servicescape
elements to increase involvement levels among consumers (Hightower et al., 2002).
Atmospheric Music
One servicescape element, atmospheric music, has been studied in relation to a
wide variety of consumer behaviors and has been shown to influence both approach and
avoidance behaviors, such as the amount of time and money spent in various service
settings (e.g., Areni & Kim, 1993; Jacob, 2006; Milliman, 1986; North & Hargreaves,
1998; North, Shilcock, & Hargreaves, 2003). The influence of atmospheric music in
eliciting preferred responses has also been shown to be related to involvement levels.
Consumer behavior research has found that when consumers’ have low levels of
involvement with a product, positive feelings (e.g., liking) are more likely to be created
with the introduction of stimuli, such as music (Kotler, 1973). Further, when presented
with both visual and auditory stimuli (e.g., music), the presence of aural cues act to
distract from visual cues (Chebat et al.,, 1993), particularly if the music is perceived to be
incongruent with the service-environment (Jacob, 2006; North, Hargreaves, &
McKendrick, 1999). Thus, in a highly-stimulating environment where multiple forms of
stimuli are present, the insertion of atmospheric music may work to distract or divide
consumers’ attention from visual elements.
The present study examined participants’ perceptions of the atmospheric music at
NBA games, based on perceived levels of congruence, distraction, and overall liking of
the music. Given that organizations may not be able to possess adequate resources to
“control” all aspects of the service-environment; one element that organizations can
easily control is the atmospheric music that is presented as part of the game experience.

85
Therefore, better understanding atmospheric music’s influence on consumer attitudes and
behaviors is an important consideration. Additionally, such music’s influence on the
sport-entertainment product would be relevant in sport marketer’s representation of their
team’s unique brand.
Purpose and Hypotheses
The purpose of the present study was to examine the extent to which professional
basketball engagement explains individuals’ attitude toward the home team. In order to
investigate this relationship, participants’ levels of involvement with professional
basketball were measured in relation to levels of attitudinal loyalty. NBA basketball was
chosen as the spectator sport of focus for the present study due to the unique nature of
both the product and consumers. According to Andrews (2006) the NBA has embraced
the notion that sport is no longer confined to the competition between teams and athletes
on the court and has “successfully blurred the boundaries between the sport, media, and
entertainment industries” (p.13).
Given the increasingly cluttered sport marketplace, there is also an impetus for
sport organizations to establish a base of loyal consumers in order to grow their fan base
and more fully insulate the organization from environmental threats (Amis, Slack &
Barrett, 1999). Supporting the importance of fan loyalty, Funk and James (2001) noted
that as a consumer’s level of involvement with a sport or event increases they progress up
the continuum of psychological commitment, a measure of established loyalty. As such,
the first hypothesis was designed to examine the extent to which professional basketball
involvement explains participants’ level of loyalty to the home team.
86
H4.1: A participant’s level of involvement with professional basketball will be positively related to a participant’s level of loyalty to the home team.
A second purpose of the study was to examine the relationship between
professional basketball involvement and attitudinal loyalty to the home team on
emotional responses to the professional basketball servicescape. The NBA product is
consumed within an increasingly stimulating consumptive landscape (Andrews, 2006).
Additionally, the sport product itself has the power to produce strong emotional reactions
and bonds. Within such a setting, individual consumers experience emotional reactions
as they watch professional basketball games as well as experience and interpret various
stimuli in the servicescape. Thus, the second and third hypotheses address the
relationship between professional basketball consumer involvement and loyalty on
emotional responses of arousal and pleasure experienced while in the consumptive
service-environment.
H4.2: Participants’ level of involvement with professional basketball will be positively related to their reported levels of arousal and pleasure experienced while in attendance of the game.
H4.3: Participants’ level of loyalty to the home team will positively be positively
related to their reported levels of arousal and pleasure experienced while in attendance of the game.
Lastly, the representation of professional basketball games is increasingly
entertainment oriented, with atmospheric music playing a prominent role. In various
service environments, the presence of atmospheric music has been reported to be salient
in eliciting various consumer attitudes and behaviors (e.g., Areni & Kim, 1993; Jacob,
2006; North et al., 1999). Therefore, hypotheses 4.4 and 4.5 focus on the relationship
between two factors: (a) professional basketball involvement and (b) attitudinal loyalty to

87
the home team on consumers’ reported levels of “liking” the music being played,
perceptions of the music as being congruent with professional basketball, and whether
they thought the music was “distracting.”
H4.4: Participants’ level of involvement with professional basketball will be positively related to the music interpretation scores of liking, congruency and distraction.
H4.5 Participants’ level of loyalty to the home team will be positively related to the
music interpretation scores of liking, congruency and distraction.
Method
Sample
The target population for the present study was individual NBA game attendees
over the age of 18. Participants were randomly selected from attendees of two
professional basketball games that were played in the southeastern region of the United
States during the 2010-2011 regular season. The venues selected for the study were
arenas of two NBA Eastern Conference teams from among the 30-team league. Average
attendance figures for the two teams’ home games during the 2010-2011 season were
16,791 and 15,846, respectively (ESPN, 2011).
A sampling frame, utilizing stratified cluster sampling, was applied in order to
establish potential participants in the study. Cluster sampling is useful, as part of a
research design, when the target population is large, therefore making it extremely
difficult to randomly sample individual members of the population (Lohr, 2008).
Restriction of the target population was necessary, and appropriate, due to both practical
(i.e., significant average attendance size) and financial (i.e., budget) constraints (Biemer
& Lyberg, 2003). Clusters for the present study were constructed utilizing randomly
selected seating-sections, which were present and easily identifiable, within the arenas.

88
Instrumentation
The survey used on the present study consisted of seven distinct sections with a
total of 42 items. An adaption of Funk and James’ (2001) Psychological Continuum
Model (PCM) 9-item scale (reworded specifically for this study) was used to measure
participants’ levels of involvement with the NBA. For example, participants were asked
to rate their level of agreement, on a seven point Likert-type scale ranging from1
(strongly disagree) to 7 (strongly agree), with the following statement: Attending
professional basketball games plays a central role in my life. Involvement facet scores
were used to determine participants’ associated level of involvement along the
psychological connection continuum (Funk & James, 2001). Participants were labeled as
belonging to either the high (attachment or allegiance) or low (awareness or attraction)
involved group.
Heere and Dickson’s (2008) 4-item Attitudinal Loyalty to Team Scale (ALTS)
was used to measure attitudinal loyalty to the home team. Loyalty was measured using a
7-point Likert-type scale (1 = strongly disagree and 7 = strongly agree). Total scores were
used to determine their respective level of attitudinal loyalty to the home team.
Participants were further place identified as belonging to one of four loyalty groups (high,
medium, low or absent) based on their total loyalty score.
Mehrabian and Russell’s (1974) Semantic Differential Measures of Emotional
Response to Environments was used to measure levels of arousal and pleasure, as
induced by stimuli in the environment, experienced by participants. Each emotional state
was gauged based on responses to six respective adjective pairs, presented in the form of
a semantic differential scale (+3 to -3 numerical score). Given that emotional responses

89
evoked by atmospheric music in the servicescape have been shown to influence consumer
attitudes and behaviors (Kotler, 1973), participants’ perceptions of the atmospheric music
played during the professional basketball game were measured based on responses to four
questions that gauged the respondents’ perceived congruency, distraction, and liking of
the music.
Procedures and Analysis
Surveys were distributed and completed by spectators at two professional
basketball games during the 2010-2011 NBA-season. Surveys and pencils were
distributed throughout randomly selected sections, based on the previously described
stratified cluster sampling procedure. The researcher, along with a supporting research
team, was onsite to distribute, administer, and collect surveys. Research site access was
approved and facilitated by each arena’s professional basketball organization. All surveys
(completed and non-completed) were retrieved from seat cup holders and/or designated
in-arena guest services locations.
Hypothesis 4.1. In order to examine the relationship between NBA involvement
and participants’ attitudinal loyalty to the home team, an independent samples t test was
performed. Homogeneity of variance was determined based upon an examination of
Levene’s (α > 0.5) test for the equality of variance, which suggested that the assumption
was not violated. The t test statistic was computed to determine if high and low involved
participants significantly differed (α = .01) in their amount of attitudinal loyalty to the
home team.
Hypotheses 4.2-4.3. A One-way MANOVA was performed to determine if
differences existed between levels of an independent variable on a specified vector of
90
dependent variables (Tabachnik & Fidell, 2001). Participants’ level of professional
basketball involvement (high v. low involved), as determined by responses to the PCM
(Funk & James, 2001), was the independent variable related to hypothesis 4.2. The
dependent variables of interest were participants’ arousal and pleasure scores as
determined by responses to Mehrabian and Russell’s (1974) Semantic Differential
Measures of Emotional Response to Environments scale. Data analysis to test hypothesis
4.3 employed the dependent variables of arousal and pleasure scores, but, levels of
attitudinal loyalty (high, medium, low, or absent), as determined by scores on the ALTS
(Heere & Dickson, 2008) was the independent variable.
Descriptive discriminant analysis (DDA) was then utilized as a follow-up
procedure to the MANOVA analyses for both research questions to determine which of
the dependent variables was most responsible for group separation (Tabachnick & Fidell,
2001). F to remove values were reported to identify variables that contributed the most to
differences in loyalty and involvement group membership. Pearson coefficients, as
presented in the structure matrix, were also used to identify variables that were significant
in defining the emotional response factor based on respective loadings. A cut-off .33 was
used to identify significant variables, as this is generally accepted as the cut-off between
prime and non-prime variable loadings (Tabachnick & Fidell, 2001).
Hypotheses 4.4-4.5. The final two hypotheses were also tested using a one-way
MANOVA. Participants’ level of NBA involvement (high v. low involved) was used as
the independent variable of interest in testing hypothesis 4.4, while levels of attitudinal
loyalty to the home team (high, medium, low, or absent) were employed to test
hypothesis 4.5. The dependent variables in both analyses were participants’ atmospheric

91
interpretation scores as indicated by responses to congruency, distraction, and liking of
music questions contained in the survey instrument. Additionally, descriptive
discriminant analysis was again used as a follow-up procedure to MANOVA. F to
remove values for music interpretation variables were utilized to identify which of the
factor variables contributed the most to differences in loyalty and involvement group
membership.
Results
A total of 800 surveys (400 each game) were distributed during two NBA games.
The study’s usable sample (N = 425 completed surveys, 53% overall response rate) was
just above the conservative estimate of 50% assumed for the present study. Individual
game samples were: first game (n = 194, 46%) and second game (n = 231, 54%).
Forty-seven percent (n = 199) of respondents were seated in the arenas’ “lower
bowls," while 53% (n = 226) had seats located in the upper bowls. Consistent with
Schnietz and colleague’s (2005) select NBA fan demographics, this study’s “average”
participant was a white (57%) male (61%) with either a bachelor’s (33%) or graduate
(24%) degree. Further, 51% of this study’s respondents were married, with 34% earning
more than $100,000 annually. For a more in depth breakdown of study participants’
demographic information see Table 3.
The reported average number of NBA games attended in a typical season was
eight games, with 33% (n = 139) participants typically attending one game a season.
Seventy-seven percent (n = 327) reported low levels of involvement with the NBA, with
the remaining 23% (n = 98) having high involvement levels. Forty-two percent of
respondents (n = 176) displayed low (n = 122) or absent (n = 54) levels of attitudinal

92
loyalty to the home team. Additionally, 41% (n = 172) and 18% (n = 77) reported
medium and high levels of attitudinal loyalty, respectively. Prior to running statistical
analyses to address the hypotheses, the internal consistency reliability of the involvement,
loyalty, and emotional responses to the environment scale was also estimated.
Table 3
Demographic Information of Current Sample (N = 425) Variable N % Gender Female 165 61
Male 260 39
Age
18-20 60 14
21-30 96 23
31-40 86 20
41-50 99 23
50+ 84 20
Ethnicity
White 244 57
African American 151 36
Hispanic 15 3.5
Alaskan Native 10 2
Asian/Pacific Islander 5 1.5
Education
High School 88 21
Some College/College Graduate 176 42
Graduate/Post Graduate Degree 153 36
Other 8 1
Marital Status
Married 215 51
Single 141 33
Divorce 32 8
Separated 13 3
Widowed 5 1
Partner 19 5
Income
<20K 95 22
20-40K 56 13
40-60K 51 12
60-80K 25 6
>80K 198 47
93
Hypothesis 4.1
The t test statistic was computed to determine if high and low involved
participants differed in their amount of attitudinal loyalty to the home team. Cronbach’s
alpha was first examined for the ALTS to ensure reliability of the scores for this scale.
The results revealed ALTS scores were internally consistent, α = .88, using the present
sample. The PCM’s Cronbach’s alpha was also examined to confirm reliability. Results
revealed scores, utilizing the present sample, were internally consistent (α = .86). Further,
the Cronbach’s alpha statistic would decrease if any of the nine items were removed from
the scale.
The independent samples t-test (t [423] = -6.907, p < .001, partial η² = .05)
revealed reported levels of professional basketball involvement were positively related to
individuals’ attitudinal loyalty to the home team. Further, participants who displayed low
levels of professional basketball involvement (M = 14.35; SD = 6.40) also reported low,
or the absence of, attitudinal loyalty to the home team, while individuals who were highly
involved (M = 19.36; SD = 5.93) with the NBA reported significantly higher levels of
attitudinal loyalty.
Hypothesis 4.2
First, the Cronbach alpha reliability estimate was examined for the adapted
version of Mehrabian and Russell’s (1974) Semantic Differential Measures of Emotional
Response to Environments scale. Results (α = .86) revealed, for the present sample,
reported arousal and pleasure scores were internally consistent. Descriptive analysis of
involvement group membership and emotional response to the servicescape scores further
revealed participants with high levels of professional basketball involvement appeared to

94
report higher levels of arousal (M = 5.13; SD = 6.11) and pleasure (M = 7.36; SD = 7.36)
than their low-involved counterparts (See Table 4).
Table 4 Mean Arousal and Pleasure Scores by Involvement Group Arousal Pleasure
N M SD M SD
Involvement Group
Low 327 1.80 6.246 4.99 6.537
High 98 5.13 6.113 7.36 7.359
Note. Mean scores represent summed scores gauged in response to twelve semantic differential word-pairs contained on the Emotional Responses to Environments Scale (Mehrabian & Russell, 1974)
One-way MANOVA results revealed a significant main effect of the independent
variable (involvement) on the set of servicescape variables (arousal and pleasure),
F (2, 423) = 11.23, p < .001, Wilk’s λ = .949. The results reflect a moderate association
between involvement (high vs. low) and the combined servicescape variables, partial
η² = .05 (Huck, 2008). Results support hypothesis 4.2, which predicted a relationship
between participants’ levels of involvement and emotional responses experienced during
an NBA game.
Next, a descriptive discriminant analysis was conducted to better understand
differences in involvement group membership. F to remove values revealed that arousal,
F = 12.898, contributed more than pleasure, F = .709, to differences in involvement.
Further analysis of the structure matrix revealed that both arousal (.983) and pleasure
(.644) seem to be meaningful variables in defining the emotional responses to the
servicescape factor.

95
Hypothesis 4.3
Preliminary analysis revealed mean differences between loyalty groups and
emotional responses to the environment. Participants with high levels of attitudinal
loyalty reported higher levels of both arousal (M = 6.55; SD = 5.03) and pleasure
(M = 8.58; SD = 6.88) than participants who reported lower levels of attitudinal loyalty
(See Table 5). Further, it appears that as loyalty increases, so too do levels of arousal and
pleasure.
Table 5 Mean Arousal and Pleasure Scores by Loyalty Group Arousal Pleasure
N M SD M SD
Loyalty Group
Absent 54 -.31 6.404 3.89 5.182
Low 122 1.73 5.200 4.54 5.993
Medium 172 2.28 6.859 5.41 7.358
High 77 6.55 5.033 8.58 6.877
Note. Mean scores represent summed scores gauged in response to twelve semantic differential word-pairs contained on the Emotional Responses to Environments Scale (Mehrabian & Russell, 1974)
One-way MANOVA revealed a significant multivariate main effect for loyalty,
F (6, 840) = 8.34, p < .001, Wilk’s λ = .891, on the combined servicescape variables.
Results also indicated a moderate association between level of team loyalty (absent, low,
medium, and high) and servicescape, partial η² = .06. Results support hypothesis 4.3, as
there was a significant relationship revealed between participants’ levels of involvement
and emotional responses experienced during an NBA game. That is, there was a
statistically significant difference between participants’ level of involvement on the linear
composite of arousal and pleasure scores.

96
Descriptive discriminant analysis was next conducted to better describe the
differences between levels of loyalty to the home team, using arousal and pleasure scores
as discriminating variables. Analysis of F to remove values revealed that arousal,
F = 9.250, contributed more than pleasure, F = 1.007, to differences in loyalty. Analysis
of the structure matrix further revealed both arousal (.976) and pleasure (.656) as salient
variables in defining the emotional responses to the servicescape factor.
Hypothesis 4.4
Descriptive analysis of music scores revealed high (M =5.49; SD = 3.75) and low
(M =5.94; SD = 3.51) involved participants reported similar music distraction scores.
Mean differences were seemingly revealed between involvement groups and both
atmospheric music congruency and liking. The means of the high involved group on both
factors was higher than the low involved group (See Table 6). The variability of the two
involvement groups on the three music interpretation factors also appear to be similar.
Table 6
Atmospheric Music Interpretation Scores by Involvement Group Distracting Congruent Liking
N M SD M SD M SD
Involvement Group
Low 327 5.94 3.506 4.69 1.982 4.62 2.046
High 98 5.49 3.745 5.38 1.791 5.36 1.823
Note. Mean scores represent summed scores in response to four Likert-type questions (1 = strongly disagree and 7 = strongly agree) contained to measure perceptions of atmospheric music distraction, congruency and liking.
One-way MANOVA revealed a significant multivariate main effect for
involvement, F (4, 420) = 3.160, p < .01, Wilk’s λ = .971, on the set of atmospheric
music dependent variables. The results reflect a modest association between involvement

97
(high vs. low) and grouped music interpretation scores, partial η² = .03. As predicted in
hypothesis 4.4, there was a relationship between participants’ levels of involvement and
perceptions of music played during the NBA game. That is, there was a positive
relationship between participants’ level of involvement and he linear composite of music
congruency, liking, and distraction scores grouped together.
Follow-up descriptive discriminant analysis was conducted to better understand
separation in involvement group membership. Results revealed the music variables of
liking, F = 1.905, and congruency, F = 1.779, contributed more to differences in NBA
involvement than variables representing music as a distraction from interaction, F = .181,
and distraction from the game, F = .528, which were revealed to be less influential
contributors to differences in levels of involvement. The structure matrix also revealed
that the two variables of music liking (.901) and congruency (.869) appear to be the
music variables that are the most salient in defining the music interpretation factor as well
as differences in levels of involvement.
Hypothesis 4.5
Initial descriptive analysis revealed similar mean ratings of music distraction for
participants in disparate loyalty groups. Regardless of the level of loyalty to the home
team, participants seemed to perceive the atmospheric music as a distracting servicescape
element. Although there were no noticeable mean differences on distraction scores, music
interpretation scores did reveal a positive relationship between team loyalty and music
liking. That is, participants with higher levels of attitudinal loyalty appeared to enjoy the
atmospheric music at higher levels than participants’ displaying lower levels loyalty to

98
the home team (See Table 7). A similar positive relationship also appears to exist
between levels of loyalty and perceptions of music congruency.
Table 7
Mean Atmospheric Music Interpretation Scores by Loyalty Group
Distracting Liking Congruent
N M SD M SD M SD
Loyalty Group
Absent 54 5.06 3.563 4.19 2.548 3.94 2.310
Low 122 6.16 3.874 4.52 2.125 4.89 1.995
Medium 172 5.90 3.290 5.05 1.806 4.98 1.803
High 77 5.74 3.622 5.05 1.761 5.10 1.832
Additionally, there were also seemingly differences on reported levels of
perceived atmospheric music congruency based on participants’ level of attitudinal
loyalty. In particular, there were mean differences between participants’ with absent
loyalty to the home team and all three other loyalty groups (low, medium, and high) on
congruency interpretation scores. That is, participants with no reported attitudinal loyalty
to the home team reported lower levels of perceived atmospheric congruency than
participants with higher reported levels of loyalty (See Table 8).
Results of the one-way MANOVA revealed, a significant multivariate main effect
for loyalty, F (4, 420) = 3.160, p < .001, Wilk’s λ = .942, of the linear composite of
music interpretation variables. Results also revealed a weak association between loyalty
(absent, low, medium, and high) and grouped music interpretation scores, partial η² = .02.
Hypothesis 4.5 was confirmed given the significance of the overall test. In-line with
results of hypothesis 4.4, there were statistically significant relationship between levels of
99
attitudinal loyalty to the home team and the linear composite of atmospheric music
interpretation scores.
Follow-up descriptive discriminant analysis was conducted to interpret separation
among loyalty groupings (absent, low, medium, and high) based on music interpretation
scores. Results of the analysis revealed high F-to-remove values for all four music
interpretation variables. Music as a distraction from interaction, F = 3.522, and
distraction from the game, F = 3.154, were revealed to be the most influential
contributors to differences in levels of loyalty. Music congruency, F = 2.444 and liking,
F = 2.007, were shown to also have high F values, but to be less influential on differences
in loyalty. Further analysis of the structure matrix revealed the two variables of music
congruency (.769) and distraction from interaction (.497) as the variables most
responsible for defining the underlying linear composite of atmospheric music
interpretation scores.
Discussion
This study’s findings seem to be in-line with previous research, within various
service sectors, as to the relationship between involvement and loyalty. Hypothesis 4.1
was supported, revealing that reported levels of professional basketball involvement
among participants were positively related to an individual’s attitudinal loyalty to the
home team. This finding appears to be consistent with Sherif and Cantril’s (1974)
contention that the foremost characteristic of a highly involved individual is the presence
of increased levels of rejection of and resistance to change. This conclusion has also been
supported by investigations of involvement amid various sport consumers (Funk, 2008;
Funk et al., 2004). Within the PCM framework (Funk & James, 2001), allegiance is used

100
to identify individuals with the highest level of involvement or psychological
commitment to an organization. This operational definition of high level involvement is
the same as Heere and Dickson’s (2008) definition of loyalty used in the development of
the ALTS. Therefore, loyalty to the home team can only be achieved after a consumer
progresses up the four stages of the involvement continuum.
Additionally, results support previous research employed to garner a deeper
understanding of emotional responses experienced by consumers in various service
environments. Significantly higher levels of arousal and pleasure experienced by highly
involved and loyal participants, as revealed in hypotheses 4.2 and 4.3, is in keeping with
the consumer-behavior literature (Hightower et al., 2002; Hines & Mehrabian, 1979;
Wakefield & Blodgett, 1994, 1996; Wakefield & Sloan, 1995). In addition, increased
levels of arousal have been shown to result in the increased prevalence of approach
behaviors, which may include an increase in the length of time spent in an environment,
as well as increased affiliation, verbal and nonverbal communication with those who are
present in the environment (Hines & Mehrabian, 1979; Magnini & Parker, 2009; Booms
& Bitner, 1980).
Finally, these results confirm previous research on atmospheric music’s impact on
consumers. The consumer behavior literature provides insight into the atmospheric music
interpretation results, in particular participants’ distraction scores as revealed in
hypotheses 4.4 and 4.5. The reported overall distracting effect of atmospheric by
participants in the present study appears to be consistent with previous investigations that
have demonstrated the divergent effect atmospheric music may have on an already
stimulating environment (Chebat et al., 1993).

101
This study provides professional sport leagues, particularly the NBA, as well as
individual franchises an opportunity to maximize the potential benefits to be derived from
an optimally constructed servicescape. Experiential service environments are increasingly
important to contemporary sport consumption. The sport product is no longer confined to
the court; it includes all attributes of the servicescape. This reproduced ancillary
experience is an extremely important element of the total sport product that organizations
and marketers can control. Thus, it is imperative organizations understand the elements of
the environment that meaningfully influence the attitudes and perceptions of sport
consumers.
One distinct element of the servicescape that has a tangible impact on consumer
attitudes and behaviors is atmospheric music. If the NBA is to fully embrace the re-
presentation and consumption of an extended sport product, the league and its teams must
systematically evaluate the chosen atmospheric music. Hypotheses 4.4 and 4.5 revealed
that overall participants liked the style of music played, while they also found it to be
congruent with their perceptions of the NBA. The hypotheses however, also revealed that
participants felt the music could be a distraction from the game as well as their ability to
socialize. Therefore, the type or style, as well as level and duration of music should be
considered by teams, since consumers’ perceptions of atmospheric music have been
shown to influence both attitudes and behaviors (e.g., Areni & Kim, 1993; North &
Hargreaves, 2003; North et al., 1999).
Additionally, given that the consumption of live sport has become increasingly a
social experience, it is imperative sport organizations and sport marketers truly
understand this trend and its relationship to attempts at manipulating the servicescape.

102
This study revealed a significant portion of participants felt atmospheric music interfered
or detracted from their ability to converse and interact with those around them. This study
confirms previous findings that when music is perceived as a distracting servicescape
element, the music detracts from the overall experience (Chebat et al., 1993). Since
introduction of aural stimuli in an already visual stimulating environment may work to
distract consumers, it is imperative that a decision to introduce music into the live-sport
consumption experience is given proper consideration. Succinctly, music played during a
sporting event should be congruent with the sport and work to enhance an increasingly
social experience; particularly when there is low involvement with the product (Kotler,
1973).
Finally, the ultimate goal of sport marketers is to create and sustain a loyal base of
fans. Given the unique and transient nature of the core sport product, creating a strong
sport brand, or building brand equity, is the foundation upon which to build a fan-base
resistant to change or unlikely to be swayed by alternative entertainment opportunities.
Since high levels of involvement are requisite to establishing loyalty, the ultimate goal of
the sport marketer, sport marketers should work to control the service environment in
order to increase sport-consumers’ levels of pleasure and arousal, thereby increasing the
prevalence of approach behaviors, which mirror indicators of increased involvement
(e.g., increased duration, frequency and affiliation).
In conclusion, the results of this study serve to reinforce the positive relationship
between involvement and loyalty (Funk, 2008; Funk et al., 2004). In addition, findings
also appear to be support previous research analyzing the influence the servicescape
(Hightower et al., 2002; Wakefield & Blodgett, 1994, 1996; Wakefield & Sloan, 1995),
103
as well as atmospheric music (Jacob, 2006; Milliman, 1986; North & Hargreaves, 1998;
North et al., 2003), has on creating emotional responses amongst consumers, which
ultimately influence behavioral responses (e.g., time allocated, affiliation, repurchase).
As competition within sport for the time, money and emotional investments of
consumers continues to grow, there is a real need to understand fully the variables that
significantly influence sport consumer behavior. Thus, the current study’s findings of the
attitudes and behaviors of a unique segment of sport consumers should be of benefit to
both sport organizations and sport marketers as they package and re-present the live sport
product. Further, given the limited amount of control sport marketers have over the
performance of the core sport product, the service environment is of increased import.
The ability of organizations and marketers to identify and operationalize significant
influencers of consumer attitudes in the servicescape is key to the establishing highly-
involved and loyal fans.
Limitations
While the present study examined the relationship between professional
basketball involvement and attitudinal loyalty to the home team, and examined the
impact of involvement and loyalty on consumer emotional responses and perceptions of
the atmospheric music within the servicescape, it cannot be assumed these findings can
be generalized to other sport-consumers and other sport settings. However, the NBA does
share consumers with other sports and is also presented within venues shared by other
sports; therefore, results could be used to better understand consumers of other sport
products. Further, the variables utilized in the present study were chosen for inclusion
after a thorough review of the consumer attitudes and behavior literature, including

104
treatments of involvement, and loyalty. Consequently, while these variables are not an
exhaustive list, they could potentially be used in subsequent research into sport-
consumers’ attitudes and behaviors.
Future Directions
This study’s design was cross-sectional in nature and served as a limiting factor;
only NBA consumers were participants. Such sport consumers are not the only group that
displays disparate levels of involvement and loyalty to a particular sport or team. Further,
professional basketball, itself, is not the only form of sport produced and consumed by
fans in an experiential environment. Therefore, it would be interesting to extend the
current line of inquiry to attendees of other professional and collegiate sporting events.
Additionally, it would be intriguing to compare and contrast consumer behavioral and
attitudinal variables amongst various professional and collegiate sports as various types
of service environments. Given that the sport industry is consumer driven and the live
sport product is fundamentally a service, continued research into sport-consumer attitudes
and behaviors is essential. Finally, and perhaps most importantly, inquiries focusing on
the impact of distinct elements within the sport servicescape are necessary, since such
research is clearly currently lacking.

105
CHAPTER V
AN INVESTIGATION OF NBA INVOLVEMENT AND LOYALTY TO THE HOME TEAM
Estimates of the economic worth and impact of the sport industry vary, but overall
report continued growth. Meek (1997) estimated that the sport industry in the United
States was a $62 billion business. More recent assessments, place the value of the sport
industry in excess of $152 billion (Broughton, Lee, & Netheny, 1999), with estimates of
annual consumer spending alone exceeding $250 billion (Crompton, 2004). Milano and
Chelladurai (2011), in an investigation of the 2005 Gross Domestic Sport Product
(GDSP), provided similar valuations. GDSP figures place the industry’s value from
$168.469 billion, conservatively, and $207.503 billion using the most liberal criteria
(Milano & Chelladurai, 2011).
With the continued growth of the sport industry, as well as the continued growth
of disparate modes of consumption, the creation of a highly involved and loyal fan base
has increased significance for sport organizations, as the creation and maintenance of
such a foundation is essential for sustainability at the organizational level. Similar to any
other industry and product, sport consumption is the result of choices made by individual
consumers. According to Funk (2008) sport consumer behavior stems from individuals’
desire to seek out a consumption experience in order to satisfy internal needs and obtain
associated benefits. Thus, it is essential for sport organizations and sport marketers to
106
identify and understand significant influencers of consumer attitudes related to the sport
consumption experience, and thus what drives sport consumption behaviors.
The sport industry is also unique, in that the core sport product exhibits many
distinct characteristics that solidify its unique nature. One such defining characteristic is
the simultaneous production and consumption of the core sport product (Mullin, Hardy,
& Sutton, 2007). Additionally, there are numerous constraints that work to limit the
control sport organizations and sport marketers have over the game itself. Sport
organizations, however, do have considerable control over the environment within which
the live sport product is produced and consumed. According to Bitner (1992), the total
experience of the consumer, within an experiential setting, has increased relevance in
understanding resultant attitudes and behaviors. Therefore the environment, within which
the sport product is presented, will also have a significant impact on overall perceptions
and opinions formed about the sport consumption experience, which will inform future
behaviors.
According to Kellner (2002) the presentation of professional basketball best
signifies the space sport holds within contemporary American society. The sport product
is no longer confined to the competition between teams and athletes on the court; it also
includes the venue and environment that surrounds the game. The NBA has embraced the
notion that sport is more than a game and according to (Andrews, 2006). As a result the
production surrounding the presentation of NBA games works to create an experience for
game attendees; thereby adding value in the minds of consumers to the cost of
attendance. Additionally, the creation of an NBA game experience is meant to attract the
largest number of consumers possible. The ultimate goal of such an approach is to
107
maximize profits by appealing to a diverse cross section of the market; thereby beating
out other entertainment and leisure options for the time and money of consumers.
Given this unique nature of sport and the sport product, there is a need for sport
specific consumer behavior research to examine the relationship between involvement
with a specific sport league and loyalty to a specific franchise. Further, there is also a
need for research to examine the experiential sport environment, in order to investigate
how sport organizations may use elements in the space surrounding the presentation of
the sport product to enhance both the experience of spectators, as well as their brand,
thereby influencing consumer attitudes and behaviors which are antecedents of
involvement, and thus by extension loyalty. In an effort to examine these issues, the
following research question was developed: Which explanatory variables cluster
participants into discernible and meaningful groups?
Review of Literature
Sport Involvement
Sport involvement, for the purposes of the present study, is an unobservable state
of interest, arousal or motivation toward an event that is induced by stimuli within a
particular environment that mediates resultant sport consumer behavior (Rothschild,
1984). Further, team sport involvement provides individuals the opportunity to express
their true selves through immersion in an experiential environment (Havitz & Dimanche,
1999). Highly involved consumers of sport seek out and consume a service within an
experiential service setting, similar in many respects to the settings in which consumers
dine, shop, travel, vacation, and participate in experiential leisure activities.

108
The present study employed Funk and James’ (2001) Psychological Continuum
Model (PCM) to measure participants’ level of involvement with the NBA. The PCM
was created specifically to investigate levels of sport fan, or spectator involvement. In
line with previous research the PCM employs a holistic approach to measuring the
complex construct of involvement (Funk, Ridinger & Moorman, 2004; Kerstetter &
Kovich, 1997; Munson & McQuarrie, 1987; Zaichkowsky, 1985). ). The PCM contains
questions created to measure three facets (attraction, sign and centrality), which are then
used to assess an individual’s level of psychological connection (awareness, attraction,
attachment, and allegiance), along a continuum. Thus, as an individual progresses up the
psychological continuum, she displays increased levels of psychological commitment
which can be equated to an increased level of involvement (Funk & James, 2001).
Team Loyalty
Behavioral indicators, such as purchases and frequency of attendance, have
traditionally been relied upon as indicators of loyalty in consumer research as well as in
sport research (Mahony, Madrigal, & Howard, 2000). Loyalty, however, is a
multidimensional construct which includes not only behavioral loyalty, but attitudinal
loyalty as well (Funk & James, 2006; Funk & Pastore, 2000; Mahony et al., 2000; Park &
Kim, 2000; Trail, Anderson, & Fink, 2000). The attitudinal component of loyalty, in the
current study, is presented as an individual’s resistance they display with respect to
changing their level of psychological commitment to the home team (Heere & Dickson,
2008; Pritchard, Havitz & Howard,1999).
Heere and Dickson’s (2008) Attitudinal Loyalty to Team Scale (ALTS) was used
in the present study to measure loyalty to the home team. The ALTS is a unidimensional ,

109
parsimonious 4-item measure of the psychological connection an individual has to a
specific team. ALTS scores represent an individuals’ resistance to change when presented
with alternatives, the team is in a slump, or changes are made to the team’s lineup. Thus,
loyalty can serve as a predictor of future behavioral intentions, regardless of the team’s
performance; which is significant given the unpredictable nature of sport and the sport
product.
Additionally, within the PCM (Funk & James, 2001), as discussed previously,
allegiance is presented as the highest level of involvement. Thus allegiance signifies the
highest level of psychological commitment to an organization. This definition of high
level involvement is the same as the definition of loyalty presented by Heere and Dickson
(2008) used in the creation of the ALTS. Therefore, loyalty can only be achieved after a
consumer progresses up the four stages of the involvement continuum. Thus,
involvement can be understood as being a determinant of loyalty.
Sport Consumers
Even though there is considerable competition and choice for today’s sport
consumer, attendance of sporting events continues to be a significant source of revenue
generation for sport organizations. Within the United States recent estimates place the
amount of money spent on attending sporting events at over $11 billion annually
(Howard & DeSchriver, 2005). Estimates increase to $26.17 billion, when other
elements, such as parking, concessions, and merchandise, are included (King, 2002).
Additionally, according to Trail and James (2008) the population of U.S. sport fans is
estimated to include 200 million individuals.
110
Although attendance figures have historically been encouraging for the NBA,
today’s sport fan has increasingly more options and modes by which to consume sport.
According to a recent Nielsen (2012) report there were over 42,500 hours of live sporting
events broadcast in 2011 on both cable and network television. This was an increase of
5% from the number of broadcast hours dedicated to sports programming in 2010.
Further, sport is also increasingly being consumed via the Internet. In an earlier Nielsen
report (2010), each month in 2009 an average of 81 million people in the US logged-on
to websites dedicated to sport to either follow their favorite team, follow their fantasy
team, or catch-up on the latest sport related news. Further, in October of 2011 alone, over
450 million video streams occurred on various sports websites which were viewed by
more than 35 million people (Nielson, 2012). With the continued growth and increased
competition within the sport industry, as well as the influx and proliferation of various
modes of sport consumption, the creation of a highly involved and loyal base of
spectators has increased significance for sport organizations, as the creation and
maintenance of such a foundation is essential for sustainability at the organizational level.
Today’s sports fan has limitless options and opportunities by which to consume
sport. The ability of sport organizations to attract and activate attendance of live events
still remains vital to an organization’s long term viability and success in the industry
(Funk, Filo, Beaton, & Pritchard, 2009). Given the availability of alternatives and
substitutes, motives for the consumption of live sport have changed. That is, the
consumption and presentation of live sport is no longer solely about the game being
played.
111
The Servicescape and Emotional Responses
According to Mehrabian and Russell (1974; 1976) all approach-avoidance
behaviors are related to the two emotional states of arousal and pleasure. Within any
given environment, approach-avoidance behaviors are related to resultant levels of
pleasure-displeasure felt by consumers as a result of stimuli in the environment.
Increased levels of pleasure result in approach behaviors that are directly correlated to
increased levels of arousal (Hines & Mehrabian, 1979). Further, as pleasure decreases,
approach behaviors are inversely related to arousal. Emotional responses to the
environment occur regardless of the type of stimuli that is present in the environment or
how the stimuli are introduced. Thus, emotional responses are a result of a consumers’
reaction to the environment as a whole; that is taking into account all of the various
elements present in a given setting (Mehrabian & Russell, 1974, 1976).
The consumption of live sporting events takes place within an experiential service
environment referred to as the servicescape (Bitner, 1992). Sport organizations are in
control of the atmospheric music being played within the servicescape, and therefore can
use the music to create meaningful memories and associations with the consumptive
experience and the sport brand in the minds’ of consumers. Atmospheric music, provides
aural cues to consumers which have been shown to influence the amount of time spent in
various service settings (Milliman, 1982; 1986), as well as the type and amount of
purchase (Guégen et al., 2008; Jacob, 2006; McKendrick, 1999). Additionally, the
insertion of atmospheric music has been to be most effective when it is used to enhance
the experience and not compete for consumers’ attention (Hecker, 1984; Macklin, 1988).
Therefore, perceptions of music congruency, distraction and liking were investigated.

112
Behavioral purchase intentions and actual purchasing behaviors have been used in
past research as an indicator of both involvement and loyalty (e.g., Gladden & Milne,
1999; Howard & Crompton, 1995; Mullin et al., 2007). According to Day (1969) the
repeated purchase of a product does not indicate loyalty unless the consumer is highly
involved with the product, thus displaying a psychological commitment to the brand
through loyalty. Given that high levels of involvement are precursors of loyalty, a
multidimensional concept that includes both behavioral and attitudinal components, it is
necessary to fully understand both sport consumer involvement and loyalty in the present
context. Additionally, participants’ purchasing and attendance behaviors were
investigated to better understand the degree to which they are correlated to emotional
responses elicited by the servicescape, as well as the interpretation of the atmospheric
music within the consumptive sport environment.
Consumer behavior research has provided a framework by which to gain a deeper
understanding of why people consume products and services. The servicescape, and the
atmoshpehric elements contained within it, have been shown to directly impact consumer
attitudes and behaviors (e.g. Chebat et al., 1993; Guégen et al, 2008; Hecker, 1984;
Kotler, 1973; North et al., 1999), including satisfaction ratings (Wakefiled & Blodgett,
1996), experiences of positive and congruent affect (Jacob, 2006; North, Shilcock &
Hargreaves, 2003), and an increased amount of time spent in the service environment
(Milliman, 1986). Further, consumer involvement and loyalty have also been shown to
directly and positively impact both repurchase and attendance behaviors, as well as
intentions (Hightower et al, 2002; Jacob, 2006; Rein et al., 2006; Wakefield & Blodgett,
1994; Wakefield & Sloan, 1995). Despite the depth of research consumer behavior
113
research, as well as the prominence of the sport industry, there is limited research
investigating the influence of the experiential sport-servicescape to levels of involvement
and loyalty.
Method
Sample
The target population for the present study was individual men’s professional
basketball game attendees over the age of 18. A sampling frame, utilizing stratified
cluster sampling, was used in the present study in order to establish the group of target
population members who would constitute potential participants in the study. Restriction
of the target population was necessary, and appropriate, due to both practical (i.e.,
significant average attendance size) and financial (i.e., budget) constraints associated
with the present study (Biemer & Lyberg, 2003). Clusters for the present study were
constructed utilizing randomly selected seating-sections, which were already present and
easily identifiable, within the selected data collections sites.
Participants were randomly selected from attendees of two professional basketball
games that were played in the southeastern region of the United States during the 2010-
2011 regular season. The venues selected for the study represented the arenas of two
eastern conference teams from among the 30-team league. Average attendance figures for
the two teams’ home games during the 2010-2011 season were 16,791 and 15,846,
respectively (ESPN, 2011).
Instrumentation
The survey used on the present study was comprised of seven distinct sections
with a total of 42 items. The first section consisted of Funk and James’ (2001)

114
Psychological Continuum Model (PCM) 9-item scale, which was used to measure
participants’ levels of involvement with professional basketball. Items were reworded
from the original instrument to reflect the distinct purpose and focus of this study.
Involvement facet scores were used to determine participants’ associated level of
involvement along the psychological connection continuum (Funk & James, 2001).
Secondly, Heere and Dickson’s (2008) 4-item Attitudinal Loyalty to Team Scale (ALTS)
was used to measure attitudinal loyalty to the home team. Participants’ total score on all
items was used to determine their respective level of attitudinal loyalty to a specific team.
Additionally, in order to gain a holistic understanding of distinct characteristics that may
predict professional basketball involvement and ultimately loyalty, consumer attitudes,
purchase intentions, purchase behaviors, and demographic variables were included.
Consumer attitude variables were selected based on an extensive review of the
consumer behavior literature. Thus, in addition to the PCM and ALTS scales discussed
above, Mehrabian and Russell’s (1974) Semantic Differential Measures of Emotional
Response to Environments was used to measure levels of arousal and pleasure
experienced by participants, as induced by stimuli in the service environment which have
been shown to influence consumer attitudes and behaviors (Kotler, 1973). Participants’
perceptions of the atmospheric music played during the professional basketball game
were also measured based on responses to four questions included to gauge perceived
levels of congruency, distraction, and liking of the music.
There has been a considerable amount of research that has shown the distinct and
real effect atmospheric elements within the service environment can have on consumer
purchasing behaviors (e.g., Alpert & Alpert, 1990; Areni & Kim, 1993; Morrin &

115
Chebat, 2005; North et al., 2003). Therefore, increases in actual purchasing behaviors
from intentions may be triggered by stimuli within the servicescape. Additionally, given
the moderating influence involvement has on the influence of stimuli in the experiential
environment, this information will help create a better understanding of the
environmental factors and individual characteristics that affect participants’ purchase
intentions and actual purchasing behaviors. Questions were thus included in the survey
instrument to measure the total amount of money participants intended to spend during
the game they were attending as well as the total amount of money they actually spent
while in attendance. The total amount of money participants’ both intended to spend and
actually spent on alcoholic beverages was measured separate from the total amount of
money spent on other types of products (i.e., merchandise and concessions) while in
attendance of the event.
Finally, demographic variables were included in the present study in order to gain
a better understanding of the characteristics of professional basketball attendees included
in the sample. Participants were asked to provide information regarding their age, gender,
educational background, occupation, income level, marital status and ethnicity.
Participants were also asked to reveal how many games of the home team, on average,
they attend during a typical professional basketball season.
Procedures and Data Analysis
Surveys were distributed and completed by participants while in-attendance of
one of two professional basketball games during the 2010-2011 NBA-season. Surveys,
along with a writing instrument, were distributed to potential participants seated in
randomly selected sections, based on the stratified cluster sampling procedure described

116
in the preceding section. The researcher, along with a supporting research team, was
onsite to distribute, administer, and collect surveys. Access to the research sites was
gained by seeking and gaining approval of each arena’s respective professional basketball
organization. Participants were instructed to leave their survey in their cup holder upon
completion. Instructions on the survey also advised participants of the option of returning
completed surveys to designated guest services locations within the arena. Surveys were
ultimately collected at the end of the game, after attendees had left the arena, from both
locales (i.e., cup holders in selected sections and guest services).
A cluster analysis was used to reveal whether or not discernible groups of
participants existed based upon the homogeneity of scores on a set of specified variables.
The objective of cluster analysis is to identify groups within a given set of data that might
be generalizable to the target population (Kachigan, 1991). Ward’s (1963) method of
hierarchical agglomeration was utilized. This method has been shown to be a preferred
method in the social sciences (Borgen & Barnett, 1987; Milligan, 1981), as it produces
clusters that are spherical and roughly the same size; given that it is designed to
maximize the minimum variance within clusters by combining clusters for which the
increase in the total within-cluster variation is the smallest (Lorr, 1983). For practical
purposes, multiple cluster solutions were analyzed, however only solutions with 2 to 8
clusters were considered.
Results
A total of 800 surveys were distributed during two separate professional
basketball games, with 400 surveys disseminated during each game. Four hundred and
twenty-five completed surveys comprised the final sample representing a 53% rate of

117
response. One hundred and ninety-four (46%) completed surveys were utilized from the
first game and 231 (54%) from the second game, representing a 49% and 58% usable rate
of response respectively. Only surveys that were filled out completely were included in
the final sample. This reduced the overall response rate from 62% (56% and 68%,
respectively) to the final rate of 53%, which was just above the conservative estimate of
50% assumed for the present study.
Forty-seven percent (n = 199) of respondents were seated in the lower bowl, while
53% (n = 226) had seats located in the upper bowl. The average participant in this study
was a white (57%) male (61%) with either a bachelor’s (33%) or graduate (24%) degree.
Further, the average participant was married (51%) and earned more than $100,000
(34%) annually. For a more in depth analysis of participants’ demographic information
see Table 3.
The average number of professional basketball games attended by participants in
was 8 games, with attendance figures ranging from 0-45 games in a typical season.
Thirty- three percent (n = 139) of participants typically attend 1 game per season.
Seventy-seven percent (n = 327) of respondents reported low levels of NBA involvement,
with 42% (n = 176) also displayed low or a relative absence of attitudinal loyalty to the
home team. Additionally, 18% (n = 77) of participants reported medium and high levels
of attitudinal loyalty. Prior to running statistical analyses to address both research
questions, the reliability and internal consistency of the involvement, loyalty and
emotional responses to the environment scales were also tested.
Cronbach’s alpha reliability analyses were first performed to examine the
reliability of scores on the primary scales contained in the research instrument. Results of

118
the estimate of reliability for the PCM revealed scores, utilizing the present sample, on
the scale were internally consistent, α = .86. Further, the Cronbach’s alpha reliability
estimate would decrease if any of the nine items were removed from the scale.
Cronbach’s alpha was also examined for the ALTS; results revealed that reported ALTS
scores were internally consistent, α = .88. Lastly, analysis of the Emotional Response to
Environments scale also revealed that, for the present sample, reported arousal and
pleasure scores were internally consistent (α = .86).
Table 8
Cluster Means, Standard Deviations and Z-scores
Cluster NBA
(N = 199) Model
(N = 123) Loyal
(N = 98) Capital (N = 5)
Construct M SD Zmean M SD Zmean M SD Zmean M SD Zmean
Involvement
Pleasure 16.09 3.15 0.29 11.98 4.89 -0.71 16.13 2.91 0.30 15.00 .000 0.02
Centrality 7.20 3.67 -.01 5.09 3.12 -0.51 9.99 4.82 0.66 7.00 .000 -0.05
Sign 10.77 3.83 0.16 7.85 4.21 -0.53 11.67 4.03 0.37 9.00 .000 -0.26
Loyalty 14.92 6.24 0.19 17.21 7.40 -0.50 17.26 5.30 0.33 5.00 .000 -1.58
Em.Response
Arousal 1.45 6.49 0.27 4.90 5.60 -0.58 6.22 4.58 0.19 2.00 .000 -0.09
Pleasure 4.95 7.20 0.27 6.95 5.91 -.039 6.30 5.02 -0.07 8.00 .000 0.36
Next, a cluster analysis using Ward’s (1963) method was conducted. Each
participant responded to items contained in the survey instrument which included
questions related to demographics (i.e., gender, ethnicity, age, occupation, marital status,
education, income, frequency of attendance, section type), consumer attitudes (i.e.,
loyalty, involvement, atmospheric music), emotional responses to the environment (i.e.,
arousal, pleasure), and purchase intentions and behaviors (i.e., concessions and alcohol).

119
The hierarchical cluster analysis utilizing Ward’s method produced four discernible and
meaningful clusters. Means and standard deviations for essential survey items for the
four-cluster solution are presented in Table 8.
Four-Cluster Solution
The first cluster, or NBA cluster, was characterized by participants’ with low
levels of involvement with the NBA and low to median levels of reported loyalty
(M = 14.92, SD = 6.24) to the home team who attended five games in a typical season. In
addition, cluster participants did not intend to, nor did they actually, spend a significant
amount of money while in attendance, including both the purchase of alcoholic beverages
and other concession items as displayed in Table 9. Members also reported median levels
of pleasure (M = 4.95, SD = 7.20) and low levels of arousal (M = 1.45, SD = 6.49). The
demographic profile of the NBA cluster, as presented in Table 10, seems to most closely
resemble to demographic make-up of the typical NBA fan reported in previous research
(e.g., Schnietz et al., 2005).
Table 9
Cluster Purchase Intentions and Behaviors
Cluster
NBA (N = 199)
Model (N = 123)
Loyal (N = 98)
Capital (N = 5)
Reported Amt. ($) M SD M SD M SD M SD
Intent Alcohol $.59 $2.78 $10.98 $15.44 $20.35 $21.59 $70.00 $0.00
Spent Alcohol $.67 $2.60 $13.91 $18.46 $14.22 $10.91 $40.00 $1.43
Intent Concessions $3.38 $5.41 $16.05 $12.06 $50.87 $11.24 $120.0 $0.00
Spent Concessions $3.67 $6.95 $18.59 $16.48 $36.65 $15.13 $235.0 $5.35
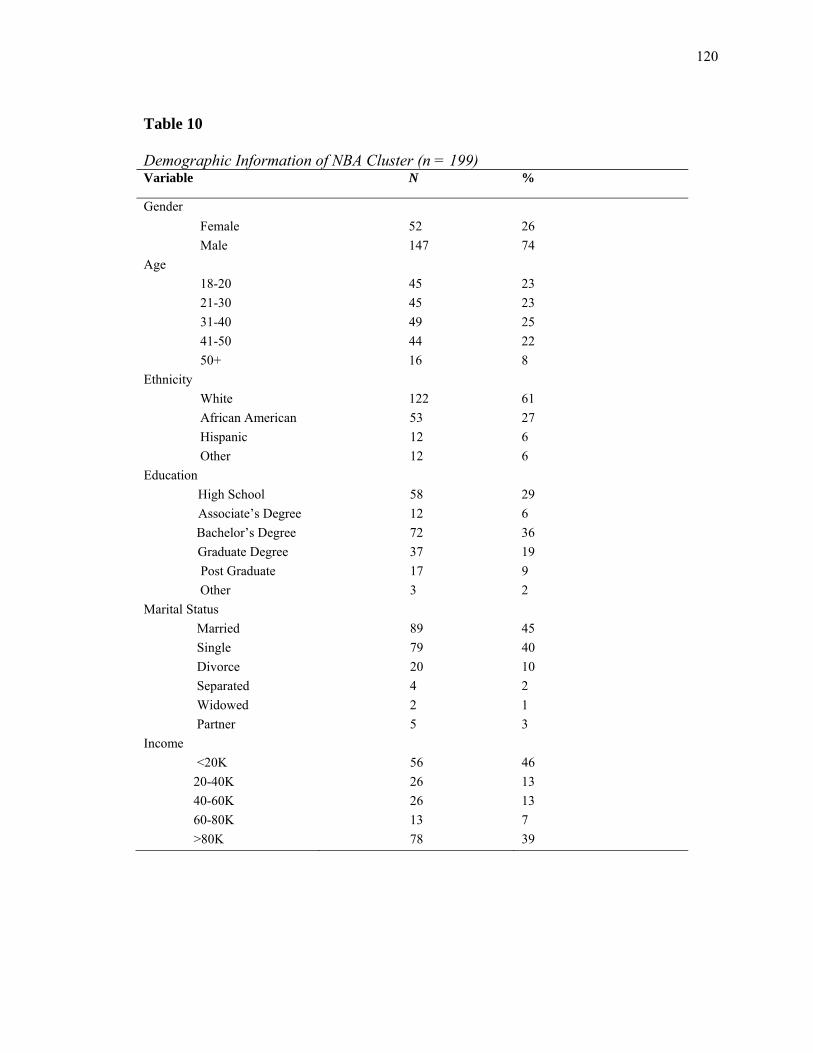
120
Table 10
Demographic Information of NBA Cluster (n = 199) Variable N %
Gender
Female 52 26
Male 147 74
Age
18-20 45 23
21-30 45 23
31-40 49 25
41-50 44 22
50+ 16 8
Ethnicity
White 122 61
African American 53 27
Hispanic 12 6
Other 12 6
Education
High School 58 29
Associate’s Degree 12 6
Bachelor’s Degree 72 36
Graduate Degree 37 19
Post Graduate 17 9
Other 3 2
Marital Status
Married 89 45
Single 79 40
Divorce 20 10
Separated 4 2
Widowed 2 1
Partner 5 3
Income
<20K 56 46
20-40K 26 13
40-60K 26 13
60-80K 13 7
>80K 78 39

121
Table 11
Select Demographic Information of Model Cluster (n = 123) Variable N %
Gender
Female 60 49
Male 63 51
Age
18-20 13 11
21-30 34 28
31-40 49 40
41-50 44 36
50+ 16 13
Ethnicity
White 71 58
African American 50 41
Hispanic 1 <1
Other 1 <1
Education
High School 18 15
Associate’s Degree 15 12
Bachelor’s Degree 39 32
Graduate Degree 29 24
Post Graduate 19 15
Other 3 2
Marital Status
Married 66 54
Single 38 31
Divorce 7 6
Separated 4 3
Widowed 1 <1
Partner 7 6
Income
<20K 14 11
20-40K 20 16
40-60K 21 17
60-80K 14 11
>80K 54 45
The second cluster, or Model group, included participants with high levels of
involvement and elevated loyalty (M = 17.2, SD = 7.40). Model group members also
122
spent roughly $3.oo more than intended on both alcoholic beverages and other
concession items, as displayed in Table 9. Additionally, members of the Model cluster
displayed elevated levels of both pleasure (M = 6.95, SD = 5.91) and arousal (M = 4.90,
SD = 5.60). Group members also attended five games in a typical season. Detailed
demographic information related to the Model cluster can be found in Table 11.
The results further distinguished the third group, or Loyal group, based on age
(40+), ethnicity (African American), education (college graduate or beyond), and marital
status (married). The Loyal group also predominantly included participants with high
levels of NBA involvement, who also had the highest mean levels of attitudinal loyalty to
the home team (M = 17.26, SD = 5.30; See Table 8). In addition, cluster members came
into the event intending to spend roughly $70 on both alcoholic beverages and other
concession items, and ultimately spent more on alcoholic beverages (M = $14.22) and
other concession items ($36.65) than both NBA and Model cluster members (See Table
9).
The fourth (Capital) group (n = 5), though small in numbers, was the only group
that was discernible, from all groups, based on distinct demographic variables (i.e.,
marital status, ethnicity, gender, age and education), with 100% of the participants
included in the group being classified as a separated white-male, between the age of
thirty and thirty nine, with a post-graduate education. Additionally, members of this last
group had high levels of NBA involvement, yet extremely low levels of loyalty
(M = 5.00, SD = .000) to the home team and only attended one game during a typical
season. Participants of this cluster displayed elevated and median levels of pleasure
(M = 8.00, SD = .000) and arousal (M = 2.00, SD = .000) respectively, and outspent, on
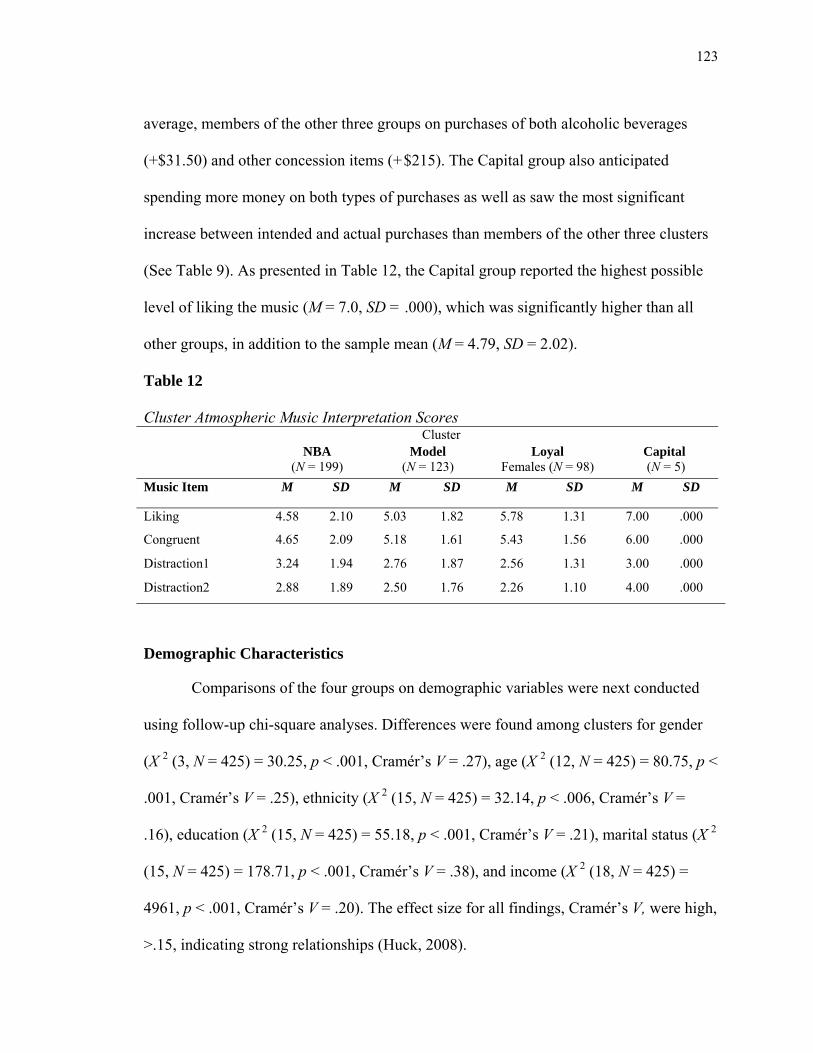
123
average, members of the other three groups on purchases of both alcoholic beverages
(+$31.50) and other concession items (+$215). The Capital group also anticipated
spending more money on both types of purchases as well as saw the most significant
increase between intended and actual purchases than members of the other three clusters
(See Table 9). As presented in Table 12, the Capital group reported the highest possible
level of liking the music (M = 7.0, SD = .000), which was significantly higher than all
other groups, in addition to the sample mean (M = 4.79, SD = 2.02).
Table 12
Cluster Atmospheric Music Interpretation Scores Cluster
NBA (N = 199)
Model (N = 123)
Loyal Females (N = 98)
Capital (N = 5)
Music Item M SD M SD M SD M SD
Liking 4.58 2.10 5.03 1.82 5.78 1.31 7.00 .000
Congruent 4.65 2.09 5.18 1.61 5.43 1.56 6.00 .000
Distraction1 3.24 1.94 2.76 1.87 2.56 1.31 3.00 .000
Distraction2 2.88 1.89 2.50 1.76 2.26 1.10 4.00 .000
Demographic Characteristics
Comparisons of the four groups on demographic variables were next conducted
using follow-up chi-square analyses. Differences were found among clusters for gender
(Χ 2 (3, N = 425) = 30.25, p < .001, Cramér’s V = .27), age (Χ 2 (12, N = 425) = 80.75, p <
.001, Cramér’s V = .25), ethnicity (Χ 2 (15, N = 425) = 32.14, p < .006, Cramér’s V =
.16), education (Χ 2 (15, N = 425) = 55.18, p < .001, Cramér’s V = .21), marital status (Χ 2
(15, N = 425) = 178.71, p < .001, Cramér’s V = .38), and income (Χ 2 (18, N = 425) =
4961, p < .001, Cramér’s V = .20). The effect size for all findings, Cramér’s V, were high,
>.15, indicating strong relationships (Huck, 2008).

124
Involvement and Loyalty Measures
The four clusters were compared on involvement and loyalty group membership
as determined by responses to PCM and ALTS scale items. One-way ANOVA and chi-
square analyses were conducted to determine if significant differences existed between
clusters. Chi-square analysis revealed significant differences among clusters on level
(high v. low) of professional basketball involvement (Χ 2 (3, N = 425) = 49.99, p < .001).
Further, one-way ANOVA analyses revealed significant differences between clusters on
the three involvement facets of pleasure (F (3, 420) = 36.25, p < .001, partial η² = .206),
centrality (F (3, 420) = 29.97, p < .001, partial η² = .176), and sign (F (3, 420) = 20.99,
p < .001, partial η² = .127). Tukey post-hoc comparisons of the four clusters indicated the
Model group (M = 3.99, 95% CI [3.70, 4.29]) had significantly lower pleasure-facet
ratings than both the NBA (M = 5.36, 95% CI [5.21, 5.51]) and the Loyal groups
(M = 5.38, 95% CI [5.18, 5.57]), p < .001). The Model group also had significantly lower
centrality (M = 1.70, 95% CI [1.51, 1.88]) and sign (M = 2.61, 95% CI [2.36, 2.86]) facet
scores than the Loyal group (M = 3.33, 95% CI [3.01, 3.65]; M = 3.89, 95% CI [3.62,
4.16]), p < .001). Comparisons between the Capital group and the other three groups were
not statistically significant, at p < .05, for the three involvement facets of pleasure
(M = 5.00, 95% CI [5.00, 5.00]), centrality (M = 2.33, 95% CI [2.33, 2.35]) and sign
(M = 3.00, 95% CI [3.00, 3.50]).
One-way ANOVA also revealed significant differences among clusters on level of
attitudinal loyalty to the home team (F (3, 420) = 23.39, p < .001, partial η² = .143).
Tukey post-hoc loyalty comparisons between the Model (M = 12.19, 95% CI [11.18,
13.20]) and Capital (M = 5.00, 95% CI [5.00, 5.00]) groups were not significantly
125
different at p < .05. Post-hoc comparisons of participant loyalty between the NBA
(M = 16.74, 95% CI [15.86, 17.63]) and Loyal (M = 17.67, 95% CI [16.34, 19.00])
groups also revealed no significant differences at p < .05. Significant differences between
the NBA group and the Model and Capital groups were revealed (p < .001). Further, post-
hoc comparisons showed significant differences between the Model group and both the
NBA and Loyal groups (p < .001) in addition to significant differences between the Loyal
and the Capital groups (p < .001).
Emotional Responses and Music Measures
Bonferroni-adjusted one-way ANOVAs were used to further compare clusters on
individual emotion and music constructs. Cluster membership was shown to have a
statistically significant effect on the two emotional responses of arousal, F (3, 420) =
22.51, p < .025, partial η² = .139, and pleasure, F (3, 420) = 12.14, p < .025, partial η² =
.08. Clusters also significantly differed on levels of music liking (F (3, 420) = 55.05, p <
.0125, partial η² = .282), congruency (F (3, 420) = 16.65, p < .0125, partial η² = .106),
distraction from interaction (F (3, 420) = 19.63, p < .0125, partial η² = .123), and
distraction from the game (F (3, 420) = 22.55, p < .0125, partial η² = .139). Mean scores
for music liking were statistically different between the Model group and all other
clusters groups (p < .0125). Liking scores also differed significantly between the NBA
and the Loyal groups (p < .0125). Additionally, the Model and Capital groups also rated
the music as a distraction from the game at significantly higher levels than the other two
groups (p < .0125). The Model group also had the highest rating of the music as a
distraction from interacting with those around them.

126
Discussion
Results of the present study appear to support previous research, administered in
various service environments, that has investigated the relationship between involvement
and loyalty. That is, the present outcome with respect to this relationship indicates a
positive relationship between an individual’s level of involvement and psychological
commitment, or loyalty. The primary attribute of highly involved individuals is the
presence of highly developed levels of psychological commitment, or resistance to
change. This prime attribute has been identified in the literature as allegiance (Funk &
James, 2001), or the highest level of involvement. Further, the definitions of allegiance
and high-involvement are synonymous with the definition of loyalty (Heere & Dickson,
2008; Pritchard, Havitz, & Howard, 1999), which this study’s results support.
In addition, the cluster analysis revealed four discernible participant groups. A
discussion of each group will provide a better understanding of participants’ attitudes and
behaviors, and thus NBA consumers. The NBA group most closely resembled the typical
NBA fan, as identified in previous research (Schnietz et al., 2005), based on select
demographic variables. Interestingly, members of this group displayed the lowest levels
of pleasure and arousal amongst all four groups, as determined by mean scores on the
Emotional Responses to Environment Scale (Mehrabian & Russell, 1974). Increased
levels of arousal have been shown to result in the increased prevalence of approach
behaviors, which may include an increase in the length of time spent in an environment,
increased affiliation, contact, and both verbal and nonverbal communication with those
who are present in the environment (Hines & Mehrabian, 1979; Magnini & Parker, 2009;
Booms & Bitner, 1980; Wakefield & Blodgett, 1996). Conversely, decreased levels of

127
arousal may result in avoidance behaviors, which are characterized by decreased time
spent in the environment, as well as evading contact and communication, both verbal and
nonverbal, with others in the environment (Donovan & Rossiter, 1982).
The relatively low levels of pleasure and arousal experienced by participants in
the NBA group, seems to help reconcile members also being classified as low-involved,
as well as reporting low attitudinal loyalty to the home team. Further, members of the
NBA group both intended to and spent the least amount of money on concessions and
alcoholic beverages of all groups, which is indicative of avoidance behaviors. The results
therefore seem to suggest the typical NBA fan, as identified in this study, was not fully-
engaged while in attendance of the event, experiencing low levels of arousal and
engaging in avoidance behaviors, such as decreased contact with the product and the
amount of money spent (Mehrabian & Russell, 1976; Milliman, 1986; Wakefield &
Blodgett, 1996).
The second, or Model cluster, contained participants with high levels of NBA
involvement as well as loyalty to the home team, and attending 5 games during a typical
season. Additionally, Loyal group members engaged in further approach behaviors based
on reported purchasing behavior. This cluster’s members reported a slight increase in the
amount of money spent compared to that which they intended to spend. This increase in
money spent is a prime example of approach behaviors, stemming from heightened levels
of arousal and pleasure, which have been consistently reported in the consumer behavior
literature (e.g., Guégen, et al., 2008; Jacob, 2006; McKendrick, 1999). It would thus be
advantageous for organizations and marketers to continue to meet the wants, needs and
desires of Loyal cluster consumers, as they display both attitudinal and behavioral loyalty
128
to the home team, which are essential for the sustainability of sport organizations in an
increasingly fragmented and competitive marketplace (Amis, Slack, & Barrett, 1999;
Funk et al., 2009)
Similar to the Model group, the Loyal cluster also consisted primarily of highly-
educated professionals who were loyal to the home team. This result is in keeping with
the arousal-pleasure hypothesis (Mehrabian & Russell, 1976), given that both cluster
participants displayed elevated levels of both arousal and pleasure. Loyalty was further
displayed by Loyal group members in their purchasing behaviors during the event, as
group members spent roughly $50 while in attendance of an NBA game, which
interestingly was roughly $20 less than members anticipated they would spend while at
the event. In addition, participants in this cluster attended 19 games in a typical NBA
season, further evidence of their heightened behavioral loyalty to the home team. The
results further suggest, consumers who meet the Loyal-clusters’ profile, if identified,
could provide organizations and marketers with unique and profitable purchasing
potential if provided attendance opportunities that better meet their distinct needs. For
example, club seats with exclusive access to spaces designed to increase the sociability of
the attendance experience (e.g., bar or restaurant style seating areas) without detracting
from the ability to watch the game being played.
The fourth group, or Capital group, though significantly small in number (n = 5),
did display distinct characteristics that warrant discussion. First, all five members
displayed matching demographic characteristics on all measures exclusive of occupation.
In addition to demographic variables, all members were divergent from the other groups
in the considerable amount money members intended to spend as well as actually spent
129
while in attendance on both concession items and alcoholic beverages. This finding, in
particular, seems to be in-line with previous research, as increased levels of pleasure and
arousal have been shows to have a direct influence on the amount of money spent while
in a service environment (Hightower et al., 2002). Further, Capital group members also
reported significantly increased levels of liking the music, which has also been shown to
impact purchasing behaviors, such as an increase in the amount of money spent. This
may help to reconcile both the sizeable amount of money spent while in attendance,
which represented a significant increase from the amount of money members anticipated
that they would spend.
The Capital group also displayed highly involved tendencies toward the NBA.
Interestingly, as a group, they had the lowest median levels of loyalty to the home team.
Given the high level of education (post-graduate degree) and disposable income
(>$100,000 annually), it would be advantageous for organizations to identify these
consumers and work to increase consumption opportunities that meet their needs. The
group reported attending only one game on average per season, therefore the organization
seems to not be capitalizing on the opportunities to incite repeat purchase behaviors,
especially given the significant amount of money (M = $275) spent while in attendance.
In conclusion, this study confirmed the findings of previous research studies that
investigated the link between involvement and loyalty. Results worked first to support the
positive relationship between involvement and loyalty (Funk, 2008; Funk et al., 2004). In
addition, the findings also provided a framework by which to gain a deeper understanding
of the attitudes and behaviors of the sport consumer in a keenly stimulating environment.
The exploratory analysis used to address the second research question also afforded a

130
better understanding of the average NBA consumer and further their wants, needs, and
desires. This information could be of great import to sport organizations and marketers as
they work to increase levels of involvement, and thus loyalty, amongst current and future
consumers.
Limitations and Future Directions
The data analysis techniques and results are overall descriptive in nature and
therefore, the present study is by no means an all-inclusive treatment of the variables of
interest. Involvement and loyalty are also remarkably complex constructs. As such, they
are constantly evolving within the literature as new studies are constructed and data are
uncovered to explain facets of each respective construct. Further, due to time, cost, and
accessibility constraints, only one scale was utilized to measure participants’ level of
attitudinal loyalty and involvement respectively. Given the complex nature of these
variable discussed above, there are alternative scales exist that have been shown to be
reliable and valid measures of each respective construct.
This study also employed cluster sampling techniques to create a sampling frame
by which to generate parameter estimates to represent the target population of interest.
This method was used due to time, cost, and logistical constraints. As such, the general
increase in sampling error that is associated with cluster sampling (Som, 1973) must be
taken into consideration when interpreting and generalizing the present research findings.
An intriguing next step may be to employ alternative measures of involvement
and loyalty. Additionally, alternative research methods, such as qualitative methods of
data collection, could also be used to provide a more in-depth understanding of
participant attitudes and behaviors. Further, this study was limited to an investigation of

131
professional basketball participants. Expanding the target population to include other
sport consumers (e.g., professional hockey, collegiate sports) may help to provide a
deeper understanding of involvement and loyalty amongst sport consumers.

132
REFERENCES
Aaker, D. (1991). Managing brand equity. New York, NY : Free Press.
Alpert, J. I., & Alpert, M. I. (1990). Music influences on mood and purchase intentions.
Psychology and Marketing, 7(2), 109-133.
Amis, J., Slack, T., & Berrett, T. (1999). Sport sponsorships as distinctive competence.
European Journal of Marketing, 33, 250-272.
Andrews, D. L. (ed.) (2001). Michael Jordan Inc.: Corporate sport, media culture, and
late modern America. Albany, NY: SUNY Press.
Andrews, D. L. (2006). Sport-commerce-culture: Essays on sport in late capitalist
America. New York, NY: Peter Lang.
Areni, C. S., & Kim, D. (1993). The influence of background music on shopping
behaviour: Classical versus top-forty music in a wine store. Advances in
Consumer Research, 20, 336-340.
Aubert-Gamet, V., & Cova, B. (1999). Servicescapes: From modern non-places to
postmodern common places. Journal of Business Research, 44, 37-45.
Backman, S. J., & Crompton, J. L. (1991). The usefulness of selected variables for
predicting activity loyalty. Leisure Sciences, 13, 205-220.
Bagozzi, R. P., Gopinath, M., & Nyer, P. U. (1999). The role of emotions in marketing.
Journal of the Academy of Marketing Science, 27(2), 184-206.

133
Baker, J. (1998). Examining the informational value of store environments. In Sherry, J.
F. Jr. (Ed.), Servicescapes: The concept of place in contemporary markets.
Chicago, IL: NTC Business Books.
Bauer, H. H., Stokburger-Sauer, N. E., & Exler, S. (2008). Brand image and fan loyalty
in professional team sport: A refined model and empirical assessment. Journal of
Sport Management, 22, 205-226.
Beaton, A. A., & Funk, D. C. (2008). An evaluation of theoretical frameworks for
studying physically active leisure. Leisure Sciences, 30, 53-70.
Biemer, P.P., & Lyberg, L.E. (2003). Introduction to survey quality. Hoboken, NJ:
Wiley-Interscience.
Bitner, M. J. (1992, April). Servicescapes: The impact of physical surroundings on
customers and employees. Journal of Marketing, 56, 57-71.
Booms, B. H., & Bitner, M. J. (1980). Marketing services by managing the environment.
Cornell Restaurant Administration Quarterly, 23, 35-39.
Borgen, F. H., & Barnett, D. C. (1987). Applying cluster analyses in counseling
psychology research. Journal of Counseling Psychology, 34, 456-468.
Borling, J. E. (1981). The effects of sedative music on alpha rhythms and focused
attention in high-creative and low-creative subjects. Journal of Music Therapy,
28, 101-108.
Brooks. C. (1994). Sports marketing: Competitive business strategies for sports. Upper
Saddle River, NJ: Prentice Hall.
Broughton, B., Lee, J., & Netheny, R. (1999, December 20-26). The question: How big is
the U.S. sports industry? Street & Smith’s SportsBusiness Journal, 23-29.

134
Chaudhuri, A. (2006). Emotion and reason in consumer behavior. Oxford, UK: Elsevier.
Chebat, J-C., Gelinas-Chebat, C., & Filiatrault, P. (1993). Interactive effects of musical
and visual cues on time perception: An application to waiting lines in banks.
Perceptual and Motor Skills, 77, 995-1020.
Chebat, J-C., Vaillant, D., & Gelinas-Chebat, C. (2000). Does background music in a
store enhance salespersons’ persuasiveness? Perceptual and Motor Skills, 91,
405-424.
Cova, B. (1997). Community and consumption: Towards a definition of the linking value
of products or services. European Journal of Marketing, 31, 297-316.
Creswell, J. W. (1998). Qualitative inquiry and research design: Choosing among five
traditions. Thousand Oaks, CA: Sage Publications.
Crompton, J. L. (2004). Conceptualization and alternate operationalizations of the
measurement of sponsorship effectiveness in sport. Leisure Studies, 23(3), 267-
281.
Daniel, W. W., & Terrel, J. C. (1992). Business statistics for management and economics.
Boston, MA: Houghton Mifflin.
Day, G. S. (1969). A two dimensional concept of brand loyalty. Journal of Advertising
Research, 9, 29-35.
Donovan, R. J., & Rossiter, J. R. (1982). Store atmosphere: An environmental
psychology approach. Journal of Retailing, 58, 34-57.
ESPN. (2009). Attendance reports, 2009. Retrieved February 4, 2010 from
http://espn.go.com/nba/attendance/_/year/2009
Everitt, B. J. (1980). Cluster Analysis, 2nd Ed. New York, NY: Halsted Press.

135
Falk, L. K., Sockel, H., & Warren, H. (2005). Reactions to integrated store environments:
The atmospheric matrix model in the virtual world. Journal of Website
Promotion, 1(4), 85-108.
Filo, K., Funk, D. C., & O’Brien, D. (2009). The meaning behind attachment: Exploring
camaraderie, cause, and competency at a charity sort event. Journal of Sport
Management, 23(3), 361-387.
Funk, D. C. (2008). Consumer behaviour in sport and events. Oxford, UK: Elsevier.
Funk, D. C., Filo, K., Beaton, A. A., & Pritchard, M. (2009). Measuring the motives of
sport event attendance: Bridging the academic-practitioner divide to
understanding behavior. Sport Marketing Quarterly, 18(3), 126-138.
Funk, D. C., & James, J. (2001). The Psychological Continuum Model: A conceptual
framework for understanding an individual’s psychological connection to sport.
Sport Management Review, 4, 119-150.
Funk, D. C., & James, J. (2006). Consumer loyalty: The meaning of attachment in the
development of sport team allegiance. Journal of Sport Management, 20, 189-
217.
Funk, D. C., & Pastore, D. L. (2000). Equating attitudes to allegiance: The usefulness of
selected attitudinal information in segmenting loyalty to professional sports
teams. Sport Marketing Quarterly, 9, 175-184.
Funk, D. C., Ridinger, L. L., Moorman, A. M. (2004). Exploring origins of involvement:
Understanding the relationship between consumer motives and involvement with
professional sport teams. Leisure Studies, 26, 35-61.

136
Funk, D. C., Toohey, T., & Bruun, T. (2007). International sport event participation:
Prior sport involvement, destination image, and travel motives. European Sport
Management Quarterly, 7, 227-248.
Gladden, J. M., & Funk, D. C. (2001). Understanding brand loyalty in professional sport:
Examining the link between brand association and brand loyalty. International
Journal of Sports Marketing and Sponsorship, 3, 67-94.
Gladden, J. M., & Funk, D. C. (2002). Developing an understanding of brand
associations in team sport: Empirical evidence from consumers of professional
sport. Journal of Sport Management, 16, 54-81.
Gladden, J. M., & Milne, G. R. (1999). Examining the importance of brand equity in
professional sports. Sport Marketing Quarterly, 8(1), 21-29.
Glass, G. V., & Hopkins, K. D. (1995). Statistical methods in education and psychology
(3rd ed.). Boston, MA: Allyn and Bacon.
Gottdiener, M. (1998). The semiotics of consumer spaces: The growing importance of
themed environments. In Sherry, J.F. Jr. (Ed.), Servicescapes: The concept of
place in contemporary markets. Chicago, IL: NTC Business Books.
Groves, R. M., Fowler, F. J., Couper, M. P., Lepkowski, J. M., Singer, E., & Tourangeau,
R. (2004). Survey methodology. Hoboken, NJ: Wiley-Interscience.
Guégen, N., Hélène, L. G., & Jacob, C. (2004). Sound level of background music and
alcohol consumption: An empirical evaluation. Perceptual and Motor Skills, 99,
34-38.

137
Guégen, N., Jacob, C., Hélène, L. G., Morineau, T., & Loural, M. (2008). Sound level of
environmental music and drinking behavior: A field experiment with beer
drinkers. Alcoholism: Clinical and Experimental Research, 32(10), 1795-1798.
Guilford, J. P., & Frunchter, B. (1978). Fundamental statistics in psychology and
education. New York, NY: McGraw-Hill.
Harris, L. C., & Ezeh, C. (2008). Servicescape and loyalty intentions: An empirical
investigation. European Journal of Marketing, 42(3/4), 390-422.
Havitz, M. F., & Dimanche, F. (1997). Leisure involvement revisited: Conceptual
conundrums and measurement advances. Journal of Leisure Research, 29(3), 245-
278.
Havitz, M. F., & Dimanche, F. (1999). Leisure involvement revisited: Drive properties
and paradoxes. Journal of Leisure Research, 31(2), 122-149.
Havitz, M. F., & Howard, D. R. (1995). How enduring is enduring involvement? A
seasonal examination of three recreational activities. Journal of Consumer
Psychology, 4, 255-276.
Hecker, S. (1984). Music for advertising effect. Psychology and Marketing, 1(3-4), 3-8.
doi: 10.1002/mar.4220020303
Heere, B., & Dickson, G. (2008). Measuring attitudinal loyalty: Separating the terms of
affective commitment and attitudinal loyalty. Journal of Sport Management, 22,
227-239.
Hightower, R., Brady, M. K., & Baker, T. L. (2002). Investigating the role of the physical
environment in hedonic service consumption: An exploratory study of sporting
events. Journal of Business Research, 55, 697-707.

138
Hines, M., & Mehrabian, A. (1979). Approach-avoidance behaviors as a function of
pleasantness and arousing quality of settings and individual differences in
stimulus screening. Social Behavior and Personality, 7(2), 223-233.
Houston, M. J., & Rothschild, M. L. (1978). Conceptual and methodological perspectives
in involvement. In S. Jain (Ed.), Research frontiers in marketing: Dialogues and
directions (pp. 184-187). Chicago, IL: American Marketing Association.
Howard, D. R., & Crompton, J. L. (1995). Financing sport. Morgantown, WV: Fitness
Information Technology, Inc.
Howard, D., & DeSchriver, T. (2005). Financial principles applied to sport management.
In L. P. Masteralexis, C. A. Barr, & M. A. Hums (Eds.), Principles and practices
of sport management (2nd ed.). Sudbury, MA: Jones & Bartlett.
Howard, D. R., & Thompson, P. (1984). The critical importance of the distribution
variable in marketing strategy. Visions in Leisure Business, 3(2), 34-40.
Hox, J. J., & De Leeuew, E. D. (1994). A comparison of nonresponse in mail, telephone,
and face-to-face surveys. Applying multilevel modeling to meta-analysis. Quality
& Quantity, 329-344.
Huck, S. W. (2008). Reading statistics and research. Boston, MA: Pearson Education.
Hyllegard, R., Mood, D. P., & Morrow, J. R. Jr. (2000). Interpreting research in sport
and exercise science. Dubuque, IA: McGraw Hill.
Jacob, C. (2006). Styles of background music and consumption in a bar. International
Journal of Hospitality Management, 25, 716-720.
Jacoby, J., & Kyner, D. B. (1973). Brand loyalty v. repeat purchase behavior. Journal of
Marketing Research, 10, 19.

139
Kachigan, S. K. (1991). Multivariate statistical analysis: A conceptual introduction.
Radius Press: New York, NY.
Keller, K. L. (1993). Conceptualizing, measuring, and managing customer-based brand
equity. Journal of Marketing, 37, 1-22.
Kellner, P. (2002). Media spectacle. London, UK: Routledge.
Kempf, D. S. (1999). Attitude formation from product trial: Distinct role of cognition and
affect for hedonic and functional products. Psychological Marketing, 16, 35-50.
Kerstetter, D. L., & Kovich, G. M. (1997). An involvement profile of Division I women’s
basketball spectators. Journal of Sport Management, 11, 234-249.
King, B. (2002). Passion that can’t be counted puts billions of dollars in play. Street &
Smith’s SportsBusiness Journal, 4(47), 25-39.
Kotler, P. (1973). Atmospherics as a marketing tool. Journal of Retailing, 49(4), 48-64.
Krejcie, R. V., & Morgan, D. W. (1970). Determining sample size for research activities.
Educational and Psychological Measurement, 30, 607-610.
Kwon, H., & Trail, G. (2003). A re-examination of the construct and concurrent validity
of the Psychological Commitment to Team scale. Sport Marketing Quarterly, 12,
88-93.
Kyle, G., Absher, J., Norman, W., Hammitt, W., & Jodice, L. (2007). A modified
involvement scale. Leisure Studies, 26(4), 399-427.
Kyle, G. T., & Mowen, A. J. (2005). An examination of the leisure involvement-agency
commitment relationship. Journal of Leisure Research, 37(3), 342-363.
Laaksonen, P. (1994). Consumer involvement: Concepts and research. London, UK:
Routledge.

140
Laurent, G., & Kapferer, J. N. (1985). Measuring consumer involvement profiles.
Journal of Marketing Research, 22, 41-53.
Li, M., Pitts, B., & Quarterman, J. (2008). Research methods in sport management.
Morgantown, WV: Fitness Information Technology.
Lohr, S. L. (2008). Coverage and sampling. In E.D. de Leeuw, J.J. Hox, & D.A. Dillman
(Eds.), International handbook of survey methodology (pp. 97-112). New York,
NY: Taylor & Francis Group.
Lorr, M. (1983). Cluster analysis for social scientists. San Francisco, CA: Jossey-Bass.
Macklin, C. M. (1988). The relationship between music in advertising and children’s
responses: An experimental investigation. In S. Hecker & D.W. Stewart (Eds.),
Nonverbal communication in advertising. Lexington, MA: Heath.
Madrigal, R. (2006). Measuring the multidimensional nature of sporting event
performance consumption. Journal of Leisure Research, 38(3), 267-292.
Magnini, V. P., & Parker, E. E. (2009). The psychological effects of music: Implications
for hotel firms. Journal of Vacation Marketing, 15, 53-62.
Mahony, D. F., Madrigal, R., & Howard, D. (2000). Using the Psychological
Commitment to Team (PCT) scale to segment sport consumers based on loyalty.
Sport Marketing Quarterly, 9(1), 15-25.
Masterealexis, L. P., Barr, C. A., & Hums, M. A., (2008). Principles and practice of
sport management (3rd ed.). Sudbury, MA: Jones and Bartlett Publishers.
McElrea, H., & Standing, L. (1992). Fast music causes fast drinking. Perceptual and
Motor Skills, 75(2), 362.

141
McIntyre, N. (1989). The personal meaning of participation: Enduring involvement.
Journal of Leisure Research, 21, 167-179.
Meek, A. (1997). An estimate of the size and supported economic activity of the sports
industry in the United States. Sport Marketing Quarterly, 6(4), 15-21.
Mehrabian, A., & Russell, J. A. (1974). The basic emotional impact of environments.
Perceptual and Motor Skills, 38, 283-301.
Mehrabian, A., & Russell, J. A. (1976). The three dimensions of emotional reaction.
Psychology Today, 10(3), 57-61.
Merriam, S. B. (1998). Qualitative inquiry and case study applications in education. San
Francisco, CA: Josey-Bass.
Milano, M., & Chelladurai, P. (2011). Gross domestic sport product: The size of the sport
industry in the United States. Journal of Sport Management, 25(1), 24-35.
Milligan, G. W. (1981). A review of Monte Carlo tests of cluster analysis. Multivariate
Behavioral Research, 16, 379-407.
Milliman, R. E. (1982). Using background music to affect the behavior of supermarket
shoppers. Journal of Marketing, 46, 86-91.
Milliman, R. E. (1986). The influence of background music on the behavior of restaurant
patrons. Journal of Consumer Research, 13, 286-289.
Moag & Company (2002). The sports industry’s resistance to bear markets. Retrieved
January 28, 2010 from http://www.moagandcompany.com/i_a/industry_
analysis.pdf

142
Morrin, M., & Chebat, J-C. (2005). Person-place congruency: The interactive effects of
shopper style and atmospherics on consumer expenditures. Journal of Service
Research, 8(2), 181-191.
Mossberg, L. (2008). Extraordinary experiences through storytelling. Scandinavian
Journal of Hospitality and Tourism, 8(3), 195-210.
Mullin, B. J., Hardy, S., & Sutton, W. A. (2007). Sport Marketing (3rd ed.). Champaign,
IL: Human Kinetics.
Munson, J. M., & McQuarrie, E. F. (1987). The factorial and predictive validities of a
revised measure of Zaichkowsky’s personal involvement inventory. Educational
and Psychological Measurement, 47, 773-782.
Namaslvayam, K., & Mattila, A. S. (2007). Accounting for the joint effects of the
servicescape and service exchange on consumers’ satisfaction evaluations.
Journal of Hospitality & Tourism Research, 31(1), 3-18.
Nielson (2012, January). State of the media: 2011 year in sports.
Nielsen (2010, January). The changing face of sports media. Retrieved January 28, 2010
from http://en-us.nielsen.com/forms/report_forms/The-Changing-Face-of-Sports-
Media-January-2010
North, A. C., & Hargreaves, D. J. (1998). The effect of music on atmosphere and
purchase intentions in a cafeteria. Journal of Applied Psychology, 28, 2254-2273.
North, A. C., Hargreaves, D. J., & McKendrick, J. (1999). The influence of in-store
music on wine selections. Journal of Applied Psychology, 84, 271-276.
North, A.C., Shilock, A., & Hargreaves, D.J. (2003). The effect of musical style on
restaurant customer’s spending. Environment and Behavior, 35(5), 712-718.

143
Orcher, L. T. (2005). Conducting research: Social and behavioral science methods.
Glendale, CA: Pyrczak Publishing.
Ourand, J., & Lombardo (2007, June 4). NBA near deal with TV partners. Street &
Smith’s SportsBusiness Journal. Retrieved from
http://www.sportsbusinessdaily.com/Journal/Issues/2007/06/20070604/This-
Weeks-News/NBA-Near-Deal-With-TV-Partners.aspx
Park, S. H., & Kim, Y. M. (2000). Conceptualizing and measuring the attitudinal loyalty
construct in recreational sport contexts. Journal of Sport Management, 14, 197-
207.
Pedersen, P. M., Miloch, K.S., & Laucella, P. C. (2007). Strategic sport communication.
Champaign, IL: Human Kinetics.
Plunkett Research, Ltd. (2009). Sports industry overview. Retrieved January 28, 2010
from http://www.plunkettresearch.com/Industries/Sports/SportsStatistics/tabid/
273/Default.aspx
Pritchard, M. P., Havitz, M. E., & Howard, D. R. (1999). Analyzing the commitment-
loyalty link in service contexts. Academy of Marketing Science, 27, 333-348.
Punj, G., & Stewart, D. W. (1983). Cluster analysis in marketing research: Review and
suggestions for application. Journal of Marketing Research, 20, 134-148.
Raj, D. (1972). The design of sample surveys. McGraw Hill: New York, NY.
Rein, I., Kotler, P., & Shields, B. (2006). The elusive fan: Reinventing sports in a
crowded marketplace. New York, NY: McGraw-Hill.
Rothschild, M. L. (1984). Perspectives on involvement: Current problems and future
directions. Advances in Consumer Research, 11, 216-217.
144
Russell, J. A. (1980). A circumplex model of affect. Journal of Personality and Social
Psychology, 39, 1161-1178.
Schnietz, K. E., Advani, S., Henderson, T., McIntyre, H., Simms, D., & van Valkenburg,
S. (2005). 5-Forces industry analysis. Graziadio Business Report, 8(4). Retrieved
January 28, 2010 from http://gbr.pepperdine.edu/054/nba.html
Sherif, M., & Cantril, H. (1974). The psychology of ego involvement: Social attitudes and
identifications. New York, NY: Wiley.
Sherif, M., & Hovland, C. I. (1961). Social judgment: Assimilation and contrast effects in
reaction to communication and attitude change. New Haven, CT: Yale University
Press.
Som, R. K. (1973). A manual of sampling techniques. London, UK: Heinemann.
Southall, R. M., & Dick, R. (2011). Sport-sales and revenue generation. In Nagel, M. &
R. M. Southall (Eds.), Introduction to sport management: Theory and practice.
Dubuque, IA: Kendall Hunt Publishing.
Stattrek. (n.d.). Random number generator. Retrieved February 4, 2010 from
http://stattrek.com/Tables/Random.aspx
Stevens, J. P. (2002). Applied multivariate statistics for the social sciences (4th ed.).
Mahwah, NJ: Lawrence Erlbaum Associates.
Tabachnick, B. G., & Fidell, L. S. (2001). Using multivariate statistics. Needham
Heights, MA: Allyn and Bacon.
Thomas, J. R., & Nelson, J. K. (2001). Research methods in physical activity (4th ed.).
Champaign, IL: Human Kinetics.

145
Trail, G. T., & James, J. D. (2008). Introduction to sport consumer behavior. In Sport
Consumer Behavior (pp. 1-23). Columbus, OH: Sport Consumer Research Group
Internet Publishing Company.
Trail, G. T., Anderson, D. F., & Fink, J. S. (2000). A theoretical model of sport spectator
consumption behavior. International Journal of Sport Management, 1, 154-180.
Von Eye, A., & Schuster, C. (1998). Regression analysis for social sciences. San Diego,
CA: Academic Press.
Wakefield, K. L., & Blodgett, J. G. (1994). The importance of servicescapes in leisure
service settings. Journal of Services Marketing, 8(3), 66-76.
Wakefield, K. L., & Blodgett, J. G. (1996). The effect of servicescapes on customers’
behavioral intentions in leisure service settings. Journal of Services Marketing,
10(6), 45-61.
Wakefield, K. L., & Sloan, H. J. (1995). The effects of team loyalty and selected stadium
factors on spectator attendance. Journal of Sport Management, 9, 153-172.
Ward, J. H. (1963). Hierarchical grouping to optimize an objective function. Journal of
the American Statistical Association, 58, 236-244.
Westerbeek, H., & Smith, A. (2003). Sport business in the global marketplace. London,
UK: Palgrave Macmillan.
Zaichkowsky, J. L. (1985). Measuring the involvement construct. Journal of Consumer
Research, 12, 341-353.

146
APPENDIX A
SURVEY INSTRUMENT

147
FRONT COVER The purpose of this survey is to gain important information from game attendees in order to gain a better understanding of sport consumer attitudes and behaviors. This survey will take less than 10 minutes to complete. All responses are anonymous and your information will be kept confidential. We appreciate you taking the time to fill out this survey and your assistance in the completion of this research project. Please leave your survey in your cup holder upon completion. You may also return your completed survey to one of the Guest Services locations outside sections 102/103 and sections 401/402.
Don’t forget to provide your email address, to be eligible to win a signed jersey or a pair of tickets to an upcoming home game!
Email: _______________________
INSIDE COLUMN 1 **For each of the following statements please indicate you level of agreement.
1. Attending professional basketball games takes up a majority of my time. Strongly Disagree 1 : 2 : 3 : 4 : 5 : 6 : 7 Strongly Agree
2. I find attending professional basketball games offers me a sense of enjoyment. Strongly Disagree 1 : 2 : 3 : 4 : 5 : 6 : 7 Strongly Agree
3. Attending professional basketball games says a lot about who I am as a person. Strongly Disagree 1 : 2 : 3 : 4 : 5 : 6 : 7 Strongly Agree
4. Attending professional basketball games plays a central role in my life. Strongly Disagree 1 : 2 : 3 : 4 : 5 : 6 : 7 Strongly Agree
5. You can tell a lot about me by watching my behaviors when I attend professional basketball games.
Strongly Disagree 1 : 2 : 3 : 4 : 5 : 6 : 7 Strongly Agree 6. Compared to other professional sporting events I attend, attending professional
basketball games are much more interesting to me. Strongly Disagree 1 : 2 : 3 : 4 : 5 : 6 : 7 Strongly Agree
7. Attending professional basketball games provides me the opportunity to relax. Strongly Disagree 1 : 2 : 3 : 4 : 5 : 6 : 7 Strongly Agree
8. A lot of my time is spent organizing and planning my attendance of professional basketball games.
Strongly Disagree 1 : 2 : 3 : 4 : 5 : 6 : 7 Strongly Agree 9. When I attend professional basketball games, I am able to act more like myself
than in other social settings. Strongly Disagree 1 : 2 : 3 : 4 : 5 : 6 : 7 Strongly Agree
INSIDE COLUMN 2 **For each of the following statements please indicate you level of agreement.
10. I would still be committed to the (home team) regardless of the lack of any star players.
Strongly Disagree 1 : 2 : 3 : 4 : 5 : 6 : 7 Strongly Agree

148
11. I could never switch my loyalty from the (home team) even if my close fans were fans of another team.
Strongly Disagree 1 : 2 : 3 : 4 : 5 : 6 : 7 Strongly Agree 12. I would still be committed to the (home team) regardless of the lack of
physical skill among the players. Strongly Disagree 1 : 2 : 3 : 4 : 5 : 6 : 7 Strongly Agree
13. It would be difficult to change my beliefs about the (home team). Strongly Disagree 1 : 2 : 3 : 4 : 5 : 6 : 7 Strongly Agree
** Thinking about the experience you are currently having attending a professional basketball game, please indicate which adjectives best describe your feelings. For each pair of adjectives listed below, please put an X closer to the adjective which you feel best describes your feelings regarding your attendance experience. The more appropriate the adjective seems, the closer you will want to put the X to that that particular adjective. Do not take too long thinking about your responses, as your initial response is usually best at capturing your true feelings.
(For example: Glad ___ : _X_ : ___ : ___ : ___ : ___ : ___ : Sad )
14. Stimulated 1 : 2 : 3 : 4 : 5 : 6 : 7 Relaxed 15. Alert 1 : 2 : 3 : 4 : 5 : 6 : 7 Distracted 16. Excited 1 : 2 : 3 : 4 : 5 : 6 : 7 Calm 17. Uncomfortable 1 : 2 : 3 : 4 : 5 : 6 : 7 Pleasant 18. Aroused 1 : 2 : 3 : 4 : 5 : 6 : 7 Content 19. Wide Awake 1 : 2 : 3 : 4 : 5 : 6 : 7 Drowsy 20. Amicable 1 : 2 : 3 : 4 : 5 : 6 : 7 Standoffish 21. Pleased 1 : 2 : 3 : 4 : 5 : 6 : 7 Irritated 22. Satisfied 1 : 2 : 3 : 4 : 5 : 6 : 7 Dissatisfied 23. Agitated 1 : 2 : 3 : 4 : 5 : 6 : 7 Fulfilled 24. Engaged 1 : 2 : 3 : 4 : 5 : 6 : 7 Disengaged 25. Happy 1 : 2 : 3 : 4 : 5 : 6 : 7 Miserable
INSIDE COLUMN 3 ** For each of the following statements please indicate you level of agreement.
26. The music did not interfere with my ability to interact and converse with those around me.
Strongly Disagree 1 : 2 : 3 : 4 : 5 : 6 : 7 Strongly Agree 27. The music did not distract me from watching the game being played.
Strongly Disagree 1 : 2 : 3 : 4 : 5 : 6 : 7 Strongly Agree 28. I liked the type of music being played during the game.
Strongly Disagree 1 : 2 : 3 : 4 : 5 : 6 : 7 Strongly Agree 29. The music played during the game was the type I associate with professional
basketball. Strongly Disagree 1 : 2 : 3 : 4 : 5 : 6 : 7 Strongly Agree

149
**Please tell us a little about yourself. 30. When you arrived at the arena today, how much money (in whole dollars) did
YOU INTEND to spend on concessions and merchandise? <Blank Space> 31. If over 21, when you arrived at the arena today, how much money (in whole
dollars) did YOU INTEND to spend on alcoholic beverages? <Blank Space> 32. How much money (in whole dollars) have YOU ACTUALLY spent on
concessions and merchandise during today’s game? <Blank Space> 33. If over 21, how much money (in whole dollars) have YOU ACTUALLY spent on
alcoholic beverages during today’s game? <Blank Space> BACK FLAP COLUMN 1 **Please tell us a little about yourself.
34. How many (home team) home games do you attend during a typical season? <Blank Space>
35. What is your gender? a. Female b. Male
36. What is your age? a. 18-20 b. 21-30 c. 31-40 d. 41-50 e. 50 or above
37. What is your zip code? <Blank Space> 38. What is your ethnicity?
a. Black or African American b. Hispanic or Latina c. Asian d. White e. American Indian or Alaska Native f. Native Hawai’ian or other Pacific Islander
39. What is your marital status? a. Married b. Divorced c. Single/Never Married d. Separated e. Widowed f. Partner
40. Please indicate the highest level of education you have completed. a. High School or less b. 2-year or Associates Degree c. Bachelor’s Degree d. Graduate Degree e. Postgraduate Degree f. Other (please specify)

150
41. What is your approximate annual household income? a. $20,000 or less b. $20,001-$40,000 c. $40,001-$60,000 d. $60,001-$80,000 e. $80,001-$100,000 f. $100,001 or greater
42. Which of the following best describes your profession/occupation? a. Sales/marketing b. Education professional c. Medical professional d. Retired e. Student f. Other (please specify)

151
APPENDIX B
INFORMED CONSENT FOR PARTICIPATION IN RESEARCH

152
Project Title: Involvement, Team Loyalty, and the Servicescape: An Investigation of NBA Spectator Attitudes and Behaviors in the Experiential Sport Environment
Lead Researcher: Crystal Southall, M.S., School of Sport and Exercise Science Email: [email protected]
Faculty Advisor: Dr. Dianna Gray, School of Sport & Exercise Science Email: [email protected]
I am conducting research on sport consumer behavior and attitudes while in attendance of professional sporting events including purchasing behaviors and perceptions of atmospheric music. If you agree to participate you will be given a brief survey to complete. The questions contained in the survey will focus on your feelings, attitudes and behaviors as a sport consumer. There will also be questions regarding your reactions, feelings, attitudes and behaviors toward the environment. The survey should take between 5-8 minutes to complete during the second half of the game.
I foresee no risks to participation in this study. However, no names will be used in the presentations and/or publication of data collected in order to ensure the confidentiality of your participation. Results of the study will be presented in group form only (e.g., averages) and all original paperwork will be kept in a locked private office and password protected personal computer. Participation is completely voluntary. You may decide not to participate in this study and if you begin participation you may still decide to stop and withdraw at any time. Your decision will be respected and will not result in loss of benefits to which you are otherwise entitled.
Having read the above please complete the attached questionnaire if you would like to participate. By completing the questionnaire you will give us permission for your participation. If you have any concerns about your selection or treatment as a research participant, please contact the Office of Sponsored Programs, Kepner Hall, University of Northern Colorado Greeley, CO 80639; 970-351-2161
Thank you for your time and assistance with this study!

153
APPENDIX C
IRB APPROVAL LETTER

154


![[PPT]Consumer Behavior and Marketing Strategy - Lars … to CB.ppt · Web viewIntro to Consumer Behavior Consumer behavior--what is it? Applications Consumer Behavior and Strategy](https://img.pdfslide.us/doc/110x75/5af357b67f8b9a74448b60fb/pptconsumer-behavior-and-marketing-strategy-lars-to-cbpptweb-viewintro.jpg)