Embed Size (px)
Citation preview

PrOF TrainingPrOF Training
Brad BrazilBrad Brazil
Kathy McLainKathy McLain
Norv WellsfryNorv Wellsfry

• The role of PrOF The role of PrOF
• An overview of the PrOF process An overview of the PrOF process
• Overview of data analysis techniquesOverview of data analysis techniques
• Suggested timelinesSuggested timelines
• Resources Resources
OutlineOutline

Role of PrOFRole of PrOF
Course SLO AssessmentsCourse SLO
Assessments
Program SLO Assessments
Program SLO Assessments
PrOF (Program Overview and Forecast
PrOF (Program Overview and Forecast
UNIT PLANUNIT PLAN
Program Level Data
Program Level Data
The Role of PrOFThe Role of PrOF

UNIT PLANUNIT PLAN
CAPITAL OUTLAY
CAPITAL OUTLAY
CLASSIFIED STAFFING
CLASSIFIED STAFFING
FACULTY PRIORITIZATION
FACULTY PRIORITIZATION
OTHER OTHER
Links to BudgetLinks to Budget

UNIT PLANUNIT PLAN
GRANTS AGENDAGRANTS AGENDA
SHORT TERM FACILITIES PLANSHORT TERM
FACILITIES PLAN
EDUCATIONAL MASTER PLAN
EDUCATIONAL MASTER PLAN
STRATEGIC PLAN
STRATEGIC PLAN
MANAGEMENT GOALS AND OBJECTIVES
MANAGEMENT GOALS AND OBJECTIVES
Links to PlanningLinks to Planning

Overview of PrOF Process Overview of PrOF Process Section I – Part ASection I – Part A

PrOF Overview PrOF Overview
Section I, Part A – Section I, Part A – Assessment/brainstormingAssessment/brainstorming
• Program IdentificationProgram Identification
• Looking Back (summary of accomplishments Looking Back (summary of accomplishments – linked to Strategic Plan Goal)– linked to Strategic Plan Goal)
• Data Review (Trends, Differences, Strengths Data Review (Trends, Differences, Strengths and Opportunities)and Opportunities)– Instructional program dataInstructional program data
• Generation of planning ideas Generation of planning ideas – to build on strengths/accomplishments to build on strengths/accomplishments – in response to the opportunities in response to the opportunities

A Guide to Analyzing A Guide to Analyzing PrOF Instructional PrOF Instructional
Data PacketsData Packets
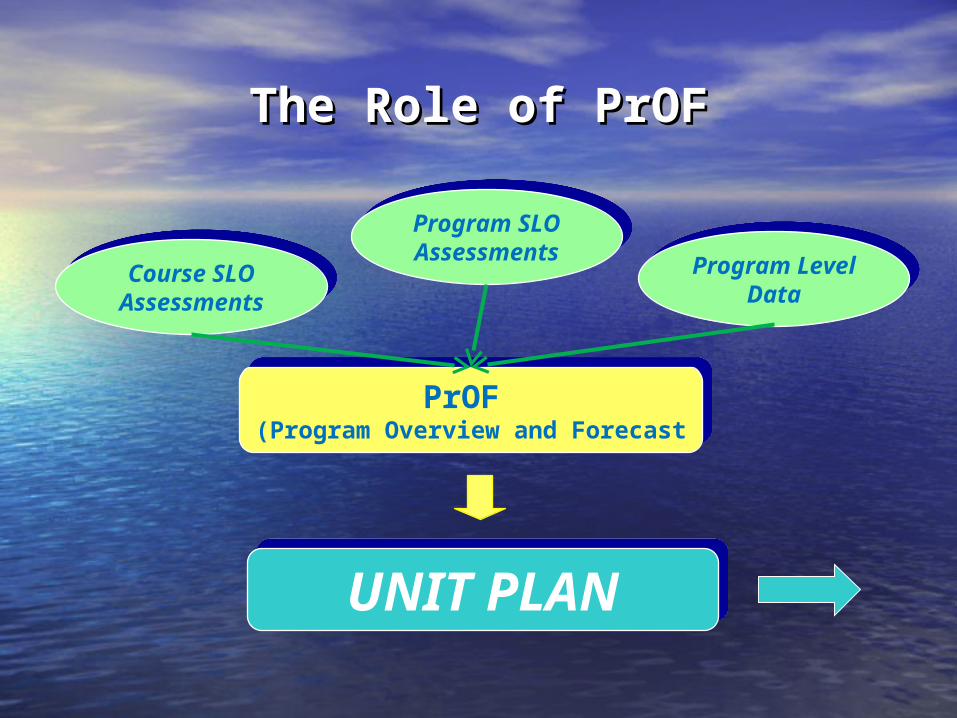
Student Access and Demographics Student Success
Available Data
The PrOF data packets graphically and numerically represent each of the demographic and outcome measures listed above. The past four academic years are analyzed and displayed in the charts to allow you to track trends over time.
Departmental Student Enrollment by:
Age groupAge group (collapsed)GenderEthnic group
Educational goal
Educational levelInstructional modeCourse levelFreshman statusEnglish primary language
Departmental Average Course Success Rates by:
Age groupAge group (collapsed)GenderEthnic groupEducational goal
Educational levelInstructional modeCourse levelFreshman statusEnglish primary language
Semester-to-semester persistence ratesDepartmental WSCH/Instructional FTE/ProductivityDegree and/or Certificates Awarded

GLOSSARY OF TERMS GLOSSARY OF TERMS
Course Success RateCourse Success Rate - - the average percent of students who the average percent of students who successfully complete a class with a grade of "A", "B", "C" or successfully complete a class with a grade of "A", "B", "C" or "CR" compared to the overall number of students enrolled in "CR" compared to the overall number of students enrolled in the class. (Students who dropped out before the fourth the class. (Students who dropped out before the fourth week of classes are automatically excluded from the week of classes are automatically excluded from the calculation.)calculation.)
NumeratorNumerator = = Number of students (duplicated) with Number of students (duplicated) with A, B, C, A, B, C, CRCR
DenominatorDenominator = = Number of students (duplicated) Number of students (duplicated) with A, B, with A, B, C, D, F, CR, NC, W, IC, D, F, CR, NC, W, I
PersistencePersistence - the percentage of students who enroll in a - the percentage of students who enroll in a particular department (regardless of course outcome) for a particular department (regardless of course outcome) for a given semester that enroll at the college in the subsequent given semester that enroll at the college in the subsequent semester.semester.

GLOSSARY OF TERMS (cont.)GLOSSARY OF TERMS (cont.)
Duplicated EnrollmentDuplicated Enrollment - the number of total enrollments in - the number of total enrollments in a particular department. A student is counted for every a particular department. A student is counted for every individual enrollment in a particular department during a individual enrollment in a particular department during a given term; in other words, if a student enrolls in three given term; in other words, if a student enrolls in three courses in a given department for a given term, they are courses in a given department for a given term, they are counted three times. counted three times.
WSCHWSCH – acronym for Weekly Student Contact Hours. This is – acronym for Weekly Student Contact Hours. This is the total student contact hours for the semester.the total student contact hours for the semester.
FTEFTE – acronym for Full-Time Equivalent. A professor teaching – acronym for Full-Time Equivalent. A professor teaching a full load would be considered to be 1.00 FTE. Professors a full load would be considered to be 1.00 FTE. Professors teaching overload or having a reduced teaching load for a teaching overload or having a reduced teaching load for a given semester are adjusted accordingly.given semester are adjusted accordingly.
ProductivityProductivity – the result of dividing the total FTE into the – the result of dividing the total FTE into the total WSCH. total WSCH.

Departmental data College-wide data
Differences, Changes and/or
Commonalities
“Looking back” at what happened
Overview of the Data Analysis Process
The PrOF data packets are arranged so you can look at trends within your departmental data and compare it with the College as a whole. In many cases, you might find that your departmental trends closely mirror overall College-wide trends, but you may see that your departmental trends differ greatly from the College-wide data. This may have implications for departmental planning.

Identifying Trends Identifying Trends
• Within your dataWithin your data– Increases over the past four years (upward Increases over the past four years (upward
tendency in the graph)tendency in the graph)– Decreases over the past four years (downward Decreases over the past four years (downward
tendency in the graph)tendency in the graph)– Cycles in the data (an up and down pattern in Cycles in the data (an up and down pattern in
the graph) the graph) – Noticeable changes over a shorter time period Noticeable changes over a shorter time period
may warrant further investigation, particularly may warrant further investigation, particularly if present on multiple slidesif present on multiple slides
• ExamplesExamples

This graph shows that the department is experiencing an increase in the percentage of African American and Hispanic students and a corresponding decrease in the percentage of Asian/Pacific Islander and White students.
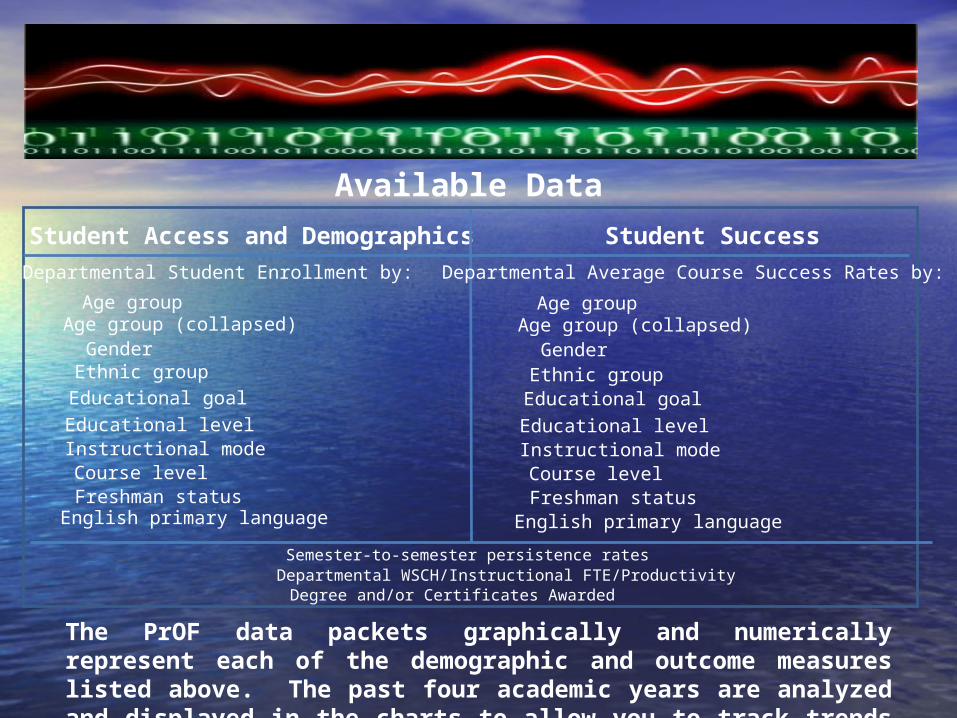
A Guide to Data Analysis for Instructional Programs
This graph shows that course success have improved for both modes over the past two years. Course success rates in online courses were slightly higher than other types of classes in 08-09, something that was not true in previous years. It should be noted, however, that a small number of online classes in the department may exaggerate observed trends.
A Guide to Data Analysis for Instructional Programs

Identifying DifferencesIdentifying Differences
• Within your dataWithin your data– Look for group(s) for which the data exceeds or is Look for group(s) for which the data exceeds or is
below the data for other groupsbelow the data for other groups– Look for years where the data differs from the other Look for years where the data differs from the other
years years – Look for data points that don’t follow an observed Look for data points that don’t follow an observed
trend trend
• When comparing your data with College-wide dataWhen comparing your data with College-wide data– Look for trends that differ from College-wide trendsLook for trends that differ from College-wide trends– Look for situations where program data exceeds or is Look for situations where program data exceeds or is
less than College-wide dataless than College-wide data
• ExamplesExamples

The fluctuation between the Fall 07 and Spring 08 headcount is much smaller than the other fluctuations, a pattern that did not continue during the next academic year.

This graph shows the department’s course success rates by the student’s enrollment status (whether or not the student was a “first-time” freshmen). Course success rates have varied over the four years. However, first-time freshmen course success rates were slightly lower compared with other students for all years prior to 08-09.
A Guide to Data Analysis for Instructional Programs

Comparing the department data with college-wide data shows that the department is serving a younger student clientele compared to the rest of the college (note that the scales on the two graphs are not the same).
Department College wide

The department’s course success rates for African American student are greater, and have increased more, than college-wide course success rates for the same group. In addition, departmental course success rates for White students have increased, whereas college-wide course success rates have decreased. The variation in the departmental data for American Indian students may reflect the low number of students from this group taking classes in the department, which may exaggerate observed trends.
A Guide to Data Analysis for Instructional Programs
Department College wide

Making Meaning from the Making Meaning from the Trends and DifferencesTrends and Differences

Implications of the DataImplications of the Data• Program strengths can be identified fromProgram strengths can be identified from
– Increases/upward trends within the departmental Increases/upward trends within the departmental data (overall or in one group)data (overall or in one group)
– Areas in which the departmental data exceeds Areas in which the departmental data exceeds college-wide data college-wide data
– Differences within the departmental data Differences within the departmental data
• Opportunities can be identified fromOpportunities can be identified from– Decreases/downward trends in the departmental Decreases/downward trends in the departmental
datadata– Areas in which the departmental data is below Areas in which the departmental data is below
college-wide data college-wide data – Differences within the departmental data Differences within the departmental data – Factors that might be limiting the growth and/or the Factors that might be limiting the growth and/or the
success of students in the department. success of students in the department.

Generating Planning Ideas Generating Planning Ideas
• Extending or expanding programs and/or Extending or expanding programs and/or changes that may have contributed to changes that may have contributed to program strengths or improvementsprogram strengths or improvements
• Identifying and addressing the factors that Identifying and addressing the factors that might be negatively affecting growth or might be negatively affecting growth or success in the department success in the department
• Identifying and planning to implement best Identifying and planning to implement best practices within the department or from practices within the department or from other institutions that are similar to CRC.other institutions that are similar to CRC.
After analyzing your Department’s Program Review Data Packets, you may be able generate planning ideas by:

Overview of PrOF Process Overview of PrOF Process Section I – Part BSection I – Part B

PrOF OverviewPrOF Overview
Section I, Part B – SLO/SAO and Section I, Part B – SLO/SAO and curriculum*curriculum*
• PSLO/PSAO development/updatingPSLO/PSAO development/updating– Definitions and differenceDefinitions and difference– Relationship to Degree, Certificate and Course OutRelationship to Degree, Certificate and Course Out
comescomes
• PSLO/PSAO Alignment – development or PSLO/PSAO Alignment – development or reviewing/updatingreviewing/updating
• PSLO/PSAO Assessment – reviewing/planningPSLO/PSAO Assessment – reviewing/planning
* Instructional Programs Only

PrOF OverviewPrOF Overview
Section I, Part B – SLO/SAO and Section I, Part B – SLO/SAO and curriculum* curriculum*
• Curriculum Review and PlanningCurriculum Review and Planning– Identification of courses that need to be Identification of courses that need to be
reviewed/updatedreviewed/updated
•Identified by last review date Identified by last review date
•Identified by SLO status Identified by SLO status – Scheduling of course review/updatingScheduling of course review/updating
•TimelinesTimelines* Instructional Programs Only

Overview of PrOF Process Overview of PrOF Process Sections II and IIISections II and III

PrOF OverviewPrOF Overview
Section II – ForecastingSection II – Forecasting• Identifying up to 5 short-term specific Identifying up to 5 short-term specific
planning agendas to be done in the next planning agendas to be done in the next four yearsfour years– DescriptionDescription– RationaleRationale– Desired OutcomesDesired Outcomes– Links to Strategies in the Strategic Plan Links to Strategies in the Strategic Plan
• Identifying longer term/broader planning Identifying longer term/broader planning agendas and related strategies from the agendas and related strategies from the Strategic PlanStrategic Plan

PrOF OverviewPrOF Overview
• Section III – Resource Needs Section III – Resource Needs – Curriculum (instructional programs only)Curriculum (instructional programs only)
•New courses/ programsNew courses/ programs
•Course deletionsCourse deletions
•Program DeletionsProgram Deletions
– Related Resource needsRelated Resource needs•Type/DescriptionType/Description
•Approximate CostApproximate Cost
•PriorityPriority

Suggested TimelinesSuggested Timelines
Solicit Feedback from Department and Supervisor/ Responsible Administrator
Solicit Feedback from Department and Supervisor/responsible Adminmistrator
Modify/Edit Draft As Needed
Generation of Initial Draft
Curriculum Review and Plan, Generation of Planning Agendas,
Identification of Associated Resource Needs, Final Review,
Approval and Submission
Generation of Initial Draft Modify/Edit Draft As
Needed
Program Identification, Looking Back,Data Review,
Identification of Strengths/Weaknesses, Planning Ideas,
Outcome Assessment Review and Planning
Phase One(September/October)
Phase Two(November/December)
PROF PROCESS DIAGRAMAUGUST, 2009

ResourcesResources
• Data Analysis Data Analysis – PowerPoint presentationsPowerPoint presentations– Podcast (in process!)Podcast (in process!)
•Appointments/consultation/Appointments/consultation/department training department training
• Examples (Coming soon!) Examples (Coming soon!) http://www.crc.losrios.edu/Faculty_anhttp://www.crc.losrios.edu/Faculty_and_Staff/Planning/Program_Review.htmd_Staff/Planning/Program_Review.htm

Relationships Between Outcomes