Embed Size (px)
Citation preview

PROF. R. K.GHOSH, FAPS, FISWS,RAISWS
DEPARTMENT OF AGRONOMY
FACULTY OF AGRICULTURE
BIDHAN CHANDRA KRISHI VISWAVIDYALAYA,
MOHANPUR, NADIA, WEST BENGAL
Email: [email protected]

WEED - THE MOST IMPORTANT PEST
AS IT CAUSES MAXIMUM LOSSES
Losses due to weeds
At Global level
11.5 % of the Total food production
Production Losses in INDIA
Due to PEST
30,000 = 00 Crores annum-1
Due to WEED Pest (12.5%)
11, 500=00 Crores /annum
Chilli- Average production losses due to weeds (2010-11)
42 % in India
Weed 37%
Insect 29%
Disease 22%
Others 12%
LOSSES CAUSED BY
VARIOUS PESTS
PEST : ANY HARMFUL ORGANISM CAUSING CROP YIELD LOSSES
(33 % yield Losses)

Different
Chilli
Cultivars

Weed Management Status in Chilli

Dominant Weed flora in Chilli field
MONOCOTS
Dactyloctenium aegyptium
Digitaria sanguinalis
Echinochloa colona
Eleusine indica
Sporobolus diander
Cyperus rotundus
DICOTS
Amaranthus viridis
Cleome viscosa
Commelina benghalensis
Digera arvensis
Euphorbia hirta / tenella
Gnaphalium luteoalbum
Melilotus alba / indica
Physalis minima
Portuleca oleracea
Scoparia dulcis
Solanum nigram
Spilanthus paniculata
Trianthema portulecastrum

Important Weed flora in Chilli
Eleusine
indica
Digitaria
sanguinalis
Cyperus
rotundus
Echinochloa
colonum
Trianthema
portulecastrum
Physalis minima
Cleome viscosa
Amaranthus
viridis
Melilotus alba
Digera arvensis

METHODS OF WEED MANAGEMENT
Pre-infested
More important
Post-infested
Weed Prevention
Minimize
Weed Seed Bank
And Invasive Weed
Weed Control
Critical Crop – Weed
Competition (CCWC)
Weed Eradication
Pernicious Weed
Annual Planning is most Important
Weed Utilization

Weed Biomass survey in field crops at some blocks
of Hooghly, Nadia, North 24 Parganas
Sl No. Crop Field *Mean Fresh Weight
(g m-2 )
•Mean Dry Weight
(g m-2 )
1. Rice 92.35 17.86
2. Potato 73.86 11.86
3. Jute 147.63 37.85
4. Wheat 81.98 14.86
5. Onion 189.32 51.65
6. Tomato 45.12 10.62
7. Chilli 128.65 21.96 8. Pointed gourd 207.12 62.87
9. Ridge gourd 241.58 64.58
10. Soybean 231.47 41.65
11. Berry Garden 287.52 100.21
12. Banana Garden 412.64 185.32
13. Guava Garden 325.48 89.62
14. Mango Garden 186.96 68.21
15. Home Garden 254.65 59.62
Mean 193.76 55.92
* Mean Fresh & Dry Weight (g m-2 ): Average of the data recorded from 10 spots
NPK Value of on-field Weed Compost
N % P % K %
0.53 0.28 0.94

COMPOST
PIT
AT FIELD
SITE

Mechanical Control
Hand weeding is the environment safe
but damage roots and not economic
Farmers are searching for alternatives

Chemical Weed Control
Time and energy saving – Power sprayer
Less expensive & cost saving
Could able to control weeds in both inter and intra rows of the crop
Always use the green label environment safer organic herbicides
Use Safener and Surfactants with safer organic herbicides
Care taken about proper dose and time of application
Needs Awareness for proper use of bio or synthetic chemicals

PESTICIDE USE
Percent of total pesticides
Pesticides World India
Herbicides 53 21
Insecticides 23 61
Fungicides 21 13
Other Pesticides 03 05
Pesticide use ha-1 (DWSR, 2011)
India – Less than 1 kg (Thailand, Japan -10 kg)
India 1.7% world pesticide consumption
Growth rate of Pesticide annum-1
Insecticides - 2.5 % Fungicides - 3.3 %
Herbicides - 5.0 %

Now a days
Farmers are using
excellent safer
herbicides
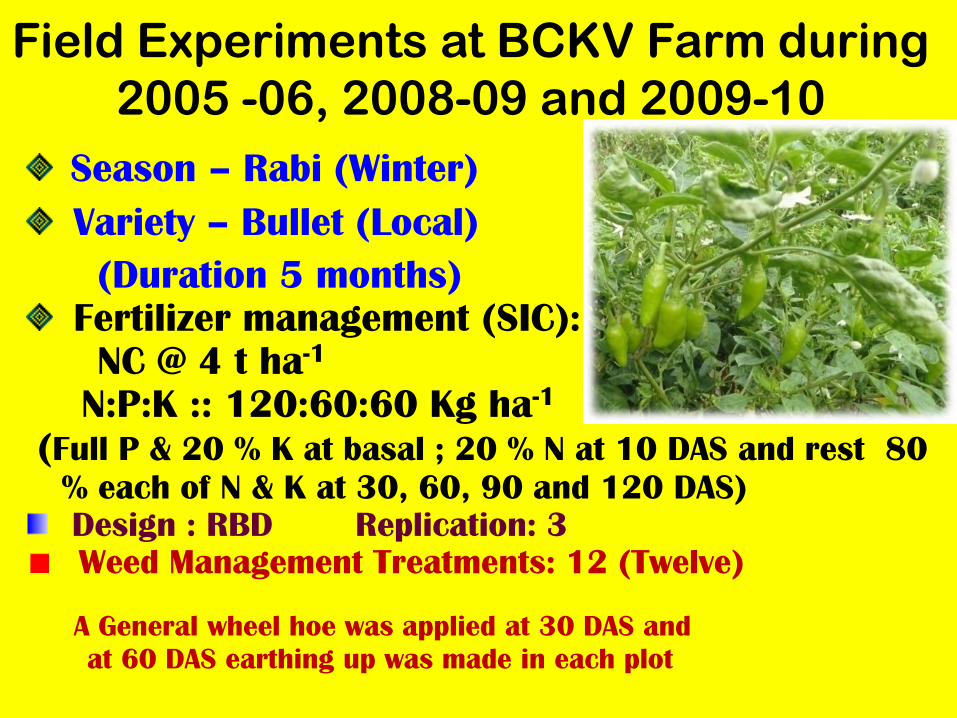
Field Experiments at BCKV Farm during
2005 -06, 2008-09 and 2009-10
Season – Rabi (Winter)
Variety – Bullet (Local)
(Duration 5 months)
Fertilizer management (SIC):
NC @ 4 t ha-1
N:P:K :: 120:60:60 Kg ha-1
(Full P & 20 % K at basal ; 20 % N at 10 DAS and rest 80
% each of N & K at 30, 60, 90 and 120 DAS)
Design : RBD Replication: 3 Weed Management Treatments: 12 (Twelve)
A General wheel hoe was applied at 30 DAS and
at 60 DAS earthing up was made in each plot

0
5
10
15
20
25
30
35
40
0
20
40
60
80
100
120
140
160
1st
Fo
rtn
igh
t
2n
d F
ort
nig
ht
1st
Fo
rtn
igh
t
2n
d F
ort
nig
ht
1st
Fo
rtn
igh
t
2n
d F
ort
nig
ht
1st
Fo
rtn
igh
t
2n
d F
ort
nig
ht
1st
Fo
rtn
igh
t
2n
d F
ort
nig
ht
1st
Fo
rtn
igh
t
2n
d F
ort
nig
ht
1st
Fo
rtn
igh
t
2n
d F
ort
nig
ht
1st
Fo
rtn
igh
t
2n
d F
ort
nig
ht
1st
Fo
rtn
igh
t
2n
d F
ort
nig
ht
1st
Fo
rtn
igh
t
2n
d F
ort
nig
ht
1st
Fo
rtn
igh
t
2n
d F
ort
nig
ht
1st
Fo
rtn
igh
t
2n
d F
ort
nig
ht
March April May June July August SeptemberOctober NovemberDecember January February
Max
imu
m &
Min
imu
m R
elati
e H
um
idit
y (
%),
Rain
fall
(mm
)
Months
Rainfall(mm)
Max.Relative
Humidity (%)
Min.Relative
Humidity (%)
Max.
Temperature0C
Min.Temperatu
re0C
Maxim
um
& M
inim
um
Tem
per
atu
re0C
Average Meteorological data during the experimental period of 2005-06, 2008-09 and 2009-10

Weedy Check (Control) Hand Weeding
Propaquizafop 5% +
Oxyfluorfen 12% EC mixture
@ 50 + 120 g a.i ha-1
At POE (20 DAS)
Oxyfluorfen 23.5% EC
@ 200 g ha-1 at PE
BCKV Farm, 2009-10

Effect of treatments on the weed biomass and Green Chilli yield
(Pooled data for three years Rabi 2005 -06, 2008-09 and 2009-10)
Treatments Weed biomass (g m-2)
At 25 DAA
Monocot Dicot
Green Chilli
yield (t ha-1)
% increase
over WC
T1 Weedy check (Control) 5.58 6.43 4.45 -
T2 Hand weeding at 20 & 40 DAS 1.94 1.09 8.72 95.9
T3 Oxyfluorfen 23.5% EC @ 150 g ha-1 3.17 4.21 7.17 56.6
T4 Oxyfluorfen 23.5% EC @ 200 g ha-1 2.35 2.46 7.88 77.0
T5 Pendimethalin 30% EC @ 1 kg ha-1 3.02 4.38 7.56 69.9
T6 Propaquizafop 10 EC @ 50 g ha-1 2.32 6.03 7.28 63.6
T7 Propaquizafop 10 EC @ 75 g ha-1 2.07 6.20 7.46 67.6
T8 Fenoxaprop-p-ethyl 50 g ha-1 2.38 5.95 7.01 57.5
T9 Fenoxaprop-p-ethyl @ 67.5 g ha-1 2.12 6.58 7.31 64.3
T10 Quizalofop-ethyl @ 50 g ha-1 2.05 5.31 7.52 69.0
T11 Propaquizafop 5% + Pendimethalin
12% EC mixture @ 50 + 600 g a.i ha-1 1.57 1.88 8.04
87.7
T12 Propaquizafop 5% + Oxyfluorfen
12% EC mixture @ 50 + 120 g a.i ha-1 1.43 1.19 8.41
89.0
CD at 5 % 0.715 1.278 1.862
T1 – T 12 A common Mechanical weeding at 30 DAS + Earthing up at 60 DAS in all plots

Follow up Crop Black Gram (Vigna radiata)
Season–Summer (March- May)
Variety–Basant bahar (PDU-1)
(Duration 3 months)
Fertilizer management (SIC):
NC @ 2 t ha-1
N:P:K :: 20: 40:40 Kg ha-1 (Full NPK at Basal)
Design : RBD Replication: 3 In Twelve (12) Weed Management Treated plots the
Black gram was sown following minimal tillage
A General hand weeding was applied at 30 DAS in each plot
After recording the plant population at 15 DAS

No Phytotoxic effect
on Follow Up Crop
Black Gram
(Vigna radiata)

Treatments Population (m-2 )
at 15 DAS
Black gram yield
(t ha-1)
T1 Weedy check (Control) 32 0.505
T2 Hand weeding at 20 & 40 DAS 33 0.695
T3 Oxyfluorfen 23.5% EC @ 150 g ha-1 31 0.618
T4 Oxyfluorfen 23.5% EC @ 200 g ha-1 32 0.635
T5 Pendimethalin 30% EC @ 1 kg ha-1 34 0.616
T6 Propaquizafop 10 EC @ 50 g ha-1 32 0.608
T7 Propaquizafop 10 EC @ 75 g ha-1 33 0.625
T8 Fenoxaprop-p-ethyl 50 g ha-1 31 0.600
T9 Fenoxaprop-p-ethyl @ 67.5 g ha-1 33 0.611
T10 Quizalofop-ethyl @ 50 g ha-1 34 0.618
T11 Propaquizafop 5% + Pendimethalin
12% EC mixture @ 50 + 600 g a.i ha-1 32 0.664
T12 Propaquizafop 5% + Oxyfluorfen
12% EC mixture @ 50 + 120 g a.i ha-1 31 0.679
CD at 5 % NS 0.0902
Effect of treatments on the Population and grain yield of Follow UP Black gram
(Pooled data for three years Summer 2005 -06, 2008-09 and 2009-10)

Field Experiments at Sekhampur Farm
during 2011-12
Season – Rabi (Winter)
Variety – Bullet (Local)
(Duration 5 months)
Fertilizer management (SIC):
NC @ 4 t ha-1
N:P:K :: 120:60:60 Kg ha-1
(Full P & 20 % K at basal ; 20 % N at 10 DAS and rest 80
% each of N & K at 30, 60, 90 and 120 DAS)
Design : RBD Replication: 3 Weed Management Treatments: 7(Seven)
A General wheel hoe was applied at 30 DAS and
at 60 DAS earthing up was made in each plot

Treatments Weed control efficiency Green chilli
yield (t ha-1) 15 DAA 30 DAA 40 DAA
T1 Propaquizafop 10 EC @ 500 ml
ha-1 at 20 DAS
61.6 49.7 50.0 4.47
T2 Propaquizafop 10 EC@ 625 ml
ha-1 at 20 DAS
70.7 59.6 57.4 4.75
T3 Propaquizafop 10 EC @750 ml
ha-1 at 20 DAS
81.8 67.3 73.9 5.13
T4 Propaquizafop 10 EC @ 1250 ml
ha-1 at 20 DAS
85.9 76.6 76.6 5.73
T5 Pendimethalin 30%EC @ 4160
ml ha-1 at 20 DAS
29.3 21.1 23.4 4.80
T6 Hand Weeding at 20 and 40 DAS 91.9 91.2 87.2 5.90
T7 Weedy Check (Control) 3.17
CD at 5% 1.754
Weed Control Efficiency and Green Chilli yield
at Sekhampur, Birbhum, West Bengal during 2011-12
T1 – T7 A common Mechanical weeding at 30 DAS in all plots

At Sekhampur, Birbhum, West
Bengal during 2011-12 Propaquizafop 10 EC
@ 1250 ml ha-1 at 20 DAS
Hand Weeding
at 20 and 40 DAS Propaquizafop 10 EC
@ 500 ml ha-1 at 20 DAS
Weedy Check (Control)

Initial
21 DAA
Harvest
From Initial to 3,7 & 21 DAA
7 DAA
Fungi Total Bacteria
Population of Actinomycetes
Effect on
Microflora
BCKV Trial
2009-10


BCKV, West Bengal, India Developed Weed Management
Annual Planning Package For cultivated Field and Horticultural crops
BCKV also Develops PE bioherbicides from Tectona, Bamboo, Calotropis, Parthenium and Cucumber
Glyphosate 71 SG + Oxyfluorfen 23.5 %
@ 2 g litre of water -1 at 21 DBP/ DBS +
PE botanical or safer chemical Herbicides +
One Hand Weeding or Mechanical weeding
(Wheel Hoe for aerobic & Weeder for anaerobic
situation) at 20- 30 DAS/DAP/DAT
Grow legume cover crops like Vigna, Senji,
Sesbania etc. in field either as intercrop / guard
crop or in between crops wherever possible

Bamboo root and Bamboo
Leaves powder
Preparation of bamboo
aqueous leaf extract
Cucumber Leaves

Drying of Tectona leaves and Parthenium plants
Raw juice Extract from Calotropis leaves

Calo hexen Calo methanol Par hexen Par methanol
Tec hexen Tec methanol
Bioherbicides
Mixture of Tectona,
Calotropis &
Parthenium
@ 50 ml l-1
at 1 DAT +
1 hand weeding
at 25 DAS
Crude Solvent Extract
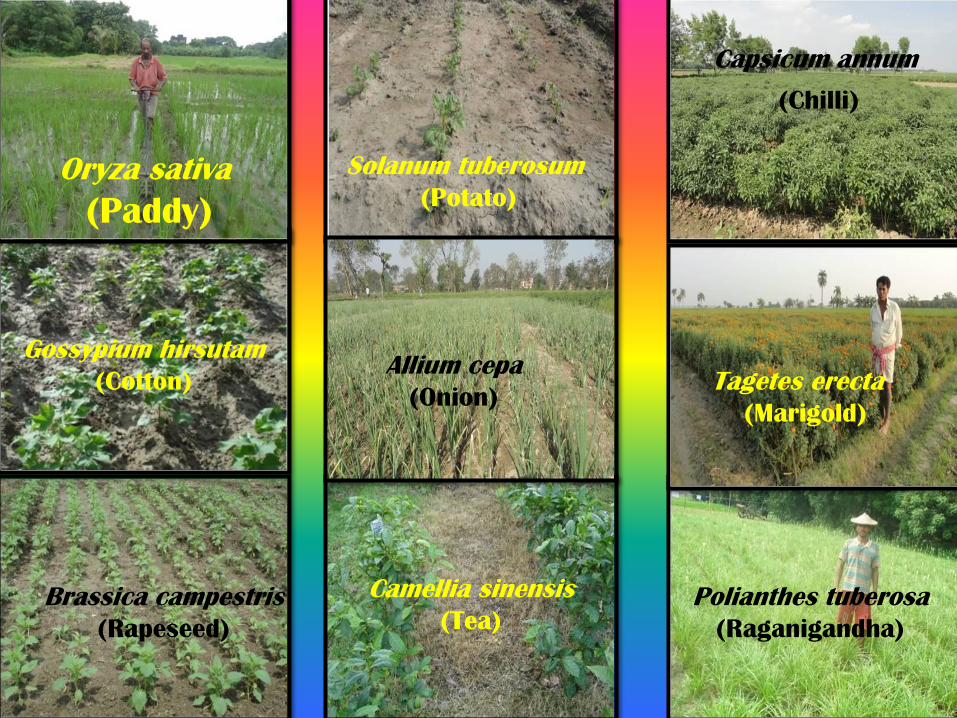
Oryza sativa
(Paddy)
Gossypium hirsutam
(Cotton)
Solanum tuberosum
(Potato)
Capsicum annum
(Chilli)
Tagetes erecta
(Marigold)
Brassica campestris
(Rapeseed)
Camellia sinensis
(Tea)
Allium cepa
(Onion)
Polianthes tuberosa
(Raganigandha)

Effect of Aqueous Plant Extracts on Green Chilli Yield
(Pooled data for 8 locations on Summer 2012)
Treatments Green Chilli yield
(t ha-1)
T1 Weedy Check (Control) 4.34
T2 Hand Weeding at 20 and 40 DAS 6.56
T3 Bamboo leaf and root extract 6.29
T4 Cucumber leaf & stem extract 6.24
T5 Calotropis + Parthenium extract 6.31
T6 Calotropis + Tectona extract 6.25
T7 Parthenium + Tectona extract 6.30
T8 Calotropis + Parthenium + Tectona
Leaf extract
6.38
T9 Quizalofop-p-ethyl @50g ha-1 at 20 DAS 6.35
CD at 5 % 1.951
All botanical treatments T3 - T8 aqueous extracts were applied at 1 DAS
All Treatments received a common mechanical weeding (wheel hoe) at 30 DAS

Pabdhara,
North 24 Parganas
(Alluvial Soil)
Gosaba, Sundarban,
South 24 Parganas
(Saline soil) Haringhata,
Nadia
(Inceptisol)
Amarpur, Burdwan
(New Alluvial soil)
Uluberia, Howrah
(Old Alluvial soil)
Chandamari,
Nadia
(New Alluvial soil)
Testing of PE Aqueous Plant Extracts on
IWM and Green Chilli Yield
(On Farm 6 locations on Summer 2012)

Awareness
Programme for
Model village to
use eco-safe
chemicals

CONCLUSION
Use Glyphosate 71 SG + Oxyfluorfen 23.5
EC @ 2 g litre-1
water at 21 DBS / DBP or
Growing of legumes mix crop /2 MBS / MBP
PE Herbicide + 2 Mechanical Weeding (MW)
PE Bio-Herbicide + 1 MW + 1 HW
Proper Dose, Time & Method of application
of environment safe organic chemicals
Use PE Green labeled organic chemicals
Spaying – On moist Soil only not on crop in
standing water
For easy measuring the required chemicals
Container must provides with Scale Cover
Training at villages more and more
Aware Farmers to contact with plant doctor


![Participatory Livestock Development Project (Loan · PDF fileParticipatory Livestock Development Project (Loan 1524-BAN[SF]) ... Participatory Livestock Development Project ... Mohanpur](https://img.pdfslide.us/doc/110x75/5aae55147f8b9a22118bdba4/participatory-livestock-development-project-loan-livestock-development-project.jpg)