Embed Size (px)
Citation preview

SBT TECHNOLOGY OF IIT BOMBAYSBT TECHNOLOGY OF IIT BOMBAY
Prof H S ShankarProf H S ShankarDepartment of Chemical Engineering
Indian Institute of Technology BombayEmail: [email protected]
APPLICATIONS OF SBT• Rain water harvesting• Drinking waterg• Swimming pool
• Sewage treatment • Industrial wastewater treatment, • Industrial air purification• Industrial air purification
• Municipal solid waste Processing p g• Commercial production of Soil• Animal House waste processing
H i l• Hospital waste treatment

Why This Technology
Agriculture
Animal Husbandry
Fi h iFisheries
Sewage Treatment
Water Supply& Sanitation
Waste Water Treatment
Rain water Harvesting
Restoration of Rivers and LakesRestoration of Rivers and Lakes
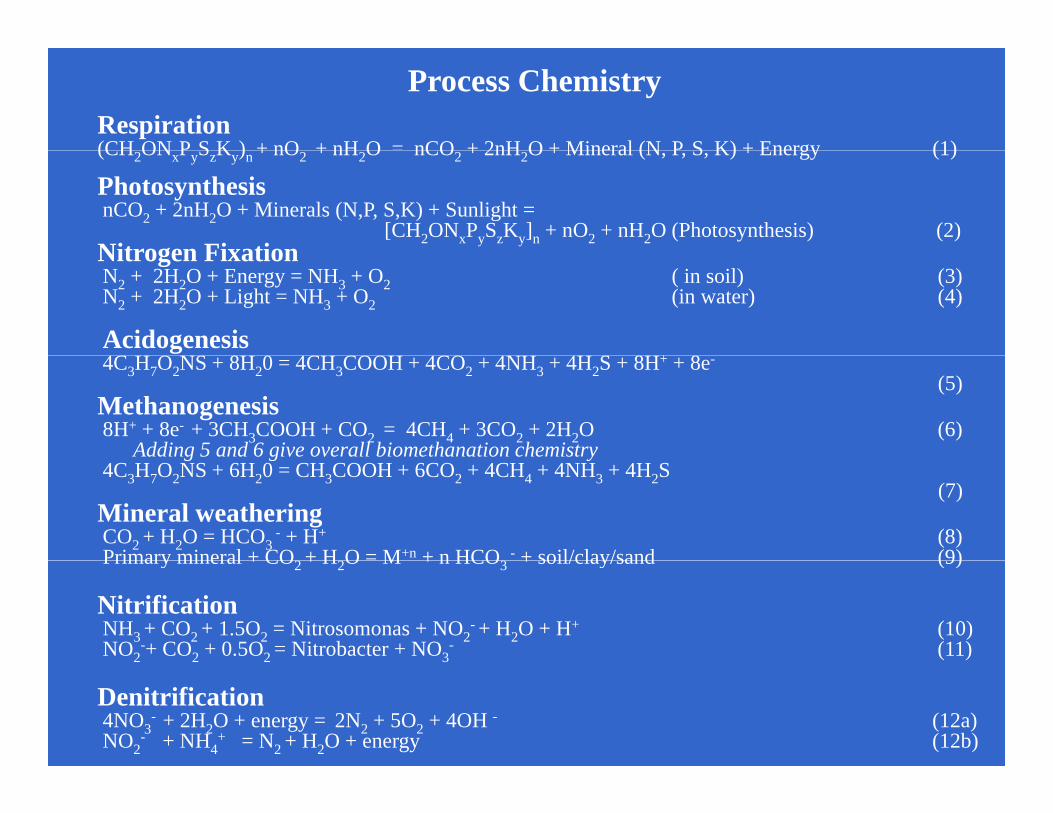
Process ChemistryRespiration(CH ON P S K ) + nO + nH O = nCO + 2nH O + Mineral (N P S K) + Energy (1)(CH2ONxPySzKy)n + nO2 + nH2O nCO2 + 2nH2O + Mineral (N, P, S, K) + Energy (1)
PhotosynthesisnCO2 + 2nH2O + Minerals (N,P, S,K) + Sunlight =
[CH2ONxPySzKy]n + nO2 + nH2O (Photosynthesis) (2)Nitrogen FixationNitrogen FixationN2 + 2H2O + Energy = NH3 + O2 ( in soil) (3) N2 + 2H2O + Light = NH3 + O2 (in water) (4)
Acidogenesis4C O S 8 0 4C COO 4CO 4 4 S 8 + 84C3H7O2NS + 8H20 = 4CH3COOH + 4CO2 + 4NH3 + 4H2S + 8H+ + 8e-
(5)Methanogenesis8H+ + 8e- + 3CH3COOH + CO2 = 4CH4 + 3CO2 + 2H2O (6)
Adding 5 and 6 give overall biomethanation chemistryg g y4C3H7O2NS + 6H20 = CH3COOH + 6CO2 + 4CH4 + 4NH3 + 4H2S
(7) Mineral weatheringCO2 + H2O = HCO3
- + H+ (8) Primary mineral + CO2 + H2O = M+n + n HCO3
- + soil/clay/sand (9)Primary mineral + CO2 + H2O M + n HCO3 + soil/clay/sand (9)
NitrificationNH3 + CO2 + 1.5O2 = Nitrosomonas + NO2
- + H2O + H+ (10)NO2
-+ CO2 + 0.5O2 = Nitrobacter + NO3- (11)
Denitrification4NO3
- + 2H2O + energy = 2N2 + 5O2 + 4OH - (12a)NO2
- + NH4+ = N2 + H2O + energy (12b)
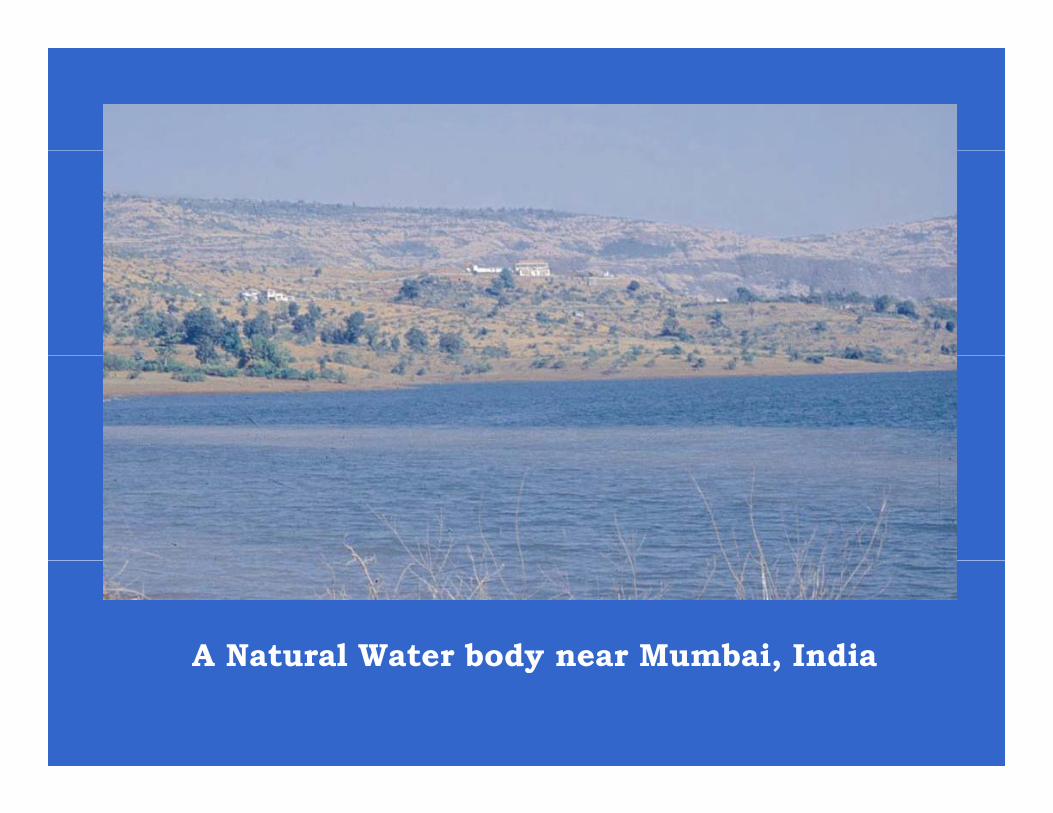
A Natural Water body near Mumbai, IndiaA Natural Water body near Mumbai, India
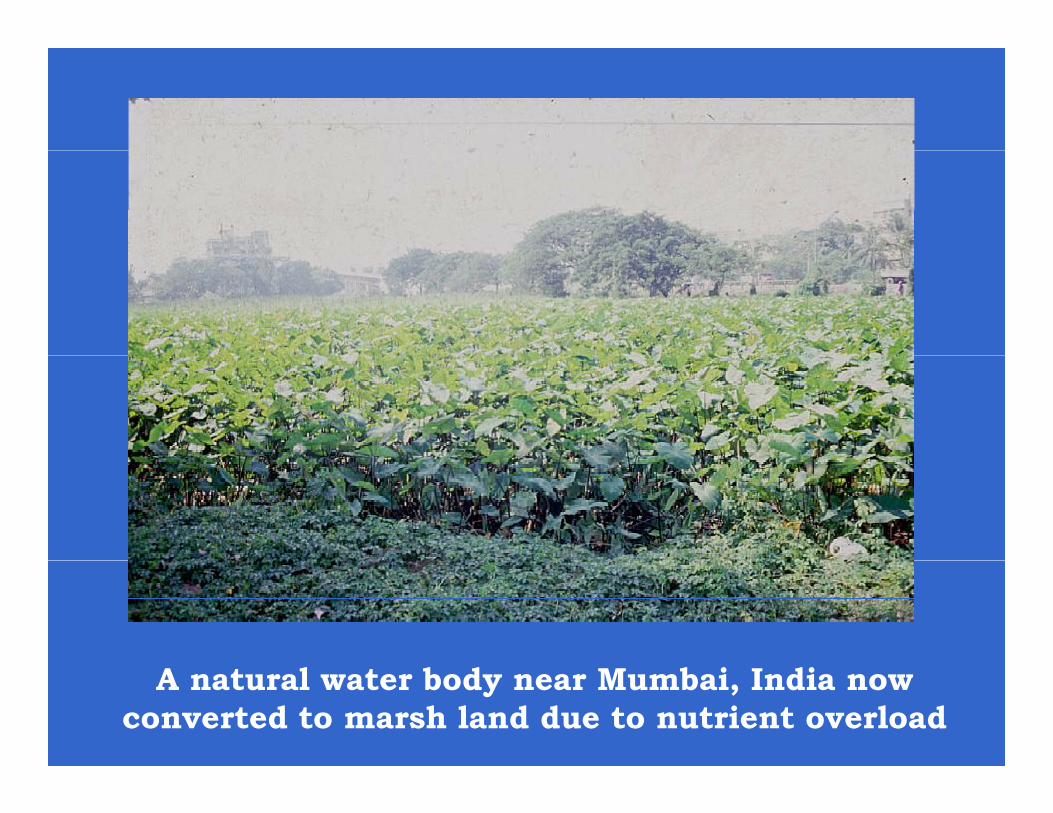
A natural water body near Mumbai, India now converted to marsh land due to nutrient overload
690
CO2 in the Atmosphere
750
Photosynthesis
6110
50
750
Respiration
(1-10 y)
Plants500
CO2 Dissolved 4,000
Live 1 5
Animals100-150 Live 1-5
Dead Organics in
(50 y) (2 y) (0.2 y)
Fossil Dead Organics
Soil50 - 6550 18
(1 y)
Fossil Fuels 4,000
Dead Organics Reserve in Soil
1,576Quantities in 1015g
(300 y)
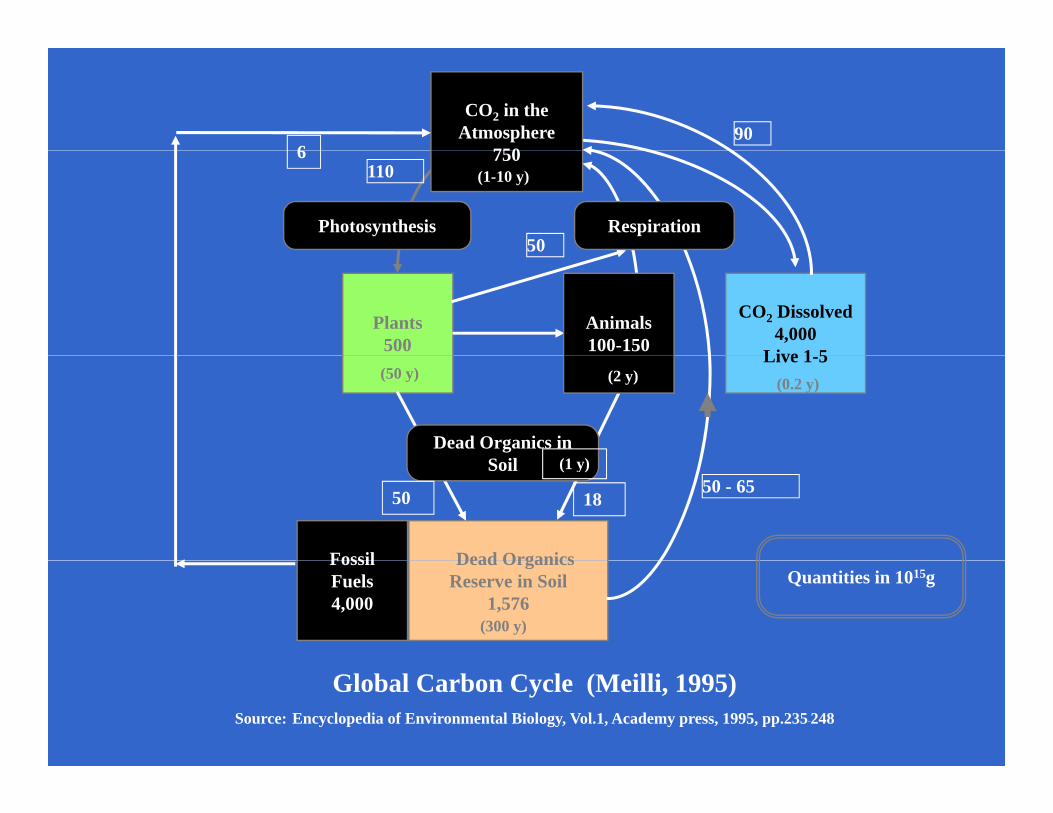
Global Carbon Cycle (Meilli, 1995)Source: Encyclopedia of Environmental Biology, Vol.1, Academy press, 1995, pp.235-248
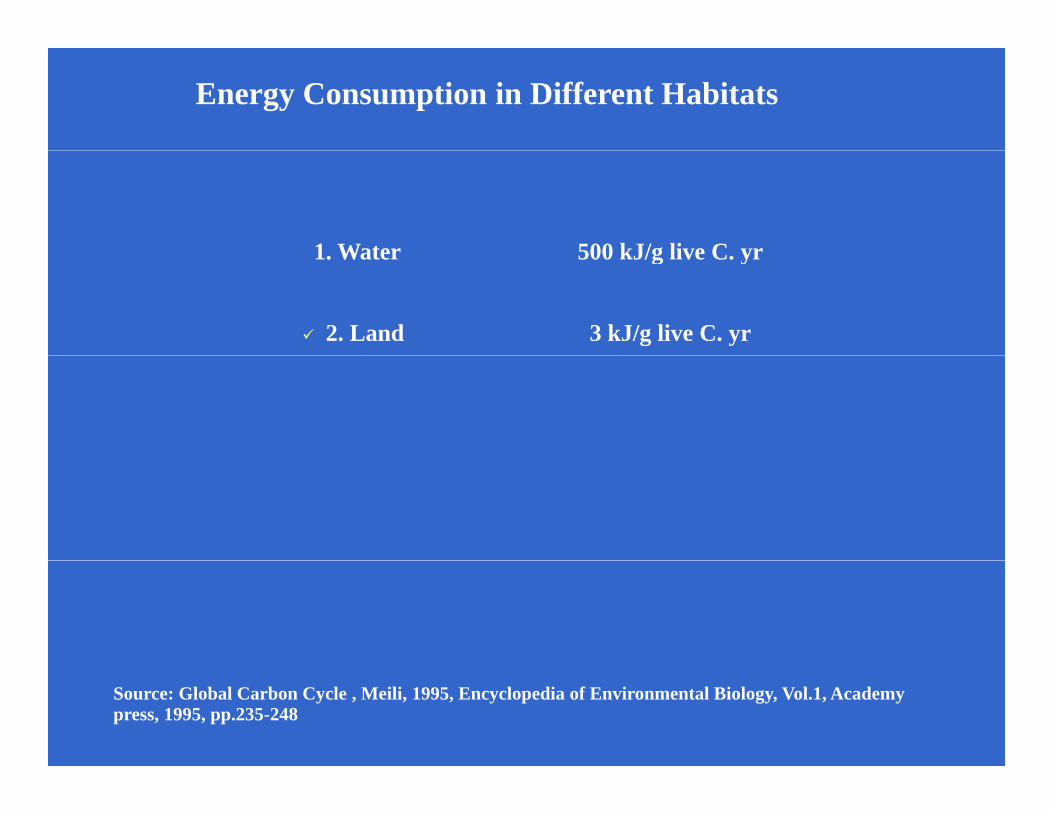
Energy Consumption in Different Habitats
1 Water 500 kJ/g live C yr1. Water 500 kJ/g live C. yr
2. Land 3 kJ/g live C. yr
Source: Global Carbon Cycle , Meili, 1995, Encyclopedia of Environmental Biology, Vol.1, Academy press, 1995, pp.235-248
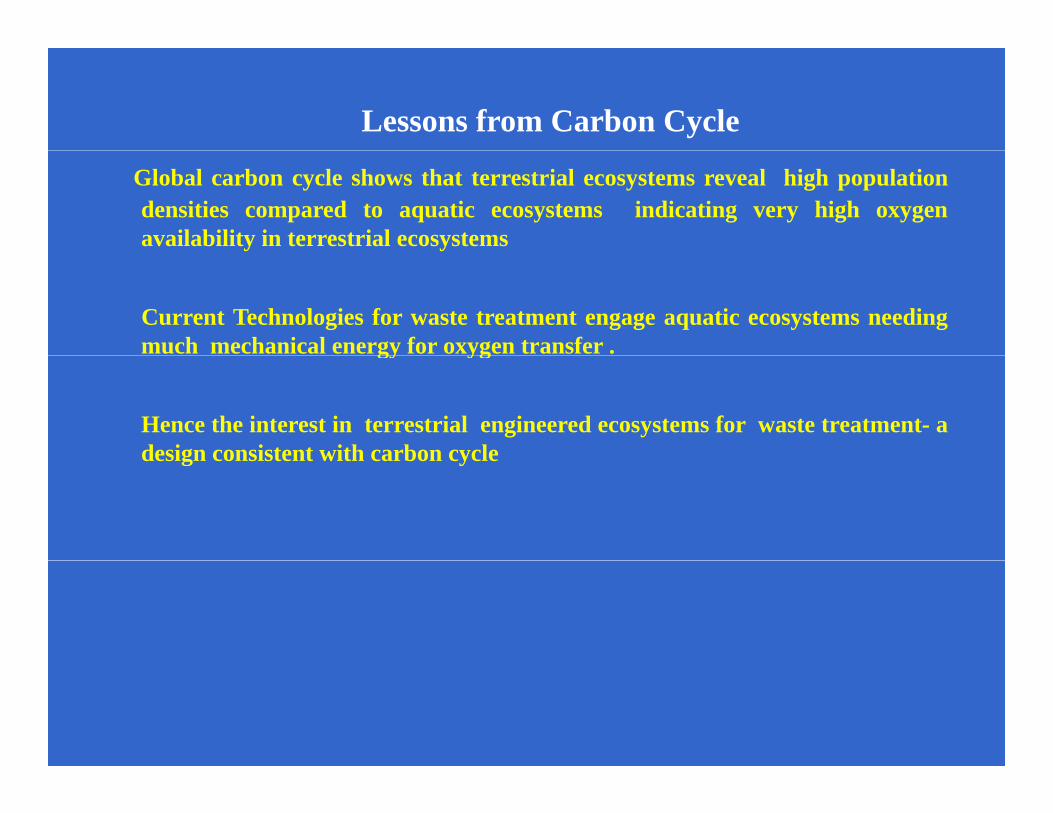
Lessons from Carbon Cycle
Global carbon cycle shows that terrestrial ecosystems reveal high populationdensities compared to aquatic ecosystems indicating very high oxygenavailability in terrestrial ecosystems
Current Technologies for waste treatment engage aquatic ecosystems needingmuch mechanical energy for oxygen transfer .gy yg
Hence the interest in terrestrial engineered ecosystems for waste treatment- adesign consistent with carbon cycledesign consistent with carbon cycle
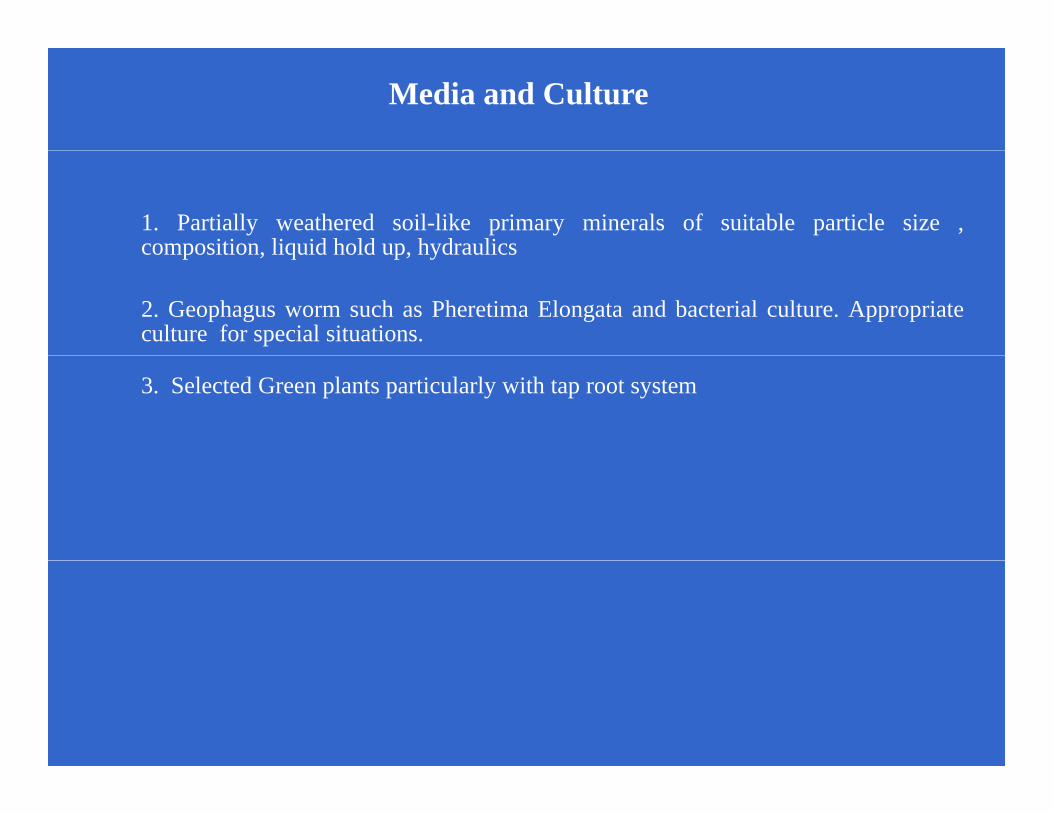
Media and Culture
1. Partially weathered soil-like primary minerals of suitable particle size ,composition, liquid hold up, hydraulicscomposition, liquid hold up, hydraulics
2. Geophagus worm such as Pheretima Elongata and bacterial culture. Appropriateculture for special situations.
3. Selected Green plants particularly with tap root system
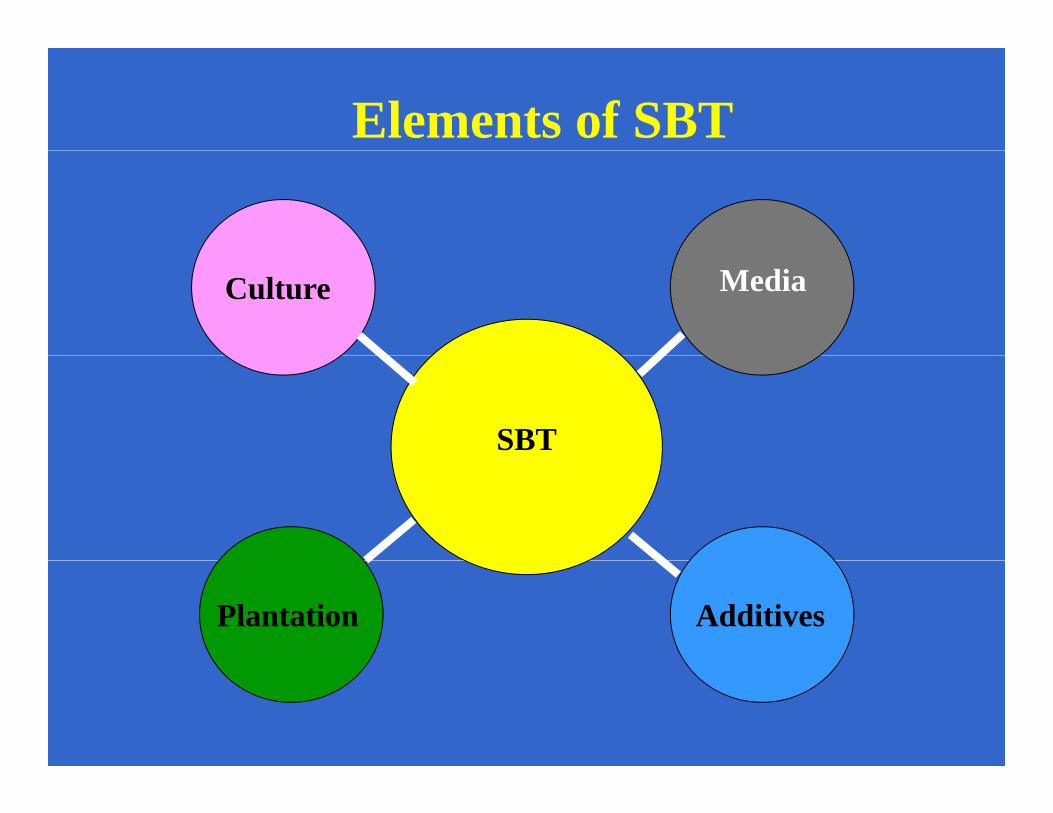
Elements of SBT
MediaCulture
SBT
AdditivesPlantation
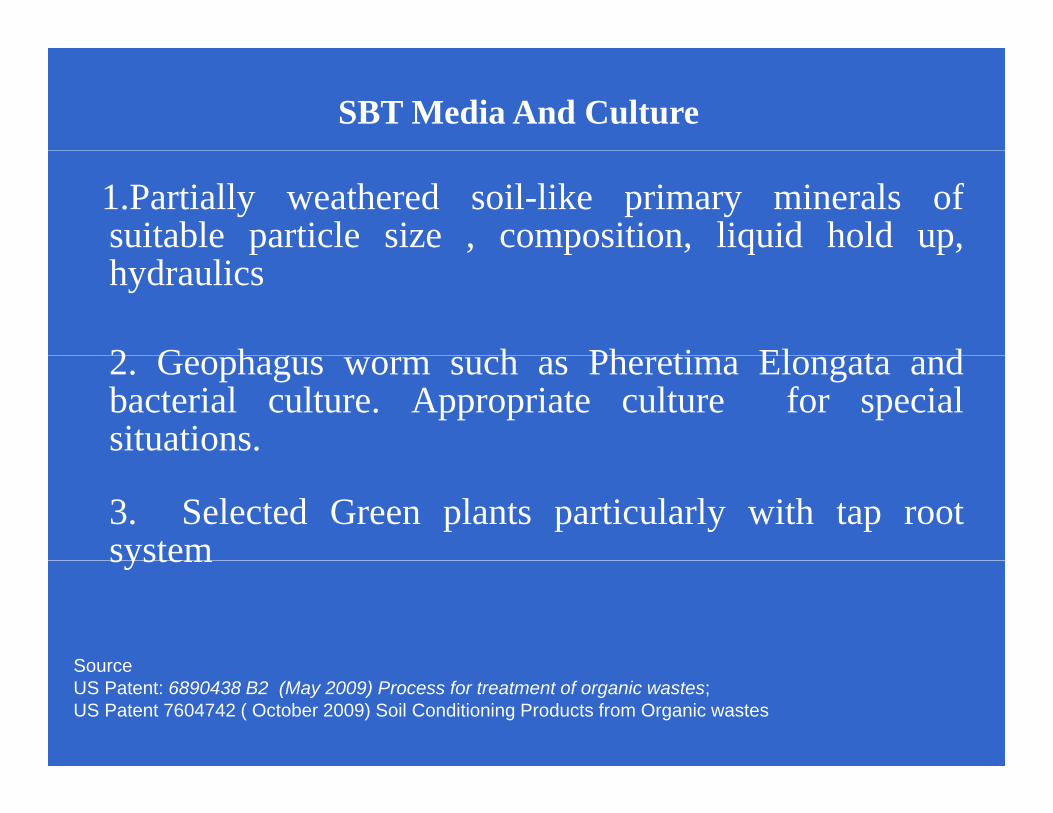
SBT Media And Culture
1.Partially weathered soil-like primary minerals ofsuitable particle size , composition, liquid hold up,p , p , q p,hydraulics
2 G h h Ph ti El t d2. Geophagus worm such as Pheretima Elongata andbacterial culture. Appropriate culture for specialsituations.
3. Selected Green plants particularly with tap rootsystemsystem
SourceSourceUS Patent: 6890438 B2 (May 2009) Process for treatment of organic wastes;US Patent 7604742 ( October 2009) Soil Conditioning Products from Organic wastes
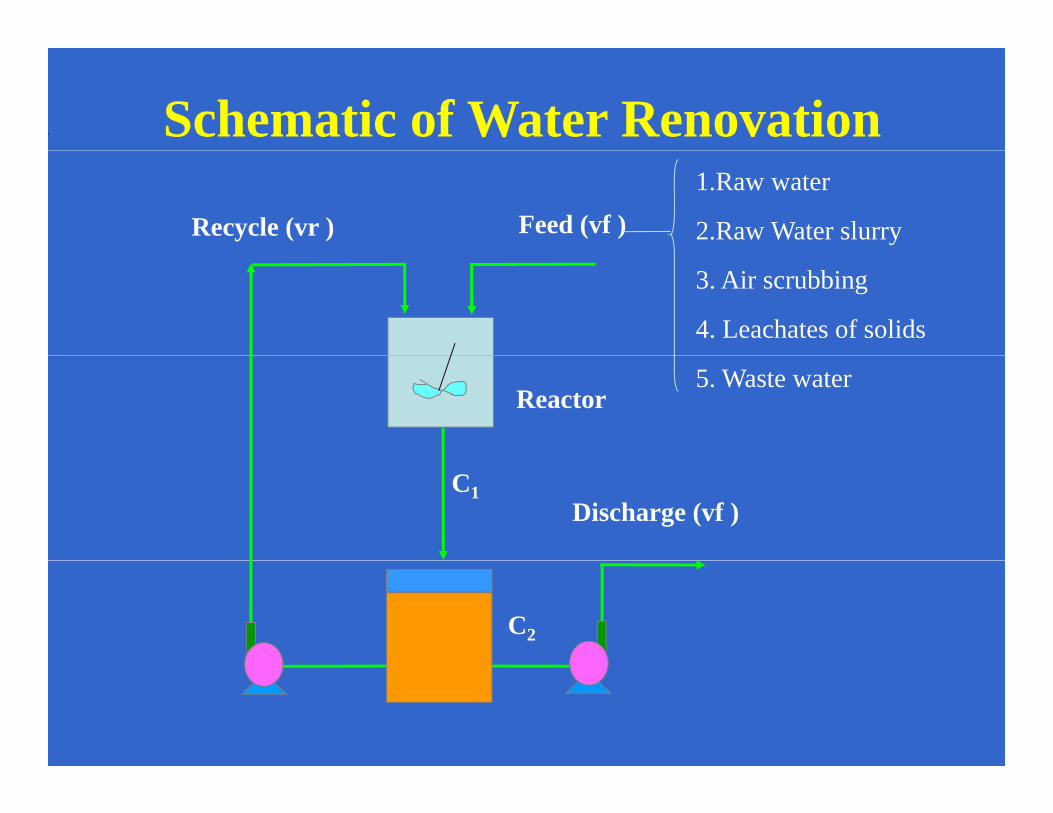
Schematic of Water Renovation
Feed (vf ) Recycle (vr ) 1.Raw water
2.Raw Water slurry
3. Air scrubbing
4. Leachates of solids
Reactor5. Waste water
Discharge (vf ) C1
C2
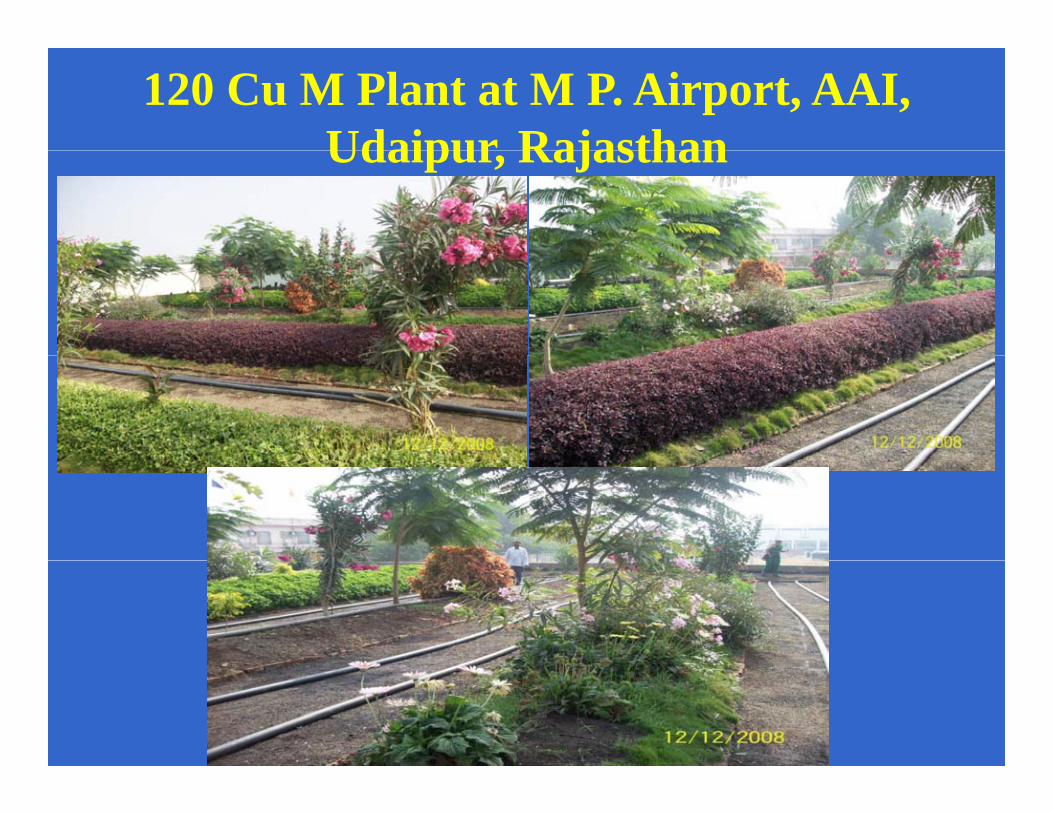
120 Cu M Plant at M P. Airport, AAI, Udaipur RajasthanUdaipur, Rajasthan
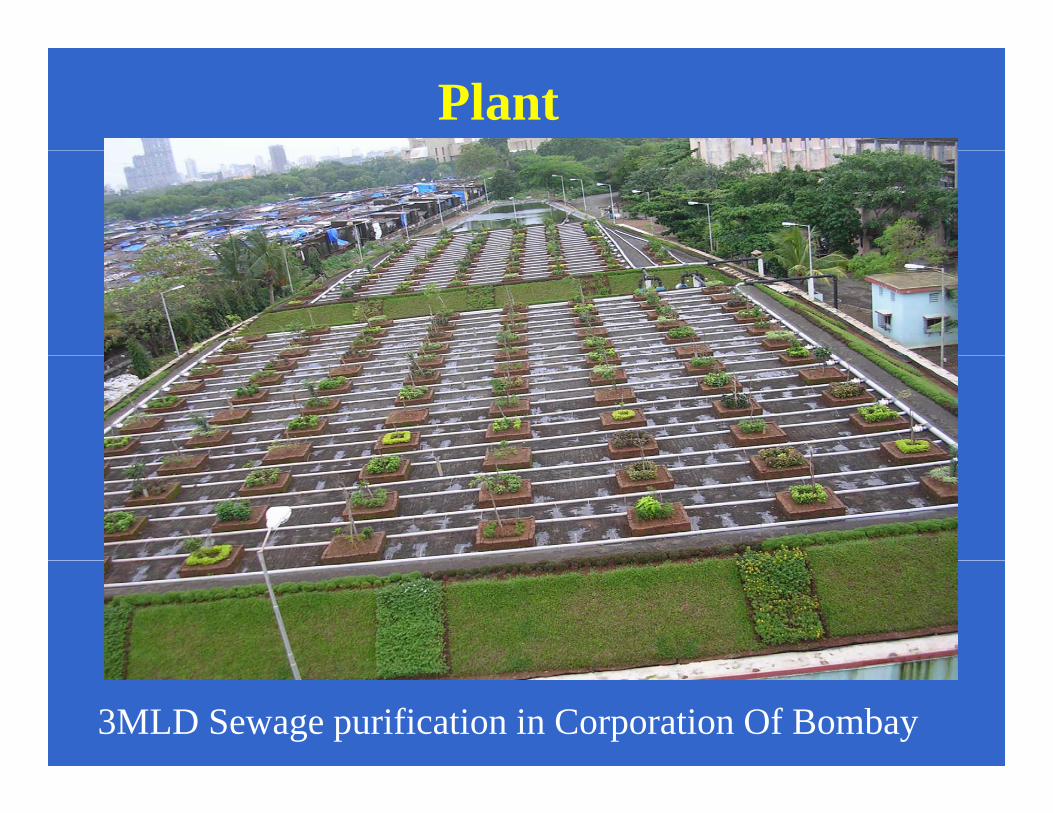
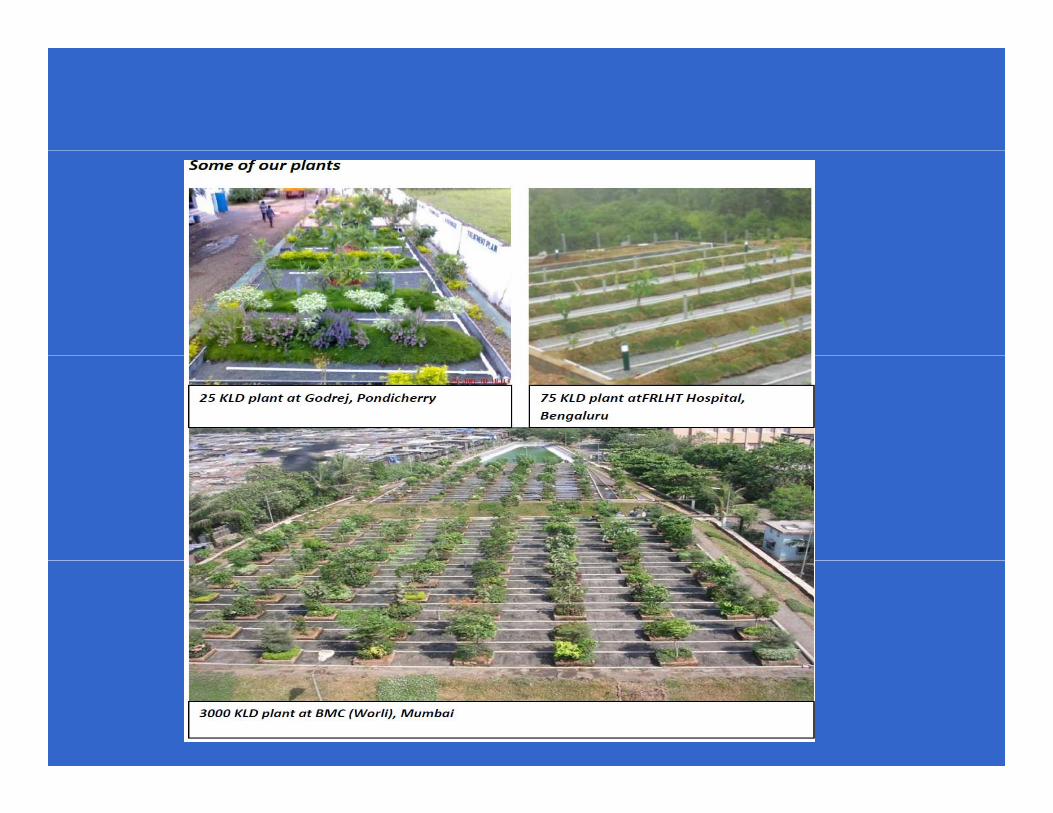
Plant
3MLD Sewage purification in Corporation Of Bombay
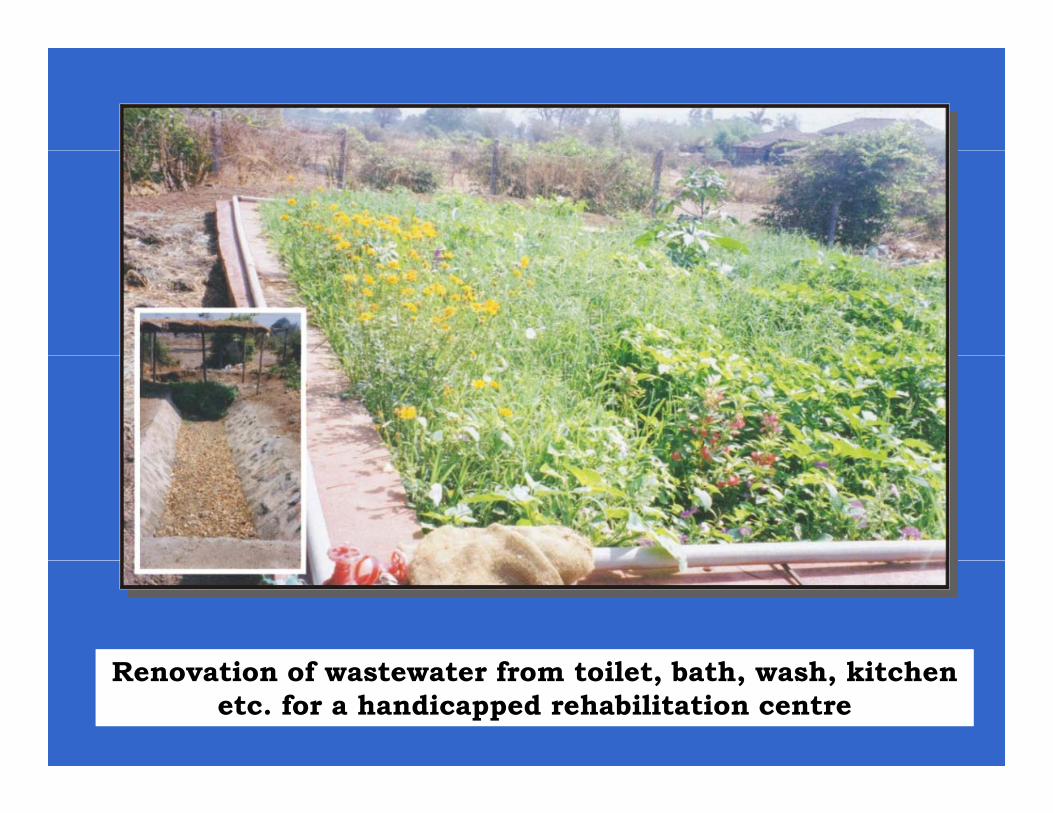
R ti f t t f t il t b th h kit h R ti f t t f t il t b th h kit h Renovation of wastewater from toilet, bath, wash, kitchen etc. for a handicapped rehabilitation centre
Renovation of wastewater from toilet, bath, wash, kitchen etc. for a handicapped rehabilitation centre
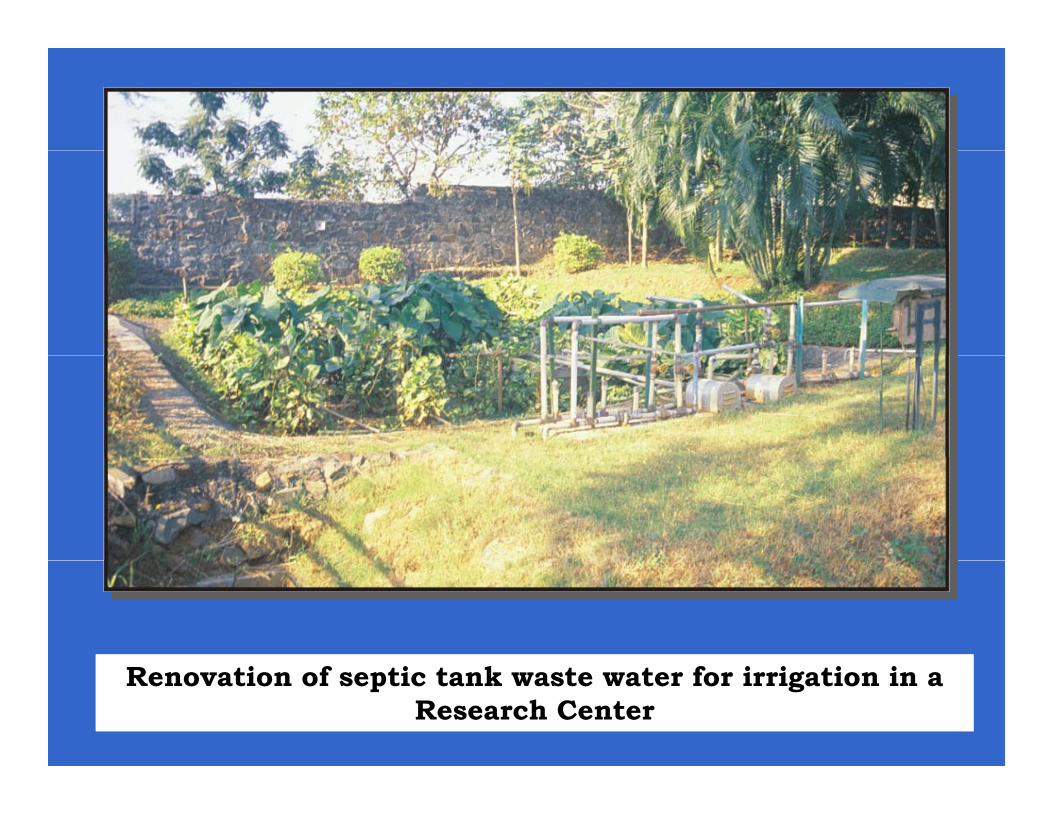
Renovation of septic tank waste water for irrigation in a Research Center
Renovation of septic tank waste water for irrigation in a Research Center
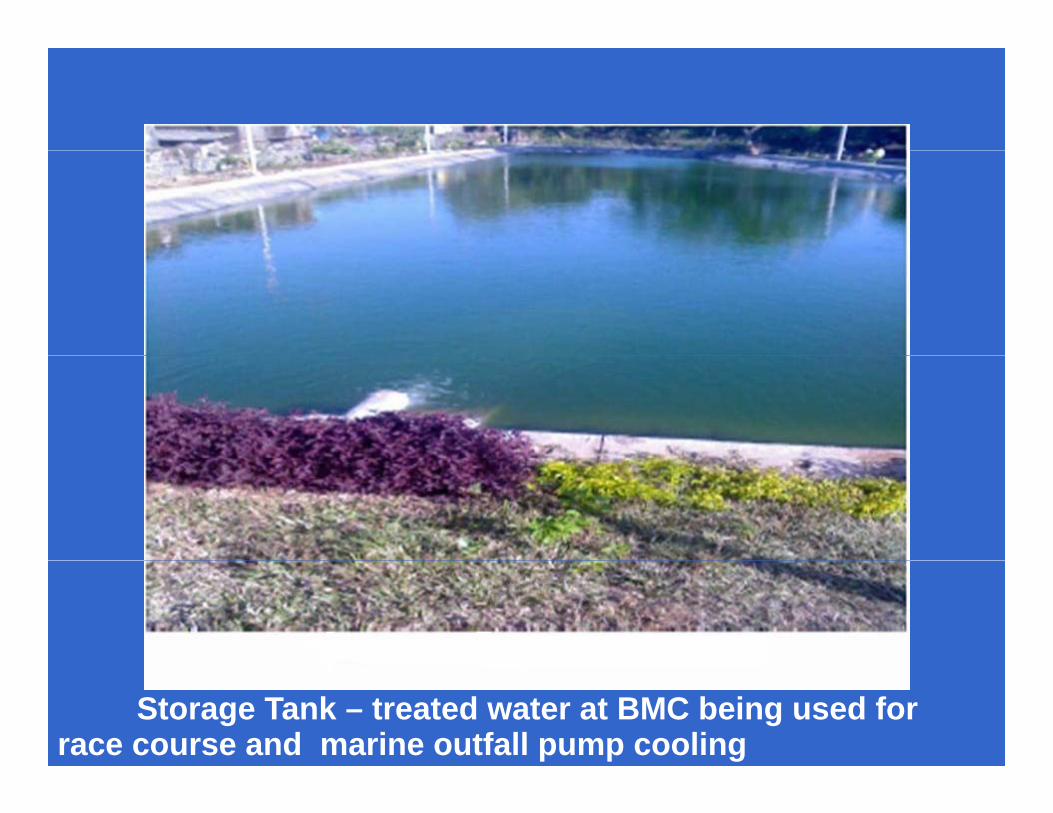
Storage Tank – treated water at BMC being used for race course and marine outfall pump cooling
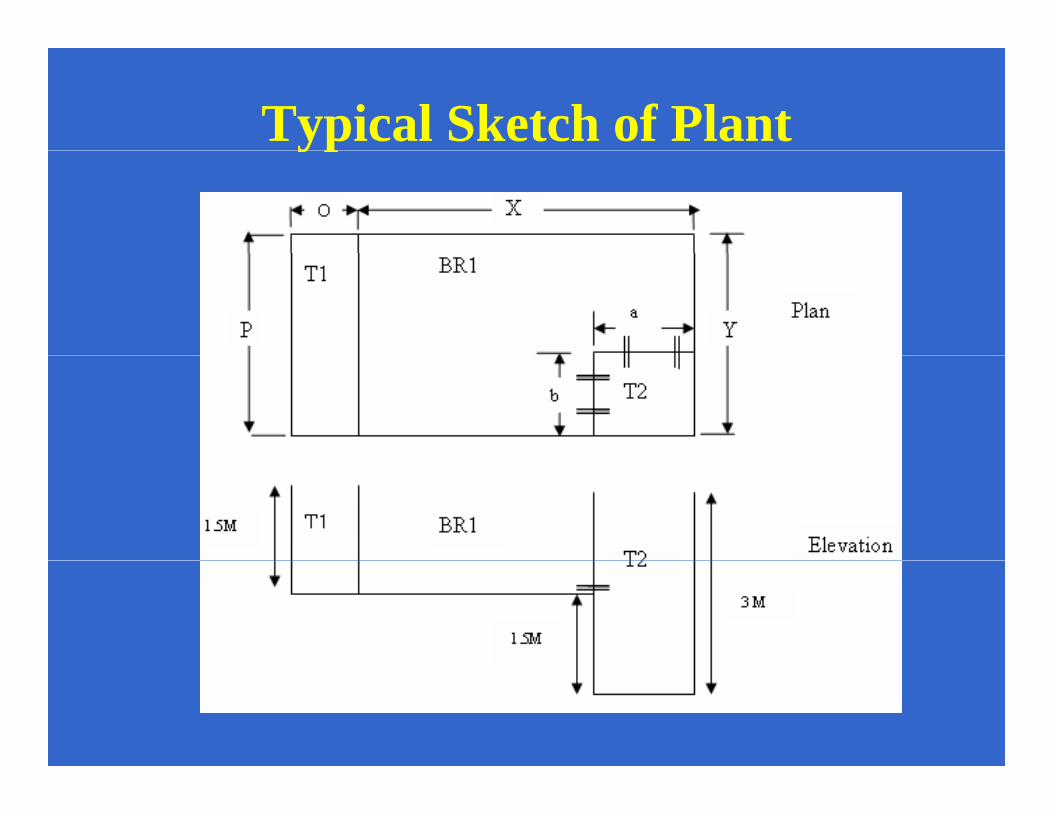
Typical Sketch of Plantyp
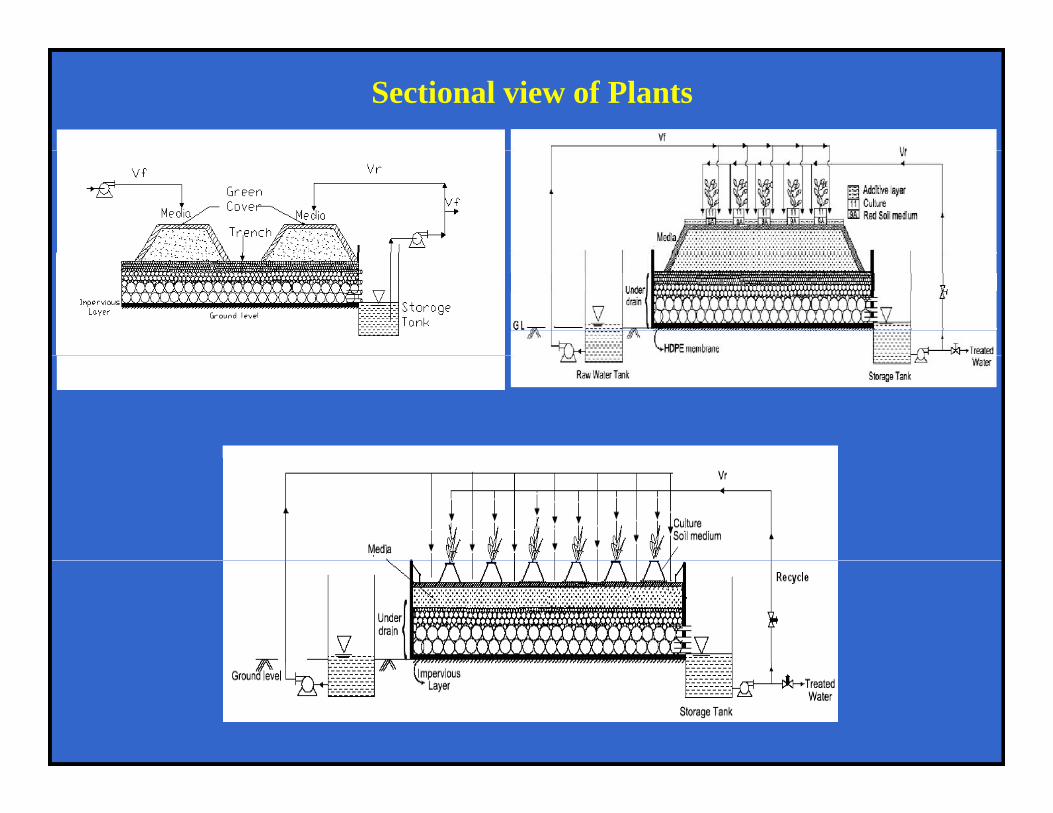
Sectional view of Plants
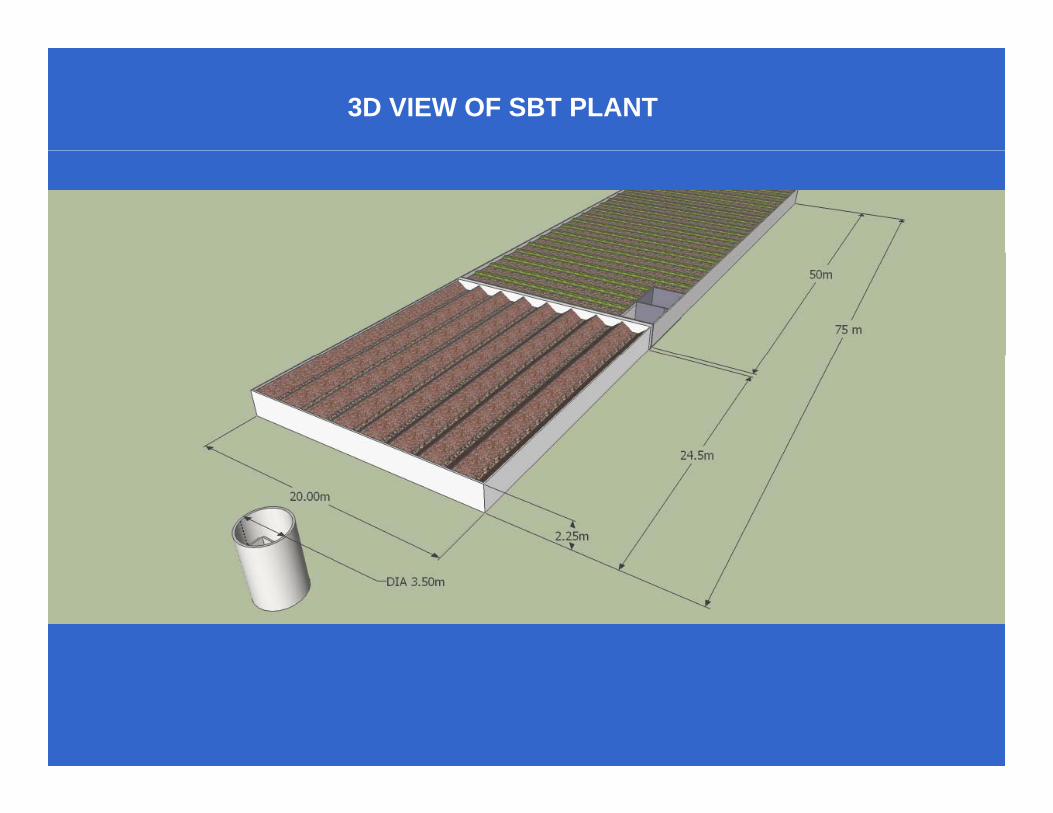
3D VIEW OF SBT PLANT
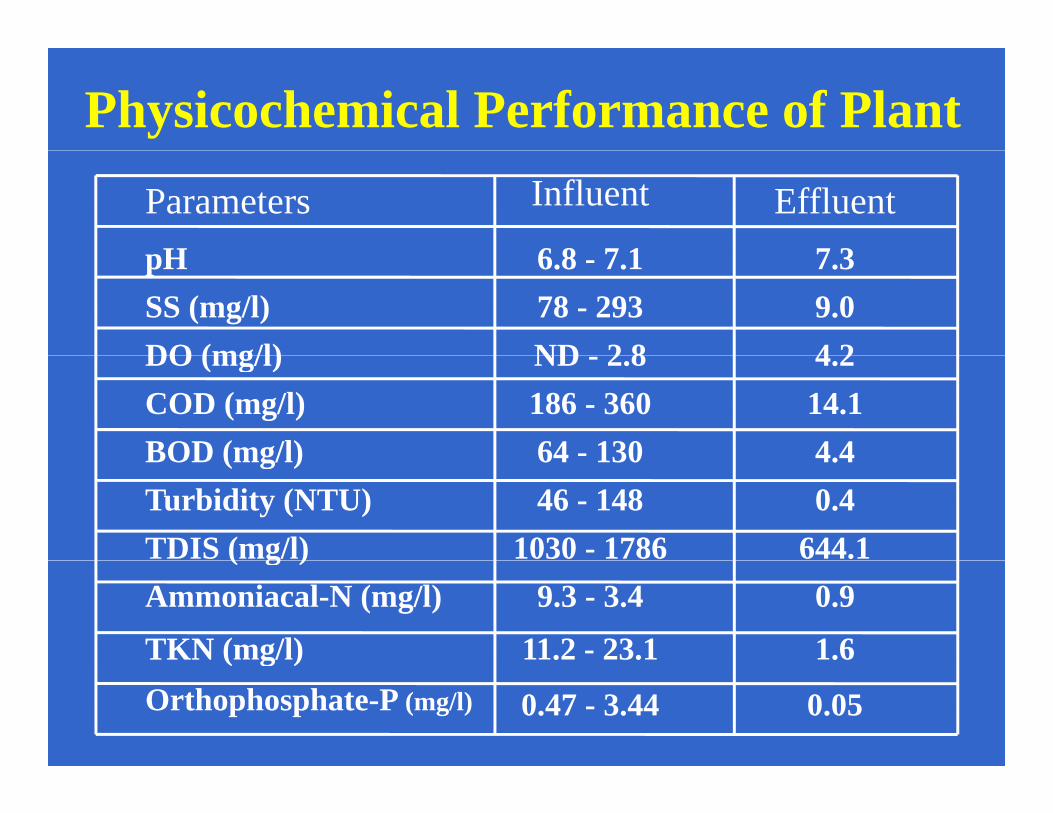
Physicochemical Performance of PlantParameters Influent Effluent
H 6 8 7 1 7 3pH 6.8 - 7.1 7.3SS (mg/l) 78 - 293 9.0DO (mg/l) ND 2 8 4 2DO (mg/l) ND - 2.8 4.2COD (mg/l) 186 - 360 14.1BOD (mg/l) 64 - 130 4.4BOD (mg/l) 64 130 4.4Turbidity (NTU) 46 - 148 0.4TDIS (mg/l) 1030 - 1786 644.1( g )Ammoniacal-N (mg/l) 9.3 - 3.4 0.9
TKN (mg/l) 11.2 - 23.1 1.6( g )Orthophosphate-P (mg/l) 0.47 - 3.44 0.05
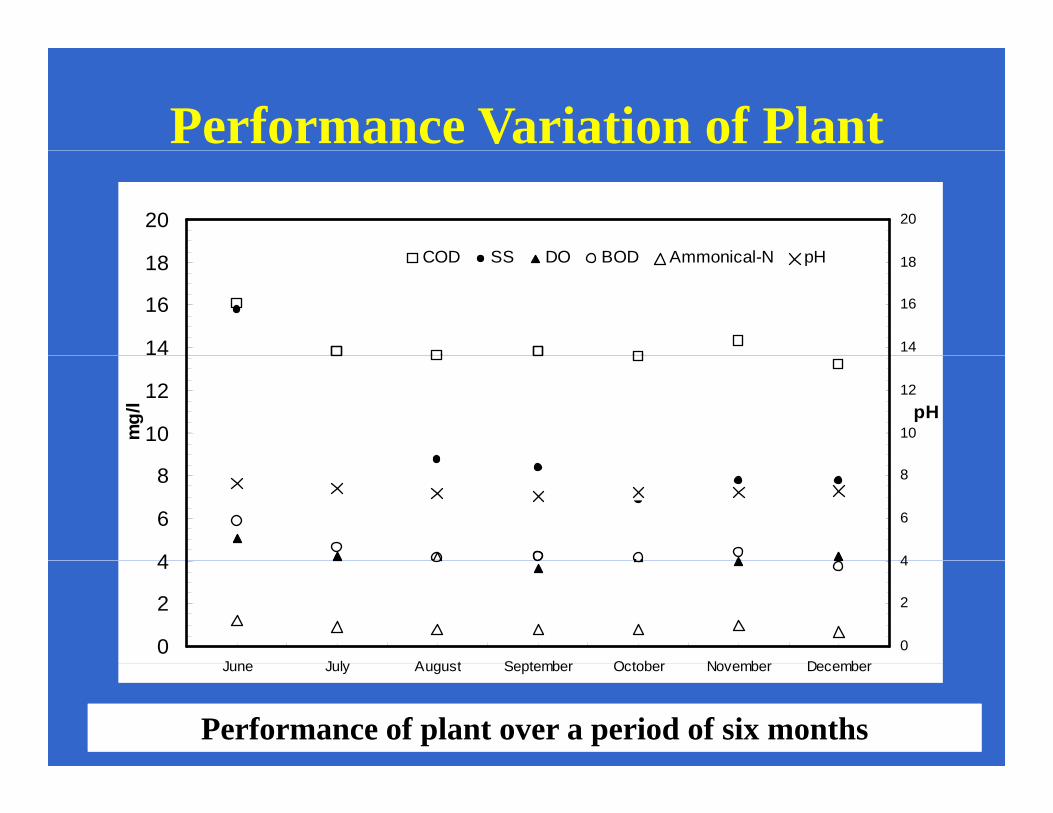
Performance Variation of Plant20 20
COD SS DO BOD A i l N H
14
16
18
14
16
18COD SS DO BOD Ammonical-N pH
10
12
mg/
l
10
12pH
4
6
8
4
6
8
0
2
4
J J l A t S t b O t b N b D b0
2
4
Performance of plant over a period of six monthsPerformance of plant over a period of six months
June July August September October November December
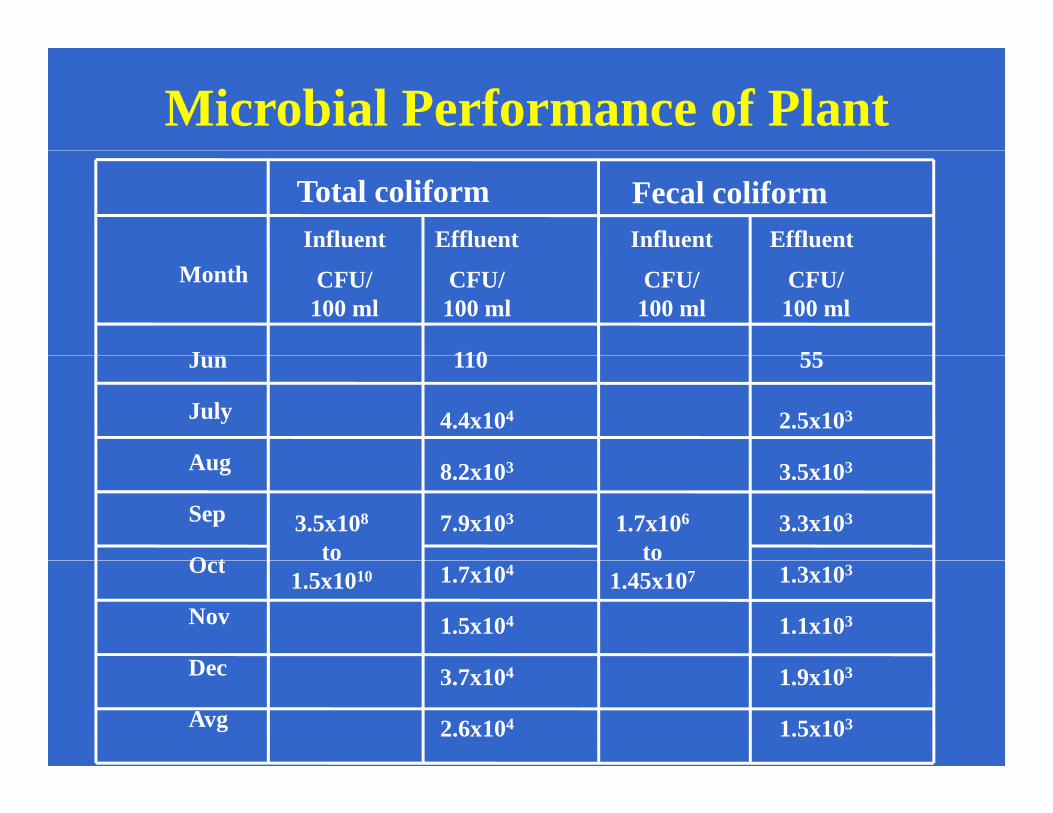
Microbial Performance of Plant
Influent Effluent Influent Effluent
Total coliform Fecal coliform
Month CFU/100 ml
CFU/100 ml
CFU/100 ml
CFU/100 ml
J 110 55Jun 110 55
July 4.4x10⁴ 2.5x10³
A
3.5x10⁸
to1.7x106
to
Aug 8.2x10³ 3.5x10³
Sep 7.9x10³ 3.3x10³
O t1.5x1010 1.45x10⁷Oct 1.7x10⁴ 1.3x10³
Nov 1.5x10⁴ 1.1x10³
DDec 3.7x10⁴ 1.9x10³
Avg 2.6x10⁴ 1.5x10³
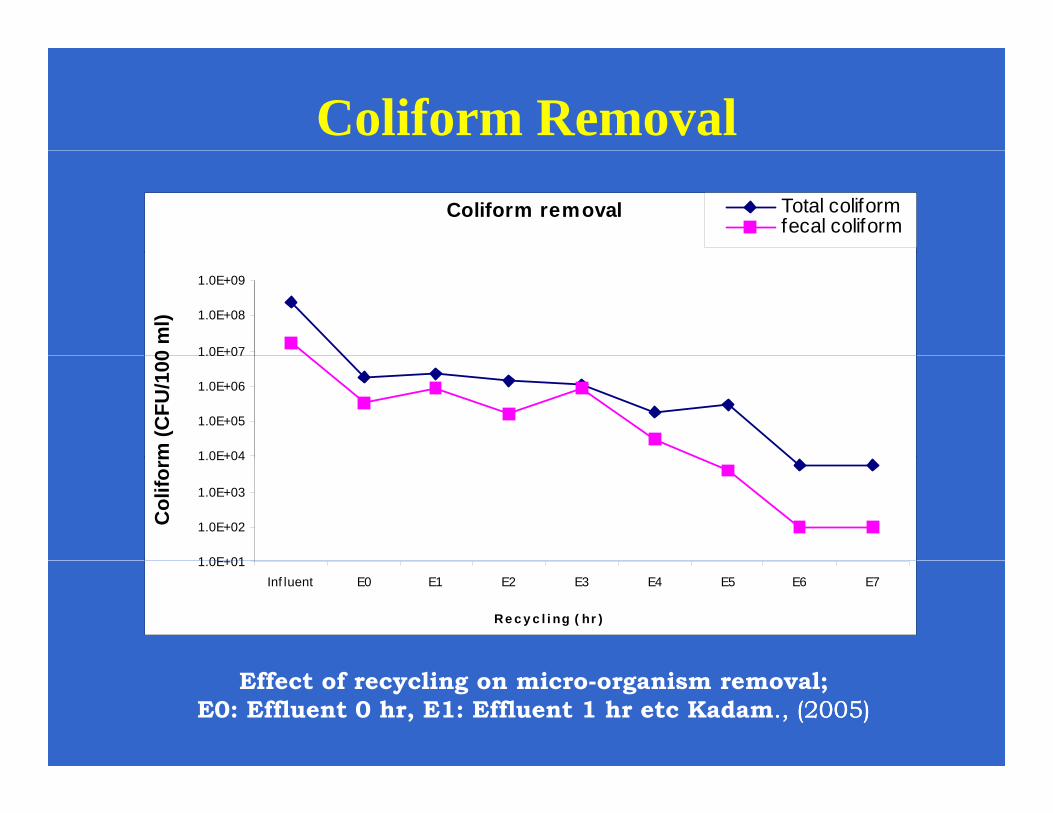
Coliform RemovalColiform removal Total coliform
fecal coliform
1.0E+07
1.0E+08
1.0E+09
0 m
l)
1 0E+04
1.0E+05
1.0E+06
1.0E 07
m (C
FU/1
00
1 0E+01
1.0E+02
1.0E+03
1.0E+04
Col
iform
1.0E+01Inf luent E0 E1 E2 E3 E4 E5 E6 E7
Re c y c l i ng ( hr )
Effect of recycling on micro-organism removal; E0: Effluent 0 hr, E1: Effluent 1 hr etc Kadam., (., (20052005))
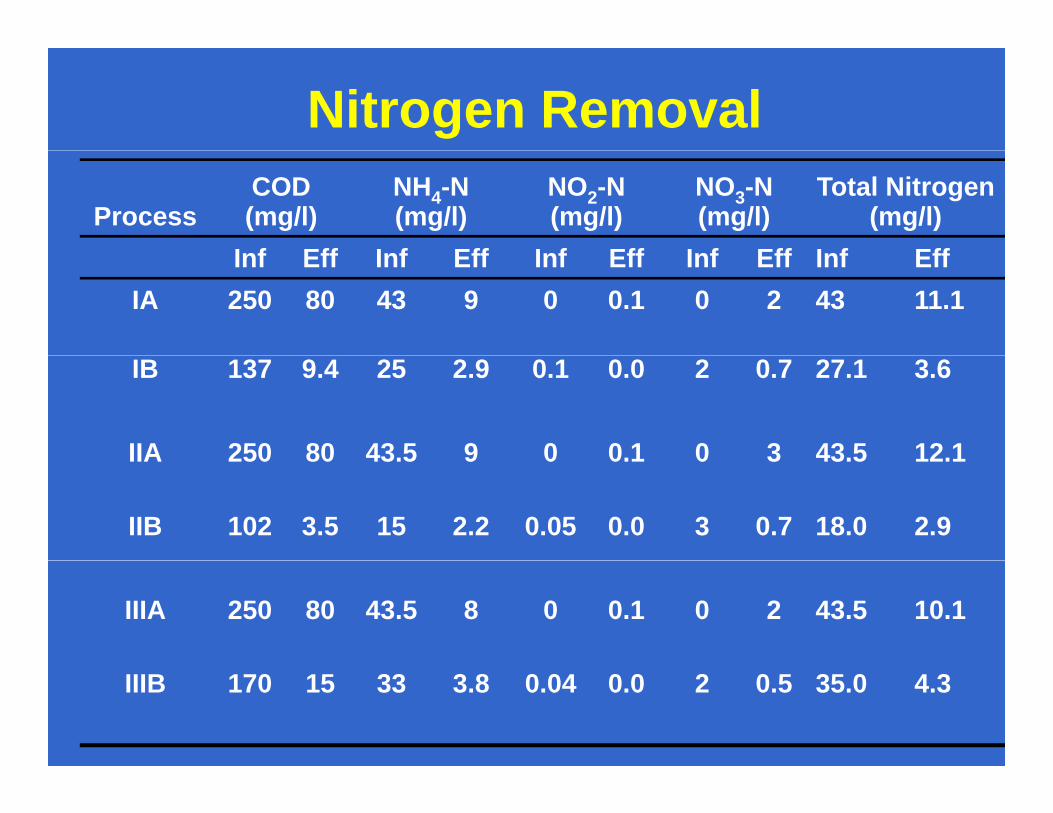
Nitrogen Removal
ProcessCOD (mg/l)
NH4-N(mg/l)
NO2-N (mg/l)
NO3-N (mg/l)
Total Nitrogen (mg/l)
I f Eff I f Eff I f Eff I f Eff I f EffInf Eff Inf Eff Inf Eff Inf Eff Inf EffIA 250 80 43 9 0 0.1 0 2 43 11.1
IB 137 9.4 25 2.9 0.1 0.0 2 0.7 27.1 3.6
IIA 250 80 43.5 9 0 0.1 0 3 43.5 12.1IIA 250 80 43.5 9 0 0.1 0 3 43.5 12.1
IIB 102 3.5 15 2.2 0.05 0.0 3 0.7 18.0 2.9
IIIA 250 80 43.5 8 0 0.1 0 2 43.5 10.1
IIIB 170 15 33 3.8 0.04 0.0 2 0.5 35.0 4.3
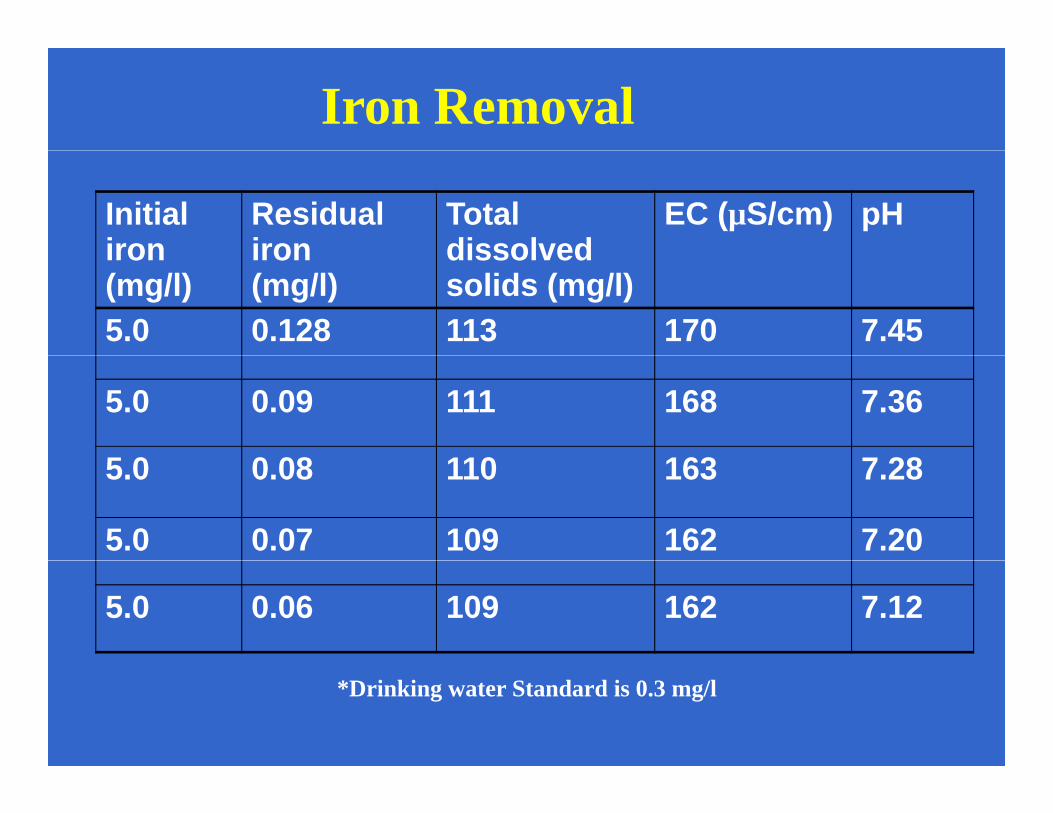
Iron Removal
Initialiron
Residualiron
Totaldissolved
EC (µS/cm) pHiron(mg/l)
iron(mg/l)
dissolvedsolids (mg/l)
5.0 0.128 113 170 7.45
5.0 0.09 111 168 7.36
5 0 0 08 110 163 7 285.0 0.08 110 163 7.28
5.0 0.07 109 162 7.20
5.0 0.06 109 162 7.12
*Drinking water Standard is 0.3 mg/l
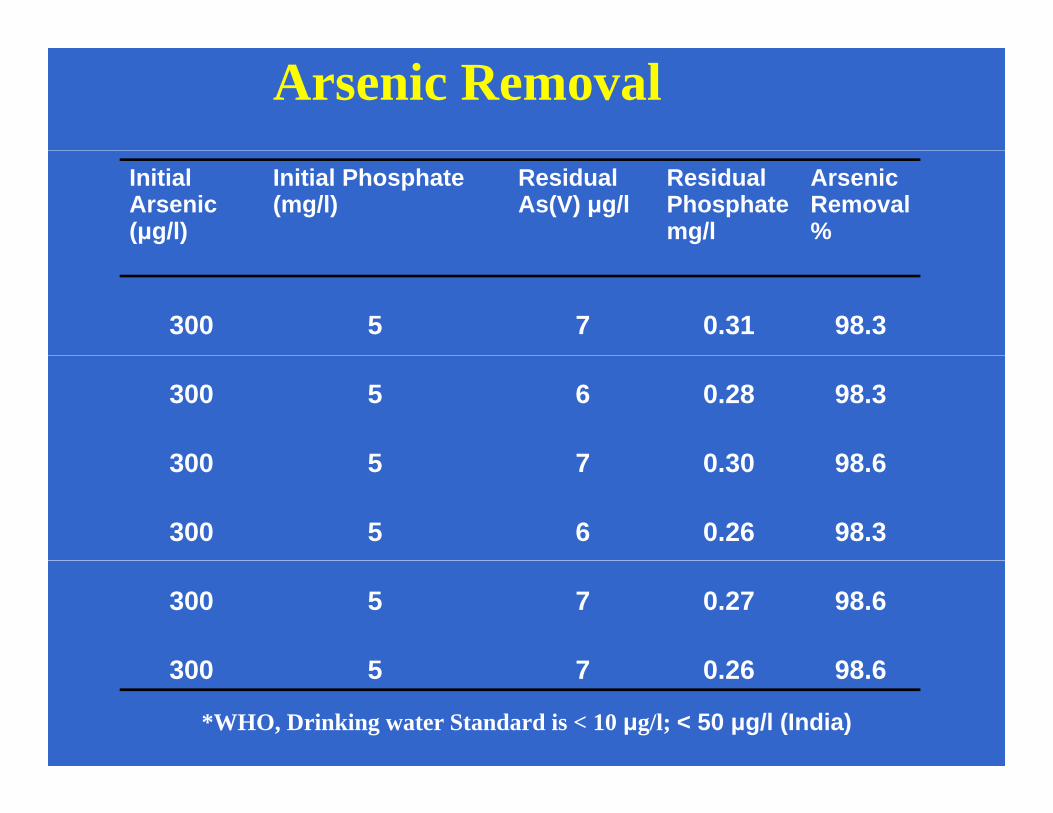
Arsenic Removal Initial Arsenic (μg/l)
Initial Phosphate (mg/l)
Residual As(V) μg/l
Residual Phosphate mg/l
Arsenic Removal%
300 5 7 0.31 98.3
300 5 6 0.28 98.3
300 5 7 0 30 98 6300 5 7 0.30 98.6
300 5 6 0.26 98.3
300 5 7 0.27 98.6
300 5 7 0 26 98 6300 5 7 0.26 98.6
*WHO, Drinking water Standard is < 10 μg/l; < 50 μg/l (India)

ABOUT VISION EARTHCARE
A company in SINESINE is Innovation Centre of IITB
SINE Was Set Up 2005SINE i S d b GOISINE is Supported by GOI

Other Offerings ?Other Offerings ?
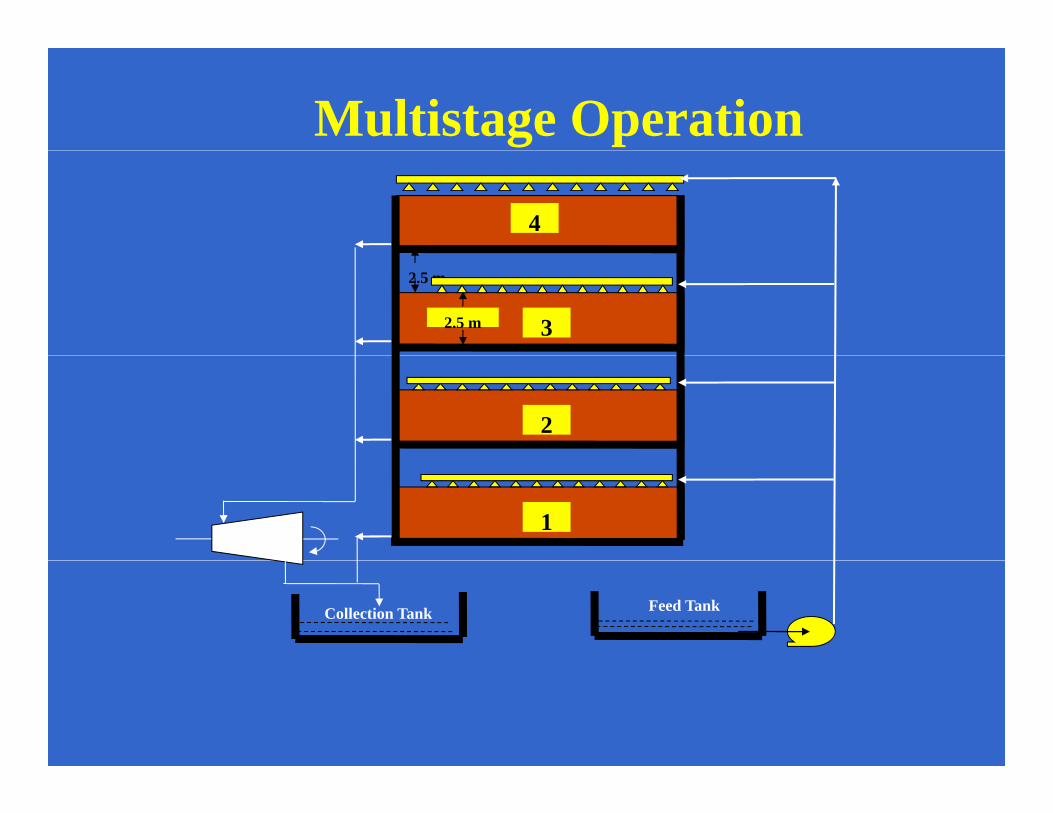
Multistage Operation
4
2.5 m
2.5 m
3
2
1
Feed TankCollection Tank
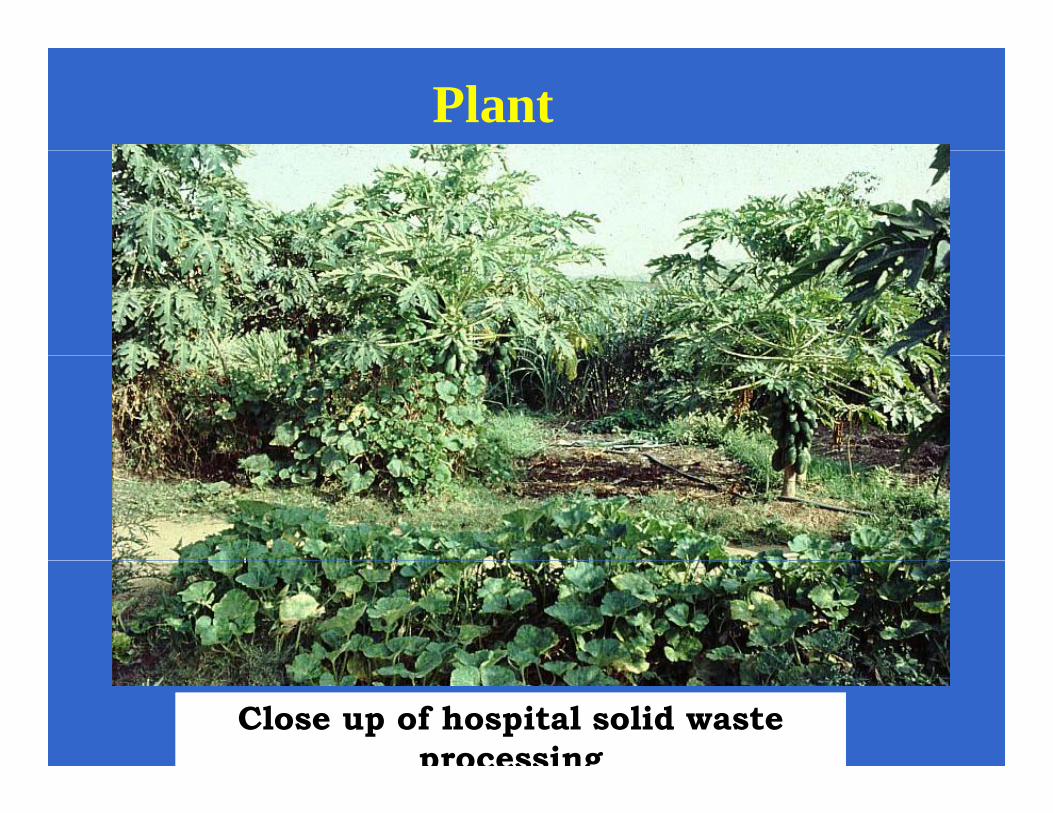
Plant
Close up of hospital solid waste processing
Close up of hospital solid waste processing
ROAD2
100 m
10
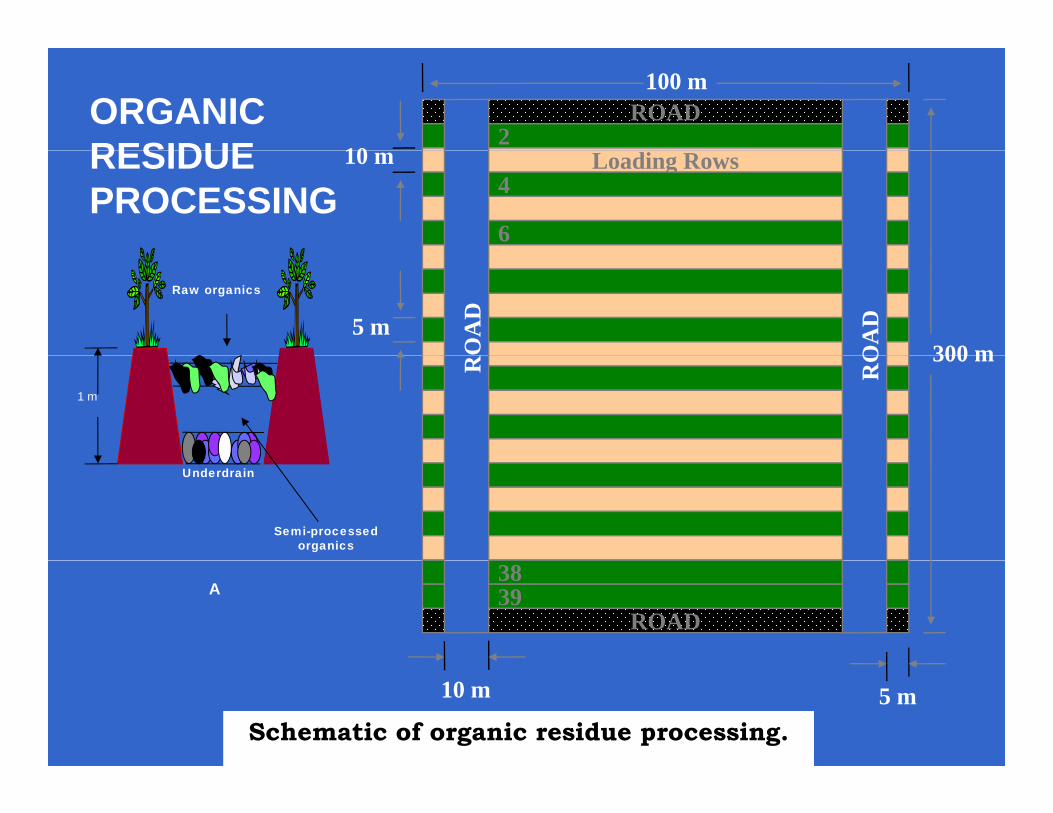
ORGANIC RESIDUE Loading Rows
4
6
10 mRESIDUEPROCESSING
300 mRO
AD
OA
D5 m
Raw organics
300 mR RO
1 m
Underdrain
Semi-processed organics
3839
ROADA
Schematic of organic residue processing. Schematic of organic residue processing. 10 m 5 m
Sewage/Waste water
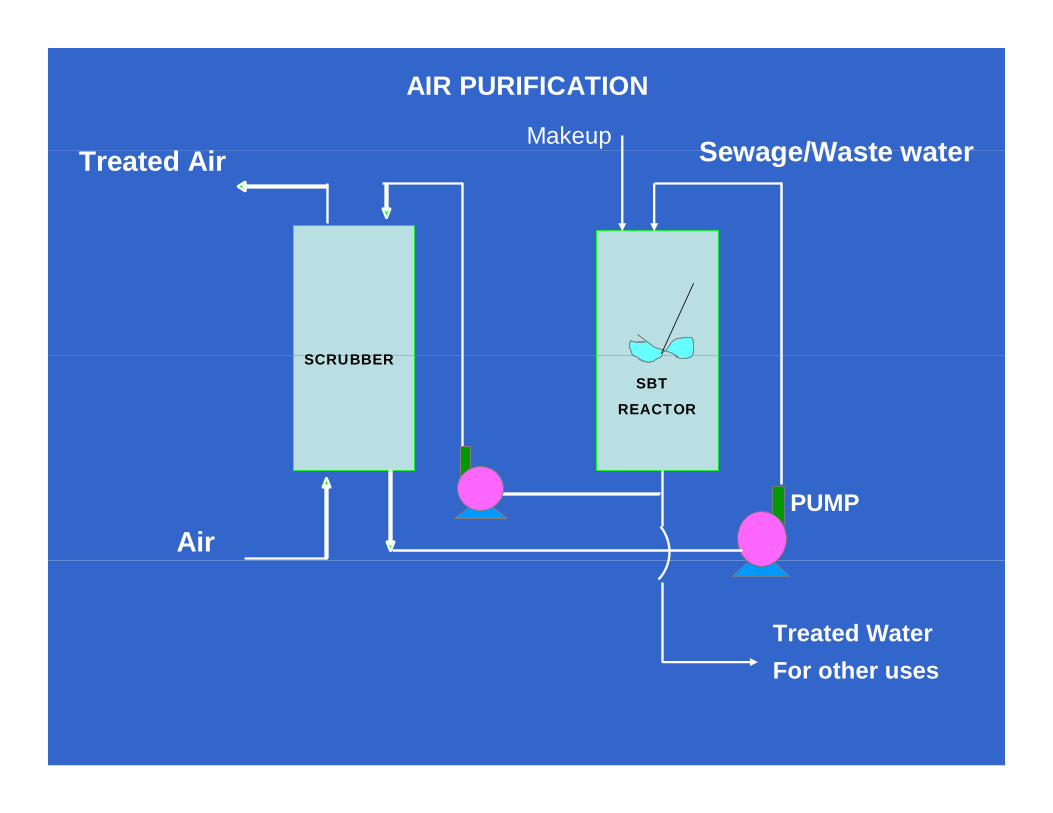
AIR PURIFICATION
MakeupTreated Air Sewage/Waste water
SCRUBBERSCRUBBERSBT
REACTOR
AirPUMP
Treated WaterF thFor other uses
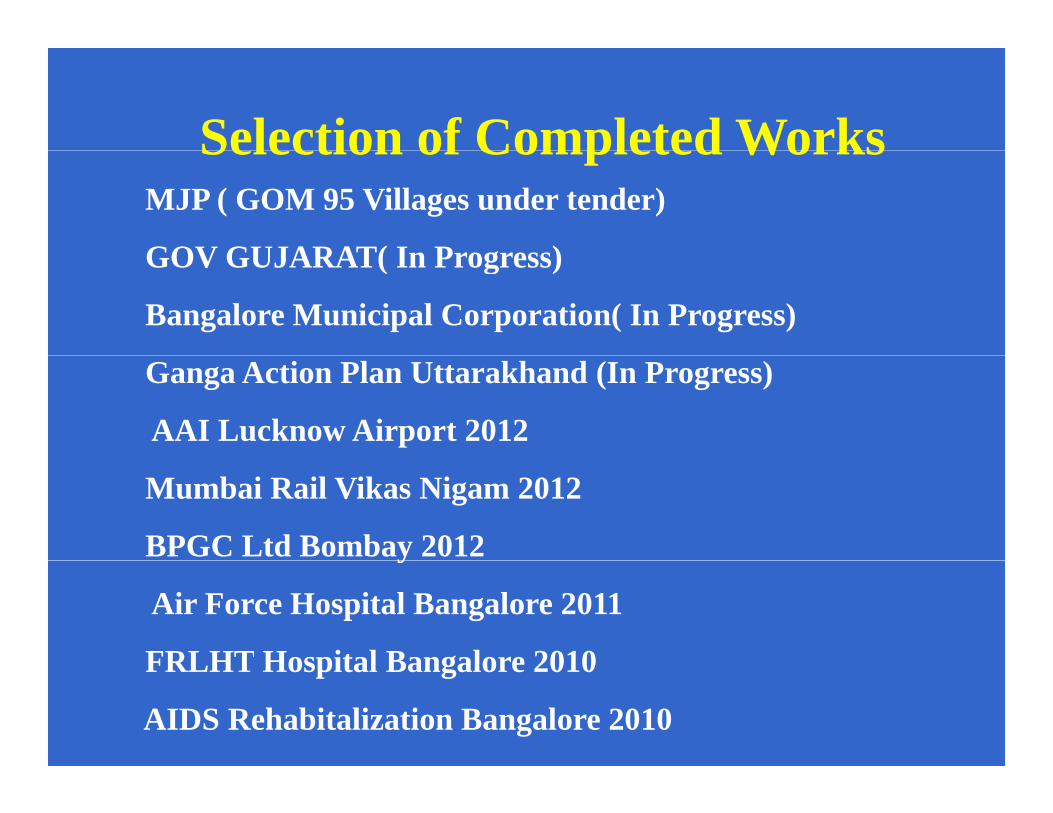
Selection of Completed WorksSelection of Completed WorksMJP ( GOM 95 Villages under tender)
GOV GUJARAT( In Progress)GOV GUJARAT( In Progress)
Bangalore Municipal Corporation( In Progress)
Ganga Action Plan Uttarakhand (In Progress)
AAI Lucknow Airport 2012
Mumbai Rail Vikas Nigam 2012
BPGC Ltd Bombay 2012y
Air Force Hospital Bangalore 2011
FRLHT Hospital Bangalore 2010FRLHT Hospital Bangalore 2010
AIDS Rehabitalization Bangalore 2010
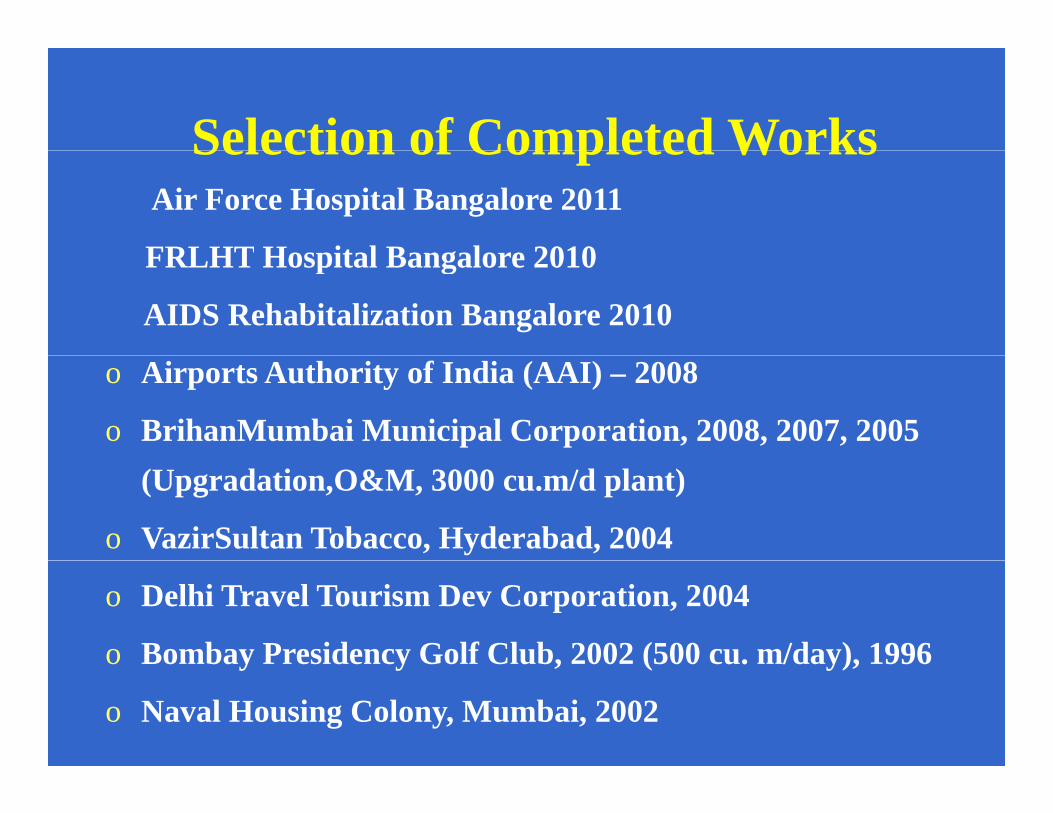
Selection of Completed WorksSelection of Completed WorksAir Force Hospital Bangalore 2011
FRLHT Hospital Bangalore 2010FRLHT Hospital Bangalore 2010
AIDS Rehabitalization Bangalore 2010
o Airports Authority of India (AAI) – 2008
o BrihanMumbai Municipal Corporation, 2008, 2007, 2005 (Upgradation,O&M, 3000 cu.m/d plant)
o VazirSultan Tobacco, Hyderabad, 2004
o Delhi Travel Tourism Dev Corporation, 2004
o Bombay Presidency Golf Club, 2002 (500 cu. m/day), 1996o Bombay Presidency Golf Club, 2002 (500 cu. m/day), 1996
o Naval Housing Colony, Mumbai, 2002
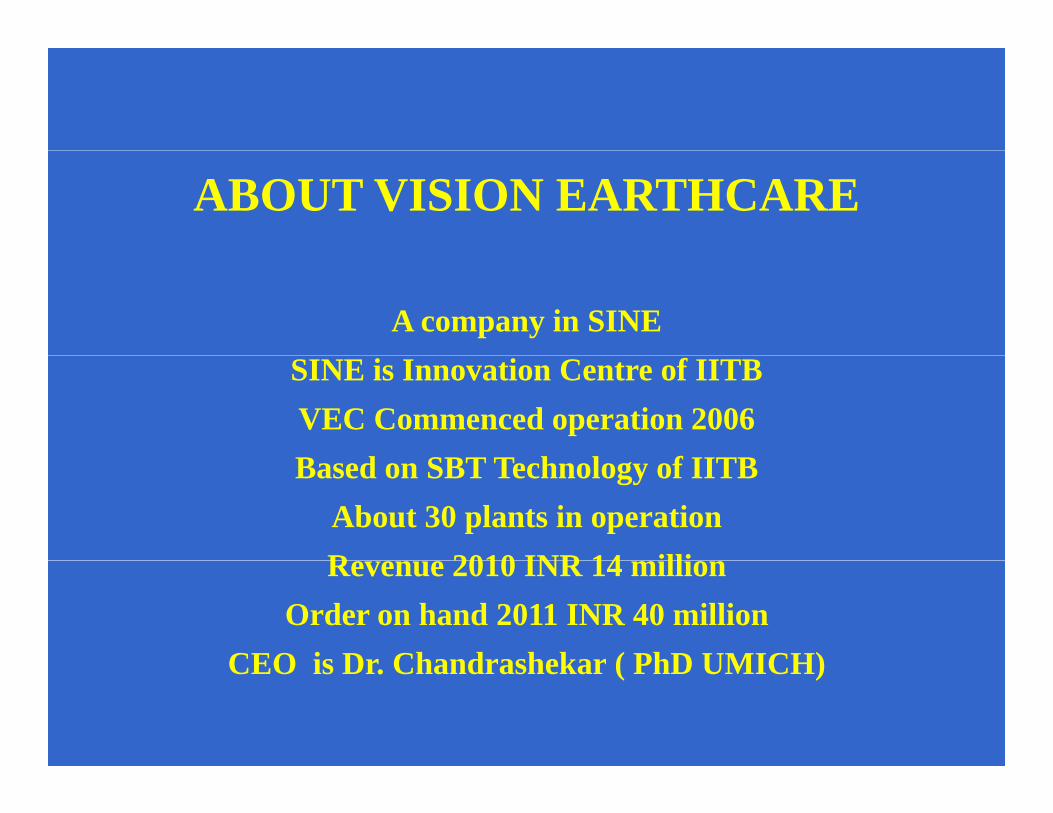
ABOUT VISION EARTHCARE
A company in SINESINE is Innovation Centre of IITBVEC Commenced operation 2006B d SBT T h l f IITBBased on SBT Technology of IITB
About 30 plants in operationR 2010 INR 14 illiRevenue 2010 INR 14 million
Order on hand 2011 INR 40 millionCEO is Dr Chandrashekar ( PhD UMICH)CEO is Dr. Chandrashekar ( PhD UMICH)

Film : India Innovates(Min. of Ext. Affairs)
http://www youtube com/watch?v=dKWVtZ81mY0http://www.youtube.com/watch?v dKWVtZ81mY0

Thank YouThank You

120 Cu M Plant at M P. Airport, AAI, Udaipur RajasthanUdaipur, Rajasthan
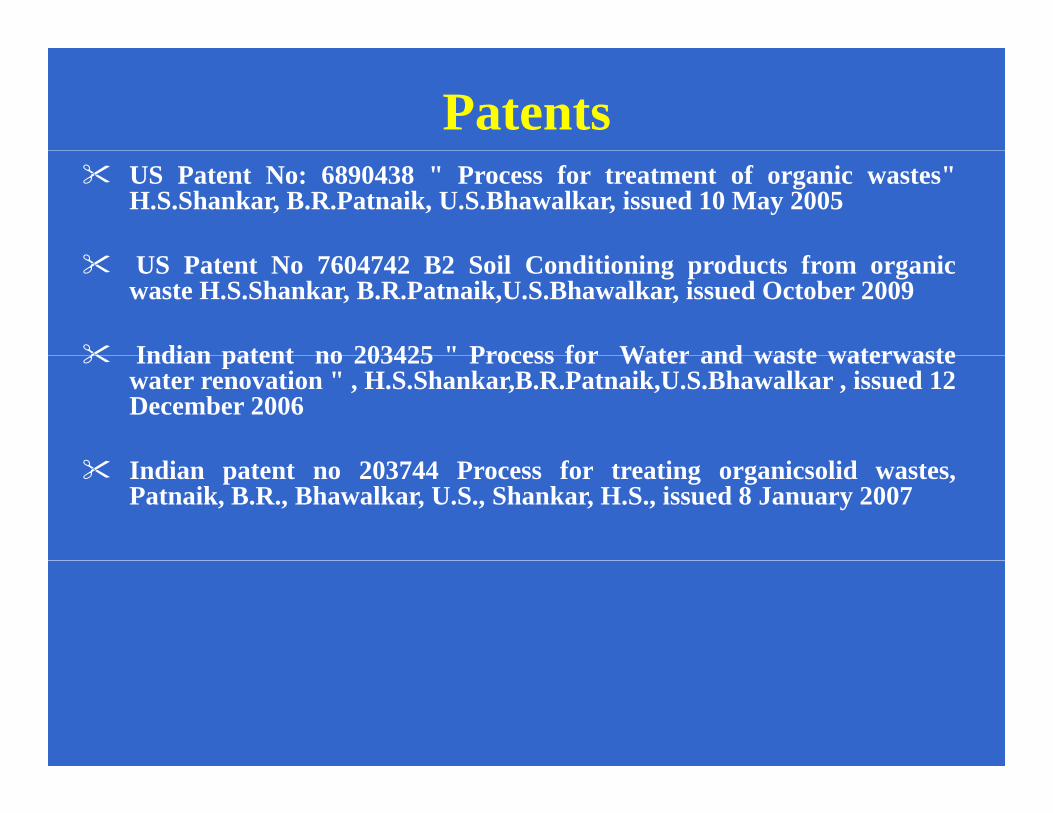
Patents US Patent No: 6890438 " Process for treatment of organic wastes"H.S.Shankar, B.R.Patnaik, U.S.Bhawalkar, issued 10 May 2005
US Patent No 7604742 B2 Soil Conditioning products from organicwaste H.S.Shankar, B.R.Patnaik,U.S.Bhawalkar, issued October 2009
Indian patent no 203425 " Process for Water and waste waterwasteIndian patent no 203425 Process for Water and waste waterwastewater renovation " , H.S.Shankar,B.R.Patnaik,U.S.Bhawalkar , issued 12December 2006
Indian patent no 203744 Process for treating organicsolid wastes,Patnaik, B.R., Bhawalkar, U.S., Shankar, H.S., issued 8 January 2007
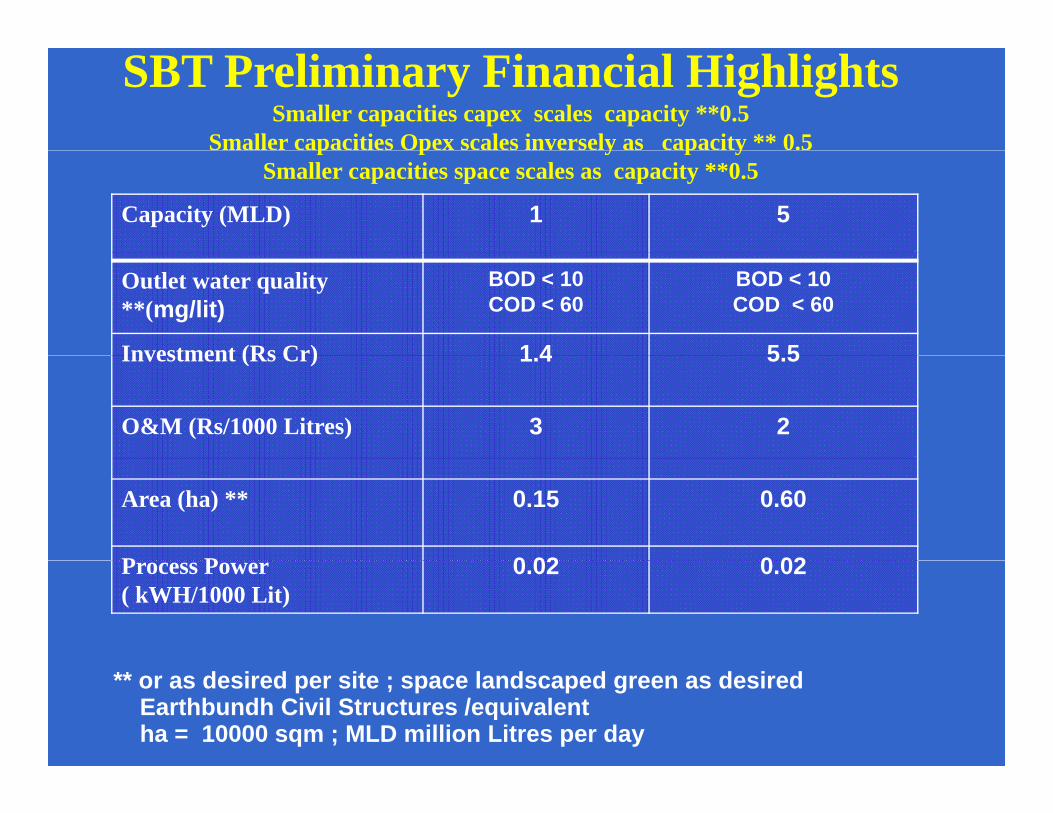
SBT Preliminary Financial HighlightsSmaller capacities capex scales capacity **0.5
Smaller capacities Opex scales inversely as capacity ** 0.5p p y p ySmaller capacities space scales as capacity **0.5
Capacity (MLD) 1 5
Outlet water quality **(mg/lit)
BOD < 10COD < 60
BOD < 10COD < 60
Investment (Rs Cr) 1 4 5 5Investment (Rs Cr) 1.4 5.5
O&M (Rs/1000 Litres) 3 2
Area (ha) ** 0.15 0.60
P P 0 02 0 02Process Power( kWH/1000 Lit)
0.02 0.02
** or as desired per site ; space landscaped green as desiredEarthbundh Civil Structures /equivalentha = 10000 sqm ; MLD million Litres per day
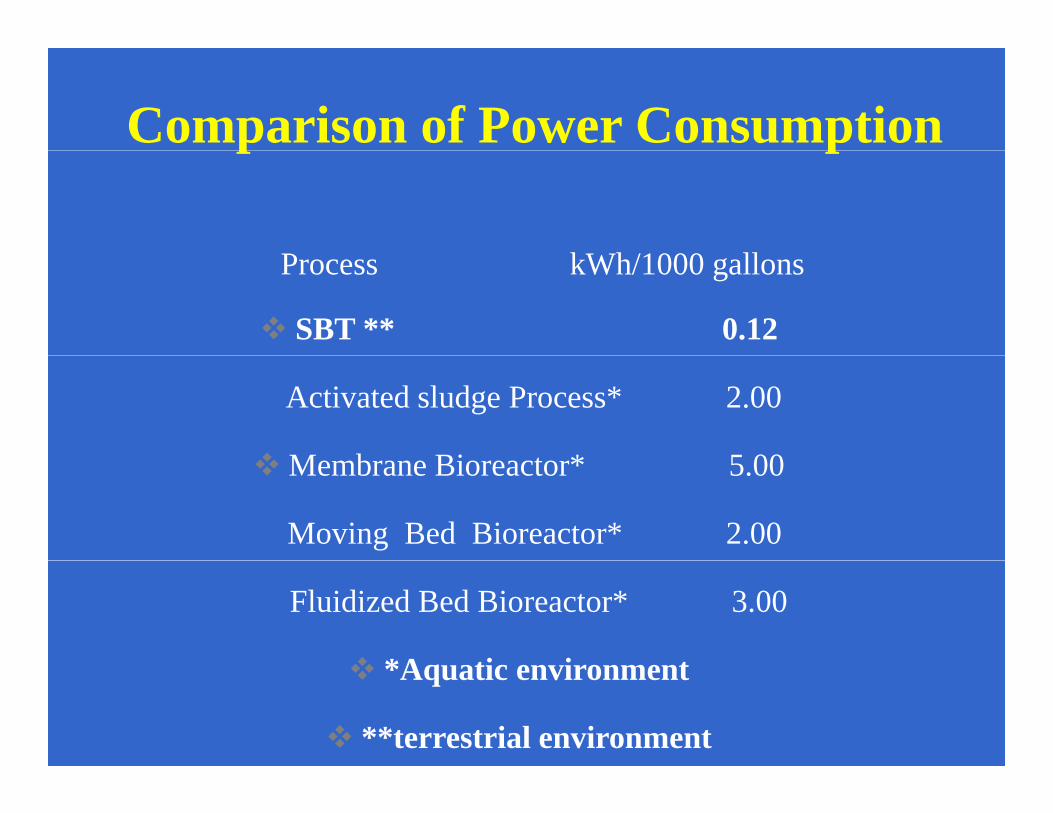
Comparison of Power Consumptionp p
k h/1000 llProcess kWh/1000 gallons
SBT ** 0.12
Activated sludge Process* 2.00
M b Bi t * 5 00Membrane Bioreactor* 5.00
Moving Bed Bioreactor* 2.00
Fluidized Bed Bioreactor* 3.00
*A ti i t*Aquatic environment
**terrestrial environment
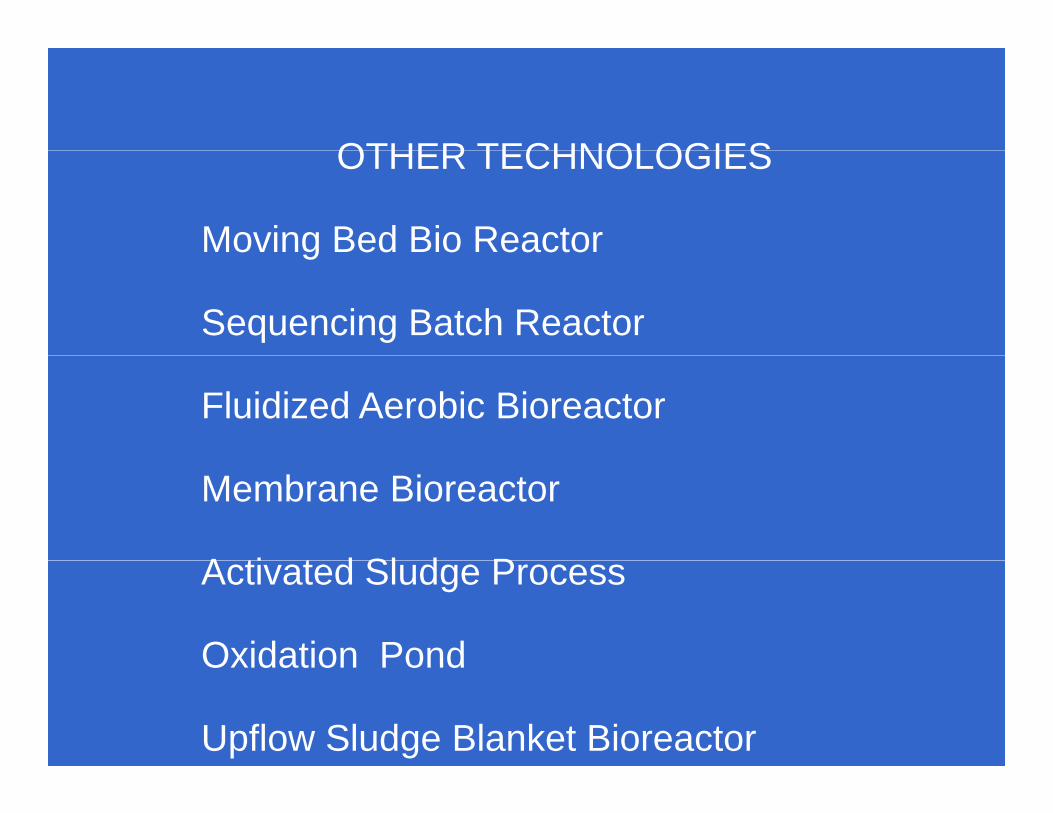
OTHER TECHNOLOGIESOTHER TECHNOLOGIES
Moving Bed Bio Reactorg
Sequencing Batch Reactor
Fluidized Aerobic Bioreactor
Membrane Bioreactor
A ti t d Sl d PActivated Sludge Process
Oxidation PondOxidation Pond
Upflow Sludge Blanket Bioreactor
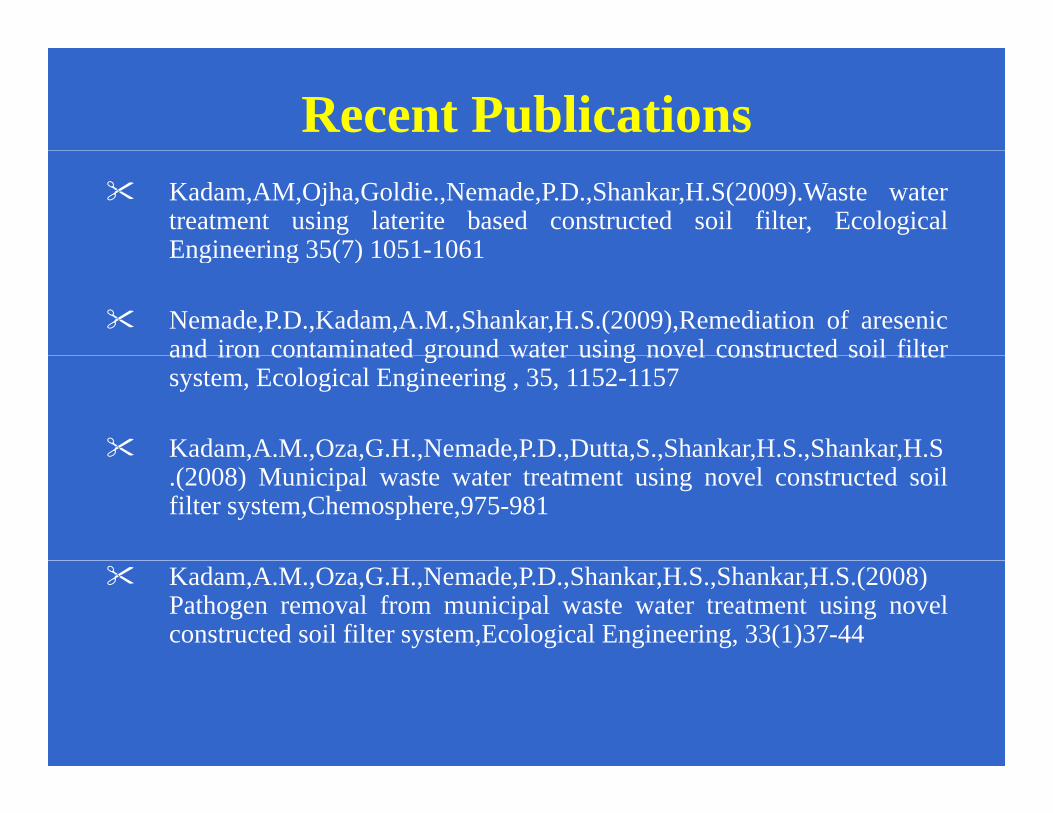
Recent PublicationsKadam,AM,Ojha,Goldie.,Nemade,P.D.,Shankar,H.S(2009).Waste watertreatment using laterite based constructed soil filter, EcologicalEngineering 35(7) 1051-1061Engineering 35(7) 1051 1061
Nemade,P.D.,Kadam,A.M.,Shankar,H.S.(2009),Remediation of aresenicand iron contaminated ground water using novel constructed soil filterand iron contaminated ground water using novel constructed soil filtersystem, Ecological Engineering , 35, 1152-1157
Kadam,A.M.,Oza,G.H.,Nemade,P.D.,Dutta,S.,Shankar,H.S.,Shankar,H.S, , , , , , , , , , ,.(2008) Municipal waste water treatment using novel constructed soilfilter system,Chemosphere,975-981
Kadam,A.M.,Oza,G.H.,Nemade,P.D.,Shankar,H.S.,Shankar,H.S.(2008)Pathogen removal from municipal waste water treatment using novelconstructed soil filter system,Ecological Engineering, 33(1)37-44
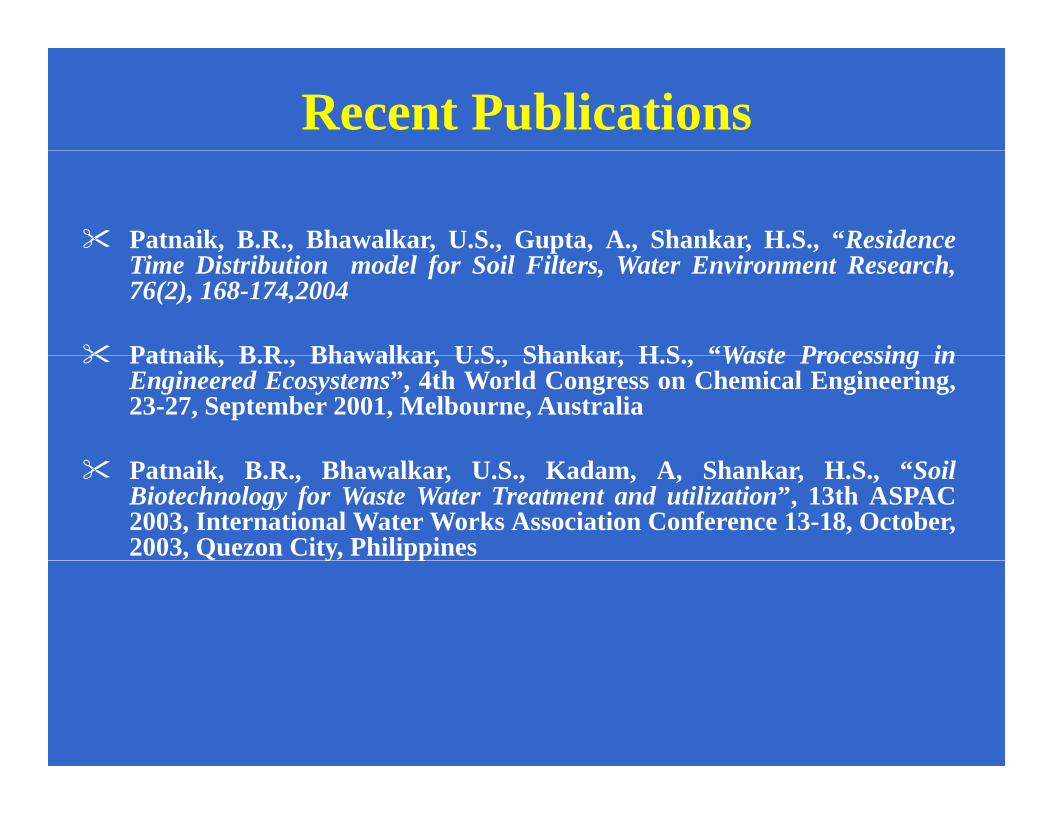
Recent Publications
Patnaik, B.R., Bhawalkar, U.S., Gupta, A., Shankar, H.S., “ResidencepTime Distribution model for Soil Filters, Water Environment Research,76(2), 168-174,2004
Patnaik B R Bhawalkar U S Shankar H S “Waste Processing inPatnaik, B.R., Bhawalkar, U.S., Shankar, H.S., Waste Processing inEngineered Ecosystems”, 4th World Congress on Chemical Engineering,23-27, September 2001, Melbourne, Australia
Patnaik, B.R., Bhawalkar, U.S., Kadam, A, Shankar, H.S., “SoilBiotechnology for Waste Water Treatment and utilization”, 13th ASPAC2003, International Water Works Association Conference 13-18, October,2003, Quezon City, Philippinesy pp
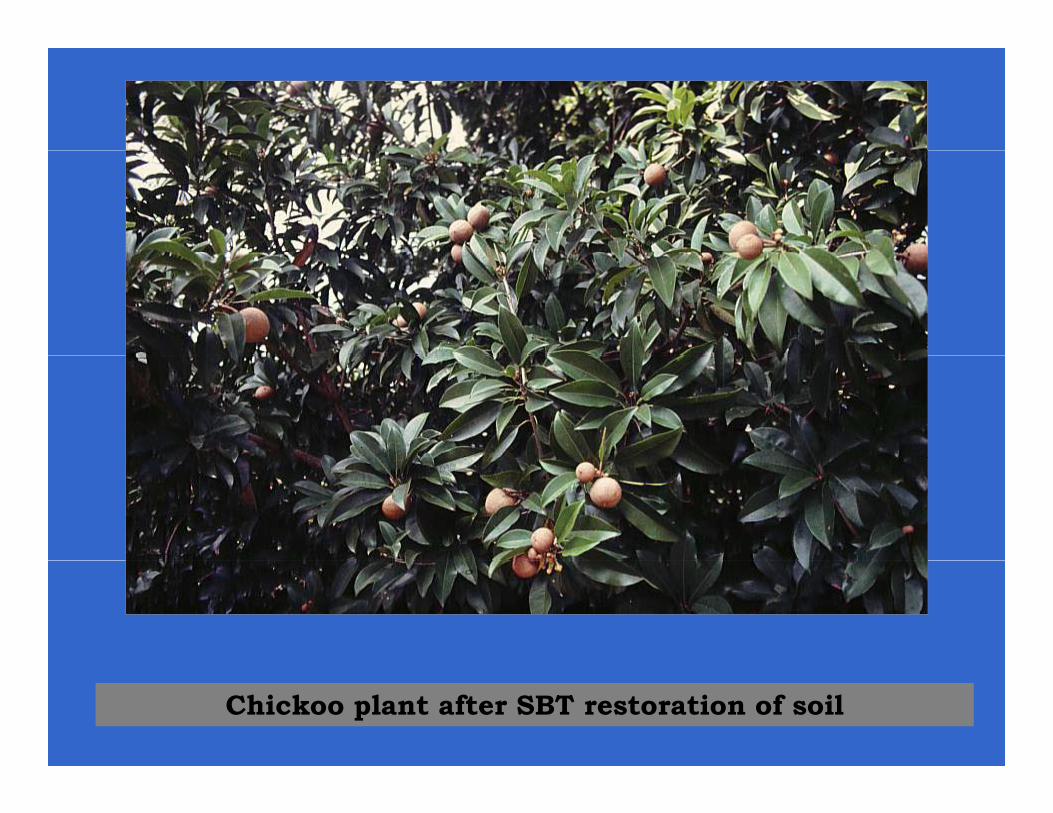
Chickoo plant after SBT restoration of soilChickoo plant after SBT restoration of soil
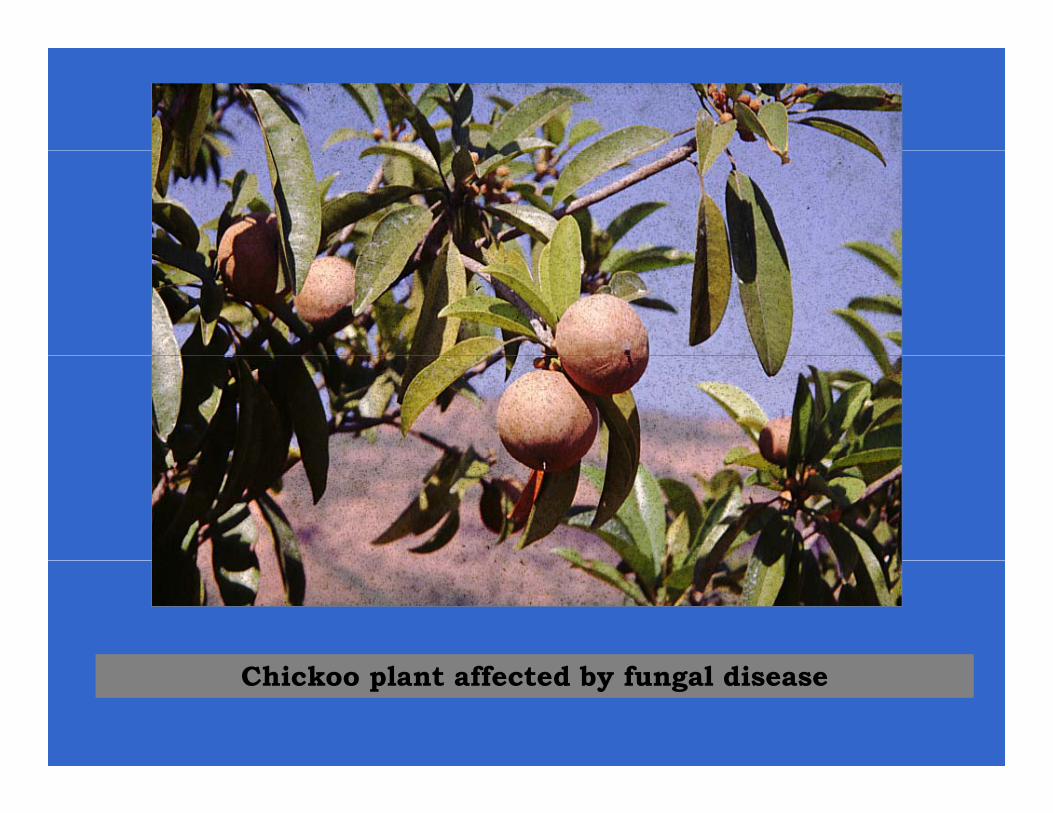
Chickoo plant affected by fungal diseaseChickoo plant affected by fungal disease
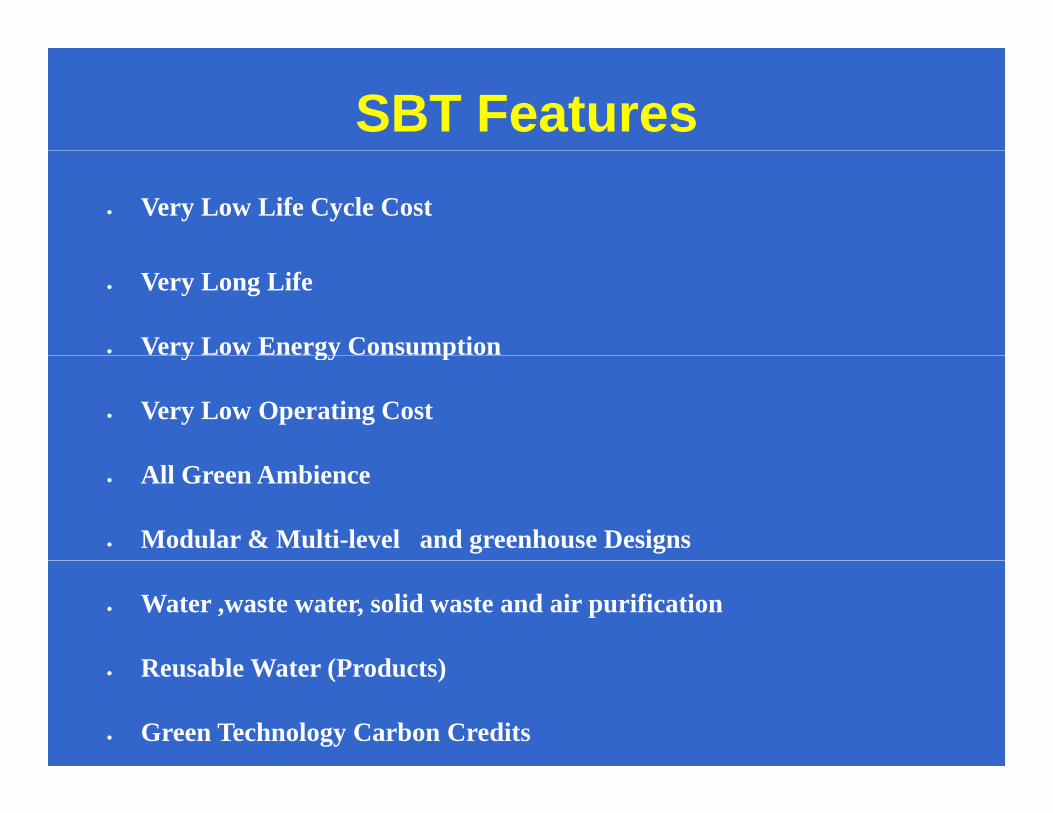
SBT Features• Very Low Life Cycle Cost
• Very Long Life
• Very Low Energy Consumption y gy p
• Very Low Operating Cost
• All Green Ambience
• Modular & Multi-level and greenhouse Designs
• Water ,waste water, solid waste and air purification
R bl W t (P d t )• Reusable Water (Products)
• Green Technology Carbon Credits
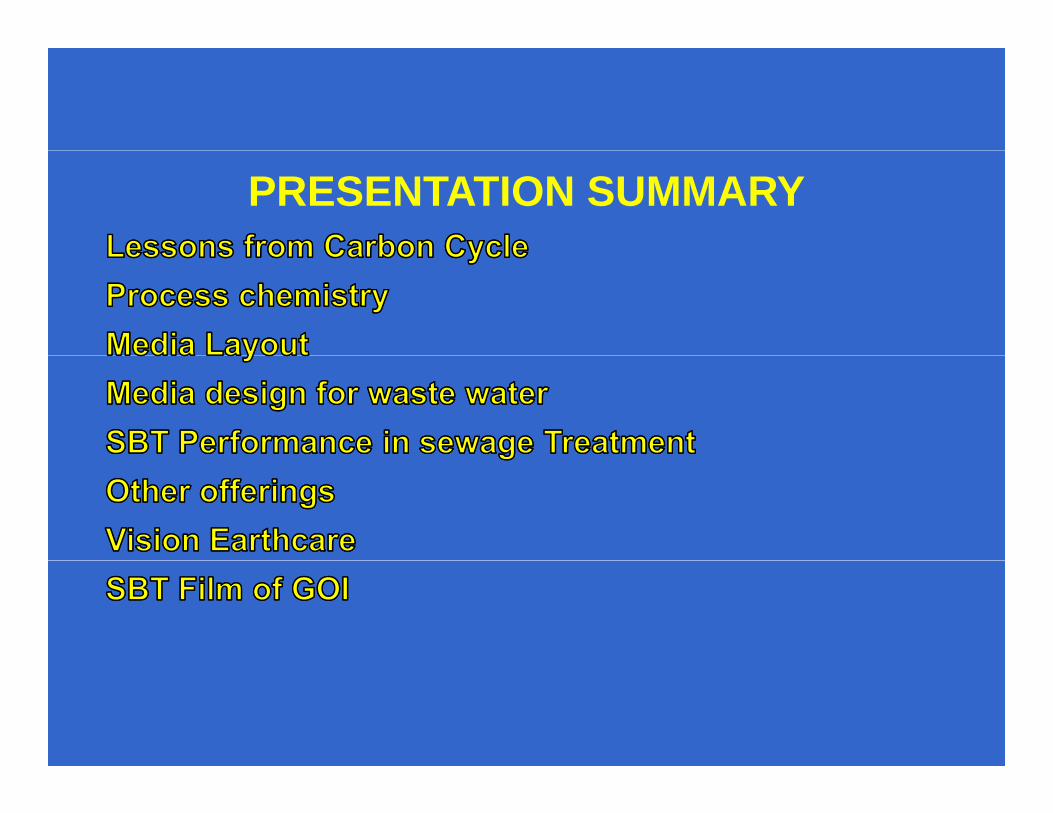
PRESENTATION SUMMARY
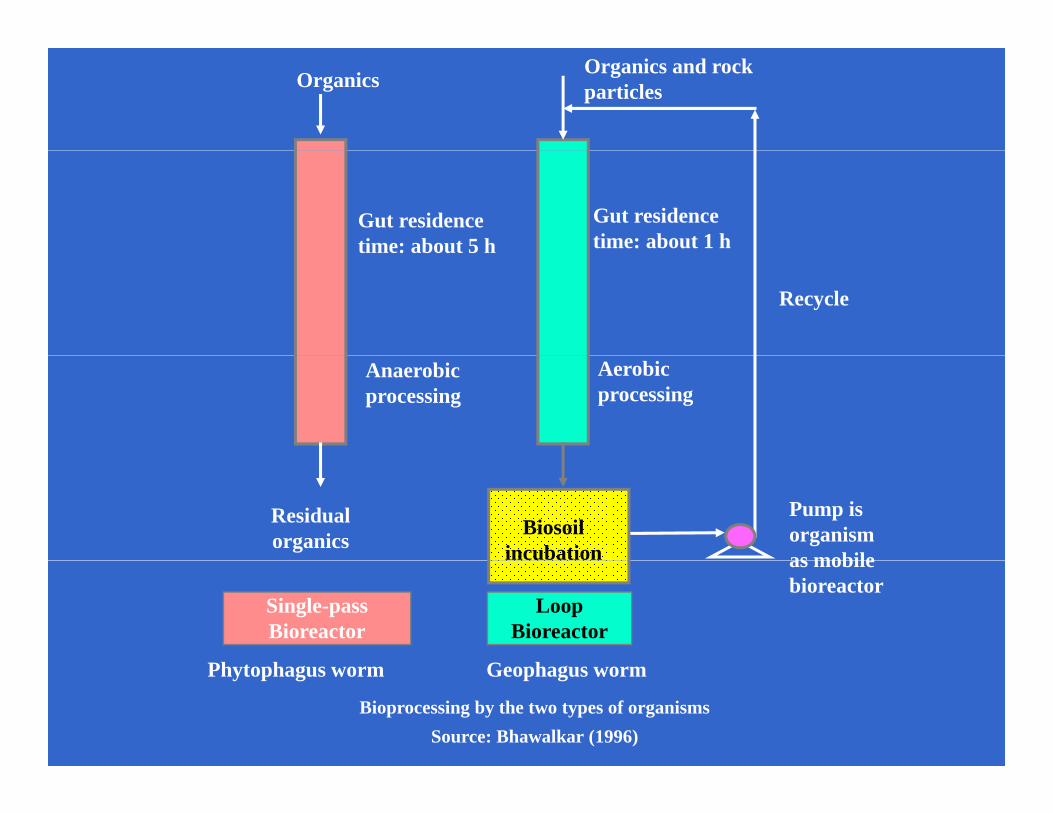
Organics Organics and rock particles
Gut residence time: about 5 h
Gut residence time: about 1 ht e: about 5
Recycle
Anaerobic processing
Aerobic processing
Residual organics
Pump is organism as mobile
Biosoil incubation as mobile
bioreactorSingle-pass Bioreactor
Loop Bioreactor
Ph h G h
Bioprocessing by the two types of organismsSource: Bhawalkar (1996)
Phytophagus worm Geophagus worm
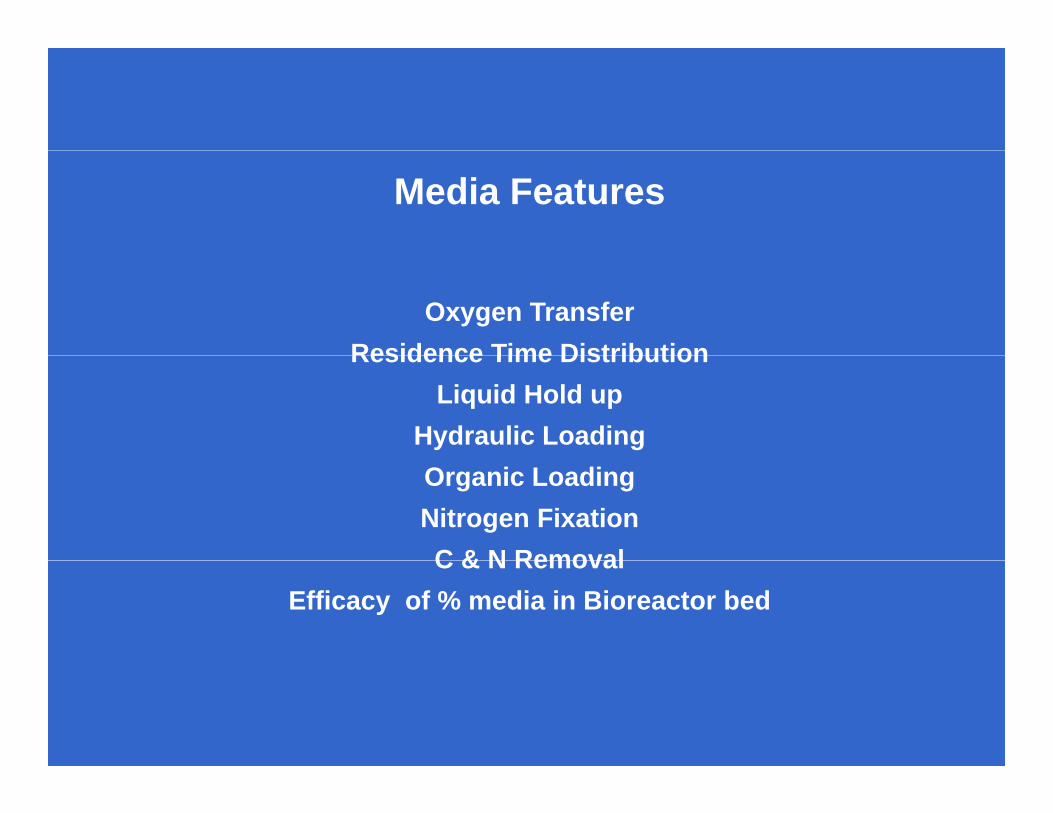
Media Features
Oxygen TransferResidence Time DistributionResidence Time Distribution
Liquid Hold upHydraulic LoadingOrganic LoadingNitrogen FixationC & N RemovalC & N Removal
Efficacy of % media in Bioreactor bed

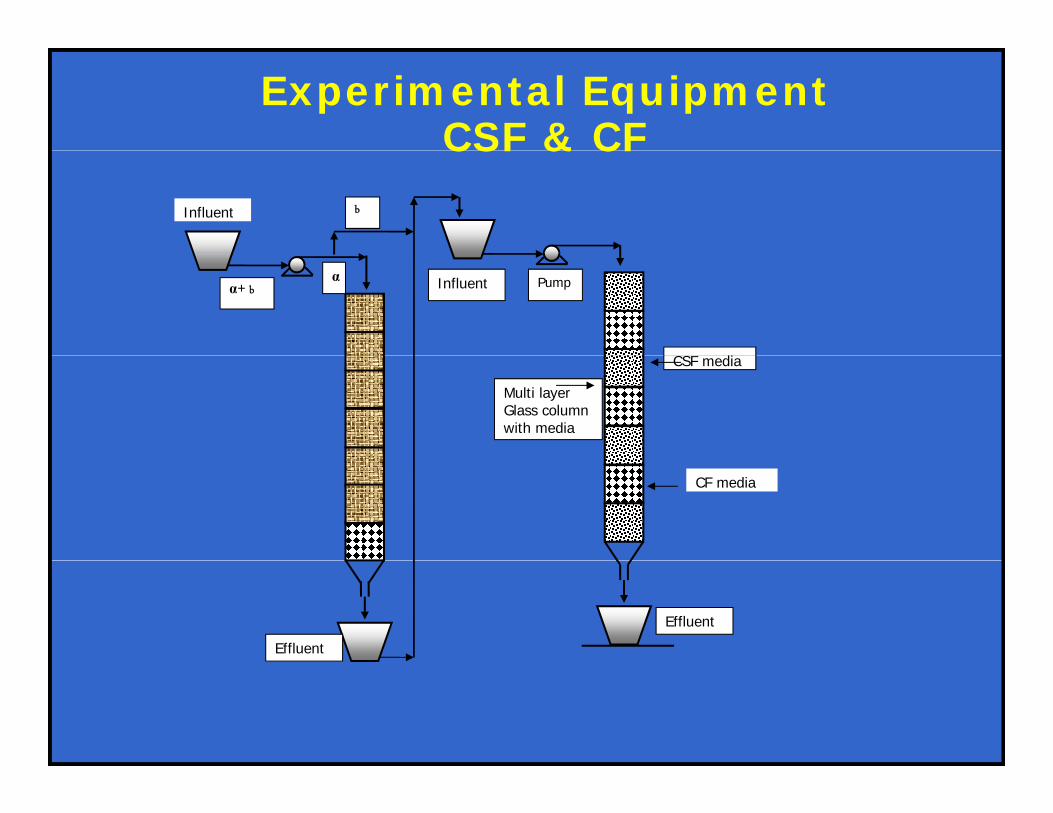
Experimental Equipment CSF & CFCSF & CF
bInfluent
Influent Pump
CSF di
α+ bα
Multi layer Glass column with media
CSF media
CF media
Effluent
Effluent
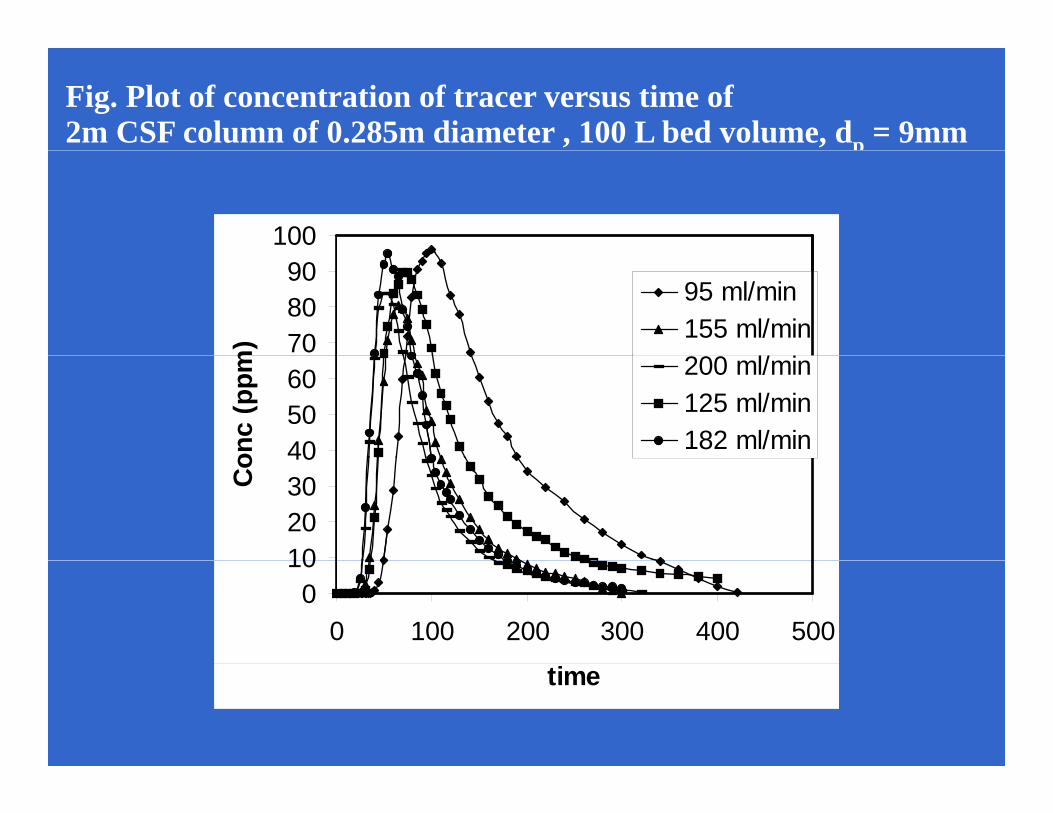
Fig. Plot of concentration of tracer versus time of 2m CSF column of 0.285m diameter , 100 L bed volume, dp = 9mm
100
708090
m)
95 ml/min155 ml/min
/
405060
onc
(ppm 200 ml/min
125 ml/min182 ml/min
10203040
Co
010
0 100 200 300 400 500
time
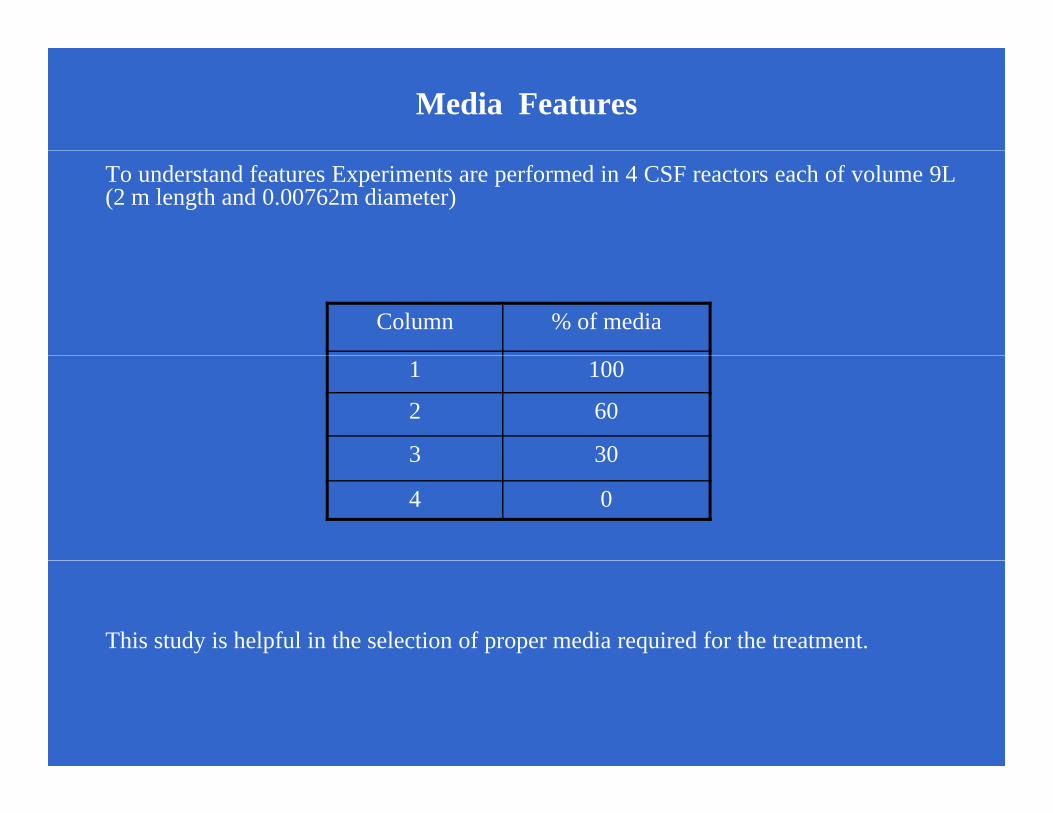
Media Features
To understand features Experiments are performed in 4 CSF reactors each of volume 9L(2 m length and 0.00762m diameter)
Column % of media
1 100
2 60
3 303 30
4 0
This study is helpful in the selection of proper media required for the treatment.
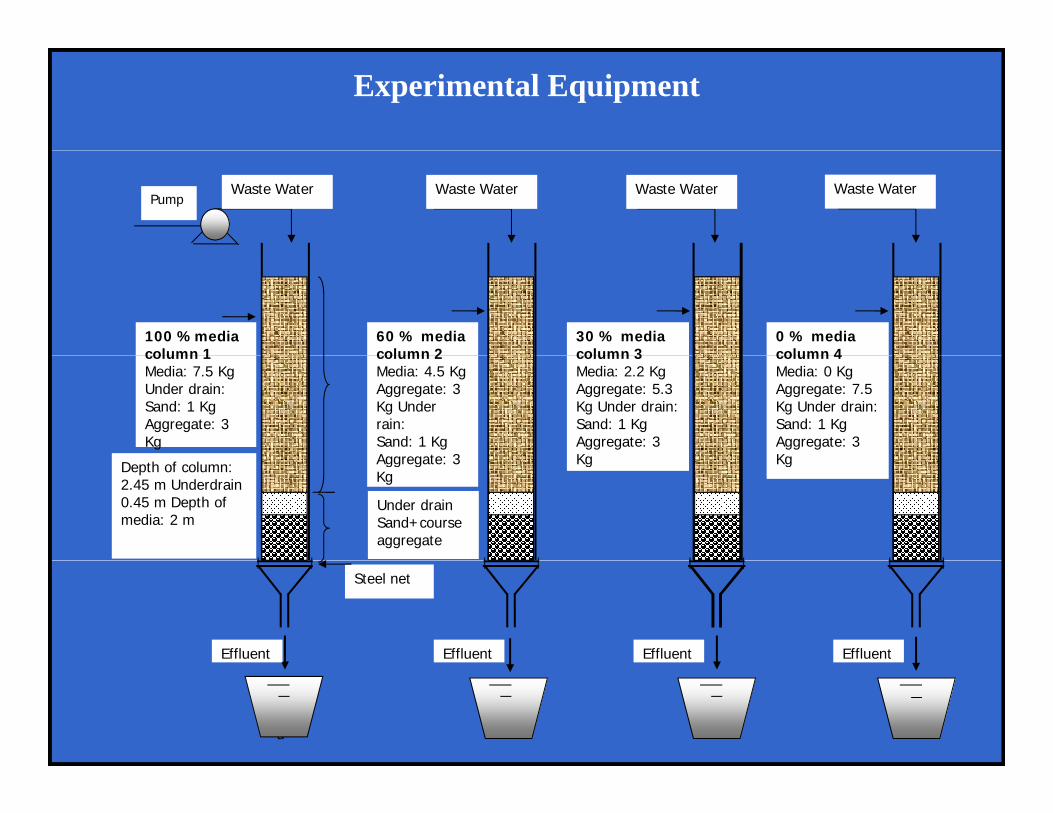
Experimental Equipment
PumpWaste Water Waste Water Waste Water Waste Water
100 %media column 1
0 % media column 4
60 % media column 2
30 % media column 3column 1
Media: 7.5 KgUnder drain: Sand: 1 KgAggregate: 3 Kg
column 4Media: 0 KgAggregate: 7.5 Kg Under drain: Sand: 1 KgAggregate: 3 Kg
column 2Media: 4.5 KgAggregate: 3 Kg Under rain: Sand: 1 KgAggregate: 3
column 3Media: 2.2 KgAggregate: 5.3 Kg Under drain: Sand: 1 KgAggregate: 3 KgDepth of column:
2.45 m Underdrain0.45 m Depth of media: 2 m
Under drain Sand+course aggregate
KgAggregate: 3 Kg
Kg
Steel net
Effluent Effluent Effluent Effluent
Efflu
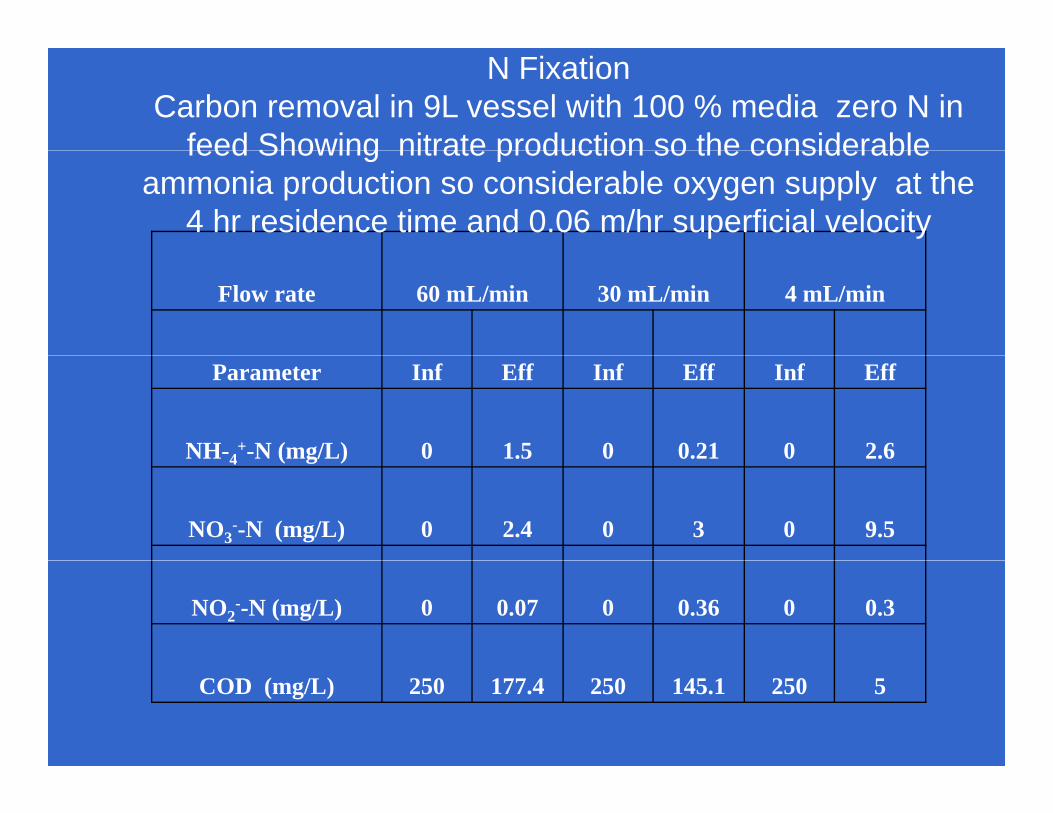
N FixationCarbon removal in 9L vessel with 100 % media zero N in
feed Showing nitrate production so the considerablefeed Showing nitrate production so the considerable ammonia production so considerable oxygen supply at the
4 hr residence time and 0.06 m/hr superficial velocity
Flow rate 60 mL/min 30 mL/min 4 mL/min
Parameter Inf Eff Inf Eff Inf Eff
NH-4+-N (mg/L) 0 1.5 0 0.21 0 2.6NH 4 N (mg/L) 0 1.5 0 0.21 0 2.6
NO3--N (mg/L) 0 2.4 0 3 0 9.5
NO2--N (mg/L) 0 0.07 0 0.36 0 0.3
COD (mg/L) 250 177.4 250 145.1 250 5
Experimental Equipment CSF & CFCSF & CF
bInfluent
Influent Pump
CSF di
α+ bα
Multi layer Glass column with media
CSF media
CF media
Effluent
Effluent
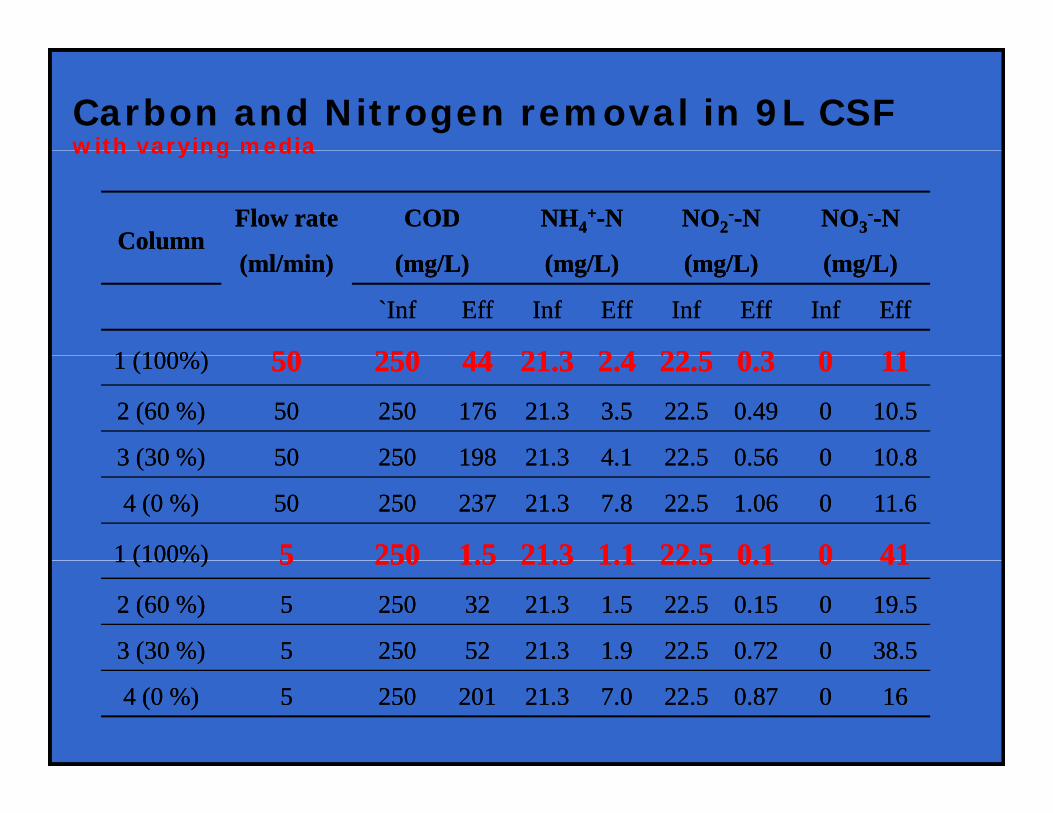
Carbon and Nitrogen removal in 9L CSFwith varying mediawith varying media
ColumnColumnFlow rate Flow rate CODCOD NHNH44
++--NN NONO22----NN NONO33
----NN
(ml/min)(ml/min) (mg/L)(mg/L) (mg/L)(mg/L) (mg/L)(mg/L) (mg/L)(mg/L)
`̀InfInf EffEff InfInf EffEff InfInf EffEff InfInf EffEff
1 (100%)1 (100%) 5050 250250 4444 21 321 3 2 42 4 22 522 5 0 30 3 00 11111 (100%)1 (100%) 5050 250250 4444 21.321.3 2.42.4 22.522.5 0.30.3 00 11112 (60 %)2 (60 %) 5050 250250 176176 21.321.3 3.53.5 22.522.5 0.490.49 00 10.510.5
3 (30 %)3 (30 %) 5050 250250 198198 21 321 3 4 14 1 22 522 5 0 560 56 00 10 810 83 (30 %)3 (30 %) 5050 250250 198198 21.321.3 4.14.1 22.522.5 0.560.56 00 10.810.8
4 (0 %)4 (0 %) 5050 250250 237237 21.321.3 7.87.8 22.522.5 1.061.06 00 11.611.6
1 (100%)1 (100%) 55 250250 1.51.5 21.321.3 1.11.1 22.522.5 0.10.1 00 41411 (100%)1 (100%) 55 250250 1.51.5 21.321.3 1.11.1 22.522.5 0.10.1 00 41412 (60 %)2 (60 %) 55 250250 3232 21.321.3 1.51.5 22.522.5 0.150.15 00 19.519.5
3 (30 %)3 (30 %) 55 250250 5252 21.321.3 1.91.9 22.522.5 0.720.72 00 38.538.5( )( )
4 (0 %)4 (0 %) 55 250250 201201 21.321.3 7.07.0 22.522.5 0.870.87 00 1616
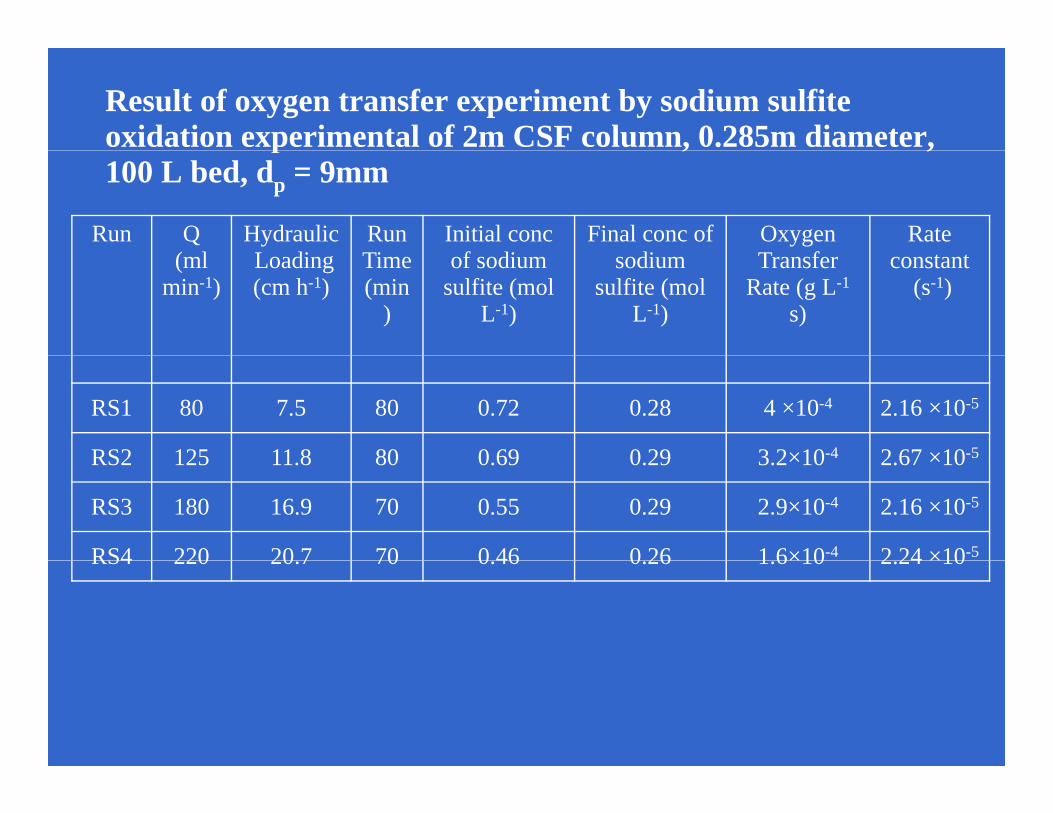
Result of oxygen transfer experiment by sodium sulfite oxidation experimental of 2m CSF column, 0.285m diameter, p , ,100 L bed, dp = 9mm
Run Q ( l
HydraulicL di
RunTi
Initial concf di
Final conc of di
Oxygen T f
Rate (ml
min-1)Loading (cm h-1)
Time (min
)
of sodium sulfite (mol
L-1)
sodium sulfite (mol
L-1)
Transfer Rate (g L-1
s)
constant(s-1)
RS1 80 7.5 80 0.72 0.28 4 ×10⁻⁴ 2.16 ×10⁻⁵
RS2 125 11 8 80 0 69 0 29 3 2×10⁻⁴ 2 67 ×10-5RS2 125 11.8 80 0.69 0.29 3.2×10 2.67 ×10 5
RS3 180 16.9 70 0.55 0.29 2.9×10⁻⁴ 2.16 ×10⁻⁵
RS4 220 20 7 70 0 46 0 26 1 6×10⁻⁴ 2 24 ×10-5RS4 220 20.7 70 0.46 0.26 1.6×10 2.24 ×10
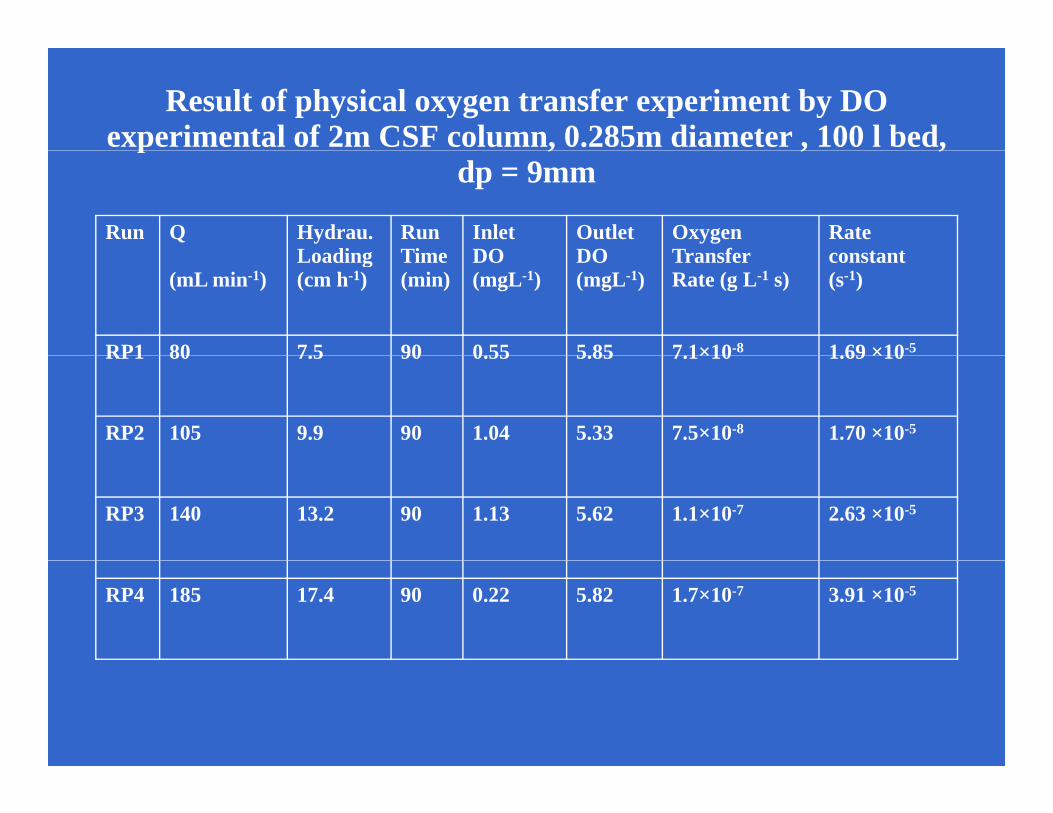
Result of physical oxygen transfer experiment by DO experimental of 2m CSF column, 0.285m diameter , 100 l bed, p , , ,
dp = 9mm
Run Q Hydrau. Loading
RunTime
InletDO
OutletDO
OxygenTransfer
Rateconstant
(mL min-1)Loading (cm h-1)
Time(min)
DO(mgL-1)
DO(mgL-1)
Transfer Rate (g L-1 s)
constant (s-1)
RP1 80 7.5 90 0.55 5.85 7.1×10⁻⁸ 1.69 ×10⁻⁵RP1 80 7.5 90 0.55 5.85 7.1×10 1.69 ×10
RP2 105 9.9 90 1.04 5.33 7.5×10⁻⁸ 1.70 ×10⁻⁵
RP3 140 13.2 90 1.13 5.62 1.1×10⁻⁷ 2.63 ×10⁻⁵
RP4 185 17.4 90 0.22 5.82 1.7×10⁻⁷ 3.91 ×10⁻⁵
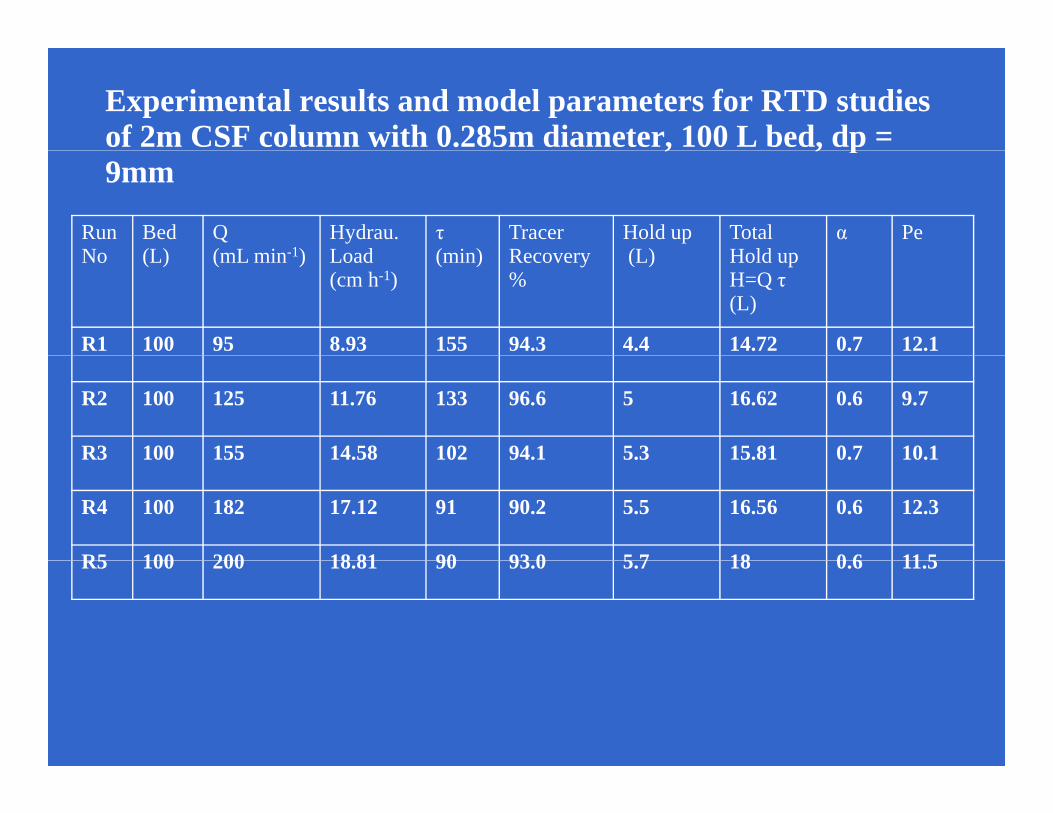
Experimental results and model parameters for RTD studies of 2m CSF column with 0.285m diameter, 100 L bed, dp = , , p9mm
Run N
Bed (L)
Q( L i -1)
Hydrau.L d
τ ( i )
Tracer Re e
Hold up(L)
Total H ld
α PeNo (L) (mL min-1) Load
(cm h-1)(min) Recovery
%(L) Hold up
H=Q τ (L)
R1 100 95 8.93 155 94.3 4.4 14.72 0.7 12.1
R2 100 125 11.76 133 96.6 5 16.62 0.6 9.7
R3 100 155 14.58 102 94.1 5.3 15.81 0.7 10.1R3 100 155 14.58 102 94.1 5.3 15.81 0.7 10.1
R4 100 182 17.12 91 90.2 5.5 16.56 0.6 12.3
R5 100 200 18 81 90 93 0 5 7 18 0 6 11 5R5 100 200 18.81 90 93.0 5.7 18 0.6 11.5
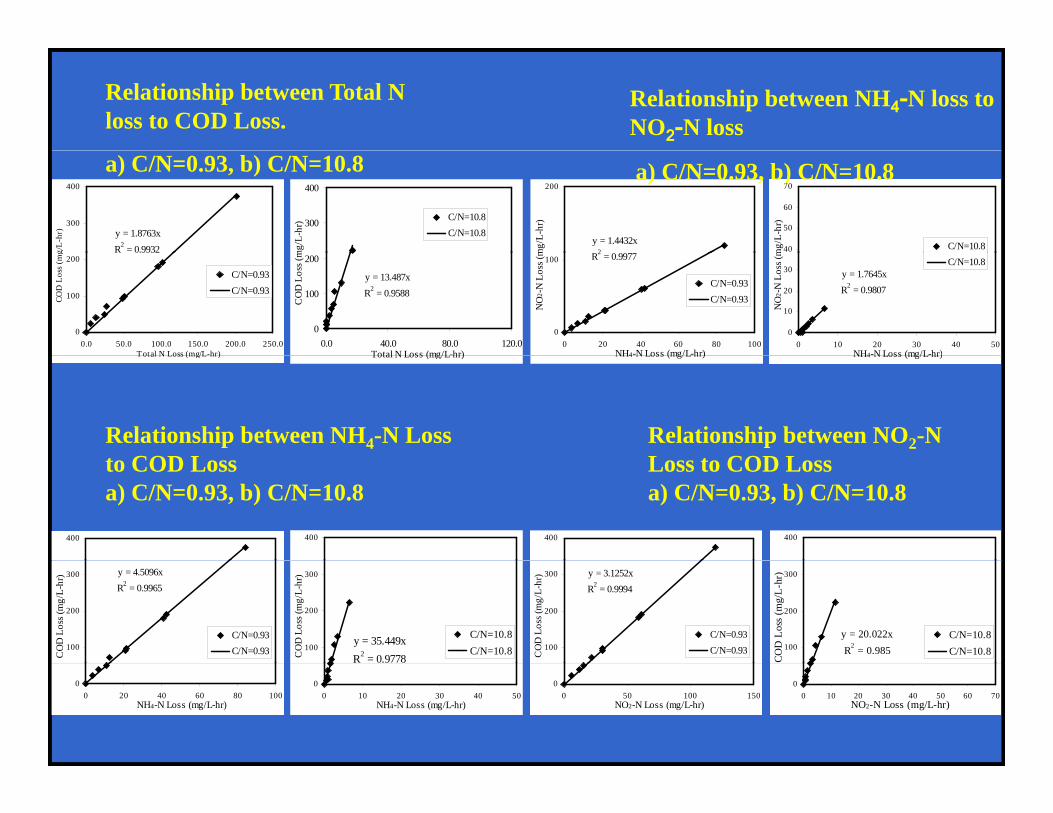
Relationship between Total N loss to COD Loss.
Relationship between NH4-N loss to NO2-N loss
y = 1.8763xR2 = 0.9932
300
400
g/L-
hr)
a) C/N=0.93, b) C/N=10.8
300
400
mg/
L-hr
) C/N=10.8C/N=10.8
y = 1.4432x2
200
mg/
L-hr
)
40
50
60
70
mg/
L-hr
)
C/N=10.8
a) C/N=0.93, b) C/N=10.8
0
100
200
0.0 50.0 100.0 150.0 200.0 250.0Total N Loss (mg/L-hr)
COD
Los
s (m
g
C/N=0.93C/N=0.93
y = 13.487xR2 = 0.9588
0
100
200
0.0 40.0 80.0 120.0Total N Loss (mg/L-hr)
CO
D L
oss (
m R2 = 0.9977
0
100
0 20 40 60 80 100NH4-N Loss (mg/L-hr)
NO
2 -N
Los
s (m
C/N=0.93C/N=0.93
y = 1.7645xR2 = 0.9807
0
10
20
30
0 10 20 30 40 50NH4-N Loss (mg/L-hr)
NO
2 -N
Los
s (m
C/N=10.8
Total N Loss (mg/L hr) Total N Loss (mg/L hr) NH4 N Loss (mg/L hr) NH4 N Loss (mg/L hr)
Relationship between NH4-N Loss t COD L
Relationship between NO2-N L t COD L
400 400
to COD Loss a) C/N=0.93, b) C/N=10.8
400 400
Loss to COD Loss a) C/N=0.93, b) C/N=10.8
y = 4.5096xR2 = 0.9965
100
200
300
CO
D L
oss (
mg/
L-hr
)
C/N=0.93C/N=0.93
y = 35.449xR2 = 0.9778
100
200
300
CO
D L
oss (
mg/
L-hr
)
C/N=10.8C/N=10.8
y = 3.1252xR2 = 0.9994
100
200
300
CO
D L
oss (
mg/
L-hr
)
C/N=0.93C/N=0.93
y = 20.022xR2 = 0.985100
200
300
COD
Los
s (m
g/L-
hr)
C/N=10.8C/N=10.8
00 20 40 60 80 100
NH4-N Loss (mg/L-hr)
00 10 20 30 40 50
NH4-N Loss (mg/L-hr)
00 50 100 150
NO2-N Loss (mg/L-hr)
00 10 20 30 40 50 60 70
NO2-N Loss (mg/L-hr)
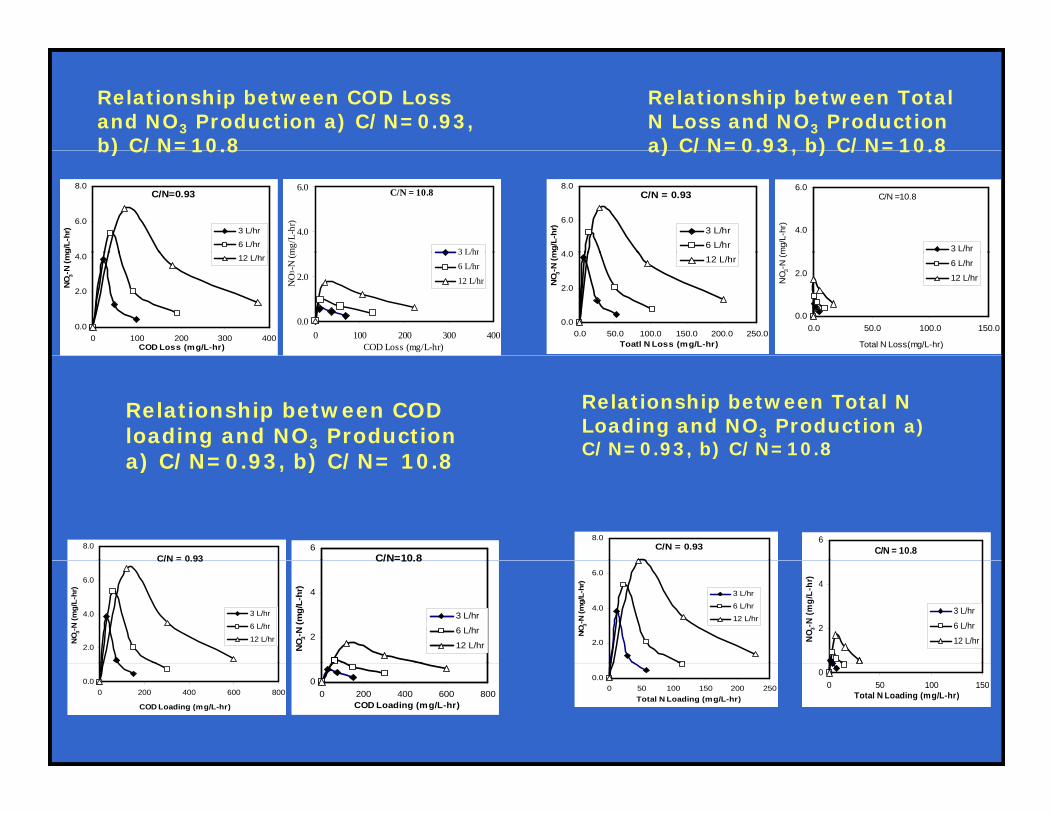
Relationship between COD Loss and NO3 Production a) C/N=0.93, b) C/N=10.8
Relationship between Total N Loss and NO3 Production a) C/N=0.93, b) C/N=10.8
C/N=0.93
6.0
8.0
g/L-
hr) 3 L/hr
6 L/hr
C/N = 10.8
4.0
6.0
mg/
L-hr
)
3 L/hr
b) C/N 10.8
C/N = 0.93
4 0
6.0
8.0
mg/
L-hr
) 3 L/hr6 L/hr
C/N =10.8
4.0
6.0
mg/
L-hr
)
3 L/hr
a) C/N 0.93, b) C/N 10.8
0.0
2.0
4.0
0 100 200 300 400COD Loss (mg/L-hr)
NO 3-
N (m
g
12 L/hr
0.0
2.0
0 100 200 300 400COD Loss (mg/L-hr)
NO
3 -N
(m 3 L/hr
6 L/hr
12 L/hr
0.0
2.0
4.0
0.0 50.0 100.0 150.0 200.0 250.0Toatl N Loss (mg/L-hr)
NO 3-
N (m 12 L/hr
0.0
2.0
0.0 50.0 100.0 150.0
Total N Loss(mg/L-hr)
NO 3-
N (m
6 L/hr
12 L/hr
Relationship between COD loading and NO3 Production a) C/N=0 93 b) C/N= 10 8
Relationship between Total N Loading and NO3 Production a) C/N=0.93, b) C/N=10.8
C/N = 0.938.0
C/N=10.86
a) C/N=0.93, b) C/N= 10.8
C/N = 0.938.0
C/N = 10.86
/ , ) /
C/N 0.93
2.0
4.0
6.0
NO 3-
N (m
g/L-
hr)
3 L/hr
6 L/hr
12 L/hr
C/N 10.8
2
4
NO 3-
N (m
g/L-
hr)
3 L/hr
6 L/hr
12 L/hr 2.0
4.0
6.0N
O 3-N
(mg/
L-hr
)3 L/hr
6 L/hr
12 L/hr2
4
NO 3
-N (m
g/L-
hr)
3 L/hr
6 L/hr
12 L/hr
0.00 200 400 600 800
COD Loading (mg/L-hr)
00 200 400 600 800
COD Loading (mg/L-hr)
0.00 50 100 150 200 250
Total N Loading (mg/L-hr)
00 50 100 150
Total N Loading (mg/L-hr)
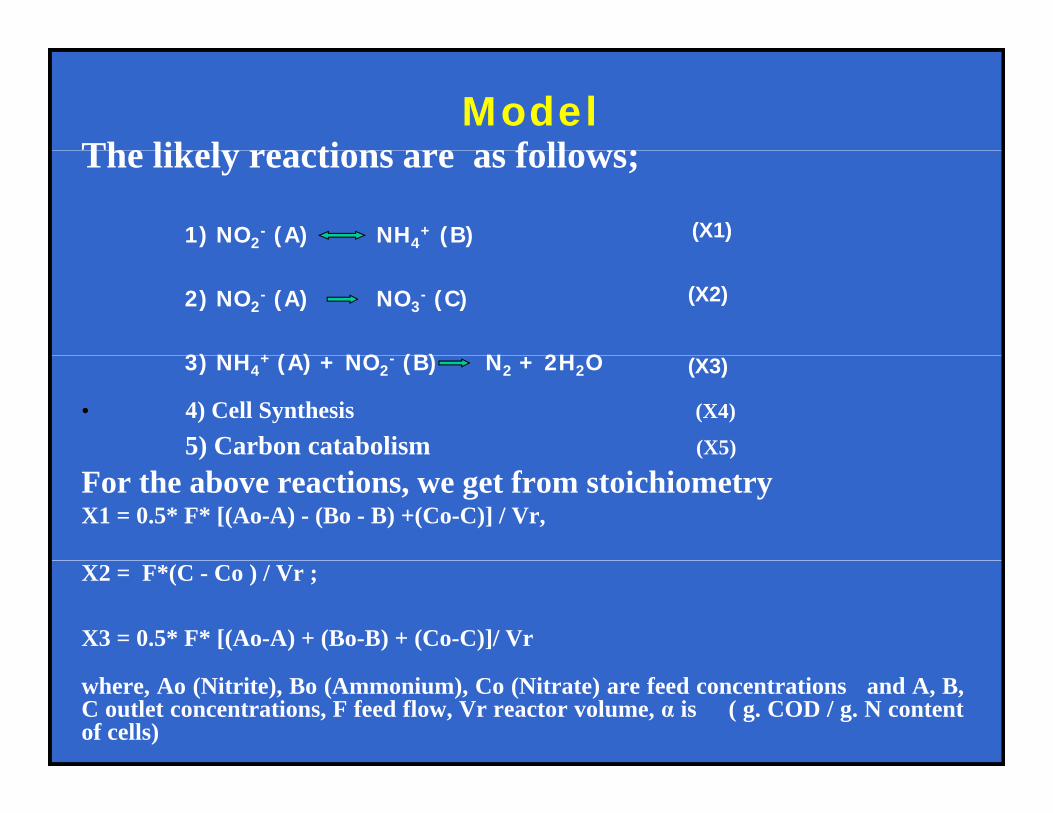
The likel reactions are as follo s;Model
The likely reactions are as follows;
(X1)1) NO2- (A) NH4
+ (B)
(X2)2) NO2- (A) NO3
- (C)
3) NH + (A) NO (B) N 2H O
• 4) Cell Synthesis (X4)
5) Carbon catabolism (X5)
(X3)3) NH4+ (A) + NO2
- (B) N2 + 2H2O
) ( )
For the above reactions, we get from stoichiometryX1 = 0.5* F* [(Ao-A) - (Bo - B) +(Co-C)] / Vr,
X2 = F*(C - Co ) / Vr ;
X3 = 0.5* F* [(Ao-A) + (Bo-B) + (Co-C)]/ Vr
where, Ao (Nitrite), Bo (Ammonium), Co (Nitrate) are feed concentrations and A, B,C outlet concentrations, F feed flow, Vr reactor volume, α is ( g. COD / g. N contentof cells)
20
10
15
-hr)
y = 0.0749xR2 = 0.949
0
5X1
(mg/
L
-5
0
0 50 100 150 200 2502X3 (mg/L-hr)
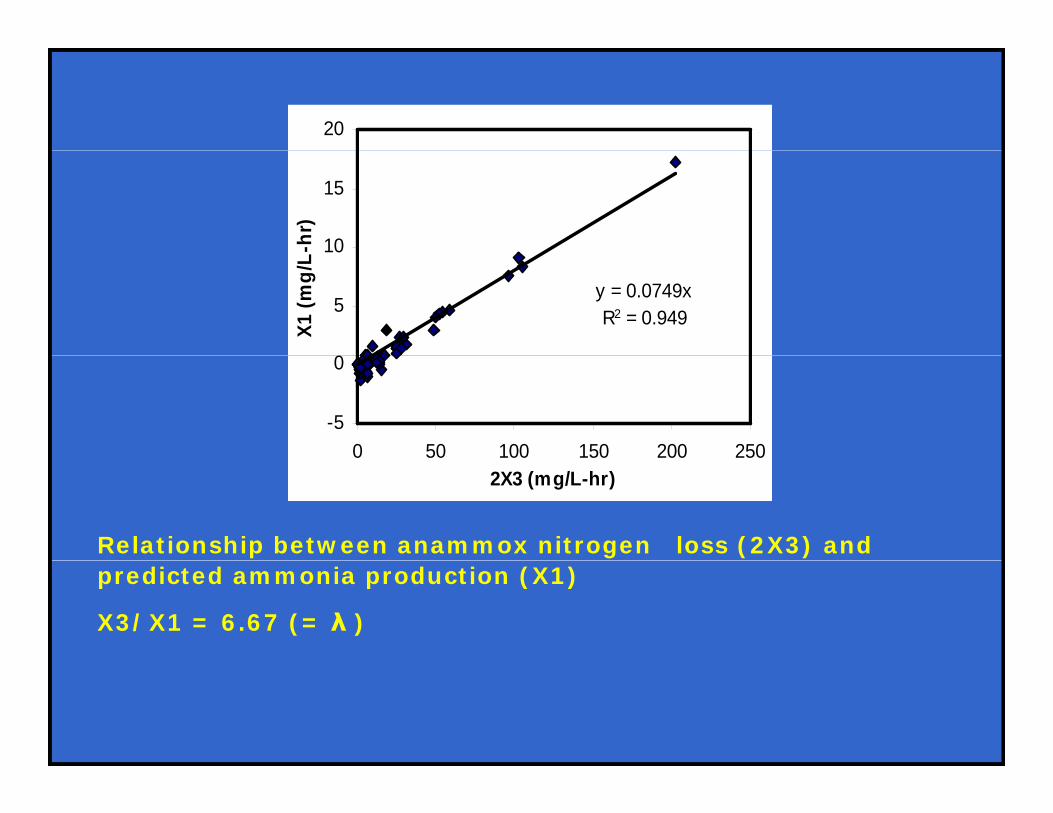
Relationship between anammox nitrogen loss (2X3) and predicted ammonia production (X1)
X3/X1 = 6.67 (= λ )
14 0
16.0
18.0
y = 1.4318x8.0
10.0
12.0
14.0
D L
oss/
2X3
R2 = 0.9732
2.0
4.0
6.0CO
D
0.00 2 4 6 8 10 12
C/N
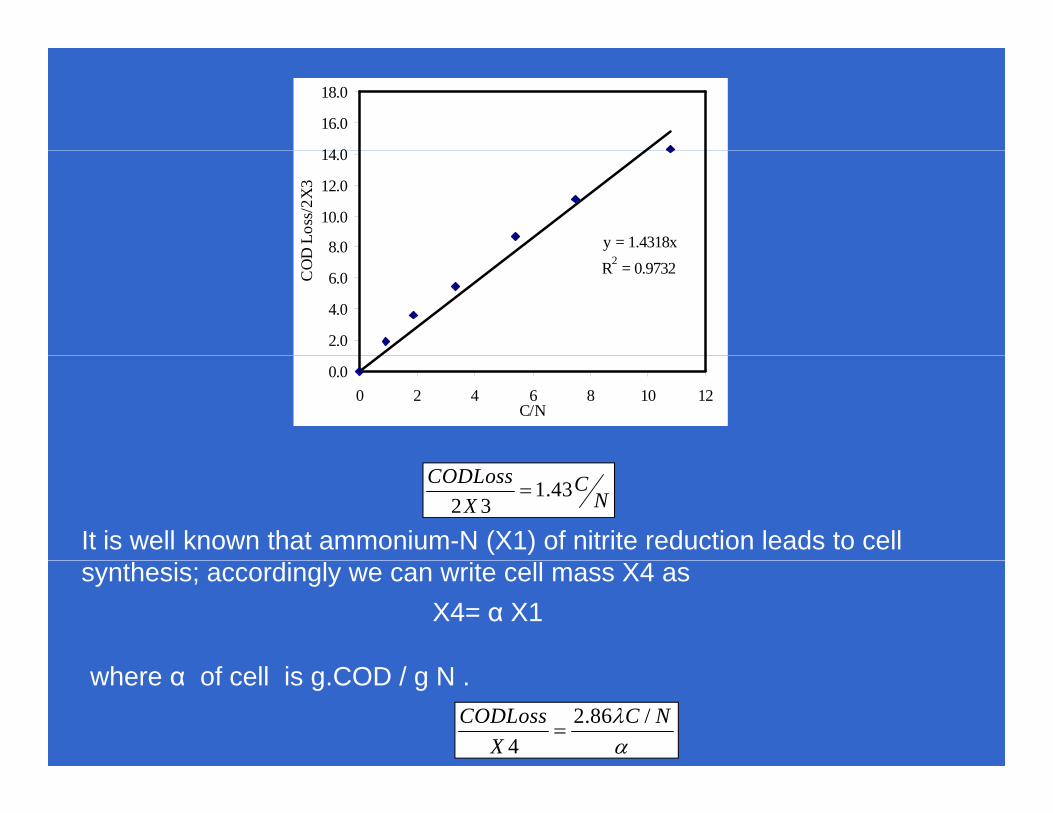
1.432 3
CODLoss CNX
=
It is well known that ammonium-N (X1) of nitrite reduction leads to cell
X4= α X1 synthesis; accordingly we can write cell mass X4 as
where α of cell is g.COD / g N . 2.86 /
4CODLoss C N
Xλα
=
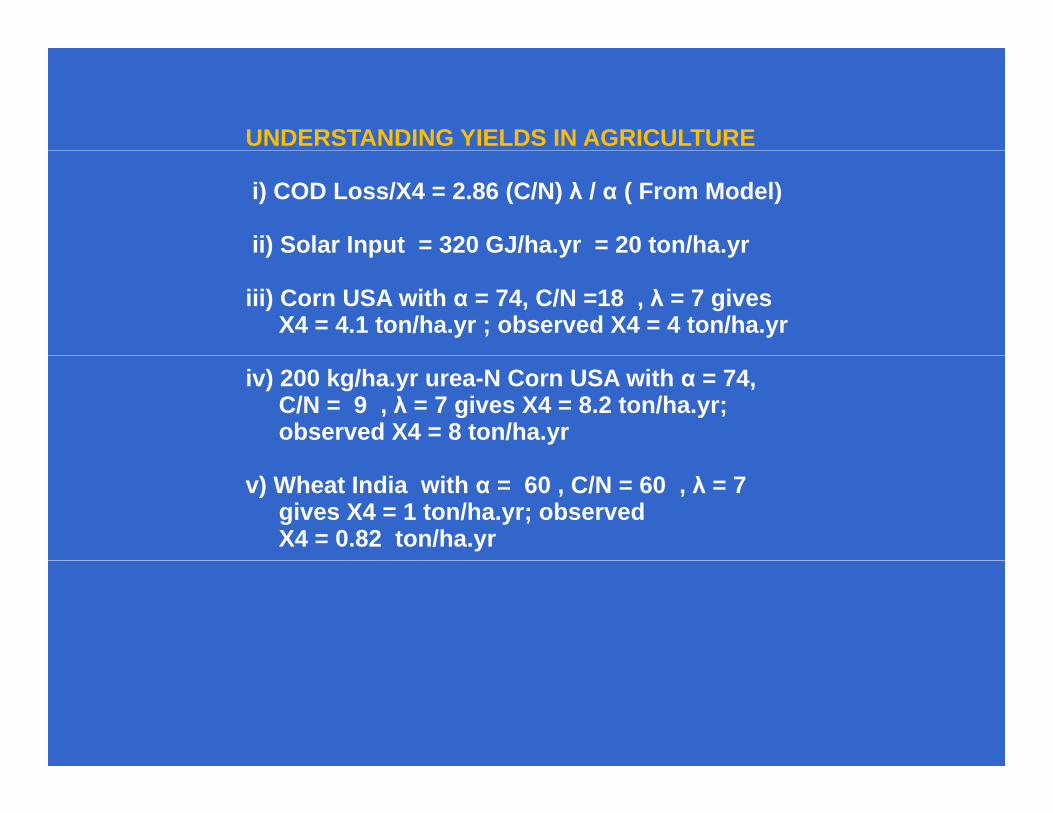
UNDERSTANDING YIELDS IN AGRICULTURE
i) COD Loss/X4 = 2.86 (C/N) λ / α ( From Model)
ii) Solar Input = 320 GJ/ha.yr = 20 ton/ha.yr) p y y
iii) Corn USA with α = 74, C/N =18 , λ = 7 givesX4 = 4.1 ton/ha.yr ; observed X4 = 4 ton/ha.yr
iv) 200 kg/ha.yr urea-N Corn USA with α = 74, C/N = 9 , λ = 7 gives X4 = 8.2 ton/ha.yr;observed X4 = 8 ton/ha.yr
v) Wheat India with α = 60 , C/N = 60 , λ = 7gives X4 = 1 ton/ha.yr; observed X4 = 0.82 ton/ha.yr
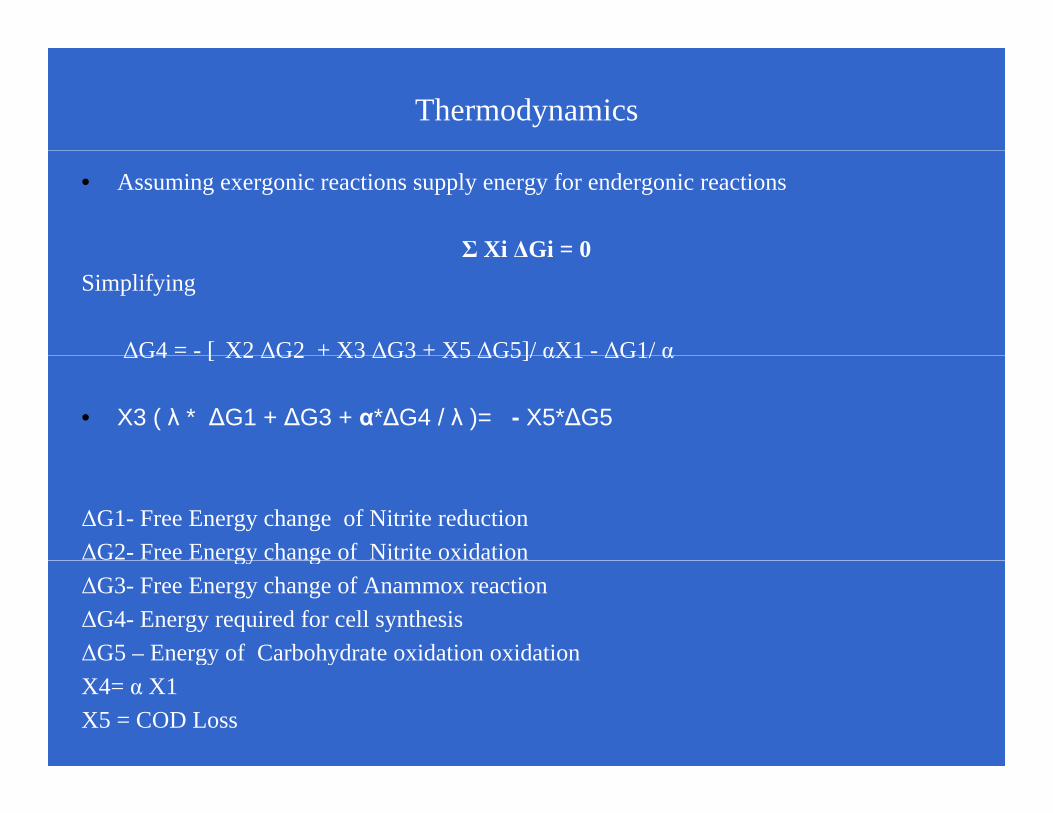
Thermodynamics
• Assuming exergonic reactions supply energy for endergonic reactions
Σ Xi ΔGi = 0Σ Xi ΔGi 0Simplifying
ΔG4 = - [ X2 ΔG2 + X3 ΔG3 + X5 ΔG5]/ αX1 - ΔG1/ αΔG4 [ X2 ΔG2 + X3 ΔG3 + X5 ΔG5]/ αX1 ΔG1/ α
• X3 ( λ * ∆G1 + ∆G3 + α*∆G4 / λ )= - X5*∆G5
ΔG1- Free Energy change of Nitrite reductionΔG2- Free Energy change of Nitrite oxidationgy gΔG3- Free Energy change of Anammox reactionΔG4- Energy required for cell synthesisΔG5 – Energy of Carbohydrate oxidation oxidationgy yX4= α X1X5 = COD Loss
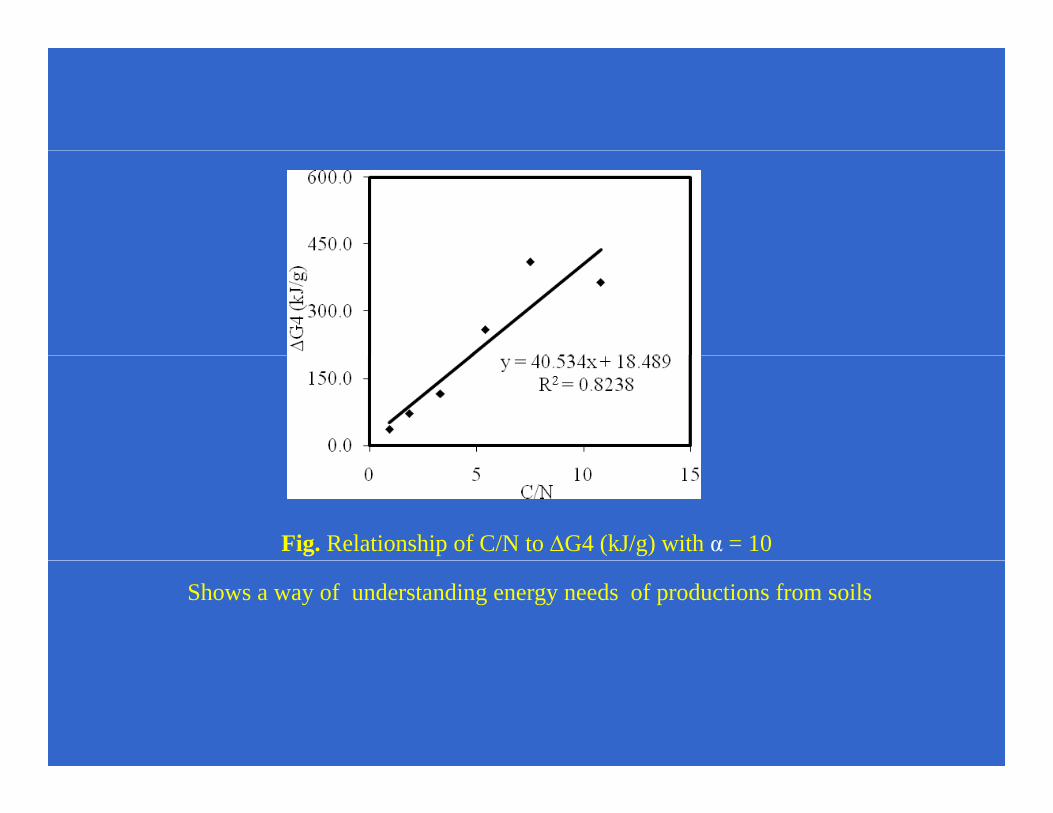
Fig. Relationship of C/N to ΔG4 (kJ/g) with α = 10
Shows a way of understanding energy needs of productions from soils
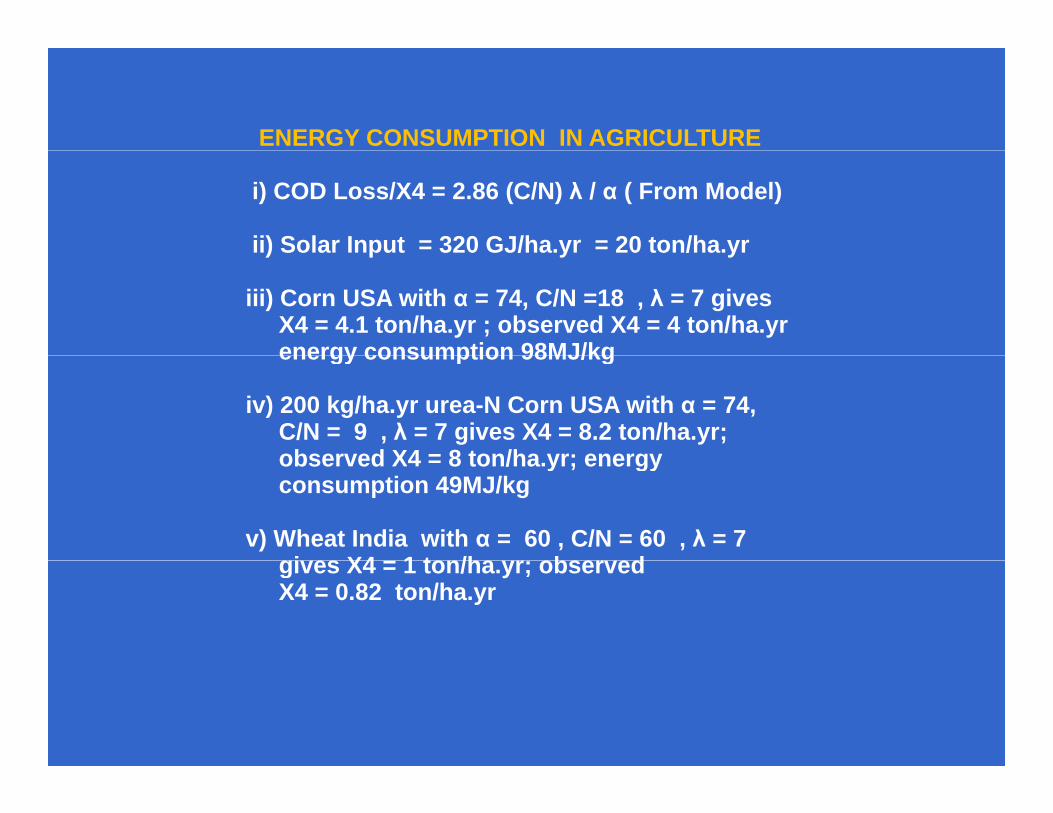
ENERGY CONSUMPTION IN AGRICULTURE
i) COD Loss/X4 = 2.86 (C/N) λ / α ( From Model)
ii) Solar Input = 320 GJ/ha.yr = 20 ton/ha.yr) p y y
iii) Corn USA with α = 74, C/N =18 , λ = 7 givesX4 = 4.1 ton/ha.yr ; observed X4 = 4 ton/ha.yrenergy consumption 98MJ/kgenergy consumption 98MJ/kg
iv) 200 kg/ha.yr urea-N Corn USA with α = 74, C/N = 9 , λ = 7 gives X4 = 8.2 ton/ha.yr;observed X4 = 8 ton/ha yr; energyobserved X4 = 8 ton/ha.yr; energy consumption 49MJ/kg
v) Wheat India with α = 60 , C/N = 60 , λ = 7gi es X4 1 ton/ha r obser edgives X4 = 1 ton/ha.yr; observed X4 = 0.82 ton/ha.yr
Hydrogen production 160 MJ/kg; Ammonia production 32 MJ/kgAmerican Soil C/N 3.5 to 35

Film : India Innovates(Min. of Ext. Affairs)
http://www youtube com/watch?v=dKWVtZ81mY0http://www.youtube.com/watch?v dKWVtZ81mY0
http://www.che.iitb.ac.in/faculty/hss/hss-web.html.

Experimental Equipment CSF & CFCSF & CF
bInfluent
Influent Pump
CSF di
α+ bα
Multi layer Glass column with media
CSF media
CF media
Effluent
Effluent
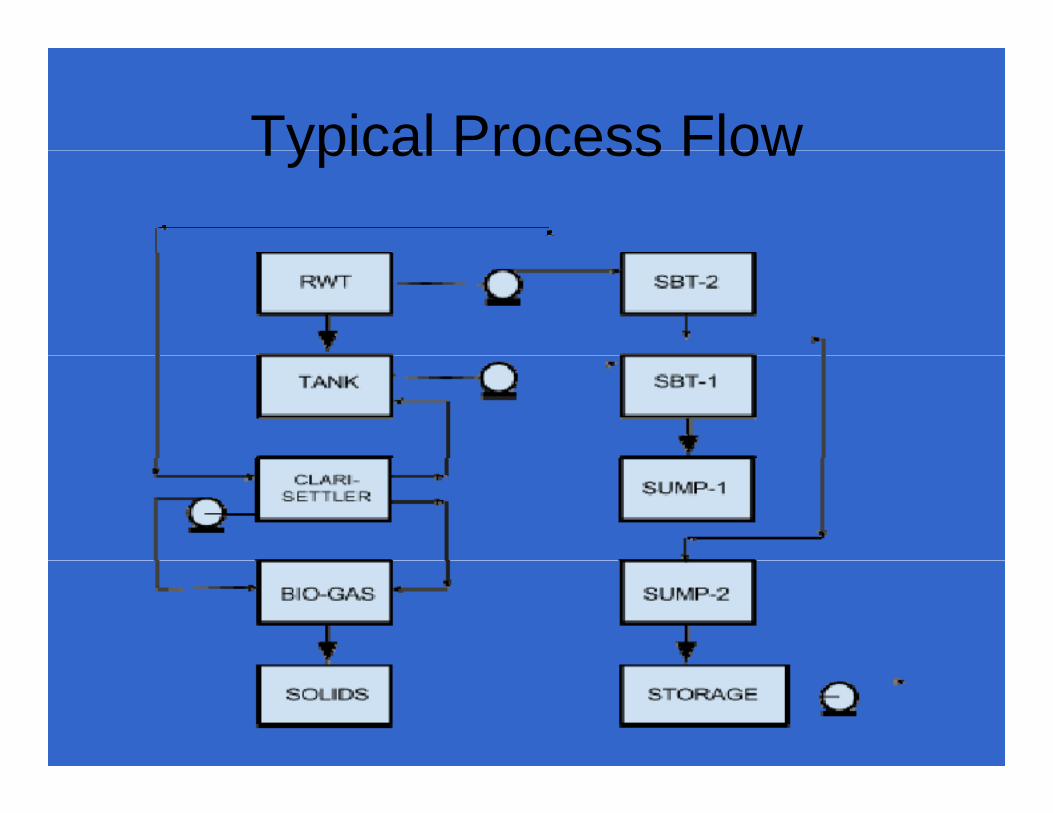
Typical Process FlowTypical Process Flow
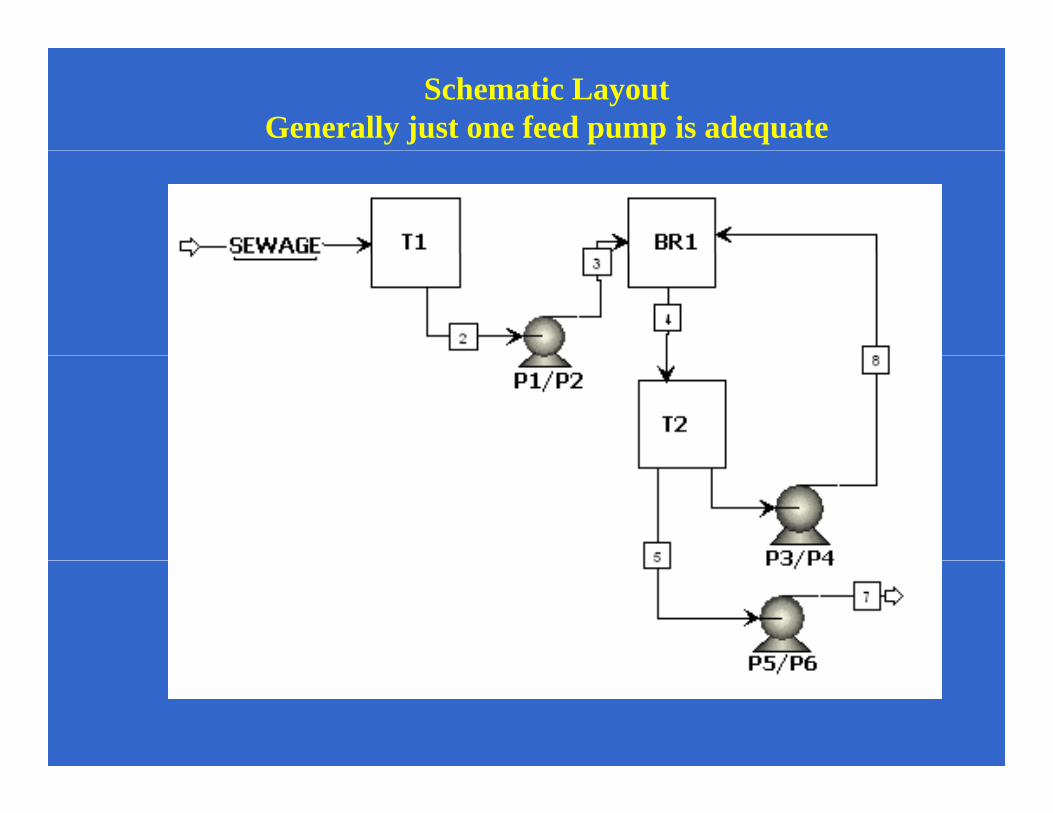
Schematic Layout Generally just one feed pump is adequate

PRESENTATION SUMMARY