Embed Size (px)
Citation preview

Prof Greg Clark CBESenior Non Resident FellowBrookings Institution
Committee for Sydney
Sydney March 2017
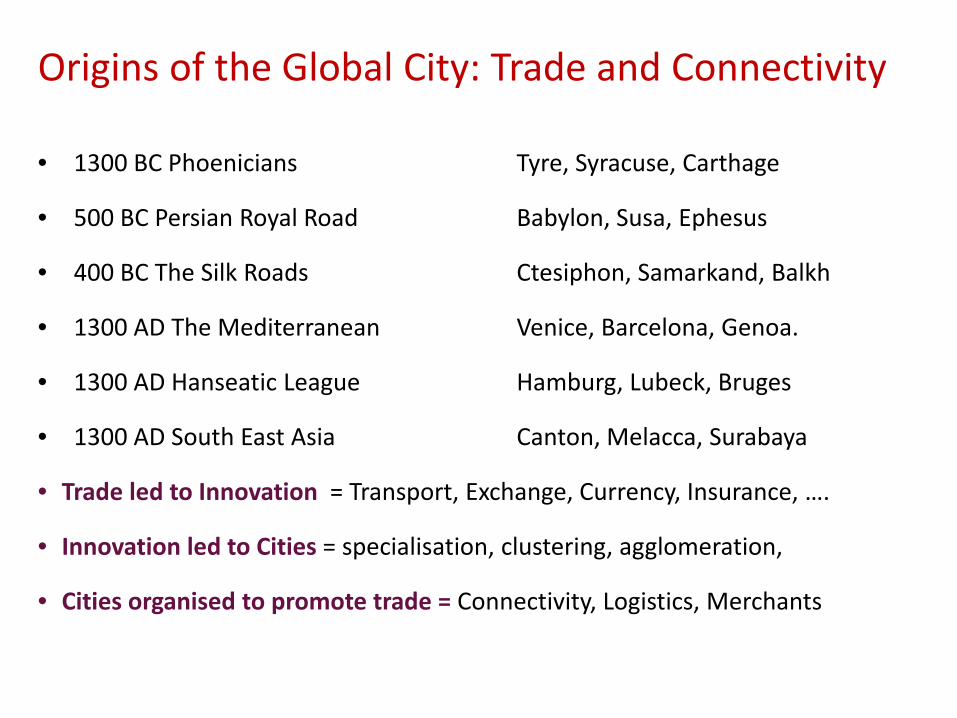
• 1300 BC Phoenicians Tyre, Syracuse, Carthage
• 500 BC Persian Royal Road Babylon, Susa, Ephesus
• 400 BC The Silk Roads Ctesiphon, Samarkand, Balkh
• 1300 AD The Mediterranean Venice, Barcelona, Genoa.
• 1300 AD Hanseatic League Hamburg, Lubeck, Bruges
• 1300 AD South East Asia Canton, Melacca, Surabaya
• Trade led to Innovation = Transport, Exchange, Currency, Insurance, ….
• Innovation led to Cities = specialisation, clustering, agglomeration,
• Cities organised to promote trade = Connectivity, Logistics, Merchants
Origins of the Global City: Trade and Connectivity
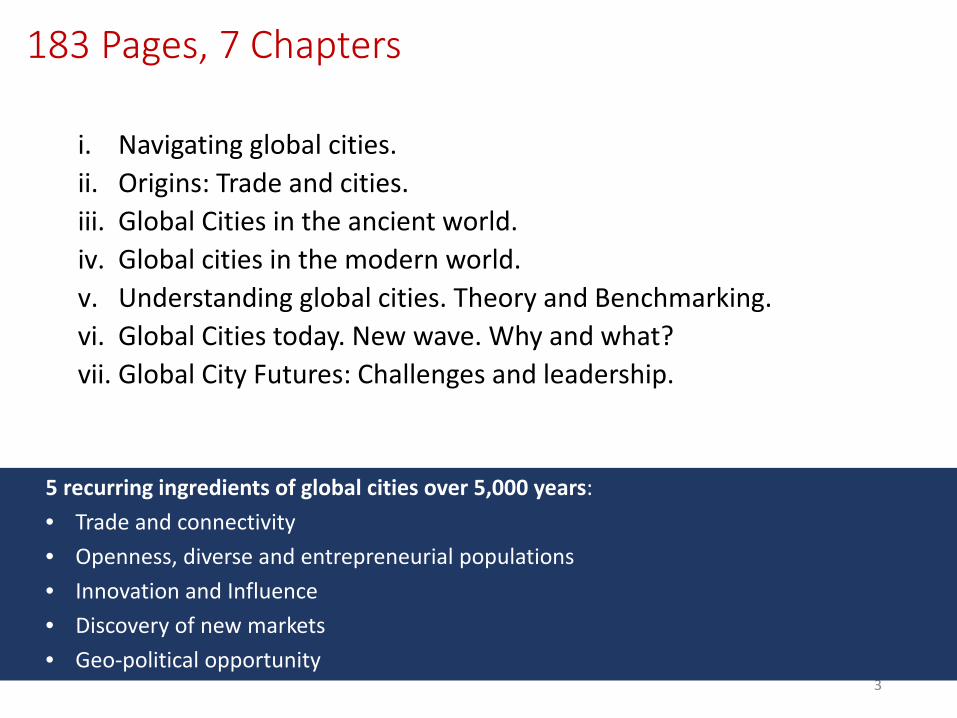
183 Pages, 7 Chapters
i. Navigating global cities.ii. Origins: Trade and cities.iii. Global Cities in the ancient world.iv. Global cities in the modern world.v. Understanding global cities. Theory and Benchmarking.vi. Global Cities today. New wave. Why and what?vii. Global City Futures: Challenges and leadership.
3
5 recurring ingredients of global cities over 5,000 years:• Trade and connectivity • Openness, diverse and entrepreneurial populations• Innovation and Influence• Discovery of new markets• Geo-political opportunity
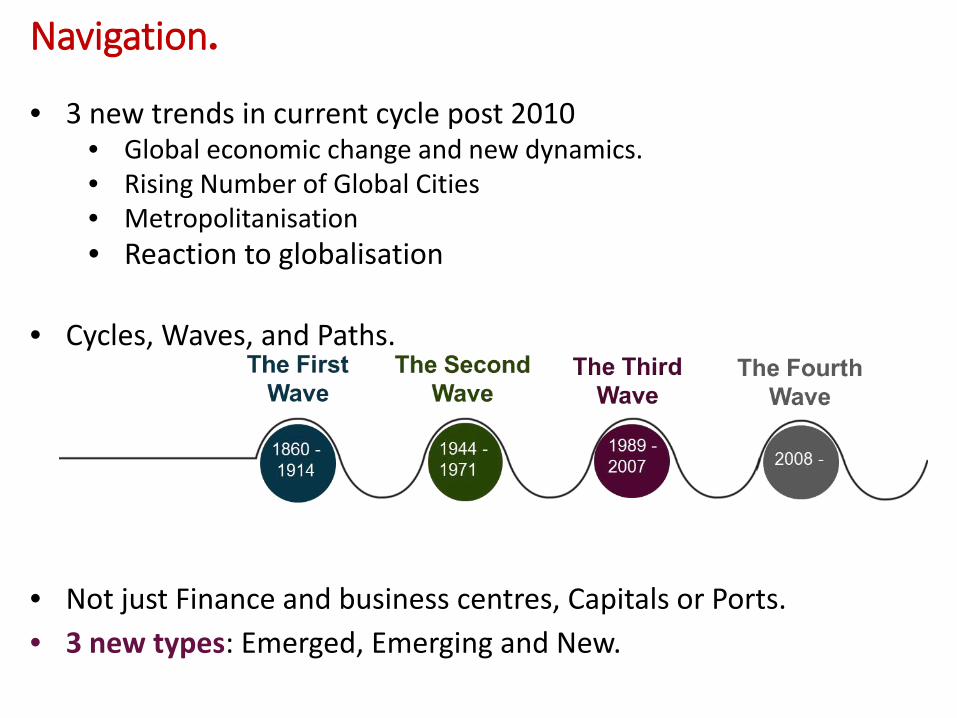
Navigation.
• 3 new trends in current cycle post 2010• Global economic change and new dynamics.• Rising Number of Global Cities• Metropolitanisation• Reaction to globalisation
• Cycles, Waves, and Paths.
• Not just Finance and business centres, Capitals or Ports.• 3 new types: Emerged, Emerging and New.
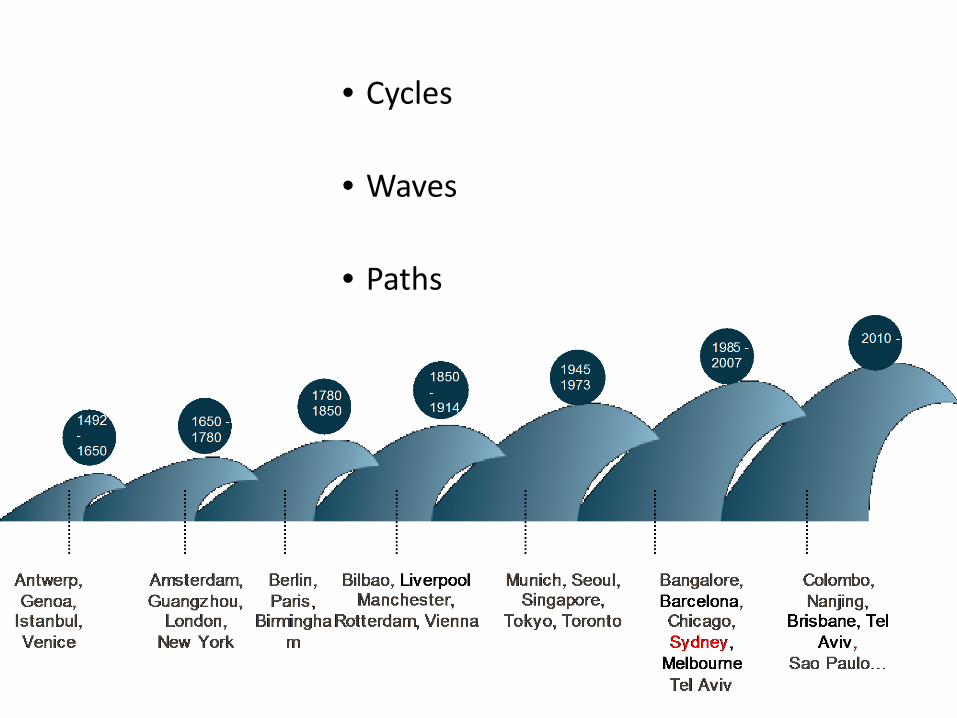
• Cycles
• Waves
• Paths

The Royal Road ~500 B.C.
Money, road building, architecture, metallurgy, taxation, shared language
Innovations
Externalities Rise of separatist provinces, military disorganisation
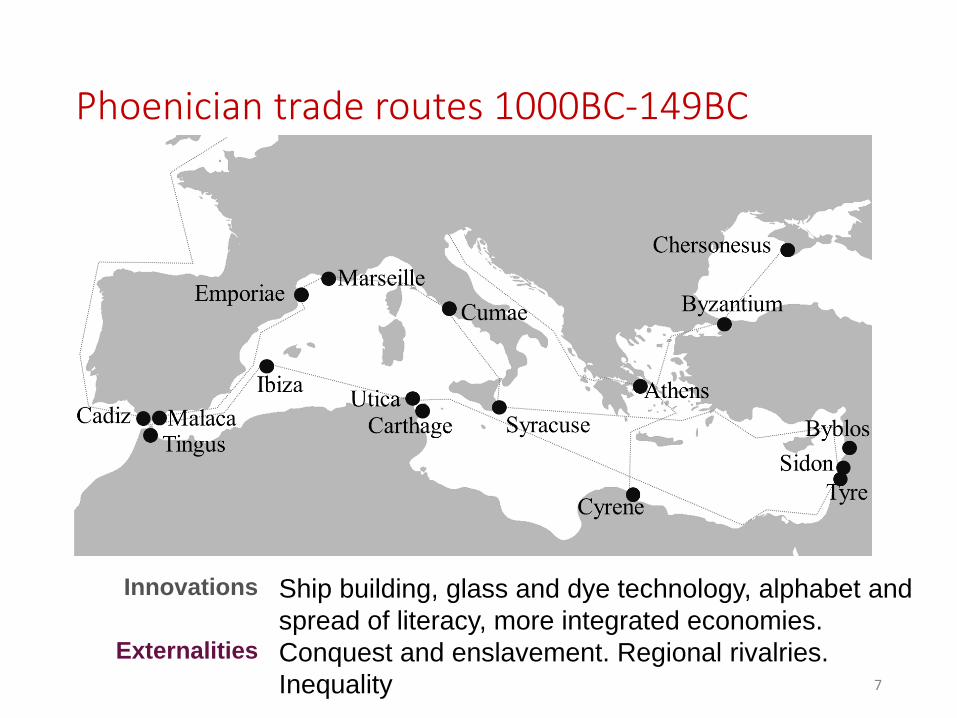
Phoenician trade routes 1000BC-149BC
7
Ship building, glass and dye technology, alphabet and spread of literacy, more integrated economies.Conquest and enslavement. Regional rivalries. Inequality
Externalities
Innovations
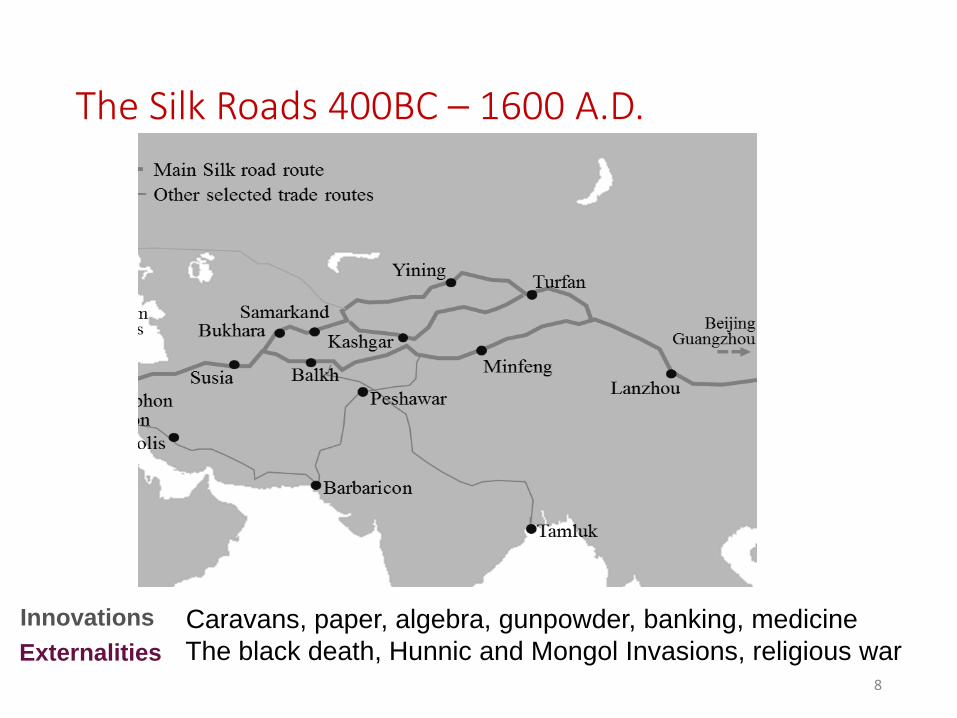
The Silk Roads 400BC – 1600 A.D.
8
Caravans, paper, algebra, gunpowder, banking, medicineThe black death, Hunnic and Mongol Invasions, religious warExternalities
Innovations

The Hanseatic League 1250-1550
9
Commercial organisationShipbuildingBanking
Restrictive trade monopoliesSelf interest of individual citiesFailure to adjust to new markets
Externalities
Innovations
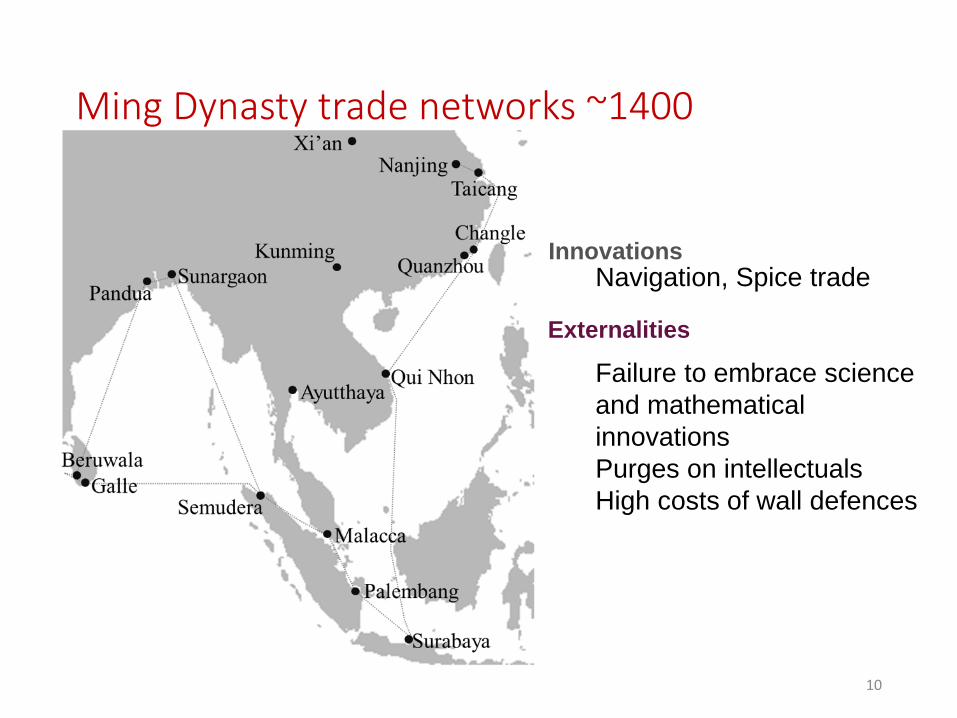
Ming Dynasty trade networks ~1400
10
Navigation, Spice trade
Failure to embrace science and mathematical innovationsPurges on intellectualsHigh costs of wall defences
Innovations
Externalities

Atlantic Slave Trade network 1500-1830
11
Externalities
InnovationsImprovements in navigation, ship-building, mercantilism, early capitalism, spread of Enlightenment ideals, property rights, capital markets, canals
Mass slavery, economic division, piracy, social dislocation
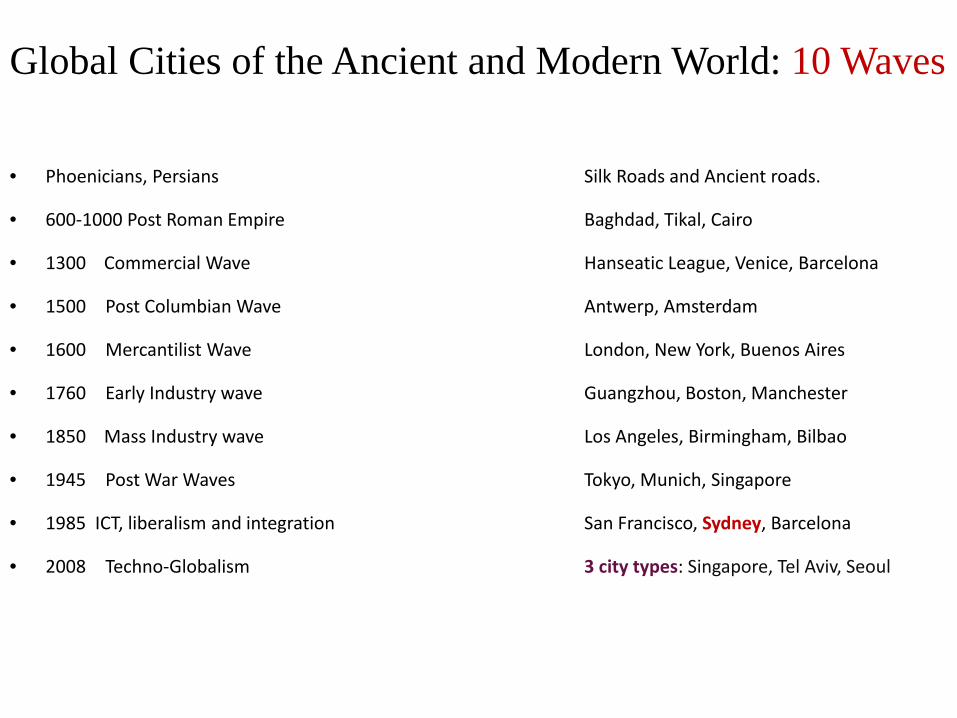
Global Cities of the Ancient and Modern World: 10 Waves
• Phoenicians, Persians Silk Roads and Ancient roads.
• 600-1000 Post Roman Empire Baghdad, Tikal, Cairo
• 1300 Commercial Wave Hanseatic League, Venice, Barcelona
• 1500 Post Columbian Wave Antwerp, Amsterdam
• 1600 Mercantilist Wave London, New York, Buenos Aires
• 1760 Early Industry wave Guangzhou, Boston, Manchester
• 1850 Mass Industry wave Los Angeles, Birmingham, Bilbao
• 1945 Post War Waves Tokyo, Munich, Singapore
• 1985 ICT, liberalism and integration San Francisco, Sydney, Barcelona
• 2008 Techno-Globalism 3 city types: Singapore, Tel Aviv, Seoul

Global Cities of the Ancient and Modern World
• Alexandria 334BC – 1450s
• Grain and Silk Roads port. Multicultural cross-roads and became city of knowledge.
13
Guangzhou 10th-15th C 1760-1850s
China’s maritime gatewayTea, opium, war.
Baghdad 8th-10th C Heart of Islamic single
market. A ‘showcase’ city open to new cultures:
progress in sciences.

Global Cities of the Ancient and Modern World
Vienna 1815-1914; 1995-Present• From cosmopolitan capital to
Fascism. Reborn as city of diplomacy, culture, tourism and regional finance.
14
San Francisco 1970s-Present• ICT driven by
R&D network, quality of life and local VC finance
Amsterdam 1550-1700
Financial and trade innovation. Colonies and canals = European distribution hub.
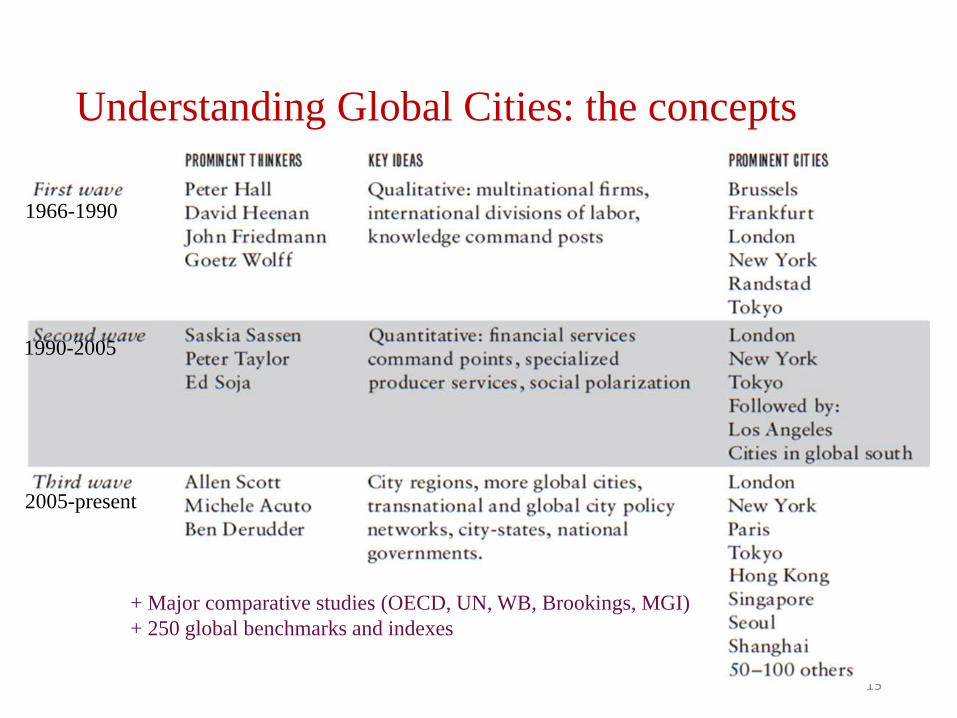
Understanding Global Cities: the concepts
15
+ Major comparative studies (OECD, UN, WB, Brookings, MGI) + 250 global benchmarks and indexes
1966-1990
1990-2005
2005-present
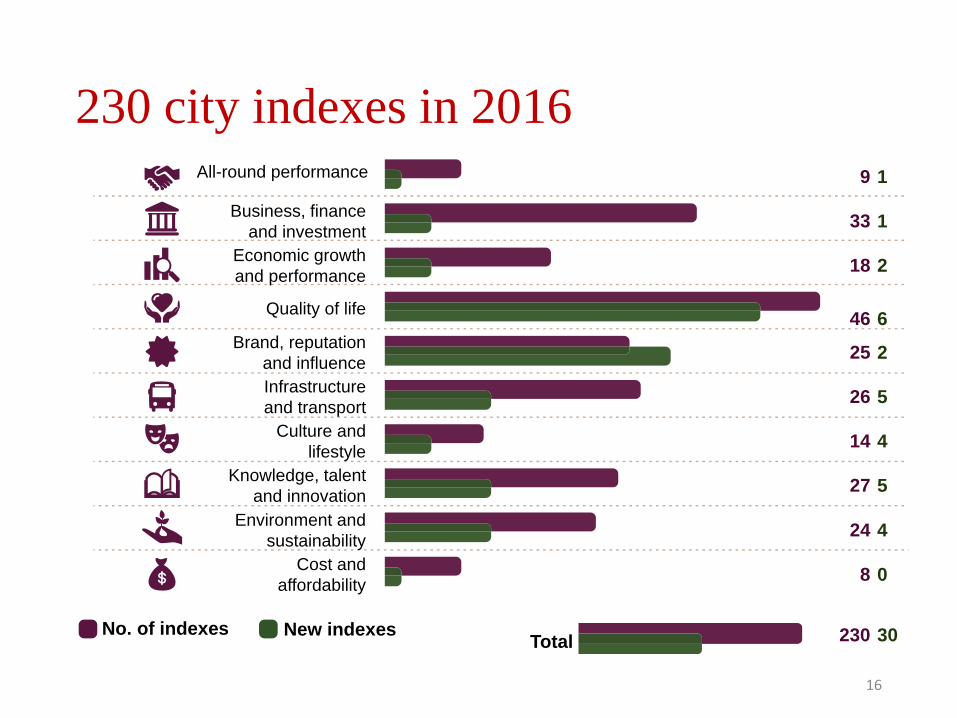
230 city indexes in 2016
16
All-round performance
Business, financeand investment
Economic growthand performance
Quality of life
Brand, reputationand influenceInfrastructureand transport
Culture andlifestyle
Knowledge, talentand innovation
Environment andsustainability
Cost andaffordability
No. of indexes Total
9
33
18
46
25
26
14
27
24
8
1
1
2
6
2
5
4
5
4
0
230 30New indexes

Current Wave: Global Cities today
• London
• New York• Hong Kong
• Paris
• Tokyo• Singapore
• + Toronto, Seoul, Sydney, Chicago, Amsterdam.
Shanghai, Beijing, Istanbul, Mumbai, Sao Paulo, Mexico City, Joburg+10-20 others
Sydney, Toronto, Stockholm, Barcelona, San Diego, Nanjing, Brisbane, Oslo, Tel Aviv, Cape Town,Auckland+20-40 others
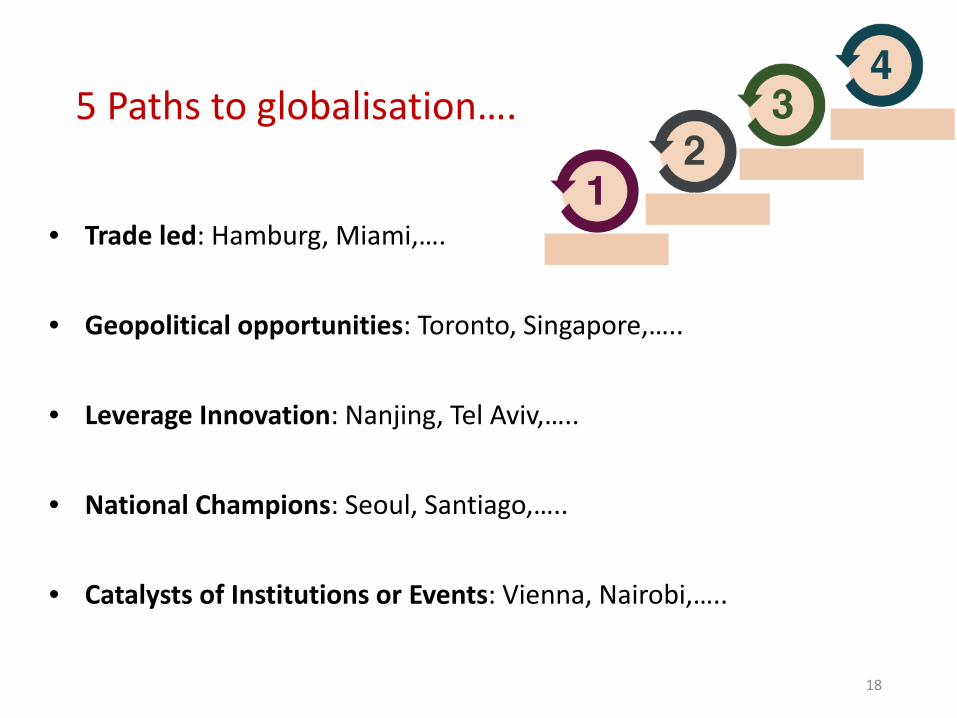
5 Paths to globalisation….
• Trade led: Hamburg, Miami,….
• Geopolitical opportunities: Toronto, Singapore,…..
• Leverage Innovation: Nanjing, Tel Aviv,…..
• National Champions: Seoul, Santiago,…..
• Catalysts of Institutions or Events: Vienna, Nairobi,…..
18

19
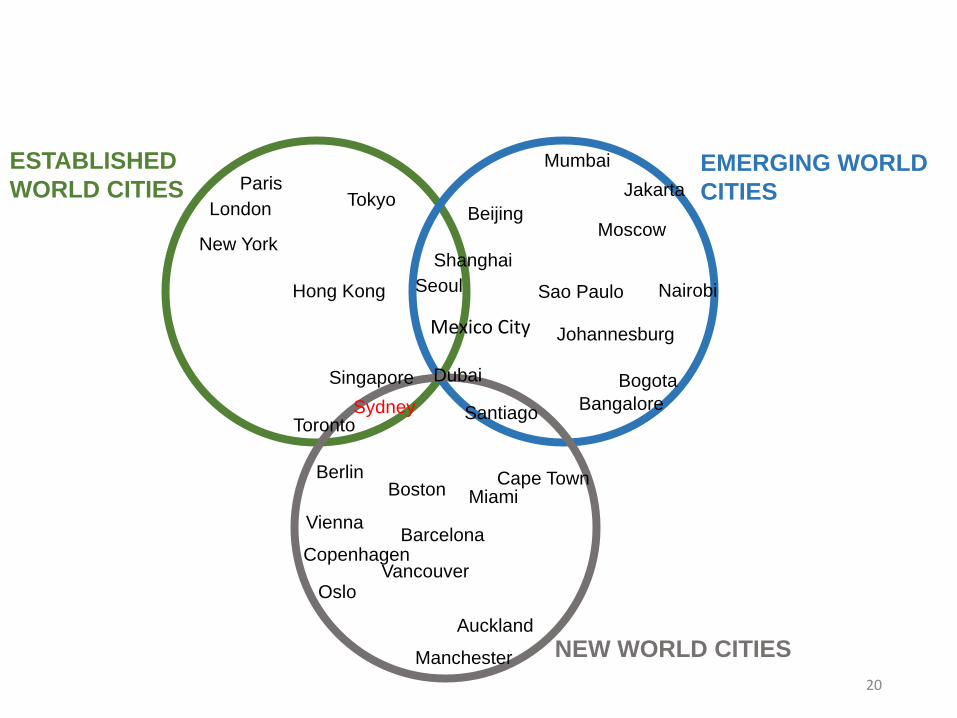
20
NEW WORLD CITIES
EMERGING WORLD CITIES
ESTABLISHED WORLD CITIES
London
New York
ParisTokyo
Hong Kong
Singapore
Shanghai
Beijing
Seoul
SydneyToronto
Berlin
Santiago
Sao Paulo
Johannesburg
Moscow
Jakarta
Dubai
Vancouver
Manchester
Auckland
Copenhagen
Vienna
Oslo
Boston
Barcelona
MiamiCape Town
Bogota
Nairobi
Bangalore
Mumbai
Mexico City
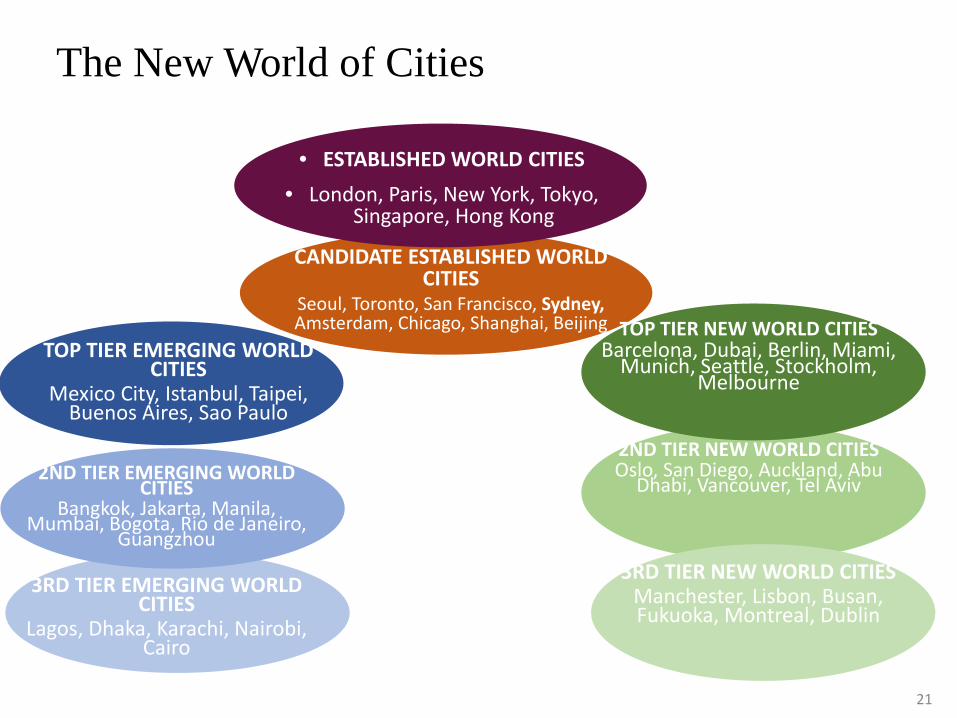
2ND TIER NEW WORLD CITIESOslo, San Diego, Auckland, Abu
Dhabi, Vancouver, Tel Aviv
3RD TIER NEW WORLD CITIESManchester, Lisbon, Busan, Fukuoka, Montreal, Dublin
• ESTABLISHED WORLD CITIES• London, Paris, New York, Tokyo,
Singapore, Hong Kong
21
CANDIDATE ESTABLISHED WORLD CITIES
Seoul, Toronto, San Francisco, Sydney, Amsterdam, Chicago, Shanghai, Beijing
TOP TIER EMERGING WORLD CITIES
Mexico City, Istanbul, Taipei, Buenos Aires, Sao Paulo
TOP TIER NEW WORLD CITIESBarcelona, Dubai, Berlin, Miami,
Munich, Seattle, Stockholm, Melbourne
2ND TIER EMERGING WORLD CITIES
Bangkok, Jakarta, Manila, Mumbai, Bogota, Rio de Janeiro,
Guangzhou
3RD TIER EMERGING WORLD CITIES
Lagos, Dhaka, Karachi, Nairobi, Cairo
The New World of Cities

Sydney among world cities
22
Sydney• An established world city and a new high quality of
life city.• Hybrid of Established World City and New World
City : two different eco-systems? Like Singapore, Toronto, Tel Aviv, Amsterdam.
• A winning city: many assets and big opportunities. But is it prepared for 2-3 cycles of growth?
• Sydney needs to shape and manage success • Weaknesses have to be addressed
23

Sydney’s peers
Hybrid established/new world cities:
• Toronto, Singapore
Most similar global services firms concentrations:
• Chicago, Milan
Most similar basic economic profile:
• Vancouver, Amsterdam, Tel Aviv
Most similar post-crisis performance since 2008:
Berlin, Tel Aviv, Hamburg
Other similar cities by size, scale, assets and internationalisation:
Madrid, Miami, Barcelona, San Francisco, Vienna, San Diego, Taipei, Santiago, Cape Town Source: Brookings Global Metro Monitor 201524
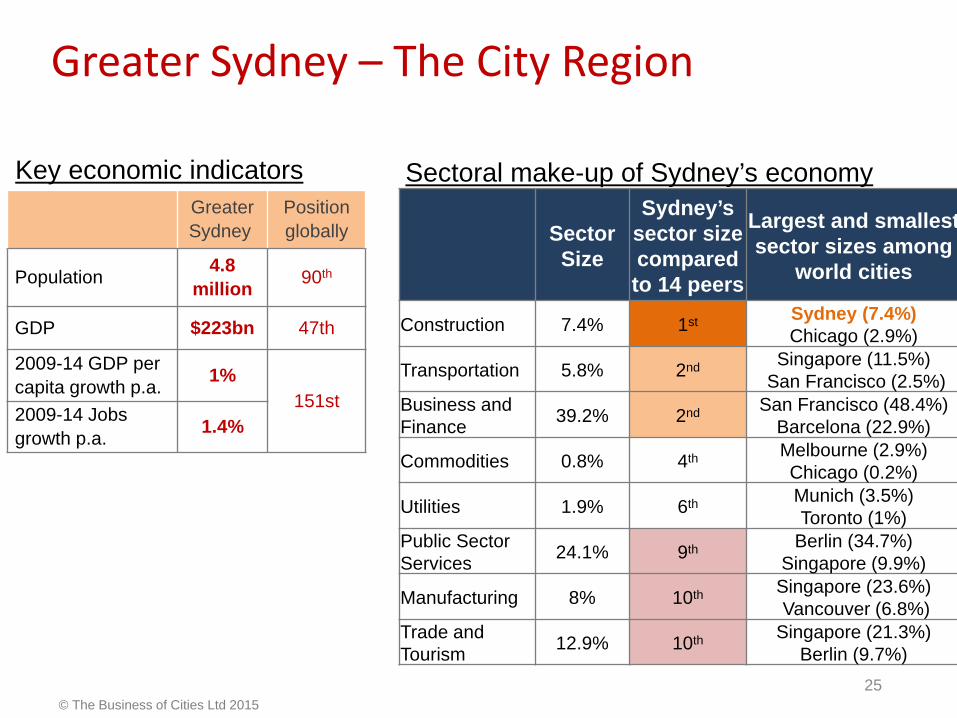
Greater Sydney
Position globally
Population 4.8 million 90th
GDP $223bn 47th
2009-14 GDP per capita growth p.a. 1%
151st2009-14 Jobs growth p.a. 1.4%
Greater Sydney – The City Region
© The Business of Cities Ltd 2015
Sector Size
Sydney’s sector size compared to 14 peers
Largest and smallest sector sizes among
world cities
Construction 7.4% 1st Sydney (7.4%) Chicago (2.9%)
Transportation 5.8% 2nd Singapore (11.5%)San Francisco (2.5%)
Business and Finance 39.2% 2nd San Francisco (48.4%)
Barcelona (22.9%)
Commodities 0.8% 4th Melbourne (2.9%)Chicago (0.2%)
Utilities 1.9% 6th Munich (3.5%)Toronto (1%)
Public Sector Services 24.1% 9th Berlin (34.7%)
Singapore (9.9%)
Manufacturing 8% 10th Singapore (23.6%)Vancouver (6.8%)
Trade and Tourism 12.9% 10th Singapore (21.3%)
Berlin (9.7%)
Sectoral make-up of Sydney’s economyKey economic indicators
25
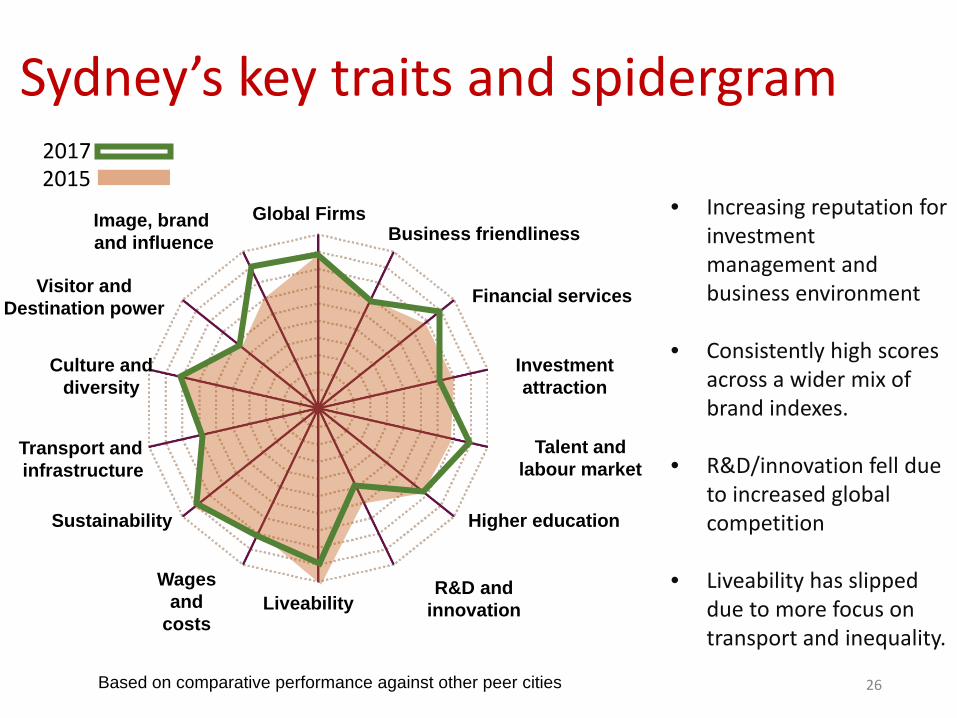
Sydney’s key traits and spidergram
26
Global FirmsBusiness friendliness
Financial services
Investment attraction
Talent and labour market
Higher education
R&D and innovationLiveability
Wages and
costs
Sustainability
Transport and infrastructure
Culture and diversity
Visitor and Destination power
Image, brand and influence
• Increasing reputation for investment management and business environment
• Consistently high scores across a wider mix of brand indexes.
• R&D/innovation fell due to increased global competition
• Liveability has slipped due to more focus on transport and inequality.
20172015
Based on comparative performance against other peer cities
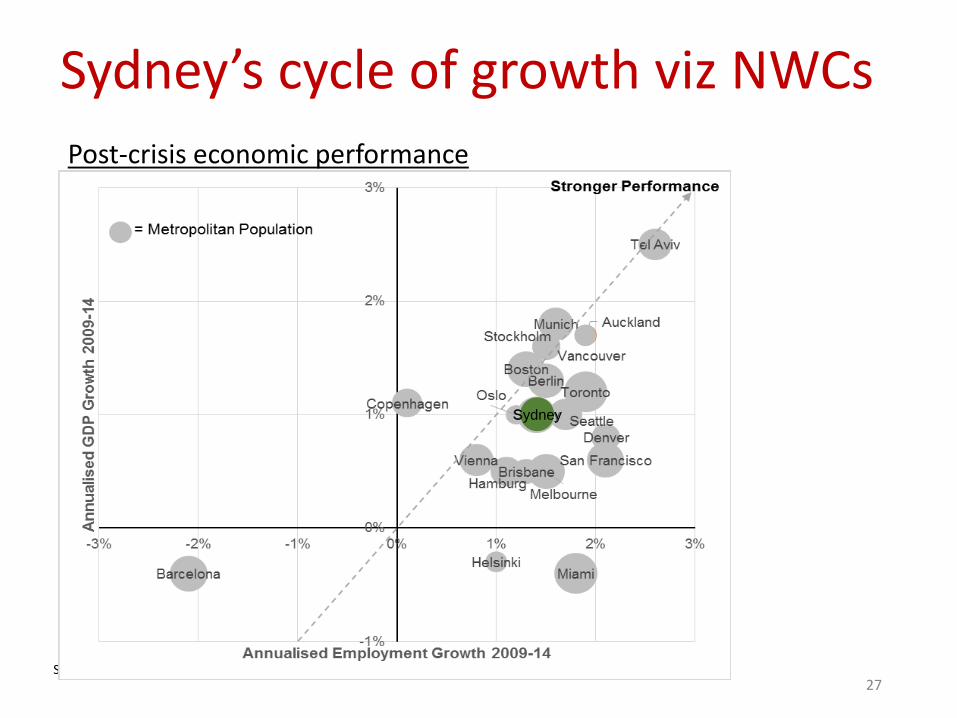
Sydney’s cycle of growth viz NWCs
27
Post-crisis economic performance
Source: Brookings and GaWC
Sydney
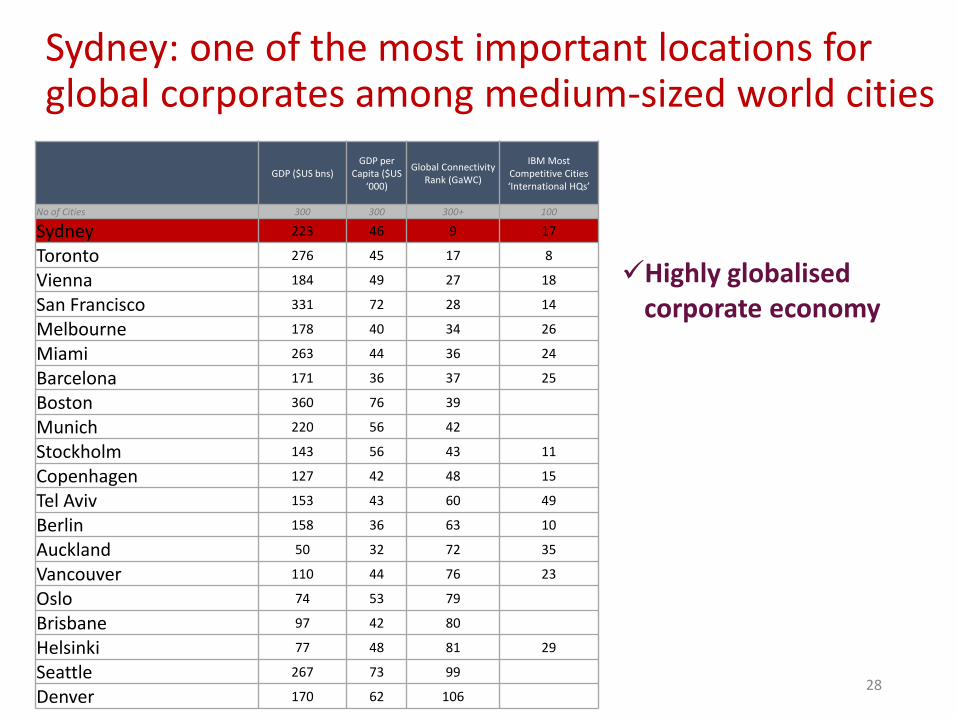
Sydney: one of the most important locations for global corporates among medium-sized world cities
28
Highly globalised corporate economy
GDP ($US bns)GDP per
Capita ($US ‘000)
Global Connectivity Rank (GaWC)
IBM Most Competitive Cities ‘International HQs’
No of Cities 300 300 300+ 100
Sydney 223 46 9 17
Toronto 276 45 17 8
Vienna 184 49 27 18
San Francisco 331 72 28 14
Melbourne 178 40 34 26
Miami 263 44 36 24
Barcelona 171 36 37 25
Boston 360 76 39
Munich 220 56 42
Stockholm 143 56 43 11
Copenhagen 127 42 48 15
Tel Aviv 153 43 60 49
Berlin 158 36 63 10
Auckland 50 32 72 35
Vancouver 110 44 76 23
Oslo 74 53 79
Brisbane 97 42 80
Helsinki 77 48 81 29
Seattle 267 73 99
Denver 170 62 106
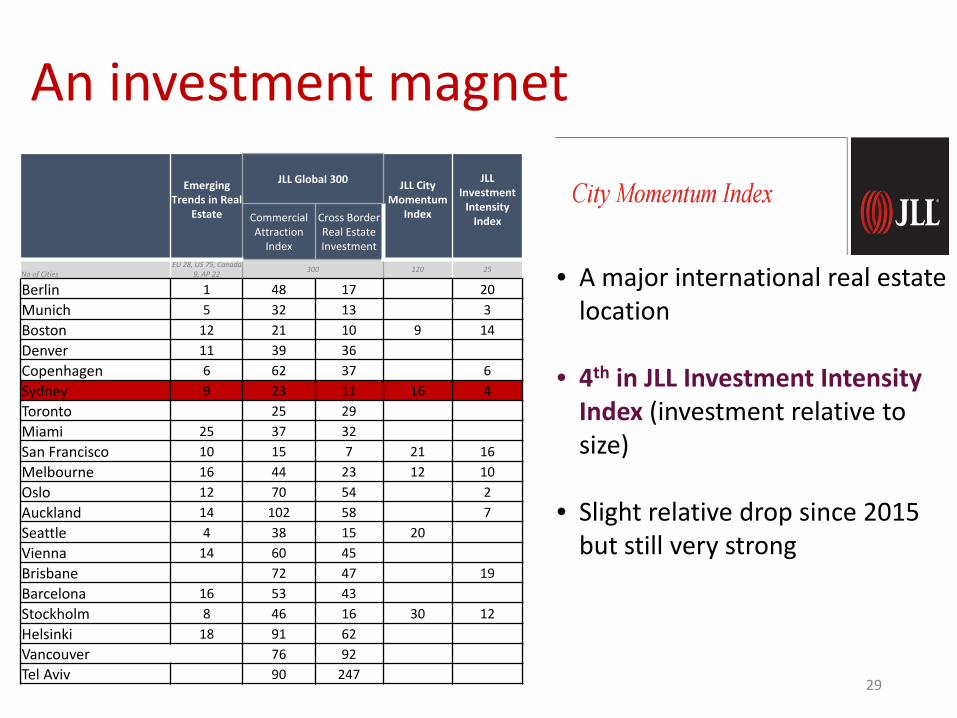
An investment magnet
29
Emerging Trends in Real
Estate
JLL Global 300 JLL City Momentum
Index
JLL Investment
Intensity IndexCommercial
Attraction Index
Cross Border Real Estate Investment
No of CitiesEU 28, US 75, Canada
9, AP 22 300 120 25
Berlin 1 48 17 20Munich 5 32 13 3Boston 12 21 10 9 14Denver 11 39 36Copenhagen 6 62 37 6Sydney 9 23 11 16 4Toronto 25 29Miami 25 37 32San Francisco 10 15 7 21 16Melbourne 16 44 23 12 10Oslo 12 70 54 2Auckland 14 102 58 7Seattle 4 38 15 20Vienna 14 60 45Brisbane 72 47 19Barcelona 16 53 43Stockholm 8 46 16 30 12Helsinki 18 91 62Vancouver 76 92Tel Aviv 90 247
• A major international real estate location
• 4th in JLL Investment Intensity Index (investment relative to size)
• Slight relative drop since 2015 but still very strong

A top 10 quality of life destination
30
Specialisation in newly traded
markets
RankMelbourne 2Sydney 4Berlin 9Munich 11Vancouver 13Toronto 13Boston 13Vienna 16Auckland 18Brisbane 18Stockholm 24Copenhagen 27San Francisco 27Barcelona 30Helsinki 34Oslo 60
QS Best Student Cities
Mercer Quality of
Living Survey
EIU Liveability Ranking
Global Liveable
Cities Ranking
ArcadisSustainable Cities Index
'People'
MonocleQuality of
Life Survey
No. of Cities 230 140 63 100 25
Vienna 1 2 4 3Berlin 13 20 11 5 2Munich 4 28 8 5Melbourne 15 1 13 22 6Helsinki 30 10 4 12Copenhagen 9 22 9 24 4Stockholm 19 24 5 14 10Vancouver 5 3 12 23 11Sydney 10 7 14 25 8Auckland 3 9 8 22Toronto 15 4 40Brisbane 36 18 21Barcelona 39 31 29 13 19Boston 34 33 23 41San Francisco 28 49 54Seattle 46 46 61Miami 66 37 89Tel Aviv 104 76

Exceptional brand with global audiences
31
City RepTrak Brand scores, 2016
• Strong reputation for visitor and resident amenities
• Less strong in measures of global influence, culture and nightlife.
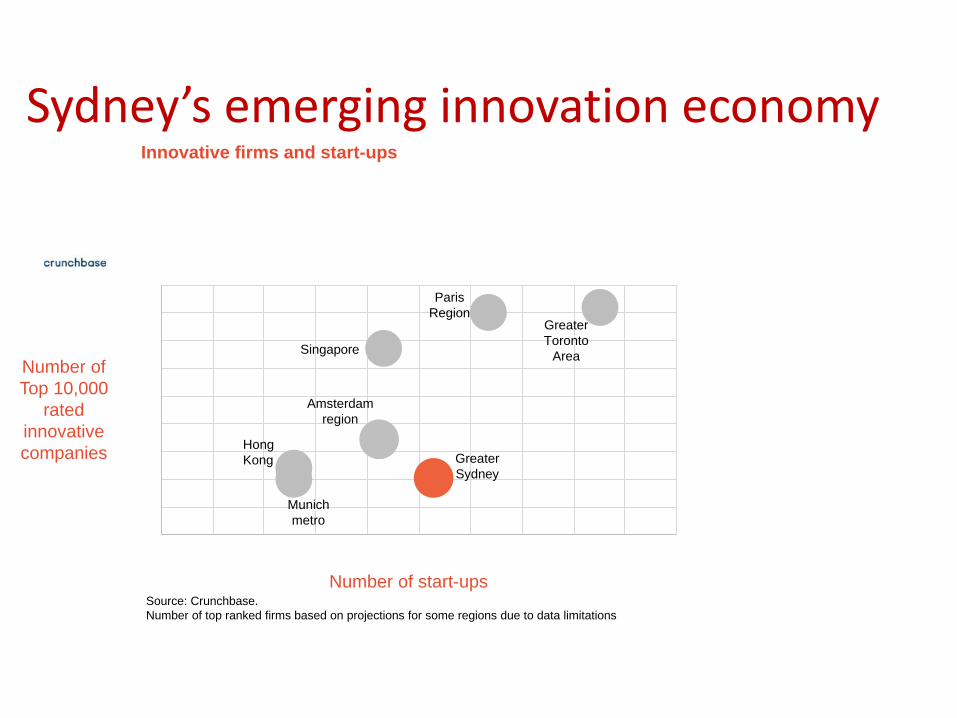
Sydney’s emerging innovation economy
Hong Kong
Paris Region
Singapore
Greater Sydney
Greater Toronto
Area
Munich metro
Amsterdam region
Number of Top 10,000
rated innovative companies
Number of start-ups
Innovative firms and start-ups
Source: Crunchbase. Number of top ranked firms based on projections for some regions due to data limitations
33
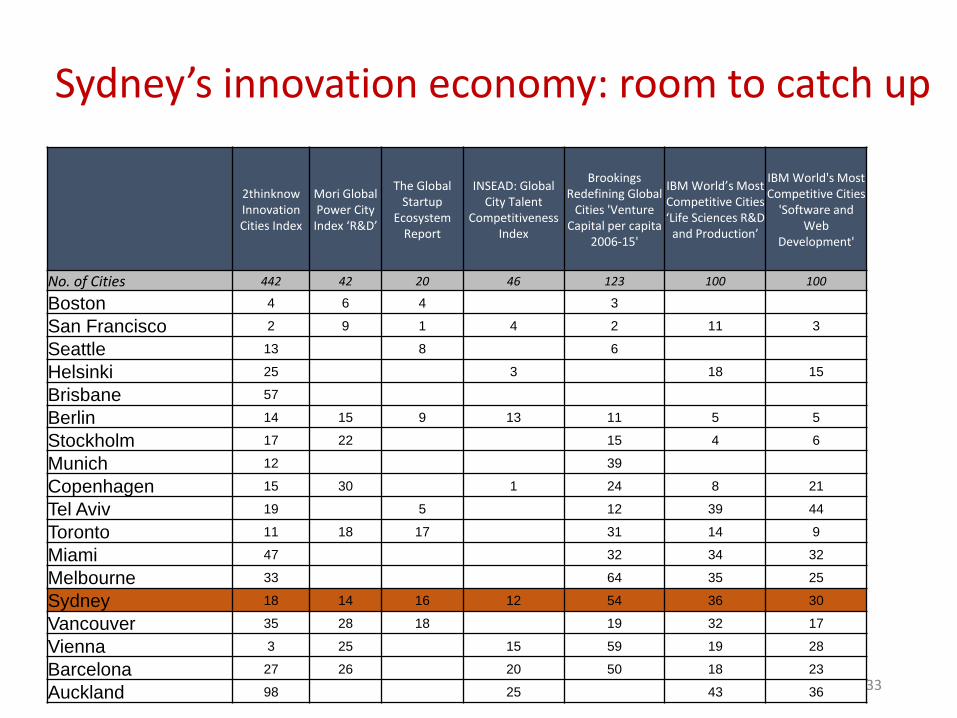
Sydney’s innovation economy: room to catch up
2thinknow Innovation Cities Index
Mori Global Power City Index ‘R&D’
The Global Startup
Ecosystem Report
INSEAD: Global City Talent
Competitiveness Index
Brookings Redefining Global
Cities 'Venture Capital per capita
2006-15'
IBM World’s Most Competitive Cities ‘Life Sciences R&D
and Production’
IBM World's Most Competitive Cities
'Software and Web
Development'
No. of Cities 442 42 20 46 123 100 100
Boston 4 6 4 3
San Francisco 2 9 1 4 2 11 3
Seattle 13 8 6
Helsinki 25 3 18 15
Brisbane 57
Berlin 14 15 9 13 11 5 5
Stockholm 17 22 15 4 6
Munich 12 39
Copenhagen 15 30 1 24 8 21
Tel Aviv 19 5 12 39 44
Toronto 11 18 17 31 14 9
Miami 47 32 34 32
Melbourne 33 64 35 25
Sydney 18 14 16 12 54 36 30
Vancouver 35 28 18 19 32 17
Vienna 3 25 15 59 19 28
Barcelona 27 26 20 50 18 23
Auckland 98 25 43 36

Infrastructure challenges remain stark
Modal share of non-car based public transport1 Hong Kong2 Singapore3 Greater London4 Amsterdam region/G45 Paris Region6 San Francisco Bay Area7 Munich metropolitan region8 Greater Boston9 Greater Toronto10 Greater Sydney

Source: Numbeo Rent Index (0= cheapest)
Price rises and unaffordability happening faster than in most other medium-sized regions
Numbeo Housing Rent Index, 2016
Increasing affordability issues
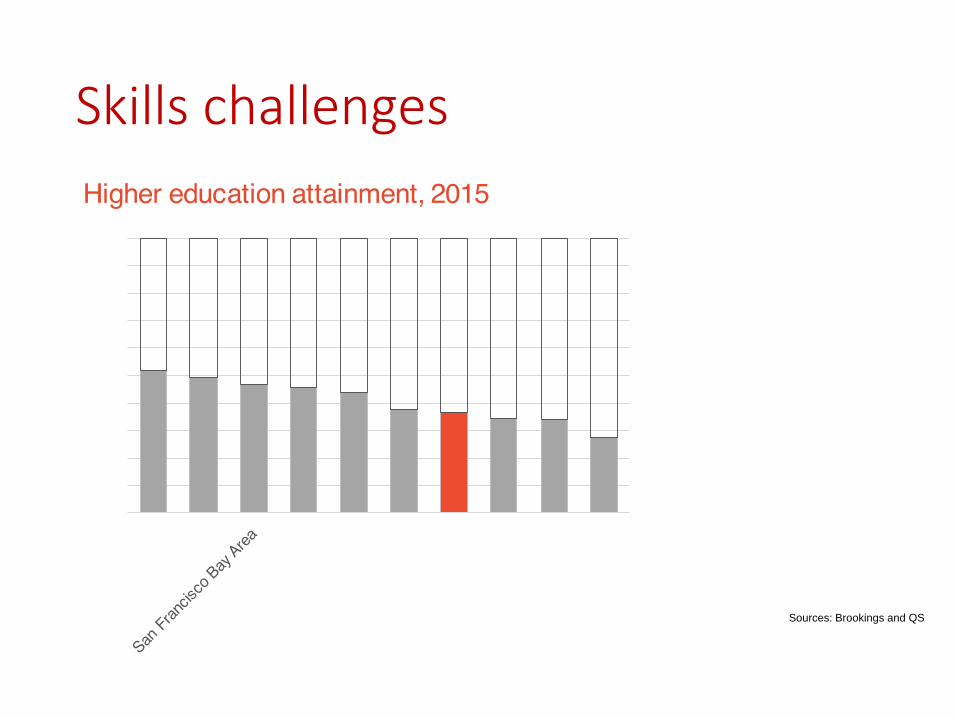
Skills challenges
Sources: Brookings and QS

37
Source: PwC Cities of Opportunity
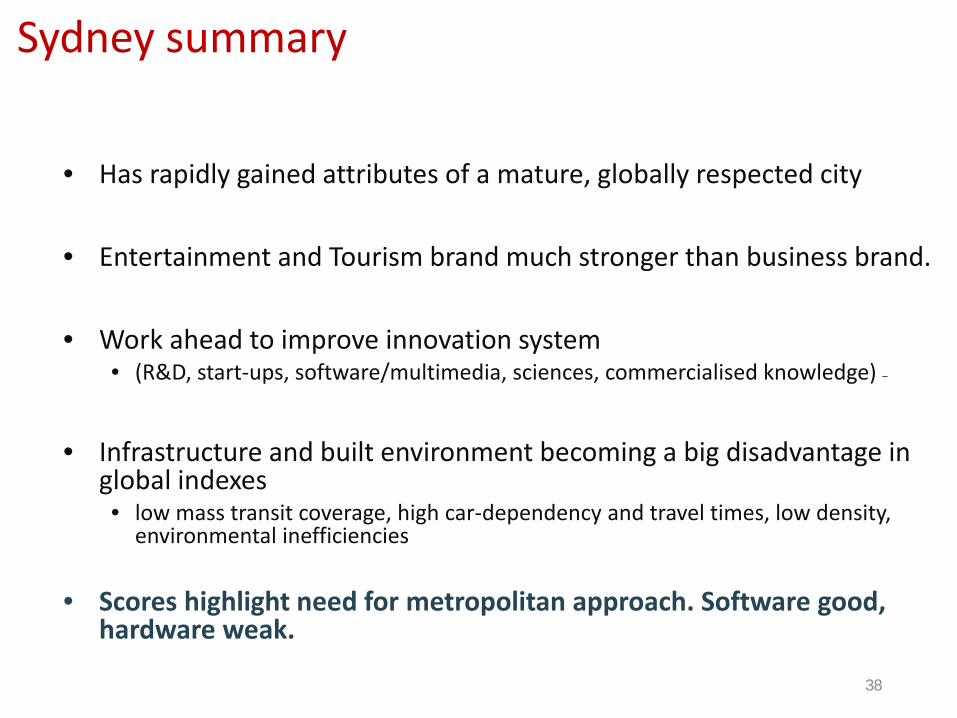
Sydney summary
• Has rapidly gained attributes of a mature, globally respected city
• Entertainment and Tourism brand much stronger than business brand.
• Work ahead to improve innovation system• (R&D, start-ups, software/multimedia, sciences, commercialised knowledge) –
• Infrastructure and built environment becoming a big disadvantage in global indexes• low mass transit coverage, high car-dependency and travel times, low density,
environmental inefficiencies
• Scores highlight need for metropolitan approach. Software good, hardware weak.
38
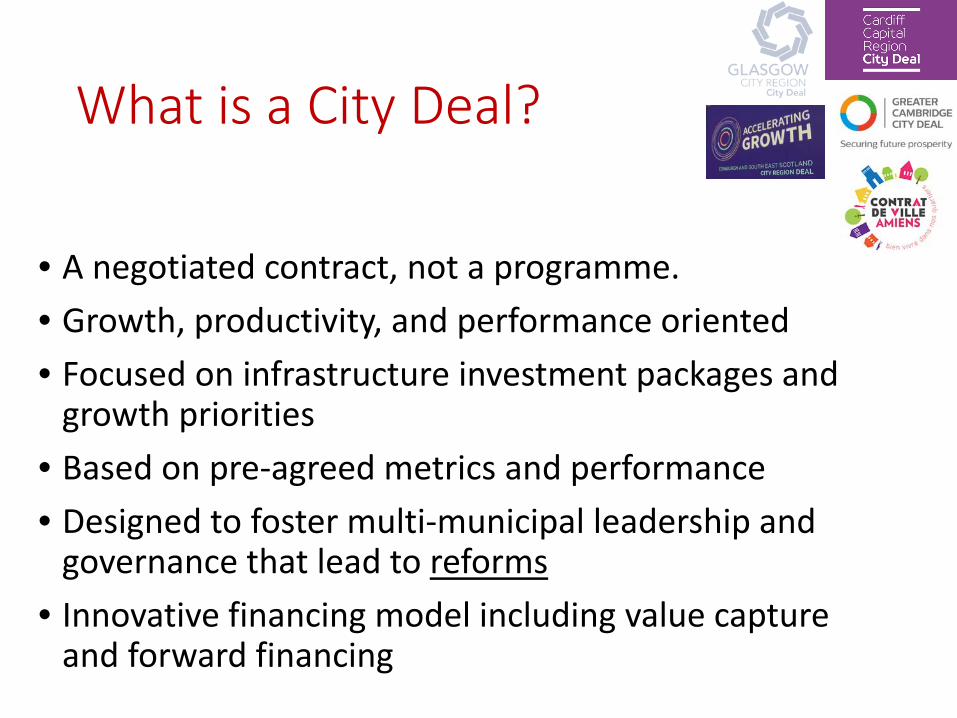
What is a City Deal?
• A negotiated contract, not a programme.• Growth, productivity, and performance oriented• Focused on infrastructure investment packages and
growth priorities• Based on pre-agreed metrics and performance• Designed to foster multi-municipal leadership and
governance that lead to reforms• Innovative financing model including value capture
and forward financing
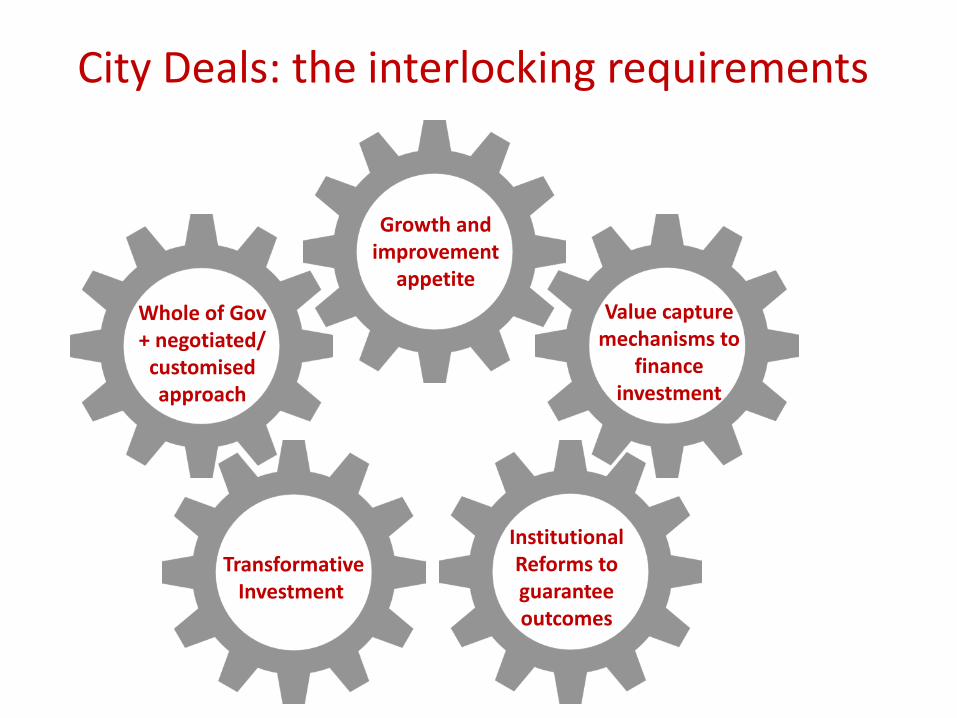
Growth and improvement
appetite
Institutional Reforms to guarantee outcomes
Whole of Gov+ negotiated/
customisedapproach
Transformative Investment
Value capture mechanisms to
finance investment
City Deals: the interlocking requirements
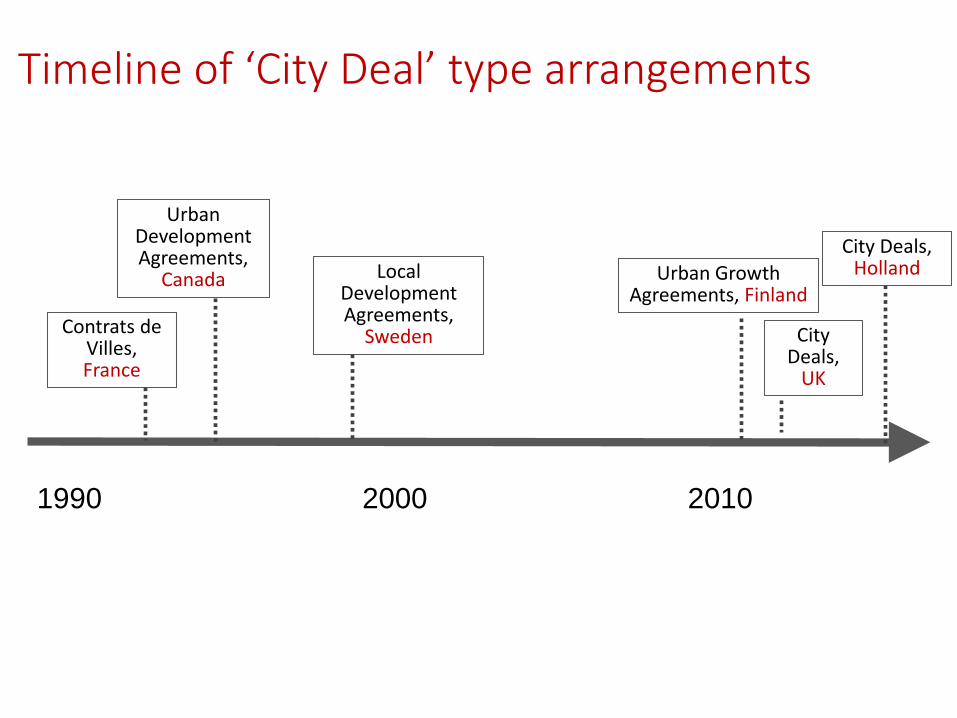
Timeline of ‘City Deal’ type arrangements
1990 2000 2010
Contrats de Villes, France
Urban Development Agreements,
Canada Local Development Agreements,
Sweden City Deals,
UK
Urban Growth Agreements, Finland
City Deals, Holland

• Lyon first to apply it at metro scale: regenerating struggling neighbourhoods (housing, skills, jobs) with state funding and coordinated strategy
• Latest in Lyon: 2015-2020: 37 neighbourhoods, €80m: housing, public spaces, skills, jobs.
• Nationwide: 5-7 year terms. 435 signed for 2015-20• Brings together all local stakeholders: state, regions, city, service
agencies• Has improved horizontal collaboration, especially including civil
society.
Contrat de Ville: Example - Lyon
• Collaboration between state, municipalities and districts
• Bottom up: each project has different structure –decided locally
• New bodies• Working groups• Mass-meetings• Working in housing districts, disadvantaged neighbourhoods
• 1999-2003: €230m allocated centrally, matched locally• Outcomes (e.g. in Gothenburg): Increases in
employment, drop in benefit dependency, lower crime
Local Development Agreements, Sweden
Vancouver Tri-Partite Agreement
• 2000: Federal, state and city governments agree to cooperate on economic and social issues in downtown Vancouver up to 2010
• Response to acute public health crisis in Downtown Eastside (drugs, social deprivation)
• Vancouver did not have jurisdiction or funding to deal with complex problems: participation from other govt. tiers required.
• Coordinated, ‘whole of government’ intervention: jobs, health, skills, businesses
• Initiatives: Economic Revitalization; Safety; Housing; Quality of Life
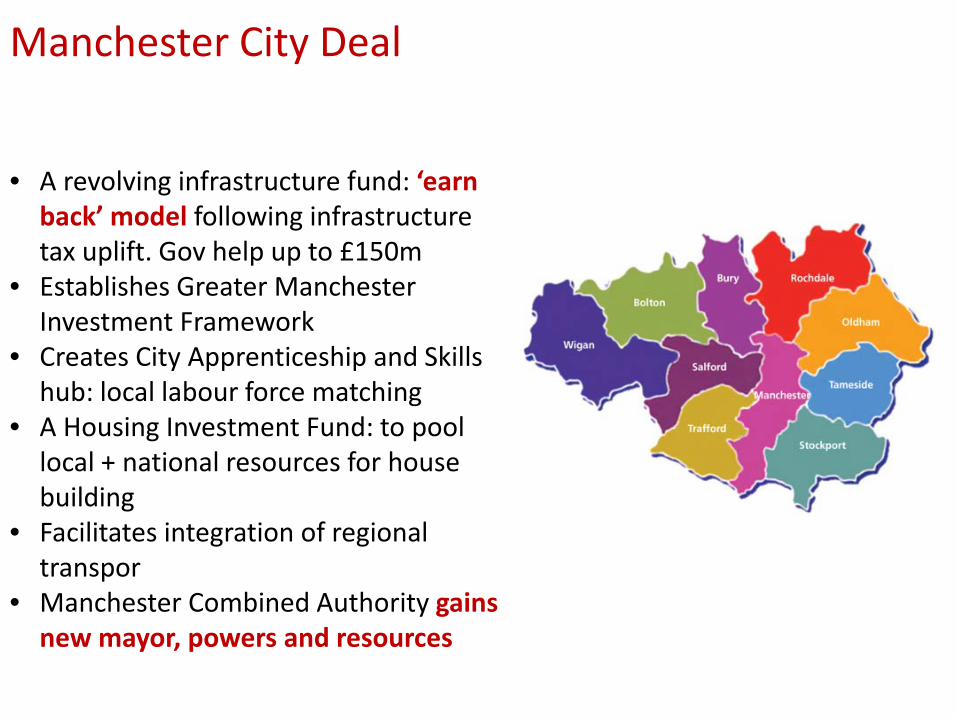
Manchester City Deal
• A revolving infrastructure fund: ‘earn back’ model following infrastructure tax uplift. Gov help up to £150m
• Establishes Greater Manchester Investment Framework
• Creates City Apprenticeship and Skills hub: local labour force matching
• A Housing Investment Fund: to pool local + national resources for house building
• Facilitates integration of regional transpor
• Manchester Combined Authority gains new mayor, powers and resources
The Future and global challenges
• Global cities will continue to emerge despite external threats.
• Why? • Global economy and nation states need them (talent and capital and trade and innovation)
• Diversification from Established WCs by talent, capital, technology and firms. Appetite for more.
• Infrastructure investment will create them. New global infrastructure scenario will reinforce open cities.
• What does change in city functionality and connectivity mean for global cities?
• 3 strategic imperatives…
1. How to compete and achieve inclusion, resilience, flexibility?
2. How to manage success and unintended consequences of growth?
3. How to resolve external challenges to global city model?46

Thank You47