Embed Size (px)
Citation preview

Productivity Losses due to Coordination:
An Empirical Study of Generalists in a Hospital
Lu Wang1, Itai Gurvich1, Jan A. Van Mieghem1, Kevin J. O’Leary, MD2
1Kellogg School of Management, Northwestern University2Feinberg School of Medicine, Northwestern University
March 31, 2016
Professional work often involves generalists who act as hubs, discussing and consulting with specialists to
gather information and make decisions. Coordination is critical when tasks, like consultations, require the
simultaneous collaboration of multiple people. Professionals typically have their individual tasks that may
be preempted to switch to collaborative tasks. Task switching can introduce setup times, often mental and
unobservable, when resuming the preempted task and reduce a generalist’s labor productivity.
We analyze the productivity loss from coordination in a field study of hospital medicine general physicians–
“hospitalists”–at Northwestern Memorial Hospital in Chicago. A hospitalist’s patient-care routine includes
visiting patients and consulting with specialized care professionals to guide patient diagnosis and treatment.
We introduce an episodal workflow model that captures the coordination dynamics — each switch and the
episode of work it preempts. A rigorous empirical analysis is presented using a data set assembled from direct
observation of physician activity and pager-log data. We show that more switches between documentation
and communication causally lead to longer documenting time, and that the cause of the switch matters: when
the switch is triggered by the hospitalist the setup impact is smaller. We estimate that a hospitalist incurs a
total setup time of 5 min per patient per day. This is substantial: Caring for 14 patients per day, a hospitalist
spends more than one hour each day on mental setups, which translates to about 20% productivity loss.
In contrast to a static snapshot of collaboration, our episodal workflow model could be deployed in other
professional settings where resource coordination is paramount.
Key words : coordination, multitasking, professional labor, productivity, setup time, empirical.
1. Introduction
Productivity is a key performance metric that captures how efficiently a process makes use of
its available resources. It is expressed as the number of jobs a resource completes per unit of
time and is constrained by the resource capacity. In contrast to capital processing assets (e.g.
machines), human resources use judgment in executing tasks and their choices affect processing
times and hence their productivity. According to the breadth and depth of their tasks, humans
can be categorized on a spectrum between generalist and specialist, with professional work often
involving a mix of both types. We study a setting where generalists act as coordinators (e.g., case
or product managers) who communicate with multiple specialists to gather information and make
decisions. Communications involve both asynchronous interactions (e.g., reaching out via voice
mail, email or text messaging) and simultaneous collaboration which requires the simultaneous
processing by multiple people (e.g., oral communication).
1
Wang, Gurvich, Van Mieghem, O’Leary: Productivity Losses due to Coordination2
Coordination is critical for simultaneous collaboration: professionals typically also have individ-
ual tasks and exercise discretion in prioritizing and switching between collaborative and individual
tasks. Task switching can introduce setup times, often mental and unobservable, when resuming
the preempted task and reduce labor productivity. Froehle and White (2014) capture, using a
discrete simulation model, how an increase in these setup times (“the forgetting rate”) impacts
the processing time and offer process-sequencing remedies. Rosenstein (2002) documents the chal-
lenges in synchronizing nurses and physicians. To alleviate simultaneity requirements, collaborators
may resort to asynchronous communication but that increases distractions, interruptions, and task
switching. Overall, the consulting of multiple specialists, via either simultaneous or asynchronous
communication, can bring about frequent task switching and the associated setup times may reduce
productivity.
We introduce an episodal workflow model that captures the coordination dynamics — each switch
and the episode of work it preempts. We deploy this model using a unique data set to measure how
coordination in practice reduces a generalist’s productivity, through task switching and associated
(unobservable) setup times. Our empirical setting is a field study of hospital medicine physicians
—“hospitalists” — at Northwestern Memorial Hospital (NMH) in Chicago. Hospitalists are general
physicians who are tasked with orchestrating high-quality inpatient care. A hospitalist’s responsi-
bilities include making decisions at each step of a patient care path (surgeries, lab tests, medication
prescriptions, discharge orders, etc.) and coordinating this care with specialists (specialty physi-
cians, lab staff, pharmacists, nurses, etc.). At NMH, a hospitalist is typically assigned 14 patients
per day and must accommodate the schedule of multiple care providers when coordinating each
patient’s care. The hospitalist’s effectiveness in orchestrating this coordinated effort is essential to
the progress of the patient’s treatment.
We conducted a time and motion study by closely observing hospitalists and recording their
activities. Figure 1 distinguishes between individual and collaborative activities. The individual
workflow includes four steps: reviewing the charts of all assigned patients, visiting patients in the
ward (typically between 9 a.m. and 11 a.m.), and then “charting” (or “documenting the chart”)
from around 11 a.m. until the end of the workday.1 Charting involves both repetitive tasks (such
as documenting routine medication or lab orders) and cognitive tasks (such as making diagnoses).
Both types of tasks must be completed in a timely manner in order to proceed with the patient’s
treatment.
1 The hospitalists seldom idle. They are motivated to finish all work as soon as possible and are continuously switchingamong their many tasks.

Wang, Gurvich, Van Mieghem, O’Leary: Productivity Losses due to Coordination3
Figure 1 A hospitalist’s daily workflow involves both individual activities and collaborative activities.
The hospitalist receives a request?
No
Yes The hospitalist reaches out?
• Collaborative workflow
Send a page
Make a phone call
Face-to-face conversation
Respond Yes
Respond? Receive a page
Receive a phone call
Yes
No
1. Review all patients’ charts
2. Initial bed-side visits to all patients
3. Document progress notes in charts
An interruption?
Finish all charts?
Yes
4. Sign-out
No
• Individual workflow
7 a.m.
No
Yes
9 a.m.
11 a.m.
2 p.m. to 8 p.m.
This structure of the NMH hospitalists workday was documented before in Tipping et al. (2010)
where it is shown that hospitalists spend most of their time documenting in the Electronic Health
Records (EHR) and that they have frequent communications with specialists during this process.
This charting occupies the lion’s share of the hospitalist work at NMH: It varies from 3 to 9 hours
per day and is therefore a key determinant of hospitalist productivity.
Our observations indicate that care providers prefer simultaneous, verbal communication over
asynchronous email or text-messaging. This inevitably means that the hospitalist must often pre-
empt ongoing documentation (i.e., individual work) to speak to a specialty care provider that is
available at that moment but might not be available shortly thereafter.
Two events can trigger task switching: (i) the hospitalist, finding that she needs some information,
stops her work and reaches out to specialists to collect the required input; or (ii) the hospitalist
switches work in response to a call/message from a specialist. If, for example, the hospitalist needs a
cardiologist’s opinion when making a patient’s diagnoses, she preempts the documentation work for
that patient and reaches out to the cardiologist by phone, text or in person. While waiting for the
cardiologist to respond, the hospitalist may switch to other cases. When available, the cardiologist
will respond to the request by either paging back or making a phone call to the hospitalist. At
that point, the hospitalist may preempt her current individual work (possibly documenting another
case). In this way, the need for information may create multiple task switches.
Wang, Gurvich, Van Mieghem, O’Leary: Productivity Losses due to Coordination4
As the above scenario illustrates, coordination leads to interruptions and switches between indi-
vidual and collaborative tasks. Lab experiments (Eyrolle and Cellier (2000) and Altmann and
Trafton (2004)) show that task interruptions are associated with longer processing times due to
the extra reconfiguration (setup) required upon resuming the task. The aggregate effect may be a
non-negligible reduction in productivity. We asked several hospitalists at Northwestern Memorial
Hospital (NMH): “What are the major hindrances to your productivity?” All hospitalists men-
tioned the delays in discussing cases with other care providers and the constant, distracting task
switching. We quote one hospitalist:
“As a clinician, my work experiences at Emory University Hospital, National Health Service
Lothian in Scotland and Northwestern Memorial Hospital all teach me one thing: interruptions
that come from different conversations can be disruptive to my work. Although the average
length of each progress note is deterministic, frequently interrupted progress notes tend to
take more time to write because I need more thought process engagement to figure out where
I was before being interrupted.”
Humans often incur a mental set up time when resuming a preempted task. We present a detailed
workflow model that allows us to estimate the unobservable mental setup times that accompany
task switching and interruptions. As such, we can analyze the resulting productivity loss that
results from resource coordination. When applied to the Hospital Medicine Division at NMH, our
empirical analysis shows that:
1. The documenting or “charting time” per patient causally increases with the number of
switches the hospitalist experiences while working on this chart.
2. The switch initiatiator matters: “Task switching to reach out” reduces productivity less than
“Task switching to respond.”
3. A substantial setup time accompanies task switching: the estimated setup time is 5min for each
patient’s daily documentation and represents almost 50% of the observed average total charting
time of 11min. Caring for 14 patients per day, a hospitalist thus spends more than one hour each
day on mental setups. Given that documenting time occupies about 40% of a hospitalist total
patient processing time, task switching results in about 20% productivity loss: if hospitalists did
not incur a setup time, they could serve 20% more patients during their shift.
Whereas the magnitude of the productivity loss is specific to this setting, our model and method-
ology are applicable to other organizations and processes where people must coordinate to solve
problems and execute tasks. Conflicting priorities — people may prioritize their own tasks — then
lead to interruptions and switches that compromise productivity. This is relevant to manufactur-
ing and new-product development (Bohn (2000)), software engineering (Perlow (1999)), and the
judiciary (Bray et al. (2015)).

Wang, Gurvich, Van Mieghem, O’Leary: Productivity Losses due to Coordination5
2. Literature Review
The fact that coordination requirements may affect efficiency is underscored, for example, by Brooks
(1975) and Staats et al. (2012) who show how the effectiveness of a team may decrease with its size
due the increased communication needs. Thompson (2000), Girotra et al. (2010), Staats and Upton
(2011) and Gardner et al. (2012) show how team structures that facilitate efficient communication
can improve team performance. Our paper dives into the process mechanisms through which team
coordination introduces inefficiency. From a workflow viewpoint, task switching is a key mechanism
inherent to the coordination of collaborative work.
Evidence of the interruption frequencies to physicians, nurses and other care providers appears
in Flynn et al. (1999), Chisholm et al. (2000), Spencer et al. (2004), Tucker and Spear (2006), Biron
et al. (2009), Halbesleben et al. (2010), Hall et al. (2010), Westbrook et al. (2010), Ballermann et al.
(2011), Ly et al. (2013) and Cole et al. (2015). Operational consequences that are discussed in these
papers include longer patient length of stay, higher hospital costs, cognitive failures and under-
allocation of time to higher acuity tasks. Our paper focuses on productivity as the operational
measure of interest. A detailed workflow model allows us to map coordination-driven interruptions
to cases and capture how they arise endogenously from the decisions of the actors in the process.
In fact, the base processing time (excluding setups), assumed in the literature to be apriori given,
may be itself endogenous in our setting. Our detailed workflow model also allows us to differentiate
between different causes of switches.
The negative effect of switching on productivity is captured via simulation and experiments in
Speier et al. (1999), Schultz et al. (2003), Bendoly et al. (2014), and Bray et al. (2015). Staats and
Gino (2012) empirically study the tradeoff between specialization (less switching) and multitasking
(enhances knowledge). KC (2013) shows that multitasking can negatively affect quality of care.
A rich psychology literature studies the memory retrieval cost associated with task preemptions
and captures how resuming a preempted task after switching out of it is cognitively costly. Pashler
(1994), Rubinstein et al. (2001), Czerwinski et al. (2004) and Salvucci et al. (2009) study how
repetitive task alternations influence participants’ working memory and thus require a memory
retrieval which is time consuming.
Closely related to ours is the work of Froehle and White (2014) who observe physicians in
a radiology department and show, using a discrete-event simulation model, that interruptions
(usually unscheduled requests from other care providers) lead to forgetting and re-work when
resources resume preempted work. Our paper studies hospitalist productivity in the field by taking
each patient on an observed day as the unit of analysis and mapping interruptions to their “trigger”
coordination activity (and hence to the “trigger” patient). This is facilitated by a full episodal model
Wang, Gurvich, Van Mieghem, O’Leary: Productivity Losses due to Coordination6
that breaks the work on a patient into its episodes, which are intervals of continuous work without
interruption. Equipped with the episodal model, we use the field data to empirically quantify the
setup time (or re-work) and translate it into productivity loss. Distinguishing different switching
triggers helps us to suggest how one should alter the workflow to recover the productivity loss.
3. Model and Econometric Specification
3.1. Episodal workflow model
The hospitalist’s productivity, measured by her throughput rate, can be defined as the number of
cases she completes per unit of time. In steady state,
Productivity≡ limt→∞
Number of patient cases processed by the hospitalist during [0, t]
t
=1
The hospitalist’s load per patient case
=1
The average processing time of a patient case
The unit of analysis is case (i, t), defined as all activities related to the care of patient i on day t.
For a case (i, t), the case processing time, PROCESS TIMEi,t, is defined as the total time spent
by the hospitalist on all activities related to the case. It is the sum of the case documenting time,
DOCUMENT TIMEi,t, the case communication time, COMMU TIMEi,t, and other activities
on the case, OTHER TIMEi,t:
PROCESS TIMEi,t =DOCUMENT TIMEi,t +COMMU TIMEi,t +OTHER TIMEi,t
We focus on the impact of task switching on the case documenting time (which, as we shall
show, constitutes 40% of the total patient’s processing time), which we subsequently translate into
the impact on case processing time and productivity.
Communications interrupt the hospitalist’s documentation work and partition the documenting
time of a case into multiple documentation “episodes”. We thus introduce a detailed episodal
workflow model to capture the coordination dynamics. For case (i, t), we let Ni,t denote the total
number of documentation episodes, separated by Ni,t−1 switches. We define episode documenting
time, EPISODE TIMEi,t,j, as the time spent on the jth episode of documenting case (i, t).
The documenting time of case (i, t), DOCUMENT TIMEi,t, equals the sum of all documenting
episodes.
Humans incur a cognitive cost to retrieve their working memory when switching among multiple
tasks. This is supported by vast evidence in both the operations and psychology literature (Staats
and Gino (2012), Pashler (1994), Speier et al. (1999), Rubinstein et al. (2001), Schultz et al. (2003),
Czerwinski et al. (2004), Salvucci et al. (2009), Bendoly et al. (2014)). In the setting of our study,

Wang, Gurvich, Van Mieghem, O’Leary: Productivity Losses due to Coordination7
each time the hospitalist resumes documenting a previously interrupted case, she may incur an
extra setup time. While we cannot observe or directly measure the hospitalist’s memory retrieval
process, we will disentangle the setup time from the observed jth-episode documenting time of case
(i, t), EPISODE TIMEi,t,j, by decomposing it into a set up time, Si,t,j, and a base documenting
time, EPISODE BASE TIMEi,t,j:
EPISODE TIMEi,t,j = Si,t,j +EPISODE BASE TIMEi,t,j
The total documenting time of the case is the sum of the episodes and a case’s base documenting
time is the sum of the episode base documenting times. The base documenting time should be
thought of as a property of case characteristic (e.g., the patient diagnosis and acuity as well as the
multitasking level of the hospitalist in charge on that day), independent of the coordination effects
(such as switches); see Figure 2 below.
The approach to proxy the cognitive (retrieval) delay with a setup time is also taken by KC
(2013) and Froehle and White (2014). Multipe modeling papers also use setup times to capture
these mental costs and to analyze or optimize the performance of the underlying processes; see
e.g. Skinner (1967), Sykes (1970), Eisenberg (1971), Hofri and Ross (1987), Conway et al. (1967),
Dobson et al. (2013). We investigate how much setup time—an additional documenting time due
to task switches and consequent communications—is needed when resuming the documenting of
a preempted case (i.e. starting a new episode). Our empirical setting departs from most modeling
work in that the interruptions and setup times are endogenous, not only in their occurrence (driven
by the decision of actors), but also in their length as evidenced by the distinction between “switching
to reach out” and “switching to respond”.
Communication between individuals is an integral part of information sharing in healthcare
(Uddin et al. (2013)). Based on our observations and interviews with hospitalists, communica-
tions could have disparate effects on the case documenting time. A discussion with a cardiologist
might lead the hospitalist to order additional lab tests for a patient thus increasing this patient’s
documenting time but it might also advance the hospitalist towards a definite diagnosis making
documentation more efficient. It is also possible that the communication between the two does not
change the case documenting time at all. To investigate the impact of communication on the docu-
menting time, our model allows the communication (frequency or duration) to affect documenting
time: communication—either frequency or duration—can adjust the case base documenting time
by bringing in extra information.

Wang, Gurvich, Van Mieghem, O’Leary: Productivity Losses due to Coordination8
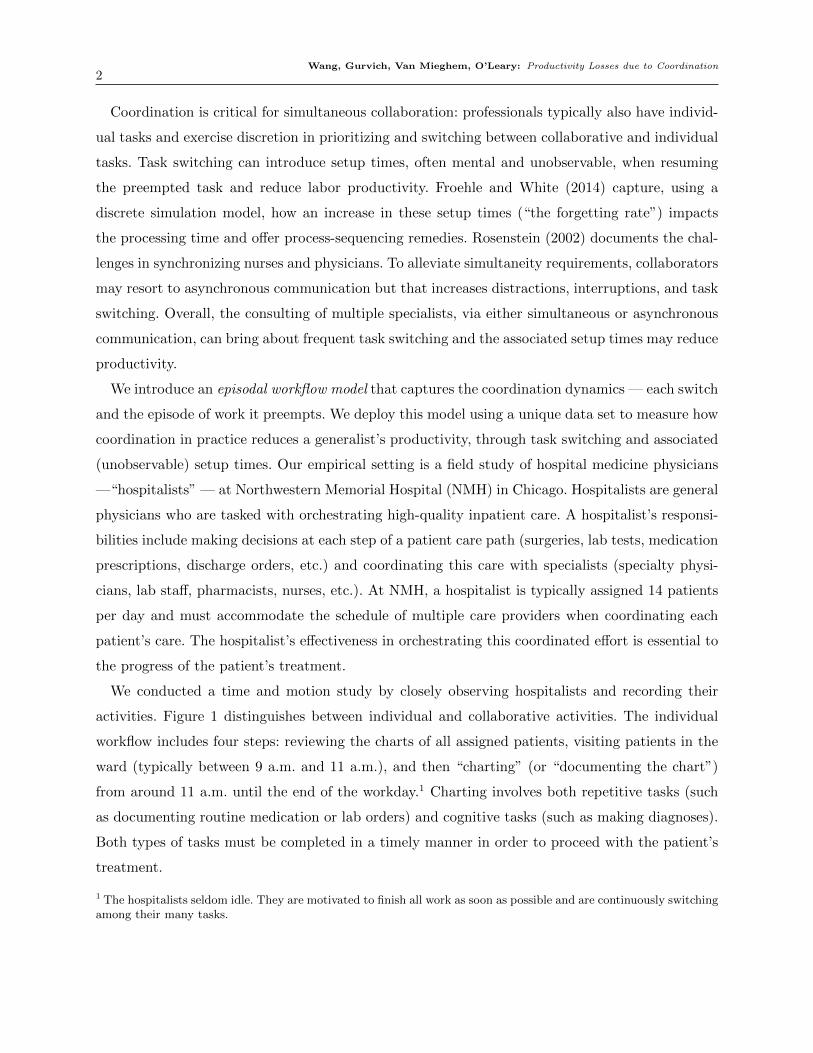
Figure 2 Episodal workflow model: Potential variables that affect a hospitalist’s documenting time of a case
Variables
2. Coordination results in communication with collaborators
• Useful information (communication frequency, collaborator type/number)
Documenting time of patient i’s progress note on day t
or…
3. Coordination switches the hospitalist among tasks
Workflow • Set-up time (switching type/frequency)
1. Case characteristics
• Patient information
• Time of the day • Multitasking: # of cases that have been started but not yet finished
Workload
Workflow
Workload
or
or
Base documenting time
Adjusted time (due to information
from communication)
Setup time (at each resumed
documentation piece)
+
+
• Hospitalist’s familiarity with the patient
Let f(COMMU TIMEi,t,j) be the (additive) adjustment to the documentation time from com-
munication about the case between the jth and the (j − 1)th episodes. Aggregating the episodes,
we let DOCUMENT BASE TIMEi,t denote the case base documenting time that equals to∑Ni,t
j=1 EPISODE BASE TIMEi,t,j, Si,t denote the total case setup time incurred by the hospi-
talist that equals to∑Ni,t
j=1 Si,t,j, and g(COMMU TIMEi,t) be the total adjusted documenting
time due to all communications about the case. The total case documenting time is given by
DOCUMENT TIMEi,t =
Ni,t∑j=1
EPISODE TIMEi,t,j
=
Ni,t∑j=1
{EPISODE BASE TIMEi,t,j +Si,t,j + f(COMMU TIMEi,t,j)}
=DOCUMENT BASE TIMEi,t +Si,t + g(COMMU TIMEi,t)
Figure 2 illustrates the episodal workflow model in detail. We consider three groups of variables
that can affect the base documenting time, adjusted load and setup time of a case (i, t). The first
group of variables includes case characteristics such as the patient information and the hospitalist’s
familiarity with the patient. These variables determine the length of the patient’s progress note, or
the case base documenting time. Other case characteristics are associated with workflow features
such as the time of day and the multitasking level (measured by number of cases that have been

Wang, Gurvich, Van Mieghem, O’Leary: Productivity Losses due to Coordination9
started but not yet finished) the hospitalist experiences when starting documenting the case. Such
variables reflect the hospitalist’s prioritization of and time allocated to a case and in turn influence
the case base documenting time. The second variable is the useful information extracted from
communication, which can affect the base documenting time—as discussed above, the adjustment
can be either positive or negative or null. The last group of variables includes the switching-induced
setup times. The case documenting time might be longer than the base documenting time due to
the setup time at each episode introduced by task switching.
The above overview of the theory suggests the following hypothesis:
Hypothesis 1 Si,t,j > 0 and Si,t > 0, where Si,t,j > 0 is the episode setup time of the jth episode of
case (i, t), j ∈ {1,2, ...,Ni,t}, and Si,t > 0 is the case setup time. Consequently, the case documenting
time increases with the number of switches the hospitalist makes while documenting the case.
The setup time required to resume an interrupted documentation might be shorter if the hos-
pitalist can control when she interrupts her work—for example, she can choose to be interrupted
only when reaching a point from which it will be easier to resume later. Our second hypothesis
distinguishes between different triggers of task switching:
Hypothesis 2 The setup time is shorter when a hospitalist resumes a case that is interrupted by
herself to reach out to another person, compared to when she interrupts cases to respond to another
person’s communication request.
As discussed previously, communication has two counterbalancing effects on the case document-
ing time that may cancel each other. We thus include communication time duration in the analysis
to control for the potential benefit and cost of information obtained from communication.
We test the two hypotheses by studying the impact of the variables shown in Figure 2 on the
case documenting time and each episode documenting time shown in Figure 2. We also quantify
the case setup time and episode setup time under different task switching triggers and frequencies.
3.2. Data
We collected the data in the inpatient unit at Northwestern Memorial Hospital (NMH). It is
assembled from three sources: an observational data set (from a time-motion study) and two digital
data sets extracted from the care providers’ pager-logs and the Electronic Health Records (EHR).
During June-July 2014, we closely observed and recorded 4 hospitalists’ activities in the Hospital
Medicine Unit at NMH. Patients hospitalized in this unit are stable but might have multiple
(possibly chronic) health conditions and need to be continuously monitored. Each hospitalist works
for 7 consecutive days and is off work for the next 7 days. On each day of our observational
study we selected one hospitalist for observation based on the staffing schedule (there are about 10
hospitalists scheduled per day at NMH). During our collection period, each hospitalist was assigned
Wang, Gurvich, Van Mieghem, O’Leary: Productivity Losses due to Coordination10
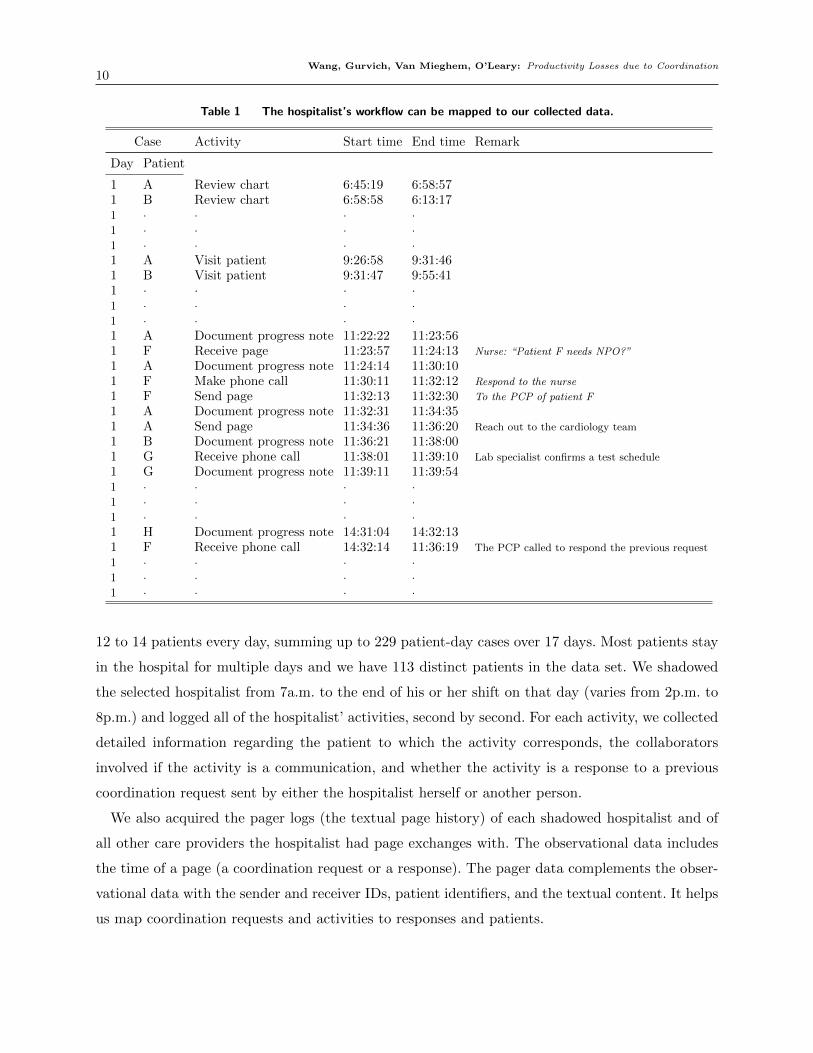
Table 1 The hospitalist’s workflow can be mapped to our collected data.
Case Activity Start time End time Remark
Day Patient
1 A Review chart 6:45:19 6:58:571 B Review chart 6:58:58 6:13:171 · · · ·1 · · · ·1 · · · ·1 A Visit patient 9:26:58 9:31:461 B Visit patient 9:31:47 9:55:411 · · · ·1 · · · ·1 · · · ·1 A Document progress note 11:22:22 11:23:561 F Receive page 11:23:57 11:24:13 Nurse: “Patient F needs NPO?”
1 A Document progress note 11:24:14 11:30:101 F Make phone call 11:30:11 11:32:12 Respond to the nurse
1 F Send page 11:32:13 11:32:30 To the PCP of patient F
1 A Document progress note 11:32:31 11:34:351 A Send page 11:34:36 11:36:20 Reach out to the cardiology team
1 B Document progress note 11:36:21 11:38:001 G Receive phone call 11:38:01 11:39:10 Lab specialist confirms a test schedule
1 G Document progress note 11:39:11 11:39:541 · · · ·1 · · · ·1 · · · ·1 H Document progress note 14:31:04 14:32:131 F Receive phone call 14:32:14 11:36:19 The PCP called to respond the previous request
1 · · · ·1 · · · ·1 · · · ·
12 to 14 patients every day, summing up to 229 patient-day cases over 17 days. Most patients stay
in the hospital for multiple days and we have 113 distinct patients in the data set. We shadowed
the selected hospitalist from 7a.m. to the end of his or her shift on that day (varies from 2p.m. to
8p.m.) and logged all of the hospitalist’ activities, second by second. For each activity, we collected
detailed information regarding the patient to which the activity corresponds, the collaborators
involved if the activity is a communication, and whether the activity is a response to a previous
coordination request sent by either the hospitalist herself or another person.
We also acquired the pager logs (the textual page history) of each shadowed hospitalist and of
all other care providers the hospitalist had page exchanges with. The observational data includes
the time of a page (a coordination request or a response). The pager data complements the obser-
vational data with the sender and receiver IDs, patient identifiers, and the textual content. It helps
us map coordination requests and activities to responses and patients.

Wang, Gurvich, Van Mieghem, O’Leary: Productivity Losses due to Coordination11
The data set assembled from the time-motion observations and the pager logs captures both the
hospitalist’s individual and collaboration workflows (Fig. 1). Table 1 is a sample of this data. After
reviewing all patients’ medical charts and visiting all patients, the hospitalist starts documenting
each patient’s progress notes around 11am. She starts to document patient A’s case at 11:22:23 for
one minute when receiving a page from a nurse who asks a question regarding another patient F.
The hospitalist ignores the request at that moment and continues with patient A’s documentation
for another 6 minutes. She then preempts patient A’s case and switches to responding to the
nurse—a switch to respond. The first documentation episode of case A thus takes 8 minutes (from
11:22:22 to 11:30:10). The conversation with the nurse motivates the hospitalist to touch base
with the Primary Care Physician (PCP) of patient F by sending a text page. She then resumes
documenting the preempted patient A’s case at 11:32:31. This episode of case A lasts for about
2 minutes since she decides to reach out to a cardiologist for a consultation about patient A’s
condition at 11:34:36—a switch to reach out. While waiting for the response of the cardiologist, the
hospitalist starts a new case, patient B. After performing hundreds of other activities during the
day (for simplicity, we do not report the whole activity flow of that day in the table), the hospitalist
receives the response from the PCP of patient F at 14:32:14 when she is working on patient H’s
case. This phone call is to respond to the hospitalist’s page sent out at 11:32:13. This sample
data reflects how the hospitalist’s individual work—activity “document progress note”—may be
interrupted by coordination requests and activities.
The third data set is extracted from NMH’s Electronic Health Records (EHR). The EHR data
contains each patient’s information on each observed day as well as the names and titles of all care
providers involved in the patient’s care. This allows identification of the patient characteristics and
the official title of each person observed communicating with the hospitalist—Physician, Nurse,
Pharmacist and Lab specialist.
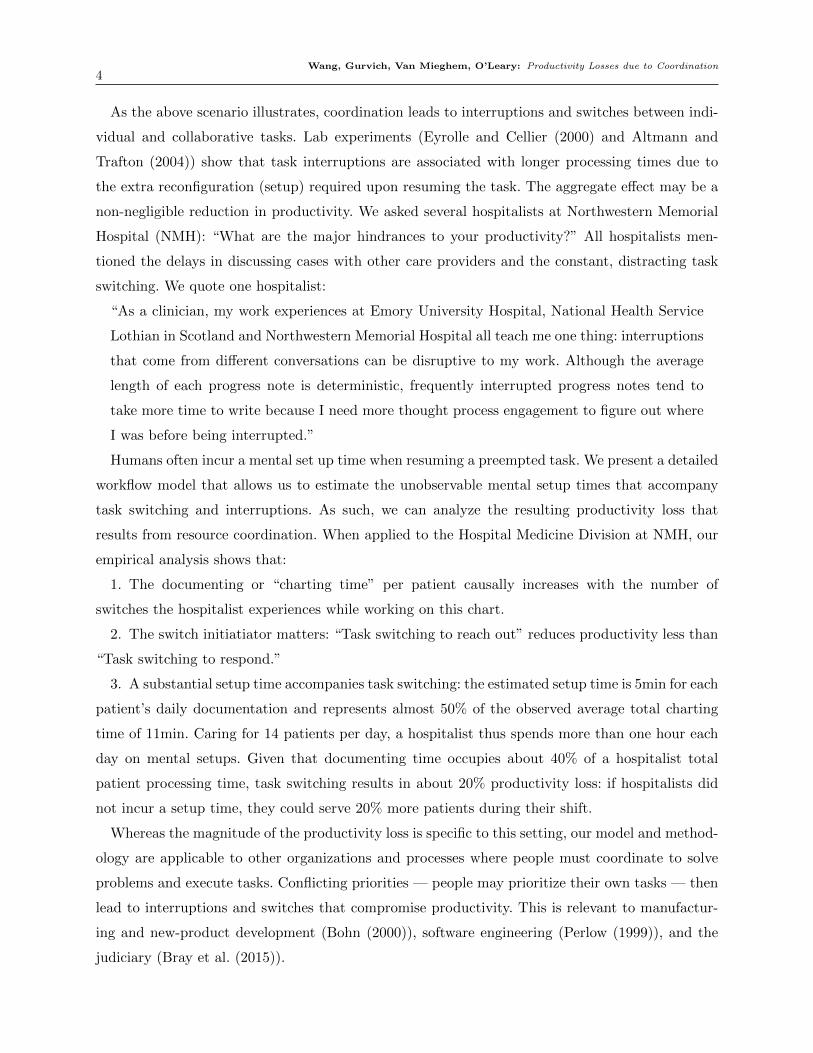
Table 2 summarizes the key variables in the assembled data set. We evaluate the hospitalist
productivity with two variables: the case processing time and the case documenting time. We
focus on the impact of different variables on the hospitalist’s case documenting time, which can be
translated into the impact on the case processing time (of which documenting time is one part) and
in turn on her productivity. The average case documenting time is 11.42 minutes, 42% of the 26.26
minutes of average case processing time. After performing a Kolmogorov-Smirnov (KS) simulation
test on the case documenting time, we obtain a p-value of 0.88 and thus establish:
Observation 1: The case documenting time is Weibull distributed.
Observations 1 is further supported by the right skewed distribution of case documenting time
shown in the left panel of Figure 3 and the close fit between the observed and simulated data in
the right panel. The Weibull distribution will be relevant to our later econometric analysis.

Wang, Gurvich, Van Mieghem, O’Leary: Productivity Losses due to Coordination12
Table 2 Summary statistics—casewise
Measure (VARIABLE NAME ) Mean SD
Operational Performance Variables (measured in minutes)
Case processing time (PROCESS TIME ) 26.26 14.96
Case documenting time(DOCUMENT TIME ) 11.42 7.01
Control variables
Case characteristics
Patient-related
Elixhauser Comorbidity Score (ELIX SCORE ) 7.49 9.01
Discharge today? 1=Yes, 0=No (DISCHARGE ) 0.26 0.44
PCP employed by NMH? 1=Yes, 0=No (PCP NMH ) 0.59 0.49
Number of days since the hospitalist has seen the patient (FAMILIARITY ) 1.90 1.00
Workflow-related
Time when starting documenting the case in hours (TIME OF DAY ) 11.66 2.32
Number of other cases the hospitalist has started but not yet finished
when starting documenting the case(MULTITASK ) 3.39 2.41
Task switching characteristics
Number of the hospitalist’s switches from documenting the case to:
reach out to collaborators (SWITCH REACHOUT ) 1.75 1.79
respond to collaborators (SWITCH RESPOND) 1.32 1.53
Communication characteristics
Communication time about the case (COMMU TIME ) 6.16 7.64
Figure 3 The observed documenting time closely follows a Weibull distribution.
0 10 20 30 40
0.075
0.050
0.025
0.000
Case documenting time (minutes)
Distribution of case documenting time
Den
sity
Quintiles for Case documenting time (minutes)
Qui
ntile
s for
Wei
bull
dist
ribut
ion
(min
utes
)
Quintiles for Weibull distribution and case documenting time
0 10 20 30
30
20
10
0
The controls case characteristics are patient and workflow related variables that may affect the
case documenting time and are independent of coordination. The patient-related variables include
(1) the Elixhauser Comorbidity Score, an index that is compiled according to the patient physical
condition and reflects the patient’s disease complexity; (2) a discharge indicator which equals to 1

Wang, Gurvich, Van Mieghem, O’Leary: Productivity Losses due to Coordination13
if the patient is discharged on that day. On the day of discharge the hospitalist has to complete
all paperwork required for discharge and this might increase the documenting time; (3) a PCP
(Primary Care Physician) indicator which equals to 1 if the patient’s PCP is employed by NMH. It
is typically easier for the hospitalist to contact and discuss the patient with a PCP that is employed
by NMH because of the common communication and IT systems; (4) the hospitalist’s familiarity
with the patient on that day measured by the number of days the hospitalist has seen the patient.
We control for the hospitalist familiarity to account for the possibility that documentation speed
increases with familiarity. The workflow-related variables include (1) the time of day; and (2) the
multitasking level (measured by the number of cases that have been started but not yet finished)
when the hospitalist starts documenting the case, which affects the case documenting time through
the hospitalist’s prioritization of the case.
Task switching and communication characteristics summarize the features of hospitalist’s com-
munication activities—the frequencies of switches to reach out or to respond to collaborators and
the communication time duration about the case. We use communication duration to proxy for
the communication information quality—extra or reduced burden to documentation.2
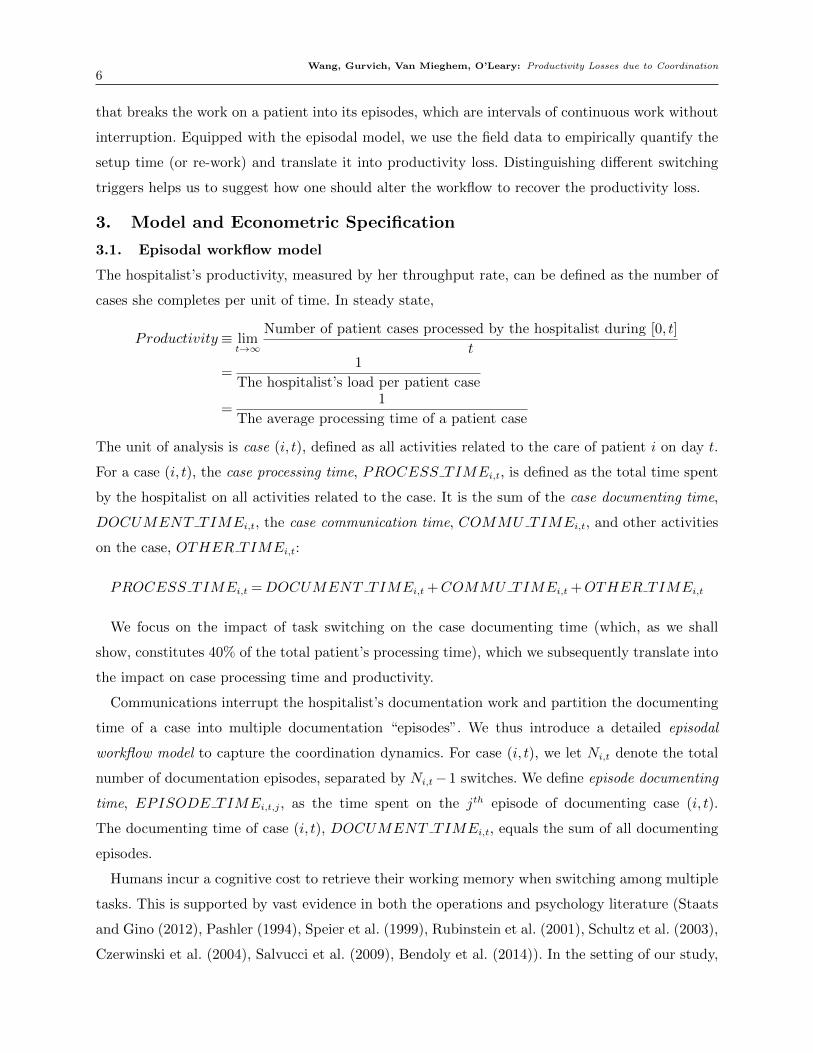
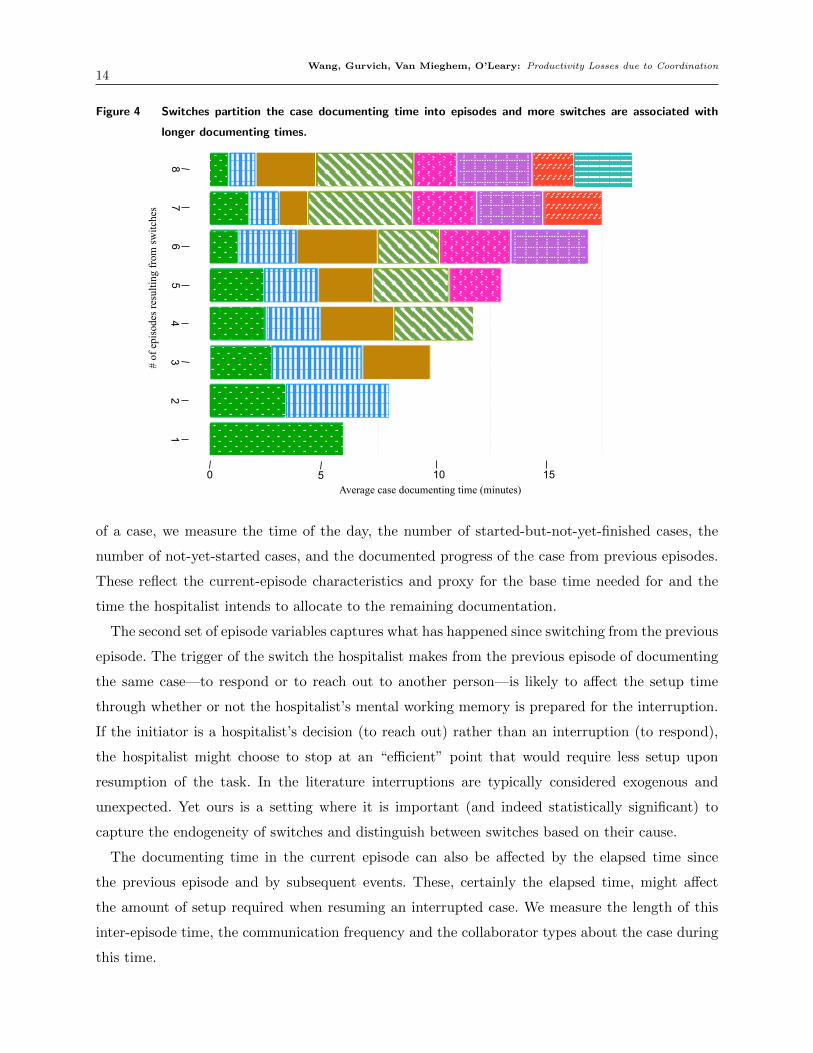
Figure 4 shows the empirical partitioning of the case documenting time into episodes (each
patterned block is an episode). The case documenting time is the sum of these episodes.
Observation 2: Cases with higher task switching frequencies have longer documenting time.
This observation provides a preliminary descriptive confirmation for Hypothesis 1: each time the
hospitalist resumes an interrupted documenting work, she incurs an extra setup time, which adds
to the total documenting time of the case. Arguably, the longer the documentation time of a case,
the higher the chances it will be interrupted —a possible reverse causality that we will rule out
through our episodal analysis and robustness checks in Sections 4.2, and 5.
Table 3 summarizes the episodal variables. The episode documenting time has an average of 2.82
minutes and a large standard deviation of 3.38 minutes. The Kolmogorov-Smirnov simulation test
indicates:
Observation 3: The episode documenting time is log-normally distributed.
The patient-related case characteristics—Elixhauser Comorbidity Score, Discharge today or not,
PCP employed by NMH or not, and the hospitalist’s familiarity with the patient—remain the same
as in Table 2. The episode-specific variables reflect what has happened before a specific episode
and how the hospitalist ends that episode: When the hospitalist starts documenting an episode
2 Our data includes also additional communication characteristics such as the numbers of collaborators with differenttitles (Physician, Nurse, Pharmacist, etc.). However, after performing multiple regression analyses, computing theVariation Inflation Factors (VIFs) of coefficients and comparing the estimated coefficients across regressions, we decideto exclude these to avoid multicollinearity.
Wang, Gurvich, Van Mieghem, O’Leary: Productivity Losses due to Coordination14
Figure 4 Switches partition the case documenting time into episodes and more switches are associated with
longer documenting times.
# of
epi
sode
s res
ultin
g fr
om sw
itche
s
Average case documenting time (minutes) 0 5 10 15
2 1
4 3
6 5
8 7
of a case, we measure the time of the day, the number of started-but-not-yet-finished cases, the
number of not-yet-started cases, and the documented progress of the case from previous episodes.
These reflect the current-episode characteristics and proxy for the base time needed for and the
time the hospitalist intends to allocate to the remaining documentation.
The second set of episode variables captures what has happened since switching from the previous
episode. The trigger of the switch the hospitalist makes from the previous episode of documenting
the same case—to respond or to reach out to another person—is likely to affect the setup time
through whether or not the hospitalist’s mental working memory is prepared for the interruption.
If the initiator is a hospitalist’s decision (to reach out) rather than an interruption (to respond),
the hospitalist might choose to stop at an “efficient” point that would require less setup upon
resumption of the task. In the literature interruptions are typically considered exogenous and
unexpected. Yet ours is a setting where it is important (and indeed statistically significant) to
capture the endogeneity of switches and distinguish between switches based on their cause.
The documenting time in the current episode can also be affected by the elapsed time since
the previous episode and by subsequent events. These, certainly the elapsed time, might affect
the amount of setup required when resuming an interrupted case. We measure the length of this
inter-episode time, the communication frequency and the collaborator types about the case during
this time.

Wang, Gurvich, Van Mieghem, O’Leary: Productivity Losses due to Coordination15
Table 3 Summary statistics—episodewise
Measure (VARIABLE NAME ) Mean SD
Operational Performance Variable (measured in minutes)
Episode documenting time (EPISODE TIME ) 2.82 3.38
Control Variables
Patient-related Case characteristics same as in Table 2
Episode characteristics
Current-episode characteristics
By the time when starting documenting the current episode of the case:
Time of the day in hours(EPISODE TIME OF DAY ) 12.78 2.40
Number of cases the hospitalist has started but not finished(EPISODE MULTITASK ) 4.49 2.64
Number of cases the hospitalist has not yet started (EPISODE NOTSTARTED) 4.96 3.93
The documented progress of the case in percentage (EPISODE PROGRESS) 34% 33%
Switching-from-previous-episode characteristics
The trigger of switching from the previous documenting episode:
0 if no switch, 1 if to respond, 2 if to reach out (PREVIOUS EPISODE SWITCH ) 1.18 0.80
During the time elapsed since the previous episode of documenting the case:
The length of this inter-episode time in minutes(INTER EPISODE TIME) 29.69 70.25
Number of communications about the case(EPISODE COMMU ) 0.44 0.81
Number of collaborator types(EPISODE COLLABORATOR TYPE) 0.51 0.78
Switching-from-current-episode characteristics
The trigger of switching from documenting the current episode:
0 if no switch, 1 if to respond, 2 if to reach out (CURRENT EPISODE SWITCH ) 1.18 0.80
The last set of episode characteristics (switching-from-current-episode) captures how the hospi-
talist ends the current episode. For reasons similar to those discussed above, when the hospitalists
causes a switch she might spend more time on the current episode to have a better starting point
when resuming.
3.3. Econometric Specifications
3.3.1. Case documenting time Recall that patient i on day t, i.e. case (i, t) is the unit of
analysis. We start with running a “naive” regression—Fixed Effect regression (FE)—when fixing
the day effect and including the case characteristics, Xcasei,t , and the coordination (task switching
and communication) characteristics, Xcollabi,t , as the covariates. We consider a log-linear relationship
in the FE regression since DOCUMENT TIMEi,t follows a Weibull distribution:
log(DOCUMENT TIMEi,t) = αfe,t +βcasefe Xcasei,t +βcollabfe Xcollab
i,t +ui,t (1.1)

Wang, Gurvich, Van Mieghem, O’Leary: Productivity Losses due to Coordination16
Survival analysis is a conventional econometric specification to examine how time duration
depends on different factors (Cox (1972), Kalbfleisch and Prentice (2011) and Collett (2015)). We
consider a Weibull model (Carroll (2003)) 34 With σ, θ being the shape and scale parameters of
the Weibull distribution of DOCUMENT TIMEi,t, the hazard rate h(DOCUMENT TIMEi,t)
is then expressed as
h(DOCUMENT TIMEi,t) =σ
θ(DOCUMENT TIMEi,t
θ)σ−1 exp(βcaseweibullX
casei,t +βcollabweibullX
collabi,t )
(1.2)
We “equalize” the impact of case characteristics to account for their confounding effects (such
as patient documentation complexity captured by the patient-related variables and documentation
prioritization captured by the workflow-related variables) that may affect both the case document-
ing time and the need for task switching. Adopting the Propensity Score (PS) Weighting method
(McCaffrey et al. (2004)), we divide all cases into 3 groups according to their task switching
frequencies when being documented: Control group — Group 0 are cases without any switches,
Treatment groups — Group 1 cases have 1 to 3 switches, and Group 2 cases have more than 3
switches. Using the boosted regression (McCaffrey et al. (2004)), we obtain a weight, wi,t for each
case (i, t), that proxies for the case’s probability of having no switch (i.e. belonging to the control
group) in the scenario where no confounding effect exists: switches would happen randomly. We
run a Survey-Weighted Generalized Linear Model (GLM)5:
log(DOCUMENT TIMEi,t) =αps,glm +βcaseps,glmXcasei,t +βcollabps,glmXcollab
i,t +ui,t,
with weight wi,t (1.3)
Lastly, we conduct a survival analysis to ensure the robustness of the statistical impact of each
covariate. We use the Cox Proportional Hazard Model (Cox)6 in which the instantaneous hazard
rate of the documenting time can be expressed as
h(DOCUMENT TIMEi,t) =h0(DOCUMENT TIMEi,t) exp(βcaseps,coxXcasei,t +βcollabps,coxX
collabi,t ),
with weight wi,t (1.4)
As discussed in Cox (1972), h0(DOCUMENT TIMEi,t) is the baseline hazard function that does
not need to be specified, and the hazard rate of each variable (βcaseps,cox and βps,collabcox ) can be estimated
using partial maximum likelihood.
3 (the survreg function in the statistical software R)
4 All survival analyses in this paper specify day, t, as a cluster.
5 Using svyglm4 function in R.
6 The weights obtained from PS weighting method are incorporated in the svycoxph4 function in R.
Wang, Gurvich, Van Mieghem, O’Leary: Productivity Losses due to Coordination17
3.3.2. Episode documenting time Our Hypothesis 1 stipulates that task switching impacts
the case documenting time through a setup time that is added to each documentation episode.
To analyze this dynamic, we run a fixed effect regression (fixing the case effect) and a survival
analysis. Recall that the episode documenting time follows a log-normal distribution. Thus, for
the jth documenting episode of patient i on day t, we take the log(EPISODE TIMEi,t,j) as the
dependent variable and express the fixed effect regression equation as
log(EPISODE TIMEi,t,j) = γfe,i,t + δcasefe Xcasei,t,j + δepisodefe Xepisode
i,t,j +ui,t,j (2.1)
where Xcase and Xepisode are summarized in Table 2 and Table 3, respectively. The hazard rate
function used for the survival analysis (Cox (1972)) is
h(EPISODE TIMEi,t,j) = h0(EPISODE TIMEi,t,j) exp(δcasecox Xcasei,t,j + δepisodecox Xepisode
i,t,j ) (2.2)
To deal with the confounding effect, we can also assign a weight to each episode using the
Propensity Score Weighting method. Since each episode can only incur at most one switch, we
now group episodes according to the switching trigger instead of switching frequency: an episode
belongs to Group 0 if it is not interrupted (i.e. the last episode of a case), Group 1 if it ends
because the hospitalist switches to respond to a collaborator, and Group 2 if the hospitalist switches
to reach out. Such grouping addresses the concerns that potential confounding factors such as
Switching-from-last-episode characteristics (events prior to the current episode) or Current-episode
characteristics might affect how the hospitalist end the current episode and the episode length
simultaneously. After equalizing the impact of case and episode characteristics with the Propensity
Score and obtaining a weight, vi,t,j for each episode (i, t, j), we conduct both a GLM4 and a survival
analysis4 to ensure the robustness of each covariate:
log(EPISODE TIMEi,t,j) =γps,glm + δcaseps,glmXcasei,t,j + δepisodeps,glm Xepisode
i,t,j +ui,t,j
with weight vi,t,j (2.3)
h(EPISODE TIMEi,t,j) =h0(EPISODE TIMEi,t,j) exp(δcaseps,coxXcasei,t,j + δepisodeps,cox Xepisode
i,t,j )
with weight vi,t,j (2.4)
The regression results are reported in section 4—Table 4 and Table 5, respectively. Further
validation and robustness checks appear in section 5.
Wang, Gurvich, Van Mieghem, O’Leary: Productivity Losses due to Coordination18
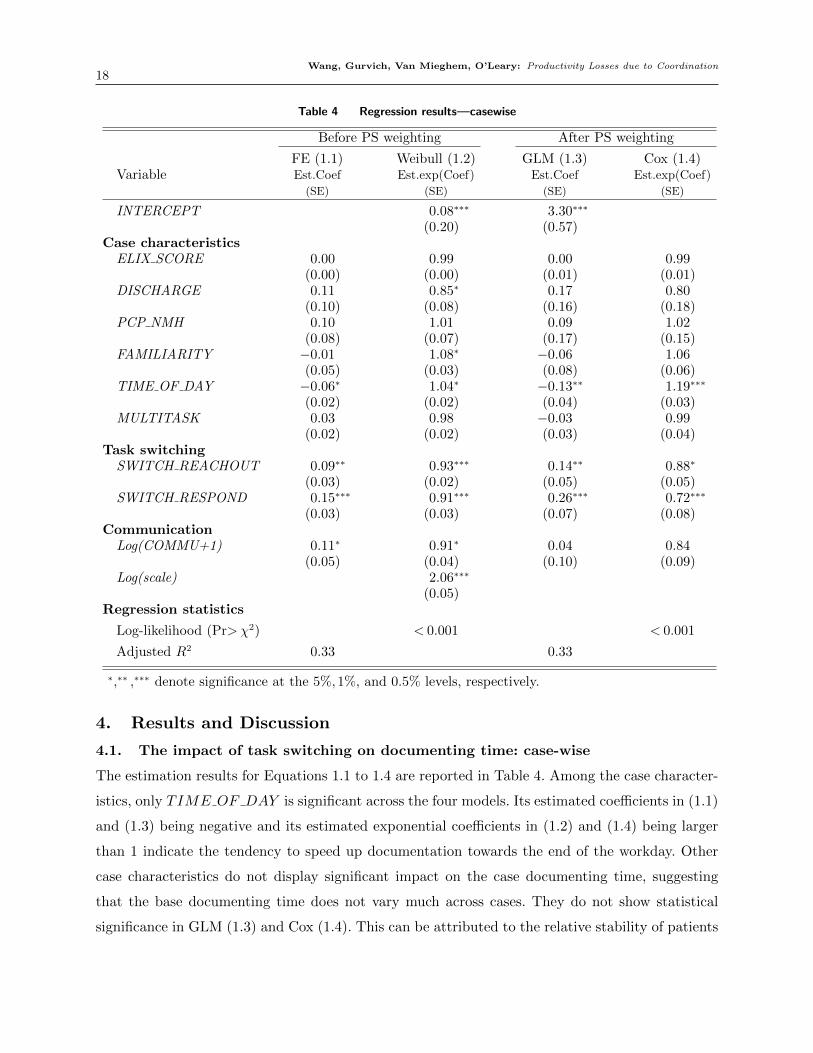
Table 4 Regression results—casewise
Before PS weighting After PS weighting
FE (1.1) Weibull (1.2) GLM (1.3) Cox (1.4)Variable Est.Coef Est.exp(Coef) Est.Coef Est.exp(Coef)
(SE) (SE) (SE) (SE)
INTERCEPT 0.08∗∗∗ 3.30∗∗∗
(0.20) (0.57)Case characteristics
ELIX SCORE 0.00 0.99 0.00 0.99(0.00) (0.00) (0.01) (0.01)
DISCHARGE 0.11 0.85∗ 0.17 0.80(0.10) (0.08) (0.16) (0.18)
PCP NMH 0.10 1.01 0.09 1.02(0.08) (0.07) (0.17) (0.15)
FAMILIARITY −0.01 1.08∗ −0.06 1.06(0.05) (0.03) (0.08) (0.06)
TIME OF DAY −0.06∗ 1.04∗ −0.13∗∗ 1.19∗∗∗
(0.02) (0.02) (0.04) (0.03)MULTITASK 0.03 0.98 −0.03 0.99
(0.02) (0.02) (0.03) (0.04)Task switching
SWITCH REACHOUT 0.09∗∗ 0.93∗∗∗ 0.14∗∗ 0.88∗
(0.03) (0.02) (0.05) (0.05)SWITCH RESPOND 0.15∗∗∗ 0.91∗∗∗ 0.26∗∗∗ 0.72∗∗∗
(0.03) (0.03) (0.07) (0.08)Communication
Log(COMMU+1) 0.11∗ 0.91∗ 0.04 0.84(0.05) (0.04) (0.10) (0.09)
Log(scale) 2.06∗∗∗
(0.05)Regression statistics
Log-likelihood (Pr>χ2) < 0.001 < 0.001
Adjusted R2 0.33 0.33
∗,∗∗ ,∗∗∗ denote significance at the 5%,1%, and 0.5% levels, respectively.
4. Results and Discussion
4.1. The impact of task switching on documenting time: case-wise
The estimation results for Equations 1.1 to 1.4 are reported in Table 4. Among the case character-
istics, only TIME OF DAY is significant across the four models. Its estimated coefficients in (1.1)
and (1.3) being negative and its estimated exponential coefficients in (1.2) and (1.4) being larger
than 1 indicate the tendency to speed up documentation towards the end of the workday. Other
case characteristics do not display significant impact on the case documenting time, suggesting
that the base documenting time does not vary much across cases. They do not show statistical
significance in GLM (1.3) and Cox (1.4). This can be attributed to the relative stability of patients

Wang, Gurvich, Van Mieghem, O’Leary: Productivity Losses due to Coordination19
in the internal medicine division and/or to the nature of the hospitalist documentation work: the
standardized formats of diagnosis report, treatment plan, medical orders and etc. With everything
else being controlled for via control variables or through the Propensity Score weighting, most
patient case characteristics do not significantly contribute to the documentation content of time.
The effects of task switching are evident in Table 4. The estimated coefficients of
SWITCH REACHOUT and SWITCH RESPOND are statistically significant in all four
columns. In FE (1.1) and GLM (1.3), the coefficients are positive, representing a marginal increase
in log(DOCUMENT TIME) due to a switch. The coefficients in Weibull (1.2) and Cox (1.4),
interpreted as the instantaneous hazard rate of the case being finished, are less than 1 and indicate
a slower documenting speed due to an additional switch. Formally, we establish the first result (the
causal relationship will be validated in later sections):
Result 1: A greater number of switches is associated with longer documenting time.
The estimated coefficients of SWITCH REACHOUT in (1.1) and (1.3) are smaller than
those of SWITCH RESPOND, suggesting that a switch to reach out to another person is
less penalizing than a switch to respond. Furthermore, the estimated exponential coefficients of
SWITCH REACHOUT in (1.2) and (1.4) are larger than those of SWITCH RESPOND,
which implies that the hospitalist can document a case faster if she experiences a switch to reach
out than if she switches to respond. To empirically test these coefficient comparisons, we performed
1000 bootstrap regressions for each model: each time, we sample 1000 data points from the original
data set with replacement—this alleviates the limitation of small sample size. By performing one-
sided t-tests on the 1000 pairs of coefficients (SWITCH REACHOUT ,SWITCH RESPOND)
for each model, we confirm the comparisons discussed above. These comparisons imply:
Result 2: A switch triggered by the hospitalist to reach out introduces a smaller penalty to the
documenting time of the preempted case than a switch triggered by responding to other collaborators.
These two results are further captured in our counterfactual predictions of the tail probabilities of
case documenting time in Figure 5, where tail probability is defined as Pr(Case documenting time≥
t), for t ≥ 0. The left panel shows that the observed tail probability of case documenting time
diminishes to zero when t approaches 20 minutes. If no case experienced any switches, our model
would predict the tail probability using Equation 1.4; notice that it falls faster than the observed
tail probability. It would go to 0 as t approaches around 15 minutes. This means that the hospitalist
would document faster if she would never switch to other activities while documenting a case. A
slightly smaller improvement in documentation speed is predicted if all cases would belong to the
low-switching-frequency group—the hospitalist makes 1 to 3 switches per case. If the hospitalist
makes more than 3 switches per case, the tail probability shifts to the right, which suggests that
she would document slower. The right panel retains the observed switching frequency of each case

Wang, Gurvich, Van Mieghem, O’Leary: Productivity Losses due to Coordination20
Figure 5 Predicting case documenting time with the Cox Proportional Hazards Model
0 10 20 30
0.2
0.4
0.6
0.8
1.0
If all cases haveObserved interruptionsNo interruptionsOnly Low−frequency interruptionsOnly High−frequency interruptions
Tail probability of case documenting time under different switching−frequency scenarios
t (minutes)
Pr (
case
doc
umen
ting
time
grea
ter t
han
t)
0 10 20 30
0.2
0.4
0.6
0.8
1.0
If all cases' interruptions' types areas observedfrom collaboratorsby hospitalists
Tail probability of case documenting time under different switching−type scenarios
t (minutes)
Pr (c
ase
docu
men
ting
time
grea
ter t
han
t)
Tail probability of case documenting time: under different switching-frequency scenarios
Tail probability of case documenting time: under different switching-type scenarios
No case has any switch
All cases have 1 to 3 switches
All cases have switches as observed in the data
All cases have more than 3 switches
All cases’ switches are conducted by the hospitalist to reach out
All cases have switches as
observed in the data
All cases’ switches are conducted to respond to other people
0 10 20 30 0 10 20 30
1.0 0.8
0.4 0.2
0.6
1.0 0.8
0.4 0.2
0.6
but performs a counterfactual on different switching triggers: the tail probability curve shifts to
the left if all observed switches would have been initiated by the hospitalist herself to reach out,
suggesting a faster documentation. The curve largely shifts to the right if all switches would have
been made in response to collaborators’ requests, indicating a slower documentation.
The estimated coefficients of communication time are not statistically significant. This is possibly
because that the two directions of effects cancel each other out: on one hand, longer communications
might generate additional information to document; on the other hand, some communications
might provide information that will help the hospitalist conclude her diagnoses more efficiently
and reduce the documenting time. This leads to:
Result 3: Communication does not significantly affect the case documenting time.
Letting R and TPROCESS denote the hospitalist productivity (i.e. throughput rate) and average
case processing time, respectively, we derive the counterfactual change in the hospitalist produc-
tivity if the task switching impact could be removed (indicated by .̂ ) as:
4RR
=“R−RR
=
1
T̂PROCESS− 1
TPROCESS
1TPROCESS
=−4TPROCESST̂PROCESS
To fill in the numbers, we first predict the case documenting time using Equation 1.3 by setting
both SWITCH REACHOUT and SWITCH RESPOND to zero. With the 1000 predicted
documenting times obtained from previous 1000 bootstrap regression results, we calculate that the
average predicted documenting time, T̂DOCUMENT is 6.5min with a standard deviation of 0.8 ≈1min. In other words, out of the observed average documenting time of 11.4min, approximately
11.4− 6.5 = 4.9≈ 5min (with a small variation: 1min of standard deviation) is due to setup times.
Formally, we establish:

Wang, Gurvich, Van Mieghem, O’Leary: Productivity Losses due to Coordination21
Result 4: Task switching introduces 5± 1 minutes of setup time to each case.
The predicted no-switch case processing time is obtained by substituting the observed document-
ing time with the predicted one, keeping the time spent on other activities fixed. From the 1000
bootstrap regression results, the average predicted case processing time, “TPROCESS, is therefore
21.4min. Recalling that the average observed processing time TPROCESS is 26.3min, the relative
change in productivity if the setup times were zero is
4RR
=−4TPROCESST̂PROCESS
=−1
26.3− 1
21.41
21.4
= 19%
The standard deviation is obtained as 3%, still calculated with the 1000 predictions from the
bootstrap regressions. Formally, we have
Result 5: In the absence of task switching, hospitalist productivity would improve by 19%±3%,
corresponding to 3 more patients per day compared to the current 14-patient assignment.
4.2. The impact of task switching on documenting time: episode-wise
We turn our attention to the detailed analysis of documenting episodes. Table 5 reports the
results for regression equations 2.1 to 2.4 in . The estimated coefficients of switching-from-previous-
episode and switching-from-current-episode characteristics help validate and explain the mecha-
nisms behind Results 1 to 4.
First, the patient-related and the current-episode characteristics (the time of day when the
episode starts, the multitasking level, the number of remaining cases that have not been started
and the documented progress ratio of the case) affect the remaining documentation work for the
case. The negative coefficients of EPISODE NOTSTARTED in (2.1) and (2.3) suggest that the
hospitalist allocates less time to the current episode if she still has many not-yet-started cases.
The negative coefficients of EPISODE PROGRESS in (2.1) and (2.3) show that the more doc-
umentation work that has been completed, the less time needed in the current episode. This might
seem intuitively expected (the more we do, the less we have remaining) but one must recall that
communication (through information added) can lengthen the documenting time. This shows that
the communication effect is not sufficiently strong to break this intuition.
The two dummy variables PREV IOUS EPISODE SWITCH = 1 and
PREV IOUS EPISODE SWITCH = 2 reflect how the hospitalist ends the previous episode—to
respond to an interruption or to reach out to a specialist. These two variables both equal 0
if the current episode is the first one of the case; i.e., there is no switching from the previous
episode. The first episode of a case does not require any setup time from the hospitalist since
there is no prior interruption of working memory. Therefore, keeping all other variables being
controlled for, the coefficients of these two dummy variables measure the incremental effects

Wang, Gurvich, Van Mieghem, O’Leary: Productivity Losses due to Coordination22
Table 5 Regression results—episode-wise, fixing the effect of Case
Before PS weighting After PS weighting
FE (2.1) Cox (2.2) GLM (2.3) Cox (2.4)Variable Est.Coef Est.exp(Coef) Est.Coef Est.exp(Coef)
(SE) (SE) (SE) (SE)
INTERCEPT 1.98∗∗∗
(0.40)
Patient-related case characteristics
ELIX SCORE 1.00 −0.00 1.00(0.00) (0.00) (0.00)
DISCHARGE 0.92 0.06 0.87(0.08) (0.09) (0.08)
PCP NMH 0.89 0.20∗ 0.84∗
(0.07) (0.08) (0.07)
FAMILIARITY 1.06 −0.04 1.08(0.03) (0.04) (0.03)
Current-episode characteristics
EPISODE TIME OF DAY 0.10 1.01 −0.03 1.01(0.06) (0.02) (0.02) (0.02)
EPISODE MULTITASK −0.01 1.01 −0.03 1.01(0.03) (0.01) (0.01) (0.01)
EPISODE NOTSTARTED −0.07∗ 1.03∗ −0.03 1.03(0.03) (0.01) (0.02) (0.01)
EPISODE PROGRESS −2.31∗∗∗ 5.71∗∗∗ −2.26∗∗∗ 20.26∗∗∗
(0.19) (0.16) (0.16) (0.18)
Switching-from-previous-episode characteristics
PREVIOUS EPISODE SWITCH= 1 (respond) 0.82∗∗∗ 0.55∗∗∗ 0.86∗∗ 0.35∗∗∗
(0.14) (0.11) (0.14) (0.14)
PREVIOUS EPISODE SWITCH= 2 (reach out) 0.74∗∗∗ 0.57∗∗∗ 0.84∗ 0.36∗∗∗
(0.14) (0.11) (0.15) (0.14)
EPISODE INTER EPISODE TIME −0.00∗∗∗ 1.00∗∗∗ −0.00∗∗ 1.00∗∗
(0.00) (0.00) (0.00) (0.00)
EPISODE COMMU 0.10 0.89∗ 0.15∗ 0.86(0.08) (0.07) (0.06) (0.07)
EPISODE COLLABORATOR TYPE −0.00 1.04 −0.07 1.05(0.09) (0.08) (0.08) (0.08)
Switching-from-current-episode characteristics
CURRENT EPISODE SWITCH= 1 (respond) −0.79∗∗∗ 2.03∗∗∗ −0.90∗∗∗ 2.27∗∗∗
(0.13) (0.10) (0.12) (0.09)
CURRENT EPISODE SWITCH= 2 (reach out) −0.89∗∗∗ 2.10∗∗∗ −1.04∗∗∗ 2.40∗∗∗
(0.13) (0.09) (0.10) (0.08)
Regression statistics
Log-likelihood (Pr>χ2) < 0.001 < 0.001
Adjusted R2 0.15 0.36
∗,∗∗ ,∗∗∗ denote significance at the 5%,1%, and 0.5% levels, respectively.
due to resumption, i.e., setup time for reconfiguring the interrupted working memory from
previous episode. The estimates are positive and significant in FE (2.1) and GLM (2.3), and the
estimated exponential coefficients in Cox (2.2) and (2.4) are smaller than 1. These suggest a
positive incremental effect from resumption—a switch out from a case induces a setup penalty

Wang, Gurvich, Van Mieghem, O’Leary: Productivity Losses due to Coordination23
Table 6 Estimated setup time per episode
Episode index1 2 3 4 5 6 7 8 ...
Estimated setup time (minutes) 1.61 1.84 2.46 1.79 2.12 1.57 1.39 ...Standard deviation (minutes) 0.29 0.28 0.33 0.33 0.47 0.33 0.31 ...1We do not estimate the setup time for the first episode since we assume there is no setup time needed.
when resuming the case. The coefficient of PREV IOUS EPISODE SWITCH = 1 being larger
than that of PREV IOUS EPISODE SWITCH = 2 in FE (2.1) and GLM (2.3) imply that
the magnitude of this setup time is larger if the previous switch is initiated to respond to an
interruption compared to reaching out. This confirms Hypothesis 1 and further validates Result 1
and is consistent with the descriptive Figure 4.
Table 5 also shows that the communication frequency and the types of collaborators that inter-
acted with the hospitalist since the previous episode do not significantly contribute to the current
episode’s documenting time. This further validates Result 3.
The switching-from-current-episode effects—CURRENT EPISODE SWITCH = 1 and
CURRENT EPISODE SWITCH = 2—are statistically significant and negative. In FE (2.1)
and GLM (2.3), the coefficients of CURRENT EPISODE SWITCH = 1 are −0.79 and −0.90
respectively and those of CURRENT EPISODE SWITCH = 2 are −0.89 and −1.04. The neg-
ativity, common to all these variables, shows that a documentation episode that does not end with
a switch (CURRENT EPISODE SWITCH would equal to 0) is longer than episodes that are
interrupted and end with a switch. Moreover, the hospitalist ends the current episode earlier when
the switch is made to reach out compared to when it is made to respond. For example in GLM
(2.3), the coefficient of CURRENT EPISODE SWITCH = 1 is −1.04 and is smaller than that
of CURRENT EPISODE SWITCH = 2, −0.90. Same conclusions are drawn from FE (2.1),
Cox (2.2) and (2.4). Following similar bootstrap procedures, we validate such coefficient compar-
isons with one-sided t-tests on estimated coefficients from each bootstrap regression results. This
confirms Hypothesis 2 and validates Result 2. It is possible because when the hospitalist controls
the switching timing (as in the case of reaching out), she will stop the documentation at a point
from which it will be easy to resume in a later episode. Consequently, she incurs a shorter setup
time relative to the case where the switch is driven by a response.
As mentioned earlier, one may be concerned with the possibility of reverse causality, namely that
it is not only that setups increase documenting time but that cases that have longer documenting
time are inevitably more likely to be interrupted and hence require more setups. We will address this
possibility of endogeneity via standard econometric methods in Section 5 yet the episodal model
here, while not ruling out the possibility that longer documenting times lead to more switches,
supports the existence of direct causality: switches increase documenting times.

Wang, Gurvich, Van Mieghem, O’Leary: Productivity Losses due to Coordination24
Table 7 The robustness-checking models
Model feature Model a Model b Model c Model d
PS weighting the data by grouping the data according to:
switching frequency X Xswitching trigger X X
In the coordination characteristics, include:
the task switching frequency group Xthe task switching trigger group X
the number of switches due to each trigger X XEstimated setup time (in minutes) 5 6 6 5
The relative change in productivity 19% 23% 23% 19%Standard deviation 3% 3% 3% 3%
Within our episodal model one can circumvent the possible reverse effect of the documenting
time on the number of switches by keeping the latter (switching frequency) constant and only
nulling the effect of the switch itself. This is achieved by setting the switching-from-previous-
episode variables equal to zero. Specifically, within each bootstrap regression of Equation 2.3,
we estimate the setup time needed for each episode by following similar procedures as in sec-
tion 4.1: we first predict the documenting time of each episode by setting the dummy variables
CURRENT EPISODE SWITCH = 1 and CURRENT EPISODE SWITCH = 2 equal to
zeros. The gap between the predicted (counterfactual) and the observed documenting time is,
purely, the effect of case resumption and is around 2min as shown in Table 6. In other words, we
find a 2min setup time for each of the second and later episodes of a case. Aggregated over all
episodes of each case, the total setup time for a case is 5.6 minutes on average and falls in the 95%
confidence interval of the estimated case setup time of Result 4 in section 4.1: 4.9± (1.96× 0.8)
minutes. In this way the detailed episodal model provides a robustness check to the result 4 (for
the simpler case level model) that 5 minutes of the documentation time are added through task
switches and their associated setup times.
5. Robustness5.1. Model validation and robustness
We first check the robustness of our propensity score weighting method. We take Equation 1.3 as
the baseline model, Model a, and further include three models. The models are summarized in
Table 7. Model b is a GLM conducted after the same PS weighting as Model a but includes the
task switching frequency group dummy variable instead of the number of switches due to each
trigger. Model c and Model d are GLMs conducted after PS weighting the data according to the
switching trigger group: Group 0 if no switch, Group 1 if the case’s switches are all to respond to
other people, Group 2 if the case’s switches are all to reach out to other people, and Group 3 if the
case’s switches include both reaching out and responding. We consider the total number of switches
of each case and the number of switches due to each trigger in the two models, respectively.
Wang, Gurvich, Van Mieghem, O’Leary: Productivity Losses due to Coordination25
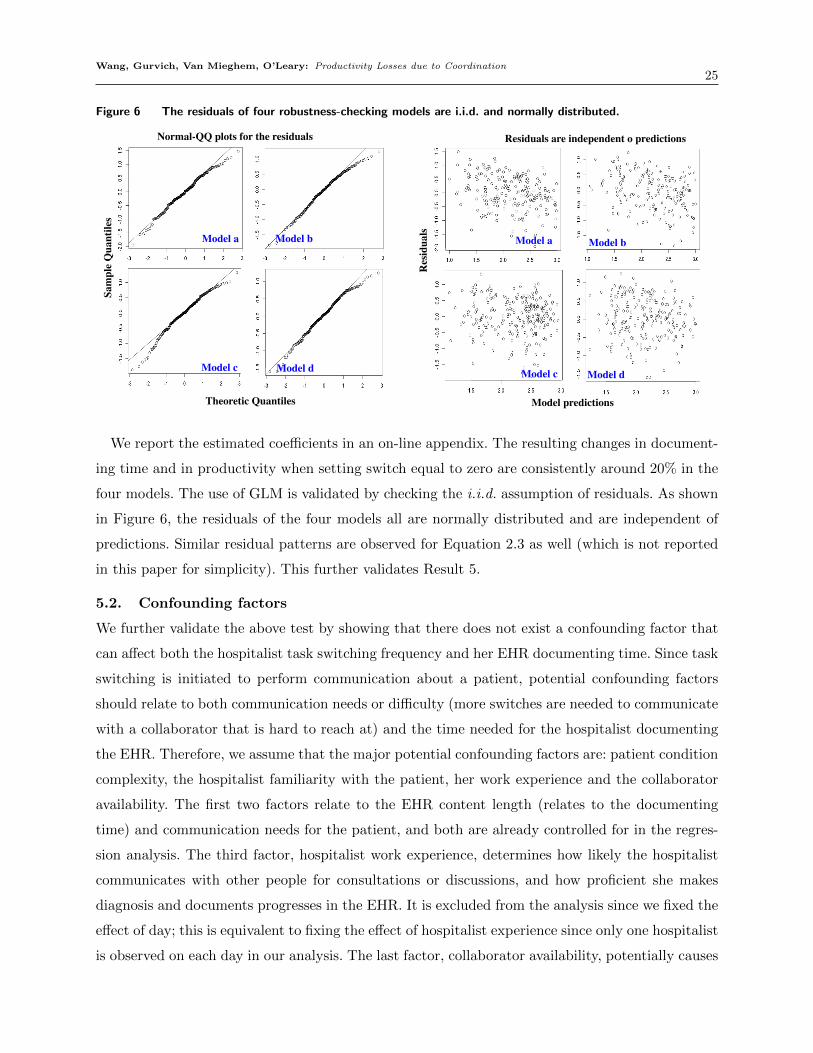
Figure 6 The residuals of four robustness-checking models are i.i.d. and normally distributed.
Model dModel c Model dModel c
Model a Model b Model a Model b
Normal-QQ plots for the residuals Residuals are independent o predictions
Res
idua
ls
Sam
ple
Qua
ntile
s
Model predictionsTheoretic Quantiles
We report the estimated coefficients in an on-line appendix. The resulting changes in document-
ing time and in productivity when setting switch equal to zero are consistently around 20% in the
four models. The use of GLM is validated by checking the i.i.d. assumption of residuals. As shown
in Figure 6, the residuals of the four models all are normally distributed and are independent of
predictions. Similar residual patterns are observed for Equation 2.3 as well (which is not reported
in this paper for simplicity). This further validates Result 5.
5.2. Confounding factors
We further validate the above test by showing that there does not exist a confounding factor that
can affect both the hospitalist task switching frequency and her EHR documenting time. Since task
switching is initiated to perform communication about a patient, potential confounding factors
should relate to both communication needs or difficulty (more switches are needed to communicate
with a collaborator that is hard to reach at) and the time needed for the hospitalist documenting
the EHR. Therefore, we assume that the major potential confounding factors are: patient condition
complexity, the hospitalist familiarity with the patient, her work experience and the collaborator
availability. The first two factors relate to the EHR content length (relates to the documenting
time) and communication needs for the patient, and both are already controlled for in the regres-
sion analysis. The third factor, hospitalist work experience, determines how likely the hospitalist
communicates with other people for consultations or discussions, and how proficient she makes
diagnosis and documents progresses in the EHR. It is excluded from the analysis since we fixed the
effect of day; this is equivalent to fixing the effect of hospitalist experience since only one hospitalist
is observed on each day in our analysis. The last factor, collaborator availability, potentially causes

Wang, Gurvich, Van Mieghem, O’Leary: Productivity Losses due to Coordination26
a confounding effect by indirectly impacting the hospitalist documenting time through affecting the
hospitalist switching frequency. A collaborator is any specialist the hospitalist communicates with
about the patient, and whose availability thus determines the communication difficulty and conse-
quently affects the hospitalist task switching needs. To rule out this fourth potential confounding
factor, we first assume the existence of such endogeneity caused by collaborator availability, then
construct instrumental variables (IV) that proxy for collaborator availability. We finally rule out
this assumption with the Durbin-Wu-Hausman test: if the test does not reject the null hypothe-
sis that task switching is exogenous given the IVs in use, we are able to claim that collaborator
availability has no confounding effect.
To validate the choice of IVs and to perform the test, a Two-Stage-Least-Squares regression is
needed. For patient i on day t, we establish:
SWITCHi,t = π0 +π1Zi,t +π2Xi,t + ε3.1i,t (3.1)
By replacing SWITCHi,t by ̂SWITCHi,t obtained from Equation 3.1, we further have:
log(DOCUMENT TIMEi,t) = φ0 +φ1̂SWITCH i,t +φ2Xi,t + ε3.2i,t (3.2)
In the above equations, SWITCHi,t represents the number of switches (both to reach out and
to respond) made by the hospitalist while documenting patient i’s EHR on day t, Xi,t includes the
control variables (excluding switches) summarized in Table 2. Zi,t represents a valid IV. We select 2
IV candidates that satisfy the two criteria for a valid IV: a) Exclusion — the IV, Z, is uncorrelated
with the error term in Equation 3.2, i.e. Cov(Z, ε3.2) = 0; and b) Inclusion: Cov(Z,SWITCH) 6=
0. In other words, a valid IV should affect the hospitalist documenting time only through the
hospitalist task switching frequency.
We select two IV candidates that measure collaborator workload to proxy their availability, based
on the assumption that busier collaborators are more difficult to reach at and thus less available.
For all patients (not limited to the observed patients) hospitalized in the inpatient unit during our
observational period, the EHR records all medical activities (medication orders, lab tests, surgeries,
consultations and etc.) and care providers who conduct those activities. We thus construct the two
IV candidates by measuring: 1) average number of patients a collaborator see on that day; and 2)
average number of activities a collaborator performs on that day.
These two IVs satisfy the Exclusion criterion because collaborator workloads do not directly
affect the hospitalist’s documenting time of any case. This is due to the nature of the hospital-
ist documentation work: it is an individual mind-focused work and thus its time depends on the
length of content the hospitalist intends to input in the EHR and the hospitalist’s thinking process.

Wang, Gurvich, Van Mieghem, O’Leary: Productivity Losses due to Coordination27
Table 8 Validation of Instrumental Variables and Specification Test Results
Instrumental variable Correlation with SWITCH
Average # of:patients each collaborator1 see on that day -0.14***2
activities each collaborator1 performs on that day -0.18***2
Specification tests p-value
Sargan test 0.22Durbin-Wu-Hausman test 0.39
1For each patient on a day, a collaborator is a person the hospitalist communicates with about the patient on that day.2 ∗,∗∗ ,∗∗∗ denote significance at the 5%,1%, and 0.5% levels, respectively.
Therefore, the workloads—how many patients seen or activities performed—of any collaborator
other than the hospitalist should not directly affect the hospitalist documentation work. We empir-
ically test the Exclusion criterion by performing a Sargan test. As shown in the bottom part of
Table 8, the large p-value 0.22 suggests that we do not reject the null hypothesis that both IVs are
uncorrelated with ε3.2 in Equation 3.2.
The two candidates satisfy the Inclusion criterion since collaborator workloads determine their
availabilities and frequencies to communicate with the hospitalist, and inevitably relates to the
hospitalist switching frequency. To empirically validate, we calculate the correlations between the
two IVs and SWITCH. The second column in the top part of Table 8 indicates that the correlations
are statistically significant and not equal to zeros.
The last row of Table 8 is the key in ruling out the endogeneity concern due to collaborator
availability. The null hypothesis of Durbin-Wu-Hausman test is that SWITCH is exogenous. The
large p-value 0.39 suggests that we cannot reject the null hypothesis and conclude that collaborator
availability does not cause a confounding effect.
6. Concluding remarks
The setting in this paper has the following fundamental characteristics: there is a set of human
resources that each have their own individual work (the hospitalist and her collaborators all have
their own individual tasks) but also collaborative activities. These characteristics are likely to be
found in a variety of information-intensive professional services (e.g. manufacturing, new-product
development, software engineering and the judiciary).
In this setting, we examine the impact of coordination on the productivity of physicians using
data collected at Northwestern Memorial Hospital. The detailed observational data, together with
an episodal empirical model, enable us to explore the effect of coordination on hospitalist pro-
ductivity through task switching. Our model estimates the unobservable setup time from task
switching to be about 5min, accounting for almost 50% of the observed case documenting time,
which translates into a 20% productivity loss.

Wang, Gurvich, Van Mieghem, O’Leary: Productivity Losses due to Coordination28
Innovative policies and technologies have been developed and implemented in various hospitals,
aiming at improving the coordination efficiency among physicians and nurses; e.g., see Zwarenstein
and Bryant (2000), Lingard et al. (2008), and Wayne et al. (2008). The experience with Structured
Interdisciplinary Rounds (SIDR) currently being implemented at Northwestern Memorial Hospital
(O’Leary et al. (2010) and O’Leary et al. (2011)) can shed light on avoiding task preemptions
that are not productive. SIDR refers to a regular short meeting held at 10 a.m. on every weekday
when hospitalists and nurses exchange information regarding their shared patients. It improves the
communication efficiency by batching the hospitalist’s coordination activities with nurses within a
certain time frame. It is desirable to design coordination protocols that reduce the cost of infor-
mation collection by better coordinating hospitalists with the providers with whom they interact.
Our results show that the benefit can be significant.
The focus of this paper is not on offering implementable remedies. Yet, from our results one can
draw conclusions about what the general direction should be:
(1) Postpone and consolidate information outreach of each case, and perhaps even per batch of
cases. Instead of reaching out to collaborators while documenting, it may be better from a produc-
tivity perspective to complete documentation task to the extent possible and then reach out to the
(possibly several) collaborators at once. This then minimizes the possibility of being interrupted by
a collaborator response. Our observation in the hospital suggests that some hospitalists do follow
such batching heuristics and write a batch of cases before initiating any coordination requests and
before responding to any interruptions. Batching, however, comes at the possible cost of missing
opportunities of communicating with other people when they are available which leads to the sec-
ond point. Ideally, if collaborators could agree to synchronize when they do their individual work,
then they could all be available simultaneously for the coordination work. This would streamline
team communication and minimize delays and task switching.
(2) Consolidate information sharing among collaborator pairs. Recall that, regardless of how
well resources are synchronized, each communication inflicts task switching which increases the
documenting time. Therefore, to the extent possible, it is preferred to consolidate all information
sharing between the same two people in one communication. (In contrast to piecemeal information
sharing via multiple interactions, which each would inflict a task switch.)
(3) Standardize work to reduce the cognitive cost from task switches: The setup time due to task
switching can be alleviated through better standardization and design of the content and format
of medical charts, e.g. a checklist for documented work.
Wang, Gurvich, Van Mieghem, O’Leary: Productivity Losses due to Coordination29
Coordination is necessary yet challenging: it may result in better patient care but it introduces
task switching and productivity losses. Our study of the impact of coordination on productivity
begs further work on the impact of coordination on quality of care. While we can proxy some
aspect of quality with communication time the hospital does not track the needed quality data,
which would require another study. Yet, the measurement of productivity is a first step towards
improvement. As the chief of hospital medicine told us: “Of course patient care quality is crucial,
but we hospitalists also want to simply improve our productivity.”
Finally, our study also highlights a trade-off between flexible and dedicated resources, which is
fundamental in operations management. Hospitalists, viewed as generalists, are flexible resources
who provide patient care to patients with a large variety of conditions and endow the hospital with
some economies of scale. It is this flexibility, however, that necessitates some of the coordination
that, in turn, affects the productivity. A patient with a cardio-vascular condition might require
fewer of these communications but such dedicated allocation compromises economies of scale. Thus,
a better understanding of the effects of coordination feeds into fundamental operations strategy
questions. We hope that this study may serve as a stepping-stone to further research of such settings
and potential solutions to the challenges they offer.
References
Altmann, E. M. and J. G. Trafton (2004). Task interruption: Resumption lag and the role of cues. Technical
report, DTIC Document.
Ballermann, M. A., N. T. Shaw, D. C. Mayes, R. N. Gibney, and J. I. Westbrook (2011). Validation of the
work observation method by activity timing (wombat) method of conducting time-motion observations
in critical care settings: an observational study. BMC medical informatics and decision making 11 (1),
32.
Bendoly, E., M. Swink, and W. P. Simpson (2014). Prioritizing and monitoring concurrent project work:
Effects on switching behavior. Production and Operations Management 23 (5), 847–860.
Biron, A. D., M. Lavoie-Tremblay, and C. G. Loiselle (2009). Characteristics of work interruptions during
medication administration. Journal of Nursing Scholarship 41 (4), 330–336.
Bohn, R. (2000). Stop fighting fires. Harvard Business Review 78 (4), 82–91.
Bray, R. L., D. Coviello, A. Ichino, and N. Persico (2015). Multitasking, multi-armed bandits, and the italian
judiciary. Available at SSRN 2631929 .
Brooks, F. P. (1975). The mythical man-month. Addison-Wesley Reading, MA.
Carroll, K. J. (2003). On the use and utility of the weibull model in the analysis of survival data. Controlled
clinical trials 24 (6), 682–701.
Wang, Gurvich, Van Mieghem, O’Leary: Productivity Losses due to Coordination30
Chisholm, C. D., E. K. Collison, D. R. Nelson, and W. H. Cordell (2000). Emergency department workplace
interruptions are emergency physicians “interrupt-driven” and “multitasking”? Academic Emergency
Medicine 7 (11), 1239–1243.
Cole, G., D. Stefanus, H. Gardner, M. J. Levy, and E. Y. Klein (2015). The impact of interruptions on the
duration of nursing interventions: a direct observation study in an academic emergency department.
BMJ quality & safety 19 (4), bmjqs–2014.
Collett, D. (2015). Modelling survival data in medical research. CRC press.
Conway, R. W., W. L. Maxwell, and L. W. Miller (1967). Theory of scheduling. Addison-Wesley Pub. Co.
Cox, D. R. (1972). Regression models and life-tables. Journal of the Royal Statistical Society. Series B
(Methodological) 34 (2), 187–220.
Czerwinski, M., E. Horvitz, and S. Wilhite (2004). A diary study of task switching and interruptions. In
Proceedings of the SIGCHI conference on Human factors in computing systems, pp. 175–182.
Dobson, G., T. Tezcan, and V. Tilson (2013). Optimal workflow decisions for investigators in systems with
interruptions. Management Science 59 (5), 1125–1141.
Eisenberg, M. (1971). Two queues with changeover times. Operations Research 19 (2), 386–401.
Eyrolle, H. and J.-M. Cellier (2000). The effects of interruptions in work activity: Field and laboratory
results. Applied ergonomics 31 (5), 537–543.
Flynn, E. A., K. N. Barker, J. T. Gibson, R. E. Pearson, B. A. Berger, and L. Smith (1999). Impact of
interruptions and distractions on dispensing errors in an ambulatory care pharmacy. American Journal
of Health System Pharmacy 56, 1319–1325.
Froehle, C. M. and D. L. White (2014). Interruption and forgetting in knowledge-intensive service environ-
ments. Production and Operations Management 23 (4), 704–722.
Gardner, H., F. Gino, and B. Staats (2012). Dynamically integrating knowledge in teams: Transforming
resources into performance. Academy of Management Journal 55 (4), 998–1022.
Girotra, K., C. Terwiesch, and K. T. Ulrich (2010). Idea generation and the quality of the best idea.
Management Science 56 (4), 591–605.
Halbesleben, J. R., G. T. Savage, D. S. Wakefield, and B. J. Wakefield (2010). Rework and workarounds
in nurse medication administration process: implications for work processes and patient safety. Health
care management review 35 (2), 124–133.
Hall, L. M., C. Pedersen, and L. Fairley (2010). Losing the moment: understanding interruptions to nurses’
work. Journal of Nursing Administration 40 (4), 169–176.
Hofri, M. and K. W. Ross (1987). On the optimal control of two queues with server setup times and its
analysis. SIAM Journal on Computing 16 (2), 399–420.

Wang, Gurvich, Van Mieghem, O’Leary: Productivity Losses due to Coordination31
Kalbfleisch, J. D. and R. L. Prentice (2011). The statistical analysis of failure time data, Volume 360. John
Wiley & Sons.
KC, D. S. (2013). Does multitasking improve performance? Evidence from the emergency department.
Manufacturing & Service Operations Management 16 (2), 168–183.
Lingard, L., G. Regehr, B. Orser, R. Reznick, G. R. Baker, D. Doran, S. Espin, J. Bohnen, and S. Whyte
(2008). Evaluation of a preoperative checklist and team briefing among surgeons, nurses, and anesthe-
siologists to reduce failures in communication. Archives of Surgery 143 (1), 12–17.
Ly, T., C. S. Korb-Wells, D. Sumpton, R. R. Russo, and L. Barnsley (2013). Nature and impact of inter-
ruptions on clinical workflow of medical residents in the inpatient setting. Journal of graduate medical
education 5 (2), 232–237.
McCaffrey, D. F., G. Ridgeway, and A. R. Morral (2004). Propensity score estimation with boosted regression
for evaluating causal effects in observational studies. Psychological methods 9 (4), 403.
O’Leary, K. J., R. Buck, H. M. Fligiel, C. Haviley, M. E. Slade, M. P. Landler, N. Kulkarni, K. Hinami,
J. Lee, S. E. Cohen, , M. V. Williams, and D. B. Wayne (2011). Structured interdisciplinary rounds in
a medical teaching unit: Improving patient safety. Archives of Internal Medicine 171 (7), 678–684.
O’Leary, K. J., D. B. Wayne, C. Haviley, M. E. Slade, J. Lee, and M. V. Williams (2010). Improving
teamwork: Impact of structured interdisciplinary rounds on a medical teaching unit. Journal of General
Internal Medicine 25 (8), 826–832.
Pashler, H. (1994). Dual-task interference in simple tasks: Data and theory. Psychological Bulletin 116 (2),
220.
Perlow, L. A. (1999). The time famine: Toward a sociology of work time. Administrative science quar-
terly 44 (1), 57–81.
Rosenstein, A. H. (2002). Nurse-physician relationships: Impact on nurse satisfaction and retention. The
American Journal of Nursing 102 (6), 26–34.
Rubinstein, J. S., D. E. Meyer, and J. E. Evans (2001). Executive control of cognitive processes in task
switching. Journal of Experimental Psychology: Human Perception and Performance 27 (4), 763.
Salvucci, D. D., N. A. Taatgen, and J. P. Borst (2009). Toward a unified theory of the multitasking continuum:
From concurrent performance to task switching, interruption, and resumption. In Proceedings of the
SIGCHI Conference on Human Factors in Computing Systems, pp. 1819–1828.
Schultz, K. L., J. O. McClain, and L. J. Thomas (2003). Overcoming the dark side of worker flexibility.
Journal of Operations Management 21 (1), 81–92.
Skinner, C. E. (1967). A priority queuing system with server-walking time. Operations Research 15 (2),
278–285.
Speier, C., J. S. Valacich, and I. Vessey (1999). The influence of task interruption on individual decision
making: An information overload perspective. Decision Sciences 30 (2), 337–360.
Wang, Gurvich, Van Mieghem, O’Leary: Productivity Losses due to Coordination32
Spencer, R., E. Coiera, and P. Logan (2004). Variation in communication loads on clinical staff in the
emergency department. Annals of emergency medicine 44 (3), 268–273.
Staats, B. R. and F. Gino (2012). Specialization and variety in repetitive tasks: Evidence from a japanese
bank. Management Science 58 (6), 1141–1159.
Staats, B. R., K. L. Milkman, and C. R. Fox (2012). The team scaling fallacy: Underestimating the declining
efficiency of larger teams. Organizational Behavior and Human Decision Processes 118 (2), 132–142.
Staats, B. R. and D. M. Upton (2011). Lean knowledge work. Harvard Business Review 89 (10), 100–110.
Sykes, J. S. (1970). Simplified analysis of an alternating-priority queuing model with setup times. Operations
Research 18 (6), 1182–1192.
Thompson, L. L. (2000). Making the Team: A Guide for Manager (5 ed.). Prentice Hall.
Tipping, M. D., V. E. Forth, K. J. O’Leary, D. M. Malkenson, D. B. Magill, K. Englert, and M. V. Williams
(2010). Where did the day go? A time-motion study of hospitalists. Journal of Hospital Medicine 5 (6),
323–328.
Tucker, A. L. and S. J. Spear (2006). Operational failures and interruptions in hospital nursing. Health
services research 41 (3p1), 643–662.
Uddin, S., L. Hossain, J. Hamra, and A. Alam (2013). A study of physician collaborations through social
network and exponential random graph. BMC health services research 13 (1), 1.
Wayne, J. D., R. Tyagi, G. Reinhardt, D. Rooney, G. Makoul, S. Chopra, and D. A. DaRosa (2008). Simple
standardized patient handoff system that increases accuracy and completeness. Journal of Surgical
Education 65 (6), 476–485.
Westbrook, J. I., E. Coiera, W. T. Dunsmuir, B. M. Brown, N. Kelk, R. Paoloni, and C. Tran (2010). The
impact of interruptions on clinical task completion. Quality and Safety in Health Care 19 (4), 284–289.
Zwarenstein, M. and W. Bryant (2000). Interventions to promote collaboration between nurses and doctors.
Cochrane Database Syst Rev 2 (2), Online.
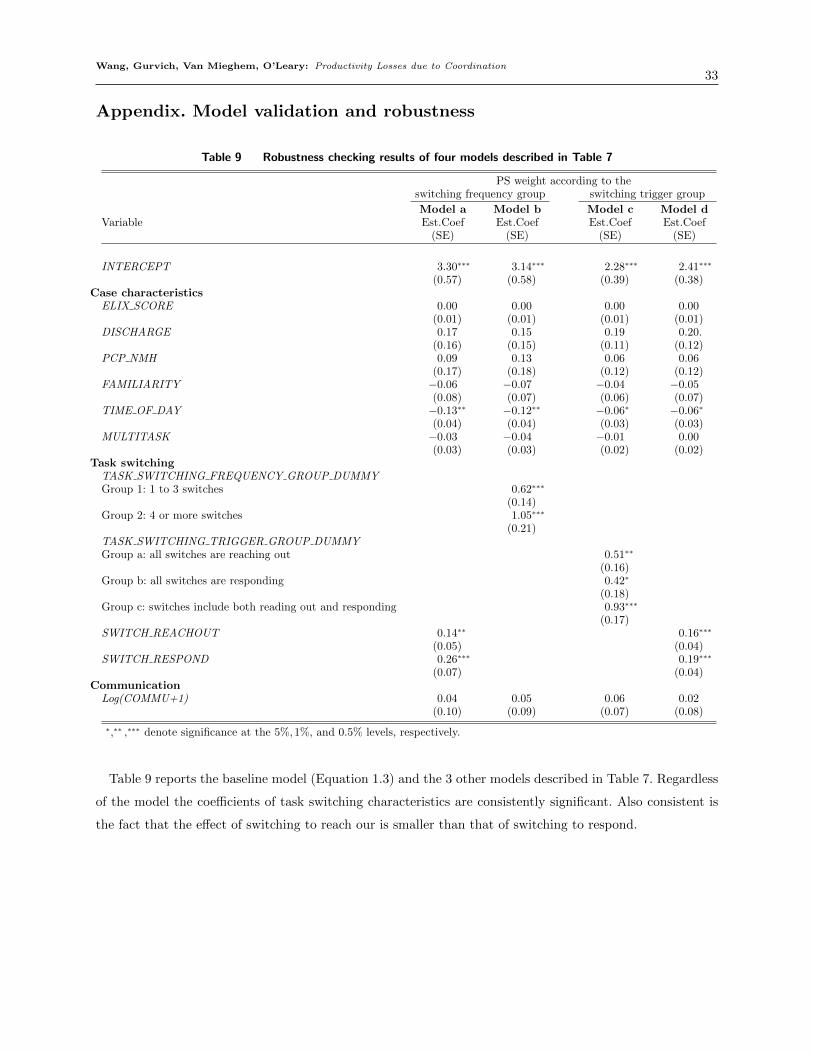
Wang, Gurvich, Van Mieghem, O’Leary: Productivity Losses due to Coordination33
Appendix. Model validation and robustness
Table 9 Robustness checking results of four models described in Table 7
PS weight according to theswitching frequency group switching trigger group
Model a Model b Model c Model dVariable Est.Coef Est.Coef Est.Coef Est.Coef
(SE) (SE) (SE) (SE)
INTERCEPT 3.30∗∗∗ 3.14∗∗∗ 2.28∗∗∗ 2.41∗∗∗
(0.57) (0.58) (0.39) (0.38)Case characteristics
ELIX SCORE 0.00 0.00 0.00 0.00(0.01) (0.01) (0.01) (0.01)
DISCHARGE 0.17 0.15 0.19 0.20.(0.16) (0.15) (0.11) (0.12)
PCP NMH 0.09 0.13 0.06 0.06(0.17) (0.18) (0.12) (0.12)
FAMILIARITY −0.06 −0.07 −0.04 −0.05(0.08) (0.07) (0.06) (0.07)
TIME OF DAY −0.13∗∗ −0.12∗∗ −0.06∗ −0.06∗
(0.04) (0.04) (0.03) (0.03)MULTITASK −0.03 −0.04 −0.01 0.00
(0.03) (0.03) (0.02) (0.02)Task switching
TASK SWITCHING FREQUENCY GROUP DUMMYGroup 1: 1 to 3 switches 0.62∗∗∗
(0.14)Group 2: 4 or more switches 1.05∗∗∗
(0.21)TASK SWITCHING TRIGGER GROUP DUMMYGroup a: all switches are reaching out 0.51∗∗
(0.16)Group b: all switches are responding 0.42∗
(0.18)Group c: switches include both reading out and responding 0.93∗∗∗
(0.17)SWITCH REACHOUT 0.14∗∗ 0.16∗∗∗
(0.05) (0.04)SWITCH RESPOND 0.26∗∗∗ 0.19∗∗∗
(0.07) (0.04)Communication
Log(COMMU+1) 0.04 0.05 0.06 0.02(0.10) (0.09) (0.07) (0.08)
∗,∗∗ ,∗∗∗ denote significance at the 5%,1%, and 0.5% levels, respectively.
Table 9 reports the baseline model (Equation 1.3) and the 3 other models described in Table 7. Regardless
of the model the coefficients of task switching characteristics are consistently significant. Also consistent is
the fact that the effect of switching to reach our is smaller than that of switching to respond.