Embed Size (px)
Citation preview
Productivity-led Growth for Korea
McKinsey Seoul Office
McKinsey Global Institute
with assistance from our Advisory Committee Bob Solow, Chairman Dick Cooper Sangyong Park
Seoul, Washington March 1998 This report is copyrighted by McKinsey & Company, Inc.; no part of it may be circulated, quoted, or reproduced for distribution without prior written approval from McKinsey & Company, Inc..

970221du3sw_262423_005-F13SW
2
1
Preface
This report is an end product of a year-long collaborative project by McKinsey/Seoul and the McKinsey Global Institute on the economic performance of Korea.
McKinsey undertook this project because of the interest expressed by the Korean business and academic communities and by our practice in Korea regarding the growth prospects for the country in the medium and long term. We hoped that McKinsey’s extensive work with companies and industries in Korea and other parts of the global economy might provide additional insight into ways to improve economic performance.
The current financial turmoil in Korea started when our project was three quarters completed. We have responded by using our analysis to relate Korea’s vulnerability to a crisis to fundamental causal factors in Korea’s economic performance. We have not developed short term crisis management solutions, which, understandably, are currently receiving highest priority. The crisis has served, however, to raise more strongly questions about Korea’s growth prospects in the medium and long term.
This project builds upon the previous work of the McKinsey Global Institute in assessing economic performance among the leading economies of the world. Our earlier reports addressed separately labor and capital productivity and employment,1 the fundamental components of economic performance. Later, we combined these components to address overall performance at the country level for Sweden, Australia, France, Germany, and the Netherlands.2 In all countries, economic performance is compared with the US, and in some countries with Japan. This study continues our efforts to assess economic performance at the country level. Together with a parallel study on Brazil, this project extends our research to the emerging economies for the first time.
As before, the core of our work is conducting industry case studies to measure differences in productivity, output and employment performance across countries and to determine the reasons for the differences. This work provides the basis from which we derive our estimates of productivity and output growth rate potential. These estimates reflect our first attempt to estimate potential aggregate growth rates based on micro analysis. In this report the performance of Korea is compared primarily with the United States and Japan, although comparison with the Netherlands in made in the case of retail banking.
This report consists of 4 chapters and an executive summary. Chapter 1 describes our objectives and approach for the project. Chapter 2 describes the analysis and conclusions at the aggregate level. This chapter provides our conclusions about what can be learned from aggregate level analysis and what questions need to be addressed at the industry case study level. Chapter 3 includes our eight industry case studies: steel, automotive, semiconductors, processed food, telecommunications, retail banking, general merchandise retailing, and residential construction. Each case gives the results of our productivity calculations and discusses the reasons for the differences we found between Korea and benchmark countries. Each case is preceded by a one-page summary of the results of the case. Readers more interested in our general results and less interested in the specifics of some or all of the cases may choose to read the summary rather than the entire case. The last chapter 4 presents the synthesis of our findings including our overall conclusions about productivity and future growth prospects for Korea.
1 Service Sector Productivity, McKinsey Global Institute, Washington, D.C., October 1992; Manufacturing Productivity, McKinsey Global Institute, Washington, D.C., October 1993; Employment Performance, McKinsey Global Institute, Washington, D.C., November 1994; Capital Productivity, McKinsey Global Institute, Washington, D.C., June 1996.
2 Sweden’s Economic Performance, McKinsey Global Institute, Stockholm, September 1995; Australia’s Economic Performance, McKinsey/Australia and McKinsey Global Institute, Sydney, November 1995; Removing Barriers to Growth in France and Germany, McKinsey Global Institute, March 1997; Boosting Dutch Economic Performance, McKinsey Global Institute and Max Geldens Foundation for Societal Renewal, September 1997.
2
A core group of 10 McKinsey consultants from the Seoul office and 5 consultants from the McKinsey Global Institute participated on the working team for this project at various times. The Seoul consultants were: Taejoon Chin, Dongchun Choi, Sungmi Chung, Jinwook Jung, Dongil Kim, Hyunsoo Kim, Chan Joong Park, Sehun Park, Jaesoo Shim, and Sanghun Yeo. The Global Institute consultants were: Andrew Gomperts, Vincent Palmade, Alex Schmitz, Michael Warren, and Eric Zitzewitz. In addition, Jaana Remes, a McKinsey Global Institute economics research specialist, participated in the synthesis. Administrative support was provided by Gretchen Bossert, Ronni Brownlee, Kyungye Kim, and Leslie Hill Jenkins. Yongsung Kim, Seungjoo Lee, and Victoria Nam were responsible for day-to-day management of the project, with Vincent Palmade leading the analytical work during the synthesis phase and Eric Zitzewitz leading the application of MGI research methodology to aggregate and case study analyses during the first half of the project. The project was conducted under the direction of Cuong Do (McKinsey/Seoul) and myself, with assistance from Martin Baily (McKinsey/MGI), Jim Bemowski (McKinsey/Seoul), and Robert Felton (McKinsey/Seoul).
We were fortunate to have an outside Advisory Committee for this project. The Advisory Committee was chaired by Bob Solow, MIT, and also included Richard Cooper, Harvard University, and Sangyong Park, Yonsei University. The working team had five all-day meetings with the Advisory Committee to review progress during the course of the project and benefited from many written comments and individual discussions. Ted Hall, Chairman of the McKinsey Global Institute Advisory Board, joined the Advisory Committee for three of these meetings. McKinsey is, of course, responsible for the conclusions in this report, and the individuals assisting us may not agree with all our specific conclusions. Moreover, our Advisory Committee and McKinsey emphasize that our calculations of structural growth potential for Korea over a ten year period are not estimates or predictions of what growth will actually be realized.
We are also grateful for the support of our Business and Government Advisory Committee, which provided valuable guidance in terms of project focus and impact. Participating members were Chongwon Ahn (SsangYong Corp.), Dae-Whan Chang (Maeil Business Newspaper), Suckrai Cho (Hyosung), Myungsik Chung (POSTECH Foundation), Yoondae Euh, (Korea Universtity), Duck Soo Han (Ministry of Trade, Industry and Energy), Hunjo Lee (LG Inwhawon), Young Ki Lee (Korean Development Institute), Kyuuck Lee (Korea Institute for Industrial Economics and Trade), Seungjoo Lee (Korea Development Institute), Yongsung Park (Doosan), Byungrak Song, (Seoul National University), Ja Song (Myungji University), Jung Uck Seo (SK Telecom), Soogil Young (Korea Institute for International Economic Policy), and Yoon Je Cho (Sogang University).
The undertaking of this project is part of the fulfillment of the McKinsey Global Institute's mission to help business and government leaders: (1) understand global economic developments, (2) improve the performance of their organizations, and (3) work for better national and international policies.
Throughout the conduct of this project we benefited from the unique worldwide perspective and knowledge of McKinsey consultants on the industries investigated in our case studies. This knowledge has been developed through client work and investment in understanding industry structure and behavior to support our work with clients. McKinsey sector leaders provided input to our case studies and reviewed our results.
We would also like to recognize the contributions of McKinsey consulting teams worldwide who provided us with invaluable information on the performance of all the industries we studied, while at the same time, preserving the confidentiality of information about specific McKinsey clients. McKinsey's research and information departments provided invaluable information and insight under very tight time constraints. Finally, we appreciate the warm welcome and useful information we received in our interviews with corporations, industry associations and government officials.
Bill Lewis Director of the McKinsey Global Institute March 1998
1
Executive Summary
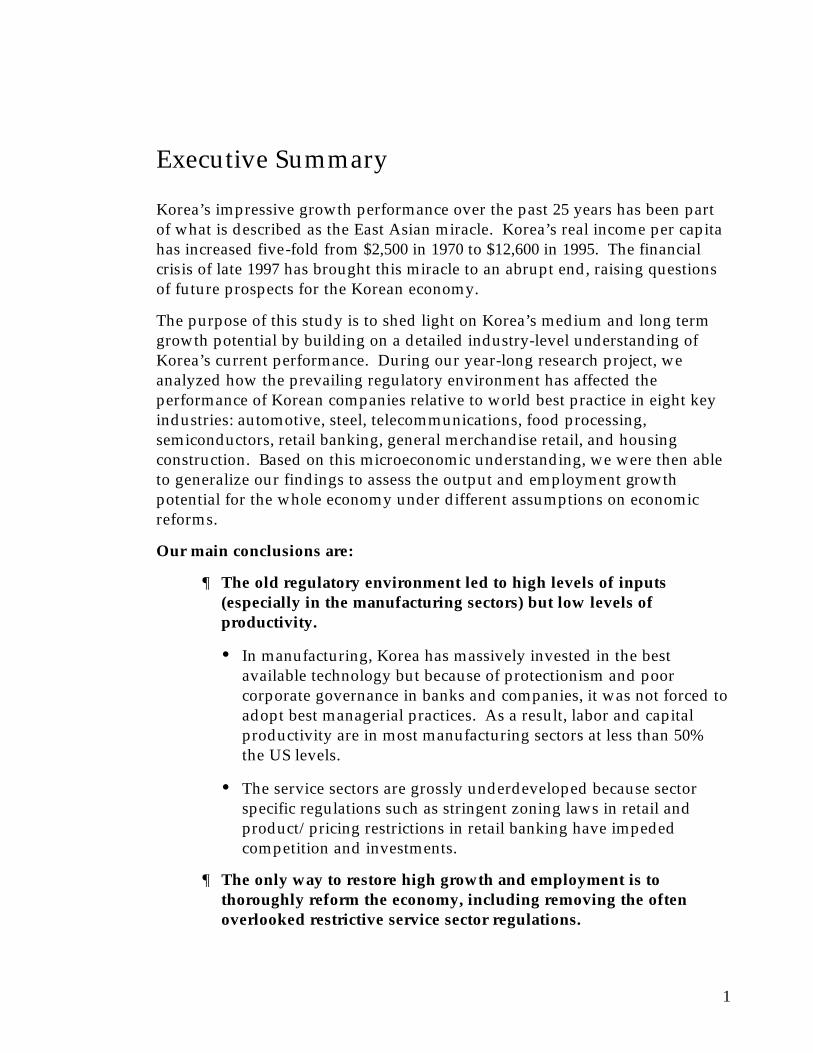
Korea’s impressive growth performance over the past 25 years has been part of what is described as the East Asian miracle. Korea’s real income per capita has increased five-fold from $2,500 in 1970 to $12,600 in 1995. The financial crisis of late 1997 has brought this miracle to an abrupt end, raising questions of future prospects for the Korean economy.
The purpose of this study is to shed light on Korea’s medium and long term growth potential by building on a detailed industry-level understanding of Korea’s current performance. During our year-long research project, we analyzed how the prevailing regulatory environment has affected the performance of Korean companies relative to world best practice in eight key industries: automotive, steel, telecommunications, food processing, semiconductors, retail banking, general merchandise retail, and housing construction. Based on this microeconomic understanding, we were then able to generalize our findings to assess the output and employment growth potential for the whole economy under different assumptions on economic reforms.
Our main conclusions are:
¶ The old regulatory environment led to high levels of inputs (especially in the manufacturing sectors) but low levels of productivity.
� In manufacturing, Korea has massively invested in the best available technology but because of protectionism and poor corporate governance in banks and companies, it was not forced to adopt best managerial practices. As a result, labor and capital productivity are in most manufacturing sectors at less than 50% the US levels.
� The service sectors are grossly underdeveloped because sector specific regulations such as stringent zoning laws in retail and product/pricing restrictions in retail banking have impeded competition and investments.
¶ The only way to restore high growth and employment is to thoroughly reform the economy, including removing the often overlooked restrictive service sector regulations.
2
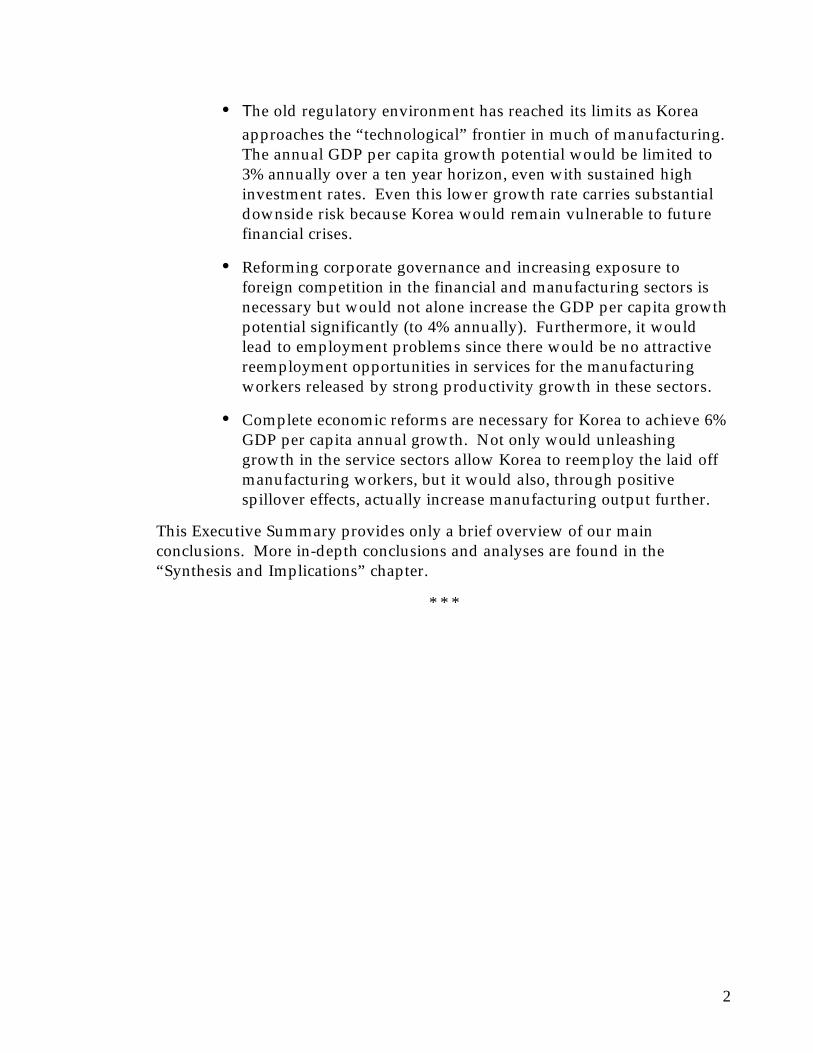
� The old regulatory environment has reached its limits as Korea approaches the “technological” frontier in much of manufacturing. The annual GDP per capita growth potential would be limited to 3% annually over a ten year horizon, even with sustained high investment rates. Even this lower growth rate carries substantial downside risk because Korea would remain vulnerable to future financial crises.
� Reforming corporate governance and increasing exposure to foreign competition in the financial and manufacturing sectors is necessary but would not alone increase the GDP per capita growth potential significantly (to 4% annually). Furthermore, it would lead to employment problems since there would be no attractive reemployment opportunities in services for the manufacturing workers released by strong productivity growth in these sectors.
� Complete economic reforms are necessary for Korea to achieve 6% GDP per capita annual growth. Not only would unleashing growth in the service sectors allow Korea to reemploy the laid off manufacturing workers, but it would also, through positive spillover effects, actually increase manufacturing output further.
This Executive Summary provides only a brief overview of our main conclusions. More in-depth conclusions and analyses are found in the “Synthesis and Implications” chapter.
* * *
3
REFORM OF SERVICE SECTOR REGULATIONS NECESSARY TO RETURN TO 6% GDP PER CAPITA GROWTH
Past growth has been input driven and focused on manufacturing
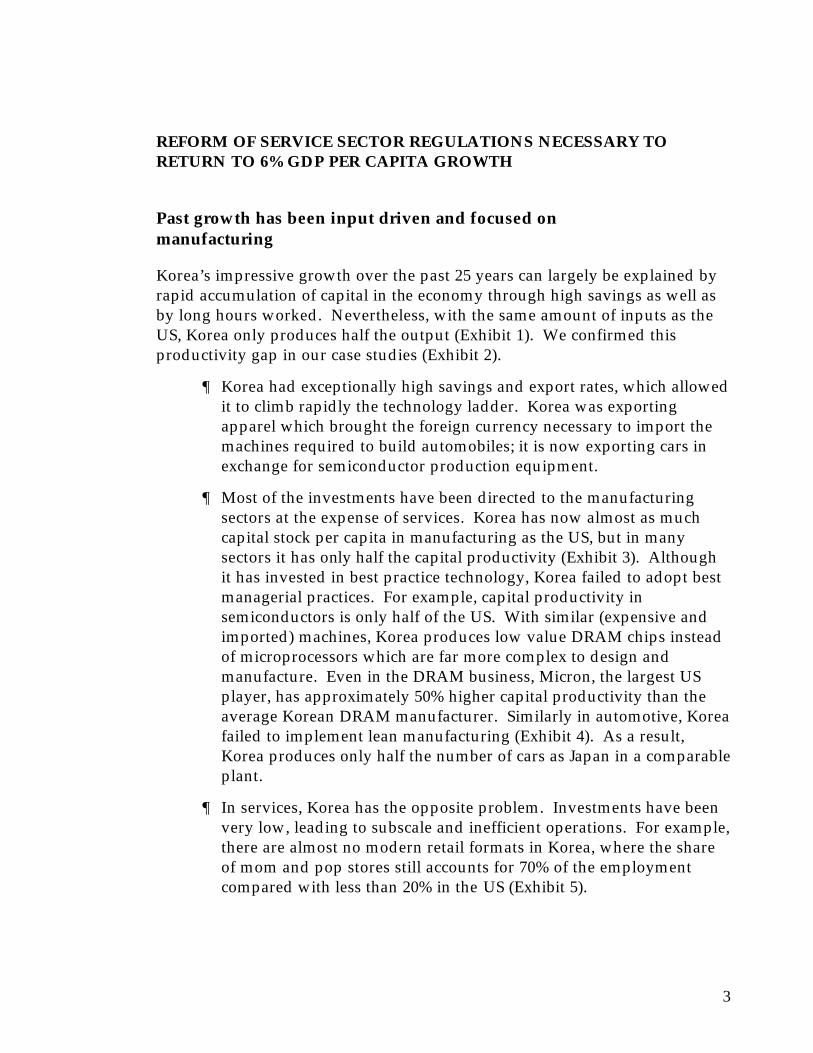
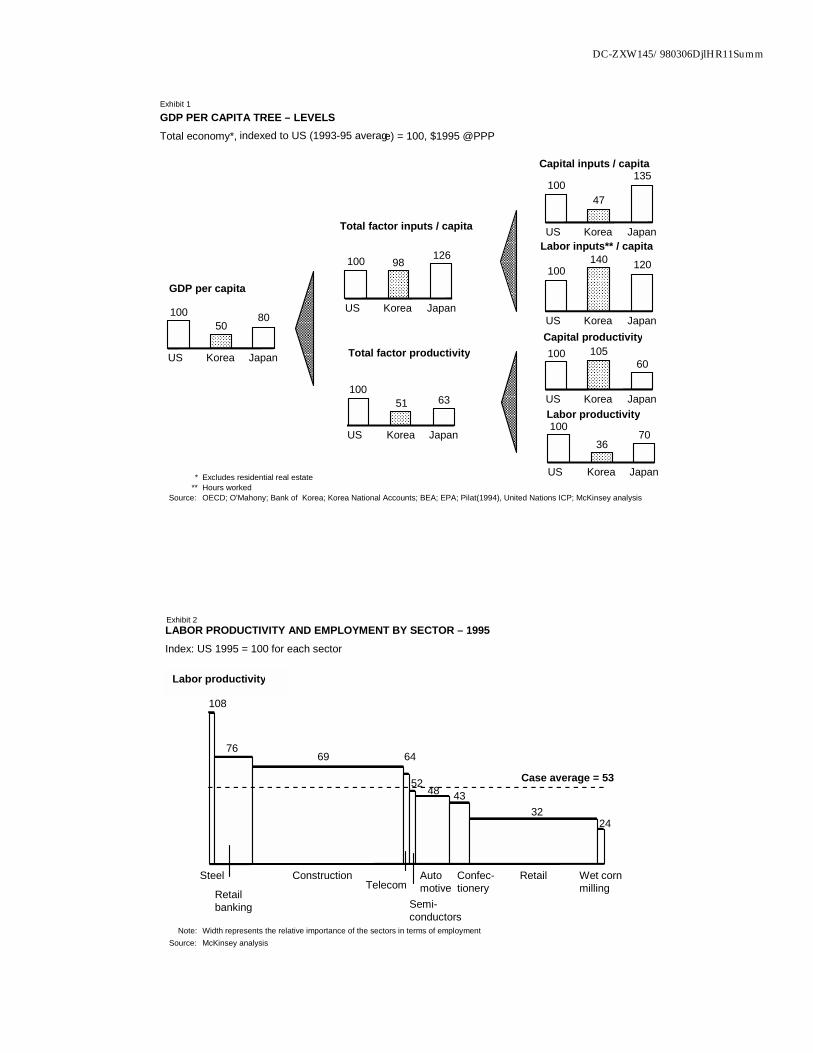
Korea’s impressive growth over the past 25 years can largely be explained by rapid accumulation of capital in the economy through high savings as well as by long hours worked. Nevertheless, with the same amount of inputs as the US, Korea only produces half the output (Exhibit 1). We confirmed this productivity gap in our case studies (Exhibit 2).
¶ Korea had exceptionally high savings and export rates, which allowed it to climb rapidly the technology ladder. Korea was exporting apparel which brought the foreign currency necessary to import the machines required to build automobiles; it is now exporting cars in exchange for semiconductor production equipment.
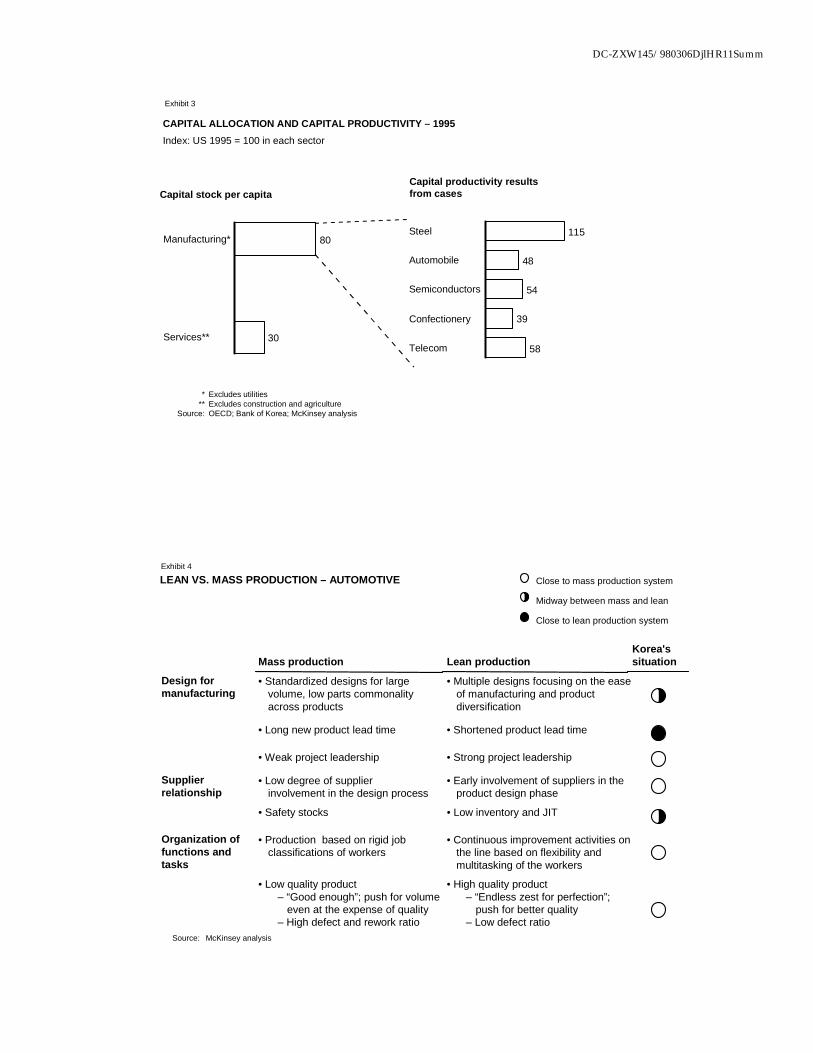
¶ Most of the investments have been directed to the manufacturing sectors at the expense of services. Korea has now almost as much capital stock per capita in manufacturing as the US, but in many sectors it has only half the capital productivity (Exhibit 3). Although it has invested in best practice technology, Korea failed to adopt best managerial practices. For example, capital productivity in semiconductors is only half of the US. With similar (expensive and imported) machines, Korea produces low value DRAM chips instead of microprocessors which are far more complex to design and manufacture. Even in the DRAM business, Micron, the largest US player, has approximately 50% higher capital productivity than the average Korean DRAM manufacturer. Similarly in automotive, Korea failed to implement lean manufacturing (Exhibit 4). As a result, Korea produces only half the number of cars as Japan in a comparable plant.
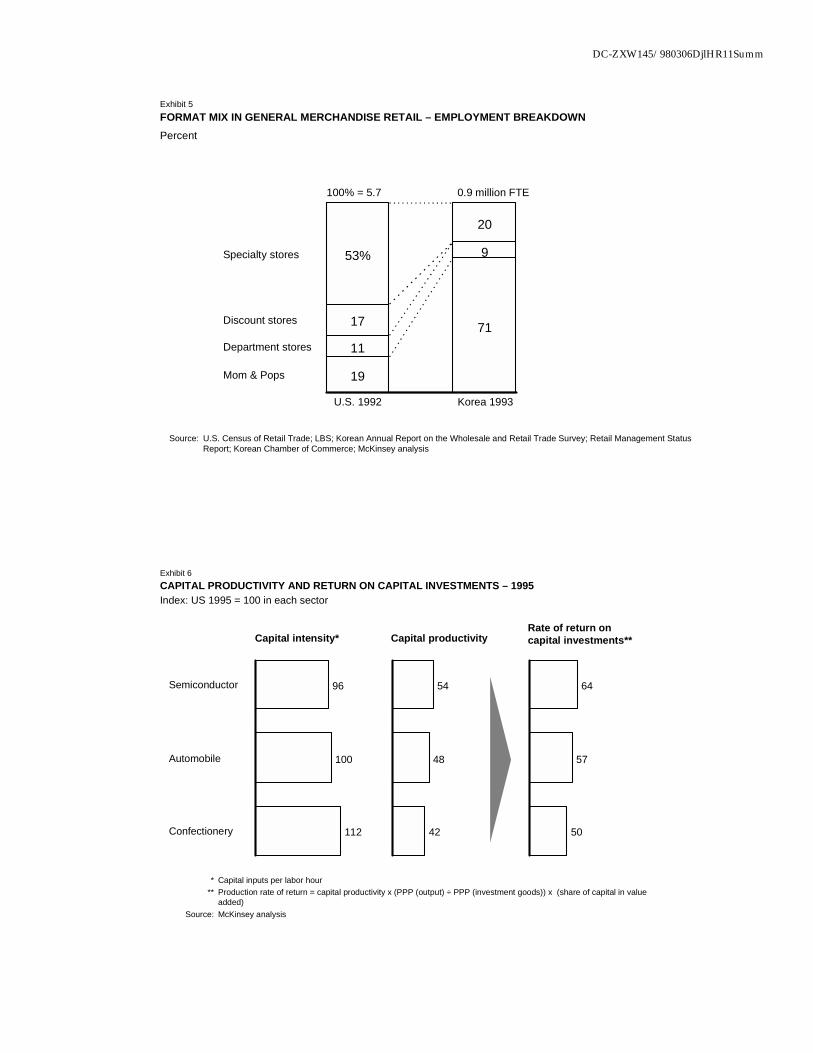
¶ In services, Korea has the opposite problem. Investments have been very low, leading to subscale and inefficient operations. For example, there are almost no modern retail formats in Korea, where the share of mom and pop stores still accounts for 70% of the employment compared with less than 20% in the US (Exhibit 5).
4
The old growth path has reached its limits
Maintaining the past regulatory environment would slow down the recovery from the current crisis and would continue to make Korea vulnerable to another financial crisis. And even under favorable stable financial conditions, it would cause GDP per capita growth to drop to 3% annually for three reasons:
¶ First, future growth can no longer be fueled by the increase in working age population relative to the total population and the shift of people out of agriculture. These two effects accounted for 2% of the 7% annual GDP per capita growth in the last ten years.
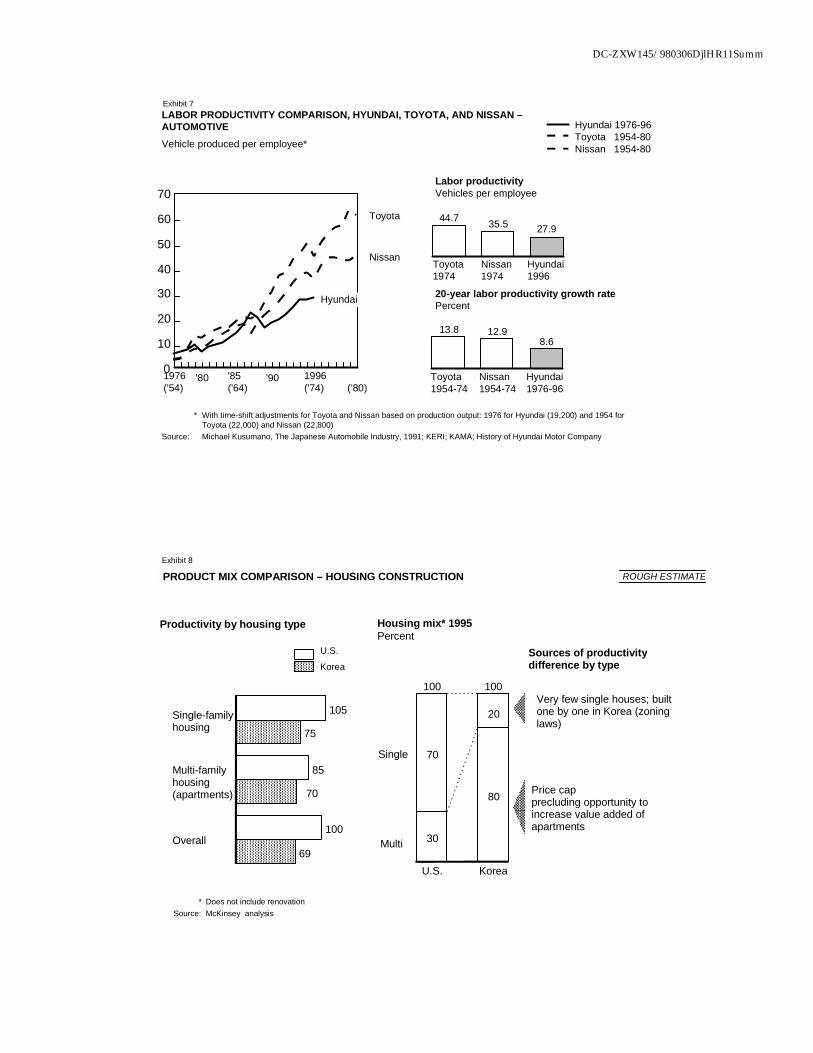
¶ Second, growth through new investments in manufacturing would drop. Failure to improve capital productivity is forcing Korea into rapidly decreasing marginal returns on its investments in manufacturing since it is now near the technological frontier (Exhibit 6). Korea must dramatically improve its capital productivity by adopting best managerial practices. Otherwise Korea will remain vulnerable to future financial crises, which would put even the 3% growth at risk. Improving capital productivity in manufacturing will not happen quickly as long as Korea protects itself from the pressure of imports and foreign direct investors, and, because of poor corporate governance in banks and companies, continues financing unprofitable businesses. In the past, it was relatively easy for Korea to achieve a comparative advantage in “simple” sectors such as apparel due to low labor costs. In integrated steel, which is already more complex, Korea achieved best practice because the sector operated under price pressure on steel imposed by the government and because local companies benefited from the help of the best practice Japanese. In the even more complex sectors of automotive and semiconductors, Korea is struggling to learn by itself and catch up with its ever advancing competitors; Korea’s automotive productivity growth is lower than Japan’s at the same stage of development (Exhibit 7).
¶ Finally, the growth in the service sectors will remain relatively slow as long as they remain clamped by very restrictive regulations that limit both investments and productivity improvements. We found major (but overlooked) barriers to growth in each of the four service sectors we studied.
� Strict zoning laws and excessive bureaucratic practices have impeded the development of large, more productive retail formats
5
in the suburbs. It took Carrefour four years to open four stores in Korea.
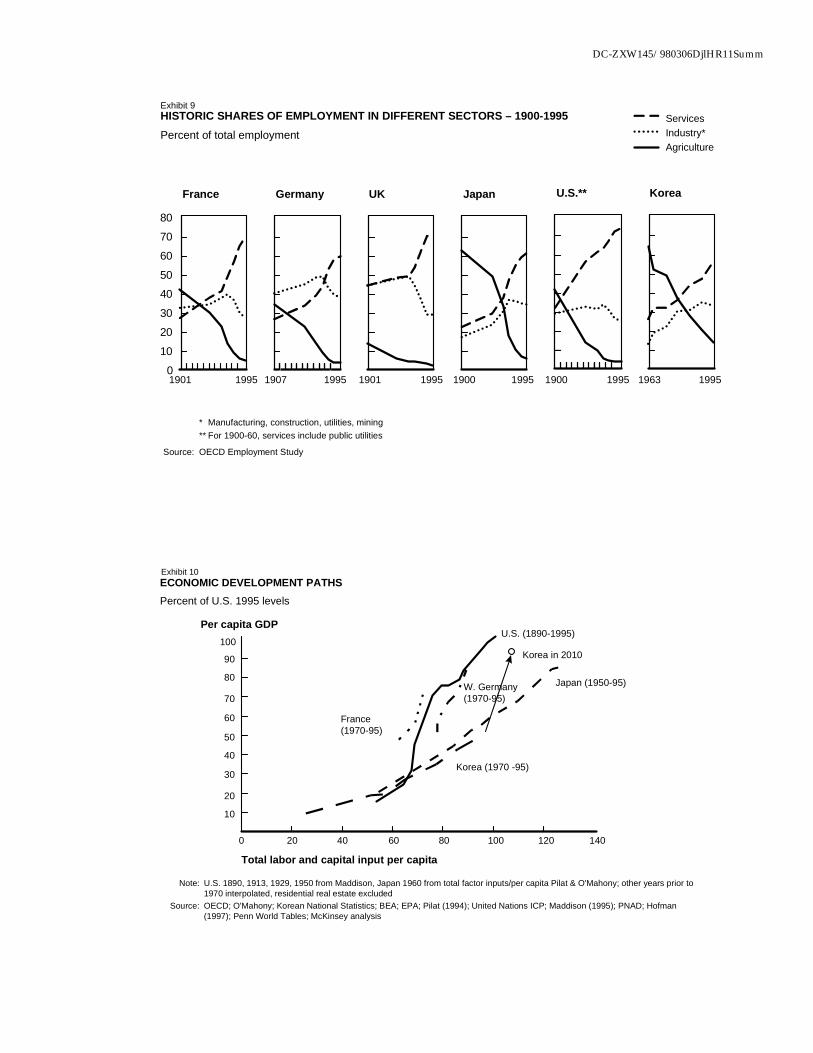
� Strict zoning laws and housing price ceilings have prevented housing construction from reaching its full productivity potential. Koreans are forced to live in standardized apartments instead of single family homes or customized condominiums, which in large housing programs are the most efficient way to provide housing. These programs account for 70% of new housing construction in the US and 60% in the land-starved Netherlands, while they are nonexistent in Korea (Exhibit 8).
� In the case of retail banking, restrictions on products and pricing limit competition between existing banks and lead to high cost and low value products to customers. Bank branches are underutilized and overstaffed, and high value investment services are not available to customers.
� Pricing regulations in telecommunications have limited both the growth in call volume and the variety of services provided. Allowing local call pricing at near-zero marginal cost would increase network utilization while also helping improve service quality in many other industries.
Reforms of the financial and manufacturing sectors are steps in the right direction
As it is currently being discussed, a profound reform of supervision and governance in Korea’s financial sector, together with lowering the barriers to imports and foreign direct investments in the economy, can reduce the risks of a future financial crisis in the medium and long term. This reduction would come mainly because fair competition with best practice together with more careful bankers and demanding shareholders would force Korean manufacturers to improve their return on investments (i.e., capital productivity). In addition, higher productivity growth in the manufacturing sectors should enable Korea’s GDP per capita to grow at 4% per annum on average, somewhat higher than without any reforms. In effect, higher productivity in manufacturing and lower import barriers would allow domestic consumption to increase due to lower prices. Opening the domestic markets would not lead to an increase in the trade deficit or external debt as higher capital productivity would reduce the need to import machines; Korea would be able to import more cheap cars because it will import less expensive semiconductor equipment.
6
Complete reform including service sectors essential to achieve high growth and employment
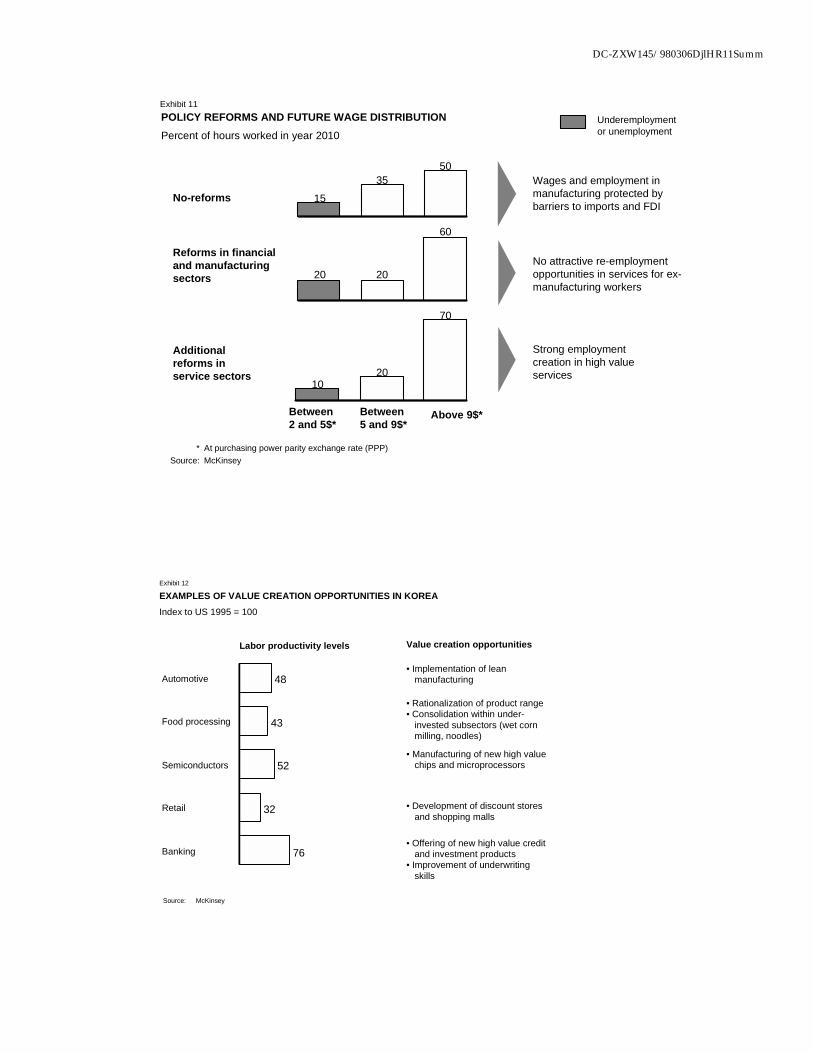
The experience of developed economies shows that service sector performance becomes increasingly important for output and employment growth as income rises (Exhibit 9). Not only would deregulating services allow Korea to employ the excess labor coming out of manufacturing, but positive spillover effects would help increase manufacturing output further. As a result, Korea could grow at 6% per capita a year, but for very different reasons than in the past.
¶ Relaxing zoning laws in retail would allow for the construction of large modern retail formats, which would provide high employment and service levels if enough land is provided. A shopping mall requires much more land than a discount store. Yet, the total land required would amount to only an additional 4% of the existing commercial land or 0.1% of greenbelt land. This increase would not pose a threat to the environment. In addition, the construction of high service malls would create new construction jobs while the mall is being built. Similarly, removing the restrictions on investment products in banking would lead to the creation of high value service jobs in order to design, market and sell new products.
¶ There are no tradeoffs between manufacturing and services; on the contrary. The rapid development of new high value services would benefit the manufacturing sectors through spillover effects. Three examples:
� Independent best practice retailers would put additional pressure on manufacturers to reduce prices, leading to higher productivity and increased production. Furthermore, high service modern retailers would stimulate demand through more targeted marketing.
� Higher competitive pressure in retail and retail banking would force firms to invest in information technology (services are the largest users of information technology), thus creating additional high value jobs among IT providers.
� There would be more demand for manufactured goods from the people who take the new high value jobs in services.
Deregulating services in addition to lowering barriers to imports, allowing FDI and improving corporate governance would be the key to restoring strong growth in Korea. We have estimated that with an achievable (based on Korean standards) 30% of GDP investment rate, Korea could grow at 6% per capita per annum, allowing it to reach 90% of the current US GDP per capita by the
7
year 2010. This new productivity led growth path would be much faster and more sustainable than the current “Japanese” input driven one (Exhibit 10).
INCOMPLETE REFORM WOULD CAUSE SOCIAL PROBLEMS
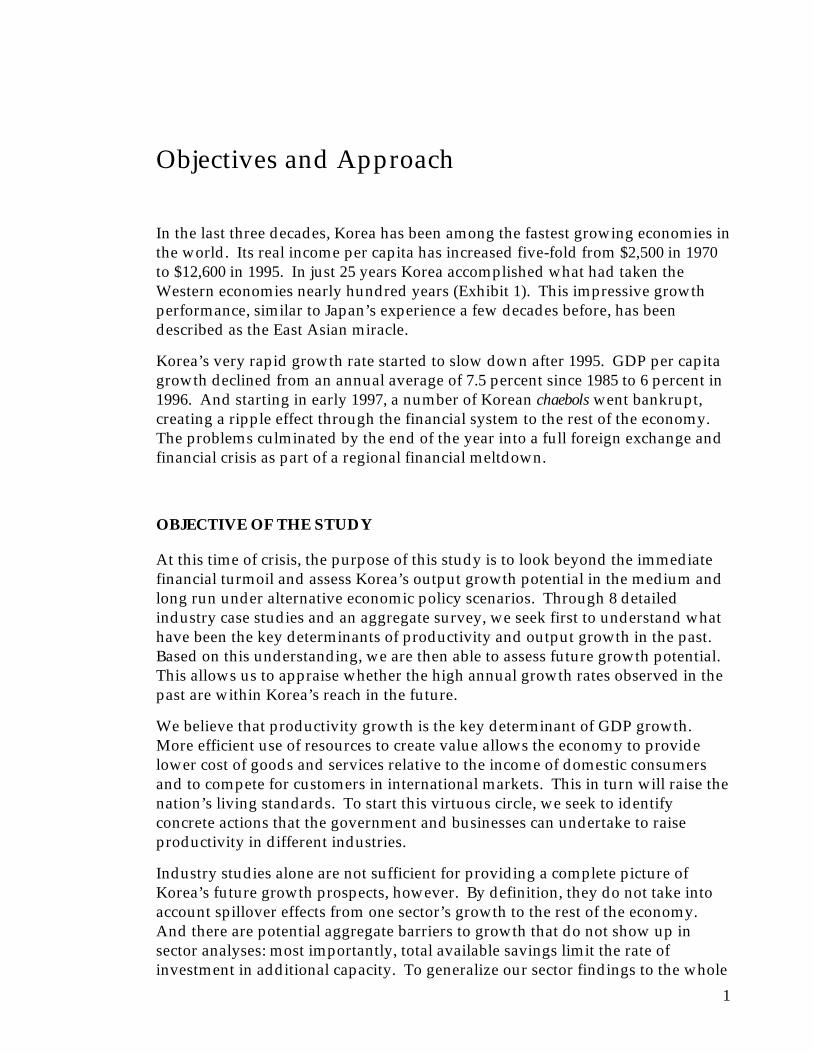
As we have seen above, reform of the financial and manufacturing sectors is necessary to remove Korea’s vulnerability to future financial crises. However, an incomplete reform gives significantly lower growth. Moreover, incomplete reform would also create serious employment problems. The policy reforms directed at the manufacturing sector alone (e.g., removal of import barriers and reform of the financial sector) would cause employment to fall in these sectors since productivity would increase faster than output, a trend observed in all the developed economies. Service sector job creation would be limited because of restrictive regulations impeding the growth of new high value services. Thus laid off manufacturing workers and young people joining the labor force would be forced into low value service jobs or, if the minimum wage is raised, into unemployment (Exhibit 11). We estimate that if Korea imposes a minimum wage and unemployment benefits at the current US levels, partial economic reforms could lead to a 12 % unemployment rate. In contrast, a complete reform would lead to rapid quality job growth in services and reduce the expected unemployment rate to 5 %, even with the US minimum wage level.
SUMMARY IMPLICATIONS TO POLICY MAKERS AND COMPANIES
While implementation of a comprehensive policy reform requires both time and resources, we found no economic or social reasons to delay across-the-board reforms. Korea should not fear the short term adjustment process following simultaneous policy reforms in all sectors of the economy. Quite to the contrary, a completely reformed economy would attract foreign investments and create jobs immediately, when they are most needed.
In effect, we found immediate and significant value creation opportunities in almost all the sectors we studied. The main opportunities in manufacturing lie in improving the utilization of the existing state-of-the-art machinery, while the service sectors are relatively underdeveloped and offer great potential for companies willing to develop new markets (Exhibit 12). Korean companies that want to benefit from these opportunities will need to immediately and proactively reform their corporate governance, refocus their business portfolio and seek global best practice companies as strategic partners as a means to quickly learn and adopt best managerial practices.
* * *
8
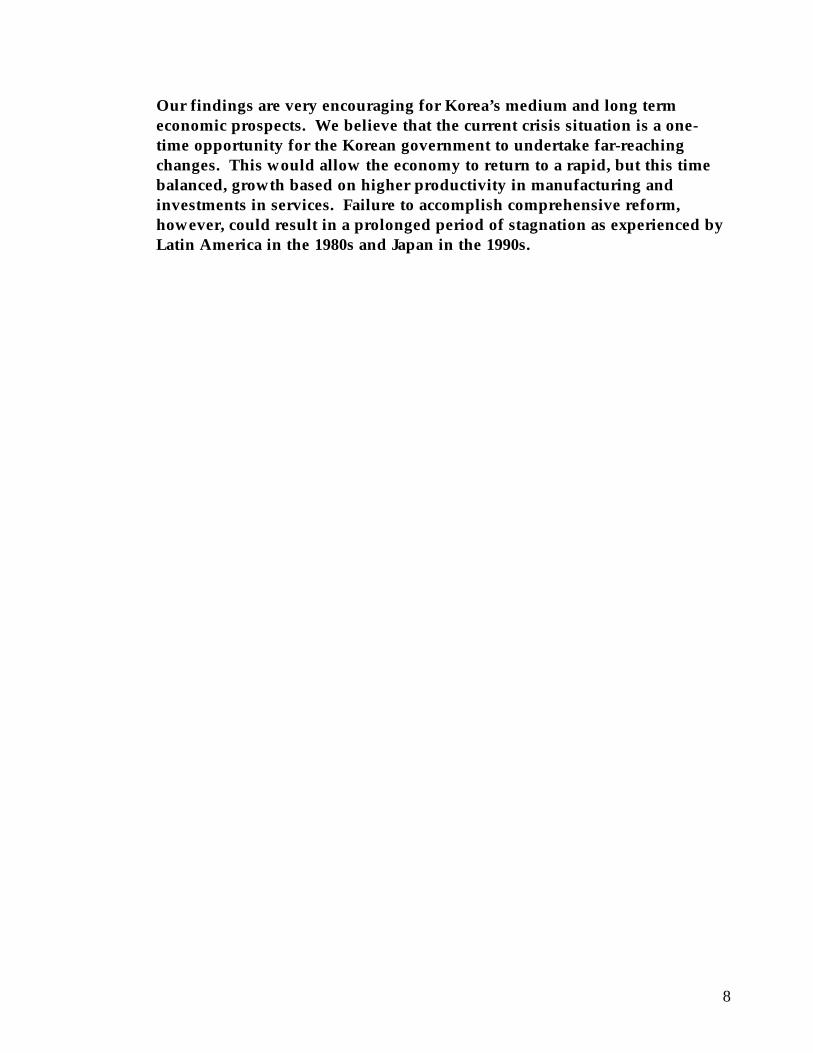
Our findings are very encouraging for Korea’s medium and long term economic prospects. We believe that the current crisis situation is a one-time opportunity for the Korean government to undertake far-reaching changes. This would allow the economy to return to a rapid, but this time balanced, growth based on higher productivity in manufacturing and investments in services. Failure to accomplish comprehensive reform, however, could result in a prolonged period of stagnation as experienced by Latin America in the 1980s and Japan in the 1990s.
DC-ZXW145/980306DjlHR11Summ
GDP PER CAPITA TREE – LEVELSTotal economy*, indexed to US (1993-95 average) = 100, $1995 @PPP
* Excludes residential real estate** Hours worked
Source: OECD; O'Mahony; Bank of Korea; Korea National Accounts; BEA; EPA; Pilat(1994), United Nations ICP; McKinsey analysis
Capital inputs / capita
10047
135
US Korea JapanLabor inputs** / capita
100140 120
US Korea Japan
Total factor inputs / capita
100 98126
US Korea Japan
Total factor productivity
10051 63
US Korea Japan
GDP per capita
10050
80
US Korea Japan
Exhibit 1
Capital productivity100 105
60
US Korea JapanLabor productivity100
3670
US Korea Japan
Steel
Retailbanking
ConstructionTelecom
Semi-conductors
Automotive
Confec-tionery
Retail Wet cornmilling
2432
434852
646976
108
Exhibit 2
Case average = 53
LABOR PRODUCTIVITY AND EMPLOYMENT BY SECTOR – 1995Index: US 1995 = 100 for each sector
Note: Width represents the relative importance of the sectors in terms of employmentSource: McKinsey analysis
Labor productivity
DC-ZXW145/980306DjlHR11Summ
Exhibit 3
CAPITAL ALLOCATION AND CAPITAL PRODUCTIVITY – 1995Index: US 1995 = 100 in each sector
80
30
Manufacturing*
Services**
Capital stock per capitaCapital productivity resultsfrom cases
115
48
54
39
58
Steel
Automobile
Semiconductors
Confectionery
Telecom
* Excludes utilities** Excludes construction and agriculture
Source: OECD; Bank of Korea; McKinsey analysis
Close to mass production system
Midway between mass and lean
Close to lean production system
Mass production Lean productionKorea'ssituation
Design formanufacturing
• Standardized designs for largevolume, low parts commonalityacross products
• Multiple designs focusing on the easeof manufacturing and productdiversification
• Long new product lead time • Shortened product lead time
• Weak project leadership • Strong project leadership
Supplierrelationship
• Low degree of supplierinvolvement in the design process
• Early involvement of suppliers in theproduct design phase
• Safety stocks • Low inventory and JIT
Organization offunctions andtasks
• Production based on rigid jobclassifications of workers
• Continuous improvement activities onthe line based on flexibility andmultitasking of the workers
• Low quality product– “Good enough”; push for volume
even at the expense of quality– High defect and rework ratio
• High quality product– “Endless zest for perfection”;
push for better quality– Low defect ratio
LEAN VS. MASS PRODUCTION – AUTOMOTIVE
Source: McKinsey analysis
Exhibit 4
DC-ZXW145/980306DjlHR11Summ
Specialty stores 53%
20
Discount stores 17
Department stores 11
9
Mom & Pops 19
71
U.S. 1992 Korea 1993
FORMAT MIX IN GENERAL MERCHANDISE RETAIL – EMPLOYMENT BREAKDOWNPercent
Source: U.S. Census of Retail Trade; LBS; Korean Annual Report on the Wholesale and Retail Trade Survey; Retail Management StatusReport; Korean Chamber of Commerce; McKinsey analysis
100% = 5.7 0.9 million FTE
Exhibit 5
Exhibit 6CAPITAL PRODUCTIVITY AND RETURN ON CAPITAL INVESTMENTS – 1995Index: US 1995 = 100 in each sector
* Capital inputs per labor hour** Production rate of return = capital productivity x (PPP (output) ÷ PPP (investment goods)) x (share of capital in value
added)Source: McKinsey analysis
Capital intensity*
96
100
112
Semiconductor
Automobile
Confectionery
Capital productivity
54
48
42
Rate of return on capital investments**
64
57
50
DC-ZXW145/980306DjlHR11Summ
LABOR PRODUCTIVITY COMPARISON, HYUNDAI, TOYOTA, AND NISSAN –AUTOMOTIVEVehicle produced per employee*
0
10
20
30
40
50
60
70
Nissan
Toyota
Hyundai
1976('54)
'80 '85 ('64)
'90 1996('74) ('80)
* With time-shift adjustments for Toyota and Nissan based on production output: 1976 for Hyundai (19,200) and 1954 forToyota (22,000) and Nissan (22,800)
Source: Michael Kusumano, The Japanese Automobile Industry, 1991; KERI; KAMA; History of Hyundai Motor Company
Hyundai 1976-96Toyota 1954-80Nissan 1954-80
Labor productivityVehicles per employee
44.7 35.5 27.9
Toyota 1974
Nissan 1974
Hyundai 1996
13.8 12.98.6
Toyota 1954-74
Nissan 1954-74
Hyundai 1976-96
20-year labor productivity growth ratePercent
Exhibit 7
100 100
70
20
30
80
U.S. Korea
* Does not include renovationSource: McKinsey analysis
75
70
69
105
85
100
Single-familyhousing
Multi-familyhousing(apartments)
Overall
Productivity by housing type
U.S.
Korea
Housing mix* 1995Percent
Sources of productivitydifference by type
Very few single houses; builtone by one in Korea (zoninglaws)
Price capprecluding opportunity toincrease value added ofapartments
Single
Multi
Exhibit 8
ROUGH ESTIMATEPRODUCT MIX COMPARISON – HOUSING CONSTRUCTION
DC-ZXW145/980306DjlHR11Summ
France
0
10
2030
4050
60
7080
Germany UK Japan U.S.** Korea
* Manufacturing, construction, utilities, mining** For 1900-60, services include public utilities
Source: OECD Employment Study
ServicesIndustry*Agriculture
HISTORIC SHARES OF EMPLOYMENT IN DIFFERENT SECTORS – 1900-1995Percent of total employment
1901 1995 1907 1995 1901 1995 1900 1995
Exhibit 9
1900 1995 1963 1995
ECONOMIC DEVELOPMENT PATHSPercent of U.S. 1995 levels
0 20 40 60 80 100 120 140
Per capita GDP
France(1970-95)
Korea (1970 -95)
U.S. (1890-1995)
Japan (1950-95)
100
90
80
70
60
50
40
30
20
10
Total labor and capital input per capita
Note: U.S. 1890, 1913, 1929, 1950 from Maddison, Japan 1960 from total factor inputs/per capita Pilat & O'Mahony; other years prior to1970 interpolated, residential real estate excluded
Source: OECD; O'Mahony; Korean National Statistics; BEA; EPA; Pilat (1994); United Nations ICP; Maddison (1995); PNAD; Hofman(1997); Penn World Tables; McKinsey analysis
Exhibit 10
Korea in 2010
W. Germany(1970-95)
DC-ZXW145/980306DjlHR11Summ
POLICY REFORMS AND FUTURE WAGE DISTRIBUTIONPercent of hours worked in year 2010
* At purchasing power parity exchange rate (PPP)Source: McKinsey
No-reforms
Reforms in financialand manufacturingsectors
Additionalreforms inservice sectors
Underemploymentor unemployment
Wages and employment inmanufacturing protected bybarriers to imports and FDI
No attractive re-employmentopportunities in services for ex-manufacturing workers
Strong employmentcreation in high valueservices
Exhibit 11
1535
50
20 20
60
1020
70
Between2 and 5$*
Between5 and 9$*
Above 9$*
EXAMPLES OF VALUE CREATION OPPORTUNITIES IN KOREAIndex to US 1995 = 100
Labor productivity levels
48
43
52
32
76
Automotive
Food processing
Semiconductors
Retail
Banking
Source: McKinsey
Value creation opportunities
• Implementation of leanmanufacturing
• Rationalization of product range• Consolidation within under-
invested subsectors (wet cornmilling, noodles)
• Manufacturing of new high valuechips and microprocessors
• Development of discount storesand shopping malls
• Offering of new high value creditand investment products
• Improvement of underwritingskills
Exhibit 12
1
Objectives and Approach
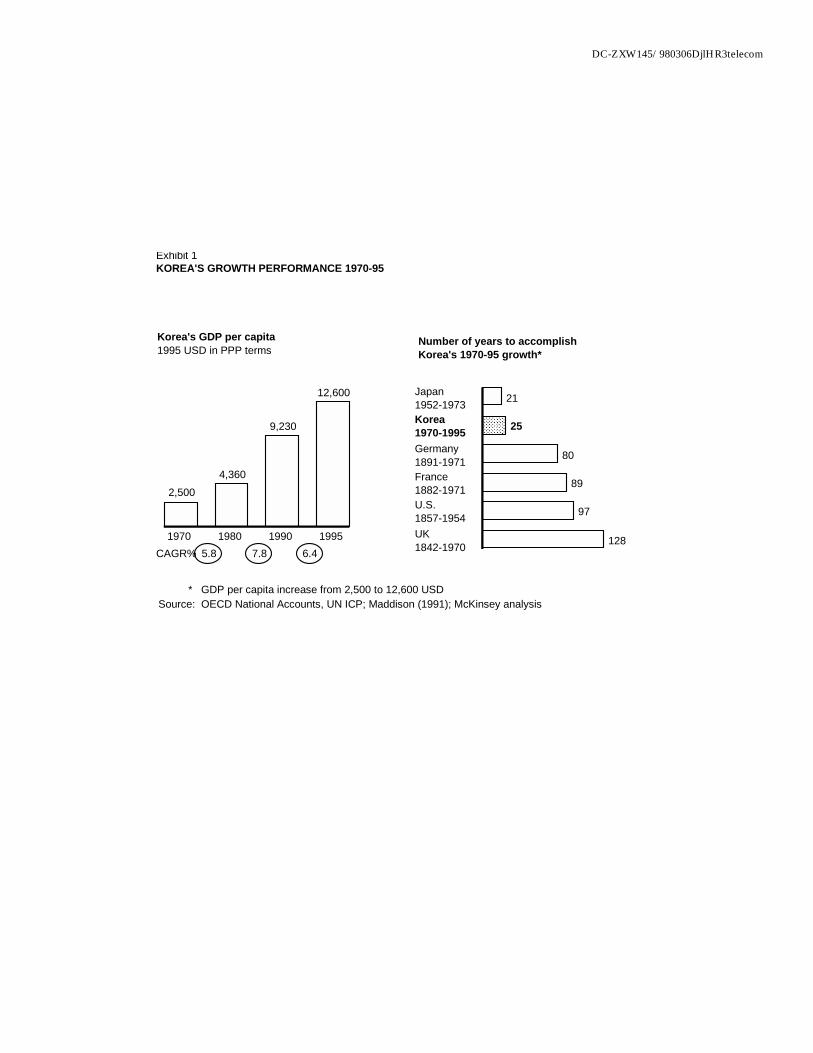
In the last three decades, Korea has been among the fastest growing economies in the world. Its real income per capita has increased five-fold from $2,500 in 1970 to $12,600 in 1995. In just 25 years Korea accomplished what had taken the Western economies nearly hundred years (Exhibit 1). This impressive growth performance, similar to Japan’s experience a few decades before, has been described as the East Asian miracle.
Korea’s very rapid growth rate started to slow down after 1995. GDP per capita growth declined from an annual average of 7.5 percent since 1985 to 6 percent in 1996. And starting in early 1997, a number of Korean chaebols went bankrupt, creating a ripple effect through the financial system to the rest of the economy. The problems culminated by the end of the year into a full foreign exchange and financial crisis as part of a regional financial meltdown.
OBJECTIVE OF THE STUDY
At this time of crisis, the purpose of this study is to look beyond the immediate financial turmoil and assess Korea’s output growth potential in the medium and long run under alternative economic policy scenarios. Through 8 detailed industry case studies and an aggregate survey, we seek first to understand what have been the key determinants of productivity and output growth in the past. Based on this understanding, we are then able to assess future growth potential. This allows us to appraise whether the high annual growth rates observed in the past are within Korea’s reach in the future.
We believe that productivity growth is the key determinant of GDP growth. More efficient use of resources to create value allows the economy to provide lower cost of goods and services relative to the income of domestic consumers and to compete for customers in international markets. This in turn will raise the nation’s living standards. To start this virtuous circle, we seek to identify concrete actions that the government and businesses can undertake to raise productivity in different industries.
Industry studies alone are not sufficient for providing a complete picture of Korea’s future growth prospects, however. By definition, they do not take into account spillover effects from one sector’s growth to the rest of the economy. And there are potential aggregate barriers to growth that do not show up in sector analyses: most importantly, total available savings limit the rate of investment in additional capacity. To generalize our sector findings to the whole

2
economy, we use the experiences of other countries at corresponding stages of development as a benchmark. By comparing Korea’s current output and employment structure to a benchmark picture in the future, we can evaluate whether the implied sectoral growth rates and capital requirements are internally consistent and realistically achievable.
Korea’s impressive growth performance has been the focus of many studies in both academic literature and popular press. The growth has been attributed to high savings and investment rates, rapid rise in average level of education, rapid transfer of technology, focus on export growth, and others. What seems to be lacking is a systematic evaluation of the relative importance of the explanatory factors. Furthermore, the bulk of the literature has looked at Korea’s growth from the macroeconomic perspective. The objective of this report is to complement the literature with a systematic analysis of the relative importance of determinants of growth at the industry level.
The focus of our work is Korea’s growth prospects in the medium and long term. Hence we do not attempt to make recommendations on short term macroeconomic policies, except when they affect output and productivity growth at the firm level in the industries we study. In drawing policy implications from our findings, we bear in mind that higher material living standards are only one of many policy goals that a government can have. Yet higher productivity and output levels provide the opportunity to use resources to address social challenges more effectively.
APPROACH OF THE STUDY
The approach used in this study is based on the methodology used in previous McKinsey Global Institute (MGI) reports. Industry case studies form a core that is complemented by analysis of aggregate data and review of relevant literature. However, we have made some adjustments to better suit an emerging market like Korea: we have paid more attention to potential productivity and output growth rates. The aggregate analysis focuses on growth performance in the past, while the discussion on potential for future growth is contained in the synthesis chapter.
Aggregate analysis. The first following chapter is a diagnostic of Korea’s past economic performance based on aggregate data and relevant literature. Through a comparison with the US and Japan, we explore the current understanding of the main factors that have contributed to Korea’s past output and productivity growth across the whole economy. The potential causal factors that are identified in the aggregate analysis form part of the hypotheses that are tested in the case studies.
Industry case studies. The core of the research project is eight detailed industry case studies. Analyzing industries in a very disaggregated level allows us to
3
understand how Korean operations differ from world benchmarks and what are the reasons for the different choices Korean managers have made. Only through this microeconomic understanding of industry operations are we able to draw conclusions on the relative importance of the external factors affecting current level of productivity and estimate future growth potential under alternative assumptions of these factors.
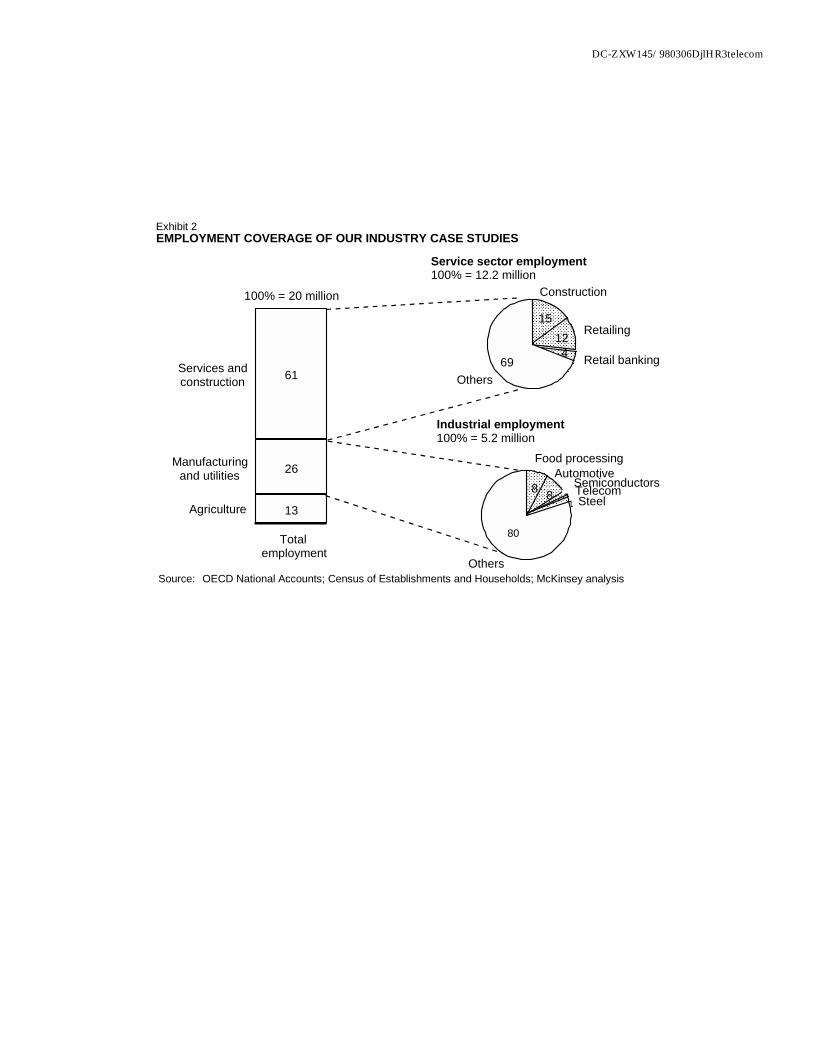
Our cases are selected to represent a significant share of the private economy, including both manufacturing and service sectors (Exhibit 2). Automotive, steel and semiconductor cases represent capital intensive sectors that have been the focus of Korea’s development strategy, while food processing is a manufacturing sector that has developed largely outside the sphere of direct policy support. All of these sectors are also potentially tradable. Telecom sector, together with steel, represent industries with close ties to the government. In service sector cases, we wanted to study both modern sectors and ones with a significant share of small scale traditional forms of production. We chose construction and retail banking as examples of the former and general merchandize retail, of the latter.
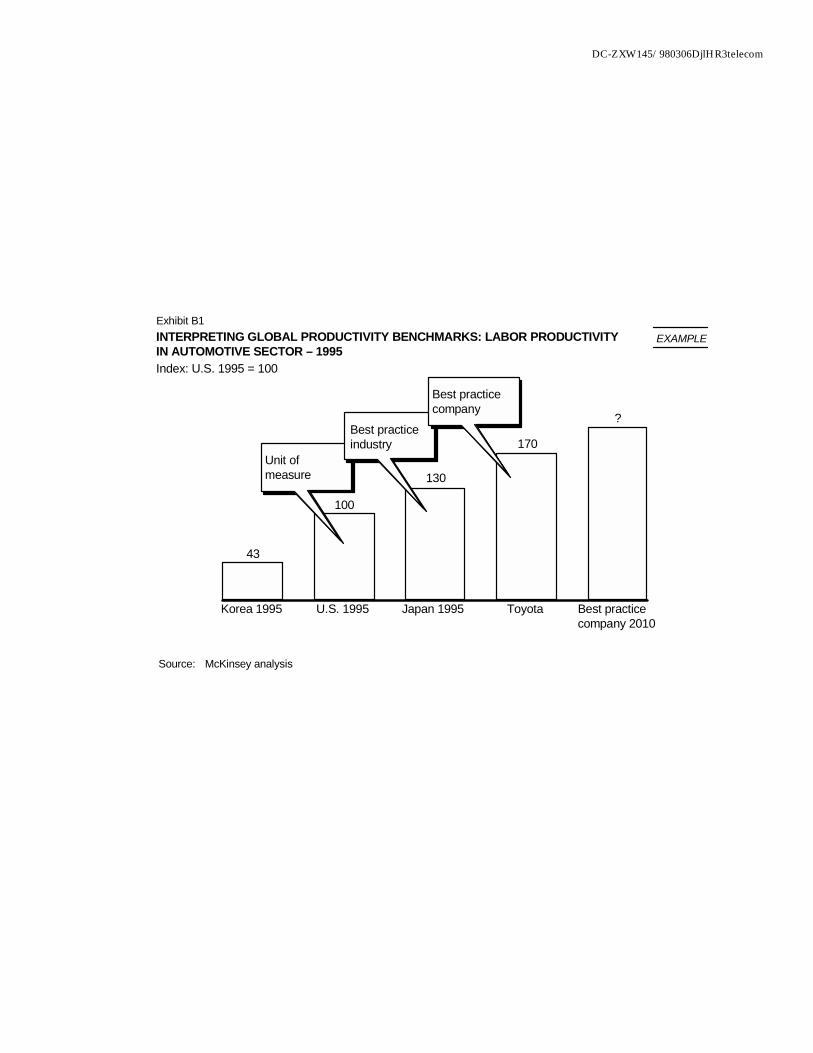
Each of the cases follows the same sequential analytical process that starts with a measurement of current productivity level of the Korean industry relative to world benchmarks (see Box 1: Interpreting global productivity benchmarks). Then we generate and test hypotheses on the causal factors that explain the observed gap. We then proceed to estimating the rate of achievable productivity growth when the current barriers to productivity growth are removed.
¶ Measuring productivity. Productivity reflects the efficiency with which resources are used to create value in the marketplace. It is measured by computing the ratio of output to input. We first define each industry in a consistent manner in Korea and the comparison countries, making sure that our industries include the same parts of an industry value chain. We then collect data on output produced in each sector using measures of physical output or Purchasing Power Parity adjusted value added. The labor inputs are measured as number of hours worked, and capital inputs, when available, as capital services obtained from the existing stock of physical capital (see Appendix 1: Measurement of output and productivity).
¶ Generating and testing causality hypotheses. To explain why levels of productivity in Korea differ from the benchmarks, we start by generating a set of hypotheses on the possible causes. In this phase, we benefit from McKinsey’s experience by using interviews with McKinsey consultants who are experts in the field, industry associations and company executives in both Korea and the comparison countries. This is a very efficient way of identifying major operational differences and the reasons for them arising from product, capital and labor market conditions.
4
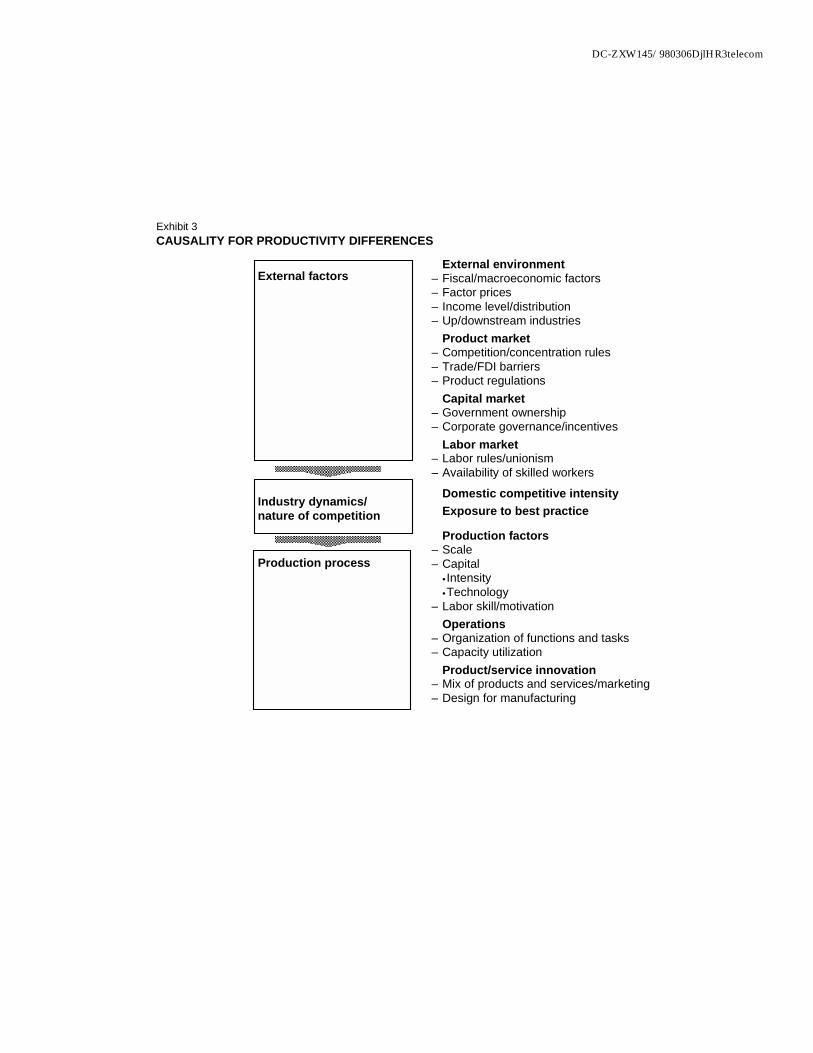
We use a systematic framework to explain productivity differences across countries that captures the major possible causal factors. This causal framework has three hierarchical layers of causality: differences observed at the production process level, factors arising from industry dynamics, and external factors that explain why the choices of Korean companies differ from the comparison country (Exhibit 3; see also Appendix 2: Framework Definition). The hypotheses are tested with further fact based analyses and plant visits that allow us to conclude with an assessment of the relative importance of the causal factors in explaining the productivity difference in each sector.
¶ Estimating achievable productivity growth. Based on our understanding of the current factors limiting higher productivity growth, we then estimate how fast productivity can grow over a ten year period if these barriers are removed. These predictions consider productivity improvements achievable in existing establishments through reorganization of functions and task or new capital investments, as well as the effect of potential new entrants to the sector.
Synthesis. Once the causal factors are identified for each case, we compare the results across cases. The patterns that emerge allow us to draw conclusions on the causes of the aggregate productivity gap between Korea and the comparison countries, as well as on the speed at which productivity can grow when the external factors are changed.
The next step is to assess the aggregate output growth potential after the barriers to productivity growth are removed. We ask the question: how fast can Korea’s GDP per capita grow over a ten year period? Our answer is derived using information from our cases together with aggregate data from the experiences of other countries at corresponding stages of development. We first use the potential labor productivity growth rates from our industry cases to estimate productivity growth potential for each of the aggregate sectors of the economy. This allows us to derive an estimate for the aggregate labor productivity growth potential. Together with an estimate of the evolution of labor inputs assuming no change in unemployment, we are able to get an estimate of the output growth potential for the economy. Based on output compositions of other countries, we then construct a benchmark that describes the sector output breakdown in Korea in 10 years. And last, we derive the benchmark employment composition from the implied output values by sector, projected productivity growth rates, and the aggregate change in labor inputs.
The benchmark picture of Korea’s economy allows us to assess the conditions that are necessary for the projected changes to occur over a ten year period. While the analysis is based on the assumptions of maintained financial stability and removal of existing barriers to productivity growth, the availability of
5
resources for the required investments may be an additional aggregate bottleneck that can limit the speed at which output can grow. We estimate the required investment rate for each growth scenario and assess whether availability of savings is likely to be a constraint for Korea’s future growth.
In addition to providing insights on Korea’s aggregate growth potential, the benchmark analysis allows us to take our study one step further and look at some implications of the projected output growth. We are particularly interested in the employment characteristics of the alternative growth scenarios. Based on MGI's previous research on comparative employment performance1, our conclusions rely on benchmark comparisons with countries with different sets of economic policies.
1 McKinsey Global Institute: “Employment Performance,” 1994 and “Removing Barriers to Growth and Employment in France and Germany,” 1997
6
Box 1
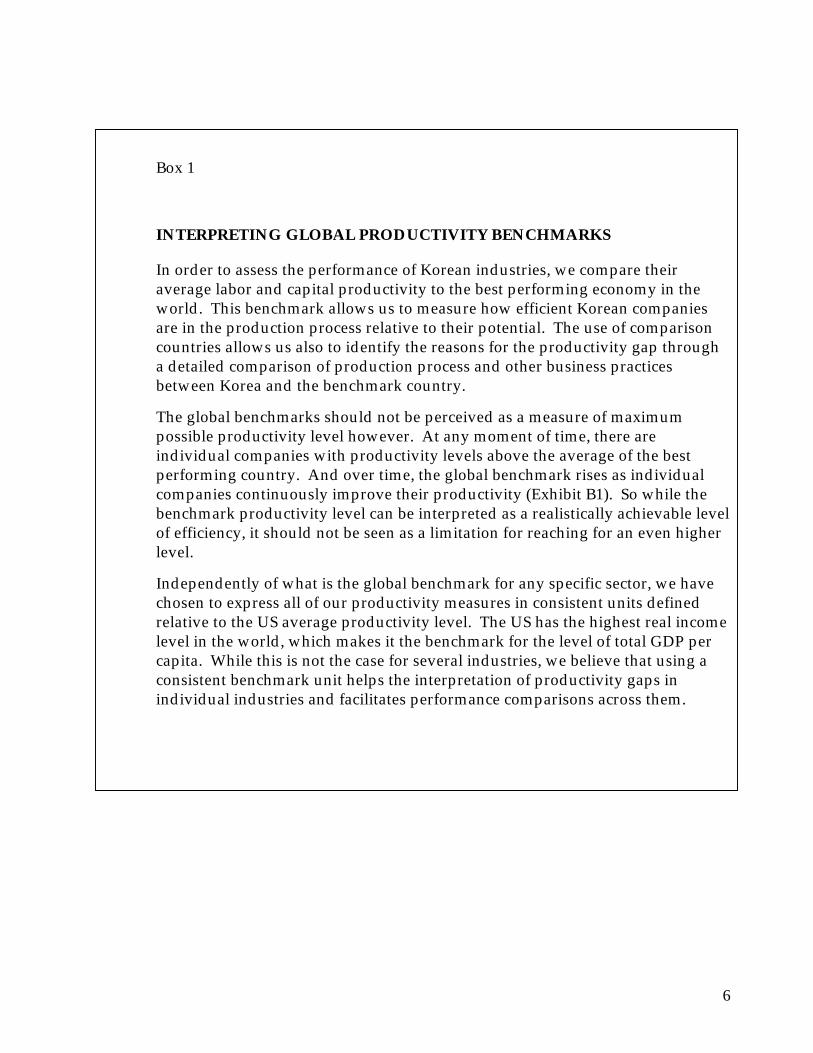
INTERPRETING GLOBAL PRODUCTIVITY BENCHMARKS
In order to assess the performance of Korean industries, we compare their average labor and capital productivity to the best performing economy in the world. This benchmark allows us to measure how efficient Korean companies are in the production process relative to their potential. The use of comparison countries allows us also to identify the reasons for the productivity gap through a detailed comparison of production process and other business practices between Korea and the benchmark country.
The global benchmarks should not be perceived as a measure of maximum possible productivity level however. At any moment of time, there are individual companies with productivity levels above the average of the best performing country. And over time, the global benchmark rises as individual companies continuously improve their productivity (Exhibit B1). So while the benchmark productivity level can be interpreted as a realistically achievable level of efficiency, it should not be seen as a limitation for reaching for an even higher level.
Independently of what is the global benchmark for any specific sector, we have chosen to express all of our productivity measures in consistent units defined relative to the US average productivity level. The US has the highest real income level in the world, which makes it the benchmark for the level of total GDP per capita. While this is not the case for several industries, we believe that using a consistent benchmark unit helps the interpretation of productivity gaps in individual industries and facilitates performance comparisons across them.
7
Appendix 1
MEASUREMENT OF OUTPUT AND PRODUCTIVITY
Productivity reflects the efficiency with which resources are used to create value in the marketplace. We measure productivity by computing the ratio of output produced in a year to inputs used in that production over the same time period.
Output. For output, there are three basic measurement approaches which can be taken: physical units, value added, and gross output. Physical output is the preferred measure, because it most closely reflects the productivity measure we are interested in. However, it is not always feasible to compare physical output due to product variety and quality differences. This approach also requires that one have data from the same part of the value chain in every country; in some countries an industry may simply assemble products while in others it may produce them from raw materials. Physical measures would tend to overestimate the productivity of the former, as fewer inputs would be required to produce the same amount of output. We were able to use physical output measures in three of our case studies: steel, telecommunications, and retail banking.
An alternative approach to physical output is to use value added. This is the approach taken in the remaining case studies: automotive, semiconductors, general merchandise retail, food processing, and construction. Here value added is defined roughly as factory-gate gross output less purchased materials and energy. The advantage of using value added is that it accounts for differences in vertical integration across countries. Furthermore, it accommodates quality differences between products, as higher quality goods normally receive a price premium which translates into higher value added. One complication arises from the fact that value added is not denominated in the same currency across countries. As a result, this approach requires a mechanism to convert value added to a common currency using Purchasing Power Parity (PPP) exchange rates, a topic which is discussed separately below.
GDP can be seen as a value added concept of output. In many cases, output is not homogeneous; the GDP of a country is made up of many thousands of different goods and services. The GDP of a country is the market value of the final goods and services produced. It reflects the market value of output produced by means of the labor and capital services available within the country.
The third approach is to use gross output. Using shipment values, as with physical output, requires that one look at the same part of the value chain across countries. Furthermore, as with value added, a mechanism for converting gross output to a common currency is needed. This approach is normally used when the first two are not feasible due to lack of data.
8
Purchasing Power Parity (PPP) exchange rate. Instead of using market exchange rates to convert value added of different countries to a common currency, we use PPP exchange rates. They can be thought of reflecting the ratio of the actual costs of purchasing the same basket of goods in local currencies in two countries. The PPP exchange rates are constructed “bottom up” by comparing the actual market prices of comparable goods and services across countries, and then aggregating the individual prices up to a “price” for sector-specific baskets and finally the total GDP.
The reason for not using the market exchange rate is that because it reflects international transactions alone, it cannot reflect the prices of non-tradable goods and services in the economy. Furthermore, comparisons done on the basis of market exchange rates would be affected by fluctuations in the exchange rate related to, say, international capital movements alone. For our aggregate survey, we use the GDP PPP exchange rate reported in the United Nations International Comparison Project (ICP).
Input. Our total factor inputs consist of labor and capital inputs. Labor inputs are more straight forward to measure: we seek to use the total annual number of hours worked in the industry. When actual hours are not available, we estimate labor inputs with the total number of employees multiplied by the best available measure of average hours of work per employee in the sector.
The heterogeneity of capital makes measuring capital inputs more difficult. Capital stock consists of various kinds of structures (such as factories, offices, or stores) and equipment (such as machines, trucks, or tools). The stock is built up incrementally by the addition of investment (business gross fixed capital formation) to the existing capital stock. Each piece of capital provides a flow of services during its service life. The value of this service is what one would pay if one were leasing this piece of capital and what we use as our measure of capital inputs.
In our aggregate chapter, we construct our capital service measures using the Perpetual Inventory Method (PIM), based on US service lives for structures and equipment. Ideally we would have liked to measure the capital inputs in each of our case studies as well. However, data was available for only the cases of steel, automotive, semiconductors, food processing, and telecom.
9
Appendix 2
FRAMEWORK DEFINITION
The framework for synthesizing the explanatory factors for the sectoral productivity performance is summarized in Exhibit 3. The various elements of the framework are further described below. Illustrations of possible effects are also presented under some of the subheadings, both in order to facilitate the understanding of the relevance of each point and in order to introduce some of the effects that are presented in the later discussions.
External factors. The external effects on managers can be divided into external environment and product, capital, and labor market factors. These factors are mainly outside the control of firms but influence how they operate.
¶ External environment
! Fiscal and macroeconomic factors. The general economic environment in which managers operate affects their planning horizon, investment decisions, and their every day operational decisions. High productivity is more difficult to achieve in an unstable macroeconomic environment where high inflation rates, uncertainty about exchange rates, or frequently changing fiscal policies generate additional uncertainty.
! Factor prices. Differences in relative prices of capital and labor lead profit-maximizing managers to choose different production technologies. This in turn leads to labor and capital productivity differences, although not total factor productivity differences, across economies.
! Income level/distribution. The structure of consumer demand influences the product mix demanded in the marketplace, which in turn can affect the value of the total output and thus productivity.
! Up/downstream industries. Supplier or downstream industries can influence productivity by exposing a national industry to international competition, by exerting buyer/seller power and by providing technical support. An underdeveloped upstream industry in turn can impose significant productivity costs on its clients.
¶ Product market
! Competition/concentration rules. Government policy can influence the competitive intensity and productivity of an industry by facilitating competition, for example, by preventing excessive concentration or collusive practices.
10
! Trade/FDI barriers. Tariff and non-tariff barriers to trade or foreign direct investment (FDI) can reduce the competitive pressure on an industry and allow low productivity to persist.
! Product regulations. Regulations prohibiting or discouraging certain product or service offerings (including regulations on pricing) can reduce or eliminate high-productivity production. Product market regulations can also limit or distort competition by protecting or favoring incumbent companies.
¶ Capital market
! Government ownership. Ownership by government may imply management objectives that differ from profit maximization and lead to a lower productivity in favor of other goals.
! Corporate governance/incentives. The extent to which management is exposed to pressure from owners or shareholders can influence the rate at which productivity is improved.
¶ Labor market
! Labor rules/unionism. Labor regulations and union policy can influence the possibility to implement productivity improvements. In addition, the work rules and compensation schemes supported by national law may increase or decrease the possibility of putting in place certain types of production processes. These differences may thus generate different constraints and incentives for managers.
! Availability of skilled workers. If workers with certain kinds of skills - e.g. software specialists or technical designers - are scarce in the labor market, their employers may not be able to implement best practice productivity operations with less skilled workers.
Industry dynamics/nature of competition. The competitive pressure in the industry influences the pressure on management to adopt best practices in the production process. We consider differences arising both from competition among domestic firms and from the exposure of an industry to best practice either via imports or foreign direct investment.
Production process. The third set of factors affecting productivity arises at the production process level. These can be grouped into availability and application of key production factors (capital, labor with various skills and scale), organization of production operations, and mix of output/demand among different products and services. All production process factors in the framework are jointly determined by elements of a firm’s external environment beyond its control and decisions made by its managers, although the three factors classified as “operations” are most directly under a firm’s control.
11
¶ Production factors
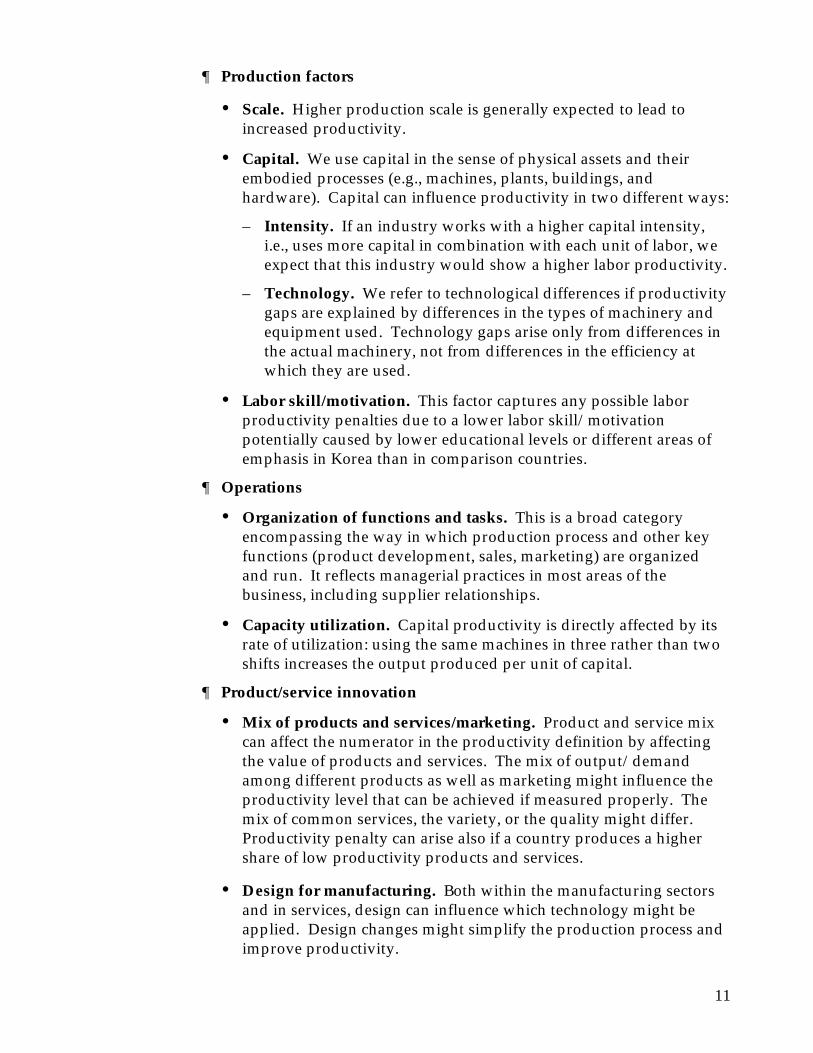
! Scale. Higher production scale is generally expected to lead to increased productivity.
! Capital. We use capital in the sense of physical assets and their embodied processes (e.g., machines, plants, buildings, and hardware). Capital can influence productivity in two different ways:
– Intensity. If an industry works with a higher capital intensity, i.e., uses more capital in combination with each unit of labor, we expect that this industry would show a higher labor productivity.
– Technology. We refer to technological differences if productivity gaps are explained by differences in the types of machinery and equipment used. Technology gaps arise only from differences in the actual machinery, not from differences in the efficiency at which they are used.
! Labor skill/motivation. This factor captures any possible labor productivity penalties due to a lower labor skill/motivation potentially caused by lower educational levels or different areas of emphasis in Korea than in comparison countries.
¶ Operations
! Organization of functions and tasks. This is a broad category encompassing the way in which production process and other key functions (product development, sales, marketing) are organized and run. It reflects managerial practices in most areas of the business, including supplier relationships.
! Capacity utilization. Capital productivity is directly affected by its rate of utilization: using the same machines in three rather than two shifts increases the output produced per unit of capital.
¶ Product/service innovation
! Mix of products and services/marketing. Product and service mix can affect the numerator in the productivity definition by affecting the value of products and services. The mix of output/demand among different products as well as marketing might influence the productivity level that can be achieved if measured properly. The mix of common services, the variety, or the quality might differ. Productivity penalty can arise also if a country produces a higher share of low productivity products and services.
! Design for manufacturing. Both within the manufacturing sectors and in services, design can influence which technology might be applied. Design changes might simplify the production process and improve productivity.
DC-ZXW145/980306DjlHR3telecom
Exhibit 1KOREA'S GROWTH PERFORMANCE 1970-95
2,5004,360
9,230
12,600
1970 1980 1990 1995
* GDP per capita increase from 2,500 to 12,600 USDSource: OECD National Accounts, UN ICP; Maddison (1991); McKinsey analysis
Korea's GDP per capita1995 USD in PPP terms
5.8 7.8 6.4CAGR%
Number of years to accomplishKorea's 1970-95 growth*
21
25
80
89
97
128
Japan1952-1973Korea1970-1995Germany1891-1971France1882-1971U.S.1857-1954UK1842-1970
DC-ZXW145/980306DjlHR3telecom
Exhibit 2EMPLOYMENT COVERAGE OF OUR INDUSTRY CASE STUDIES
Source: OECD National Accounts; Census of Establishments and Households; McKinsey analysis
Construction
15Retailing12
Retail banking4
Others69
Service sector employment100% = 12.2 million
Industrial employment100% = 5.2 million
Food processing
8Automotive
8Semiconductors
2 Telecom1 Steel1
Others
80
Services andconstruction 61
Manufacturingand utilities 26
Agriculture 13
Totalemployment
100% = 20 million
DC-ZXW145/980306DjlHR3telecom
Exhibit 3CAUSALITY FOR PRODUCTIVITY DIFFERENCES
� External environment– Fiscal/macroeconomic factors– Factor prices– Income level/distribution– Up/downstream industries� Product market– Competition/concentration rules– Trade/FDI barriers– Product regulations� Capital market– Government ownership– Corporate governance/incentives� Labor market– Labor rules/unionism– Availability of skilled workers
� Production factors– Scale– Capital
• Intensity•Technology
– Labor skill/motivation� Operations– Organization of functions and tasks– Capacity utilization� Product/service innovation– Mix of products and services/marketing– Design for manufacturing
� Domestic competitive intensity� Exposure to best practice
Industry dynamics/nature of competition
Production process
External factors
DC-ZXW145/980306DjlHR3telecom
?
Exhibit B1INTERPRETING GLOBAL PRODUCTIVITY BENCHMARKS: LABOR PRODUCTIVITYIN AUTOMOTIVE SECTOR – 1995Index: U.S. 1995 = 100
Source: McKinsey analysis
43
100
130
170
Korea 1995 U.S. 1995 Japan 1995 Toyota Best practicecompany 2010
Unit ofmeasure
Best practiceindustry
Best practicecompany
EXAMPLE
1
Aggregate Analysis
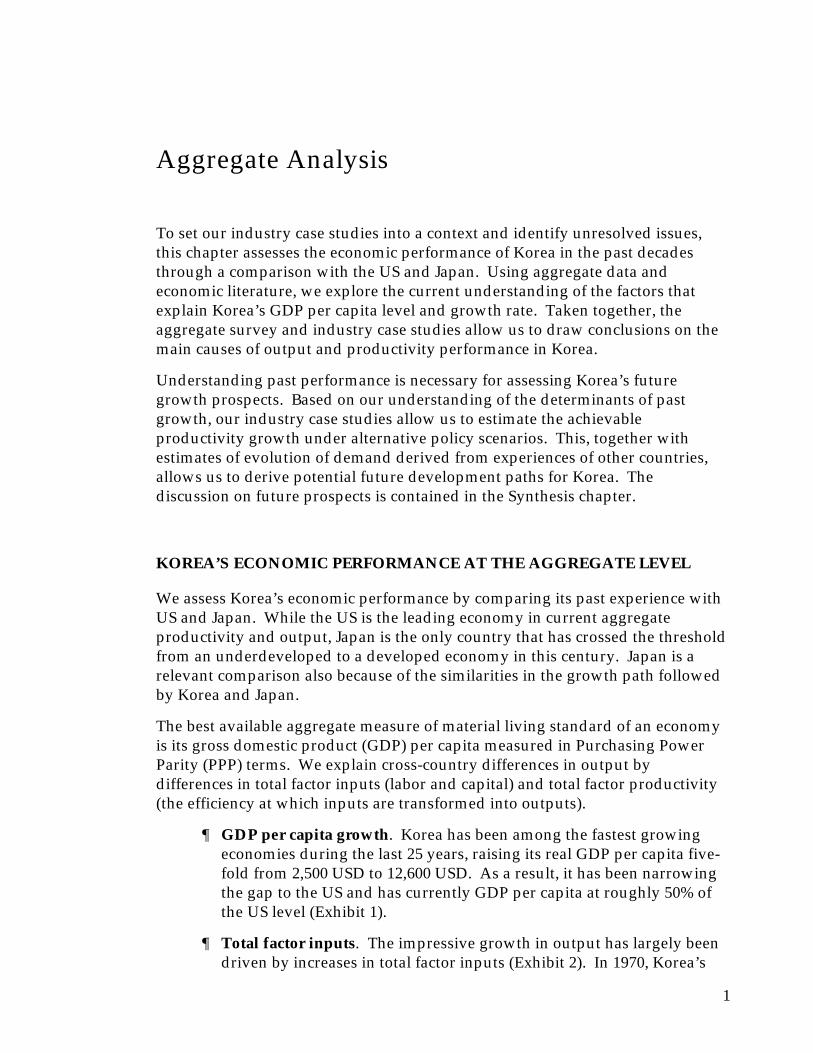
To set our industry case studies into a context and identify unresolved issues, this chapter assesses the economic performance of Korea in the past decades through a comparison with the US and Japan. Using aggregate data and economic literature, we explore the current understanding of the factors that explain Korea’s GDP per capita level and growth rate. Taken together, the aggregate survey and industry case studies allow us to draw conclusions on the main causes of output and productivity performance in Korea.
Understanding past performance is necessary for assessing Korea’s future growth prospects. Based on our understanding of the determinants of past growth, our industry case studies allow us to estimate the achievable productivity growth under alternative policy scenarios. This, together with estimates of evolution of demand derived from experiences of other countries, allows us to derive potential future development paths for Korea. The discussion on future prospects is contained in the Synthesis chapter.
KOREA’S ECONOMIC PERFORMANCE AT THE AGGREGATE LEVEL
We assess Korea’s economic performance by comparing its past experience with US and Japan. While the US is the leading economy in current aggregate productivity and output, Japan is the only country that has crossed the threshold from an underdeveloped to a developed economy in this century. Japan is a relevant comparison also because of the similarities in the growth path followed by Korea and Japan.
The best available aggregate measure of material living standard of an economy is its gross domestic product (GDP) per capita measured in Purchasing Power Parity (PPP) terms. We explain cross-country differences in output by differences in total factor inputs (labor and capital) and total factor productivity (the efficiency at which inputs are transformed into outputs).
¶ GDP per capita growth. Korea has been among the fastest growing economies during the last 25 years, raising its real GDP per capita five-fold from 2,500 USD to 12,600 USD. As a result, it has been narrowing the gap to the US and has currently GDP per capita at roughly 50% of the US level (Exhibit 1).
¶ Total factor inputs. The impressive growth in output has largely been driven by increases in total factor inputs (Exhibit 2). In 1970, Korea’s
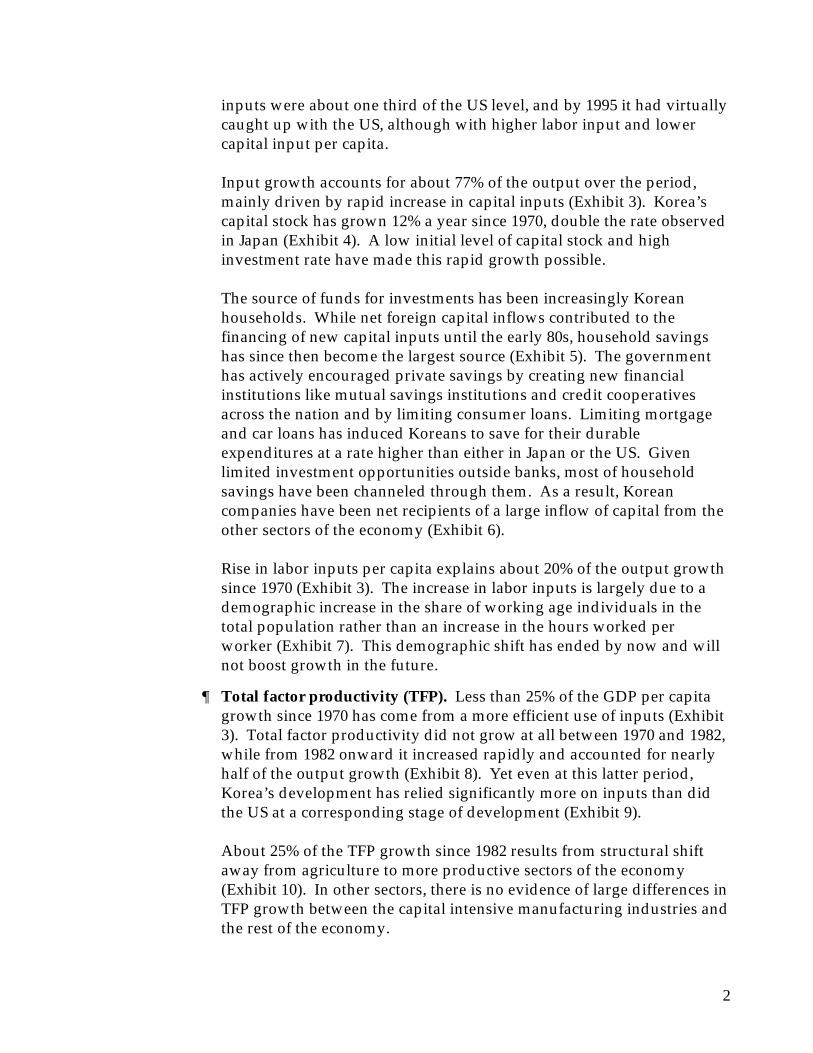
2
inputs were about one third of the US level, and by 1995 it had virtually caught up with the US, although with higher labor input and lower capital input per capita. Input growth accounts for about 77% of the output over the period, mainly driven by rapid increase in capital inputs (Exhibit 3). Korea’s capital stock has grown 12% a year since 1970, double the rate observed in Japan (Exhibit 4). A low initial level of capital stock and high investment rate have made this rapid growth possible. The source of funds for investments has been increasingly Korean households. While net foreign capital inflows contributed to the financing of new capital inputs until the early 80s, household savings has since then become the largest source (Exhibit 5). The government has actively encouraged private savings by creating new financial institutions like mutual savings institutions and credit cooperatives across the nation and by limiting consumer loans. Limiting mortgage and car loans has induced Koreans to save for their durable expenditures at a rate higher than either in Japan or the US. Given limited investment opportunities outside banks, most of household savings have been channeled through them. As a result, Korean companies have been net recipients of a large inflow of capital from the other sectors of the economy (Exhibit 6). Rise in labor inputs per capita explains about 20% of the output growth since 1970 (Exhibit 3). The increase in labor inputs is largely due to a demographic increase in the share of working age individuals in the total population rather than an increase in the hours worked per worker (Exhibit 7). This demographic shift has ended by now and will not boost growth in the future.
¶ Total factor productivity (TFP). Less than 25% of the GDP per capita growth since 1970 has come from a more efficient use of inputs (Exhibit 3). Total factor productivity did not grow at all between 1970 and 1982, while from 1982 onward it increased rapidly and accounted for nearly half of the output growth (Exhibit 8). Yet even at this latter period, Korea’s development has relied significantly more on inputs than did the US at a corresponding stage of development (Exhibit 9). About 25% of the TFP growth since 1982 results from structural shift away from agriculture to more productive sectors of the economy (Exhibit 10). In other sectors, there is no evidence of large differences in TFP growth between the capital intensive manufacturing industries and the rest of the economy.
3
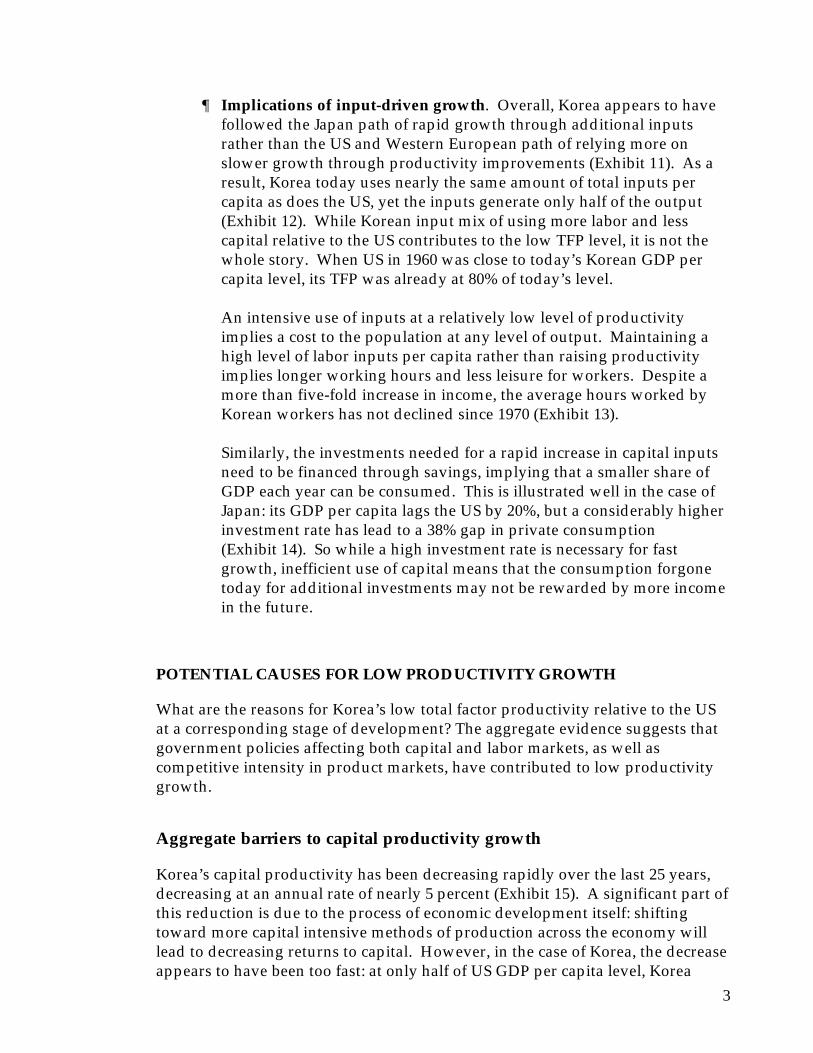
¶ Implications of input-driven growth. Overall, Korea appears to have followed the Japan path of rapid growth through additional inputs rather than the US and Western European path of relying more on slower growth through productivity improvements (Exhibit 11). As a result, Korea today uses nearly the same amount of total inputs per capita as does the US, yet the inputs generate only half of the output (Exhibit 12). While Korean input mix of using more labor and less capital relative to the US contributes to the low TFP level, it is not the whole story. When US in 1960 was close to today’s Korean GDP per capita level, its TFP was already at 80% of today’s level. An intensive use of inputs at a relatively low level of productivity implies a cost to the population at any level of output. Maintaining a high level of labor inputs per capita rather than raising productivity implies longer working hours and less leisure for workers. Despite a more than five-fold increase in income, the average hours worked by Korean workers has not declined since 1970 (Exhibit 13). Similarly, the investments needed for a rapid increase in capital inputs need to be financed through savings, implying that a smaller share of GDP each year can be consumed. This is illustrated well in the case of Japan: its GDP per capita lags the US by 20%, but a considerably higher investment rate has lead to a 38% gap in private consumption (Exhibit 14). So while a high investment rate is necessary for fast growth, inefficient use of capital means that the consumption forgone today for additional investments may not be rewarded by more income in the future.
POTENTIAL CAUSES FOR LOW PRODUCTIVITY GROWTH
What are the reasons for Korea’s low total factor productivity relative to the US at a corresponding stage of development? The aggregate evidence suggests that government policies affecting both capital and labor markets, as well as competitive intensity in product markets, have contributed to low productivity growth.
Aggregate barriers to capital productivity growth
Korea’s capital productivity has been decreasing rapidly over the last 25 years, decreasing at an annual rate of nearly 5 percent (Exhibit 15). A significant part of this reduction is due to the process of economic development itself: shifting toward more capital intensive methods of production across the economy will lead to decreasing returns to capital. However, in the case of Korea, the decrease appears to have been too fast: at only half of US GDP per capita level, Korea
4
already has practically the same capital productivity as the US. In contrast, when the US in 1960 was close to today’s Korean GDP per capita level, its capital productivity was 25% above its current level. This suggests that unless the productivity trend drastically changes, Korea is likely to follow Japan’s path to a very low level of capital productivity.
The aggregate evidence suggests that Korea’s low relative capital productivity has two components. First, capital investments done in many sectors have simply not been economically efficient. An indication of this is that the return on invested capital in the industrial sectors has been below the cost of debt during a number of years (Exhibit 16). Second, capital allocation across sectors may not have been optimal. Korea’s development strategy has focused on tradable manufacturing sectors which have received the bulk of capital resources, allowing them to reach physical capital levels close to US in per capita terms (Exhibit 17). This has meant that some productive investment opportunities in the service sector have likely been forgone.
The factors that have limited both efficient investments and allocation of capital in the economy as a whole appear to be both government intervention in the financial markets and an excessive reliance on debt financing.
¶ Government regulation of the banking industry. As in the case of mobilizing savings, the Korean government has regulated and directly participated in the way banks allocate capital across industries and companies.
! Interest rate controls. The Korean government has regulated both the deposit and lending rates of financial institutions. The lending rate for many loans has been fixed close to the borrowing rate and below the market price (Exhibit 18). Companies that consistently face artificially low cost of capital invest in low return projects that they would not undertake if facing the market cost of capital. In addition, banks cannot adjust interest rates according to the risk of each borrower, reducing their potential profitability.
! Direct intervention on loan allocation. A key component of Korea’s development strategy has been the focus on export-oriented manufacturing sectors. In order to direct capital into these sectors, the government has assigned or approved loans to favored industries and companies. Often access to subsidized credit was tied to export volume, inducing companies further to focus on increasing export sales rather than the return on capital. The government has also discouraged lending to non-preferential sectors like leisure or real estate. As a result of all of these policies, the allocation of capital has been based on factors other than expected returns, contributing to a low relative capital productivity in the economy.
5
! Government intervention in bank management. The Korean government has directly intervened in the selection and evaluation of bank top management. It has also imposed strict product regulations and bank operating rules that reduce the competitive intensity of the banking sector. Both of these factors severely affect the capacity of banks to differentiate themselves through higher productivity. In return for the control, the government appears to have implicitly insured banks against bankruptcies, reducing the need of banks to closely monitor the use of loans by clients.
! Limitations on external financing. The Korean government simultaneously restricted access to external financial markets. Companies were not free to seek debt or equity financing from abroad, keeping them inside the controlled financial system.
¶ Reliance on debt financing. Given the government’s efforts to mobilize domestic savings through banks, a large share of available funds in the economy have been in the form of bank loans. Equity markets are relatively underdeveloped, with a market capitalization as a share of GDP between 30-50% of the US level. As a result, Korean companies currently have nearly twice as high a debt to equity ratio as does the US (Exhibit 19). The incentives on managers imposed by debt financing do not reward maximizing the rate of return on capital: debtors can be satisfied as long as profits generated by new investments are sufficient to cover the interest and debt repayments. In equity financed companies, the shareholders have an interest in obtaining higher returns on their investment, providing an incentive for managers to be more efficient in their use of capital. Our case studies will test whether this aggregate hypothesis is supported at the industry level. A very different implication of excessive debt financing in a low capital productivity environment is that companies become more vulnerable to bankruptcies. Korean businesses had a considerably lower cash flow to interest payment ratio than the US (Exhibit 19). The situation arose, at least in part, because the financial discipline imposed by the risk of bankruptcy has been diminished by emergency loans provided by the government to rescue bankrupt companies and implement industry rationalization.
Aggregate barriers to labor productivity growth
Labor productivity in Korea has grown at an annual rate of 5% since 1970, rising from 14% to 36% of the US 1995 level of productivity (Exhibit 20). This growth has been driven mainly by the rapid rise in the use of capital inputs in the production process: the aggregate capital intensity (capital inputs used per labor
6
hour) has grown at twice the rate of labor productivity growth since 1970. As one would expect, having access to more machines, computers, and vehicles has made workers more efficient in their tasks. At the same time, the educational attainment of Korea’s workforce also increased dramatically, contributing to the potential for labor productivity growth (Exhibit 21).
Despite the continuous rise in labor productivity, there are indications that this growth has been below its potential. One reason for this is that increasing capital inputs have not been used as efficiently as they could have been, simultaneously affecting labor productivity. But additional factors arising from labor markets themselves can potentially limit labor productivity growth as well.
¶ Barriers to lay-offs. During economic development, one of the key drivers of total factor productivity growth is the substitution of capital for labor in processes where machinery and equipment are inherently more efficient. In order to capture the full benefit of these productivity gains, redundant labor inputs need to be redeployed in new, more productive jobs. Korean labor regulations could have prevented an efficient allocation of workers to jobs by limiting lay-offs and preventing companies from reaping full benefits from their labor saving investments (Exhibit 22).
¶ Other labor market regulations. Korean labor legislation imposes additional restrictions on how labor may be employed. The ability of Korean firms to employ part-time and temporary workers is somewhat more limited than in the US or Japan (Exhibit 23). These restrictions limit employers’ capacity to tailor their labor use over time in the most efficient way, particularly in sectors where demand for labor inputs is highly cyclical.
Despite this aggregate evidence, our case studies do not find labor market factors to be an important factor explaining the current productivity performance at the industry level. Korean government is also currently considering lifting the constraints, suggesting that future impact may be even less important.
Aggregate barriers on both capital and labor productivity growth
Both capital and labor productivity are affected by competitive intensity in the economy because competitive pressure affects companies’ need to increase productivity in order to survive. Aggregate evidence suggests that low exposure to competition from global best practice in the domestic market and high level of concentration may have kept competitive pressure low.
¶ Protection from foreign competition. Tariff protection and direct import restrictions have been used both to protect domestic producers of strategic manufacturing sectors and to restrict consumer goods imports. As a result, raw materials and capital goods account for
7
around 90% of imports even in the 90s (Exhibit 24). At the same time, foreign direct investments have been severely restricted, keeping global foreign competitors from entering through investments in Korea (Exhibit 25). These barriers have shielded Korean companies from competition with companies operating at best practice productivity levels.
¶ High level of concentration. The targeted allocation of capital has benefited large companies over small ones, leading to high level of concentration in the favored manufacturing industries. For over 75% of manufacturing products, the top three players control over half of total sales (Exhibit 26). This level of concentration may allow leading companies to exercise market power, reducing their need to compete on the basis of productivity.
CONCLUSIONS AND IMPLICATIONS FOR CASE STUDIES
Korea’s impressive growth performance in the last 25 years has been largely driven by rapid increase in inputs, mainly capital. Total factor productivity has contributed less than 25% to the output growth. The aggregate analysis suggests that the key causes for Korea’s low total factor productivity growth arise from policy decisions like government intervention in the banking sector and protective import and foreign direct investment policies.
While many potential causes for low productivity growth are apparent across the whole economy, a definitive picture of what the actual causes are can be obtained only through an understanding of the microeconomic factors that affect the decisions of managers in each industry. The eight case studies will complement this aggregate analysis by testing for the hypotheses raised here, and the synthesis section draws together the main conclusions.

DC-ZXW145/980306DjlHR3telecom
1.6%US
GDP PER CAPITA*Indexed to US 1995 = 100
* Includes residential real estateSource: OECD National Accounts; Korea National Accounts; IMF; Maddison 1992; The Economist, Penn World Tables
0
20
40
60
80
100
1970 75 80 85 90 1995
CAGRPercent
2.9%
6.7%
Japan
Korea
Exhibit 1
GDP PER CAPITA TREE – GROWTHIndexed to US 1995 = 100, 1970-95, total economy
GDP per capita *
0
20
40
60
80
100
Japan
US
Korea
1970 75 80 85 90 1995
* Excludes residential real estateSource: OECD; O'Mahony; Bank of Korea; Korea National Accounts; BEA; EPA; Pilat (1994); United Nations ICP; McKinsey analysis
CAGR
0
40
80
120
160
Japan
USKorea
1970 75 80 85 90 1995
0
20
40
60
80
100
120
Japan
US
Korea
1970 75 80 85 90 1995
Total factor inputs per capita
Total factor productivity
CAGR
1.6%
CAGR0.4%
Exhibit 2
1.6
7.1
1.25.5
0.9
1.5%
2.6
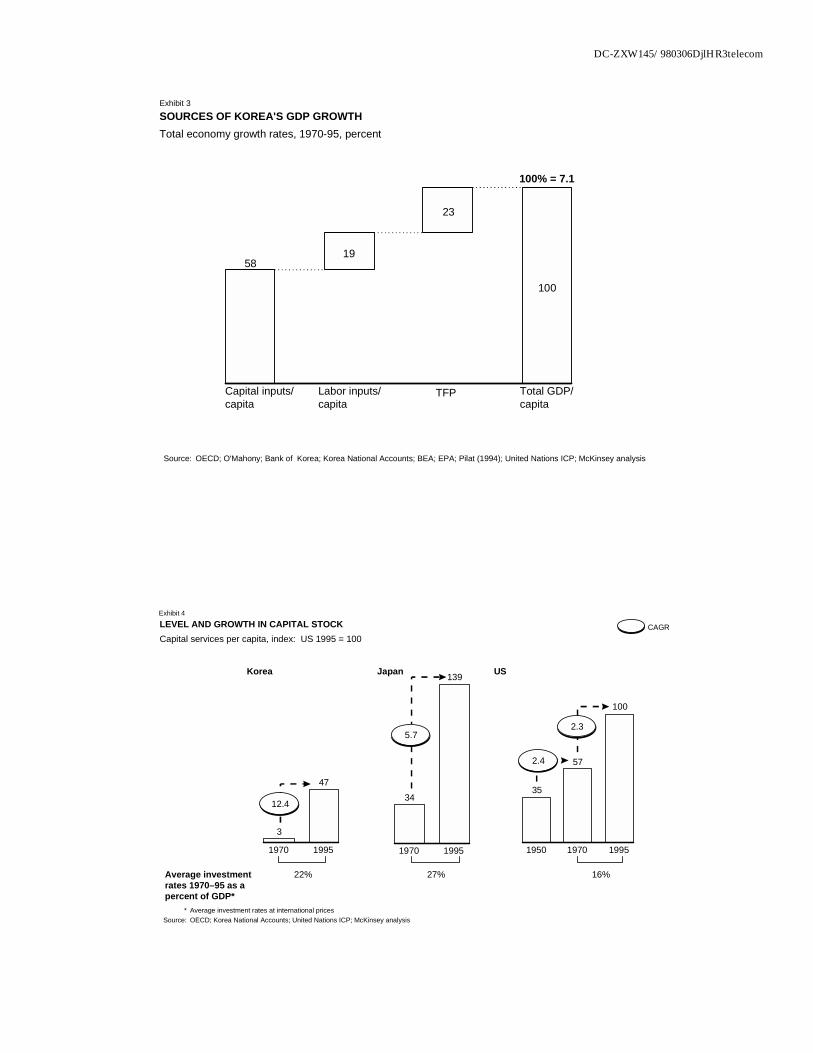
DC-ZXW145/980306DjlHR3telecom
SOURCES OF KOREA'S GDP GROWTHTotal economy growth rates, 1970-95, percent
Source: OECD; O'Mahony; Bank of Korea; Korea National Accounts; BEA; EPA; Pilat (1994); United Nations ICP; McKinsey analysis
5819
23
100
Capital inputs/capita
Labor inputs/capita
TFP Total GDP/capita
100% = 7.1
Exhibit 3
* Average investment rates at international pricesSource: OECD; Korea National Accounts; United Nations ICP; McKinsey analysis
3
47
1970 1995
34
139
1970 1995
35
57
100
1950 1970 1995
12.4
5.7
2.4
2.3
22% 27% 16%
Korea Japan US
Average investmentrates 1970–95 as apercent of GDP*
LEVEL AND GROWTH IN CAPITAL STOCKCapital services per capita, index: US 1995 = 100
Exhibit 4
CAGR
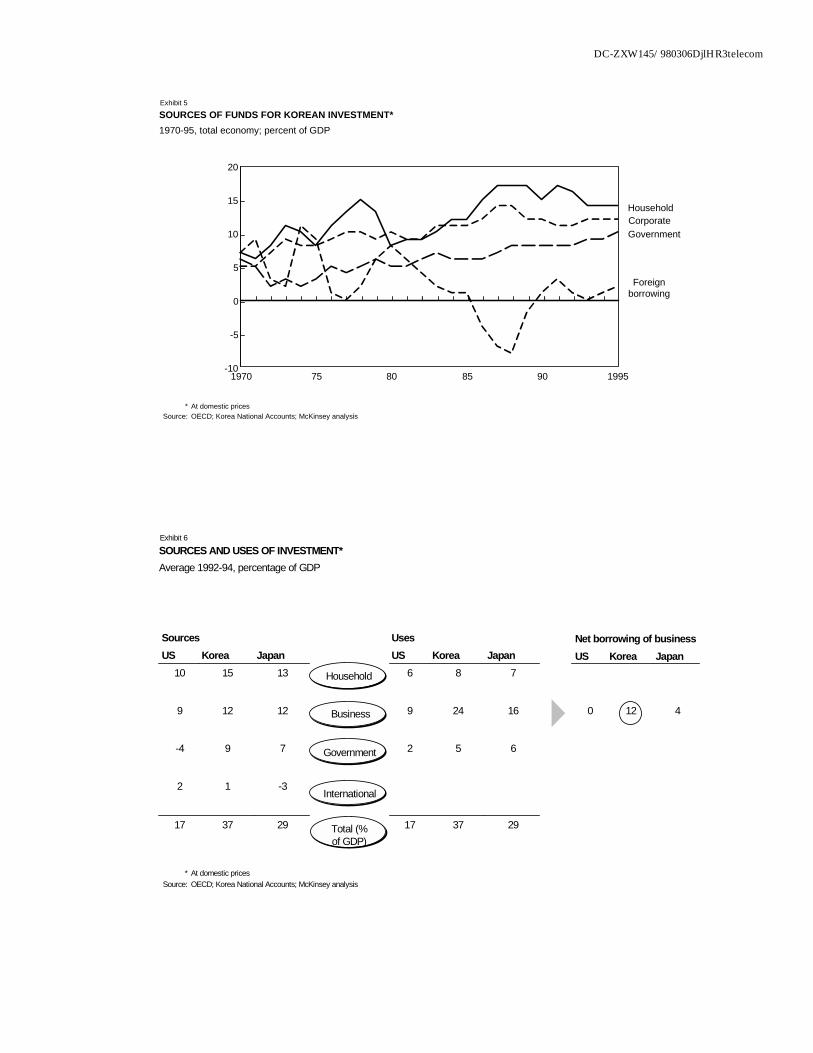
DC-ZXW145/980306DjlHR3telecom
SOURCES OF FUNDS FOR KOREAN INVESTMENT*1970-95, total economy; percent of GDP
-10
-5
0
5
10
15
20
Government
Foreignborrowing
CorporateHousehold
1970 75 80 85 90 1995
* At domestic pricesSource: OECD; Korea National Accounts; McKinsey analysis
Exhibit 5
Net borrowing of businessUS Korea Japan
0 12 4
* At domestic pricesSource: OECD; Korea National Accounts; McKinsey analysis
SourcesUS Korea Japan
10 15 13
9 12 12
-4 9 7
2 1 -3
17 37 29
UsesUS Korea Japan
6 8 7
9 24 16
2 5 6
17 37 29
Household
Business
Government
International
SOURCES AND USES OF INVESTMENT*Average 1992-94, percentage of GDP
Total (%of GDP)
Exhibit 6
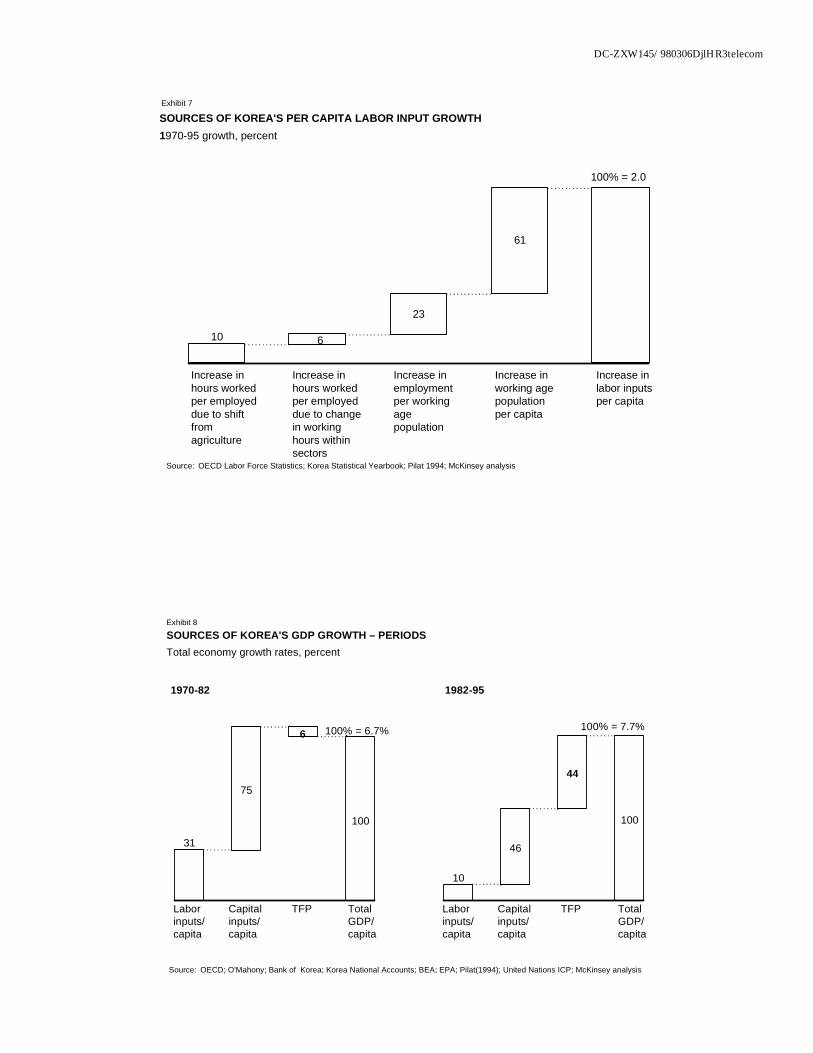
DC-ZXW145/980306DjlHR3telecom
SOURCES OF KOREA'S PER CAPITA LABOR INPUT GROWTH1970-95 growth, percent
10 6
23
61
Increase inhours workedper employeddue to shiftfromagriculture
Increase inhours workedper employeddue to changein workinghours withinsectors
Increase inemploymentper workingagepopulation
Increase inworking agepopulationper capita
Increase inlabor inputsper capita
Source: OECD Labor Force Statistics; Korea Statistical Yearbook; Pilat 1994; McKinsey analysis
100% = 2.0
Exhibit 7
SOURCES OF KOREA'S GDP GROWTH – PERIODSTotal economy growth rates, percent
1970-82
31
75
6
100
Labor inputs/capita
Capital inputs/capita
TFP Total GDP/capita
100% = 6.7%
1982-95
10
46
44
100
Labor inputs/capita
Capital inputs/capita
TFP Total GDP/capita
100% = 7.7%
Source: OECD; O'Mahony; Bank of Korea; Korea National Accounts; BEA; EPA; Pilat(1994); United Nations ICP; McKinsey analysis
Exhibit 8
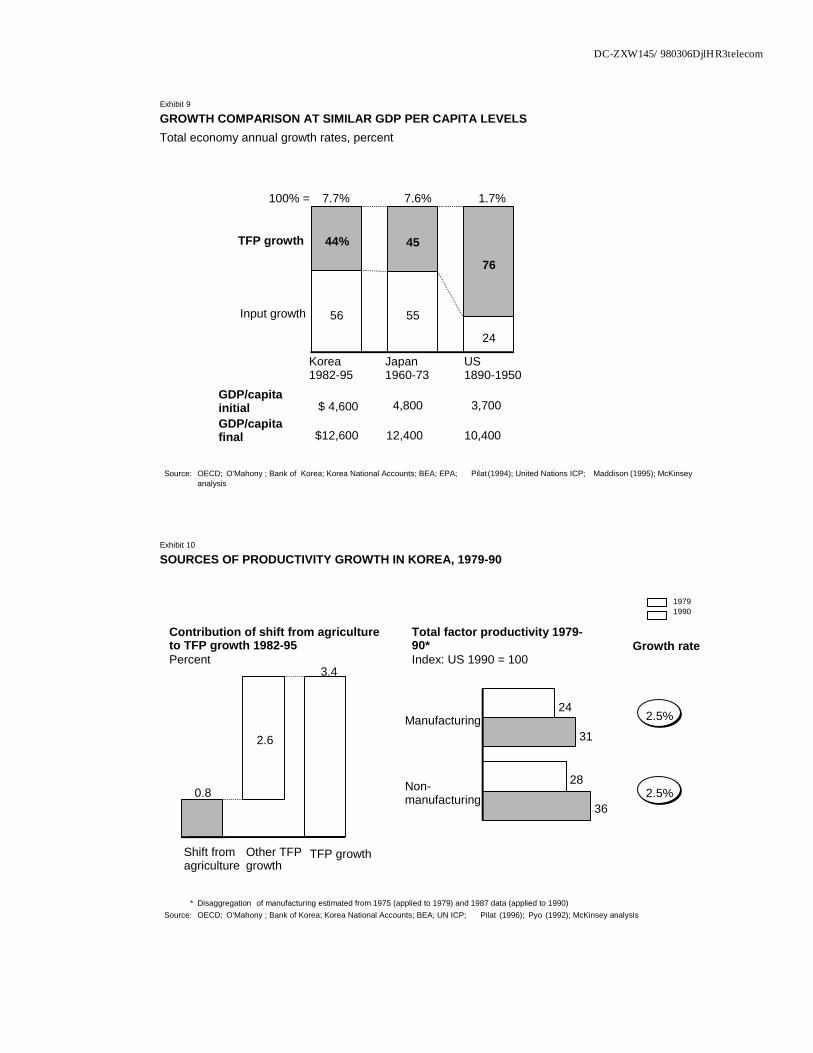
DC-ZXW145/980306DjlHR3telecom
GROWTH COMPARISON AT SIMILAR GDP PER CAPITA LEVELSTotal economy annual growth rates, percent
Source: OECD; O'Mahony ; Bank of Korea; Korea National Accounts; BEA; EPA; Pilat (1994); United Nations ICP; Maddison (1995); McKinseyanalysis
TFP growth 44% 45
76
Input growth 56 55
24
Korea1982-95
Japan1960-73
US1890-1950
100% = 7.7% 7.6% 1.7%
GDP/capitainitial $ 4,600 4,800 3,700GDP/capitafinal $12,600 12,400 10,400
Exhibit 9
SOURCES OF PRODUCTIVITY GROWTH IN KOREA, 1979-90
31
36
24
28
Manufacturing
Non-manufacturing
Total factor productivity 1979-90*Index: US 1990 = 100
2.5%
2.5%
Growth rate
19791990
* Disaggregation of manufacturing estimated from 1975 (applied to 1979) and 1987 data (applied to 1990)Source: OECD; O'Mahony ; Bank of Korea; Korea National Accounts; BEA; UN ICP; Pilat (1996); Pyo (1992); McKinsey analysis
0.8
2.6
3.4
Shift fromagriculture
Other TFPgrowth
TFP growth
Exhibit 10
Contribution of shift from agricultureto TFP growth 1982-95Percent
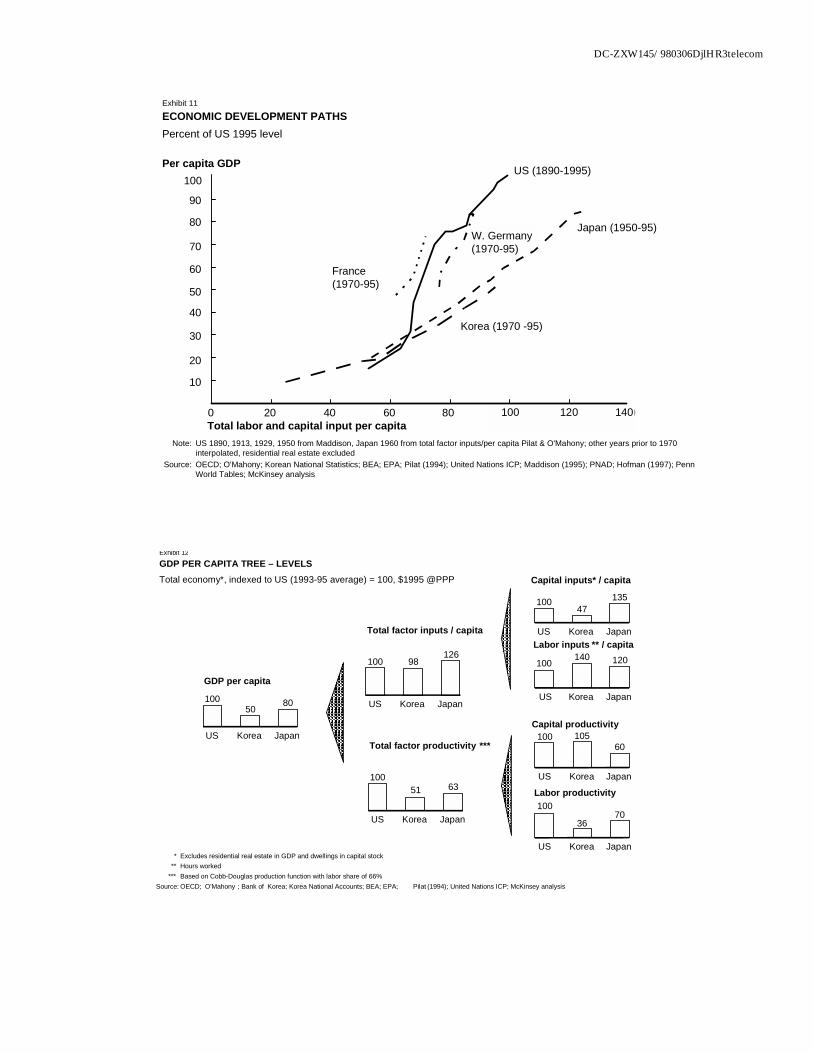
DC-ZXW145/980306DjlHR3telecom
ECONOMIC DEVELOPMENT PATHSPercent of US 1995 level
0 20 40 60 80 100 120 140
Per capita GDP
France(1970-95)
Korea (1970 -95)
US (1890-1995)
Japan (1950-95)
100 120 140
100
90
80
70
60
50
40
30
20
10
Total labor and capital input per capitaNote: US 1890, 1913, 1929, 1950 from Maddison, Japan 1960 from total factor inputs/per capita Pilat & O'Mahony; other years prior to 1970
interpolated, residential real estate excludedSource: OECD; O'Mahony; Korean National Statistics; BEA; EPA; Pilat (1994); United Nations ICP; Maddison (1995); PNAD; Hofman (1997); Penn
World Tables; McKinsey analysis
Exhibit 11
W. Germany(1970-95)
GDP PER CAPITA TREE – LEVELSTotal economy*, indexed to US (1993-95 average) = 100, $1995 @PPP
* Excludes residential real estate in GDP and dwellings in capital stock** Hours worked
*** Based on Cobb-Douglas production function with labor share of 66%Source: OECD; O'Mahony ; Bank of Korea; Korea National Accounts; BEA; EPA; Pilat (1994); United Nations ICP; McKinsey analysis
Total factor inputs / capita
100 98126
US Korea Japan
Total factor productivity ***
10051 63
US Korea Japan
GDP per capita
10050
80
US Korea JapanCapital productivity
100 10560
US Korea Japan
Labor productivity100
3670
US Korea Japan
Exhibit 12
Capital inputs* / capita
10047
135
US Korea JapanLabor inputs ** / capita
100140 120
US Korea Japan
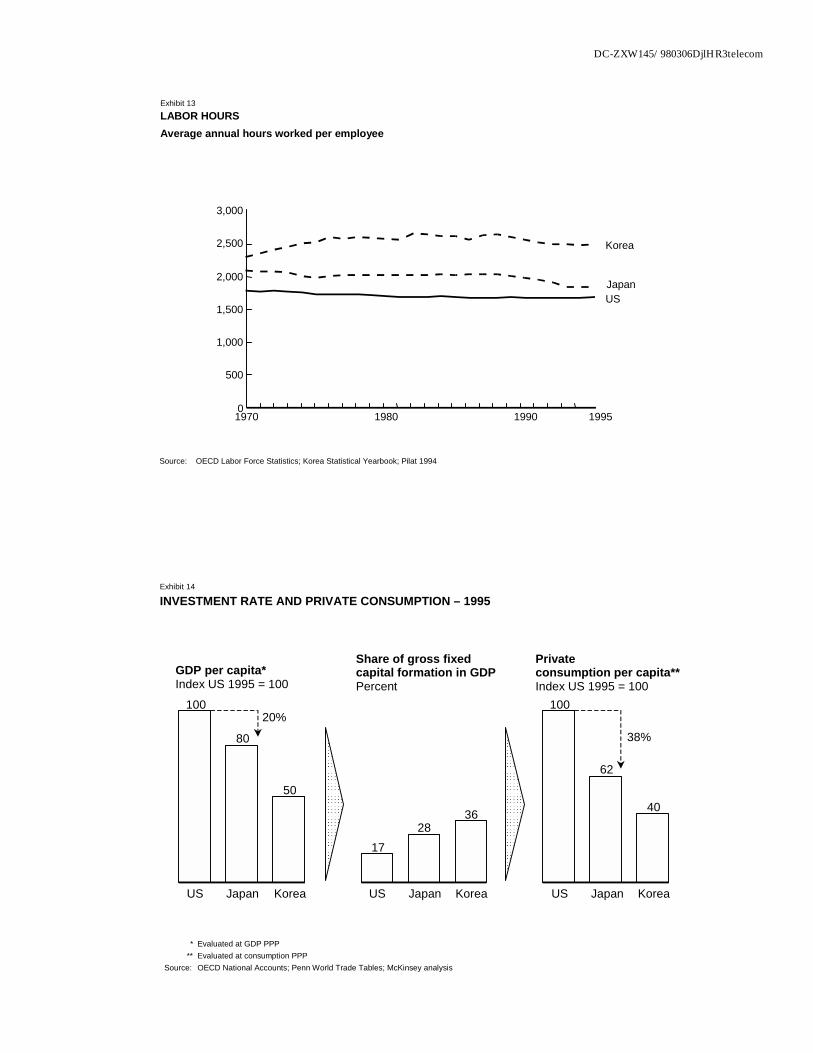
DC-ZXW145/980306DjlHR3telecom
Source: OECD Labor Force Statistics; Korea Statistical Yearbook; Pilat 1994
0
500
1,000
1,500
2,000
2,500
3,000
1970 1980 1990 1995
Korea
LABOR HOURSAverage annual hours worked per employee
Exhibit 13
USJapan
INVESTMENT RATE AND PRIVATE CONSUMPTION – 1995
GDP per capita*Index US 1995 = 100
100
80
50
US Japan Korea
Share of gross fixedcapital formation in GDPPercent
1728
36
US Japan Korea
Privateconsumption per capita**Index US 1995 = 100
100
62
40
US Japan Korea
* Evaluated at GDP PPP** Evaluated at consumption PPP
Source: OECD National Accounts; Penn World Trade Tables; McKinsey analysis
Exhibit 14
20%38%
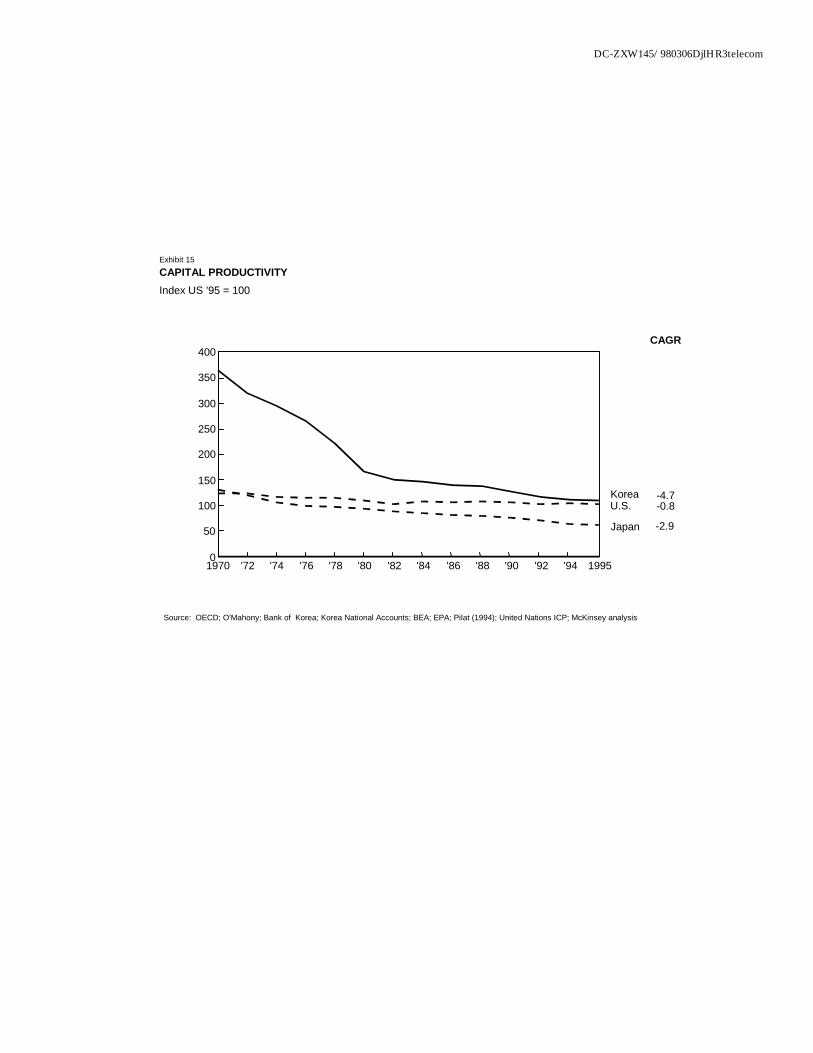
DC-ZXW145/980306DjlHR3telecom
CAPITAL PRODUCTIVITYIndex US '95 = 100
Exhibit 15
0
50
100
150
200
250
300
350
400
U.S.
Japan
Korea
1970 '72 '74 '76 '78 '80 '82 '84 '86 '88 '90 '92 '94 1995
Source: OECD; O'Mahony; Bank of Korea; Korea National Accounts; BEA; EPA; Pilat (1994); United Nations ICP; McKinsey analysis
CAGR
-2.9
-4.7-0.8
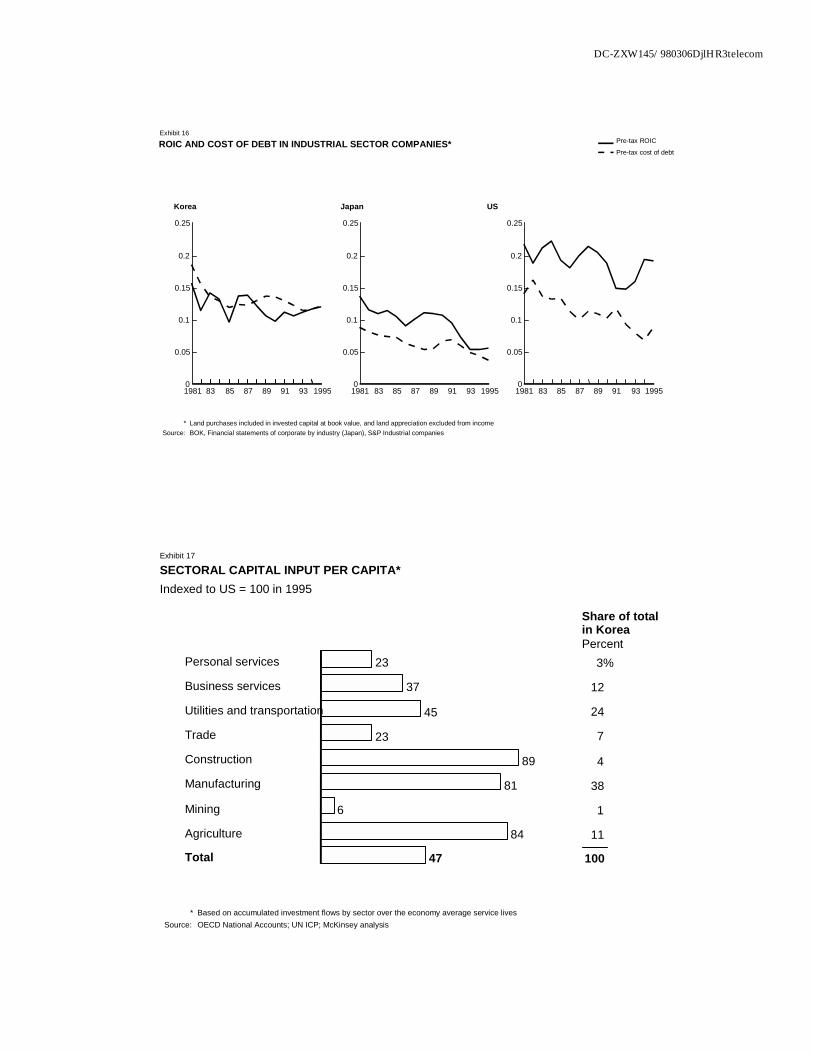
DC-ZXW145/980306DjlHR3telecom
ROIC AND COST OF DEBT IN INDUSTRIAL SECTOR COMPANIES*
* Land purchases included in invested capital at book value, and land appreciation excluded from incomeSource: BOK, Financial statements of corporate by industry (Japan), S&P Industrial companies
Korea
0
0.05
0.1
0.15
0.2
0.25
1981 83 85 87 89 91 93 1995
Japan
0
0.05
0.1
0.15
0.2
0.25
1981 83 85 87 89 91 93 1995
US
0
0.05
0.1
0.15
0.2
0.25
1981 83 85 87 89 91 93 1995
Pre-tax ROIC
Pre-tax cost of debt
Exhibit 16
SECTORAL CAPITAL INPUT PER CAPITA*Indexed to US = 100 in 1995
23
37
45
23
89
81
6
84
47
Personal services
Business services
Utilities and transportation
Trade
Construction
Manufacturing
Mining
Agriculture
Total
* Based on accumulated investment flows by sector over the economy average service livesSource: OECD National Accounts; UN ICP; McKinsey analysis
Share of totalin KoreaPercent
3%
12
24
7
4
38
1
11
100
Exhibit 17
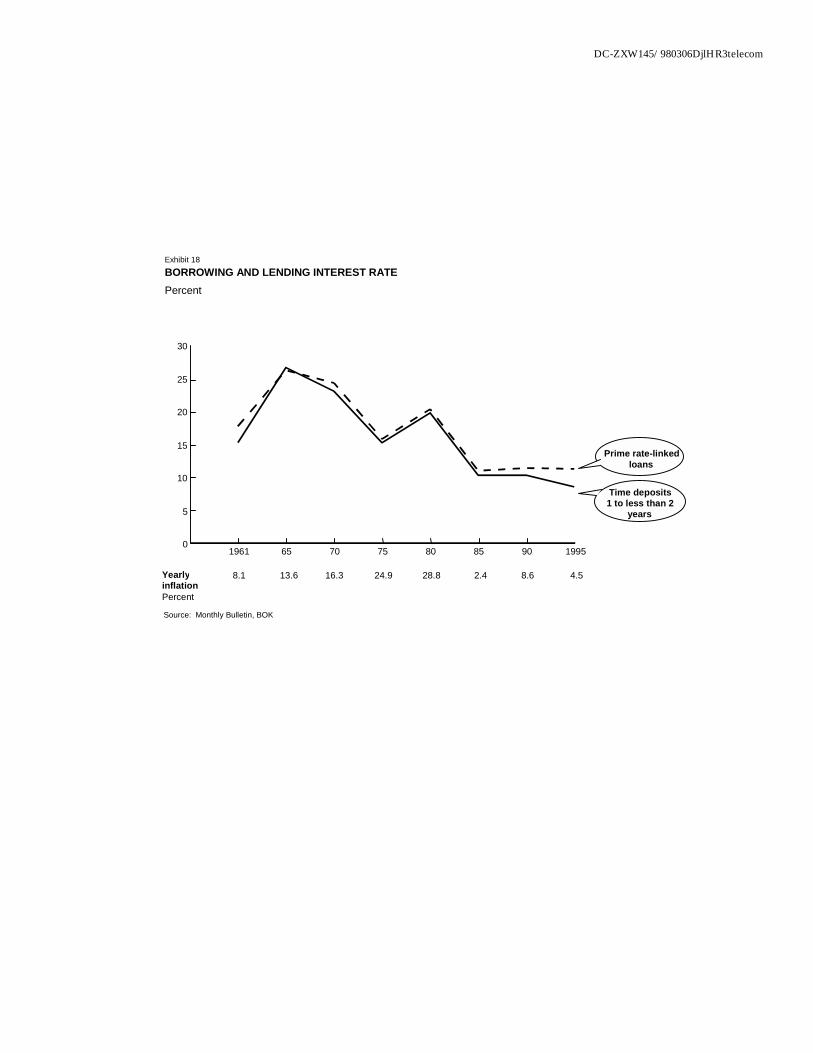
DC-ZXW145/980306DjlHR3telecom
BORROWING AND LENDING INTEREST RATEPercent
Source: Monthly Bulletin, BOK
0
5
10
15
20
25
30
1961 65 70 75 80 85 90 1995
Prime rate-linkedloans
Time deposits1 to less than 2
years
YearlyinflationPercent
8.1 13.6 16.3 24.9 28.8 2.4 8.6 4.5
Exhibit 18
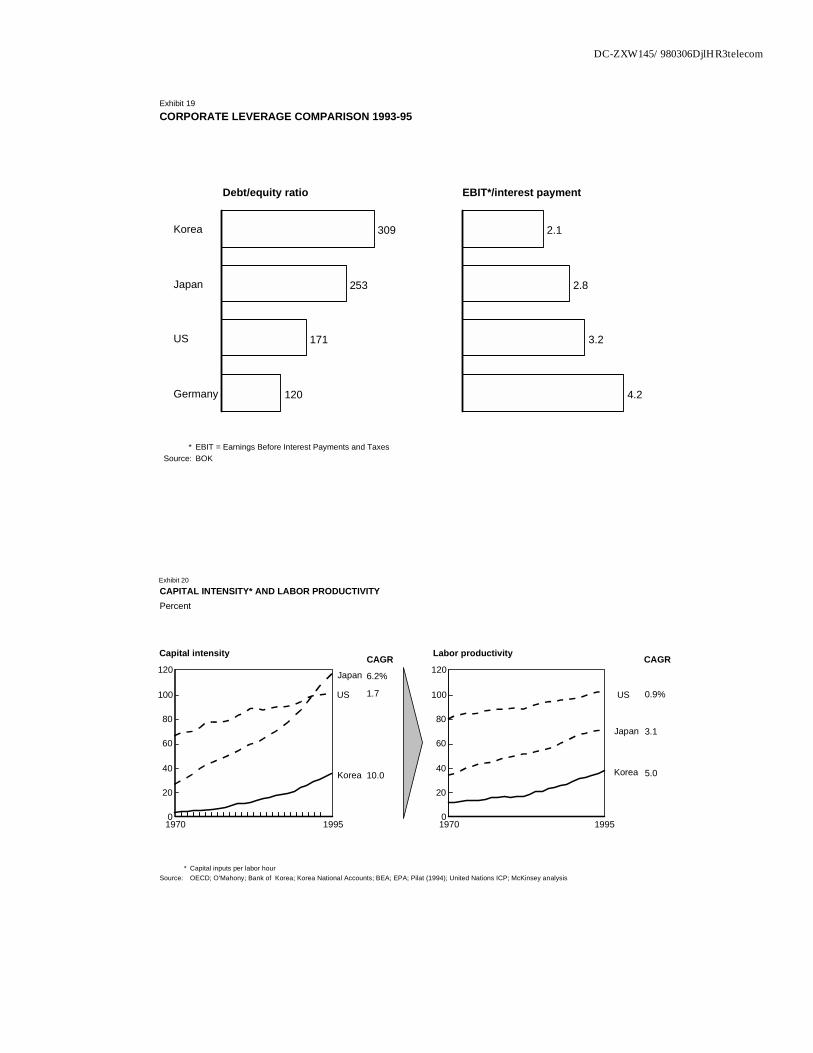
DC-ZXW145/980306DjlHR3telecom
CORPORATE LEVERAGE COMPARISON 1993-95
* EBIT = Earnings Before Interest Payments and TaxesSource: BOK
309
253
171
120
Korea
Japan
US
Germany
2.1
2.8
3.2
4.2
Taiwan
Germany
US
Japan
Debt/equity ratio EBIT*/interest payment
Exhibit 19
CAPITAL INTENSITY* AND LABOR PRODUCTIVITYPercent
Capital intensity
0
20
40
60
80
100
120
US
Japan
Korea
1970 1995
Labor productivity
0
20
40
60
80
100
120
US
Japan
Korea
1970 1995
Exhibit 20
0.9%
3.1
5.0
CAGR
6.2%
1.7
10.0
CAGR
* Capital inputs per labor hourSource: OECD; O'Mahony; Bank of Korea; Korea National Accounts; BEA; EPA; Pilat (1994); United Nations ICP; McKinsey analysis
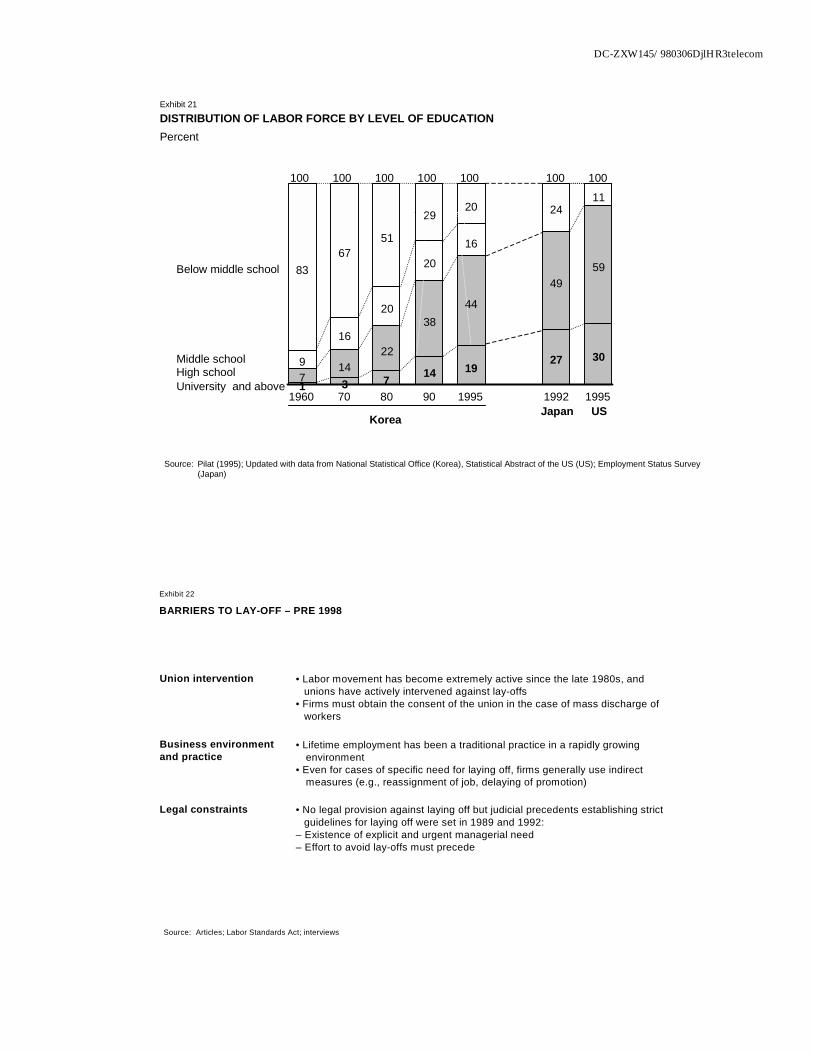
DC-ZXW145/980306DjlHR3telecom
Source: Pilat (1995); Updated with data from National Statistical Office (Korea), Statistical Abstract of the US (US); Employment Status Survey(Japan)
Below middle school 8367
51
2920
Middle school 9
16
20
20
16
2411
High school 714
22
3844
4959
University and above 1 3 7 14 1927 30
1960 70 80 90 1995 1992 1995
KoreaJapan US
DISTRIBUTION OF LABOR FORCE BY LEVEL OF EDUCATIONPercent
Exhibit 21
100 100 100 100 100 100 100
BARRIERS TO LAY-OFF – PRE 1998
Source: Articles; Labor Standards Act; interviews
Union intervention • Labor movement has become extremely active since the late 1980s, andunions have actively intervened against lay-offs
• Firms must obtain the consent of the union in the case of mass discharge ofworkers
Business environmentand practice
• Lifetime employment has been a traditional practice in a rapidly growingenvironment
• Even for cases of specific need for laying off, firms generally use indirectmeasures (e.g., reassignment of job, delaying of promotion)
Legal constraints • No legal provision against laying off but judicial precedents establishing strictguidelines for laying off were set in 1989 and 1992:
– Existence of explicit and urgent managerial need– Effort to avoid lay-offs must precede
Exhibit 22
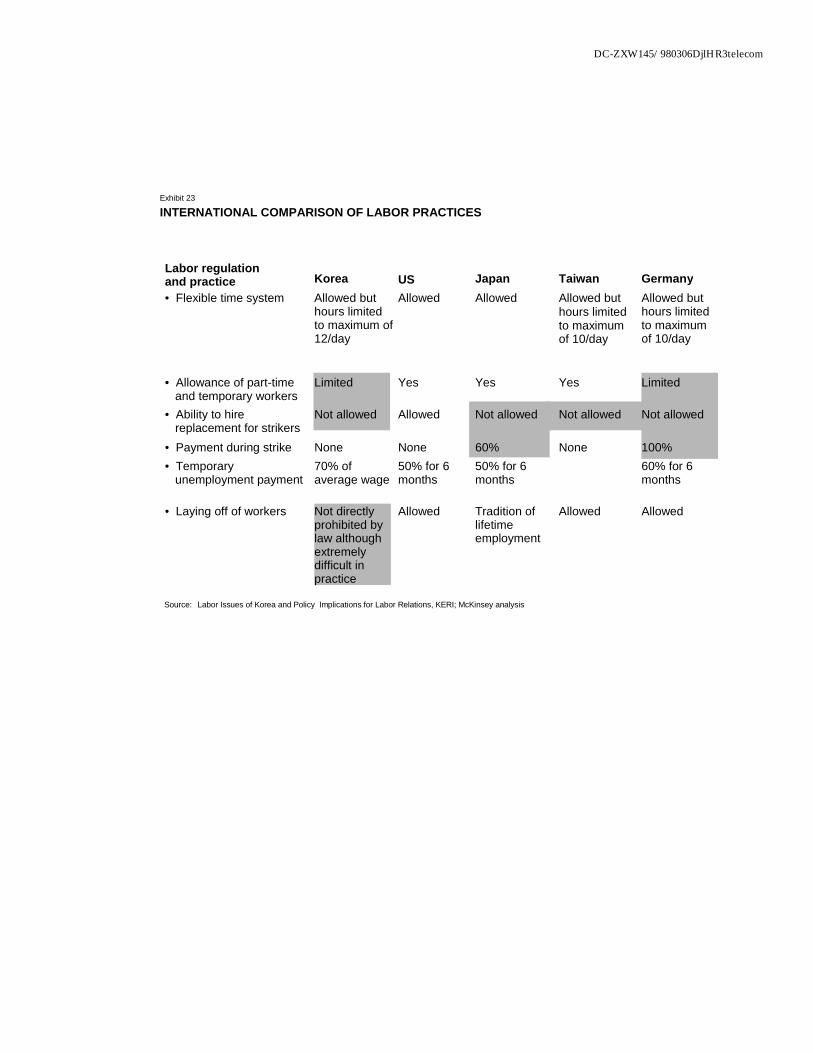
DC-ZXW145/980306DjlHR3telecom
INTERNATIONAL COMPARISON OF LABOR PRACTICES
Source: Labor Issues of Korea and Policy Implications for Labor Relations, KERI; McKinsey analysis
Labor regulationand practice Korea US Japan Taiwan Germany• Flexible time system Allowed but
hours limitedto maximum of12/day
Allowed Allowed Allowed buthours limitedto maximumof 10/day
Allowed buthours limitedto maximumof 10/day
• Allowance of part-timeand temporary workers
Limited Yes Yes Yes
• Ability to hirereplacement for strikers
Not allowed Allowed Not allowed Not allowed
• Payment during strike None None 60% None
Limited
Not allowed
100%• Temporary
unemployment payment70% ofaverage wage
50% for 6months
50% for 6months
60% for 6months
• Laying off of workers Not directlyprohibited bylaw althoughextremelydifficult inpractice
Allowed Tradition oflifetimeemployment
Allowed Allowed
Exhibit 23
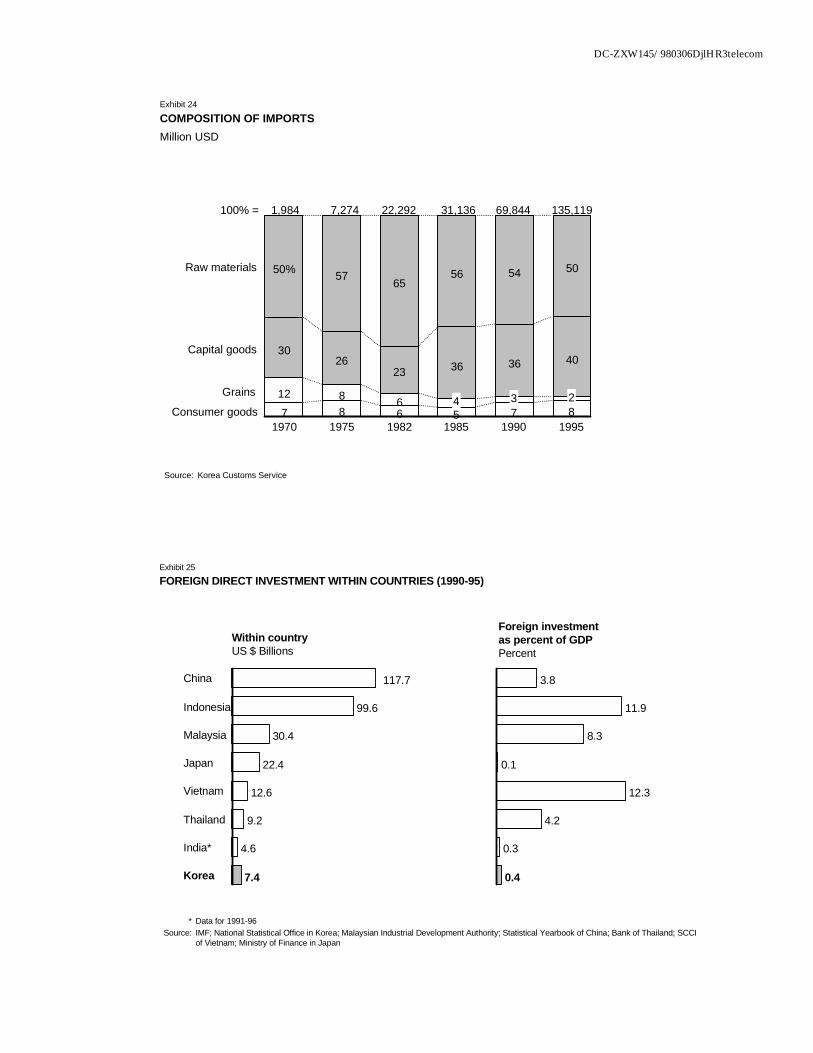
DC-ZXW145/980306DjlHR3telecom
COMPOSITION OF IMPORTSMillion USD
Raw materials 50% 57 6556 54 50
Capital goods 3026
23 36 36 40
Grains 12 8 6Consumer goods 7 8 6 7 8
1970 1975 1982 1985 1990 1995
Source: Korea Customs Service
Exhibit 24
100% = 1,984 7,274 22,292 31,136 69,844 135,119
4 3 25
FOREIGN DIRECT INVESTMENT WITHIN COUNTRIES (1990-95)
117.7
99.6
30.4
22.4
12.6
9.2
4.6
7.4
China
Indonesia
Malaysia
Japan
Vietnam
Thailand
India*
Korea
3.8
11.9
8.3
0.1
12.3
4.2
0.3
0.4
* Data for 1991-96Source: IMF; National Statistical Office in Korea; Malaysian Industrial Development Authority; Statistical Yearbook of China; Bank of Thailand; SCCI
of Vietnam; Ministry of Finance in Japan
Within countryUS $ Billions
Foreign investmentas percent of GDPPercent
Exhibit 25
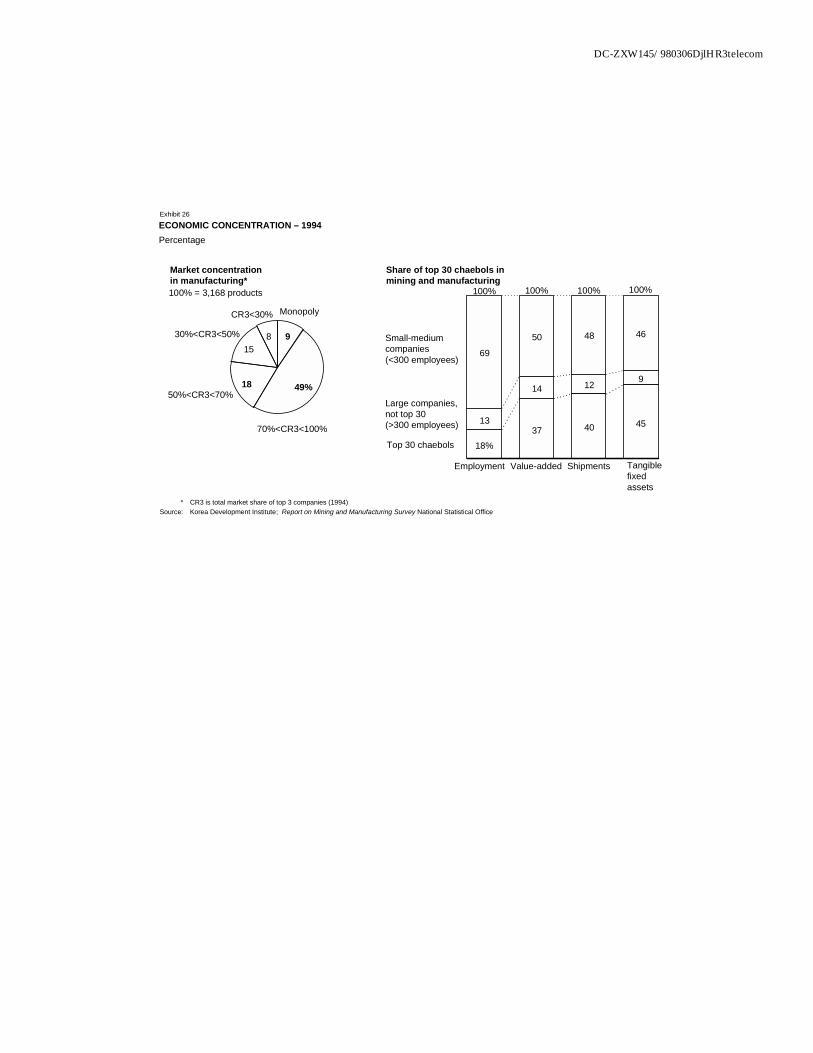
DC-ZXW145/980306DjlHR3telecom
ECONOMIC CONCENTRATION – 1994Percentage
* CR3 is total market share of top 3 companies (1994)Source: Korea Development Institute; Report on Mining and Manufacturing Survey National Statistical Office
Market concentration in manufacturing*
Monopoly
9
70%<CR3<100%
49%50%<CR3<70%
18
30%<CR3<50%15
CR3<30%
8
Share of top 30 chaebols in mining and manufacturing
Small-medium companies(<300 employees)
69
50 48 46
Large companies, not top 30(>300 employees) 13
14 12 9
Top 30 chaebols 18%37 40 45
Employment Value-added Shipments Tangible fixed assets
100% = 3,168 products
Exhibit 26
100% 100% 100% 100%
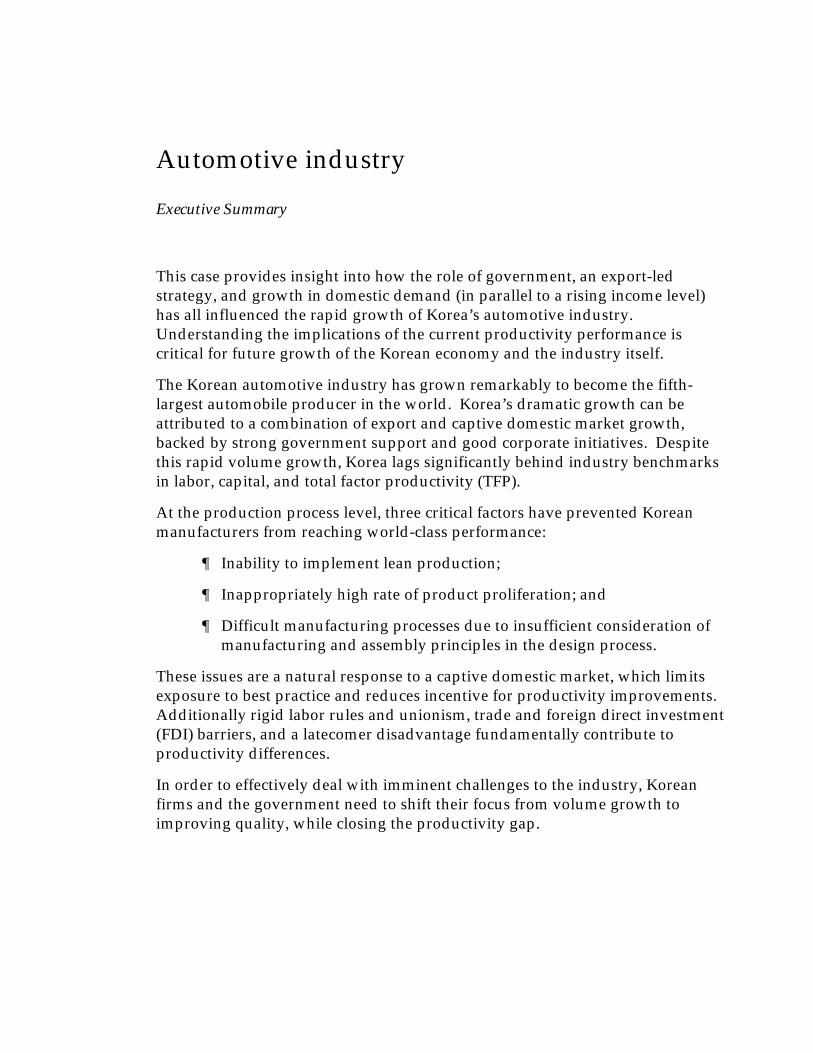
Automotive industry
Executive Summary
This case provides insight into how the role of government, an export-led strategy, and growth in domestic demand (in parallel to a rising income level) has all influenced the rapid growth of Korea’s automotive industry. Understanding the implications of the current productivity performance is critical for future growth of the Korean economy and the industry itself.
The Korean automotive industry has grown remarkably to become the fifth-largest automobile producer in the world. Korea’s dramatic growth can be attributed to a combination of export and captive domestic market growth, backed by strong government support and good corporate initiatives. Despite this rapid volume growth, Korea lags significantly behind industry benchmarks in labor, capital, and total factor productivity (TFP).
At the production process level, three critical factors have prevented Korean manufacturers from reaching world-class performance:
¶ Inability to implement lean production;
¶ Inappropriately high rate of product proliferation; and
¶ Difficult manufacturing processes due to insufficient consideration of manufacturing and assembly principles in the design process.
These issues are a natural response to a captive domestic market, which limits exposure to best practice and reduces incentive for productivity improvements. Additionally rigid labor rules and unionism, trade and foreign direct investment (FDI) barriers, and a latecomer disadvantage fundamentally contribute to productivity differences.
In order to effectively deal with imminent challenges to the industry, Korean firms and the government need to shift their focus from volume growth to improving quality, while closing the productivity gap.
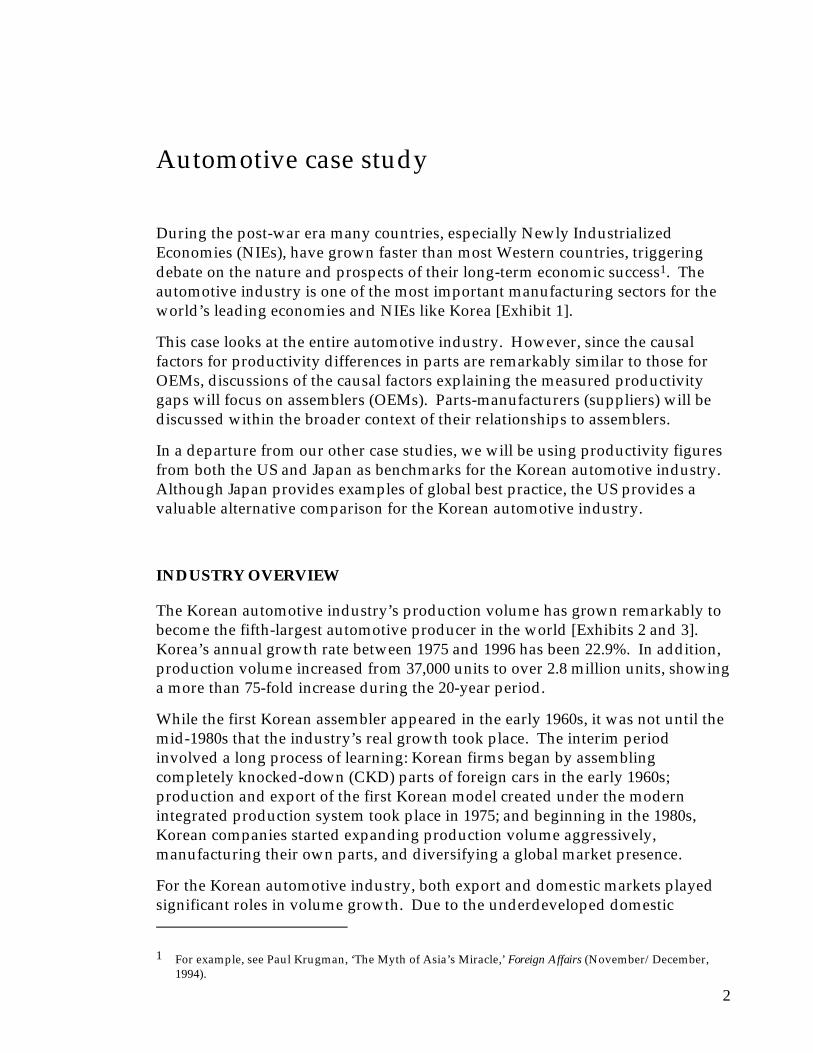
2
Automotive case study
During the post-war era many countries, especially Newly Industrialized Economies (NIEs), have grown faster than most Western countries, triggering debate on the nature and prospects of their long-term economic success1. The automotive industry is one of the most important manufacturing sectors for the world’s leading economies and NIEs like Korea [Exhibit 1].
This case looks at the entire automotive industry. However, since the causal factors for productivity differences in parts are remarkably similar to those for OEMs, discussions of the causal factors explaining the measured productivity gaps will focus on assemblers (OEMs). Parts-manufacturers (suppliers) will be discussed within the broader context of their relationships to assemblers.
In a departure from our other case studies, we will be using productivity figures from both the US and Japan as benchmarks for the Korean automotive industry. Although Japan provides examples of global best practice, the US provides a valuable alternative comparison for the Korean automotive industry.
INDUSTRY OVERVIEW
The Korean automotive industry’s production volume has grown remarkably to become the fifth-largest automotive producer in the world [Exhibits 2 and 3]. Korea’s annual growth rate between 1975 and 1996 has been 22.9%. In addition, production volume increased from 37,000 units to over 2.8 million units, showing a more than 75-fold increase during the 20-year period.
While the first Korean assembler appeared in the early 1960s, it was not until the mid-1980s that the industry’s real growth took place. The interim period involved a long process of learning: Korean firms began by assembling completely knocked-down (CKD) parts of foreign cars in the early 1960s; production and export of the first Korean model created under the modern integrated production system took place in 1975; and beginning in the 1980s, Korean companies started expanding production volume aggressively, manufacturing their own parts, and diversifying a global market presence.
For the Korean automotive industry, both export and domestic markets played significant roles in volume growth. Due to the underdeveloped domestic
1 For example, see Paul Krugman, ‘The Myth of Asia’s Miracle,’ Foreign Affairs (November/December, 1994).
3
market, Korea’s initial growth strategy was to export to less competitive countries in the Middle East and Southeast Asia, and then to North America by the mid-1980s. However, increased domestic demand, equaling about two-thirds of 1996 sales [Exhibit 4], supported rapid industry growth during the last decade. Some of this domestic demand can be attributed to the notable role of the Korean government in the development of the automotive industry. For the past three decades, the automotive industry has been regarded as a major national strategic industry of Korea and, during this period, the Korean government has promoted the industry through various incentive policies, restrictions of imports, and industry restructuring/regulating [Exhibit 5].
Three main players in the industry [Exhibit 6] account for over 95% of 1996 total production. All players have technological alliances with foreign players and compete in segments for passenger cars, jeeps, buses, and trucks. Hyundai is the biggest producer among the Korean OEMs, with 47% of domestic production, and Samsung plans to enter the market in 1998 in the passenger car segment.
LEAN PRODUCTION
Lean production, lean manufacturing, and agile production refer interchangeably to the innovative manufacturing process which has led to Toyota’s unrivaled productivity performance since the 1960s and has come to represent Toyota’s Production System (TPS). Lean production is defined in the APICS (American Production and Inventory Control Society) dictionary as “a philosophy of production that emphasizes the minimization of the amount of all resources, including time, used in the various activities of the enterprise.”
Lean production pursues an optimum streamlining of the production system by eliminating waste, building quality into the production process, and recognizing the principle of cost reduction. To accomplish this, all employees – from top management down – share general knowledge and skill to eliminate “muda” (waste) in the areas of overproduction, inventory management, and movement of workers. Quality assurance is designed to provide immediate feedback and identify defects at the source. The concept of Just-In-Time (JIT) is aimed at producing only what is needed, when it is needed, to the level of quality needed.
Lean producers employ teams of multi-skilled workers at all levels of the organization and use highly flexible, increasingly automated machines to produce volumes of products in potentially enormous variety. Flexibility in functions and tasks of workers and machines (e.g., Toyota’s workers inspect parts, install them, and conduct quality checks) enables significant savings of labor in the production process. Lean producers also rely on close coordination with their suppliers (suppliers participate in the design of parts and have information-sharing practices that ensure the delivery of parts on a JIT basis).
4
METHODOLOGY
The sheer breadth of product range in vehicles and parts produced makes it impossible to use a physical measure of output such as number of parts and vehicles. Therefore, we have measured industry output as value added, converted at a car-specific purchasing power parity (PPP) exchange rate that removes pure price differences across the markets [Exhibit 7]. This roughly adjusts for output mix differences by valuing cars from larger-size classes as more output than smaller cars. The PPP also adjusts for average differences in output quality traceable to actual production differences based on price premiums that consumers are willing to pay for different cars. Industry coverage We have matched the industry definitions as closely as possible to include parts and assembly. For Korea, we use SIC 34 (motor vehicles and trailers) for the whole industry, and SIC 341 (motor vehicle engines and vehicles) and SIC 342 (automotive body and trailers) for the assembly, plus SIC 343 (motor vehicle parts) for parts only. For the US, we use SIC 371 (motor vehicles and equipment) plus SIC 3465 (automotive stampings) for the whole industry, and SIC 3714 (motor vehicle parts and accessories) plus SIC 3465 for parts only. For Japan, we use SIC 311 for the whole industry and SIC 3113 for parts only. Output We have standardized to the US Census definition of value added (essentially product shipment value minus raw material and energy costs). For Korea and Japan we had to add back depreciation. Value-added figures were converted to 1995 real values using each country’s producer price index for autos. Capital services For capital, we have constructed standardized capital stocks for each country based on historic investments on new structures and equipment. To do so, we summed the previous 12 years of expenditures on new equipment and tooling and 31 years of expenditures on new structures. These service lives are approximately those used in the US. Land costs and rent is not included. We then used the OECD PPPs for structures and for machinery and equipment to translate capital stocks into common currency. Capital services are obtained by dividing the stock by the respective service life.
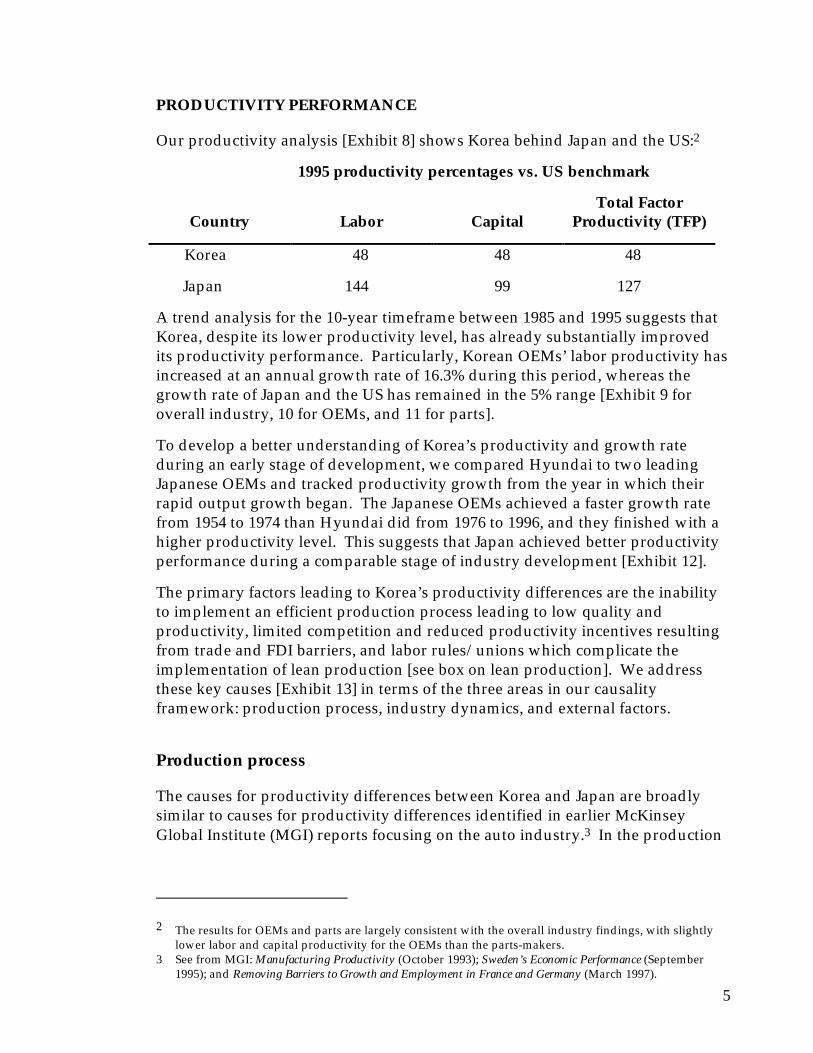
5
PRODUCTIVITY PERFORMANCE
Our productivity analysis [Exhibit 8] shows Korea behind Japan and the US:2
1995 productivity percentages vs. US benchmark
Country
Labor
Capital
Total Factor Productivity (TFP)
Korea 48 48 48
Japan 144 99 127
A trend analysis for the 10-year timeframe between 1985 and 1995 suggests that Korea, despite its lower productivity level, has already substantially improved its productivity performance. Particularly, Korean OEMs’ labor productivity has increased at an annual growth rate of 16.3% during this period, whereas the growth rate of Japan and the US has remained in the 5% range [Exhibit 9 for overall industry, 10 for OEMs, and 11 for parts].
To develop a better understanding of Korea’s productivity and growth rate during an early stage of development, we compared Hyundai to two leading Japanese OEMs and tracked productivity growth from the year in which their rapid output growth began. The Japanese OEMs achieved a faster growth rate from 1954 to 1974 than Hyundai did from 1976 to 1996, and they finished with a higher productivity level. This suggests that Japan achieved better productivity performance during a comparable stage of industry development [Exhibit 12].
The primary factors leading to Korea’s productivity differences are the inability to implement an efficient production process leading to low quality and productivity, limited competition and reduced productivity incentives resulting from trade and FDI barriers, and labor rules/unions which complicate the implementation of lean production [see box on lean production]. We address these key causes [Exhibit 13] in terms of the three areas in our causality framework: production process, industry dynamics, and external factors.
Production process
The causes for productivity differences between Korea and Japan are broadly similar to causes for productivity differences identified in earlier McKinsey Global Institute (MGI) reports focusing on the auto industry.3 In the production
2 The results for OEMs and parts are largely consistent with the overall industry findings, with slightly lower labor and capital productivity for the OEMs than the parts-makers.
3 See from MGI: Manufacturing Productivity (October 1993); Sweden’s Economic Performance (September 1995); and Removing Barriers to Growth and Employment in France and Germany (March 1997).
6
process, key factors4 in the Korean industry contributing to Japan’s advantage are an inefficient organization of functions and tasks, design for manufacturing and assembly (DFMA), and product proliferation and a lack of marketing.
Organization of functions and tasks The fundamental cause of Korean low productivity is an inability to implement the principles of lean production in the assembly process. While no definitive means exist for measuring how well a company/country implements lean production, these symptoms suggest Korea’s lack of success:
High defect and rework ratio on the line. Korean plants have high defects during the production process, thus a high rework ratio. Successful Japanese lean manufacturers target for “zero defects,” but the number of plant-level defects in Korean plants are over twice the level of Japanese plants [Exhibit 14]. High defect and rework ratios lead to higher material cost, longer working hours, and, eventually, lower quality vehicles [Exhibit 15].
The high defect and rework ratio can be attributed to Korean firms’ volume-quality tradeoff: i.e., Korean OEMs’ focus on building volume as quickly as possible. As our interviewees commonly pointed out, there was no leisure for sophistication in quality control, planning, and management when “whatever made were sold.”
Relative absence of multi-tasked jobs. Korea’s strong unions have hindered effective implementation of lean production with respect to multi-tasked jobs. Continuous improvement activities and training workers to perform multiple tasks reduce unnecessary labor hours and ultimately achieve a minimum efficient staffing level while producing high quality vehicles. However, Korean unions have been effective in preventing the adoption of multi-tasked jobs, resulting in higher staffing levels. Consequently, Korean firms have significantly more5 direct and indirect labor hours spent on the shop floor than those from other countries [Exhibit 16].
Cooperation between OEMs and suppliers. Less-than-optimal cooperation between OEMs and suppliers also limits the implementation of lean production. The uniquely tiered structure of Japanese OEM-supplier relationships leads to direct interactions between OEMs and only a few suppliers. As a result, transactions are less complex and the resulting deeper relationships lead to a close collaboration between OEMs and suppliers in the design process. Some barriers exist for developing these types of relationships in Korea:
4 Although we have identified the spread of lean production techniques as the single most important causal factor for productivity differences among advanced countries, we will now attempt to balance the influence of the Korean auto industry’s growth against the need for lean production.
5 One striking internal report of a leading Korean OEM suggested recently that there are over 5,500 excess employees among 42,000 employees in its major plant complex.
7
¶ Lower technological capability and scale. Korean suppliers’ smaller scale and lack of R&D capability inevitably leads to lower participation by suppliers in the design process and longer time for new parts development [Exhibit 17]. Unlike Japanese suppliers, most Korean suppliers are unable to design parts on their own, and are often delivered drawing and specifications from the OEMs to undertake only the manufacturing tasks. This issue is further complicated by the fact that OEMs frequently come up with design changes, and suppliers are not technologically capable to flexibly meet unexpected needs.
¶ Lower OEM labor productivity. The suppliers’ lack of technological capability in turn lowers OEM labor productivity. This is done in two ways: (1) OEMs are compelled to outsource CKD parts from their suppliers and carry out sub-assembly functions, effectively leading to higher direct labor hours and more complex assembly process for the OEM to perform; (2) Korean OEMs have a large indirect labor force to debottleneck skill and technology issues of the suppliers [Exhibit 18].
Design for manufacturing and assembly (DFMA) Product designs that facilitate manufacturability are another key factor explaining productivity differences. A key measure of DFMA is “underskin complexity” or underlying complexity such as number of common parts, welding spots, and option content. Successful OEMs of Japan have reduced underskin complexity, allowing manufacturers to handle model complexity without sacrificing productivity.6 Moreover, the Japanese practice of offering more standard options reduces variability, smoothes production, and allows complex cars to be built efficiently.
As customers demand a wider variety of options, the increase of common parts becomes crucial for OEMs to cut cost and labor productivity. A recent study result shows that Korean OEMs have less common parts across different models and higher underskin complexity, which leads to a lower manufacturability ranking [Exhibit 19]. This may be attributed to the short time in which Korean OEMs have been producing their “own-designed” vehicles. Inexperienced OEMs have followed the path from assembling foreign models and developing indigenous models under foreign licenses to building completely indigenous models (e.g., Hyundai, Korea’s new product development leader, has only recently started producing indigenous engines [Exhibit 20]).
Role and authority of project managers. Experts have long recognized the crucial role of project managers in the development process – well-managed projects under strong managers have proven to reduce lead time, control quality more effectively, and produce designs easier to manufacture. Japanese OEMs have traditionally focused on giving more accountability to their project
6 For example, Suzuki Alto and Wagon-R radically differ in appearance but share about 60% of the parts.
8
managers, and the shift to stronger managers witnessed by the US OEMs in recent years is another evidence of its importance. Project managers in Japan have three essential powers which contribute to their abilities to successfully lead projects: control over the budget, authority to control human resources, and the right to veto design changes suggested from above. These authorities are weak or non-existent for Korean project managers. Furthermore, Korean project teams still rely on functional or weakly cross-functional teams [Exhibit 21] – an approach that Japanese and US companies have found less effective.
Quality trade-off. Finally, our interview findings suggest that among the three key factors in new product development (schedule, cost and quality), Korean OEMs focus on meeting the schedule, with cost as the second priority – leaving quality often unresolved [Exhibit 22]. Unfortunately, this focus on speed and growth leads to lower quality and costly rework. Korean OEMs can afford this lack of emphasis on quality because new products can be tested in the relatively safe, less quality-exposed domestic consumer market for a year before their introduction to the overseas market.
Product proliferation and lack of marketing To exacerbate Korea’s DFMA challenges, Korean OEMs rapidly increased the number of available models through platform diversification during the 1990s. The result is that Korean OEMs have introduced a large number of disparate platforms, rather than creating model variations from an individual platform to leverage investments [Exhibit 23]. This effectively means higher R&D and material cost, fewer common parts across different models, more complicated production process, and low capital productivity from assembly assets. The rapid product proliferation results from several factors:
“Me-too mentality.” As in other Korean industries, Korean auto manufacturers are too focused on copying competitors’ successful products. As a result, they fail to sufficiently focus on marketing and differentiating its products. Thus, Korean firms offer product lines that are remarkably alike, and few Korean models are uniquely positioned against the competitors.
Legacy of importing CKD models from abroad. Korea’s approach of assembling CKD models helped create the platform proliferation problems. When a Korean manufacturer needs a new model, they import a new platform from abroad (vs. developing or importing a model that builds off an existing platform). This results in a low model per platform ratio of roughly 1 model per platform compared to roughly 3+ for Japanese and European manufacturers.
Capacity utilization and scale Industry experts have found that scale is becoming less of a differentiating factor as lean manufacturers have the ability to quickly change the set-up of the line. However, the impact of capacity in Korea is linked to the platform/model proliferation issue discussed above. Due to the desire among Korean manufacturers to be broadline companies, Korean companies have expanded
9
into virtually all car segments. This creates a participation problem in lower volume segments, where Korea is unable to gain sufficient volumes to achieve high productivity. Korea’s average production volume for large/premium cars and sports utility vehicles (SUVs) are 16,000 and 35,000 units annually in 1996 – a volume that is significantly lower than the typical 100,000+ required for economic performance. This problem shows up operationally as lower capacity utilization for these production assets.
Non-differentiating factors in the production process By 1995, the capital intensity of Korean plants had increased at an annual growth rate of 13.7% to achieve a level comparable to the US and roughly 50% behind Japan [Exhibit 24]. Consequently, the productivity gap is not due to capital levels. Nor do there seem to be labor skill issues in Korea. Most Korean production workers have achieved an education level comparable to Japanese workers, and no evidence suggests that Korean workers have intrinsic issues in labor skill acquirement. In fact, since Japanese OEMs were able to successfully transfer lean production to achieve high productivity in the US, the UK, and Spain, it is unlikely that local skill issues prevent productivity improvement.
Industry dynamics
Due to the presence of the main innovator of lean production (Toyota) in its home market, Japanese firms have been exposed to intense direct competition in both domestic and export markets. In turn, US firms were exposed to best practice as Japanese companies exported their cars to the US and ultimately built transplant factories in the US.
While exposure to and competition with best practice are in place for both the US and Japan, Korea has been virtually shielded from best practice competition. Like European countries in the 1980s – and for many still in the 1990s – Korea has no transplants. Furthermore, Korea is further protected from entry of foreign products through import quotas and tariffs in the domestic market.
Domestic competitive intensity is much lower in Korea due to a highly concentrated market situation. The top three OEMs’ market share account for nearly 95% in Korea, with Hyundai occupying around 48% of the total [please refer back to Exhibit 6].
External factors
Among external factors, we find trade and FDI barriers to be the most important differentiators.
10
Trade/FDI barriers Existence of tariff barriers has been a key source of Korea’s lagging productivity performance. The tariff on imported cars was 50% in 1985, and has seen some gradual reduction over the past decade. However, the presence of import cars is still minimal – in 1996, only a little over 10,000 foreign cars were sold in Korea, occupying less than 1% of the total sales in the country [Exhibit 25]. Moreover, other non-tariff barriers in areas like taxation, distribution and marketing, and governmental policies have further constrained import and sales of foreign vehicles [Exhibit 26]. Particularly, a policy for “securing multilateral import sources” puts import restriction on Japanese cars and has virtually sealed off best practice competition in the home market.
Labor rules and unionism Korean labor rules have had two primary impacts on the auto industry:
¶ Inability to deploy workers to multi-tasked jobs. Korean unions have long focused on job categories, craft barriers, and working hours as the basis of negotiations. This approach inevitably led to the preservation of function-specific tasks and prevented manufacturers from implementing the multi-tasking required for lean production (e.g., workers who inspect, install, and conduct quality control). Japanese and some US manufacturers were not burdened with this situation, since their unions focus on high wage and job security demands as the primary basis for negotiations.
¶ Inability to reduce working hours. Because Korean unions have long been against layoffs, Korean manufacturers have been forced to keep excess workers on the assembly line. In addition, unions continue to fight for minimum legal working hours – rebelling against reductions in actual working hours per shift while demanding more workers on line in the name of “better labor conditions.”
Corporate governance rules Korean chaebols have long operated under a strategy of volume expansion and business area diversification. This mentality has led Korean companies to proliferate platforms/models, while relatively overlooking productivity and profits. Consequently, Korean auto industry virtually has never earned their cost of capital [Exhibit 27]. Improving quality would be a much more important value creation lever than growing volume.
Top-down corporate culture is not something unique in Korea, but chaebols often exhibit a strong hierarchical corporate culture which often leads to bureaucratic immobility. This has impact on all areas in the production process, especially the planning and product design phase, where sudden changes in new product design and production schedule are highly expensive.
11
Less differentiating external factors Latecomer disadvantage. The auto industry is an example of an industry with a steep learning curve. Unlike other manufacturing industries (e.g., steel and dairy) where skill is embedded in technology and can be purchased from equipment suppliers, auto industry is a “learn-by-doing” industry, where manufacturing skill and know-how (process technology) are acquired over a significant time period. Despite the fact that Korea has invested heavily in capital and is now as capital intensive as the US, its skill base (and consequently its labor productivity) lags far behind. This disadvantage is especially troublesome since the competitors continue to make rapid progress – Korea does not have the luxury to learn by doing since by the time it catches up to where Japan was, Japanese manufacturers have moved on to redefine best practice.
Competition/concentration rules. Traditionally Korean government has played a significant role in regulating the industry structure. The main objective was to develop the auto industry as quickly as possible without proliferation of players that may limit the scale build-up of OEMs. This in turn reduced the level of competition and the incentive for productivity increase. In the early 1980s, after the Second Oil Shock, Korean OEMs were designated with specific products to manufacture, and Samsung initially was not allowed to enter the market due to “overcapacity” reasons. This policy became less appreciated as the industry grew and competition became more important than volume growth, and the government accordingly relaxed it.
Non-differentiating external factors We found negligible or no differences on productivity from fiscal factors, factor price, infrastructure, and effects from up/downstream industries.
CHALLENGES AND IMPLICATIONS
We have seen in the previous sections that Korea grew “big but not strong,” and the seemingly high-volume growth has masked underlying weaknesses. Productivity, both in labor and capital, is substantially lower than the benchmarks, and output quality undermines the high-volume growth figures. Furthermore, in the future, Korean OEMs will face a number of fundamental challenges to their previous success in volume growth [Exhibit 28]:
¶ Competition at home. The protected home market that fueled the growth of Korean firms is no longer secure. Because foreign car companies will be able to compete freely in the Korean domestic market, Korean firms will face intense competition with the reduction of tariffs and elimination of import diversification regulations.
12
Particularly, Japanese cars will be allowed to enter by 19987 and compete in mid-size segments, where previously Korean firms enjoyed full protection. Competition among domestic producers will be further intensified by the recent consolidation of Daewoo and Ssangyong and the impending entrance of Samsung into the auto industry. Depending on the fate of Kia, the domestic market structure could be further consolidated to create stronger competitors.
¶ Global overcapacity. Global overcapacity has been forecast over the next five years, and competition at the global level is likely to be more intense. One report suggests that only the top ten OEMs of the world are likely to survive into the next century, and current aggressive investment by Korean firms in capacity expansion will go through some hard tests.
In view of the challenges faced by this industry, Korean firms, the government, and the labor unions should work jointly to increase productivity and quality of products in the following ways.
Government
The government used to play a role in helping protect and build the Korean auto industry. Such “infant industry” protectionist schemes may have been justified in the past, but given Korea’s standing as the 5th largest auto manufacturer in the world, it would be difficult to argue that Korea’s auto industry is still an infant in need of protection. Consequently, the government’s role in the auto industry going forward should be limited to ensuring a level playing field for all competitors along with the removal of all external barriers to productive manufacturing.
To ensure a level playing field, the government must move quickly to remove the transparent and non-transparent barriers. This involves reducing import tariffs and eliminating the obstacles to the growth of imports (e.g., restrictions on foreign ownership of car dealerships). Furthermore, elimination of the import diversification practices that have effectively kept Japanese imports from entering must be quickly pursued.
To ensure that Korean manufacturers can pursue lean manufacturing, the government must take actions to enable lay-offs. Until Korean companies can release excess workers, labor and capital productivity will be kept at low levels.
7 Japanese cars made in Japan are to enter in 1999, and Japanese cars produced in their transplant sites are allowed in 1998. The recent negotiations with the International Monetary Fund may accelerate this market opening.
13
Unions
It appears that the impact of unionism is one of the fundamental barriers for productivity improvement. Unions may have been right in the past to demand better wages and working conditions. On the other hand, the unions’ confrontational attitude and rigid negotiating stance on job descriptions is detrimental to efficient manufacturing process, which could ultimately benefit the remaining workers.
Unions’ focus on job classification has resulted in unproductive manufacturing and the demise of manufacturers in Europe and the US. The approach that Japanese and some US unions have taken, focusing on maximizing wages and job security for members, has proven to be more effective. It has enabled companies to achieve lean production and manufacturing gains, while increasing demand for products, which has ultimately led to the loss of fewer jobs compared to the unions’ French and Italian counterpart.
Corporations
The primary challenges for achieving productivity gains rest with Korean companies, who have to make a host of changes to ultimately develop the ability to implement lean production.
Management incentives Firms must shift away from the old volume-oriented mindset which rewarded managers for producing more cars rather than maximizing profits. Firms should realize that the miraculous volume growth of the past cannot be replicated nor is it desirable in the future. The only way to succeed in the future is to focus on high-quality cars that can compete with the Japanese and to maximize labor and capital productivity.
Developing world-class skills Korea no longer has the luxury of being shielded from the world’s best practices. As a result, Korean firms can only succeed in the future if world-class skills in critical areas are developed:
¶ Lean manufacturing. The ability to implement lean production is the critical skill factor that enables Toyota and Japanese companies to produce high quality cars at significantly lower costs than the competitors. US and European companies who have been unable to fully implement lean products are continuing to suffer when competing against Japanese companies. Unless Korean manufacturers move rapidly to develop this capability, the current productivity level will be no match for Japanese competitors once the domestic Korean market opens.
14
¶ Design for manufacturing. Korean firms need to rapidly enhance their DFMA capabilities. This involves a wide-ranging set of changes that include: (1) bolstering the role of project teams/managers; (2) adopting design approaches to simplify designs, reduce costs, and maximize sharing of parts across models; and (3) enhancing the abilities of and working approaches with parts suppliers.
Korean manufacturers need to realize the impact of deregulation and liberalization in the domestic market. If Korean firms are not prepared to compete with quality products at competitive prices, the impact of market opening could lead to the demise of the firms themselves. Firms should seek measures to improve quality and productivity with a long-term perspective, while building better relationship with the workers.
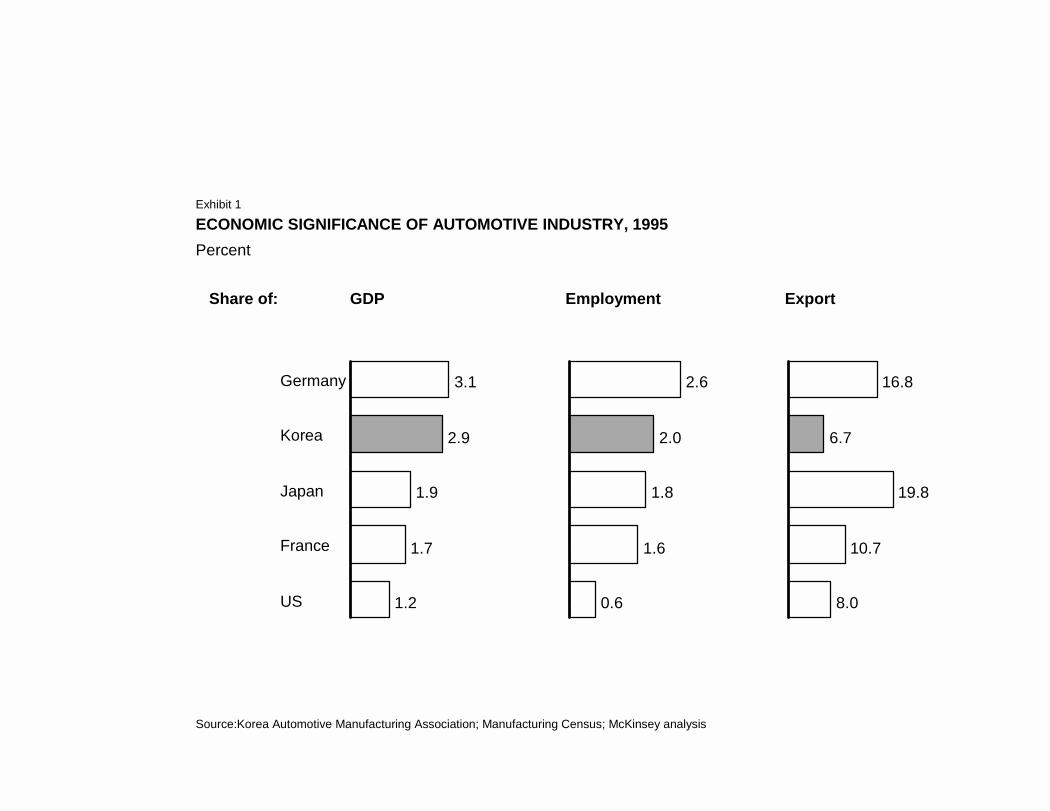
ECONOMIC SIGNIFICANCE OF AUTOMOTIVE INDUSTRY, 1995Percent
Source:Korea Automotive Manufacturing Association; Manufacturing Census; McKinsey analysis
3.1
2.9
1.9
1.7
1.2
Germany
Korea
Japan
France
US
2.6
2.0
1.8
1.6
0.6
16.8
6.7
19.8
10.7
8.0
GDP Employment ExportShare of:
Exhibit 1
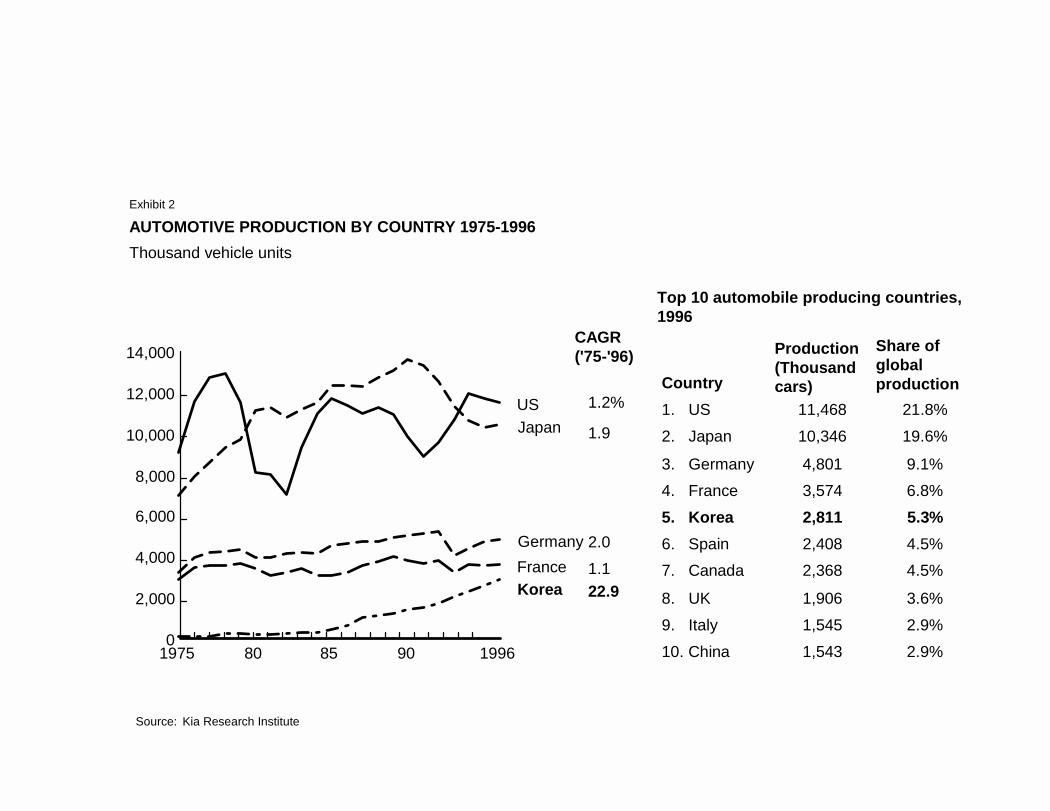
AUTOMOTIVE PRODUCTION BY COUNTRY 1975-1996Thousand vehicle units
Source: Kia Research Institute
0
2,000
4,000
6,000
8,000
10,000
12,000
14,000
KoreaFranceGermany
JapanUS
1975 80 85 90 1996
1.1
1.2%
1.9
2.0
22.9
CAGR('75-'96)
Country
Production(Thousand cars)
Share of global production
1. US 11,468 21.8%2. Japan 10,346 19.6%
3. Germany 4,801 9.1%4. France 3,574 6.8%5. Korea 2,811 5.3%6. Spain 2,408 4.5%7. Canada 2,368 4.5%
8. UK 1,906 3.6%9. Italy 1,545 2.9%10. China 1,543 2.9%
Top 10 automobile producing countries, 1996
Exhibit 2
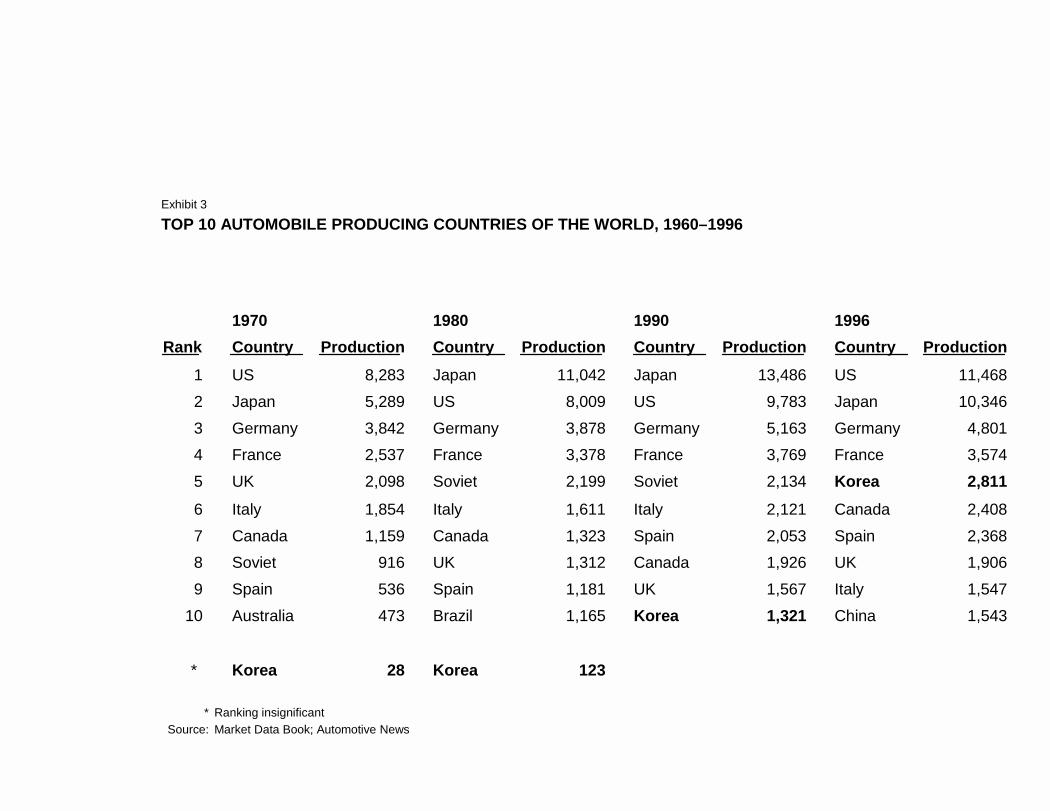
TOP 10 AUTOMOBILE PRODUCING COUNTRIES OF THE WORLD, 1960–1996
* Ranking insignificantSource: Market Data Book; Automotive News
1970 1980 1990 1996Rank Country Production Country Production Country Production Country Production
1 US 8,283 Japan 11,042 Japan 13,486 US 11,4682 Japan 5,289 US 8,009 US 9,783 Japan 10,3463 Germany 3,842 Germany 3,878 Germany 5,163 Germany 4,8014 France 2,537 France 3,378 France 3,769 France 3,5745 UK 2,098 Soviet 2,199 Soviet 2,134 Korea 2,8116 Italy 1,854 Italy 1,611 Italy 2,121 Canada 2,4087 Canada 1,159 Canada 1,323 Spain 2,053 Spain 2,3688 Soviet 916 UK 1,312 Canada 1,926 UK 1,9069 Spain 536 Spain 1,181 UK 1,567 Italy 1,547
10 Australia 473 Brazil 1,165 Korea 1,321 China 1,543
* Korea 28 Korea 123
Exhibit 3
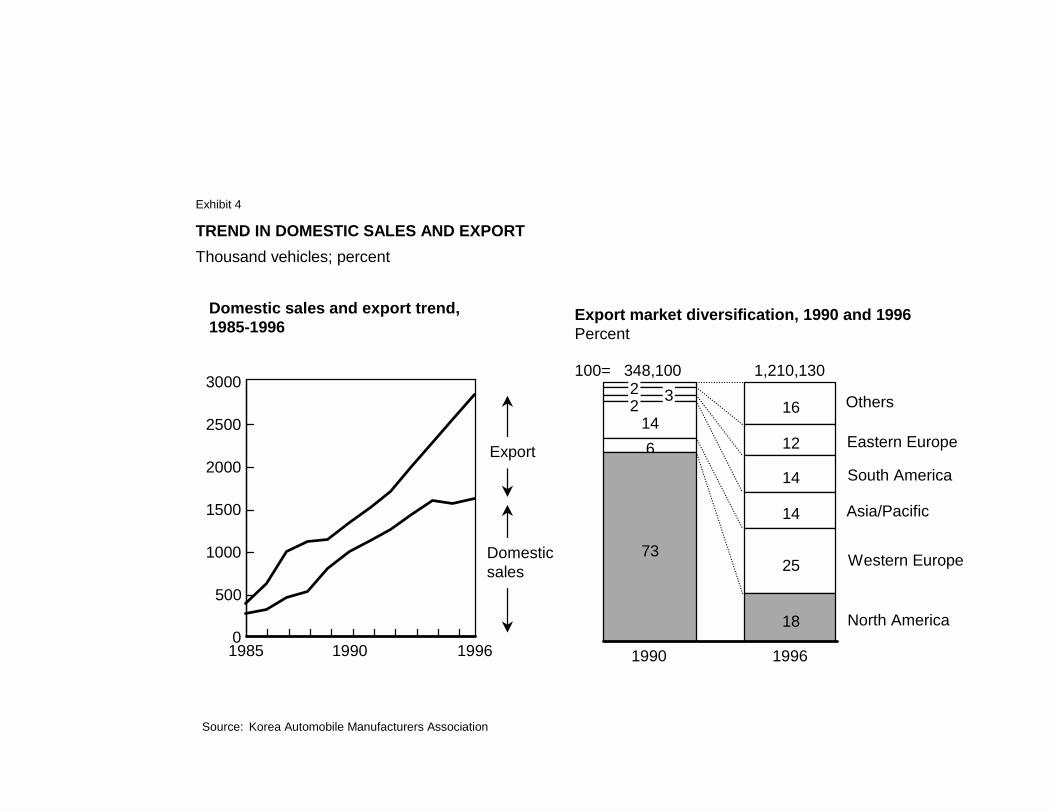
TREND IN DOMESTIC SALES AND EXPORTThousand vehicles; percent
Source: Korea Automobile Manufacturers Association
0
500
1000
1500
2000
2500
3000
1985 1990 1996
100=
Others16
Eastern Europe12
South America14
Asia/Pacific
14
14
Western Europe
6
25
North America
73
18
1990 1996
348,100 1,210,130
Domestic sales and export trend, 1985-1996
Export market diversification, 1990 and 1996Percent
Domestic sales
Export
Exhibit 4
2 32
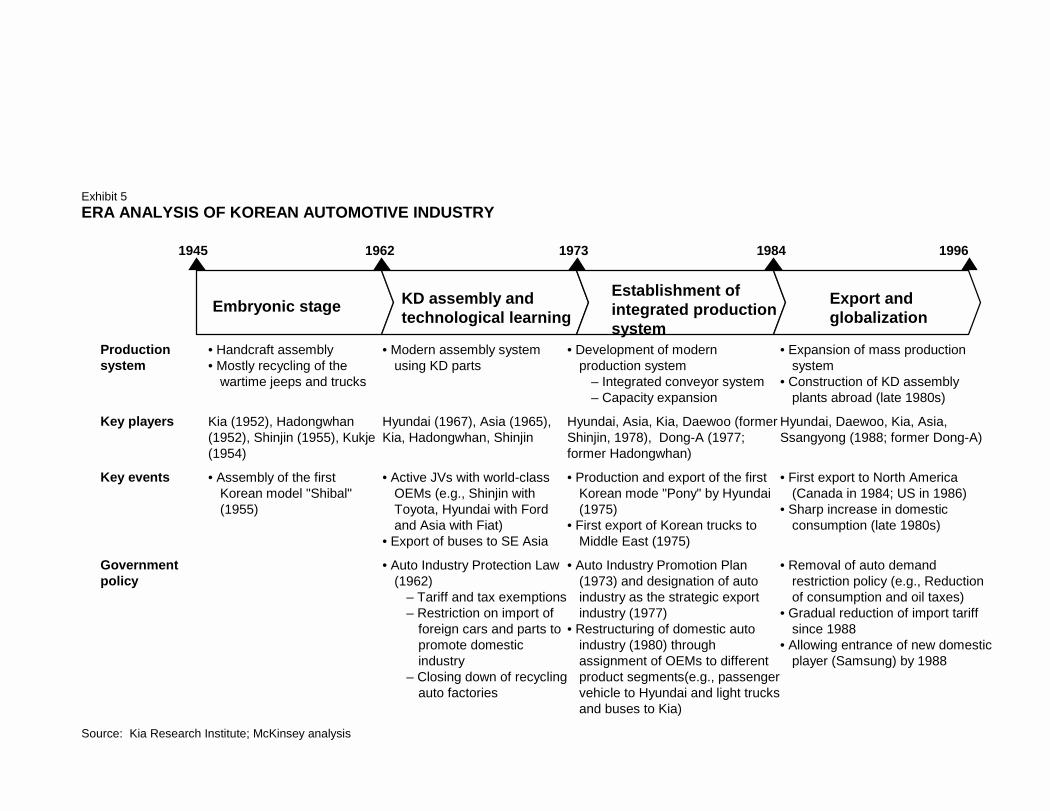
Production system
• Handcraft assembly• Mostly recycling of the
wartime jeeps and trucks
• Modern assembly system using KD parts
• Development of modern production system
– Integrated conveyor system– Capacity expansion
• Expansion of mass production system
• Construction of KD assembly plants abroad (late 1980s)
Key players Kia (1952), Hadongwhan (1952), Shinjin (1955), Kukje (1954)
Hyundai (1967), Asia (1965), Kia, Hadongwhan, Shinjin
Hyundai, Asia, Kia, Daewoo (former Shinjin, 1978), Dong-A (1977; former Hadongwhan)
Hyundai, Daewoo, Kia, Asia, Ssangyong (1988; former Dong-A)
Key events • Assembly of the first Korean model "Shibal" (1955)
• Active JVs with world-class OEMs (e.g., Shinjin with Toyota, Hyundai with Ford and Asia with Fiat)
• Export of buses to SE Asia
• Production and export of the first Korean mode "Pony" by Hyundai (1975)
• First export of Korean trucks to Middle East (1975)
• First export to North America (Canada in 1984; US in 1986)
• Sharp increase in domestic consumption (late 1980s)
Government policy
• Auto Industry Protection Law (1962)
– Tariff and tax exemptions – Restriction on import of
foreign cars and parts to promote domestic industry
– Closing down of recycling auto factories
• Auto Industry Promotion Plan (1973) and designation of auto industry as the strategic export industry (1977)
• Restructuring of domestic auto industry (1980) through assignment of OEMs to different product segments(e.g., passenger vehicle to Hyundai and light trucks and buses to Kia)
• Removal of auto demand restriction policy (e.g., Reduction of consumption and oil taxes)
• Gradual reduction of import tariff since 1988
• Allowing entrance of new domestic player (Samsung) by 1988
ERA ANALYSIS OF KOREAN AUTOMOTIVE INDUSTRY
Source: Kia Research Institute; McKinsey analysis
Embryonic stage KD assembly and technological learning
Establishment of integrated production system
Export and globalization
1945 1962 1973 1984 1996
Exhibit 5
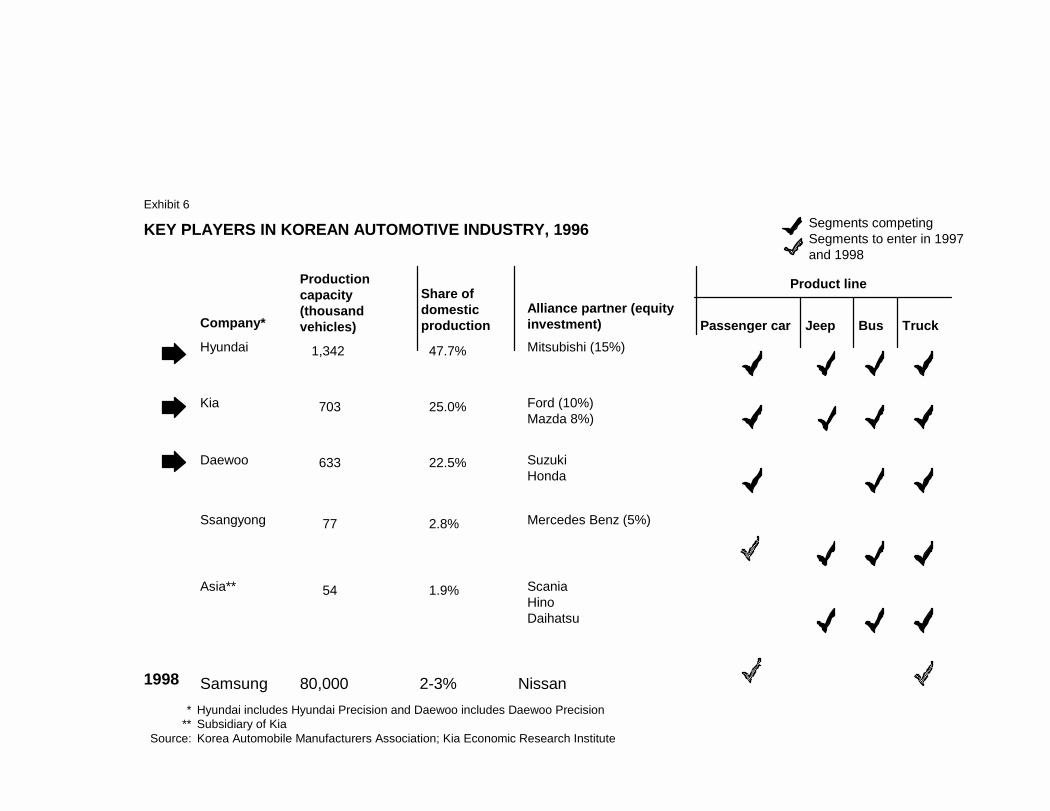
Company*
Production capacity (thousand vehicles)
Share of domestic production
Alliance partner (equity investment) Passenger car Jeep Bus Truck
Hyundai 1,342 47.7% Mitsubishi (15%)
Kia 703 25.0% Ford (10%)Mazda 8%)
Daewoo 633 22.5% SuzukiHonda
Ssangyong 77 2.8% Mercedes Benz (5%)
Asia** 54 1.9% ScaniaHinoDaihatsu
Product line
KEY PLAYERS IN KOREAN AUTOMOTIVE INDUSTRY, 1996
* Hyundai includes Hyundai Precision and Daewoo includes Daewoo Precision** Subsidiary of Kia
Source: Korea Automobile Manufacturers Association; Kia Economic Research Institute
Samsung 80,000 2-3% Nissan1998
Segments competingSegments to enter in 1997and 1998
Exhibit 6
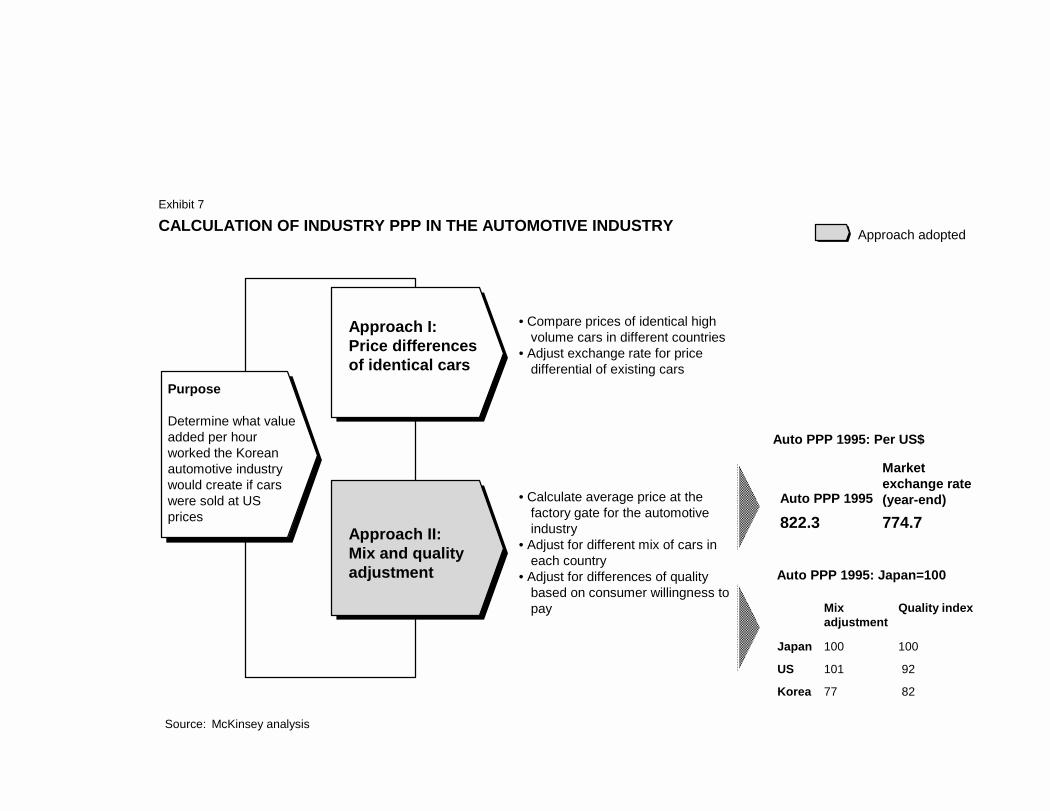
CALCULATION OF INDUSTRY PPP IN THE AUTOMOTIVE INDUSTRY
Source: McKinsey analysis
• Calculate average price at the factory gate for the automotive industry
• Adjust for different mix of cars in each country
• Adjust for differences of quality based on consumer willingness to pay
• Compare prices of identical high volume cars in different countries
• Adjust exchange rate for price differential of existing cars
Approach II:Mix and quality adjustment
Approach I:Price differences of identical cars
Purpose
Determine what value added per hour worked the Korean automotive industry would create if cars were sold at US prices
Auto PPP 1995
Market exchange rate (year-end)
822.3 774.7
Auto PPP 1995: Per US$
Approach adopted
Mix adjustment
Quality index
Japan 100 100
US 101 92
Korea 77 82
Auto PPP 1995: Japan=100
Exhibit 7
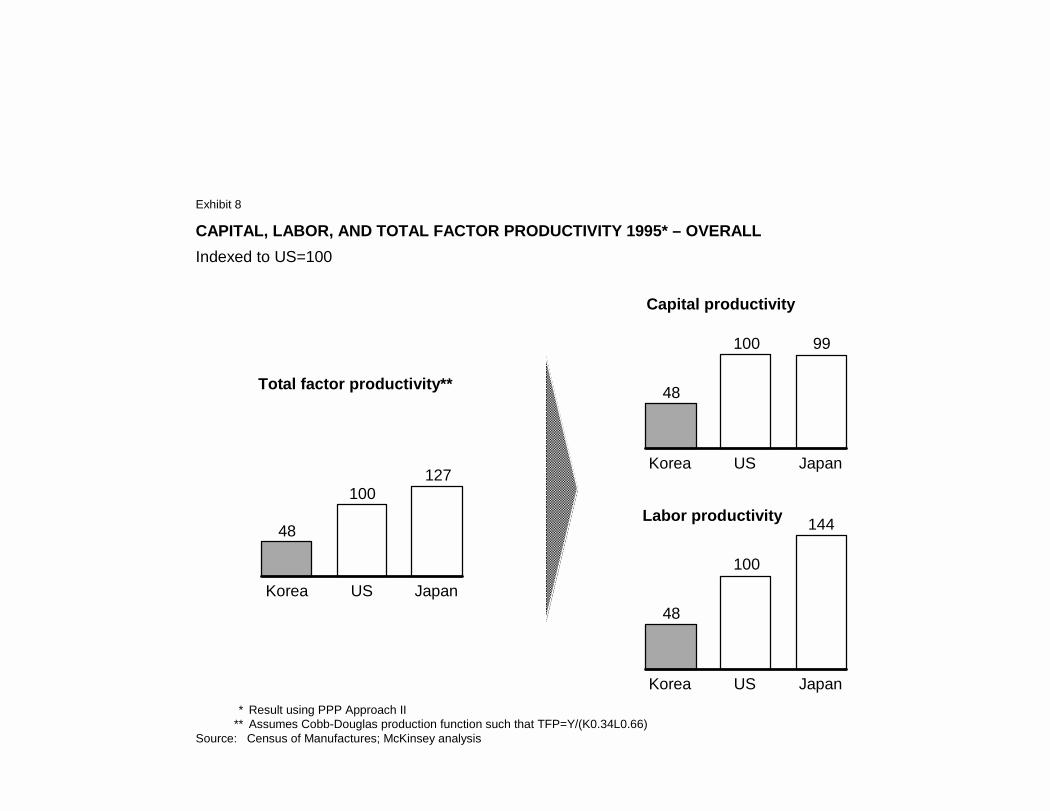
CAPITAL, LABOR, AND TOTAL FACTOR PRODUCTIVITY 1995* – OVERALLIndexed to US=100
48
100 99
Korea US Japan
* Result using PPP Approach II** Assumes Cobb-Douglas production function such that TFP=Y/(K0.34L0.66)
Source: Census of Manufactures; McKinsey analysis
48
100
144
Korea US Japan
48
100127
Korea US Japan
Capital productivity
Labor productivity
Total factor productivity**
Exhibit 8
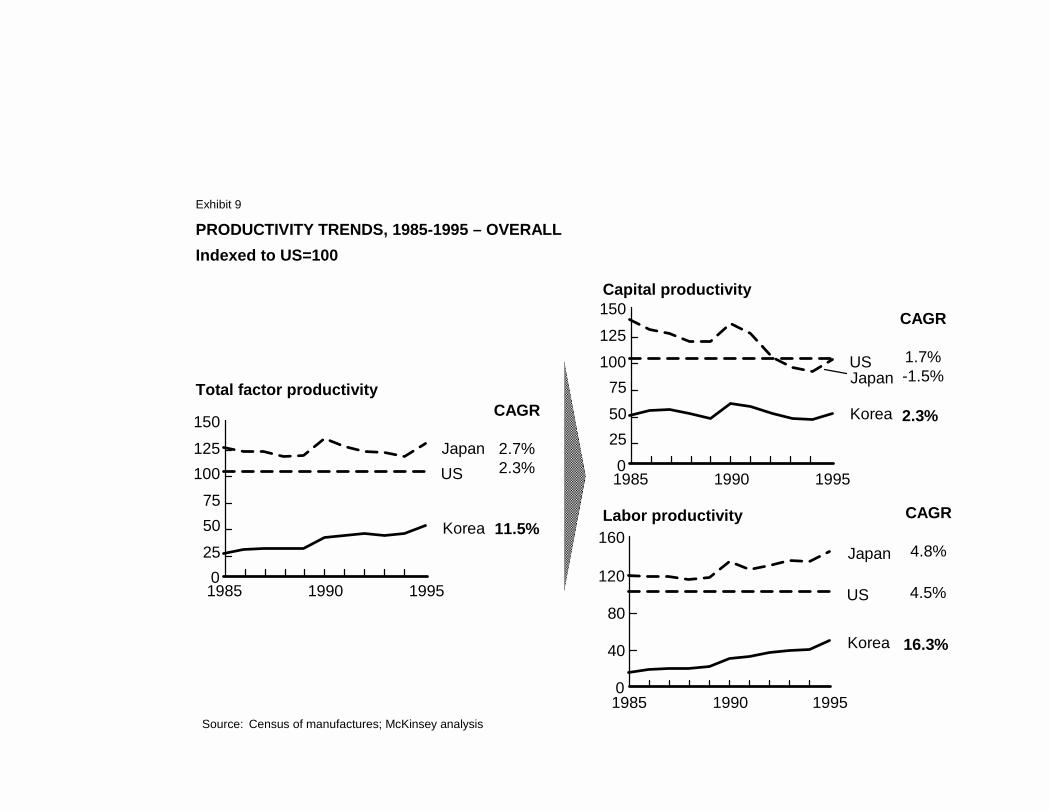
PRODUCTIVITY TRENDS, 1985-1995 – OVERALLIndexed to US=100
Source: Census of manufactures; McKinsey analysis
0
40
80
120
160Japan
US
Korea
1985 1990 1995
0255075
100125150
JapanUS
Korea
1985 1990 1995
0255075
100125150
JapanUS
Korea
1985 1990 1995
Capital productivity
Labor productivity
Total factor productivityCAGR
2.7%2.3%
CAGR
1.7%-1.5%
CAGR
4.8%
4.5%
16.3%
11.5%
2.3%
Exhibit 9
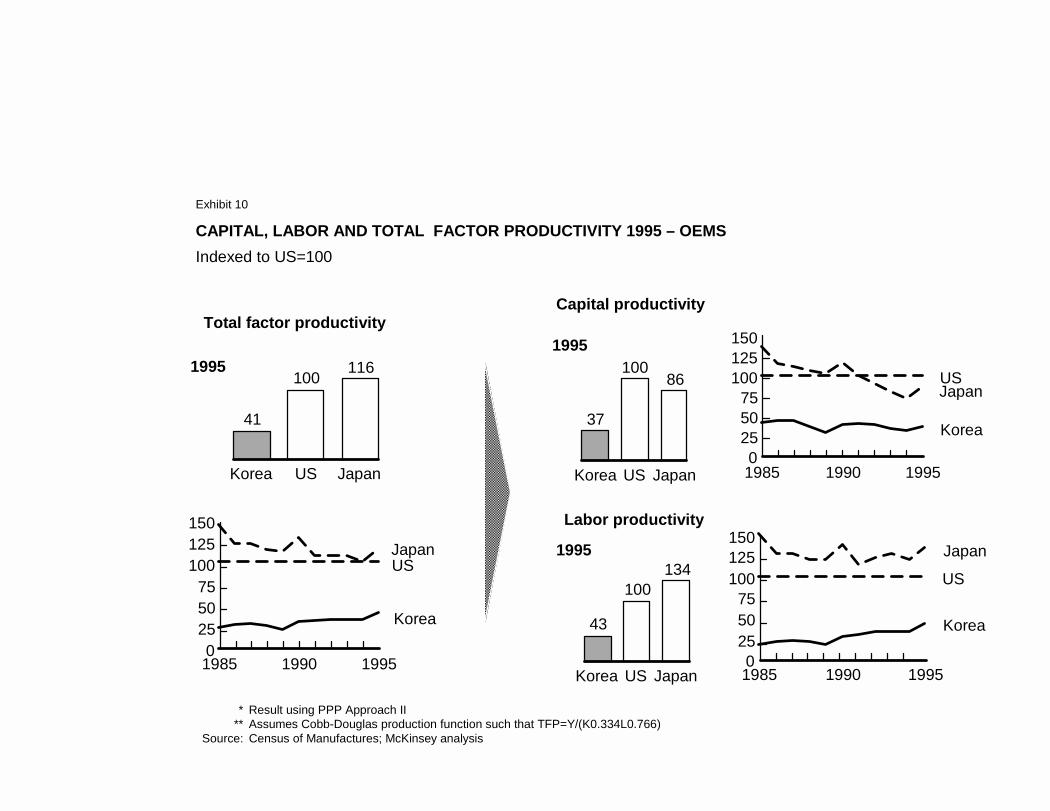
43
100134
Korea US Japan
CAPITAL, LABOR AND TOTAL FACTOR PRODUCTIVITY 1995 – OEMSIndexed to US=100
37
10086
Korea US Japan
* Result using PPP Approach II** Assumes Cobb-Douglas production function such that TFP=Y/(K0.334L0.766)
Source: Census of Manufactures; McKinsey analysis
41
100 116
Korea US Japan
Capital productivity
Labor productivity
Total factor productivity
0255075
100125150
Japan
US
Korea
1985 1990 1995
0255075
100125150
JapanUS
Korea
1985 1990 1995
0255075
100125150
JapanUS
Korea
1985 1990 1995
1995
19951995
Exhibit 10
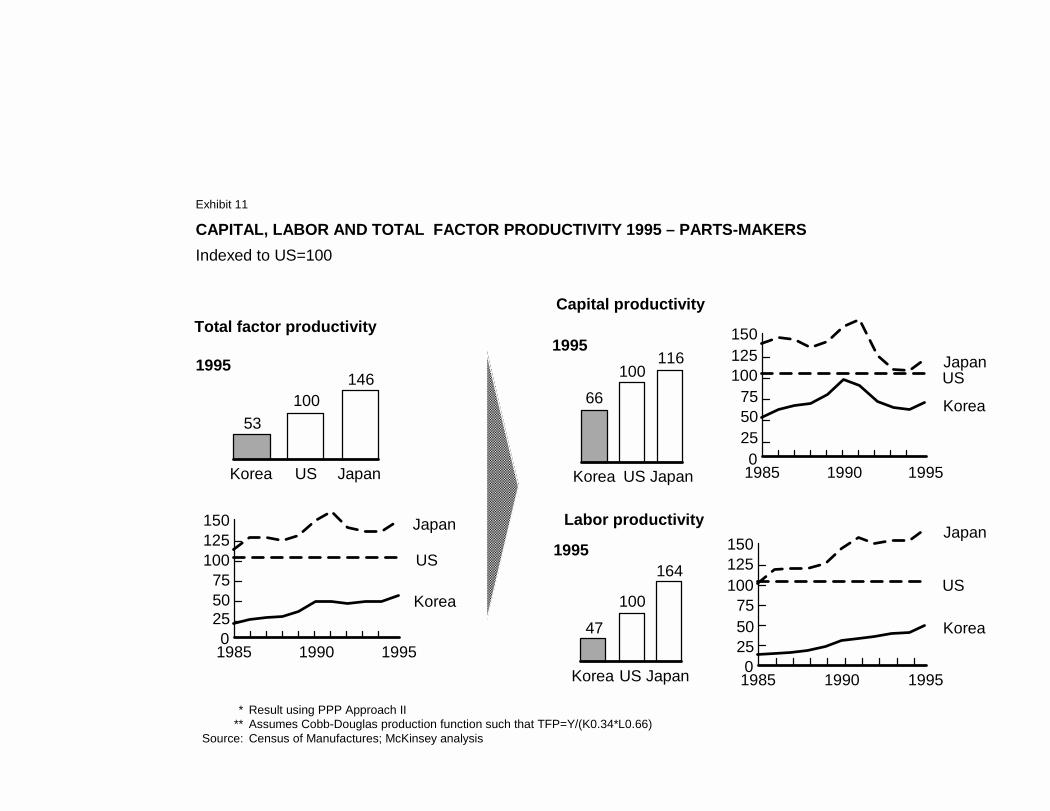
47100
164
Korea US Japan
CAPITAL, LABOR AND TOTAL FACTOR PRODUCTIVITY 1995 – PARTS-MAKERSIndexed to US=100
66100
116
Korea US Japan
* Result using PPP Approach II** Assumes Cobb-Douglas production function such that TFP=Y/(K0.34*L0.66)
Source: Census of Manufactures; McKinsey analysis
53100
146
Korea US Japan
Capital productivity
Labor productivity
Total factor productivity
0255075
100125150
Japan
US
Korea
1985 1990 1995
0255075
100125150
JapanUS
Korea
1985 1990 1995
0255075
100125150 Japan
US
Korea
1985 1990 1995
1995
19951995
Exhibit 11
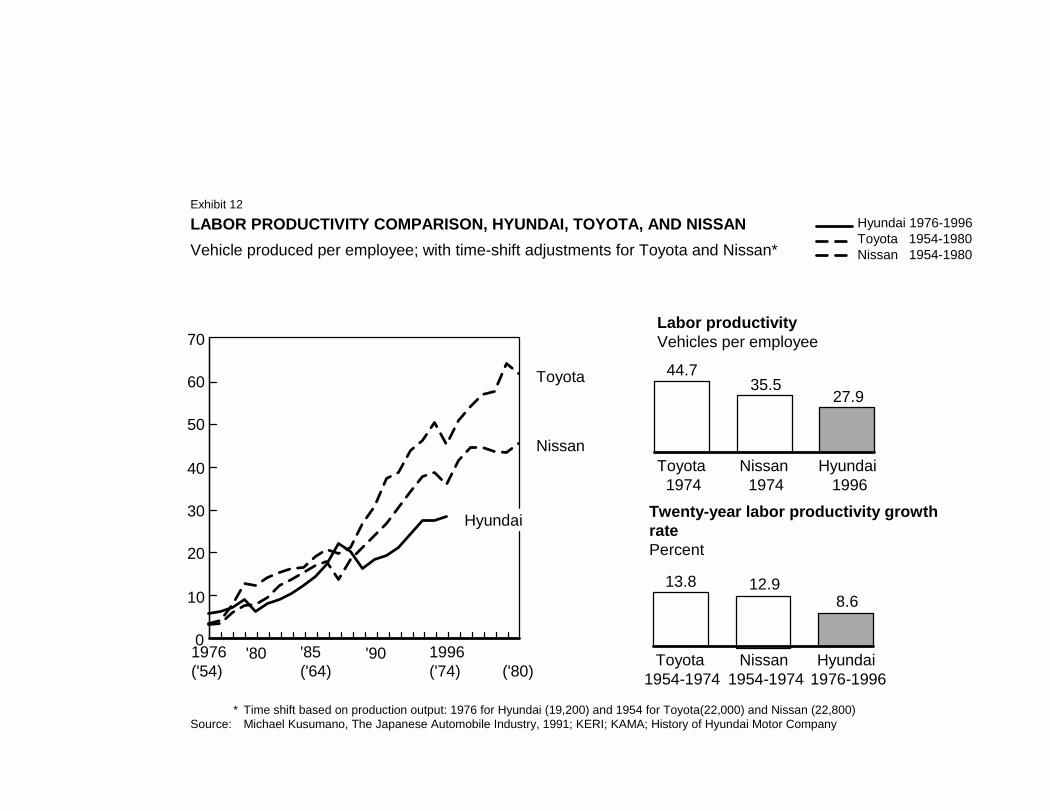
LABOR PRODUCTIVITY COMPARISON, HYUNDAI, TOYOTA, AND NISSAN Vehicle produced per employee; with time-shift adjustments for Toyota and Nissan*
0
10
20
30
40
50
60
70
Nissan
Toyota
Hyundai
1976('54)
'80 '85 ('64)
'90 1996('74) ('80)
* Time shift based on production output: 1976 for Hyundai (19,200) and 1954 for Toyota(22,000) and Nissan (22,800)Source: Michael Kusumano, The Japanese Automobile Industry, 1991; KERI; KAMA; History of Hyundai Motor Company
Hyundai 1976-1996Toyota 1954-1980Nissan 1954-1980
Labor productivityVehicles per employee
44.735.5
27.9
Toyota 1974
Nissan 1974
Hyundai 1996
13.8 12.98.6
Toyota 1954-1974
Nissan 1954-1974
Hyundai 1976-1996
Twenty-year labor productivity growth ratePercent
Exhibit 12
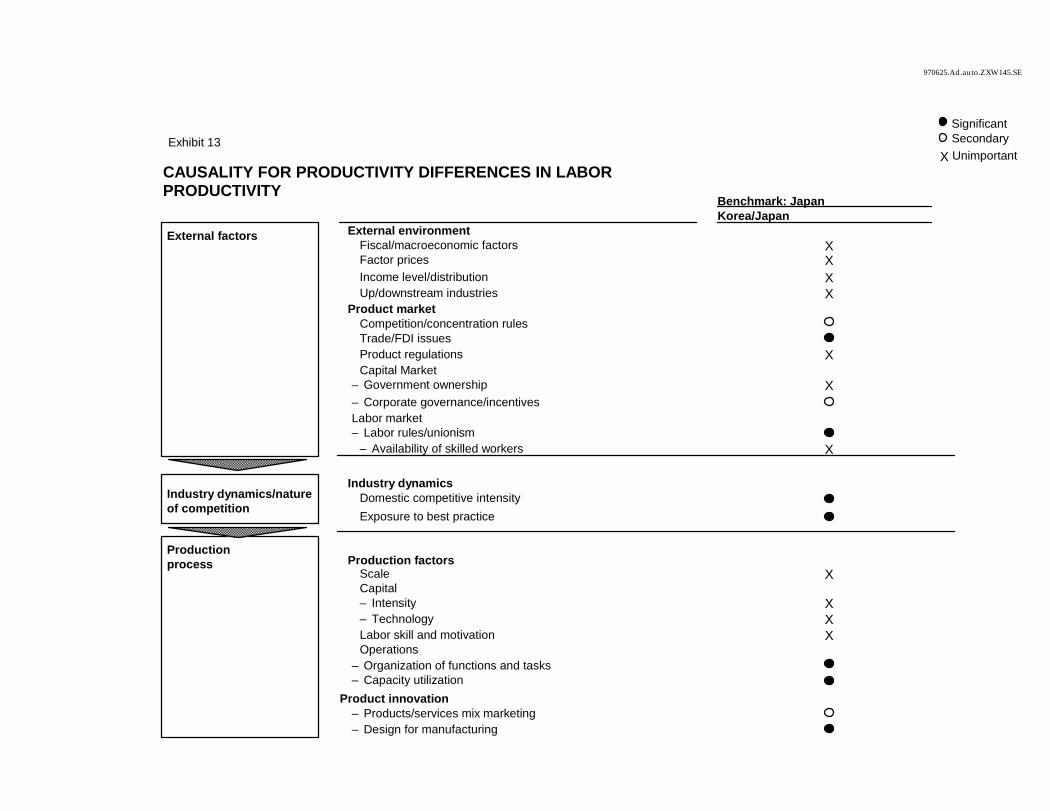
970625.Ad.auto.ZXW145.SE
Benchmark: JapanKorea/Japan
External factors External environment� Fiscal/macroeconomic factors X� Factor prices X� Income level/distribution X� Up/downstream industries XProduct market � Competition/concentration rules� Trade/FDI issues� Product regulations X� Capital Market– Government ownership X– Corporate governance/incentives
� Labor market– Labor rules/unionism
– Availability of skilled workers X
Industry dynamics/nature of competition
Industry dynamics� Domestic competitive intensity� Exposure to best practice
Productionprocess Production factors
� Scale X� Capital
– Intensity X– Technology X
� Labor skill and motivation X� Operations– Organization of functions and tasks– Capacity utilization
Product innovation – Products/services mix marketing – Design for manufacturing
CAUSALITY FOR PRODUCTIVITY DIFFERENCES IN LABOR PRODUCTIVITY
Significant
XSecondaryUnimportant
Exhibit 13
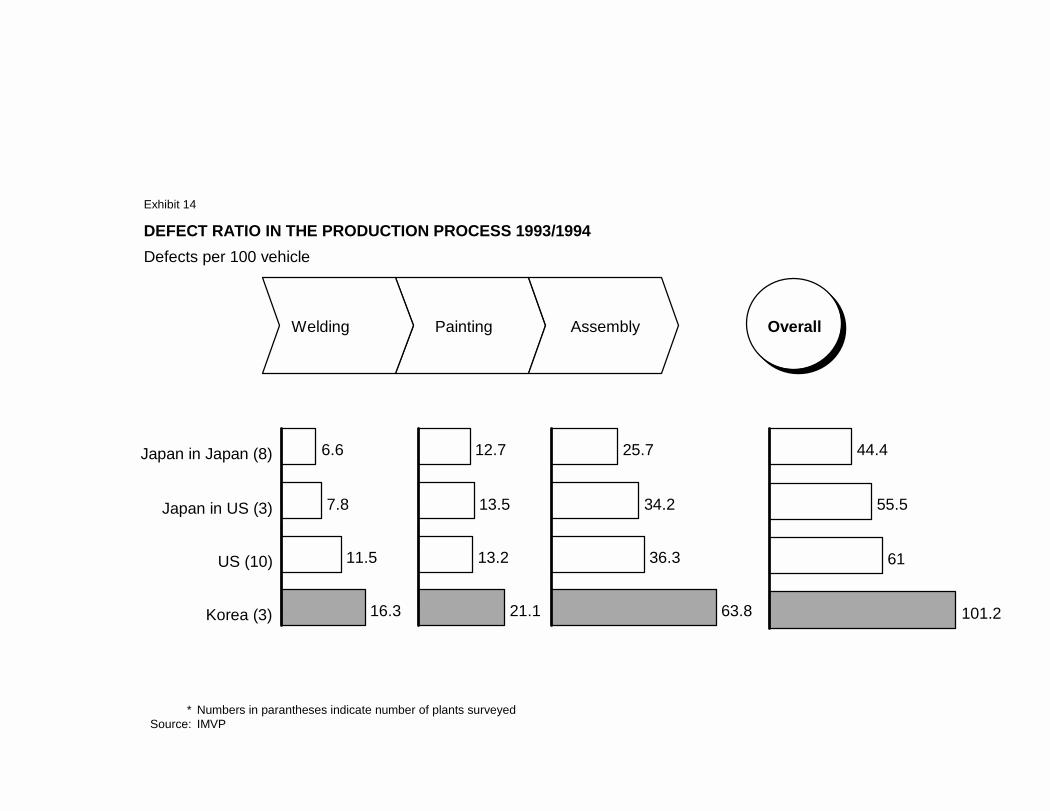
Welding Painting Assembly
DEFECT RATIO IN THE PRODUCTION PROCESS 1993/1994Defects per 100 vehicle
* Numbers in parantheses indicate number of plants surveyed Source: IMVP
6.6
7.8
11.5
16.3
Japan in Japan (8)
Japan in US (3)
US (10)
Korea (3)
12.7
13.5
13.2
21.1
25.7
34.2
36.3
63.8
44.4
55.5
61
101.2
Overall
Exhibit 14
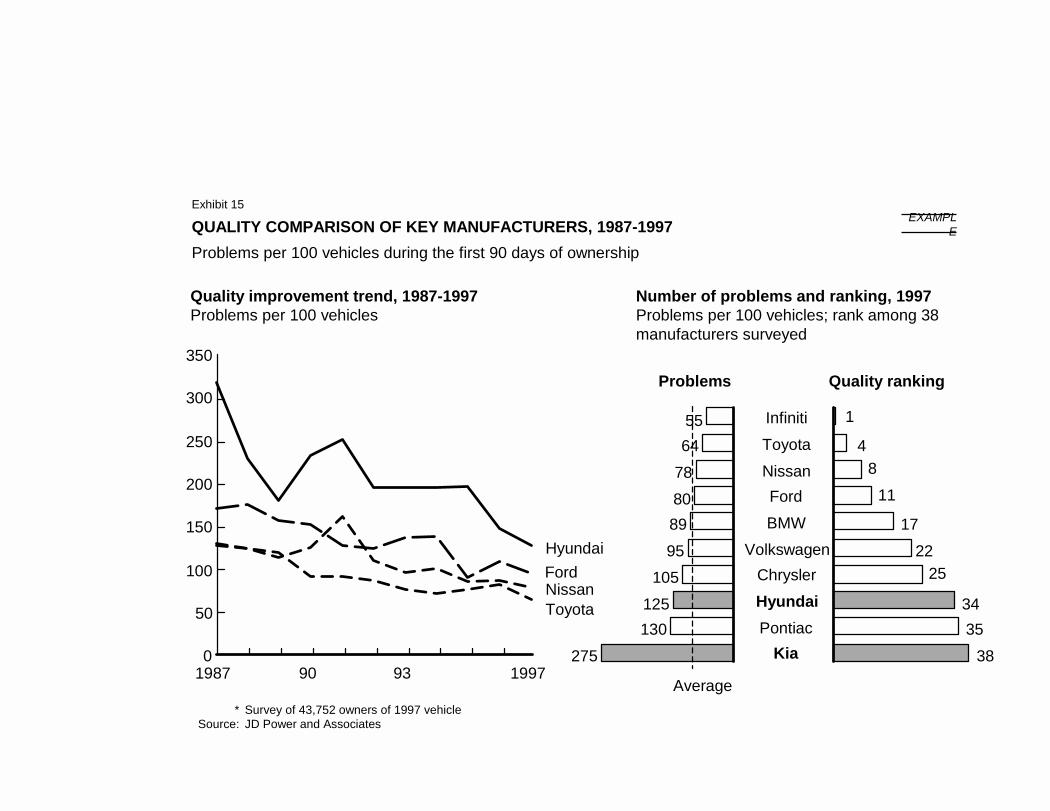
0
50
100
150
200
250
300
350
FordNissanToyota
Hyundai
1987 90 93 1997
QUALITY COMPARISON OF KEY MANUFACTURERS, 1987-1997Problems per 100 vehicles during the first 90 days of ownership
* Survey of 43,752 owners of 1997 vehicleSource: JD Power and Associates
Number of problems and ranking, 1997Problems per 100 vehicles; rank among 38 manufacturers surveyed
Problems Quality ranking
Quality improvement trend, 1987-1997Problems per 100 vehicles
5564
78808995
105125130
275
1
48
11
1722
25
3435
38
InfinitiToyotaNissanFordBMW
VolkswagenChryslerHyundaiPontiac
Kia
Average
Exhibit 15EXAMPL
E
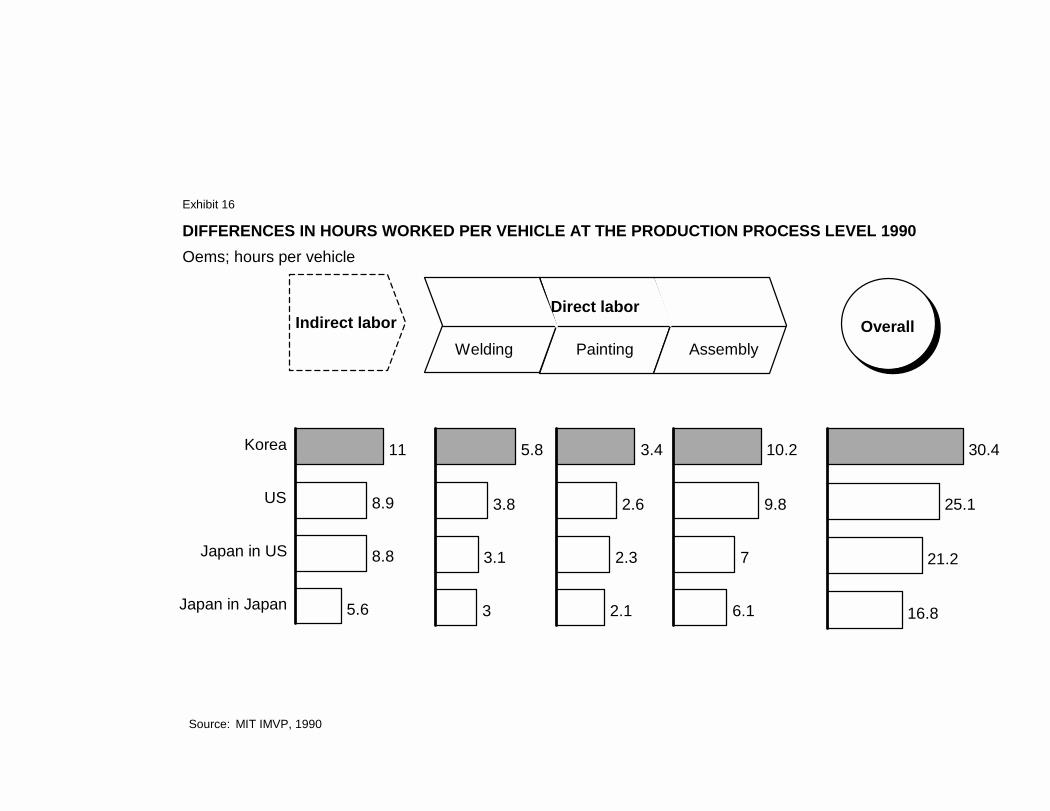
DIFFERENCES IN HOURS WORKED PER VEHICLE AT THE PRODUCTION PROCESS LEVEL 1990Oems; hours per vehicle
Source: MIT IMVP, 1990
OverallWelding Painting Assembly
Direct laborIndirect labor
5.8
3.8
3.1
3
3.4
2.6
2.3
2.1
10.2
9.8
7
6.1
30.4
25.1
21.2
16.8
11
8.9
8.8
5.6
Korea
US
Japan in US
Japan in Japan
Exhibit 16
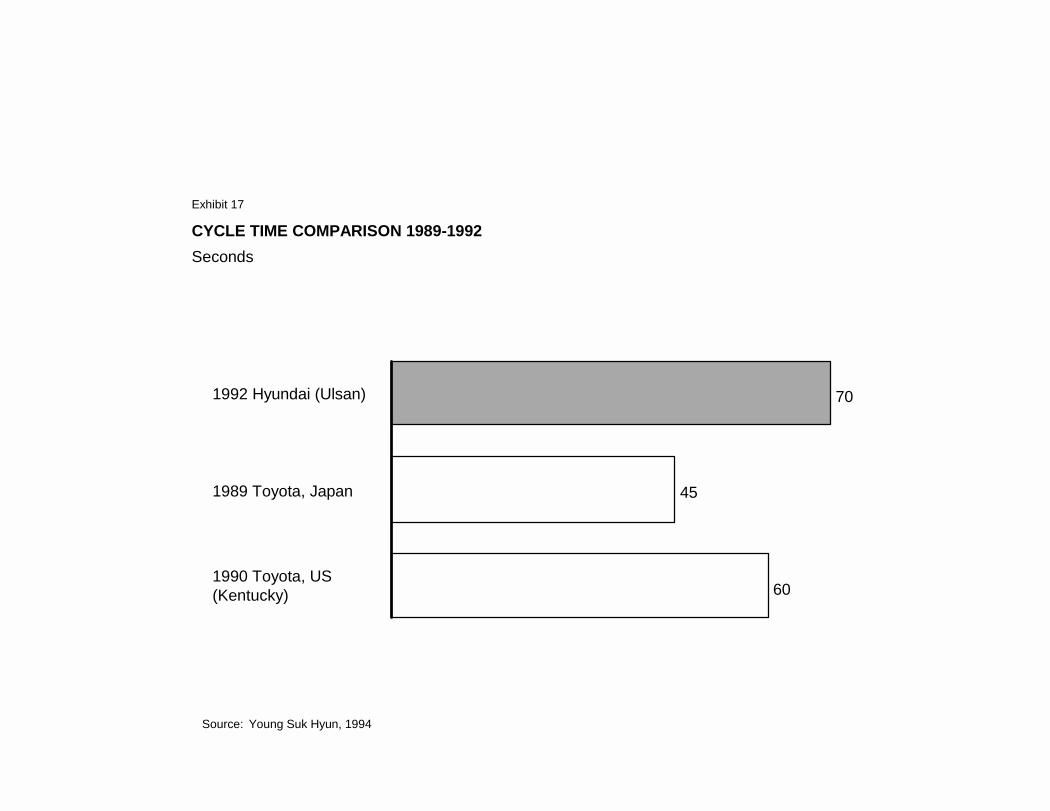
CYCLE TIME COMPARISON 1989-1992Seconds
Source: Young Suk Hyun, 1994
70
45
60
1992 Hyundai (Ulsan)
1989 Toyota, Japan
1990 Toyota, US (Kentucky)
Exhibit 17
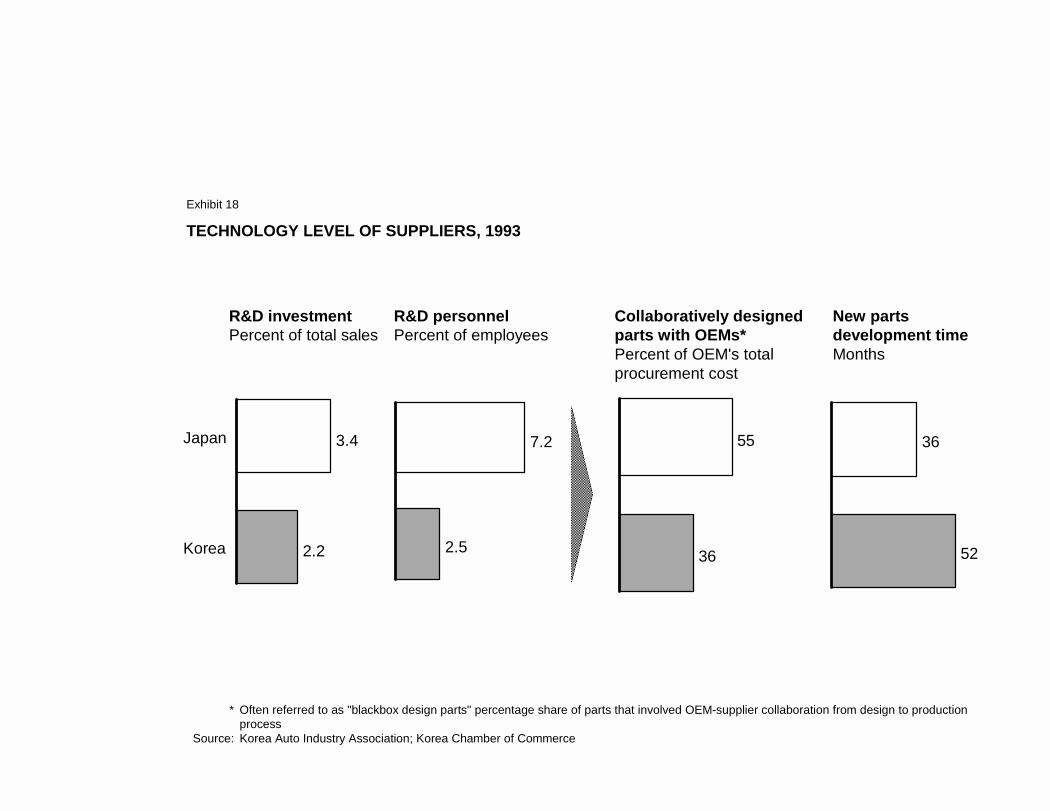
TECHNOLOGY LEVEL OF SUPPLIERS, 1993
* Often referred to as "blackbox design parts" percentage share of parts that involved OEM-supplier collaboration from design to production process
Source: Korea Auto Industry Association; Korea Chamber of Commerce
Japan
Korea
3.4
2.2
7.2
2.5
R&D investment Percent of total sales
R&D personnel Percent of employees
55
36
36
52
Collaboratively designed parts with OEMs*Percent of OEM's total procurement cost
New parts development timeMonths
Exhibit 18
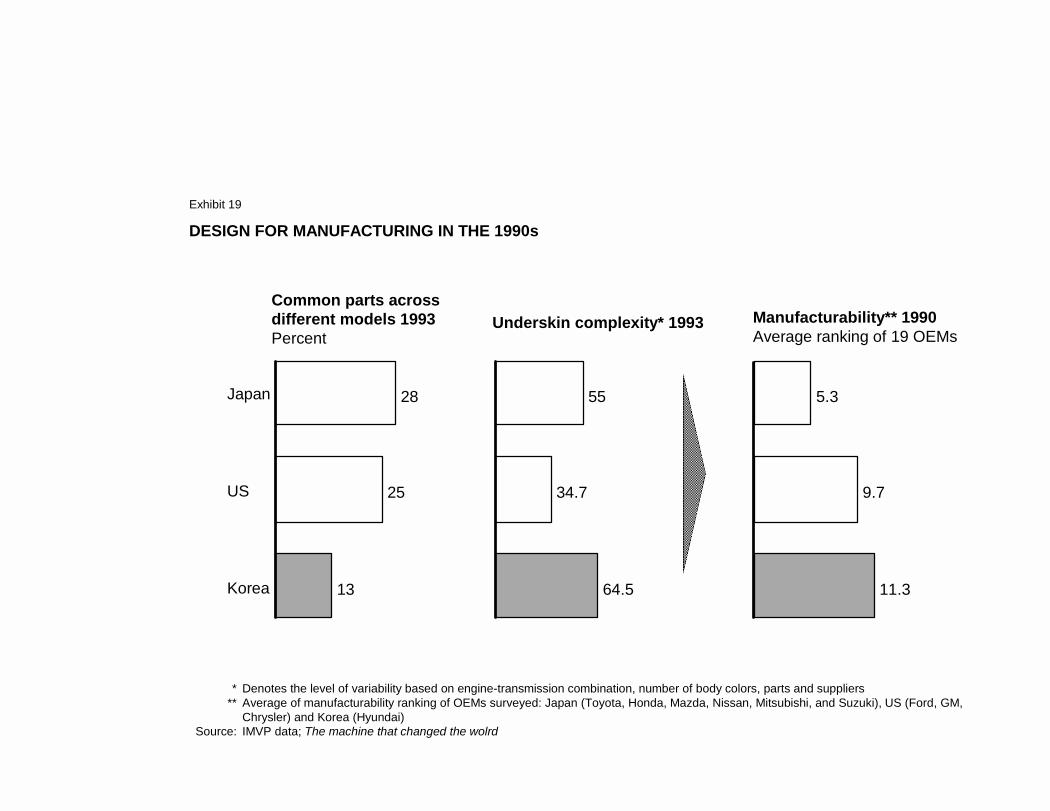
DESIGN FOR MANUFACTURING IN THE 1990s
* Denotes the level of variability based on engine-transmission combination, number of body colors, parts and suppliers** Average of manufacturability ranking of OEMs surveyed: Japan (Toyota, Honda, Mazda, Nissan, Mitsubishi, and Suzuki), US (Ford, GM,
Chrysler) and Korea (Hyundai)Source: IMVP data; The machine that changed the wolrd
28
25
13
Japan
US
Korea
55
34.7
64.5
5.3
9.7
11.3
Common parts across different models 1993Percent
Underskin complexity* 1993 Manufacturability** 1990Average ranking of 19 OEMs
Exhibit 19
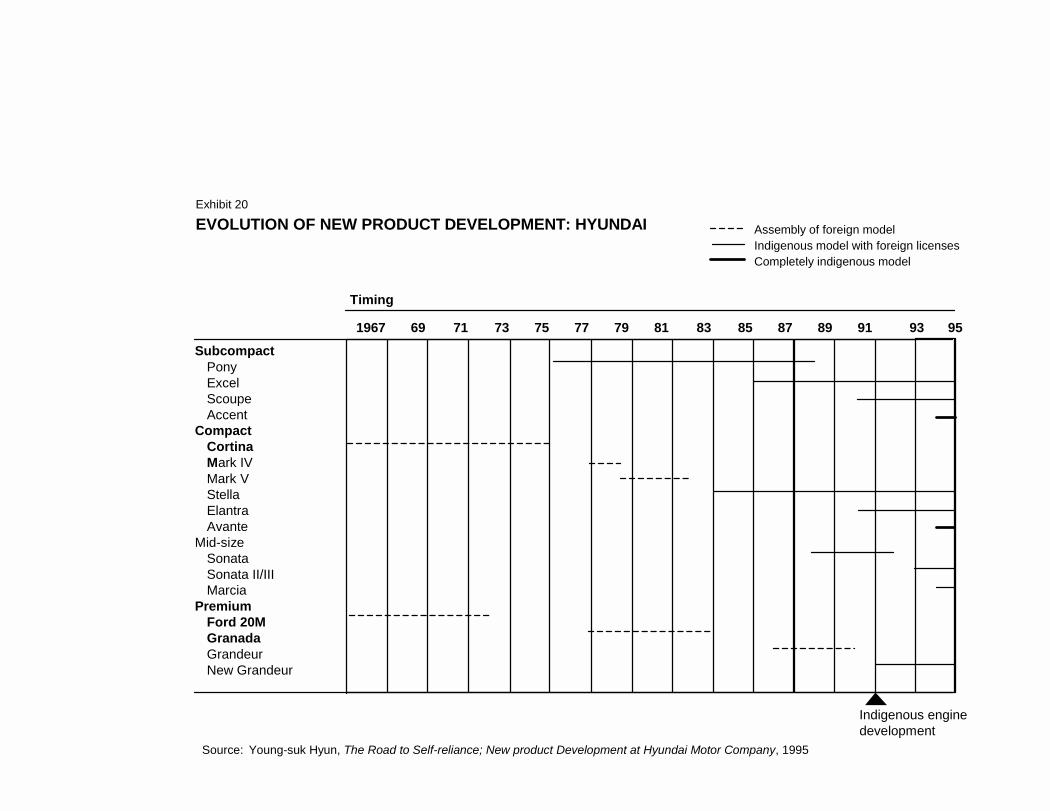
EVOLUTION OF NEW PRODUCT DEVELOPMENT: HYUNDAI
Source: Young-suk Hyun, The Road to Self-reliance; New product Development at Hyundai Motor Company, 1995
Completely indigenous model
Assembly of foreign modelIndigenous model with foreign licenses
SubcompactPonyExcelScoupeAccent
CompactCortinaMark IVMark VStellaElantraAvante
Mid-sizeSonataSonata II/IIIMarcia
PremiumFord 20MGranadaGrandeurNew Grandeur
Timing
1967 69 71 73 75 77 79 81 83 85 87 89 91 93 95
Indigenous engine development
Exhibit 20
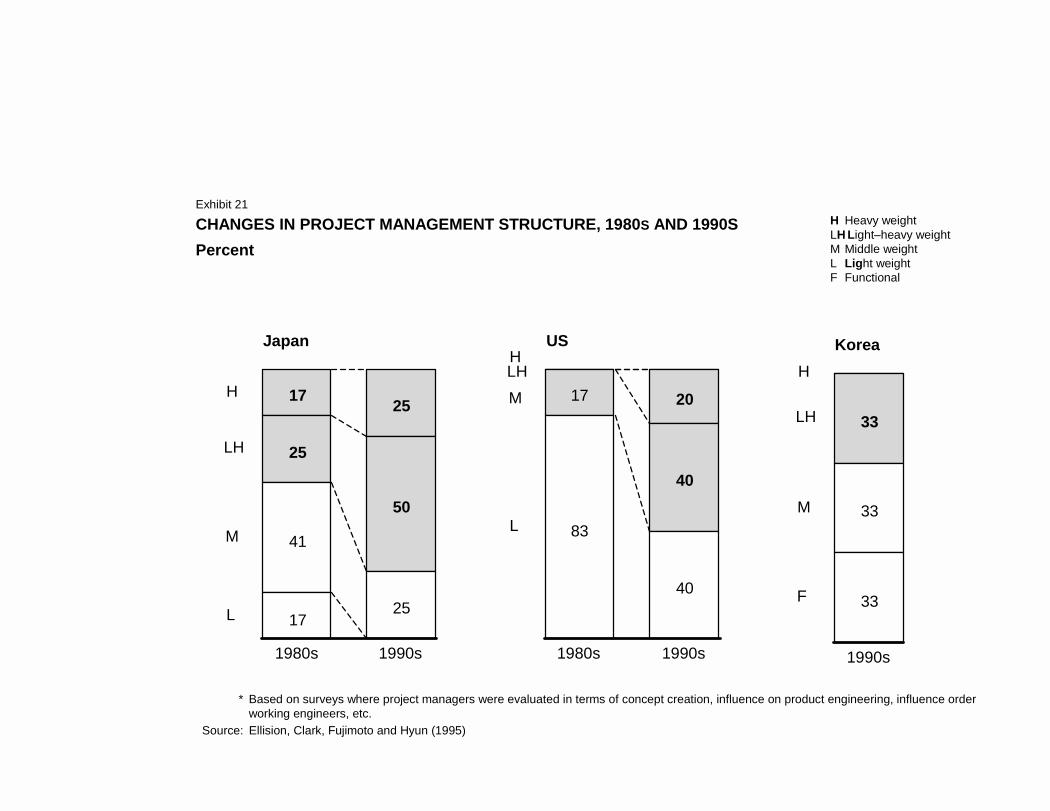
CHANGES IN PROJECT MANAGEMENT STRUCTURE, 1980S AND 1990SPercent
* Based on surveys where project managers were evaluated in terms of concept creation, influence on product engineering, influence order working engineers, etc.
Source: Ellision, Clark, Fujimoto and Hyun (1995)
Japan
H 17 25
LH 25
50
M 41
25L 17
1980s 1990s
USHLH
20M 17
40
L 83
40
1980s 1990s
KoreaH
LH 33
M 33
F 33
1990s
H Heavy weightLH Light–heavy weightM Middle weightL Light weightF Functional
Exhibit 21
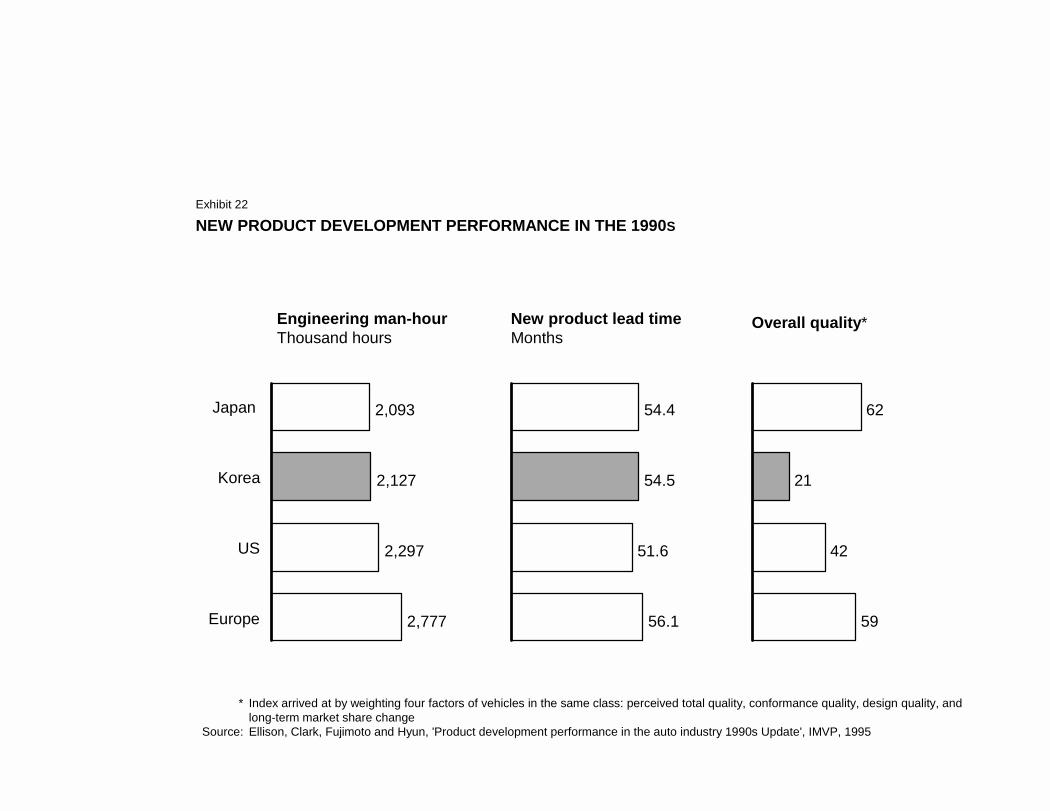
NEW PRODUCT DEVELOPMENT PERFORMANCE IN THE 1990S
* Index arrived at by weighting four factors of vehicles in the same class: perceived total quality, conformance quality, design quality, and long-term market share change
Source: Ellison, Clark, Fujimoto and Hyun, 'Product development performance in the auto industry 1990s Update', IMVP, 1995
2,093
2,127
2,297
2,777
Japan
Korea
US
Europe
54.4
54.5
51.6
56.1
62
21
42
59
Engineering man-hourThousand hours
New product lead timeMonths
Overall quality*
Exhibit 22
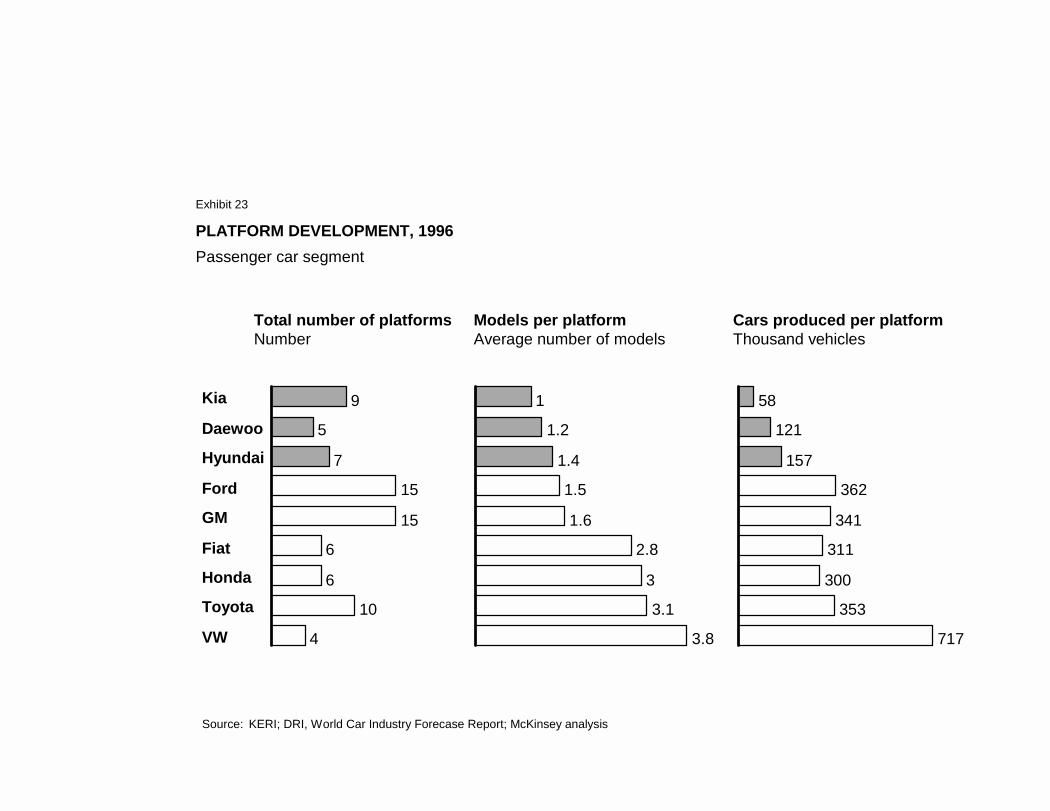
PLATFORM DEVELOPMENT, 1996Passenger car segment
Source: KERI; DRI, World Car Industry Forecase Report; McKinsey analysis
Total number of platformsNumber
Models per platformAverage number of models
Cars produced per platformThousand vehicles
9
5
7
15
15
6
6
10
4
Kia
Daewoo
Hyundai
Ford
GM
Fiat
Honda
Toyota
VW
1
1.2
1.4
1.5
1.6
2.8
3
3.1
3.8
58
121
157
362
341
311
300
353
717
Exhibit 23
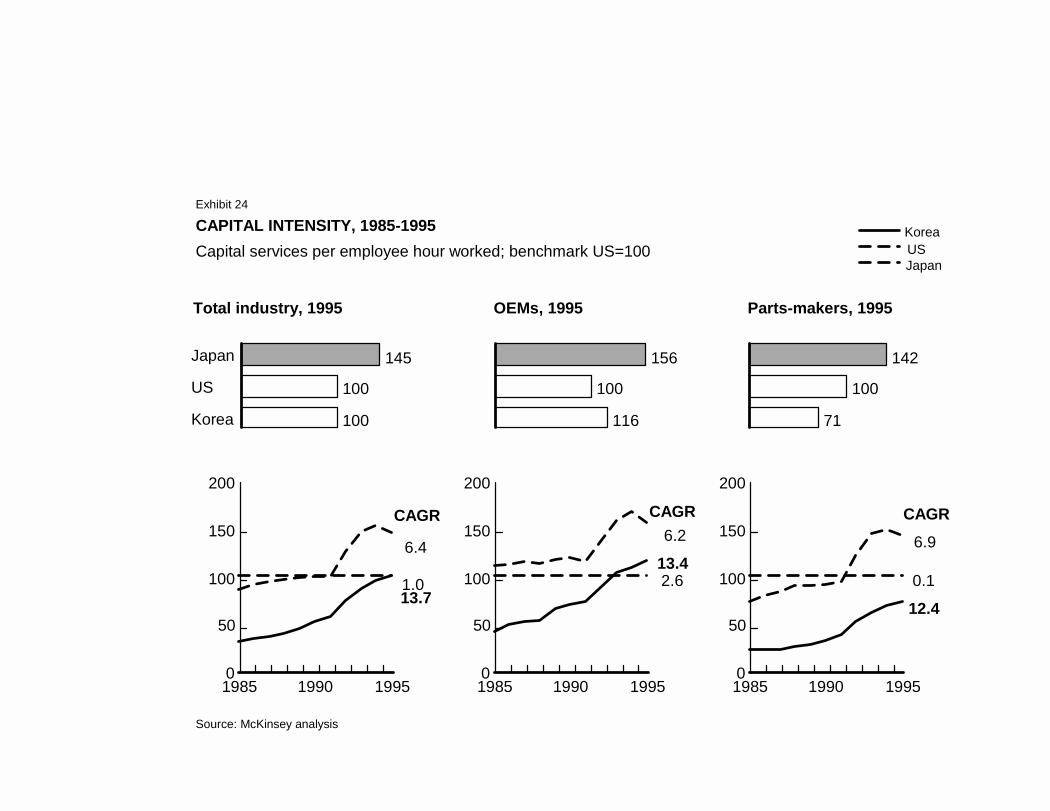
CAPITAL INTENSITY, 1985-1995Capital services per employee hour worked; benchmark US=100
Source: McKinsey analysis
Total industry, 1995 OEMs, 1995 Parts-makers, 1995
0
50
100
150
200
1985 1990 19950
50
100
150
200
1985 1990 19950
50
100
150
200
1985 1990 1995
145
100
100
Japan
US
Korea
156
100
116
142
100
71
KoreaUSJapan
CAGR
13.71.0
6.4
CAGR
13.42.6
6.2CAGR
12.40.1
6.9
Exhibit 24
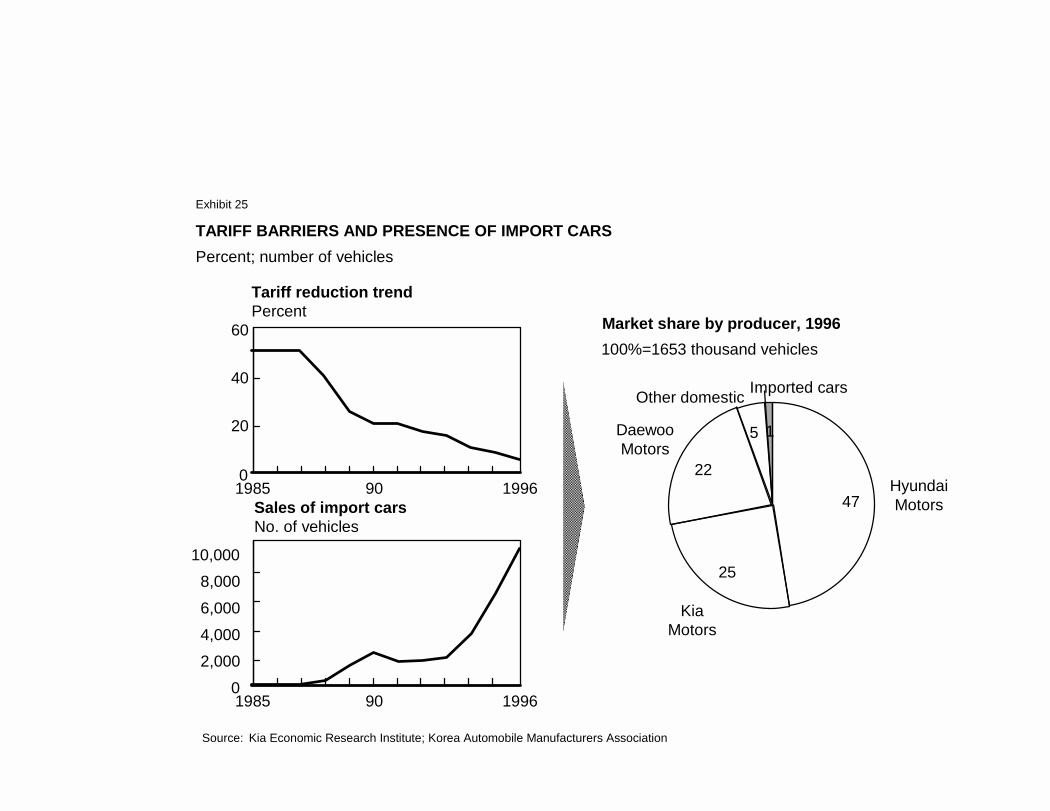
TARIFF BARRIERS AND PRESENCE OF IMPORT CARSPercent; number of vehicles
Source: Kia Economic Research Institute; Korea Automobile Manufacturers Association
0
20
40
60
1985 90 1996
02,0004,0006,0008,000
10,000
1985 90 1996
Tariff reduction trendPercent
Sales of import carsNo. of vehicles
Market share by producer, 1996
HyundaiMotors47
KiaMotors
25
DaewooMotors
22
Other domestic
5
Imported cars
1
100%=1653 thousand vehicles
Exhibit 25
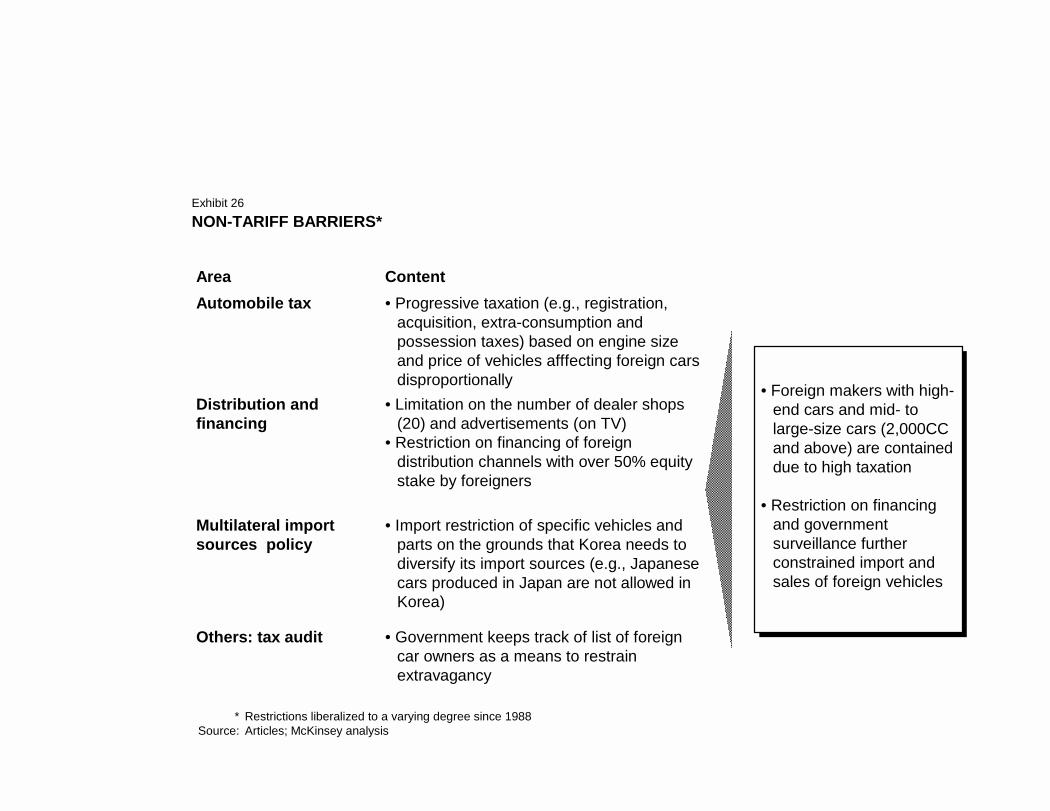
NON-TARIFF BARRIERS*
* Restrictions liberalized to a varying degree since 1988Source: Articles; McKinsey analysis
Area ContentAutomobile tax • Progressive taxation (e.g., registration,
acquisition, extra-consumption and possession taxes) based on engine size and price of vehicles afffecting foreign cars disproportionally
Distribution and financing
• Limitation on the number of dealer shops (20) and advertisements (on TV)
• Restriction on financing of foreign distribution channels with over 50% equity stake by foreigners
Multilateral import sources policy
• Import restriction of specific vehicles and parts on the grounds that Korea needs to diversify its import sources (e.g., Japanese cars produced in Japan are not allowed in Korea)
Others: tax audit • Government keeps track of list of foreign car owners as a means to restrain extravagancy
• Foreign makers with high-end cars and mid- to large-size cars (2,000CC and above) are contained due to high taxation
• Restriction on financing and government surveillance further constrained import and sales of foreign vehicles
Exhibit 26
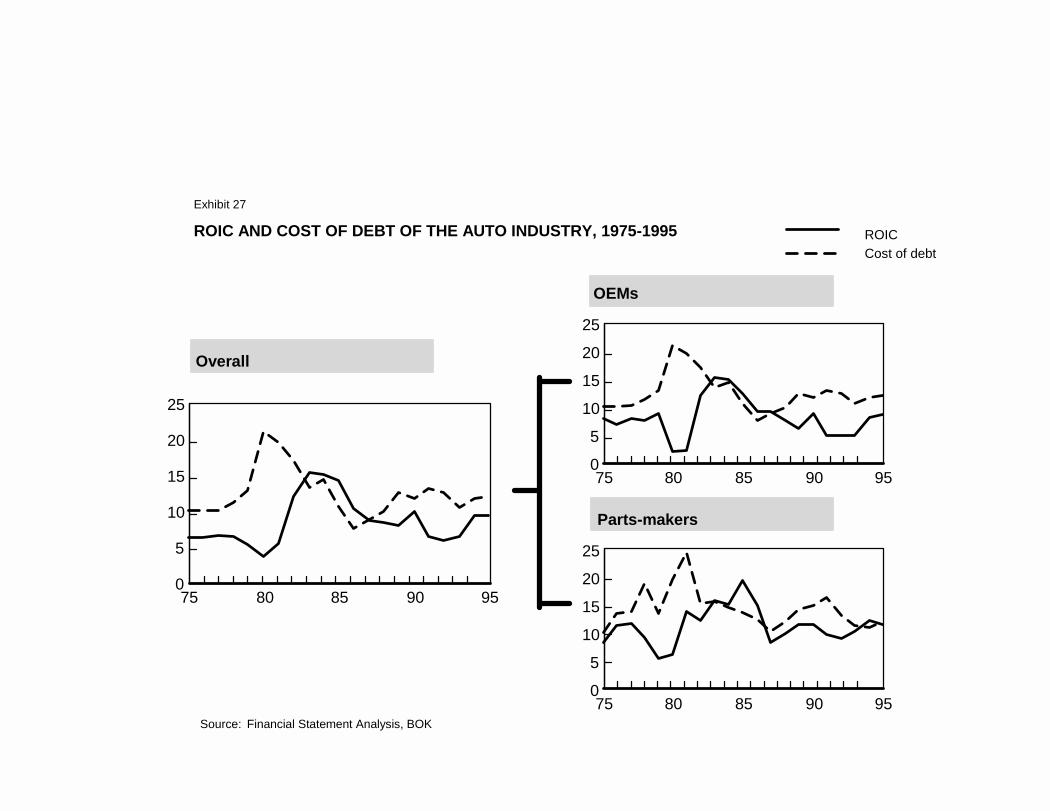
ROIC AND COST OF DEBT OF THE AUTO INDUSTRY, 1975-1995
Source: Financial Statement Analysis, BOK
Overall
Parts-makers
OEMs
0
5
10
15
20
25
75 80 85 90 95
0
5
10
15
20
25
75 80 85 90 95
0
5
10
15
20
25
75 80 85 90 95
Cost of debtROIC
Exhibit 27
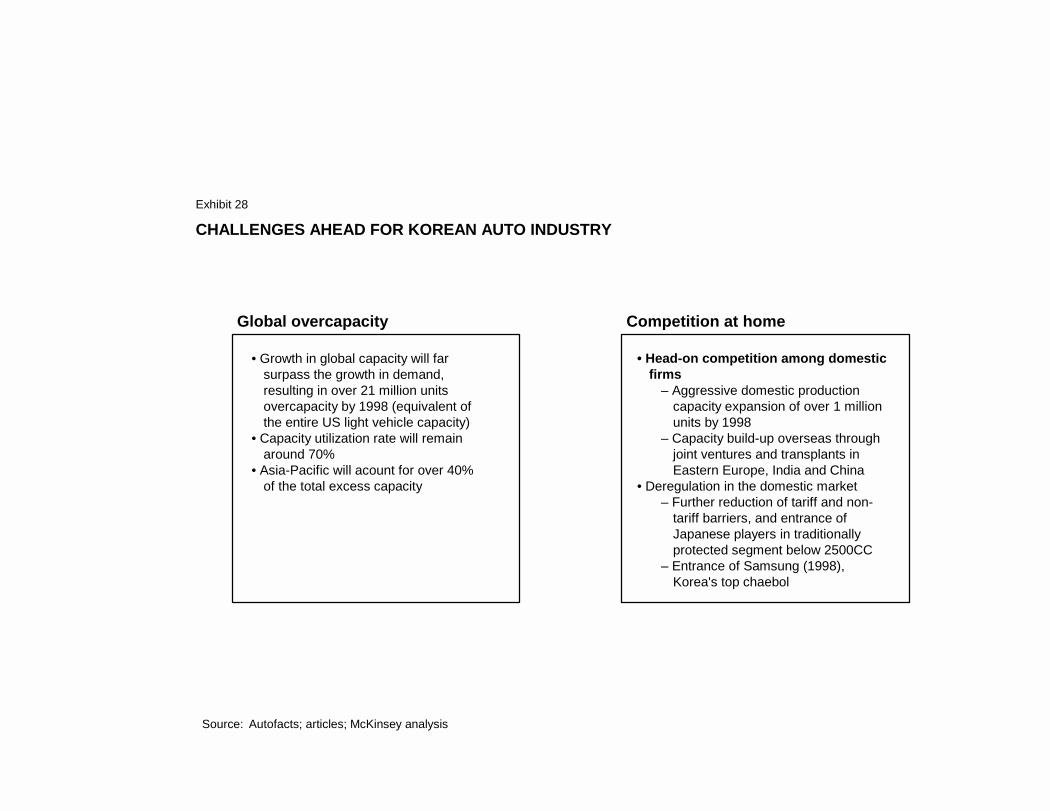
CHALLENGES AHEAD FOR KOREAN AUTO INDUSTRY
Source: Autofacts; articles; McKinsey analysis
• Head-on competition among domestic firms
– Aggressive domestic production capacity expansion of over 1 million units by 1998
– Capacity build-up overseas through joint ventures and transplants in Eastern Europe, India and China
• Deregulation in the domestic market– Further reduction of tariff and non-
tariff barriers, and entrance of Japanese players in traditionally protected segment below 2500CC
– Entrance of Samsung (1998), Korea's top chaebol
Exhibit 28
• Growth in global capacity will far surpass the growth in demand, resulting in over 21 million units overcapacity by 1998 (equivalent of the entire US light vehicle capacity)
• Capacity utilization rate will remain around 70%
• Asia-Pacific will acount for over 40% of the total excess capacity
Global overcapacity Competition at home
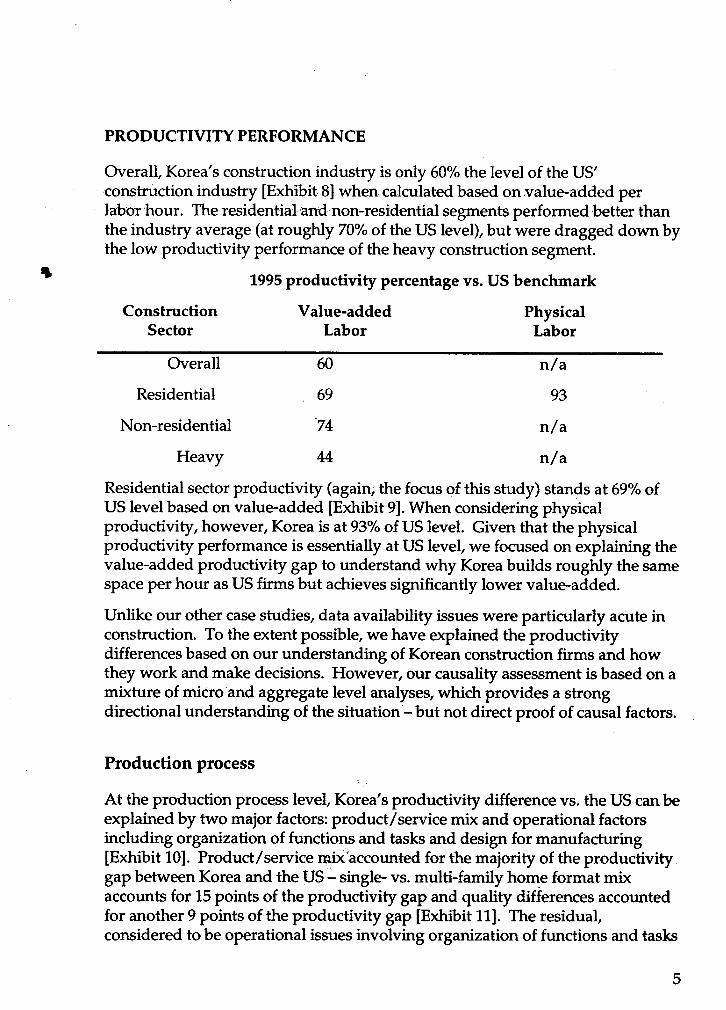

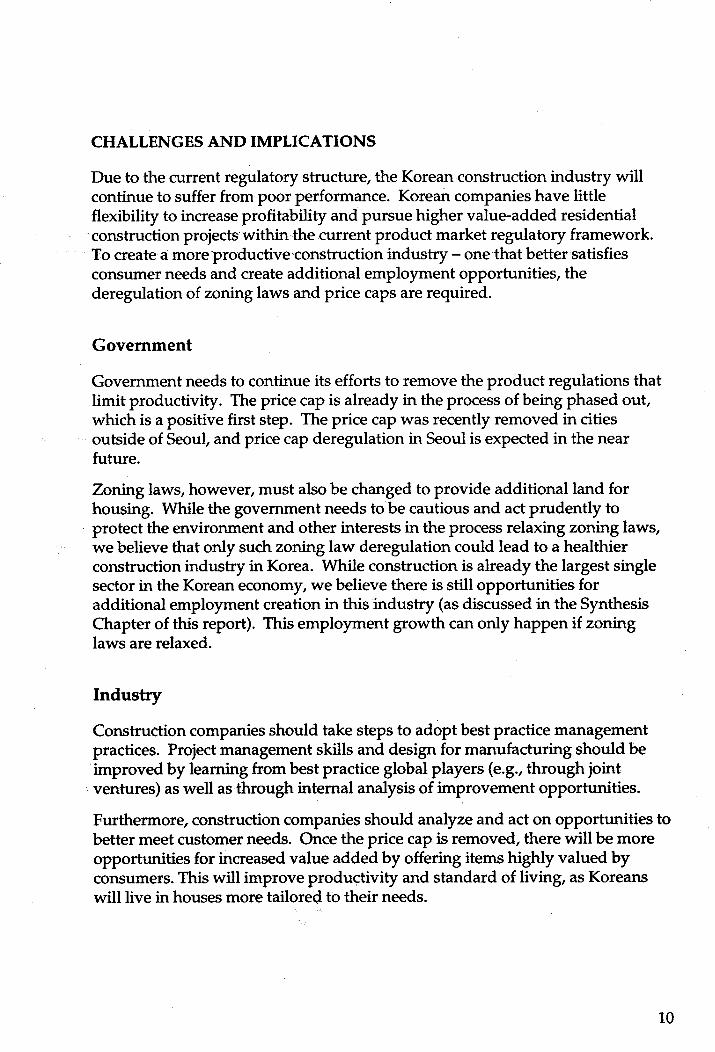
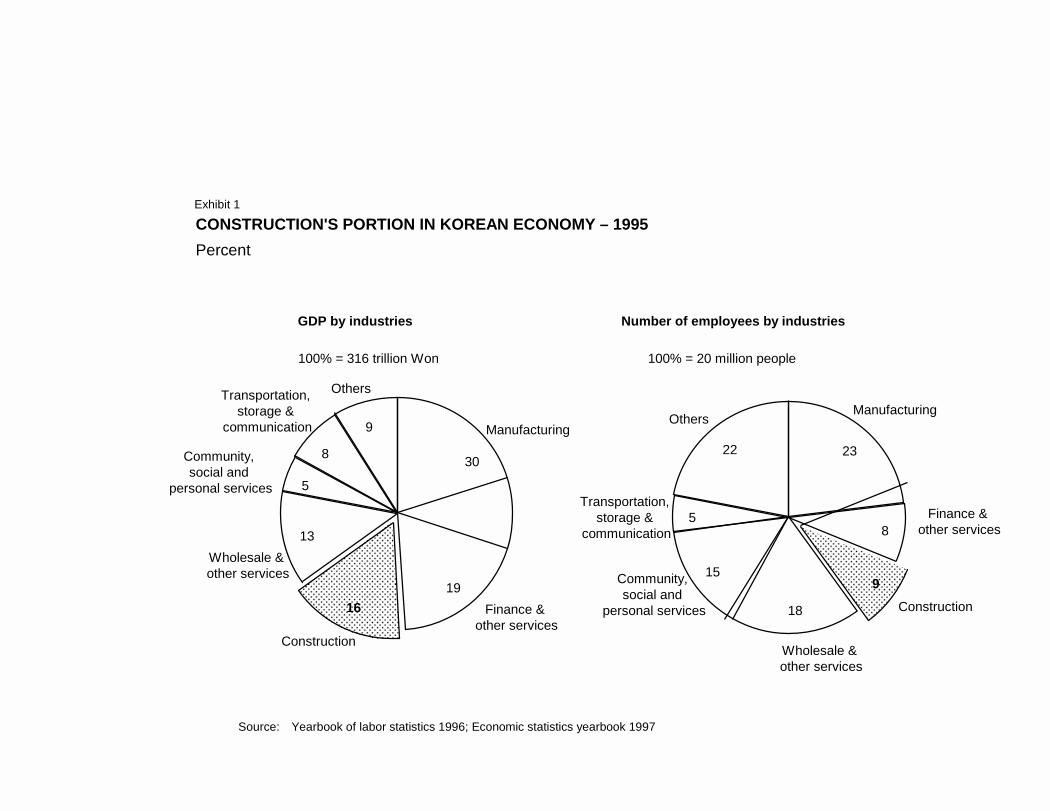
Manufacturing
30
Finance & other services
19
Construction
16
Wholesale & other services
13
Community, social and
personal services 5
Transportation, storage &
communication
8
Others
9
GDP by industries
100% = 316 trillion Won
Number of employees by industries
100% = 20 million people
Manufacturing
23
Finance & other services8
Construction
9
Wholesale & other services
18
Community, social and
personal services
15
Transportation, storage &
communication5
Others
22
Source: Yearbook of labor statistics 1996; Economic statistics yearbook 1997
CONSTRUCTION'S PORTION IN KOREAN ECONOMY – 1995Percent
Exhibit 1
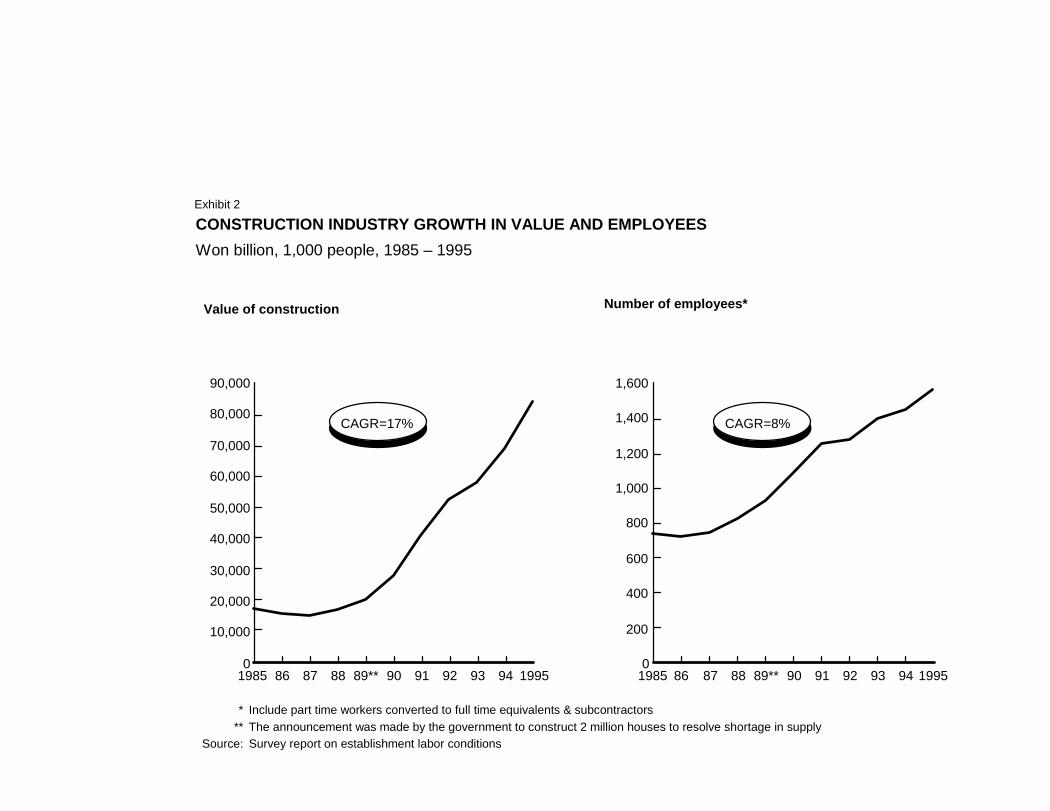
CONSTRUCTION INDUSTRY GROWTH IN VALUE AND EMPLOYEESWon billion, 1,000 people, 1985 – 1995
Number of employees*
0
200
400
600
800
1,000
1,200
1,400
1,600
1985 86 87 88 89** 90 91 92 93 94 1995
* Include part time workers converted to full time equivalents & subcontractors** The announcement was made by the government to construct 2 million houses to resolve shortage in supply
Source: Survey report on establishment labor conditions
Value of construction
0
10,000
20,000
30,000
40,000
50,000
60,000
70,000
80,000
90,000
1985 86 87 88 89** 90 91 92 93 94 1995
Exhibit 2
CAGR=17% CAGR=8%
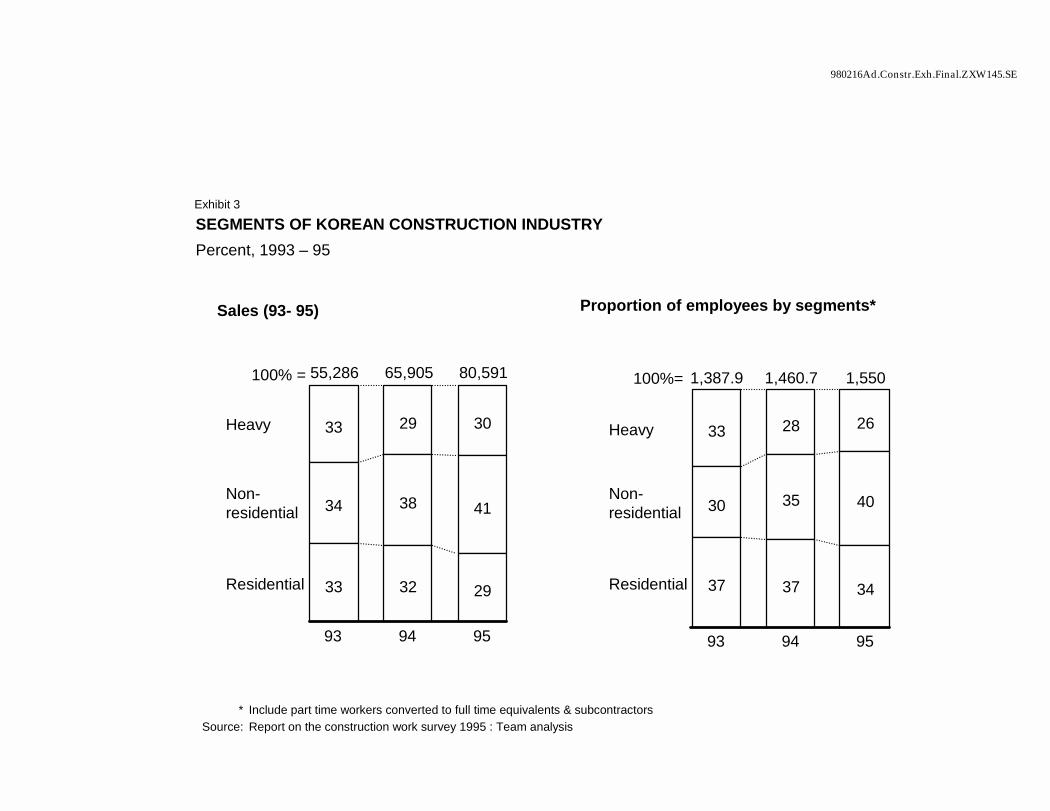
980216Ad.Constr.Exh.Final.ZXW145.SE
1,387.9 1,460.7 1,550
Heavy 33 28 26
Non-residential 30 35 40
Residential 37 37 34
93 94 95
Proportion of employees by segments*
SEGMENTS OF KOREAN CONSTRUCTION INDUSTRYPercent, 1993 – 95
55,286 65,905 80,591
Heavy 33 29 30
Non-residential 34 38 41
Residential 33 32 29
93 94 95
100% =
* Include part time workers converted to full time equivalents & subcontractorsSource: Report on the construction work survey 1995 : Team analysis
100%=
Sales (93- 95)
Exhibit 3
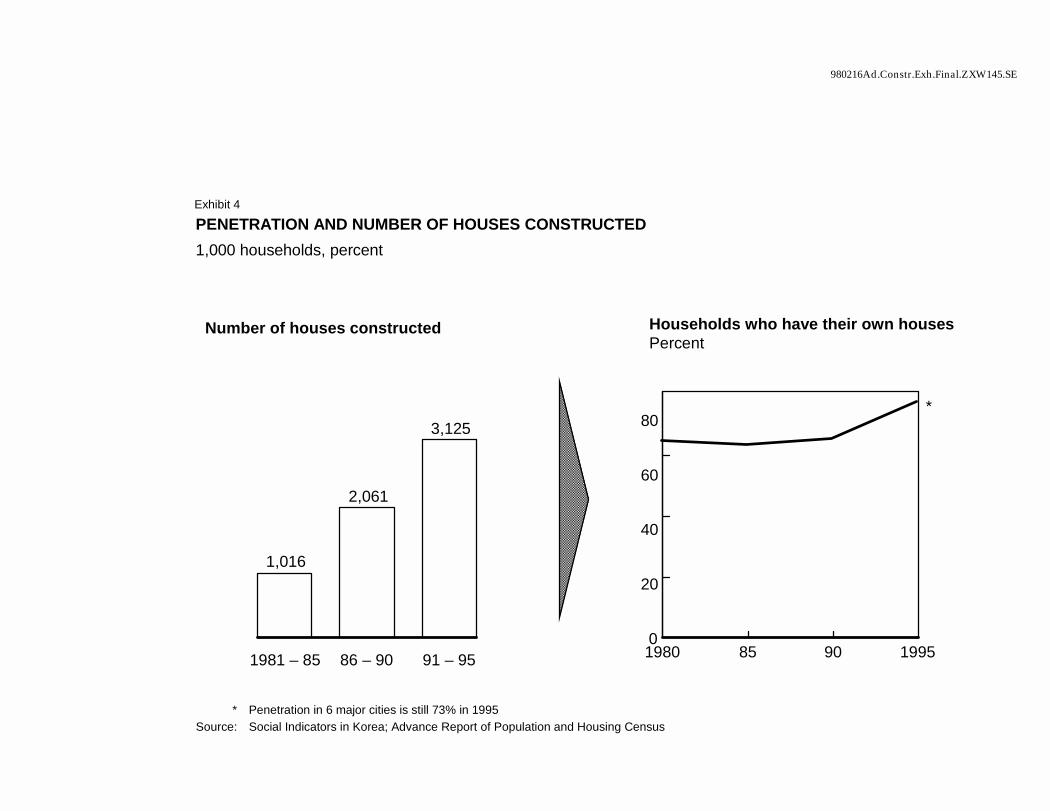
980216Ad.Constr.Exh.Final.ZXW145.SE
PENETRATION AND NUMBER OF HOUSES CONSTRUCTED1,000 households, percent
1,016
2,061
3,125
1981 – 85 86 – 90 91 – 95
Number of houses constructed Households who have their own housesPercent
0
20
40
60
80
1980 85 90 1995
*
* Penetration in 6 major cities is still 73% in 1995Source: Social Indicators in Korea; Advance Report of Population and Housing Census
Exhibit 4
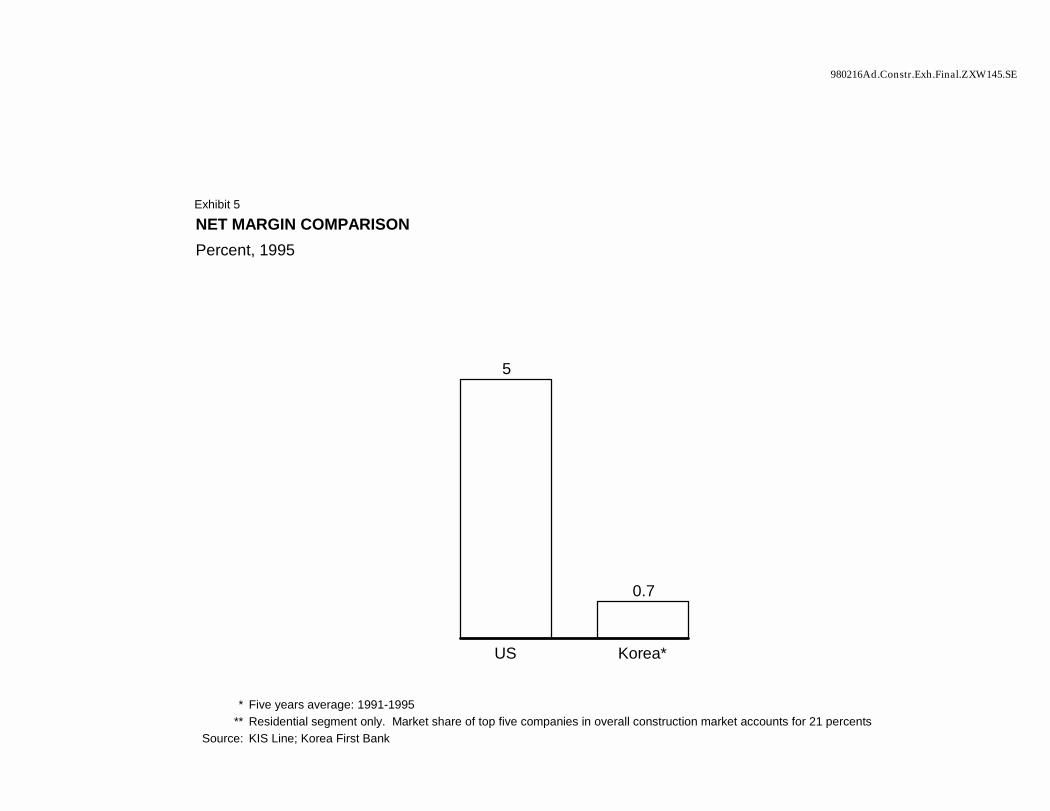
980216Ad.Constr.Exh.Final.ZXW145.SE
NET MARGIN COMPARISONPercent, 1995
* Five years average: 1991-1995** Residential segment only. Market share of top five companies in overall construction market accounts for 21 percents
Source: KIS Line; Korea First Bank
5
0.7
US Korea*
Exhibit 5
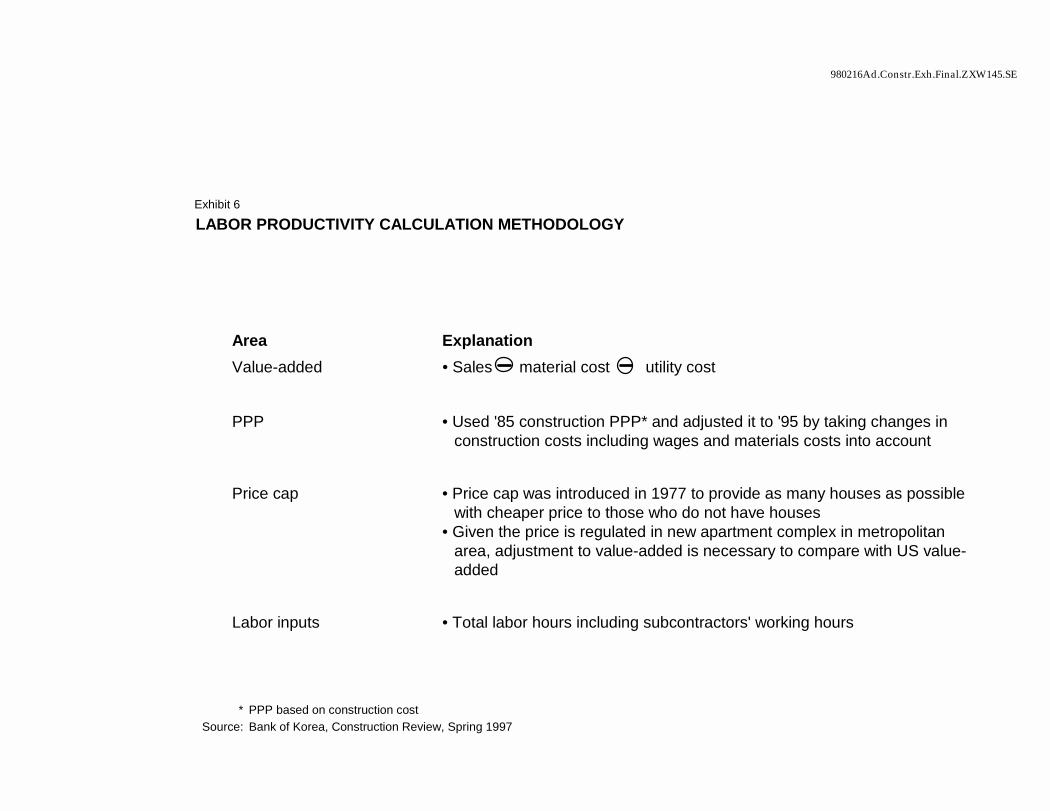
980216Ad.Constr.Exh.Final.ZXW145.SE
LABOR PRODUCTIVITY CALCULATION METHODOLOGY
* PPP based on construction costSource: Bank of Korea, Construction Review, Spring 1997
Area ExplanationValue-added • Sales material cost utility cost
PPP • Used '85 construction PPP* and adjusted it to '95 by taking changes in construction costs including wages and materials costs into account
Price cap • Price cap was introduced in 1977 to provide as many houses as possible with cheaper price to those who do not have houses
• Given the price is regulated in new apartment complex in metropolitan area, adjustment to value-added is necessary to compare with US value-added
Labor inputs • Total labor hours including subcontractors' working hours
Exhibit 6
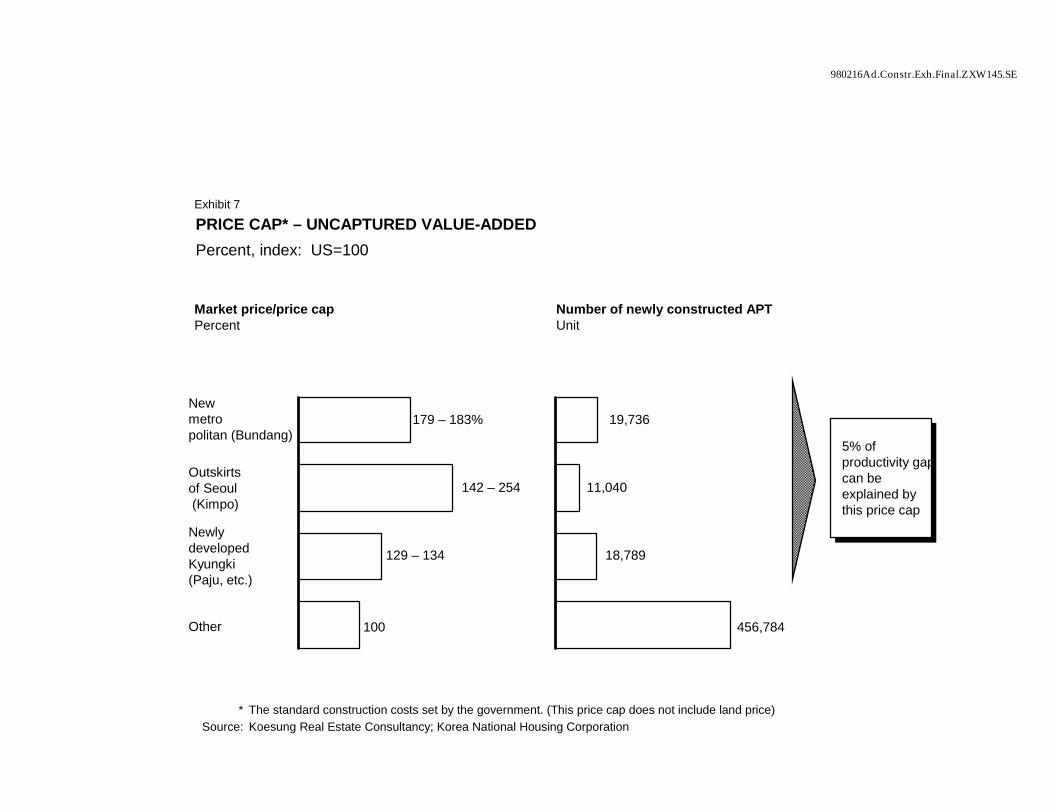
980216Ad.Constr.Exh.Final.ZXW145.SE
PRICE CAP* – UNCAPTURED VALUE-ADDEDPercent, index: US=100
* The standard construction costs set by the government. (This price cap does not include land price)Source: Koesung Real Estate Consultancy; Korea National Housing Corporation
New metropolitan (Bundang)
Outskirts of Seoul(Kimpo)
Newly developed Kyungki (Paju, etc.)
Other
179 – 183%
142 – 254
129 – 134
100
19,736
11,040
18,789
456,784
Market price/price capPercent
Number of newly constructed APT Unit
5% of productivity gap can be explained by this price cap
Exhibit 7
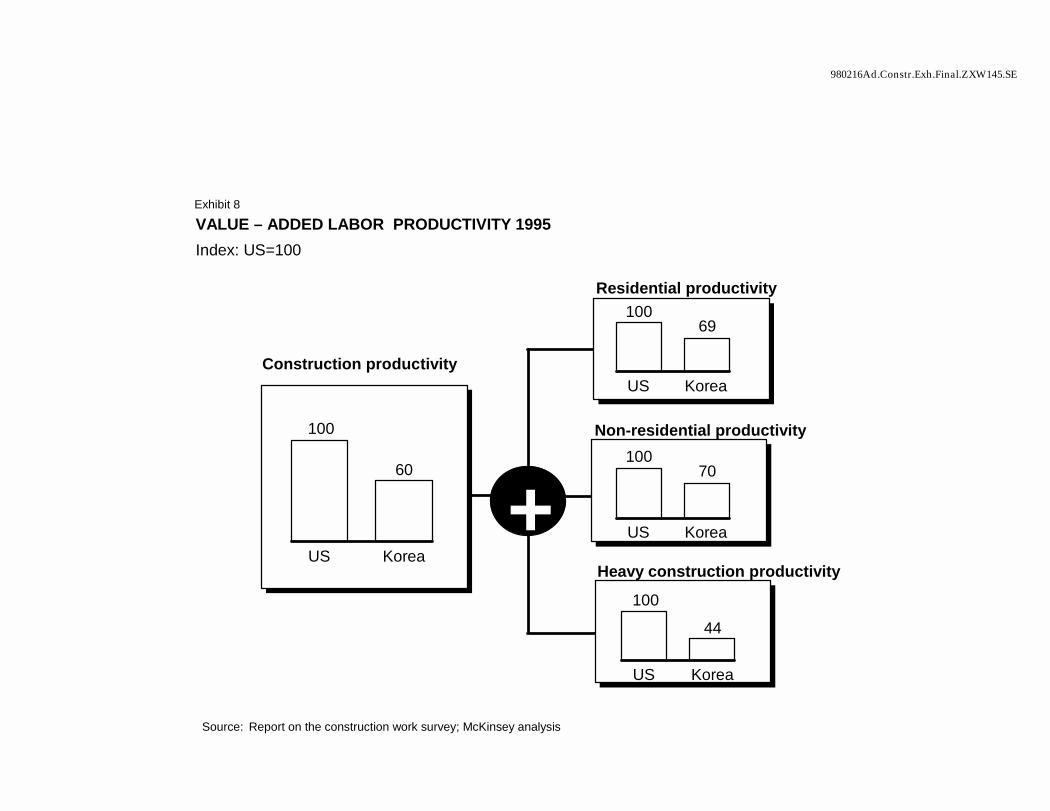
980216Ad.Constr.Exh.Final.ZXW145.SE
VALUE – ADDED LABOR PRODUCTIVITY 1995Index: US=100
Residential productivity
100
60
US Korea
Construction productivity
Non-residential productivity
10069
US Korea
+Heavy construction productivity
100
44
US Korea
10070
US Korea
Source: Report on the construction work survey; McKinsey analysis
Exhibit 8
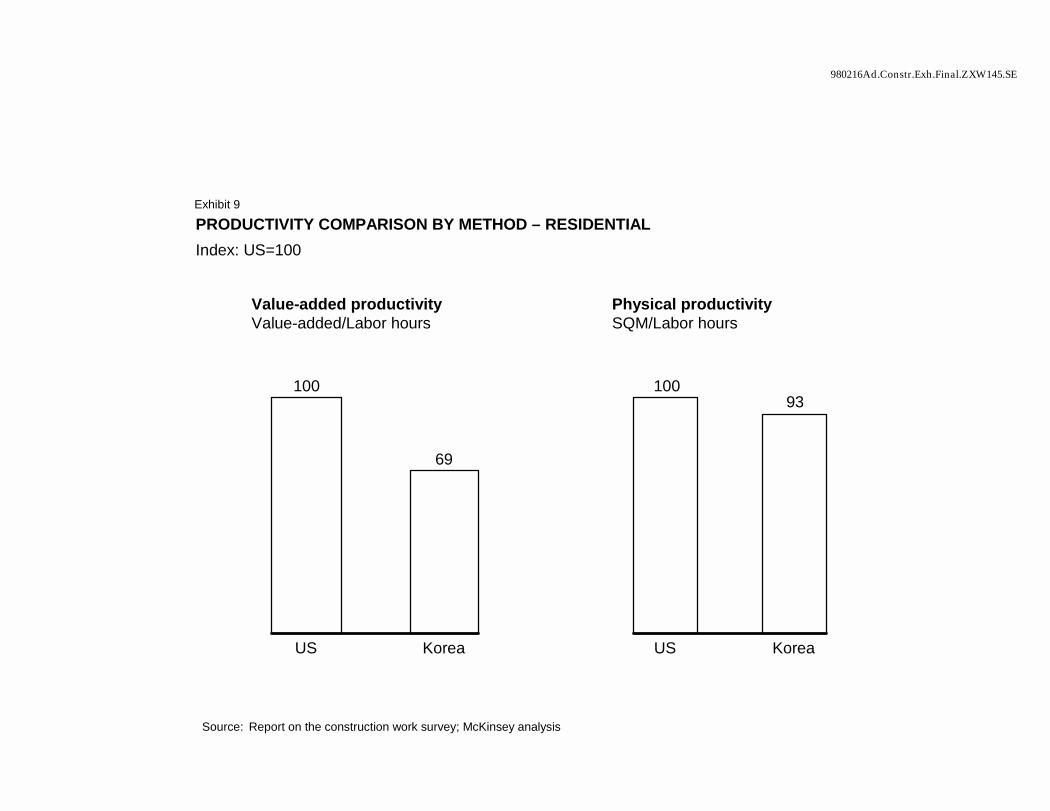
980216Ad.Constr.Exh.Final.ZXW145.SE
PRODUCTIVITY COMPARISON BY METHOD – RESIDENTIALIndex: US=100
Source: Report on the construction work survey; McKinsey analysis
100
69
US Korea
Value-added productivityValue-added/Labor hours
10093
US Korea
Physical productivitySQM/Labor hours
Exhibit 9
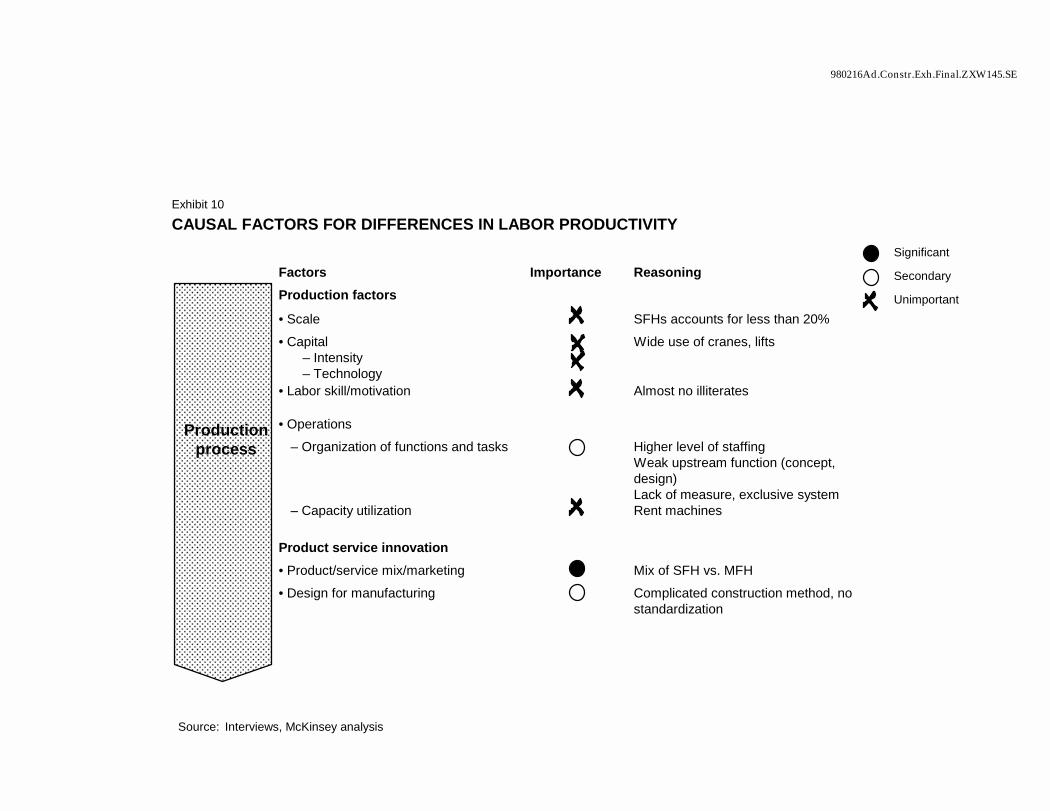
980216Ad.Constr.Exh.Final.ZXW145.SE
Factors Importance ReasoningProduction factors
• Scale SFHs accounts for less than 20%
• Capital – Intensity– Technology
Wide use of cranes, lifts
• Labor skill/motivation Almost no illiterates
• Operations
– Organization of functions and tasks Higher level of staffingWeak upstream function (concept, design)Lack of measure, exclusive system
– Capacity utilization Rent machines
Product service innovation • Product/service mix/marketing Mix of SFH vs. MFH
• Design for manufacturing Complicated construction method, no standardization
Source: Interviews, McKinsey analysis
Significant
Secondary
Unimportant
Production process
Exhibit 10
CAUSAL FACTORS FOR DIFFERENCES IN LABOR PRODUCTIVITY
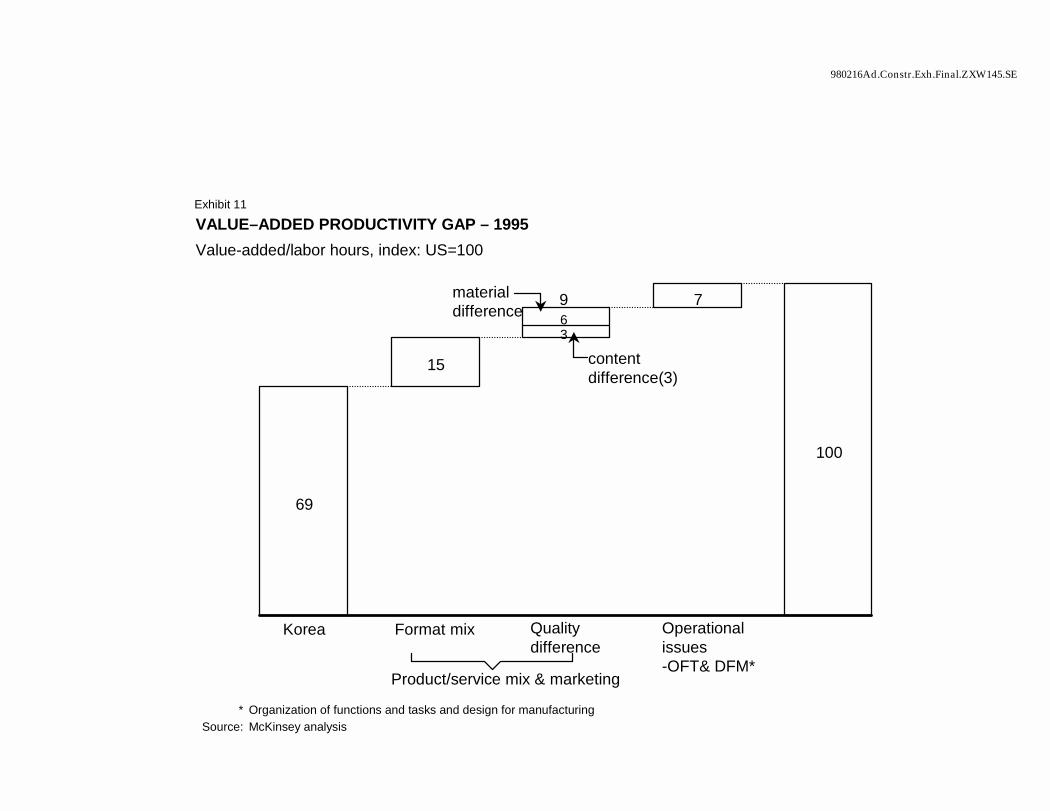
980216Ad.Constr.Exh.Final.ZXW145.SE
VALUE–ADDED PRODUCTIVITY GAP – 1995Value-added/labor hours, index: US=100
69
15
9 7
100
Korea Format mix Quality difference
Operational issues-OFT& DFM*
Exhibit 11
6
content difference(3)
material difference
Product/service mix & marketing
* Organization of functions and tasks and design for manufacturingSource: McKinsey analysis
3
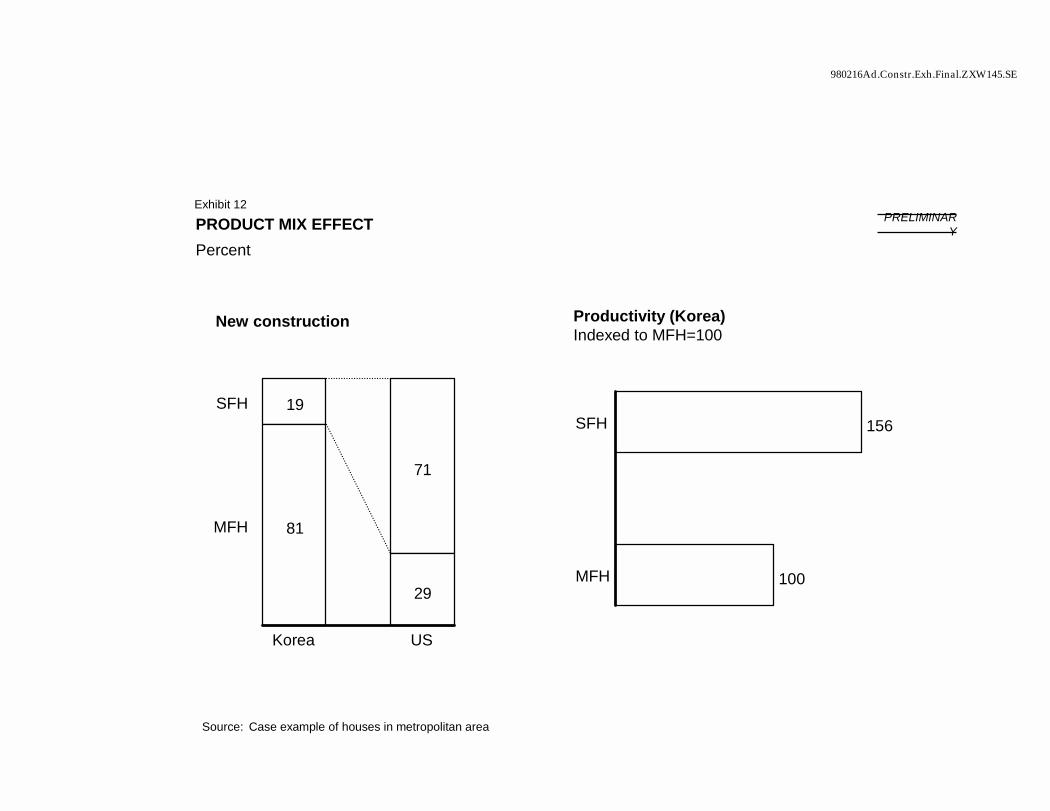
980216Ad.Constr.Exh.Final.ZXW145.SE
PRODUCT MIX EFFECTPercent
SFH 19
71
MFH 81
29
Korea US
New construction
156
100
SFH
MFH
Productivity (Korea)Indexed to MFH=100
Source: Case example of houses in metropolitan area
Exhibit 12PRELIMINAR
Y
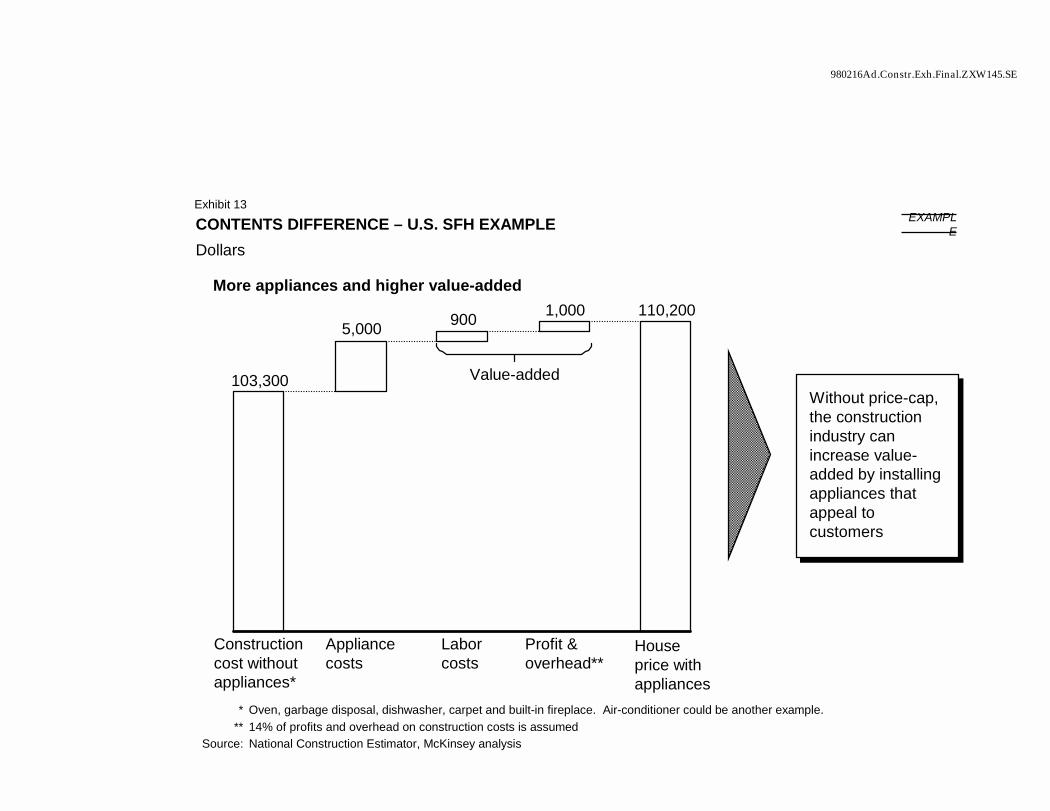
980216Ad.Constr.Exh.Final.ZXW145.SE
* Oven, garbage disposal, dishwasher, carpet and built-in fireplace. Air-conditioner could be another example.** 14% of profits and overhead on construction costs is assumed
Source: National Construction Estimator, McKinsey analysis
103,300
5,000 900 1,000 110,200
Constructioncost withoutappliances*
Appliancecosts
Laborcosts
Profit &overhead**
Without price-cap, the construction industry can increase value-added by installing appliances that appeal to customers
Without price-cap, the construction industry can increase value-added by installing appliances that appeal to customers
CONTENTS DIFFERENCE – U.S. SFH EXAMPLEDollars
More appliances and higher value-added
Value-added
Exhibit 13
House price with appliances
EXAMPLE
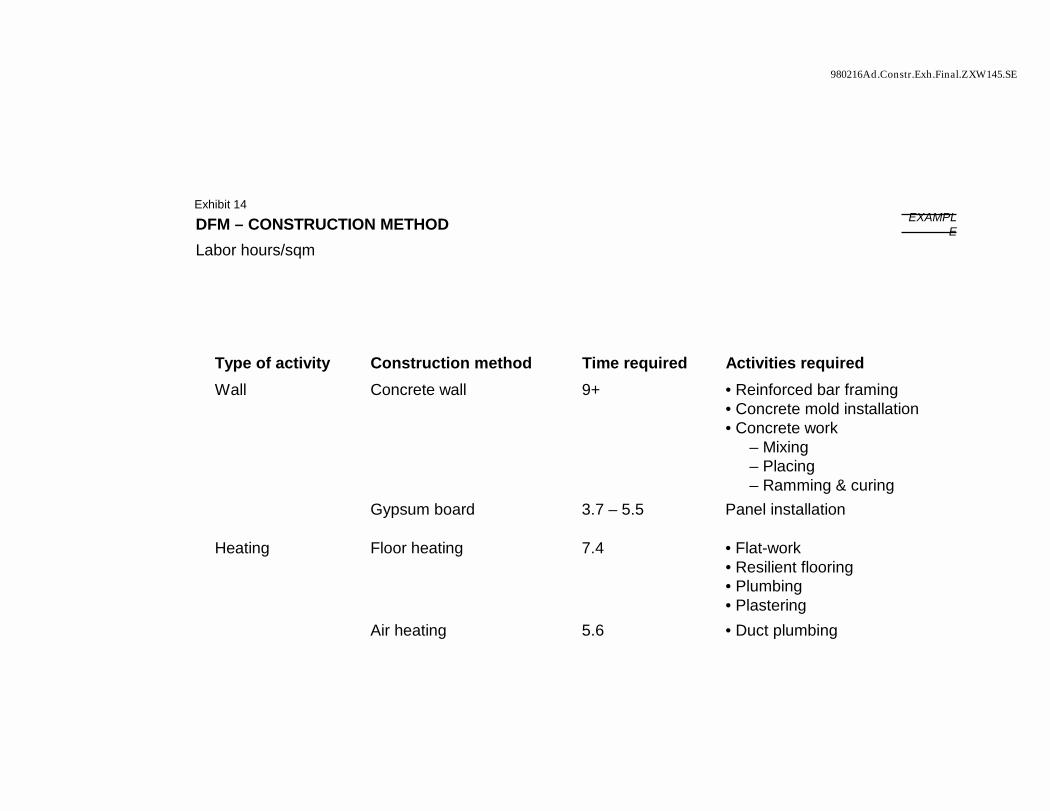
980216Ad.Constr.Exh.Final.ZXW145.SE
Type of activity Construction method Time required Activities requiredWall Concrete wall 9+ • Reinforced bar framing
• Concrete mold installation• Concrete work
– Mixing– Placing– Ramming & curing
Gypsum board 3.7 – 5.5 Panel installation
Heating Floor heating 7.4 • Flat-work• Resilient flooring• Plumbing• Plastering
Air heating 5.6 • Duct plumbing
DFM – CONSTRUCTION METHODLabor hours/sqm
Exhibit 14EXAMPL
E
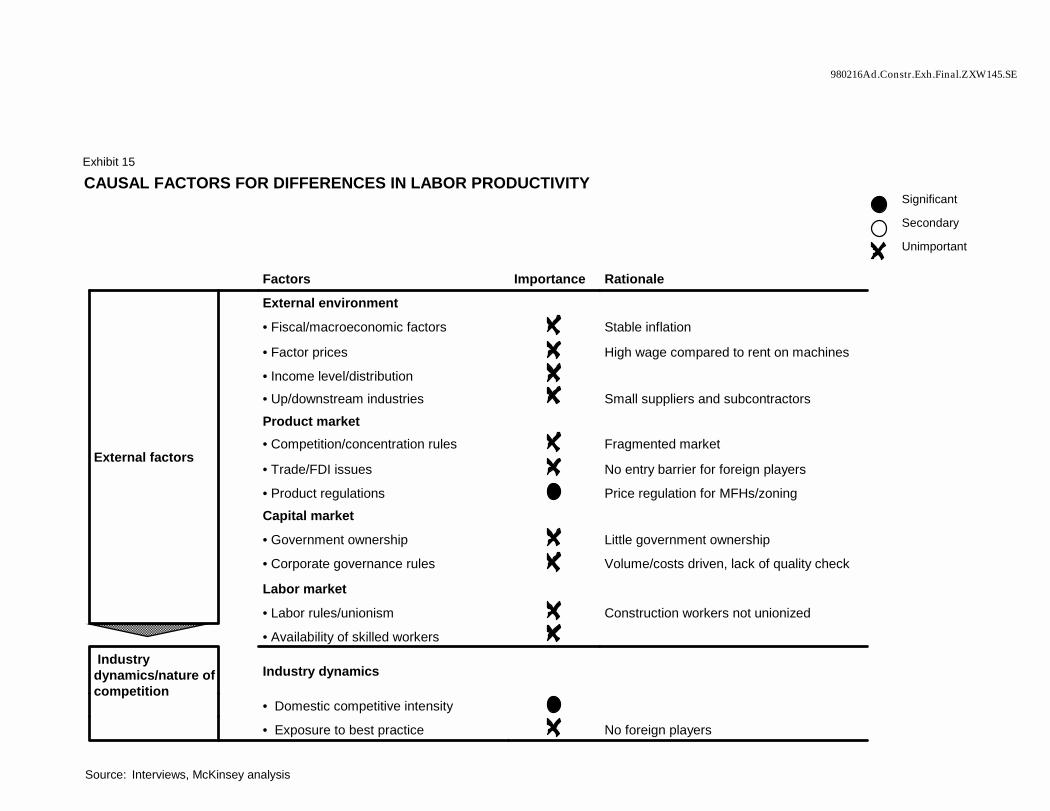
980216Ad.Constr.Exh.Final.ZXW145.SE
Factors Importance Rationale
External factors
External environment
• Fiscal/macroeconomic factors Stable inflation
• Factor prices High wage compared to rent on machines
• Income level/distribution
• Up/downstream industries Small suppliers and subcontractorsProduct market• Competition/concentration rules Fragmented market
• Trade/FDI issues No entry barrier for foreign players
• Product regulations Price regulation for MFHs/zoningCapital market
• Government ownership Little government ownership
• Corporate governance rules Volume/costs driven, lack of quality check
Labor market
• Labor rules/unionism Construction workers not unionized
• Availability of skilled workers Industry dynamics/nature of competition
Industry dynamics
• Domestic competitive intensity
• Exposure to best practice No foreign players
Source: Interviews, McKinsey analysis
Significant
Secondary
Unimportant
Exhibit 15
CAUSAL FACTORS FOR DIFFERENCES IN LABOR PRODUCTIVITY
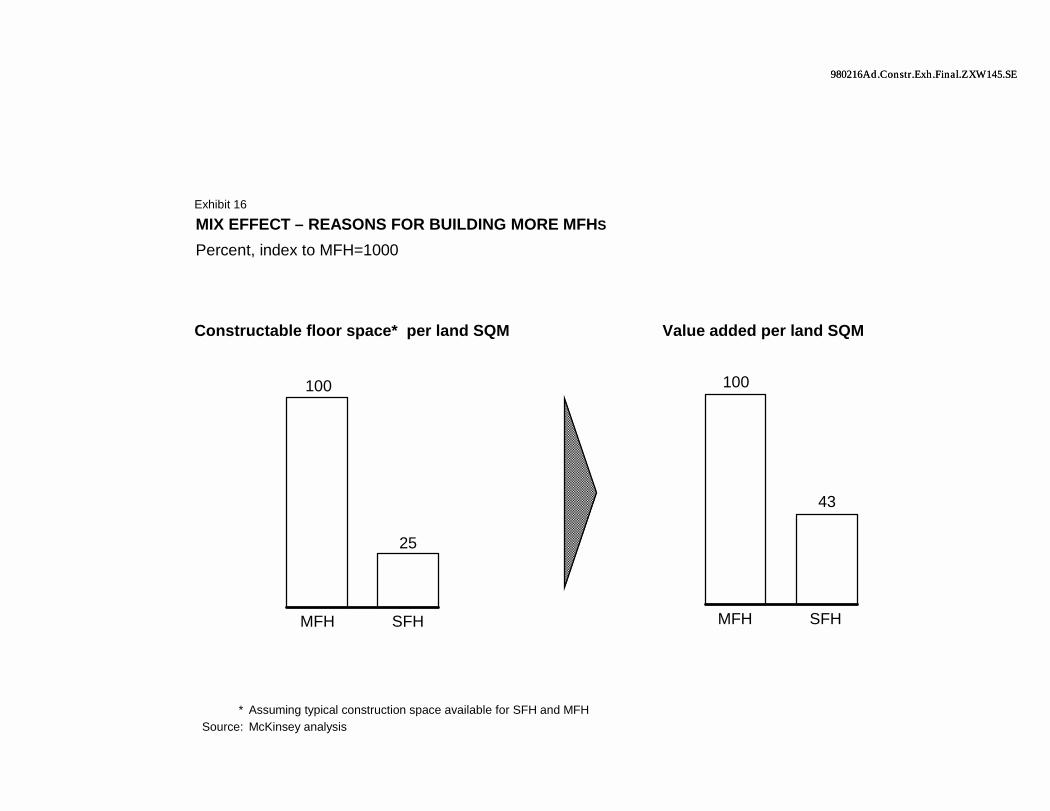
980216Ad.Constr.Exh.Final.ZXW145.SE980216Ad.Constr.Exh.Final.ZXW145.SE
100
25
MFH SFH
Constructable floor space* per land SQM
100
43
MFH SFH
Value added per land SQM
MIX EFFECT – REASONS FOR BUILDING MORE MFHS
Percent, index to MFH=1000
Exhibit 16
* Assuming typical construction space available for SFH and MFHSource: McKinsey analysis
Processed food industry
Executive Summary
The diversity of products within the processed food industry makes it the most heterogeneous of the industries covered in this MGI report. In addition to the inherent product heterogeneity, the Korean processed food industry consists of subcategories with widely varied levels of industry development, reflected in the capital intensity1 and scale of production. In order to take this latter diversity into account, we have chosen to focus on the performance of two subgroups of industries:
¶ High capital intensity group. In sub-categories such as confectionery, dairy, sugar and bakery, capital investments have rapidly substituted for labor, and most plants have reached an efficient scale with up-to-date technology. Despite high investments, both labor and capital productivity are low.2
¶ Low capital intensity group. Capital investment levels have been low in products such as milling, preserved fruits/vegetables, and noodles, and a gap in plant scale vs. best practice is found in this group. Therefore, labor productivity is low due to a lack of automation, whereas capital productivity is high simply as a result of low investments.
Our conclusions are based on in-depth study of three sectors of the food industry – confectionery and dairy of capital intensive sectors and wet corn milling of low capital intensity ones. In addition, we have conducted extensive interviews with industry experts. Interestingly, the characterization of industries by the level of capital intensity can be done for the overall Korean economy as well; most of the manufacturing industries and telecommunications utilize close to best practice levels of capital per labor hour, while services and parts of processed food lag far behind with low capital intensity relative to world best practice.
1 Capital intensity is defined as capital stock / labor hours. 2 Productivity of confectionery and bakery is below US level. Although dairy and sugar show at or above US
level of productivity, the US may not show best practice; therefore it is not believed to be an effective benchmark.
The overall Korean processed food industry shows low productivity performance. In total factor productivity (TFP), Korea reached only 46% of the US level in 1995.
Our analyses suggest that the low productivity performance of the Korean processed food industry is the result of the following factors:
¶ Limited competitive pressures. Barriers to trade/FDI (foreign direct investment) have prevented best practice exposure and subsequent managerial skills transfers – this is especially apparent in marketing deficiencies and the inefficient organization of functions and tasks. In addition, an underdeveloped retail sector fails to exert price pressure on food distributors, thus lowering competition.
This low competition level has allowed certain sectors of the industry to remain underdeveloped, as have other product market regulations (designed to protect small mom & pop type operations) limiting the number of entrants into the industry.
¶ Corporate governance focus. Corporate incentives tend to focus on growth, not profit, which promotes excessive capital investment, lower capacity utilization and inefficient product portfolio management as companies focus on sales rather than return-on-invested-capital (ROIC) measures. This was particularly relevant to the high capital intensity group.
2
Processed food case study
We defined processed food3 to be all products modified in an intermediary manufacturing plant before reaching consumers. Our analysis included eleven product groups4 [Exhibit 1]: meat, dairy, preserved fruits and vegetables, fats and oils, seafood, confectionery, milling, bakery, noodles, sugar, and seasoning.
These eleven product groups vary widely in the level of industry development, reflected in the capital intensity and scale of production [Exhibit 2]. In order to reflect this diversity, we have chosen to focus on two subgroups from the opposite ends of the range of capital intensities:
¶ High capital intensity group. In sub-categories such as confectionery, dairy, sugar and bakery, capital investments have rapidly substituted for labor, and most plants have reached an efficient scale with up-to-date technology. In terms of productivity performance, both labor and capital productivity are low 5.
¶ Low capital intensity group. Capital investment levels have been low in products such as milling, preserved fruits/vegetables, and noodles, and a gap in plant scale vs. best practice is found in most plants in this group. Labor productivity is very low due to low automation level; and capital productivity is relatively high simply due to low investment level.
Our conclusions are based on in-depth study of three sectors of the food industry – confectionery and dairy of high capital intensive sectors and wet corn milling for low capital intensive ones. In addition, we have conducted extensive interviews with industry experts to assess how applicable our findings in the studied sub-sectors are of others at the same stage of development.
Interestingly, this wide variance in capital intensity relative to best practice can be observed in the overall Korean economy as well. As explained in the synthesis chapter, Korean industries overall can be roughly grouped into two by their relative capital intensity. Most of the manufacturing industries and telecommunications
3 Beverages, animal/pet food, and all fresh foods were excluded from this study. 4 The “Others” category was excluded from this comparison because the products comprising this residual
category were too dissimilar across countries. 5 See footnote 2.
3
utilize close to best practice levels of capital per labor hour, while services and parts of processed food lag far behind with low capital intensity. In terms of productivity improvement, there is an opportunity to raise productivity without making major new investments in the former group, while both investment and increases in productivity are required in the latter one.
Confectionery, dairy, and milling were selected as mini-case examples to represent these two categories and to provide a detailed understanding of productivity levels and the causality of the performance gap. The US and Japan were selected as comparative markets for productivity performance – the US for its highly developed processed food industry and Japan for its similar food culture.
Because of the heterogeneous characteristics of the processed food industry, the relative productivity of different products, the external environment, and the production process varied among the sectors studied. Throughout in-depth research of each mini-case, we tried to draw most representative conclusions for the overall processed food industry. However, attention may be required in generalizing conclusions to specific product cases across countries.
4
METHODOLOGY
Due to the wide range of product diversity and heterogeneous characteristics of each product group, mini case examples, which can represent the overall processed food case, were selected to identify key causes of productivity gaps. Explanation of productivity performance at the production process level differed enough in the mini case examples to merit separate sections addressing each; however an aggregate description will suffice for industry dynamics and external factors for all mini cases. Product purchasing parity As PPP for the Korean processed food industry is not available from public sources, several steps were taken to compute PPPs. First, 400 sample products were selected from 12 different product groups, and then retail prices for Korea and the US were obtained through supermarket surveys. Factory gate prices were then generated based on an adjustment for sales tax and distribution margin. As supermarket survey prices were from 1997, the food PPPs for 1995 and other years were deflated by using PPI (producer price index). Finally, by taking the product-specific PPP and calculating a weighted average based on sales, both the aggregate and the sector PPP conversion rates were obtained. The aggregate food processing PPP in 1995 derived in this way is 966.81 won for 1 US dollar.
Capacity utilization As the capacity utilization ratio can vary depending on the measurement and the definition of full capacity level, we developed a standard definition in this case to obtain an accurate comparison between Korea and the US. Based on our definition, capacity utilization ratio was quantified as actual machine running hours compared to theoretical full capacity (7 days, 24 hours). Furthermore, rather than using publicly available data sources for capacity utilization, we conducted extensive field interviews with plant managers in the US and Korea to develop an accurate micro-level capacity utilization comparison.
INDUSTRY OVERVIEW
Processed food is a vital part of the Korean economy, accounting for 3.3% of national GDP and 2.2% of total employment [Exhibit 3]. Because of the perishable nature of most processed food products and a lack of export efforts to overseas markets, processed food is considered a non-traded industry, with an export/import ratio of under 10% [Exhibit 4].
5
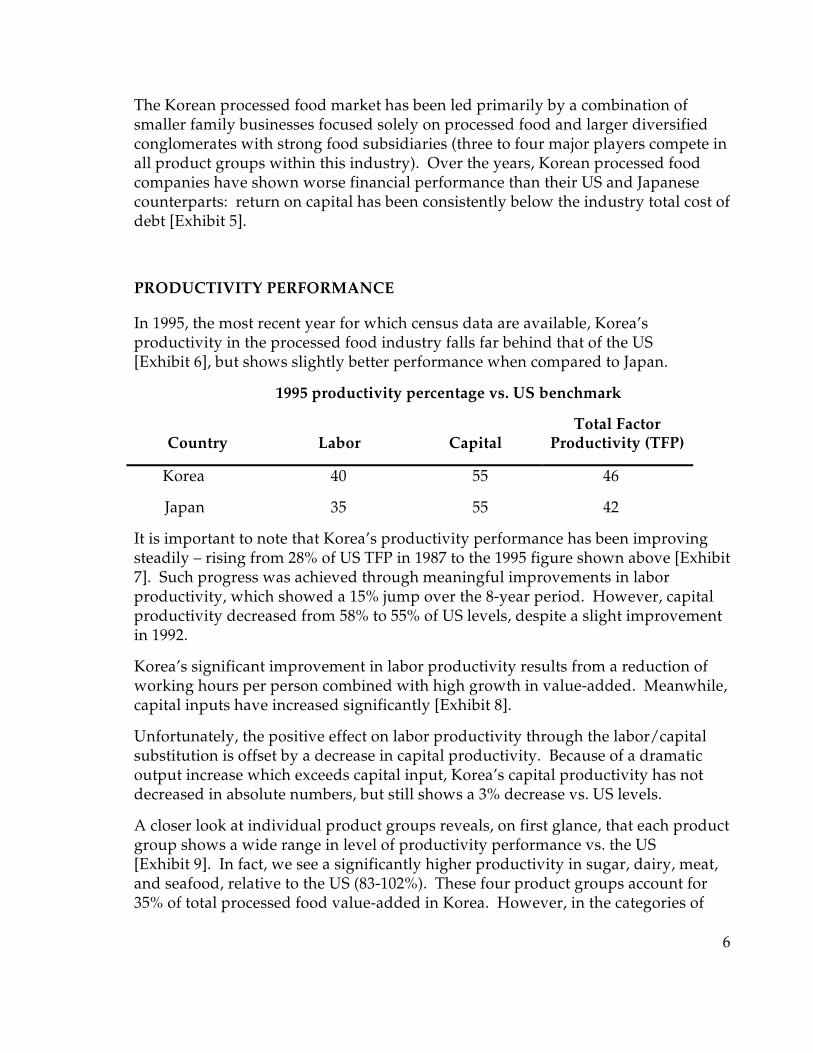
The Korean processed food market has been led primarily by a combination of smaller family businesses focused solely on processed food and larger diversified conglomerates with strong food subsidiaries (three to four major players compete in all product groups within this industry). Over the years, Korean processed food companies have shown worse financial performance than their US and Japanese counterparts: return on capital has been consistently below the industry total cost of debt [Exhibit 5].
PRODUCTIVITY PERFORMANCE
In 1995, the most recent year for which census data are available, Korea’s productivity in the processed food industry falls far behind that of the US [Exhibit 6], but shows slightly better performance when compared to Japan.
1995 productivity percentage vs. US benchmark
Country
Labor
Capital
Total Factor Productivity (TFP)
Korea 40 55 46
Japan 35 55 42
It is important to note that Korea’s productivity performance has been improving steadily – rising from 28% of US TFP in 1987 to the 1995 figure shown above [Exhibit 7]. Such progress was achieved through meaningful improvements in labor productivity, which showed a 15% jump over the 8-year period. However, capital productivity decreased from 58% to 55% of US levels, despite a slight improvement in 1992.
Korea’s significant improvement in labor productivity results from a reduction of working hours per person combined with high growth in value-added. Meanwhile, capital inputs have increased significantly [Exhibit 8].
Unfortunately, the positive effect on labor productivity through the labor/capital substitution is offset by a decrease in capital productivity. Because of a dramatic output increase which exceeds capital input, Korea’s capital productivity has not decreased in absolute numbers, but still shows a 3% decrease vs. US levels.
A closer look at individual product groups reveals, on first glance, that each product group shows a wide range in level of productivity performance vs. the US [Exhibit 9]. In fact, we see a significantly higher productivity in sugar, dairy, meat, and seafood, relative to the US (83-102%). These four product groups account for 35% of total processed food value-added in Korea. However, in the categories of
6
sugar and dairy, we believe that US companies have not reached world-class production levels due to product regulations or lack of mass production. Therefore, Korea’s high productivity in sugar and dairy likely reflects the relatively low performance of US counterparts, rather than the outstanding performance of Korean companies. We did not study seafood, and therefore, do not know the drivers of strong Korean performance in this group. Productivity performance in bakery, confectionery, milling, and seasoning is quite poor, reaching only 21-47% of the US levels.
In terms of capital and labor productivity performance, productivity vs. the US varies widely in different product groups, although considering the variations in US performance vs. best practice mentioned above, may actually not be as significantly different [Exhibit 10].
As Japan does not show significant productivity differences compared to Korea, our analyses were mainly focused on understanding the key causes for productivity differences between Korea and the US. The key causes for productivity gaps were divided into three levels: production process, industry dynamics, and external factors. As stated in the methodology sections, mini-case examples – confectionery, dairy, and wet-corn milling – were used to illustrate specific issues in the production process. Because of the similarity of key issues across mini case examples, industry dynamics and external factors are discussed mainly at an aggregate level.
Production process
In the processed food industry overall, a lack of plant operation expertise and low marketing skills were largely responsible for Korea’s low productivity performance. These factors, along with low capital intensity and scale level in the less developed sectors, contributed to the following causes of low productivity [Exhibit 11]:
¶ Low capacity utilization. Capacity decisions were made based on peak demand, and low utilization resulted when output growth slowed. A lack of ability to forecast consumer demand also caused low capacity utilization. In confectionery, for example, many dedicated lines were built for new products which did not sell at forecast levels – mostly due to a lack of marketing expertise in forecasting consumer demand.
¶ Low automation level. In low capital intensity sectors (milling, noodles, and preserved fruits/vegetables), low labor productivity is mainly caused by a lack of automation-associated technology and scale. In high capital intensity sectors, capital has rapidly substituted for labor; however, overall automation level is still relatively low, particularly in packaging areas.
7
¶ Inefficiency in organization of functions and tasks and low marketing skills. Korean processed food companies have not adapted best managerial practices, particularly as seen in the inefficient organization of functions and tasks and low marketing skills. This skill gap both contributed to the low capacity utilization and automation level described above, as well as lowered productivity in other areas.
¶ Scale. In spite of small domestic market size, scale is not a key issue in the high capital intensity group. Most plants have reached an efficient scale level with modern capital equipment. However, a large gap of plant scale is found in the low capital intensity group and it lowered productivity results because of the failure to achieve economies of scale.
Confectionery The confectionery industry consists of three sub-categories: biscuits, chocolate/candy6, and ice-cream. Korea and the US show a varying portion of total sales in each sub-category [Exhibit 12]. In Korea, sales from these three sub-categories were approximately even; in the US, chocolate/candy generated half of total confectionery sales with ice-cream and biscuits approximately splitting the remaining 50%.
In the confectionery category, Korea’s total factor productivity showed a 17% average growth rate during the last eight years, however, the speed of improvement has been much faster in labor productivity than capital productivity [Exhibit 13]. Korea’s confectionery total factor productivity is only 42% of the US level with capital productivity at 39% and labor productivity at 44% of the US level. Low capacity utilization explains 25-30% of the capital productivity gap and a low automation level in packaging lines accounts for 20-25% of the labor productivity gap [Exhibit 14]. The remaining gap in labor and capital productivity was from inefficient organization of functions and tasks and lack of sufficient marketing functions and skills.
Low capacity utilization ratio. In actual machine running hours, Korean plants show 42 hours less than their US counterparts per week [Exhibit 15]. To understand issues causing the gap in actual running hours, hours between theoretical full capacity and actual machine running hours were broken down into three categories: regular shutdown7, line shutdowns due to low demand (machines running less than full capacity), and operating downtime. Time losses from regular shutdowns are similar in both countries. Line shutdown time due to low demand is four times
6 Gum is also included. 7 Regular shutdown time applies to scheduled line stops during weekends and meal breaks.
8
bigger in Korea than the US, and Korea also shows two times more operating downtime.
Through extensive interviews with managers in Korean confectionery companies, we learned that misallocations of capital investment, capacity decisions based on the peak demand, and inefficiency in organization of functions and tasks are the key issues causing low capacity utilization ratios.
¶ Misallocation of capital investment. In many cases, dedicated lines were built to produce one new product with optimistic sales forecasts based on insufficient analyses. As a result, many new products ultimately did not sell at forecast levels and showed a dramatic drop in sales volume. In an extreme case of one gum line example, a product produced by dedicated lines dropped to 20% of full capacity level after a few months of launching. In contrast, the US best-practice companies operate focused plants and flexible plants separately to minimize the risk of producing new products by dedicated lines. Most new products are produced at a highly flexible plant which can deal with around 200 SKU (stock keeping units) and later – when long-term performance is demonstrated – move to a focused plant, which produces less than 50 SKUs with dedicated lines. In addition, outsourcing of production is also frequently applied for new products for the first one year of production.
¶ Capacity decisions. Korean confectionery plants typically based capacity decisions on peak demand, rather than average demand. Korean companies tend to avoid having high inventory stocks and are somewhat reluctant to utilize outsourcing. Furthermore, when the market was at a high growth stage, excess capital investment could be absorbed by the rapid increase of production volume, and aggressive capacity expansion increased the companies’ market shares. Therefore, capacity additions made more economic sense in the 1970 - 80s. Since the late 1980s, however, the growth rate of the Korean confectionery industry has gradually decreased, but capital investment has been maintained at the prior high growth level [Exhibit 16]. Due to the failure to change investment patterns, Korean companies started to suffer from low capacity utilization. In discussing our findings with industry experts, many questioned whether the low capacity utilization was merely a cyclical phenomenon or was “normal” in a growing economy. Due to the continuation of high investment over the last ten years despite significant decline in demand,
9
we do not believe that the low capacity utilization was the result of cyclical downturn in demand or a “rational” effort prepare for continued demand growth. This is confirmed by the industry’s high capital input. The Korean confectionery industry has shown a very rapid increase of capital inputs, surpassing the US level of capital intensity by 12% in 1995 [Exhibit 17].
¶ Inefficiency in organization of functions and tasks. Best-practice companies organize workers and tasks to maximize production capacity. For example, US lines run on a rotation basis to lower downtime and yield losses, while Korean lines often stop during meal times.
Low automation in packaging lines. Although capital input in the confectionery industry is high as described above, capital investment has mostly focused on immediate production lines, leading to a continued lack of automation in packaging lines. Biscuit production lines show very little difference in automation level at mixing, cutting, and baking stages, but there is a 30-35% gap in packaging lines which explains 20-25% of the labor productivity gap [Exhibit 18].
There are two reasons for the gap in packaging line automation. First of all, capital allocation was poorly planned; it was focused on building immediate dedicated production lines and lacked systematic analysis of automation opportunities.
Second, the recent trends have resulted in excessive packaging (double wrapping, individual packages, etc.) and small package sizes, which both limit automation. Although US plants use manual and semi-automated packaging lines in some cases, the overall level of automation is much higher than in Korea due to better capital planning, and simpler and bigger packaging.
Lack of marketing functions and skills. The limited marketing efforts of Korean companies have focused on introducing numerous new products every year, with success regarded as more or less a “probability game” rather than a result of extensive marketing efforts. Active test-marketing and new demand creation have not been actively practiced, leading to a lack of investments in promoting long-lasting brands and focused product lines. A failure to understand and shape consumer demands has led to missed opportunities (e.g., creating consumer demand for more “productive” products such as bulk products or higher value-added products). Furthermore, a lack of consumer understanding contributed to the inaccurate demand forecasts leading to the aforementioned capacity utilization issues.
Another distinguishable phenomenon of the Korean confectionery industry is preponderance of “me-too” products. In order to defend market share positions, companies copy the characteristics of hit products. These “me-too” products can
10
retain market share on a short-term basis but ultimately kill the product market – most do not reach the quality level of original products, thus deteriorating the overall reputation and even pushing the product to exit from the market. This trend in “me-too” products prevents the building of long-lasting brand equity, shortens overall product life cycles, and most importantly, is not profitable for companies.
In contrast to Korean companies, US companies have shown better product portfolio management skills as they are more focused on building core brands as well as global brands. Although it is difficult to obtain product life cycle data for both countries, with the competitive introduction of “me-too” products, we hypothesize that Korean products have much shorter product life cycle and lower sales levels than US ones where marketing efforts are heavily focusing on modifying and diversifying existing successful brands. At least among hit products, product life cycles are much shorter than in the US. In 1996, the average product life cycle of the top 10 leading brands was ten years in Korea compared to fifty six years in the US. However, considering the shorter history of Korean companies8, it would be too early to conclude that Korea shows much shorter product life cycle for hit products.
The lower product sales levels, however, are confirmed by an analysis of sales per product [Exhibit 19]. In 1996, Korea showed sales per product at only 10% of the US level. When product sales were converted to per capita, the US was still 1.7 times bigger than Korea. This indicates a high potential for improving marketing efforts to reach US levels of product sales per capita as well as reinforces the importance of building global brands to overcome the relatively small domestic market size.
Inefficiency in organization of functions and tasks. Although Korean companies have enhanced their organization of functions and tasks in various efficient ways (e.g., confectionery companies shift production workers between ice cream and chocolate plants during different seasons) to help improve their labor productivity, the overall efficiency of organization of functions and tasks is still below the US level.
Korean firms have failed to adopt managerial best practice despite significant improvement in production technology. As explained earlier, this inefficiency leads to low capacity utilization ratios as well as automation levels. It also lowered productivity performance in other ways. For example, the practice of shutting production during meal break lowers not only capacity utilization, but also yield levels. Furthermore, many functions are not staffed as leanly as possible. Finally, most Korean companies do not display the desirable skill level yet in areas such as
8 Korean companies have been in the market for average of 40 years and history of US companies is around 100 years.
11
discipline/flexibility in task assignment, job rotation, and clear skill criteria, especially in engineering and maintenance areas.
Dairy The Korean dairy industry reached 97% of the US total factor productivity performance [Exhibit 20]. Labor productivity surpassed the US performance by 1% and capital productivity showed only an 8% gap in 1995. To clarify key causes of the capital productivity gaps, further research was conducted on fluid milk, which accounts for 81% of total dairy sales.
Compared to US level, Korea showed 90% of total factor productivity performance, with capital productivity at 80% of the US level and labor productivity at 98% of the US level. Again as in the confectionery case, a low capacity utilization ratio is the key issue and explains most of the productivity gap. By applying the same measurement as in the confectionery case, Korean fluid milk plants show 18.8 less hours per week in actual machine running hours compared to US counterparts. Like confectionery case, low utilization is mainly caused by peak demand based capacity planning and lack of careful forecasting of future demand level.
Even though Korea reached the US level of productivity performance, it is too early to conclude that Korea shows high performance because the US does not display best practice in this sector.9 In 1994, the Netherlands dairy industry outperformed the US by 44% in labor productivity. This high productivity level is mainly due to larger scale of operations, especially in milk powder and cheese. In addition, the Dutch level of dairy production per capita is twice as high as the US, probably due to the close proximity of major export markets and the EU’s massive support for dairy farming – including high import tariffs and export subsidies. Furthermore, as the export market has become increasingly competitive, Dutch dairy cooperatives have pushed industry consolidation through a series of mergers, pursued scale advantages, and lowered input price.
While the Netherlands’ overall dairy industry shows global best practice, the US may have some individual high performers. In an analysis10 of the productivity of 35 fluid milk plants in the US, the average of the three most productive plants performed 64% above the total average for the 35 fluid milk plants.11 Fewer SKUs, a higher capacity utilization ratio, narrower product mix focusing on gallon and half-gallon containers, and a higher proportion of products handled on pallets all led to
9 Previous MGI work compared productivity performance among the US, European countries, and Japan. 10 See An Analysis of Processing and Distribution Productivity and Costs in 35 Fluid Milk Plants, February 1997,
Cornell Program on Dairy Markets and Policy. 11 Plant labor productivity for the 35 plants averaged 174 gallons per hour of labor. The three most productive
plants averaged 286 gallons per hour.
12
increased plant labor productivity. Captive plants (those owned by supermarket companies) showed the high-performing characteristics described above and had an advantage of 28% in labor productivity compared to full-line dairies.
Scale. For both dairy and confectionery, there is no significant gap in plant scale. Most Korean dairy and confectionery plants reached an efficient scale with up-to date technology. Only US biscuit plants show scale advantages compared to Korean plants; major US plants are two times bigger in terms of production volume. In fluid milk, chocolate, and ice-cream, Korean plants generate similar output to US levels in production volume and value-added per plant.
As found in other industries, the cases of dairy and confectionery suggest that in the more developed, capital intensive sectors, Korea does not suffer from a scale disadvantage relative to world best practice. This finding is counter to conventional wisdom that Korean plants suffer from scale disadvantages due to the smaller Korean market.
Wet corn milling We focused on the wet corn milling sector12 within the milling industry to complete our case analysis. Please note that we have not studied this sector as rigorously as the confectionery and dairy cases. Instead we provide a summary overview of the key drivers of low productivity in this sector, with the goal of outlining how the low capital intensity sectors differ from the high capital intensity ones.
The total factor productivity for Korean wet corn milling was 43% of the US level in 1995 [Exhibit 21]. This industry is underdeveloped and the labor productivity gap stems mainly from low labor productivity due to low automation/technology levels, poor plant management skills, and economies of scale.
Capital intensity/technology. In spite of recent capital investments, in 1995 the capital intensity in the Korean wet corn milling was only 26% of the US level. Most plants were built over 20 years ago, and the production lines have outdated equipment. Invested capital has mostly been spent on line expansion, while overall modernization has been kept to a minimum. The result has been a low automation level and a significant technology gap vs. the US, especially in the production of high value-added products.
Organization of functions and tasks. Just as in the other examples, inefficiency of organization of functions and tasks was also found in the wet corn milling sector. The lack of efficient plant management skills have lead to over staffing and low yields, among other issues, and lowered productivity.
12 Wet corn milling produces starch, HFSC (high-fructose corn syrup), glucose, etc.
13
Scale. On average, US plants are five times larger than Korean plants in terms of production capacity. Although small plant scale itself does not necessarily prohibit automation (the most automated plant in Korea reached only average production capacity), Korean plants do not benefit from the economies of scale advantages of US plants.
Industry Dynamics
Because the industry dynamics are quite similar across our industry mini cases, we discuss them herein mainly at an aggregate level, with specific examples from the mini cases when appropriate. Analyses on industry dynamics focused on two key levers; competitive intensity and exposure to best practice [Exhibit 22].
Competitive intensity The degree of competitiveness in the Korean processed food industry is low relative to the US – both among domestic players and against the world’s best-practice companies. In terms of market concentration, the processed food industries in both Korea and the US are very concentrated in most product categories as shown in these three mini-case examples [Exhibit 23].
However, Korea’s competitive intensity is lower largely because of the underdeveloped retail industry. In Korea, around 80% of food retailers are “mom & pop” stores and the presence of large new formats such as hypermarkets or large discount stores is still very low. Therefore, in Korea, food retailers do not exert pressure on food processors for lower prices; however, in the US, competitive intensity allows supermarket chains to aggressively switch among suppliers in search of lower cost, higher quality products. In addition, the portion of private label products by supermarkets is very significant in the US (representing up to 60% of the total market share of some products), while private label products are not seen in Korea yet. As a result of lower competitive intensity, processed food companies were not highly pressured to improve productivity compared to their US counterparts, and underproductive, underdeveloped companies persisted in certain food sectors.
One logical question arising out of the assessment of low domestic competitive intensity is “why did processed food companies not raise their prices?” Interviews with companies and industry experts revealed that the reason was twofold: First, there was a lack of understanding of individual product profitability and returns, thereby making accurate price determination difficult. Second, more importantly, corporate focus on market share retention (described later in external factors), led to a reluctance to raise prices.
14
Exposure to best practice Korea shows a much lower degree of exposure to best-practice companies compared to the US. As a matter of fact, there are very few multinational food companies operating in Korea across all product groups. In contrast, the US food processors have been fiercely competing against best-practice multinational players. In addition, many key US companies are regarded as best practice companies in each product group.
Confectionery. Only two foreign transplants operate in Korea [Exhibit 24], and none of them are fully owned by foreign companies. In contrast, US companies have many transplant operations with full foreign ownership. In addition, major US companies have built plants in many countries (e.g., approximately 30% of Nabisco’s sales comes from overseas operations).
Wet corn milling. The Korean wet corn milling industry shows quite the same story. With an oligopoly of five major domestic producers, Korea has no multinational companies in the market and the share of trade is insignificant. In the US, the UK based multinational company, Staley, is the third largest producer and accounts for roughly 20% of total domestic production. Also, major US wet corn producers have overseas plants in Latin America, Canada, Mexico, Europe, Africa and Asia.
External Factors
Restrictions in capital and product markets have been the main external factors causing lower productivity performance in the Korean processed food industry [Exhibit 22].
Capital market Corporate governance/incentives. In Korea, corporate governance rules have focused on market share and sales rather than profitability. As shown in confectionery case [Exhibit 25], key performance measurements have emphasized on the growth of sales and market share. Sales growth-driven corporate governance has resulted in the expansion of capacity leading to low capacity utilization ratios as shown in many products. In addition, as in confectionery case, this corporate governance also contributed to poor product portfolio management as companies competitively introduced “me-too” products to maintain their market share.
Product market Barriers on trade and FDI. In product market, barriers on trade and foreign direct investment (FDI) are still high in Korea and resulted in very low degree of exposure to best practice from other countries.
15
In confectionery, low productivity was the result of implicit, rather than explicit, barriers to FDI. While tariff levels were similar between the US and Korea and foreign investment was allowed, the penetration of imported products and transplant operations remained quite low. This is because, despite legal deregulation, implicit FDI barriers persisted. For example, foreign companies do not have equal access to prime time advertisement, and thus face disadvantages in their business activities. In Korea, all broadcast networks’ advertising time is sold through a government organization called Korea Broadcast Advertising Corporation (KOBACO) and most of the total air time is already occupied by large Korean advertisers on a long term contract basis. Thus, the availability of air time, especially for longer length copy over 30 seconds and prime time spots, is very limited for foreign companies. Additionally, the underdeveloped retail market and associated logistics issues have prevented effective importing of goods.
Furthermore, in establishing transplant operations, companies must complete an extensive and complex registration process. These complex bureaucratic processes are complicated by non-transparent, relationship-based procedures. In fact, the burdensome application and registration processes also affect and lower the productivity of Korean company operations. Although, certainly they are more familiar for a Korean company to navigate, they nonetheless require excessive time and lower efficiency.
In the wet corn milling case, the productivity gap was caused by legal barriers. Prior to 1996, the market was not fully opened to foreign companies, and there were quota restrictions on starch imports. (Starch can be either produced or imported by wet corn milling companies and then used as an input to produce corn syrup). Thus, wet corn milling companies were not exposed to best practice and domestic competitive intensity was low. Interestingly, however, since 1996, the market has been opened to foreign investment, and yet none has been made. This is likely due primarily to continued implicit barriers.
In summary, both explicit and implicit barriers played a role in limiting past productivity. Many explicit legal barriers have recently been removed, however, as in wet corn milling. Therefore, implicit barriers will likely be more important barriers to productivity in the future, unless efforts to remove them are undertaken.
Downstream industries. As mentioned in industry dynamics sector, the portion of new advanced formats such as discount stores or hypermarkets is still very insignificant in the Korean retail sector. The first local discount store, E-Mart was only introduced in 1993 and most foreign retailers entered into Korea only after the full liberalization of the Korean retail market in 1996.
The underdeveloped retail industry has been a factor which lowers productivity. As explained at the previous chapter, the underdeveloped retail industry has not
16
generated enough price pressure to processed food producers and thus has lowered domestic competitive intensity compared to the US.
Product regulation. There have been government regulations to protect small companies in products such as rice, noodle, and corn oil13. Big companies, which have more than 300 employees, could not enter these businesses unless they received permission from the government. As a result, participation of big companies is very low in certain food sectors, allowing underdeveloped mom & pop-type operations to continue.
Labor market Labor rules/unionism. Unionism is not strong in most processed food companies as most of their production workers are female, who have quite high turn over ratios (average one or two years). Layoff of production workers is relatively more difficult in certain products group like milling products where most workers are men.
However, layoffs were not a key factor in explaining low productivity in this industry. Rather, the key issue was that in the protected market with minimal shareholder return/profit focus, there was minimal pressure to reduce cost by laying off workers. Furthermore, limitations on part-time workers were not the key issue either as companies did not, generally speaking, seek opportunities to use part-time workers. In the future, as companies become more keen on slimming down their labor force due to increased competition, labor rules and unionism may become a more important barrier.
CHALLENGES AND IMPLICATIONS
Based on our findings in this case, several steps can be proposed to improve productivity. As failure to maximize productivity can be attributed to lack of best practice level managerial skills and sales-driven, vs. profit-driven, corporate governance, government and companies should focus on changing these two key external factors.
13 Government has protected small companies for certain sectors since 1983. In processed food, noodles, tofu (soybean curd), corn oil, polished rice, starch excluding corn starch and potato starch are regulated products. This deregulation will be freed up in the future but the detailed schedule is not announced yet.
17
Government
Attracting foreign direct investment (FDI) Barriers to FDI have prevented best practice exposure and subsequently managerial skills transfer. As complex and ambiguous administrative procedures are the key obstacle, government should require more simple and transparent administration procedures. And, most importantly, these efforts should be clearly communicated and practiced by front-line government bureaucrats. In addition, other implicit barriers such as access to distribution must be addressed. This, for example, would be addressed by allowing larger retail formats through change in zoning laws, which would in turn lead to a more competitive, larger retail sector (as described in the retail case analysis) through which both domestic and foreign players could distribute their products.
Furthermore, until now, foreign companies continue to be more or less regarded as an uninvited guest rather than a partner in Korea. Therefore, it is important to emphasize the benefit of FDI to encourage companies to change their mindset.
Changing bureaucracy and mindset are not easy tasks and require massive organizational and cultural changes. But, implementation of these changes will certainly pay off by increasing competition and exposure to best practice.
Removing protections for small companies As mentioned in the discussion of external factors, government has protected small companies in noodle, corn oil, and rice, etc. Big companies with over three hundred employees, can only participate in these areas after receiving permission from the government. As a result of the protection of small companies, these industries are still underdeveloped.
Removing protection of small companies will allow full participation of large companies in these underdeveloped sectors and allow them to develop. Also, necessary industry consolidation would be accelerated as well.
Industry
Implementing incentives and performance measures based on profitability Corporate governance and performance measures have been mainly driven by sales growth instead of shareholder returns. Implementing performance measures such as ROIC, activity based costing and profitability vs. sales, would be extremely beneficial for Korean companies as a tool to guide the optimum investment scale and also maximize profitability.
18
19
Improving marketing skills Developing market research functions, evaluation processes for brand creation abilities, and product portfolio management capabilities (i.e., more rigorously pruning “dead” products) are critical skills for Korean companies to build.
Companies should balance their efforts between new product development and supporting/developing core brands. A clear strategy for new product development, specifying the process for evaluating and determining whether products should be introduced, will be critical going forward. In addition, efforts to build more core brands, as well as global brands, should be implemented.
The enhancement of marketing skills must occur before most packaging lines can be economically automated. Based on our analyses of pay back time for the automation of biscuit packaging lines [Exhibit 26], Korea requires three years of pay back time while the US and Brazil14 require one year and six years, respectively. Thus, in order for packaging automation to be economically sound, products must generally survive for at least three years.
Adopting more disciplined plant management practices To improve organization of functions and tasks, efforts such as closer tracking of plant performance indicators, and rigorous evaluation of investment and operating decisions should be enhanced in the future. Furthermore, as in the case of confectionery, Korea shows much less production volume per product compared to the US. So, special efforts for plant management focusing on “flexibility” should be considered.
Carefully determining automation levels needed in low capital intensity sectors Companies in low capital intensity group should be careful to avoid mistakes made by the current high intensity group as they evaluate capital investments needed to modernize. Careful determination of optimal automation level as well as rational capacity planning should be implemented to avoid misallocation of capital investment.
14 The Brazil case serves as an example of cheap labor cost.
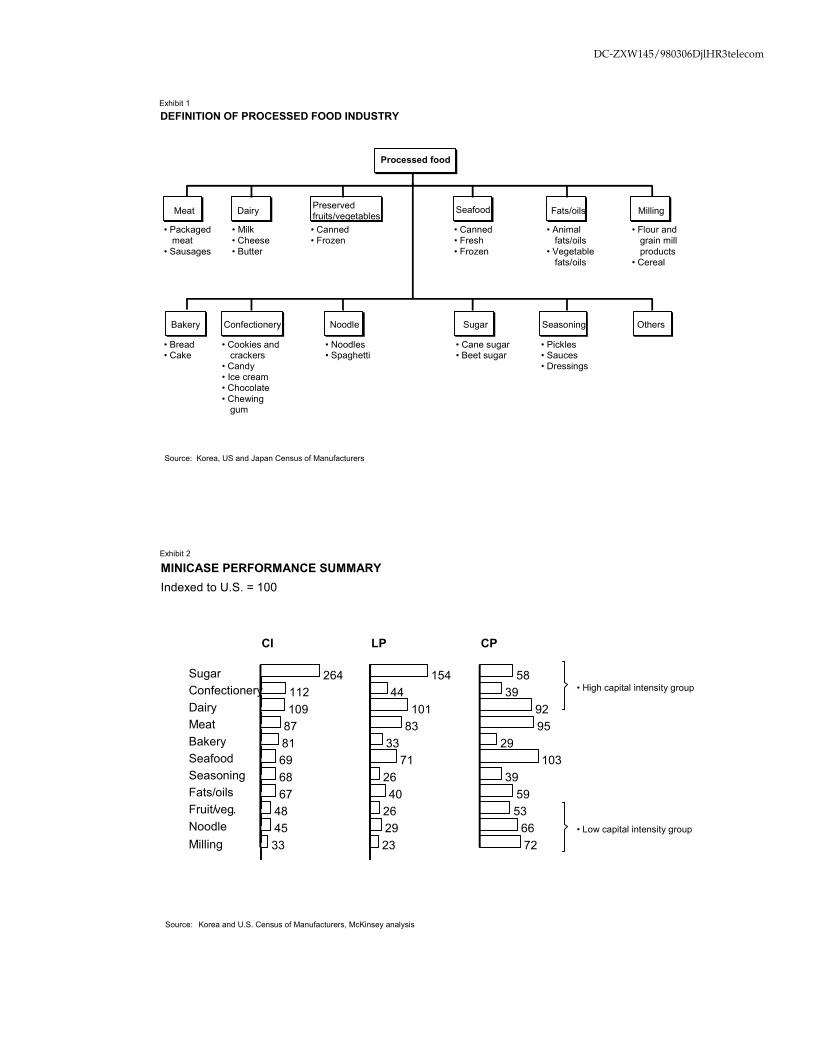
DC-ZXW145/980306DjlHR3telecom
Source: Korea, US and Japan Census of Manufacturers
Processed food
Meat Dairy Preservedfruits/vegetables
Seafood Fats/oils Milling
Bakery Confectionery Noodle Sugar Seasoning Others
• Packagedmeat
• Sausages
• Milk• Cheese• Butter
• Canned• Frozen
• Canned• Fresh• Frozen
• Animalfats/oils
• Vegetablefats/oils
• Flour andgrain millproducts
• Cereal
• Bread• Cake
• Cookies andcrackers
• Candy• Ice cream• Chocolate• Chewing
gum
• Noodles• Spaghetti
• Cane sugar• Beet sugar
• Pickles• Sauces• Dressings
DEFINITION OF PROCESSED FOOD INDUSTRYExhibit 1
MINICASE PERFORMANCE SUMMARYIndexed to U.S. = 100
Source: Korea and U.S. Census of Manufacturers, McKinsey analysis
Exhibit 2
CI
264112109
8781696867
484533
SugarConfectioneryDairyMeatBakerySeafoodSeasoningFats/oilsFruit/veg.NoodleMilling
LP
15444
10183
3371
2640
262923
CP
5839
9295
29103
395953
6672
• High capital intensity group
• Low capital intensity group
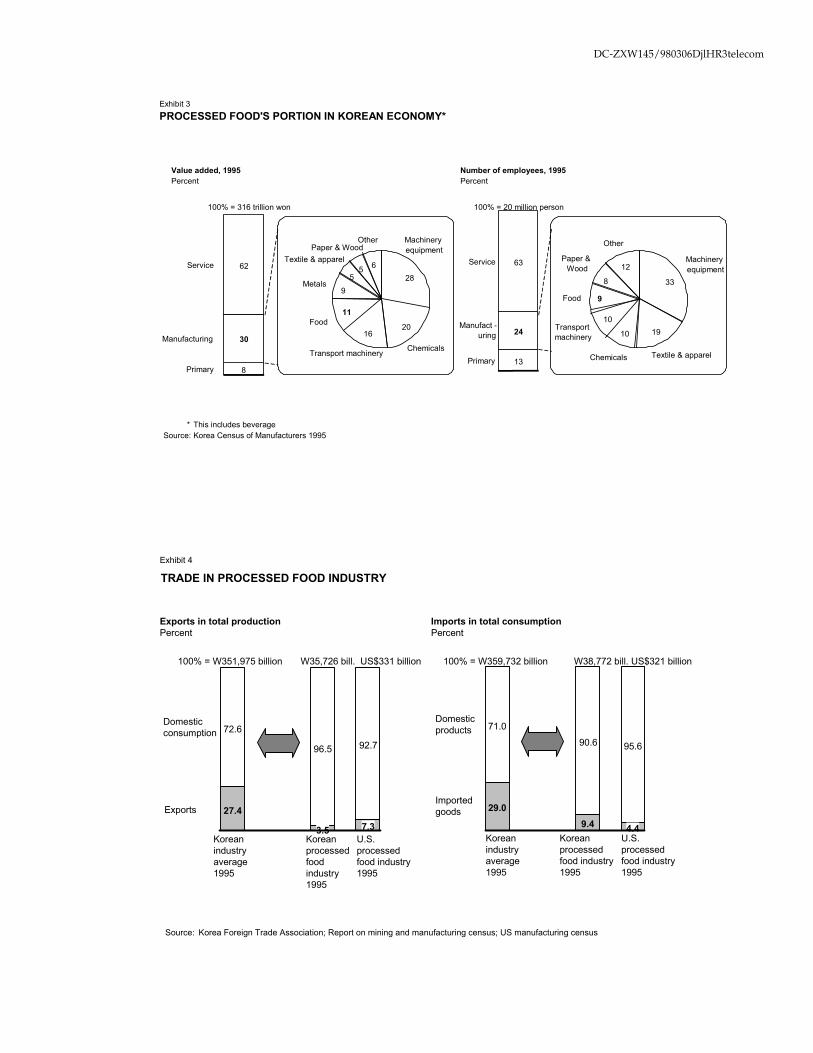
DC-ZXW145/980306DjlHR3telecom
* This includes beverageSource: Korea Census of Manufacturers 1995
Service 62
Manufacturing 30
Primary 8
Machineryequipment
28
Chemicals
20
Transport machinery
16Food
11
Metals9
Textile & apparel
5
Paper & Wood
5
Other
6
Value added, 1995Percent
Service 63
Manufact -uring 24
Primary 13
Machineryequipment
33
Textile & apparel
19
Chemicals
10Transport
machinery
10
Food 9
Paper &Wood
8
Other
12
Number of employees, 1995Percent
100% = 316 trillion won 100% = 20 million person
PROCESSED FOOD'S PORTION IN KOREAN ECONOMY*Exhibit 3
Source: Korea Foreign Trade Association; Report on mining and manufacturing census; US manufacturing census
Exports in total productionPercent
Domestic products 71.0
90.6 95.6
Imported goods 29.0
9.4 4.4Korean industry average1995
Korean processed food industry 1995
U.S. processedfood industry 1995
Imports in total consumptionPercent
100% = W351,975 billion W35,726 bill. US$331 billion 100% = W359,732 billion W38,772 bill. US$321 billion
Domesticconsumption 72.6
96.5 92.7
Exports 27.4
3.5 7.3Korean industryaverage 1995
Korean processed food industry 1995
U.S. processedfood industry 1995
TRADE IN PROCESSED FOOD INDUSTRYExhibit 4
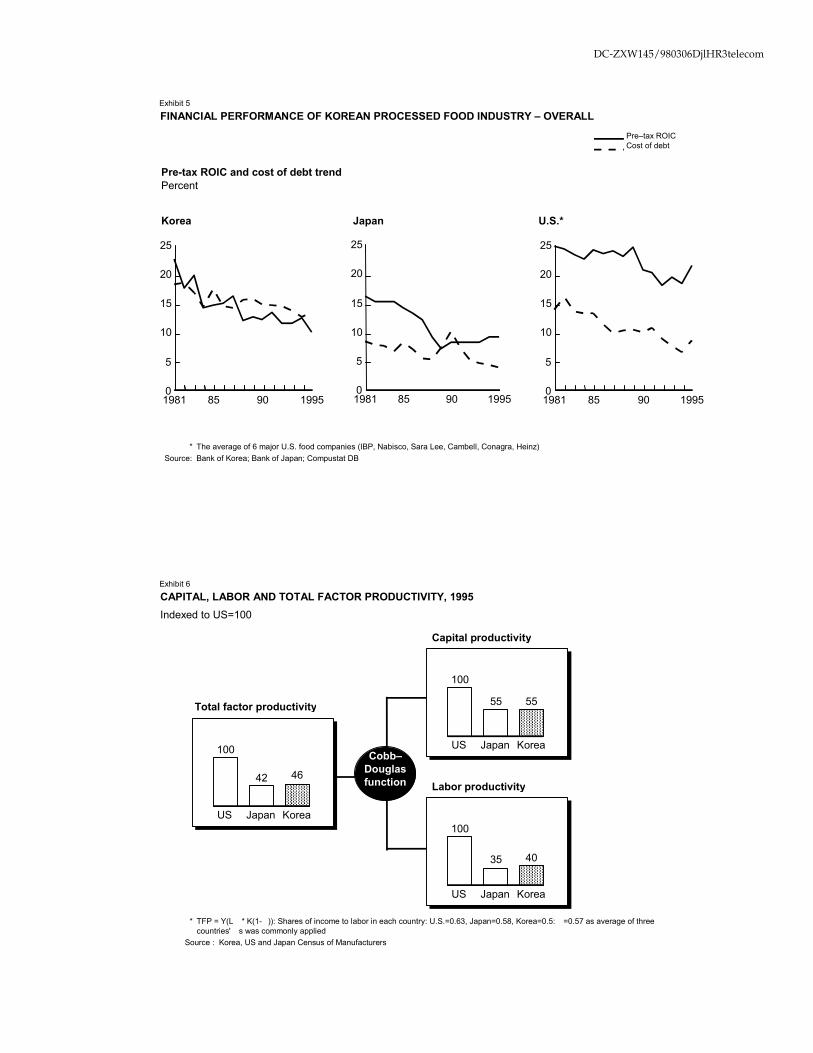
DC-ZXW145/980306DjlHR3telecom
Pre-tax ROIC and cost of debt trendPercent
0
5
10
15
20
25
1981 85 90 19950
5
10
15
20
25
1981 85 90 19950
5
10
15
20
25
1981 85 90 1995
U.S.*Japan
Pre–tax ROICCost of debt
Korea
* The average of 6 major U.S. food companies (IBP, Nabisco, Sara Lee, Cambell, Conagra, Heinz)Source: Bank of Korea; Bank of Japan; Compustat DB
FINANCIAL PERFORMANCE OF KOREAN PROCESSED FOOD INDUSTRY – OVERALLExhibit 5
CAPITAL, LABOR AND TOTAL FACTOR PRODUCTIVITY, 1995Indexed to US=100
* TFP = Y(L� * K(1-�)): Shares of income to labor in each country: U.S.=0.63, Japan=0.58, Korea=0.5: �=0.57 as average of threecountries' �s was commonly applied
Source : Korea, US and Japan Census of Manufacturers
Capital productivity
100
42 46
US Japan Korea
Total factor productivity
Labor productivity
100
55 55
US Japan Korea
100
35 40
US Japan Korea
Cobb–Douglasfunction
Exhibit 6
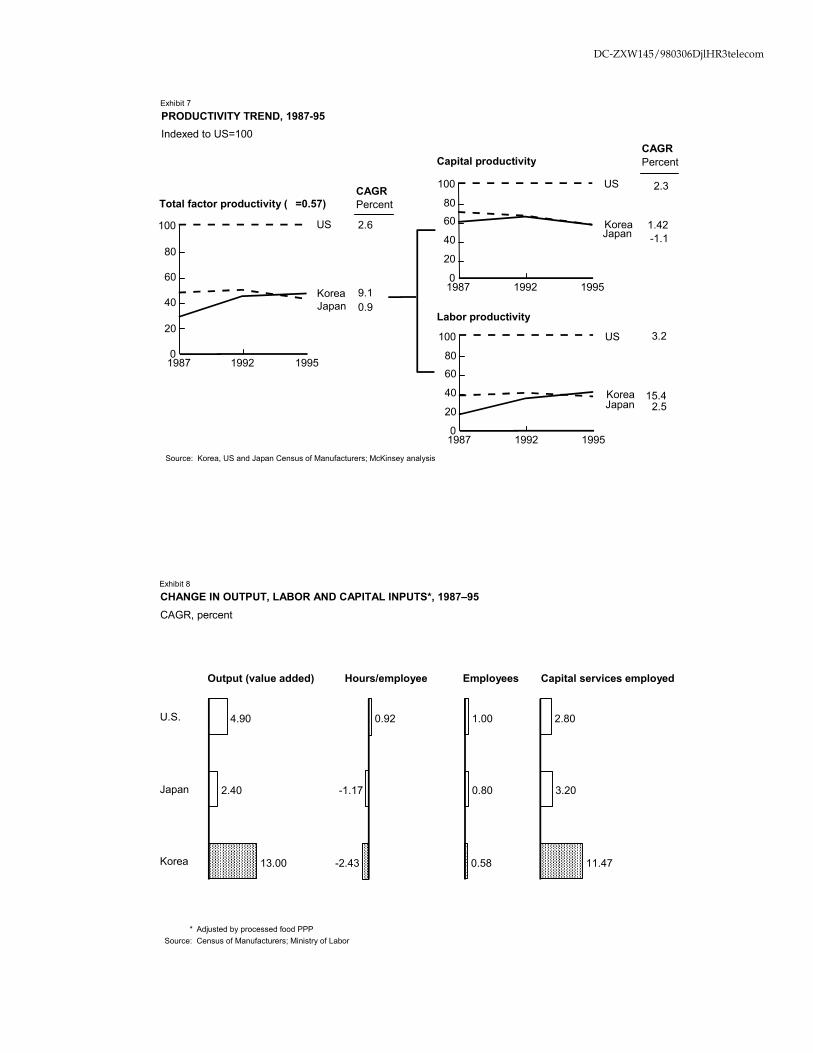
DC-ZXW145/980306DjlHR3telecom
PRODUCTIVITY TREND, 1987-95Indexed to US=100
Source: Korea, US and Japan Census of Manufacturers; McKinsey analysis
Total factor productivity (�=0.57)
Capital productivity
Labor productivity
0
20
40
60
80
100 US
JapanKorea
1987 1992 1995
CAGRPercent
2.6
0.99.1
0
20
40
6080
100 US
JapanKorea
1987 1992 1995
0
20
40
6080
100 US
JapanKorea
1987 1992 1995
CAGRPercent
2.3
-1.11.42
3.2
15.42.5
Exhibit 7
Output (value added)
4.90
2.40
13.00
U.S.
Japan
Korea
0.92
Hours/employee
-1.17
-2.43
Employees
1.00
0.80
0.58
Capital services employed
2.80
3.20
11.47
CHANGE IN OUTPUT, LABOR AND CAPITAL INPUTS*, 1987–95CAGR, percent
* Adjusted by processed food PPPSource: Census of Manufacturers; Ministry of Labor
Exhibit 8
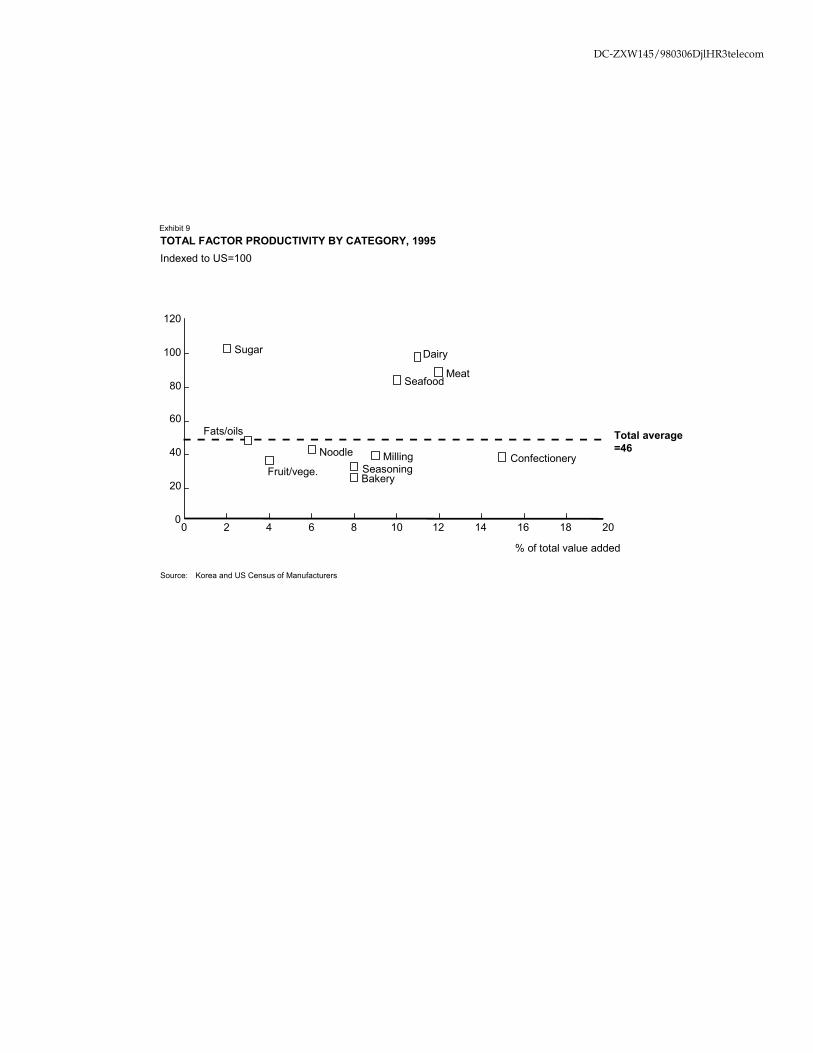
DC-ZXW145/980306DjlHR3telecom
TOTAL FACTOR PRODUCTIVITY BY CATEGORY, 1995Indexed to US=100
0
20
40
60
80
100
120
Sugar
Fats/oils
Fruit/vege.
NoodleSeasoningBakery
Milling
Seafood
Dairy
Meat
Confectionery
0 2 4 6 8 10 12 14 16 18 20
Total average=46
% of total value added
Source: Korea and US Census of Manufacturers
Exhibit 9
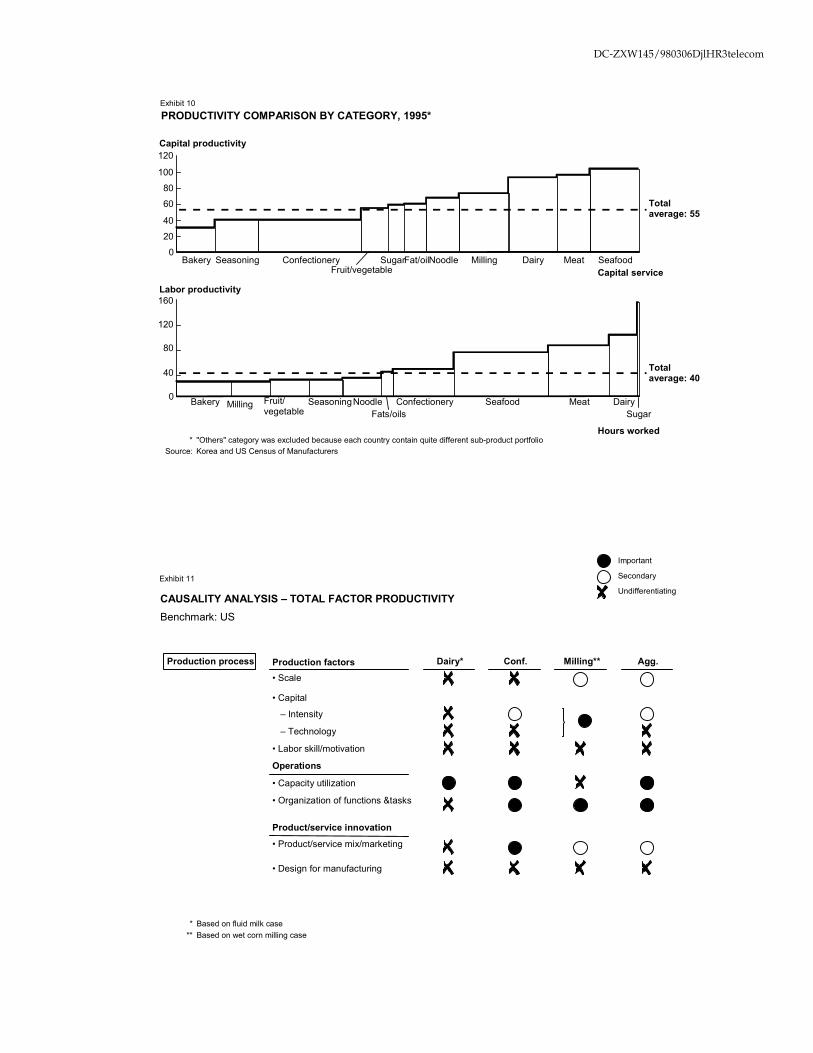
DC-ZXW145/980306DjlHR3telecom
* "Others" category was excluded because each country contain quite different sub-product portfolioSource: Korea and US Census of Manufacturers
0
20
40
60
80
100
120
Bakery Seasoning ConfectioneryFruit/vegetable
SugarFat/oilNoodle Milling Dairy Meat Seafood
Capital productivity
Totalaverage: 55
0
40
80
120
160
Bakery Milling Fruit/vegetable
SeasoningNoodleFats/oils
Confectionery Seafood Meat DairySugar
Labor productivity
Totalaverage: 40
Capital service
Hours worked
Exhibit 10PRODUCTIVITY COMPARISON BY CATEGORY, 1995*
CAUSALITY ANALYSIS – TOTAL FACTOR PRODUCTIVITYBenchmark: US
Production process Production factors Dairy* Conf. Milling** Agg.
• Scale
• Capital
– Intensity
– Technology
• Labor skill/motivation
Operations
• Capacity utilization
• Organization of functions &tasks
Product/service innovation• Product/service mix/marketing
• Design for manufacturing
* Based on fluid milk case** Based on wet corn milling case
Exhibit 11
Important
Secondary
Undifferentiating
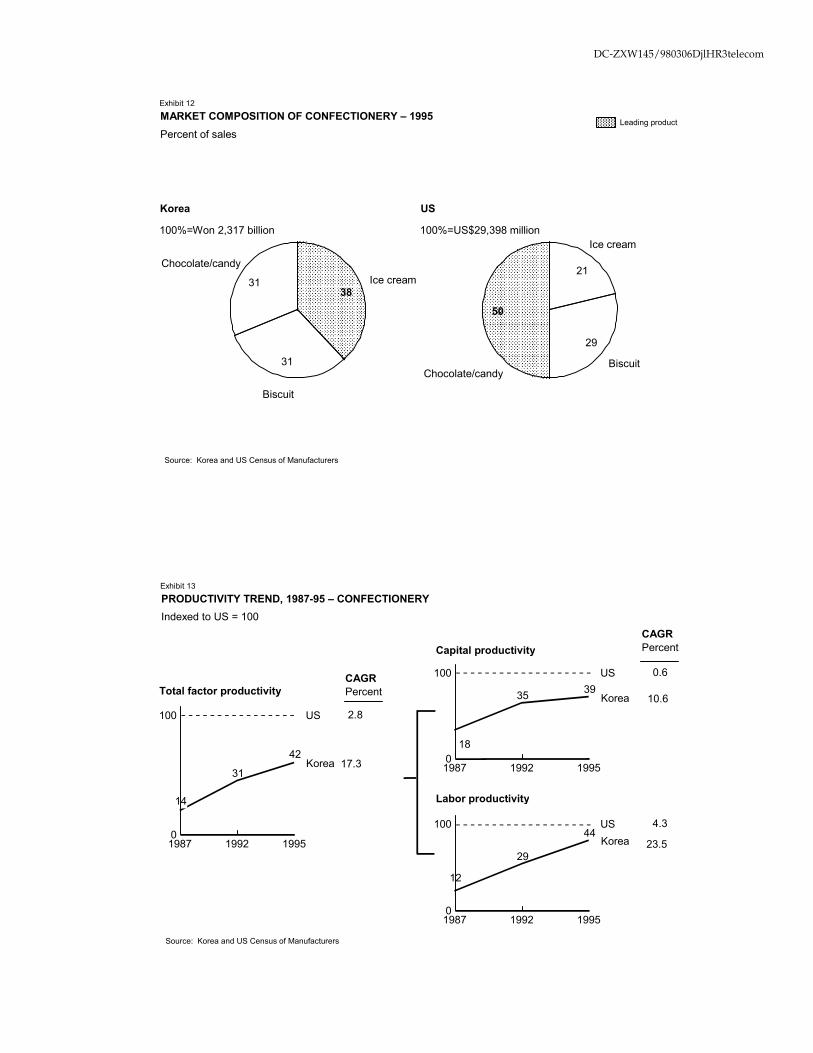
DC-ZXW145/980306DjlHR3telecom
Leading product
Korea
Ice cream38
Biscuit
31
Chocolate/candy
31
US
Ice cream
21
Biscuit
29
Chocolate/candy
50
100%=Won 2,317 billion 100%=US$29,398 million
Source: Korea and US Census of Manufacturers
Exhibit 12
MARKET COMPOSITION OF CONFECTIONERY – 1995Percent of sales
Total factor productivity
Capital productivity
0
100 US
Korea
14
31
42
1987 1992 1995
CAGRPercent
0
100 US
Korea
18
35 39
1987 1992 1995
0
100 USKorea
12
29
44
1987 1992 1995
CAGRPercent
2.8
17.3
Labor productivity
0.6
10.6
4.3
23.5
Source: Korea and US Census of Manufacturers
Exhibit 13
PRODUCTIVITY TREND, 1987-95 – CONFECTIONERYIndexed to US = 100
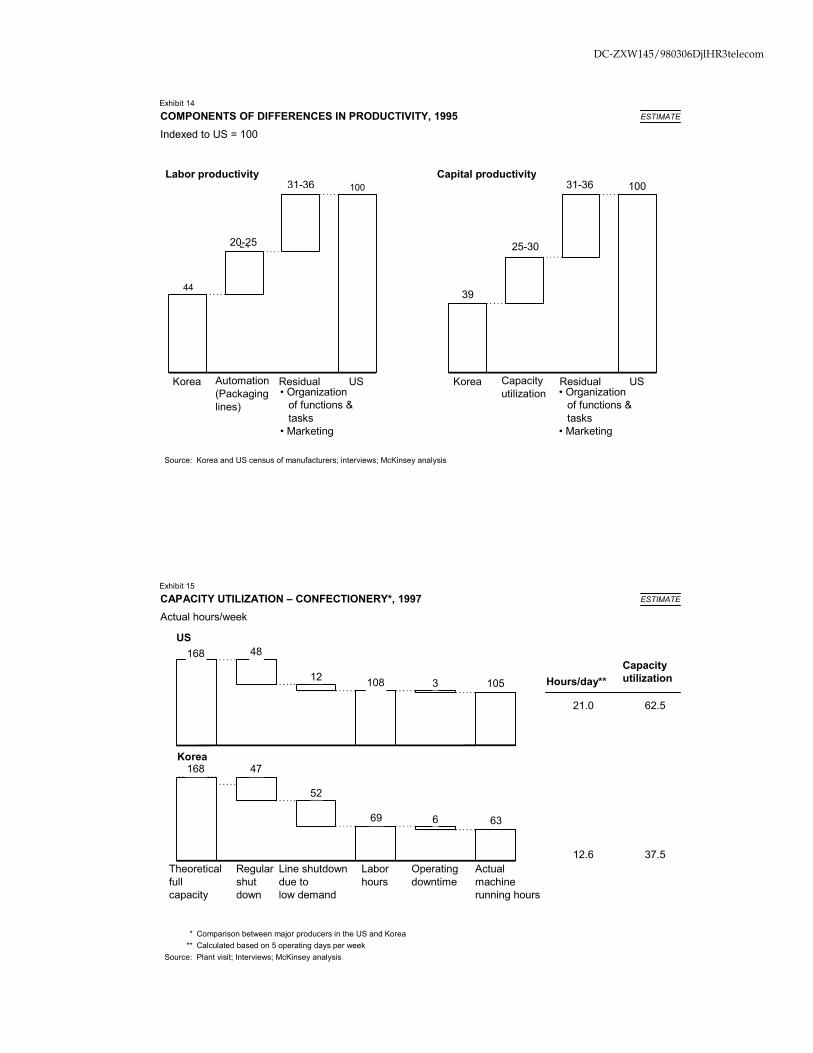
DC-ZXW145/980306DjlHR3telecom
Labor productivity
44
24
100
Korea Automation(Packaginglines)
Residual US• Organization
of functions &tasks
• Marketing
Capital productivity
39
100
Korea Capacityutilization
Residual US• Organization
of functions &tasks
• Marketing
20-25
31-36
25-30
31-36
Source: Korea and US census of manufacturers; interviews; McKinsey analysis
Exhibit 14
COMPONENTS OF DIFFERENCES IN PRODUCTIVITY, 1995Indexed to US = 100
ESTIMATE
CAPACITY UTILIZATION – CONFECTIONERY*, 1997Actual hours/week
* Comparison between major producers in the US and Korea** Calculated based on 5 operating days per week
Source: Plant visit; Interviews; McKinsey analysis
US168 48
12 108 3 105
Korea168 47
52
69 6 63
Theoreticalfullcapacity
Regularshutdown
Line shutdowndue tolow demand
Laborhours
Operatingdowntime
Actualmachinerunning hours
Hours/day**
21.0
12.6
Capacityutilization
62.5
37.5
Exhibit 15ESTIMATE
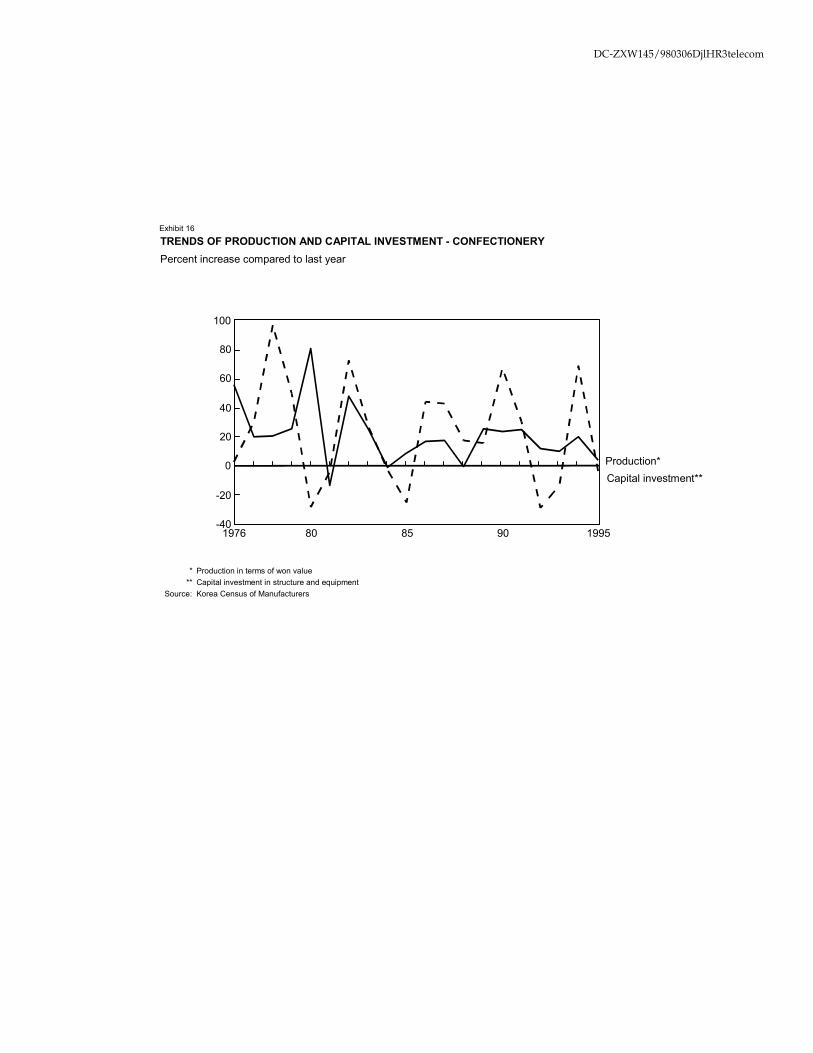
DC-ZXW145/980306DjlHR3telecom
TRENDS OF PRODUCTION AND CAPITAL INVESTMENT - CONFECTIONERYPercent increase compared to last year
* Production in terms of won value** Capital investment in structure and equipment
Source: Korea Census of Manufacturers
-40
-20
0
20
40
60
80
100
Capital investment**Production*
1976 80 85 90 1995
Exhibit 16
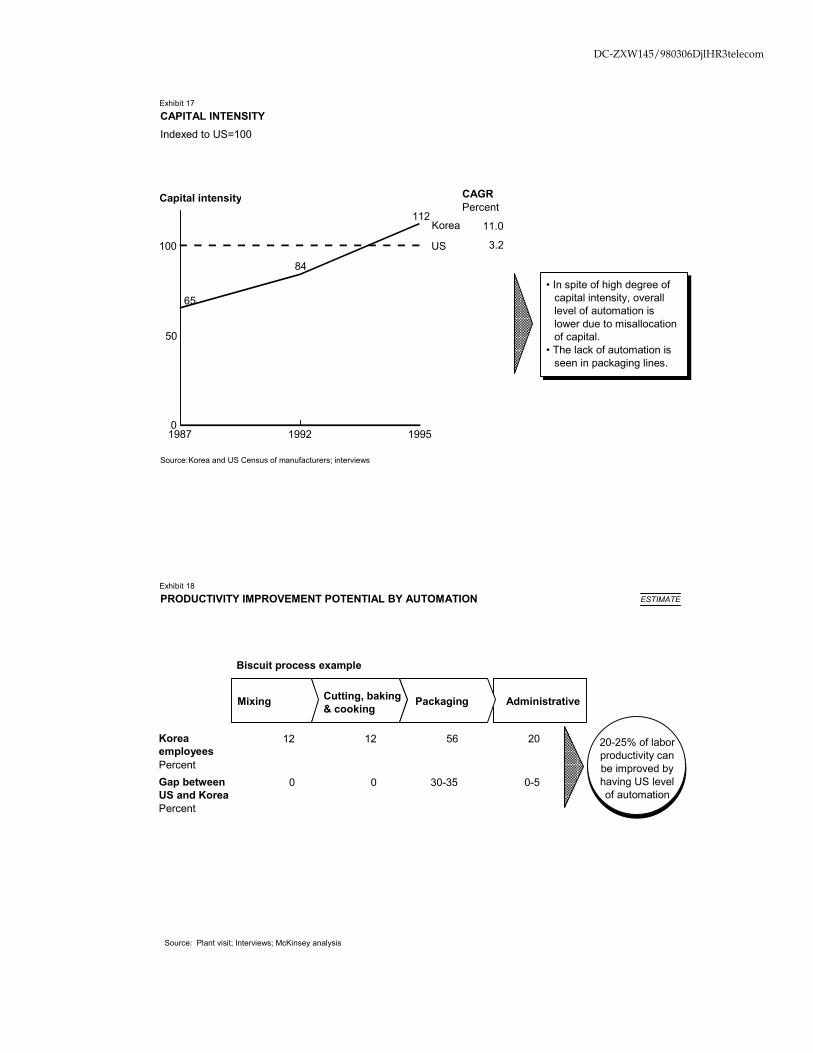
DC-ZXW145/980306DjlHR3telecom
0
50
100 US
Korea
65
84
112
1987 1992 1995
Capital intensity
• In spite of high degree ofcapital intensity, overalllevel of automation islower due to misallocationof capital.
• The lack of automation isseen in packaging lines.
• In spite of high degree ofcapital intensity, overalllevel of automation islower due to misallocationof capital.
• The lack of automation isseen in packaging lines.
Source:Korea and US Census of manufacturers; interviews
CAGRPercent
11.0
3.2
Exhibit 17
CAPITAL INTENSITYIndexed to US=100
KoreaemployeesPercent
12 12 56 20
Gap betweenUS and KoreaPercent
0 0 30-35 0-5
Source: Plant visit; Interviews; McKinsey analysis
PRODUCTIVITY IMPROVEMENT POTENTIAL BY AUTOMATION
AdministrativeMixing Cutting, baking& cooking
Packaging
Biscuit process example
20-25% of laborproductivity canbe improved byhaving US levelof automation
Exhibit 18ESTIMATE
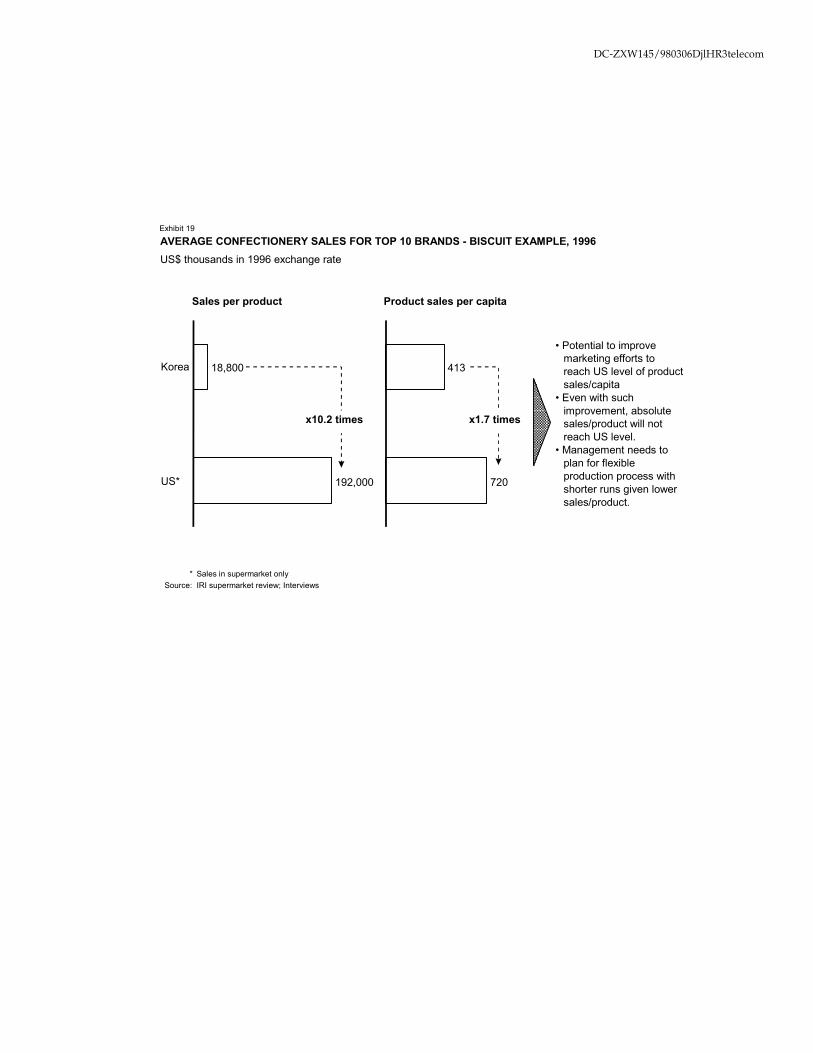
DC-ZXW145/980306DjlHR3telecom
* Sales in supermarket onlySource: IRI supermarket review; Interviews
18,800
192,000
Korea
US*
Sales per product
413
720
Product sales per capita
x10.2 times x1.7 times
AVERAGE CONFECTIONERY SALES FOR TOP 10 BRANDS - BISCUIT EXAMPLE, 1996US$ thousands in 1996 exchange rate
• Potential to improvemarketing efforts toreach US level of productsales/capita
• Even with suchimprovement, absolutesales/product will notreach US level.
• Management needs toplan for flexibleproduction process withshorter runs given lowersales/product.
Exhibit 19
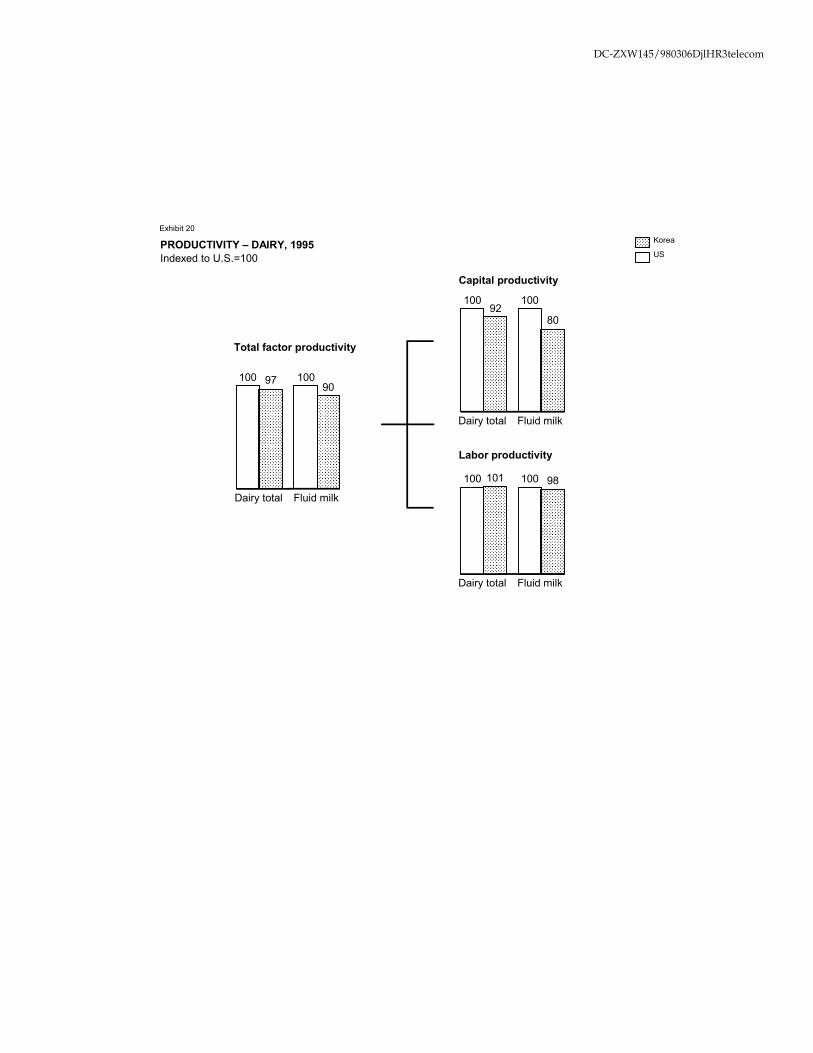
DC-ZXW145/980306DjlHR3telecom
PRODUCTIVITY – DAIRY, 1995Indexed to U.S.=100
Exhibit 20
97 90100 100
Dairy total Fluid milk
Total factor productivity
9280
100 100
Dairy total Fluid milk
Capital productivity
101 98100 100
Dairy total Fluid milk
Labor productivity
Korea
US
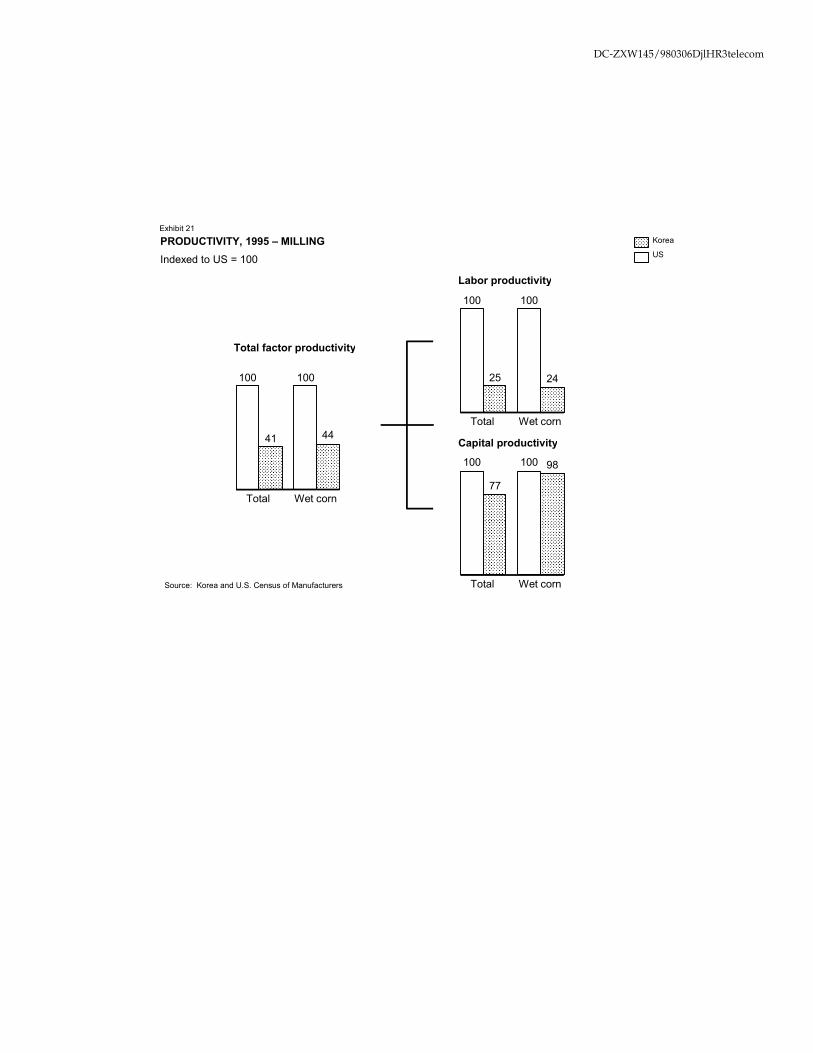
DC-ZXW145/980306DjlHR3telecom
PRODUCTIVITY, 1995 – MILLINGIndexed to US = 100
Source: Korea and U.S. Census of Manufacturers
Exhibit 21
41 44
100 100
Total Wet corn
Total factor productivity
25 24
100 100
Total Wet corn
Labor productivity
77
98100 100
Total Wet corn
Capital productivity
Korea
US
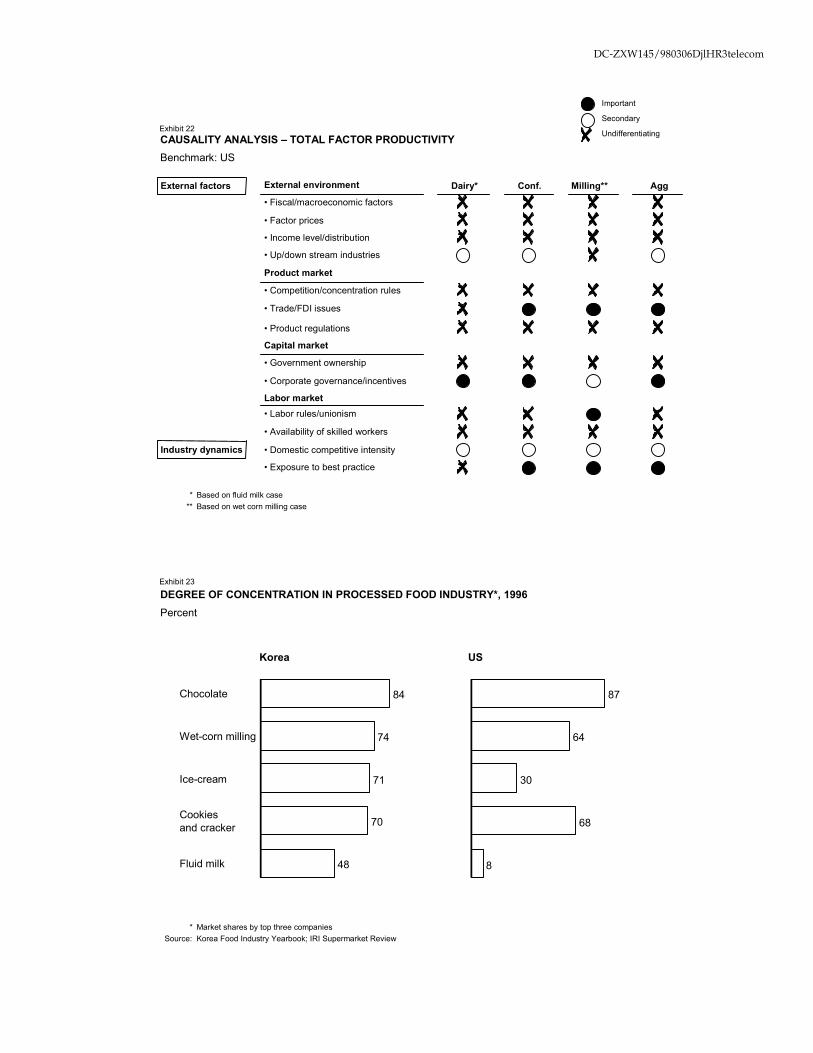
DC-ZXW145/980306DjlHR3telecom
CAUSALITY ANALYSIS – TOTAL FACTOR PRODUCTIVITYBenchmark: US
External factors External environment Dairy* Conf. Milling** Agg• Fiscal/macroeconomic factors
• Factor prices
• Income level/distribution
• Up/down stream industries
Product market
• Competition/concentration rules
• Trade/FDI issues
• Product regulations
Capital market
• Government ownership
• Corporate governance/incentives
Labor market• Labor rules/unionism
• Availability of skilled workers
Industry dynamics • Domestic competitive intensity
• Exposure to best practice
* Based on fluid milk case** Based on wet corn milling case
Exhibit 22
Important
Secondary
Undifferentiating
DEGREE OF CONCENTRATION IN PROCESSED FOOD INDUSTRY*, 1996Percent
* Market shares by top three companiesSource: Korea Food Industry Yearbook; IRI Supermarket Review
Exhibit 23
84
74
71
70
48
Chocolate
Wet-corn milling
Ice-cream
Cookiesand cracker
Fluid milk
87
64
30
68
8
Korea US
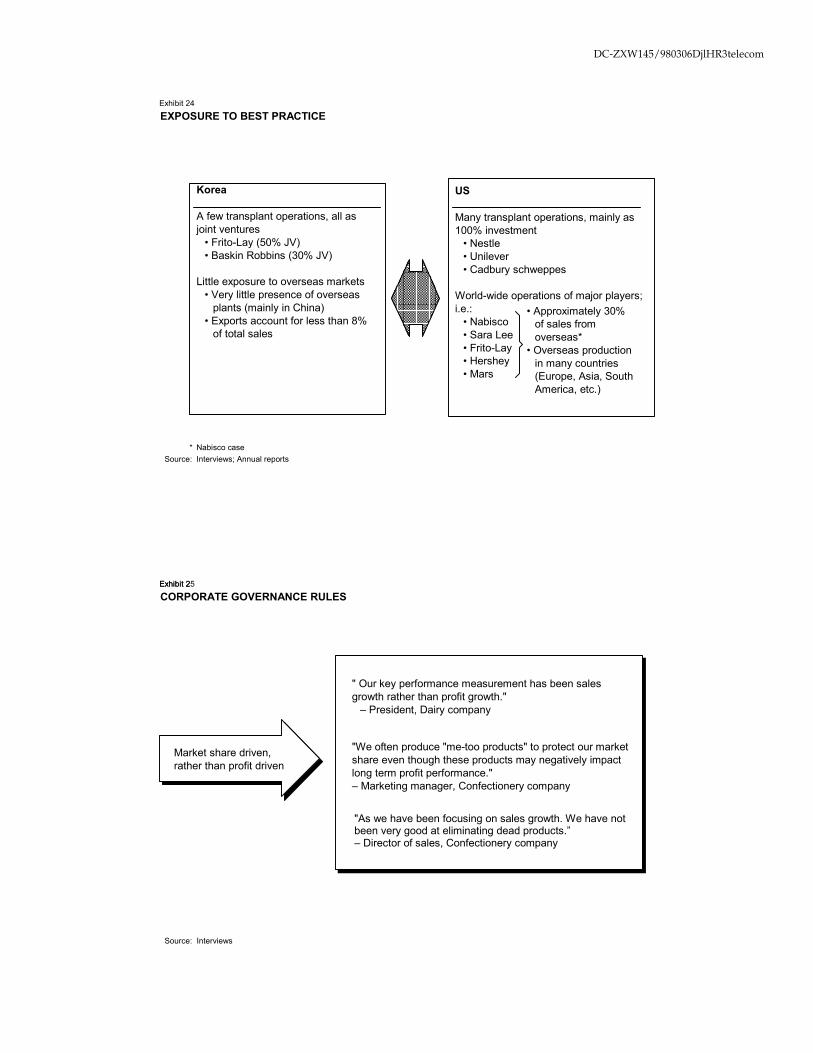
DC-ZXW145/980306DjlHR3telecom
* Nabisco caseSource: Interviews; Annual reports
US
Many transplant operations, mainly as100% investment
• Nestle• Unilever• Cadbury schweppes
World-wide operations of major players;i.e.:
• Nabisco• Sara Lee• Frito-Lay• Hershey• Mars
• Approximately 30%of sales fromoverseas*
• Overseas productionin many countries(Europe, Asia, SouthAmerica, etc.)
EXPOSURE TO BEST PRACTICEExhibit 24
Korea
A few transplant operations, all asjoint ventures
• Frito-Lay (50% JV)• Baskin Robbins (30% JV)
Little exposure to overseas markets• Very little presence of overseas
plants (mainly in China)• Exports account for less than 8%
of total sales
CORPORATE GOVERNANCE RULES
Source: Interviews
" Our key performance measurement has been salesgrowth rather than profit growth."
– President, Dairy company
"We often produce "me-too products" to protect our marketshare even though these products may negatively impactlong term profit performance."– Marketing manager, Confectionery company
"As we have been focusing on sales growth. We have notbeen very good at eliminating dead products.”– Director of sales, Confectionery company
Market share driven,rather than profit driven
Exhibit 2Exhibit 25
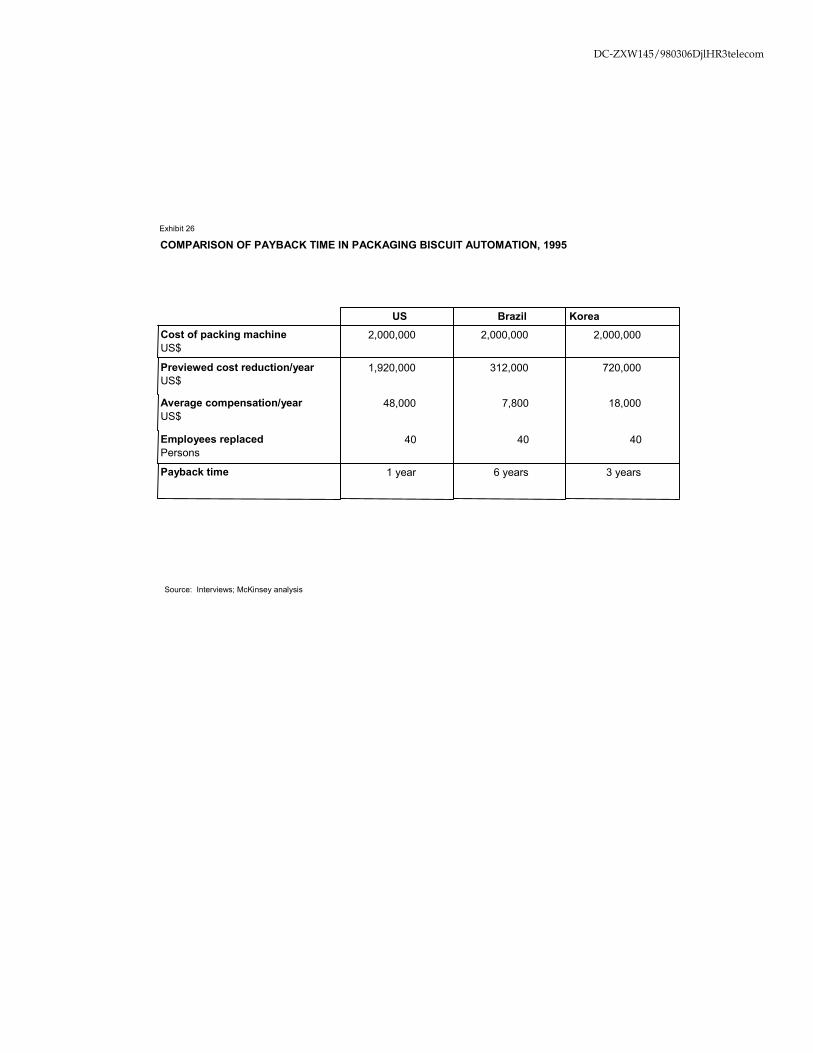
DC-ZXW145/980306DjlHR3telecom
COMPARISON OF PAYBACK TIME IN PACKAGING BISCUIT AUTOMATION, 1995
Source: Interviews; McKinsey analysis
US Brazil KoreaCost of packing machineUS$
2,000,000 2,000,000 2,000,000
Previewed cost reduction/yearUS$
1,920,000 312,000 720,000
Average compensation/yearUS$
48,000 7,800 18,000
Employees replacedPersons
40 40 40
Payback time 1 year 6 years 3 years
Exhibit 26
Personal financial services industry
Executive Summary
This case examines the labor productivity performance of the Personal Financial Services (PFS) sector in Korea as represented by deposit money banks and compares it with the productivity performance of the Netherlands and US.
Overall, the labor productivity of the Korean PFS sector is approximately 24% lower than that of the US and varies significantly in the following three product categories: payment services, including payments, money transfers, and cash withdrawals; deposit taking, including savings and transaction products such as checking accounts; and lending services, including loans and mortgages.
¶ Payment services. By leveraging electronic payments, the Netherlands (the world’s best practice country for payments) has achieved more than twice Korea’s level of productivity in the transaction of payments. In contrast, Korean PFS players have been ineffective in migrating customers to electronic payment systems.
¶ Deposit taking. Because of interest rate regulations and directed lending practices, Korean PFS players have focused on increasing deposits. As a result, deposit-taking tasks have become streamlined, allowing Korean banks to outperform US banks in this area by 38%.
¶ Lending. Historically, consumer lending has not been important for Korean banks and this lack of competitive pressure has led to a lack of innovation. Consequently, Korean banks underperform the US banks in lending practices by 43%.
To improve productivity levels, the industry should improve their operations: branches should no longer be seen simply as an access point for deposit taking, and PFS operators should pursue methods for migrating customers to more efficient electronic payment systems.
In addition, the government should not be involved in the appointment of bank managers; however, they can help PFS players effectively manage complicated consumer credit risks by developing the credit information industry.
2
Personal financial services case study
This case examines the Personal Financial Services (PFS) sector – otherwise known as retail banking. PFS are defined as the retail portion of the banking industry that provides individual customers with financial products and services. We chose not to focus on wholesale banking – the sector which provides services to commercial companies. Given Korea’s financial crisis, one may question our decision to focus on retail rather than wholesale banking. Our focus, however, was selected based on several strategic and practical concerns:
¶ Importance of PFS. Contrary to popular belief, the PFS sector is a large and growing portion of the banking industry in Korea – representing about 55% of total banking employees.1 Looking forward, PFS are expected to play a larger role as Korea grows economically and develops the need for additional financial services (e.g., mutual funds, mortgages, other consumer credit products). In addition, PFS has the added benefit of rather homogeneous product groups with relatively less volatility (in stark contrast to wholesale banking).
¶ Inability to define and measure output of wholesale banking. Wholesale banking involves a large array of products and services, whose value cannot be easily defined and quantified (e.g., quality and size of loans made to companies). Furthermore, Korea’s history of corporate lending practices (e.g., directed government lending) creates gross distortions that are difficult to consider.
¶ Ability to assess wholesale banking through other case studies. Other case studies in this report indirectly assess the wholesale banking sector by looking at investment returns in that sector. Since most of these investments were funded by bank loans (e.g., wholesale banking), we gain an indirect look at the quality of Korean wholesale banking through a detailed understanding of returns in the various sectors.
Due to the unavailability of certain data regarding savings institutions in Korea, we focus on deposit money banks in Korea – comparing labor productivity against the US banking industry (the world benchmark in productivity) and comparing payment systems with the Netherlands2.
1 This number goes up to 60% in the case of the US. 2 According to the Economic Research Europe Ltd. Survey, the Netherlands has the highest banking
productivity in the EU.
3
INDUSTRY OVERVIEW
Korean financial institutions [Exhibit 1] are comprised of monetary institutions and other financial institutions (development institutions3, investment institutions, savings institutions, insurance institutions) according to their credit-creating ability as recommended by the International Monetary Fund (IMF). Monetary institutions are then divided into two categories: the central bank (fundamental money supply) and deposit money banks (credit-creating ability with a high share of demand deposits). Within this framework, deposit money banks and savings institutions provide retail banking service primarily by focusing on savings deposit collection with a view to financing development of targeted areas.
Government involvement in the industry
To fully appreciate the role of retail banking in Korea, one must start with an understanding of the role banking played in Korea’s economic development and how the government used the banking industry to implement its economic policies. The Korean government’s control of the banking industry began in 1962 with the Bank of Korea Act. This act put the independent central bank under the authority of the Ministry of Finance and was soon followed by the nationalization of most commercial banks. To acquire the funds required for investment in prioritized industries, the Korean government attracted savers by regulating interest rates, limiting consumer lending opportunities, and establishing specialized banks.
Control of interest rates Especially during the earlier stages of Korea’s economic development, the government used the control of interest rates as a primary method for mobilizing the required financial inputs. Savings ratio (time and savings deposit as percentage of GNP) soared from 1.8% in 1961 to 20.7% in 1970 mainly due to the change of interest rates by the government with a view to funneling money from unregulated market to formal institutions [Exhibit 2].
Absence of consumer lending options The types of consumer financing found in other developed countries (such as car loans or mortgages) were not common in the marketplace until 1996. This absence of consumer lending options contributed to the growth of savings accounts – Koreans were forced to save for major purchases (rather than finance through loans). One key component of this approach involved establishing the
3 Although Korea Development Bank, Export-Import Bank of Korea, and Korea Long Term Credit Bank are all specialized banks, they are categorized as development institutions because they have a very low share of demand deposits and supply their funds mainly through borrowing from the government, foreign financial institutions and the issue of financial debentures.
4
Korean Housing Bank (KHB) and the National Housing Fund, which took large sums of deposits from many consumers saving to buy a home.
Increased access to savers The creation of additional banking entities served as a lever for increased access to savers. To expedite regional development and reach funds located outside the Seoul area, ten local banks were created in major cities from 1967 to 1971. Several non-bank4 institutions such as mutual savings institutions, financial investment companies, and credit cooperatives were also established throughout the 1970s and 80s. These institutions developed rapidly by operating like banks – mobilizing savings from individuals and lending to industries – but with higher interest rates than commercial banks [Exhibit 3].
Capital allocation to prioritized industries
The funds raised through the manner described above were transferred to prioritized sectors such as export-oriented industries, heavy industries, and overseas construction. This transfer was done mainly through selective central bank rediscounts (e.g., policy loans) and other regulatory restrictions such as loan prohibition. Selective provision of rediscounts by central banks and explicit direction of loans to large corporations have been the major measures for controlled capital allocation by the government. Creation of special funds such as the National Investment Fund (1974) provided another important vehicle for executing policy loans to select industries.
The government also prohibited financial institutions from lending to certain sectors, such as leisure or real estate businesses, which isolated these potential borrowers from access to bank loans. For example, 25% of all business establishments operating in Korea in 1991 (of which a large portion were small businesses) were engaged in the industries where formal lending was banned.
Korea’s price for the rapid economic development backed by government-controlled banking industry include: the current banking crisis (which resulted from poor government-directed lending decisions to companies); a relatively underdeveloped consumer-lending market; a weakened sense of responsibility among bank managers; and an undeveloped bank capability for making lending decisions.
4 Korean non-banks are unlike the non-bank institutions in other countries, which trade large volumes of securities and intermediate institutional investors with short-term borrowers.
5
METHODOLOGY Defining output measures for PFS Productivity is measured using physical outputs, adapting a methodology used by the Bureau of Labor Statistics (BLS) for the purpose of international comparison. Considering the diversity of output in PFS, our method first measured the productivity for each of the three main product categories of the PFS sector before these categories were aggregated into an overall measure of labor productivity. To supplement the publicly available data, we conducted a sample survey on output and labor input at a Korean commercial bank and interviewed industry experts, including representatives of the Central Bank of Korea, major Korean banks, various financial research institutes, and the McKinsey financial institutions practice.
For the product category “transacting payments/disbursing cash,” a flow measure is taken as we measure the number of payment transactions per year in each country. For both “managing deposit accounts” and “managing loan accounts,” stock measures are used, as we count the number of deposits or loan accounts in a banking system at the end of each year.
Defining input measures for PFS Labor costs are usually the largest portion (approximately 60%) of non-interest costs for both Korea and other countries. Labor, therefore, is the main operating input of PFS and, consequently, labor productivity appears to be an appropriate single factor productivity measure [Exhibit 4].
¶ For the countries studied, we therefore first calculated the total labor input in the PFS sector by adjusting total banking industry employment, taking out the wholesale part of the business. Across the three countries, around 60% of all bank employees are in PFS. We then transform the employment number into full-time equivalents (FTE) by adjusting for the part-time workforce.
¶ Significant differences exist in total hours worked per year. Korean banking FTEs work approximately 15% more hours per year than their US counterparts.
¶ To arrive at the output per hour worked in each product category, it is necessary to divide total employment in PFS along the three main product lines described above. Transacting payment is by far the most labor-intensive function and employs around 50% of the FTEs.
In using physical output measures, it is important to ensure that outputs are comparable across countries. Otherwise it would be possible to “buy” higher productivity at the expense of lower output quality. Comparing these industries along several quality dimensions leads to the conclusion that, overall, there are no significant quality differences among the three countries [Exhibit 5].
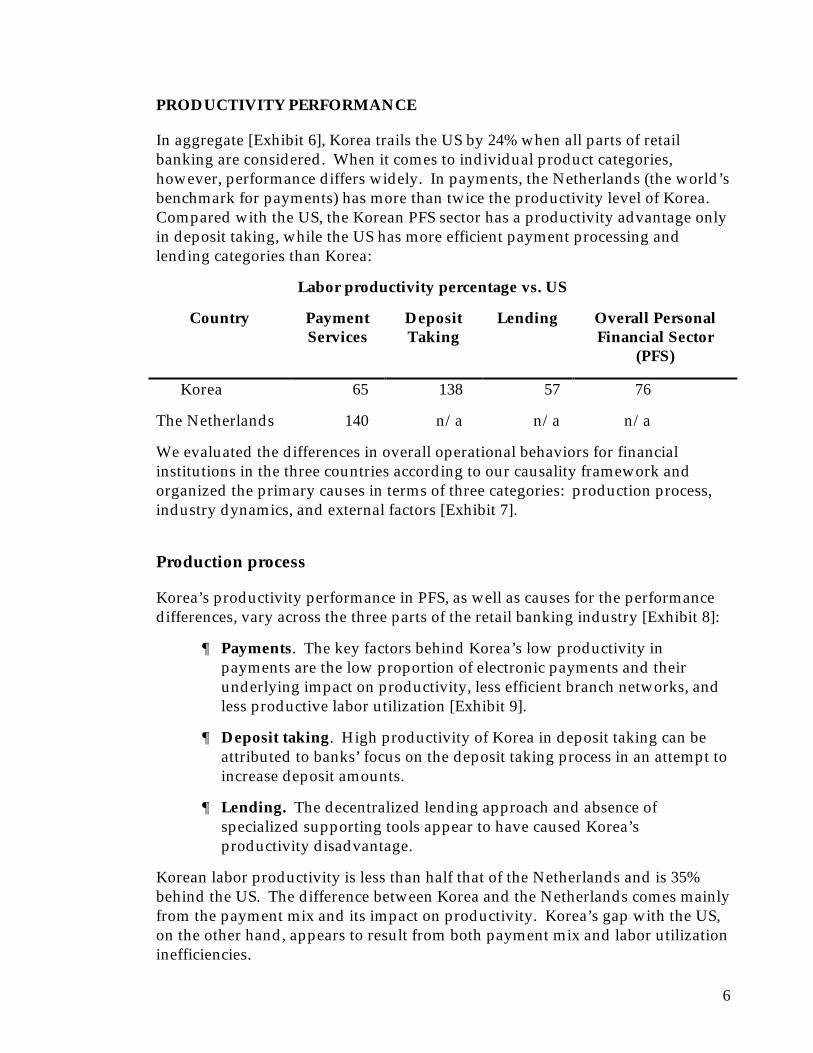
6
PRODUCTIVITY PERFORMANCE
In aggregate [Exhibit 6], Korea trails the US by 24% when all parts of retail banking are considered. When it comes to individual product categories, however, performance differs widely. In payments, the Netherlands (the world’s benchmark for payments) has more than twice the productivity level of Korea. Compared with the US, the Korean PFS sector has a productivity advantage only in deposit taking, while the US has more efficient payment processing and lending categories than Korea:
Labor productivity percentage vs. US
Country Payment Services
Deposit Taking
Lending Overall Personal Financial Sector
(PFS)
Korea 65 138 57 76
The Netherlands 140 n/a n/a n/a
We evaluated the differences in overall operational behaviors for financial institutions in the three countries according to our causality framework and organized the primary causes in terms of three categories: production process, industry dynamics, and external factors [Exhibit 7].
Production process
Korea’s productivity performance in PFS, as well as causes for the performance differences, vary across the three parts of the retail banking industry [Exhibit 8]:
¶ Payments. The key factors behind Korea’s low productivity in payments are the low proportion of electronic payments and their underlying impact on productivity, less efficient branch networks, and less productive labor utilization [Exhibit 9].
¶ Deposit taking. High productivity of Korea in deposit taking can be attributed to banks’ focus on the deposit taking process in an attempt to increase deposit amounts.
¶ Lending. The decentralized lending approach and absence of specialized supporting tools appear to have caused Korea’s productivity disadvantage.
Korean labor productivity is less than half that of the Netherlands and is 35% behind the US. The difference between Korea and the Netherlands comes mainly from the payment mix and its impact on productivity. Korea’s gap with the US, on the other hand, appears to result from both payment mix and labor utilization inefficiencies.
7
Product/service mix and marketing In 1995, over 85% of payments in the Netherlands were handled electronically, versus only about 30% in Korea and the US [Exhibit 10]. Electronic transactions tend to be extremely efficient, allowing 3 to 16 times greater productivity than paper-based transactions [Exhibit 11]. If we isolate the productivity impact of electronic payments, we can see that they have allowed the Netherlands to outperform the US and Korea by 72% and 89% respectively.
Each country has followed a different development path in moving toward an electronic payment system (EPS):
¶ Netherlands. The consolidated structure5 of the PFS sector in the Netherlands and historical pressure from the Postbank played major roles in establishing electronic transactions as the norm in payment services. When the Postbank, which has a dense post office network and lower wage levels due to the CLA (Collective Labor Agreement), introduced its own electronic payment system, the other banks were forced to launch an alternative EPS to compete. These competitive efforts ultimately led to commercial banks agreeing to the standardized specifications that are essential to far-reaching penetration of electronic payment systems.
¶ United States. High usage of checks in the highly fragmented banking system in the US has made it difficult to move away from paper toward electronic imaging technology or transit to an EPS. The industry’s inability to reach agreement for an EPS standard has prevented US banks from realizing potential productivity gains provided by electronic payments.
¶ Korea. While Korea has made progress in moving toward an EPS (e.g., government-led initiatives to link all banks’ cash dispenser (CD) and automatic teller machine (ATM) networks), Korea’s reliance on cash creates a major productivity penalty in the payments arena. Korean banks have made some attempts to minimize the labor requirements for payment transactions (e.g., encourage cash withdrawals from ATMs instead of tellers); however, Korea is still far behind other countries in its ability to implement electronic transactions to eliminate paper.
Organization of functions and tasks The overall labor productivity disadvantage for Korean banks in all three product categories can be attributed to a lack of attention to efficient human resource management.
5 The Dutch PFS sector was dominated by three major players who together held an 81% market share in terms of deposits.
8
Over-branching. The less efficient branch network in Korea contributes substantially to the labor productivity disadvantage. A focus on proximity to deposits rather than the cost of branch expansion has resulted in an excessive number of branches per km2 of residential area [Exhibit 12]. If we single out the impact of branches on productivity, the Netherlands has achieved 23% greater productivity than the US and 29% greater productivity than Korea.
Decentralized lending processes and lack of automated support tools. Korean banks are run as a series of “little banks.” Credit decisions are made in each branch through manual and hierarchical processes – except for exceptionally large loans, which require additional review and approval at the head office. Typically, lending officers in branches are not given incentives for their lending volumes, rather they are personally penalized for defaults. This leads lending officers and branch managers to review the consumer loan applications in a painstakingly careful manner, leading to a credit approval process that takes days/weeks and much more labor content than their counterparts in the US [Exhibit 13]. This practice of making lending decisions in a decentralized manner at bank branches, combined with the common practice of frequent staff rotations, appears to lead to Korea’s low productivity in lending.
In contrast, US lending institutions minimize the time required for a loan request by simplifying the application process and centralizing decision-making. Many US banks can process in minutes/hours typical applications for consumer loans (e.g., credit cards, installment loans, mortgages). US institutions achieve this high performance level through investments in the required automation tools (e.g., automated credit scoring approval models) and supporting infrastructure (e.g., credit bureaus). This higher degree of automation, combined with an accumulation of expertise throughout the business system, leads to significant gains in labor productivity [Exhibit 14].
Less innovative human resource management. Inflexible labor utilization and the absence of performance-based incentives seem to have negatively influenced labor productivity of Korean banks across all product categories.
¶ Less aggressive use of part-time tellers by Korean banks has resulted in excessive off-peak staffing in many of the branches [Exhibit 15]. In contrast, US banks aggressively use part-time tellers to avoid this off-peak staffing problem. In one US bank example, changing the part-timer teller mix from 25 to 50% allowed the bank to reduce its total FTE requirement by 20% while providing the same customer-service levels.
¶ The practice of incentive compensation based on performance evaluation has not been common in the Korean banking industry perhaps due to its long history of lifetime employment and seniority-based society norms. In the case of teller management, US banks are rigorously adapting these two measures to enhance teller productivity [Exhibit 16].
9
The one area where Korea banks excel is in taking deposits. As mentioned before, the highly regulated banking environment in Korea effectively made increasing deposits the natural focus for Korean banks. As a result, banks streamlined the deposit-taking processes, while minimizing the advice content provided to depositors. From there, Korean banks were able to achieve high through handling of deposit accounts in a simple and computerized way. Opening an account is done at the teller, directly in the banks’ computer systems. All deposit handling is, therefore, as easy as handling transactions.
Capital intensity/technology Labor productivity has been further depressed by a lack of investment in Korean banks. Although the number of branches per capita is high in Korea, Korean banks invested much less in information technology than Western banks. This was largely due to the preponderance of paper-based transactions and the failure to adopt managerial best practices in centralizing and automating back office processes and in using IT for credit approval processes. We estimated the IT stock (per unit of output) in Korea to be at around 40% of the US level, and despite the need to catch up, current IT spending per output is only at around 60% of the US level.
Industry dynamics
Korea demonstrates a lower competitive intensity within the overall PFS banking sector. Compared to the US, the pressure level from industry competition does not seem to have been high enough to sufficiently focus management’s attention on productivity gains.
Competition rules Ultimately, rules set by the government have limited banks’ to competing to offer efficient deposit taking services and capture high volumes of consumer deposits. In its effort to mobilize domestic funds and to channel these funds to prioritized industrial sectors, the government regulated factors such as interest rates or new product development (with which banks can differentiate themselves by improving their productivity) and implicitly guided banks to avoid lending to consumers. These regulations significantly influenced the banks’ behavior to focus on increasing deposits since the profit margin was guaranteed by the regulated interest rates on both deposit and lending. As a result, banks only competed through branch expansion to gain access to deposits and did not have to compete in payments and lending.
In addition, exit has also been controlled by the government. Strong ties between the government and industry seem to have created beliefs among bank managers and customers that banks will never go bankrupt – deposit insurance was only introduced in 1996. In fact, no Korean banks have gone bankrupt or merged for the past 15 years [Exhibit 17]. The only merger in the history of
10
banking industry (between Seoul Bank and Korea Trust Bank) was led by the government in 1976.
Absence of competition with specialized players and loan securitization In lending, the Korean government’s use of controlling entry to the banking industry to effectively channel funds to industrial development has led to relative absence of specialized consumer lending players [Exhibit 18]. This has led to far less competitive pressure on Korean banks to increase productivity as well as retarded the development of a centralized lending system often found at specialized players such as consumer financing companies in the US. These specialized loan providers in the US have eventually forced traditional large commercial banks to migrate to a centralized lending system.
Securitization of loans in the US has intensified competition by allowing segmentation of the value chain and lowering barriers to entry in each segment. Until recently, Korean banks were not able to effectively securitize their loans since they were not allowed to issue bonds (except for several specialized banks such as Korea Development Bank, Korea Long Term Credit Bank and Korea Housing Bank). This had the effect of keeping new consumer lending competitors out of the market by keeping high entry barriers.
External factors
Competition/concentration rules During the course of planned economic development as explained above, the government imposed significant regulation on the banking industry. This regulation has greatly influenced competitive behavior of Korean banks as indicated above. Some measures that have had a major impact on labor productivity can be summarized as follows:
¶ Entry barriers. Creating a new bank requires approval from an authority both in Korea and the US. However, in Korea, the need to control industry rather than market needs appears to have been a major factor in government decision making. This entry control by the government has impeded the creation of innovative new players such as specialized loan providers. Some of the new entrants in the US industry, on the other hand, have had a major impact in fostering industry competition – in 1984, Countrywide was a small Californian S&L; by 1992, it was the largest US mortgage lender.
¶ Direct as well as indirect (window) guidance on lending with the aim of supporting the industrial development of Korea sheltered banks from intense competitive pressure – not only by repressing retail lending but also by creating constant excess demand for retail bank loans [Exhibit 19]. Retail customers, as a result, had to run to an unregulated market (the curb market) for their loan needs.
11
Product regulation Until recently, regulation on the interest rates of both deposits and loans as well as on new product development has created undifferentiated banks in the industry. The only exception has been two products (housing installment savings and housing subscription account) provided by Korea Housing Bank. MMDA (money market deposit account) which introduced in the US in 1982 was only introduced in Korea in 1997. These product regulations have also hampered competition of Korean banking industry.
Corporate governance/government interference The pressure from owners in the US to improve productivity is much higher than in Korea. Striving to create shareholder value can be identified as a main driver for the productivity advantage of the US over Korea [Exhibit 20]:
¶ Unlike those in the US, top managers of Korean banks have been explicitly appointed by government policy makers instead of shareholders. Starting with this practice the government has exerted considerable influence [Exhibit 21] in management issues of almost all major banks. In some cases, the government has also bailed out troubled banks by providing special lending through the central bank. Therefore, bank managers are exempt from the shareholders pressure to maximize value through productivity improvement.
¶ While in the US, more than a third of the total compensation for top management of banks consists of a performance-related bonus, this share is significantly lower in Korea if it exists at all. This practice also fails to align productivity increases with management’s own agenda in the Korean PFS sector.
Labor rules/unionism Labor rules that have practically prevented layoffs as well as strong unions of all the banks under these labor rules appear to have also affected the industry dynamics and bank operations in Korea. Although it is changing, this practice may explain part of labor productivity disadvantage for Korean banks.
Korean labor rules have practically prevented layoffs, leading to implicit agreement between employer and employee of lifetime employment. Therefore, many Korean banks have relied on natural attrition and/or volunteer retirement through additional benefits (often as high as 3 years’ salary). An employment decline at close to attrition rates (e.g., in 1994, the 6 largest Korean commercial banks newly hired a total of 1,649 employees while 3,539 workers including volunteers retired) suggests that Korea was constrained by layoff barriers.
Moreover, all the Korean banks are unionized, including the central bank, and are affected by these labor rules. Our interviews suggest that the two main objectives of these unions are to secure the jobs and to negotiate favorable collective wage levels with managers. This practice appears to have been a major barrier for M&As since M&As usually involve layoffs. Another impact of
12
unionism can be the difficulty for bank managers to employ performance-based compensation. Union leaders seem to worry about the fact that measuring employee performance would eventually bring differentiated wage levels among workers, significantly limiting union’s power in collective wage negotiation.
CHALLENGES AND IMPLICATIONS
Relative underdevelopment of the PFS sector, especially in consumer lending as explained above, provides a large opportunity going forward to create jobs and to serve customers who have been set aside to supply funds for industrial development. Further, corporations’ gradual shift of corporate funding source from banks to capital market, namely financial disintermediation [Exhibit 22], forces the banks to seek an alternative lending market, retail loans.
Government
We acknowledge that the Korean government has taken many initiatives to increase efficiency and to further develop the industry by intensifying competitive atmosphere of the PFS sector. Ongoing interest rate deregulation, stoppage of most policy loans, and gradual breakdown of firewalls between businesses are notable actions. The impact of these policy changes can be identified in many respects. For example, interest deregulation has increased customer sensitivity to product prices, thus intensifying price competition among banks. These banks will eventually focus more on improving their operational efficiency to win the competition.
However, there are some other areas where government changes or efforts are needed to help drive industry development and to sustain further economic development as the country becomes fully developed.
Stop appointing bank managers The government should set up independent outside Boards of Directors who have the authority to hire and fire bank CEOs and the senior management team. Only with such an obvious move away from government appointments will Korean bank managers start to act in a manner that maximizes shareholder value.
Eliminate indirect government intervention in banking management The legacy of implicit interference in the lending decisions through so-called window guidance also impedes management autonomy. By stopping these practices, the government can help restore a performance-oriented mindset to the bank managers for their operational results.
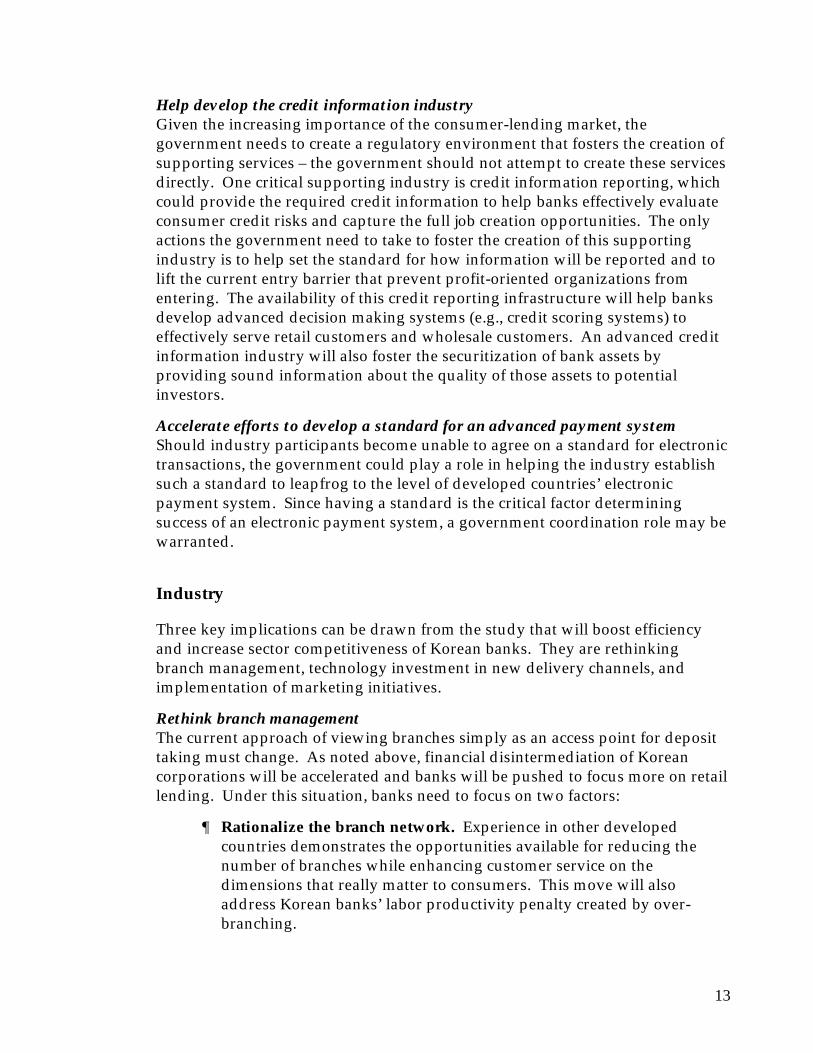
13
Help develop the credit information industry Given the increasing importance of the consumer-lending market, the government needs to create a regulatory environment that fosters the creation of supporting services – the government should not attempt to create these services directly. One critical supporting industry is credit information reporting, which could provide the required credit information to help banks effectively evaluate consumer credit risks and capture the full job creation opportunities. The only actions the government need to take to foster the creation of this supporting industry is to help set the standard for how information will be reported and to lift the current entry barrier that prevent profit-oriented organizations from entering. The availability of this credit reporting infrastructure will help banks develop advanced decision making systems (e.g., credit scoring systems) to effectively serve retail customers and wholesale customers. An advanced credit information industry will also foster the securitization of bank assets by providing sound information about the quality of those assets to potential investors.
Accelerate efforts to develop a standard for an advanced payment system Should industry participants become unable to agree on a standard for electronic transactions, the government could play a role in helping the industry establish such a standard to leapfrog to the level of developed countries’ electronic payment system. Since having a standard is the critical factor determining success of an electronic payment system, a government coordination role may be warranted.
Industry
Three key implications can be drawn from the study that will boost efficiency and increase sector competitiveness of Korean banks. They are rethinking branch management, technology investment in new delivery channels, and implementation of marketing initiatives.
Rethink branch management The current approach of viewing branches simply as an access point for deposit taking must change. As noted above, financial disintermediation of Korean corporations will be accelerated and banks will be pushed to focus more on retail lending. Under this situation, banks need to focus on two factors:
¶ Rationalize the branch network. Experience in other developed countries demonstrates the opportunities available for reducing the number of branches while enhancing customer service on the dimensions that really matter to consumers. This move will also address Korean banks’ labor productivity penalty created by over-branching.

14
¶ Build a centralized lending system to manage the cost and risk of handling retail loans. This new system is required since consumer loans are generally larger in number and smaller in loan amount than wholesale products – the manual approach of repeatedly reviewing each loan application will not work.
New delivery channels In order to become more efficient in providing banking services and to effectively meet ever-changing customer needs as well as to help rethink traditional branch concept, Korean banks have to consider investing in a new type of delivery technology. On-line delivery systems, for example, are getting popular in several advanced countries as customers become more computer literate and demand the additional services that can only be offered through on-line connections (e.g., electronic statements, 24-hour account information). Charles Schwab provides an interesting example. Schwab has introduced a variety of delivery systems, including “e.Schwab” on-line software and “Schwab Online” on the World Wide Web and Microsoft Network; already, 15% of all transactions come in by PC, and 25,000 orders a day flow in through Internet. Schwab spends 10 to 15% of its annual revenues on technology and vigorously leverages other companies such as Microsoft Network and CompuServe to develop advanced electronic systems, such as WOW! On-line venture.
Market alternative services Korean banks also have to become more aggressive in migrating customers to more productive payment instruments – especially considering that the enabling mechanisms are already in place (e.g., ATM penetration in Korea is the same as in the US and companies such as Korea Telecom are providing discounts to customers switching to direct debit). This migration will improve not only overall industry productivity but also profitability of individual banks since electronic transactions are far more cost efficient than traditional transaction methods [Exhibit 23].
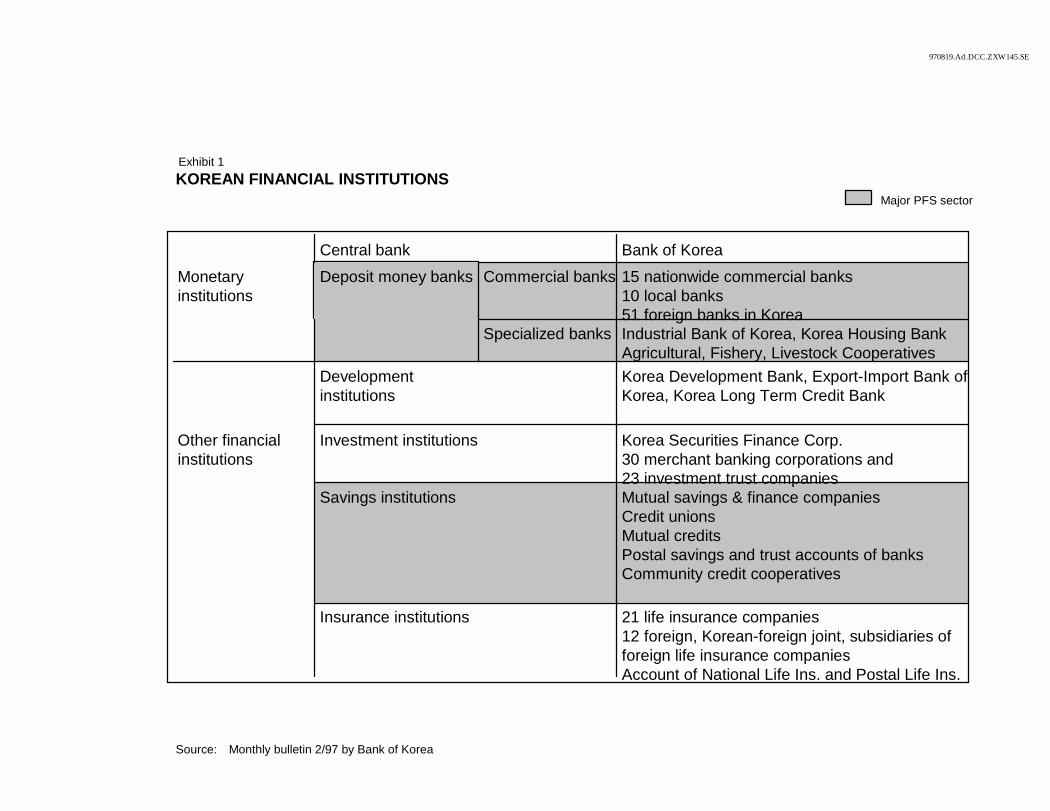
970819.Ad.DCC.ZXW145.SE
Central bank Bank of KoreaMonetary institutions
Deposit money banks Commercial banks 15 nationwide commercial banks10 local banks51 foreign banks in Korea
Specialized banks Industrial Bank of Korea, Korea Housing BankAgricultural, Fishery, Livestock Cooperatives
Development institutions
Korea Development Bank, Export-Import Bank of Korea, Korea Long Term Credit Bank
Other financial institutions
Investment institutions Korea Securities Finance Corp.30 merchant banking corporations and 23 investment trust companies
Savings institutions Mutual savings & finance companiesCredit unionsMutual creditsPostal savings and trust accounts of banksCommunity credit cooperatives
Insurance institutions 21 life insurance companies12 foreign, Korean-foreign joint, subsidiaries of foreign life insurance companiesAccount of National Life Ins. and Postal Life Ins.
Source: Monthly bulletin 2/97 by Bank of Korea
KOREAN FINANCIAL INSTITUTIONSMajor PFS sector
Exhibit 1
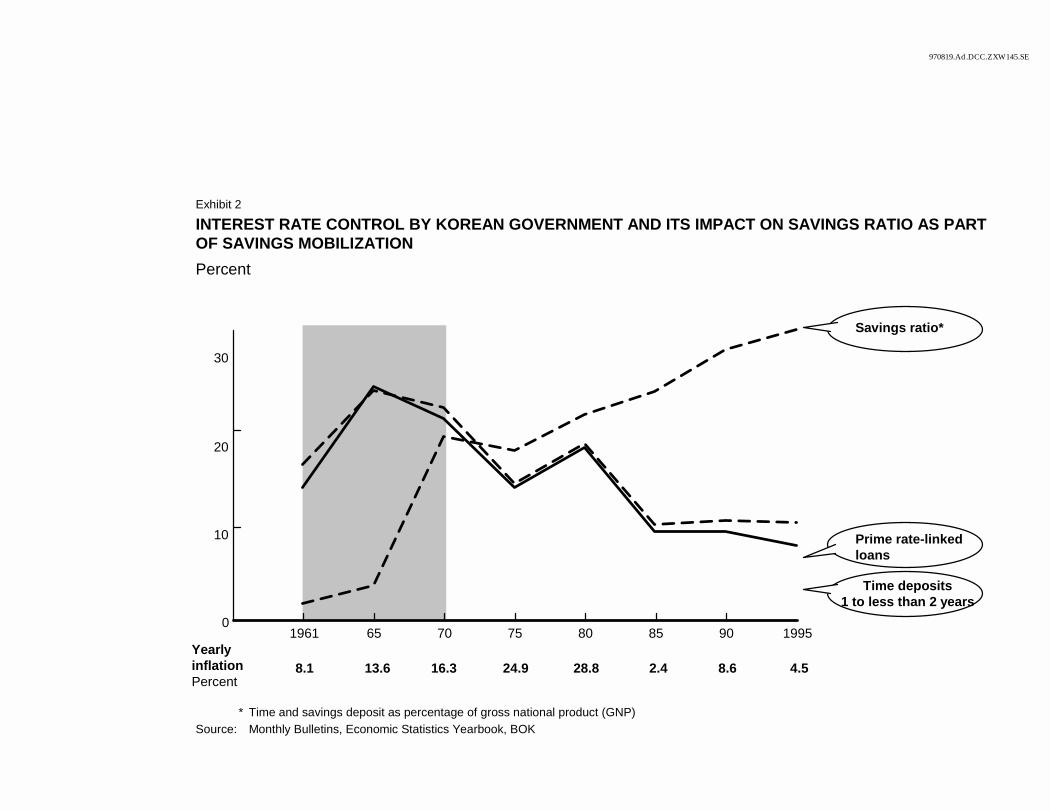
970819.Ad.DCC.ZXW145.SE
INTEREST RATE CONTROL BY KOREAN GOVERNMENT AND ITS IMPACT ON SAVINGS RATIO AS PART OF SAVINGS MOBILIZATIONPercent
* Time and savings deposit as percentage of gross national product (GNP)Source: Monthly Bulletins, Economic Statistics Yearbook, BOK
0
10
20
30
1961 65 70 75 80 85 90 1995
Prime rate-linked loans
Time deposits 1 to less than 2 years
Yearly inflationPercent
8.1 13.6 16.3 24.9 28.8 2.4 8.6 4.5
Savings ratio*
Exhibit 2
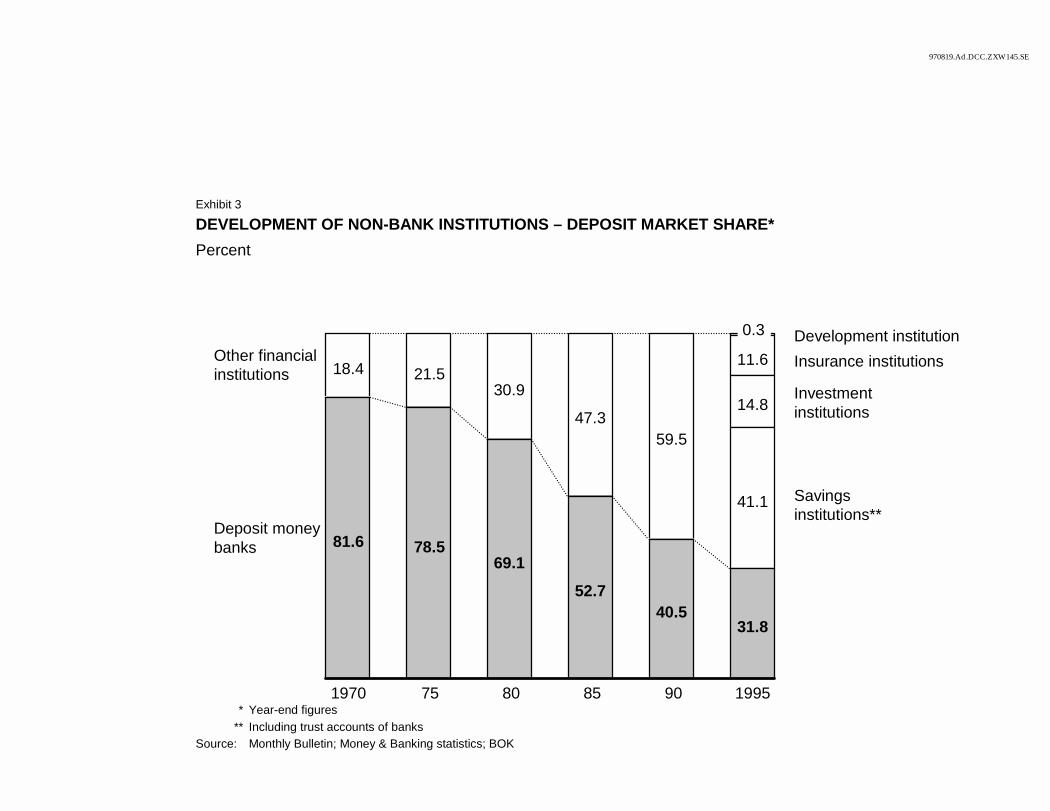
970819.Ad.DCC.ZXW145.SE
DEVELOPMENT OF NON-BANK INSTITUTIONS – DEPOSIT MARKET SHARE* Percent
* Year-end figures** Including trust accounts of banks
Source: Monthly Bulletin; Money & Banking statistics; BOK
Other financialinstitutions 18.4 21.5
30.9
47.359.5
11.6
14.8
41.1Deposit moneybanks 81.6 78.5
69.152.7
40.531.8
1970 75 80 85 90 1995
Savingsinstitutions**
Investmentinstitutions
Insurance institutionsDevelopment institution0.3
Exhibit 3
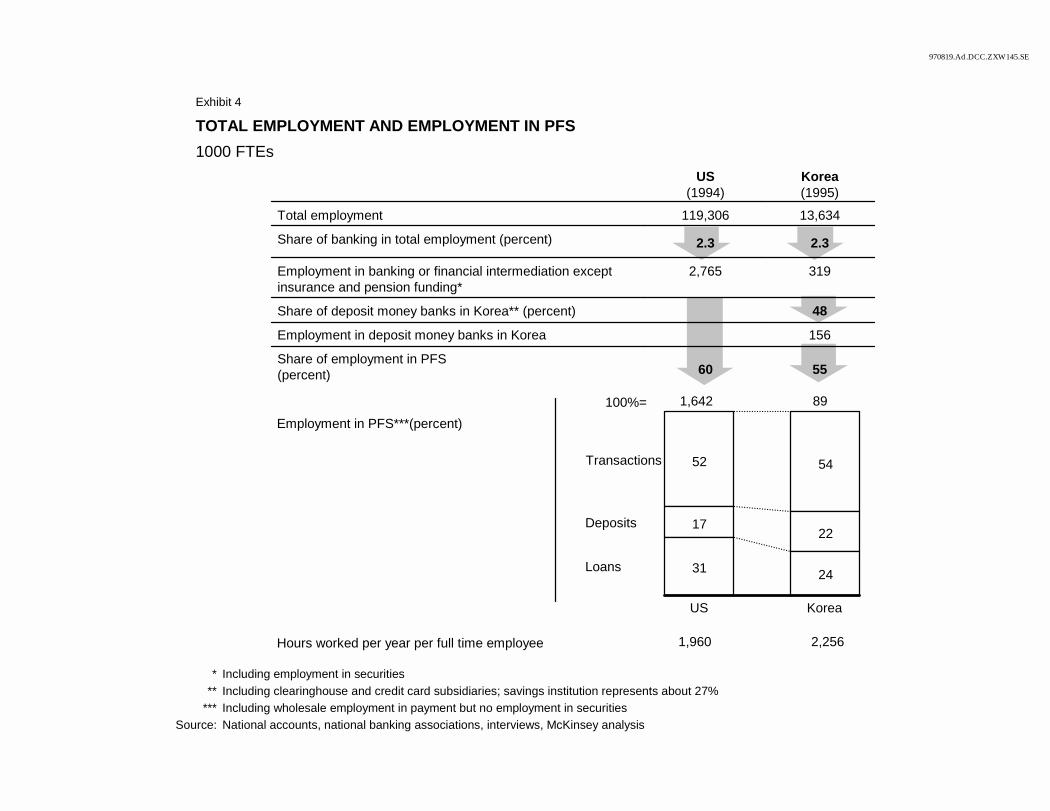
970819.Ad.DCC.ZXW145.SE
US(1994)
Korea(1995)
Total employment 119,306 13,634
Share of banking in total employment (percent) 2.3 2.3
Employment in banking or financial intermediation except insurance and pension funding*
2,765 319
Share of deposit money banks in Korea** (percent) 48
Employment in deposit money banks in Korea 156
Share of employment in PFS(percent) 60 55
TOTAL EMPLOYMENT AND EMPLOYMENT IN PFS 1000 FTEs
* Including employment in securities** Including clearinghouse and credit card subsidiaries; savings institution represents about 27%
*** Including wholesale employment in payment but no employment in securitiesSource: National accounts, national banking associations, interviews, McKinsey analysis
Transactions 52 54
Deposits 1722
Loans 31 24
US Korea
2,256
1,642 89Employment in PFS***(percent)
1,960
100%=
Hours worked per year per full time employee
Exhibit 4
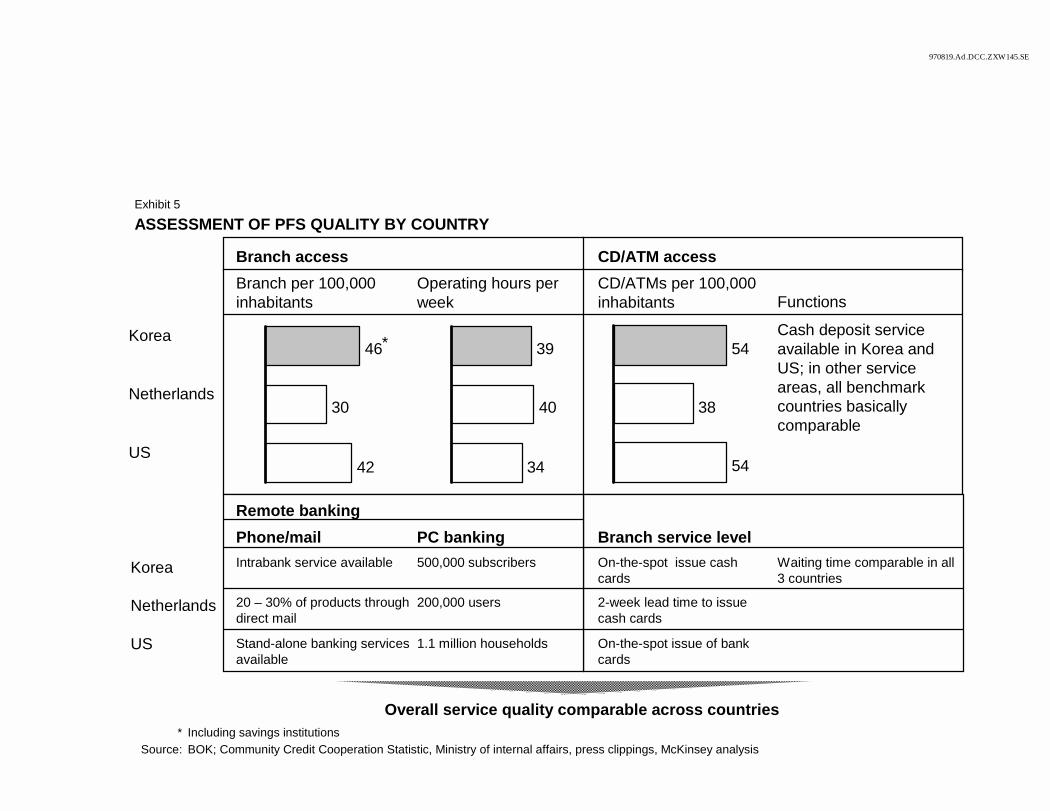
ASSESSMENT OF PFS QUALITY BY COUNTRY
970819.Ad.DCC.ZXW145.SE
Korea
Netherlands
US
* Including savings institutionsSource: BOK; Community Credit Cooperation Statistic, Ministry of internal affairs, press clippings, McKinsey analysis
Branch access CD/ATM accessBranch per 100,000 inhabitants
Operating hours per week
CD/ATMs per 100,000 inhabitants Functions
Cash deposit service available in Korea and US; in other service areas, all benchmark countries basically comparable
Remote bankingBranch service levelPhone/mail PC banking
Intrabank service available 500,000 subscribers On-the-spot issue cash cards
Waiting time comparable in all 3 countries
20 – 30% of products through direct mail
200,000 users 2-week lead time to issue cash cards
Stand-alone banking services available
1.1 million households On-the-spot issue of bank cards
46
30
42
Korea
Netherlands
US
39
40
34
54
38
54
*
Overall service quality comparable across countries
Exhibit 5
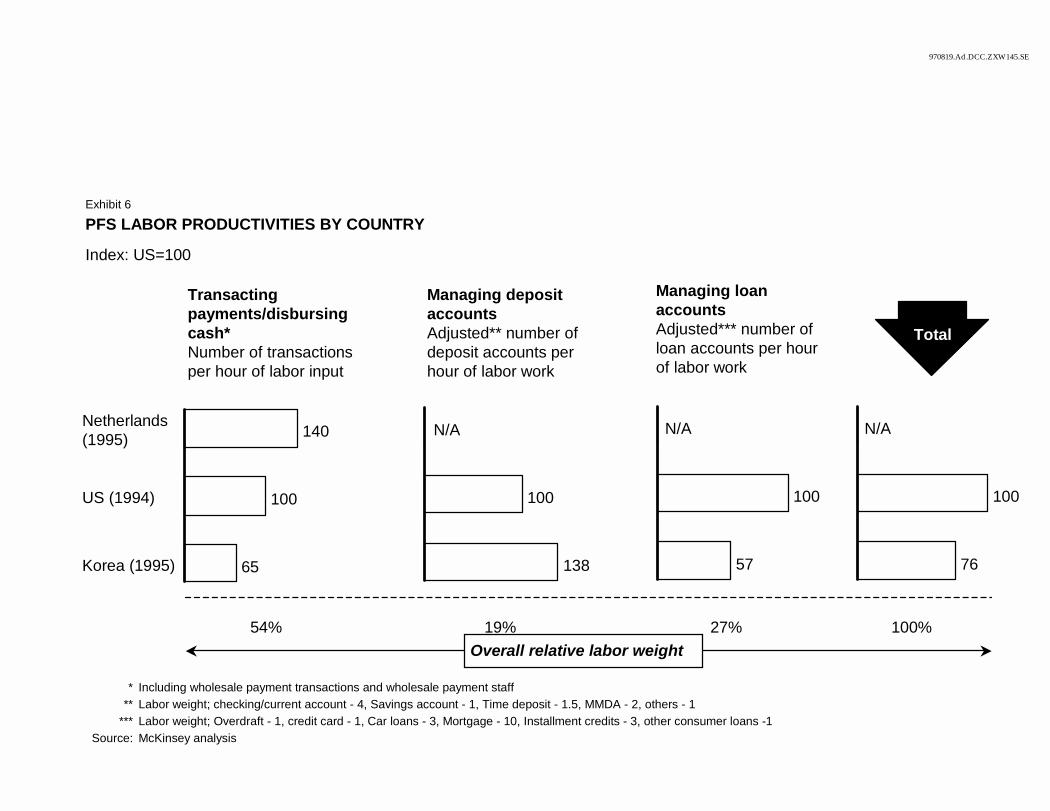
970819.Ad.DCC.ZXW145.SE
PFS LABOR PRODUCTIVITIES BY COUNTRY
140
100
65
Netherlands(1995)
US (1994)
Korea (1995)
N/A
100
138
N/A
100
57
Transacting payments/disbursing cash*Number of transactions per hour of labor input
Managing deposit accountsAdjusted** number of deposit accounts per hour of labor work
Managing loan accountsAdjusted*** number of loan accounts per hour of labor work
Index: US=100
* Including wholesale payment transactions and wholesale payment staff** Labor weight; checking/current account - 4, Savings account - 1, Time deposit - 1.5, MMDA - 2, others - 1
*** Labor weight; Overdraft - 1, credit card - 1, Car loans - 3, Mortgage - 10, Installment credits - 3, other consumer loans -1Source: McKinsey analysis
N/A
100
76
Total
Overall relative labor weight54% 19% 27% 100%
Exhibit 6
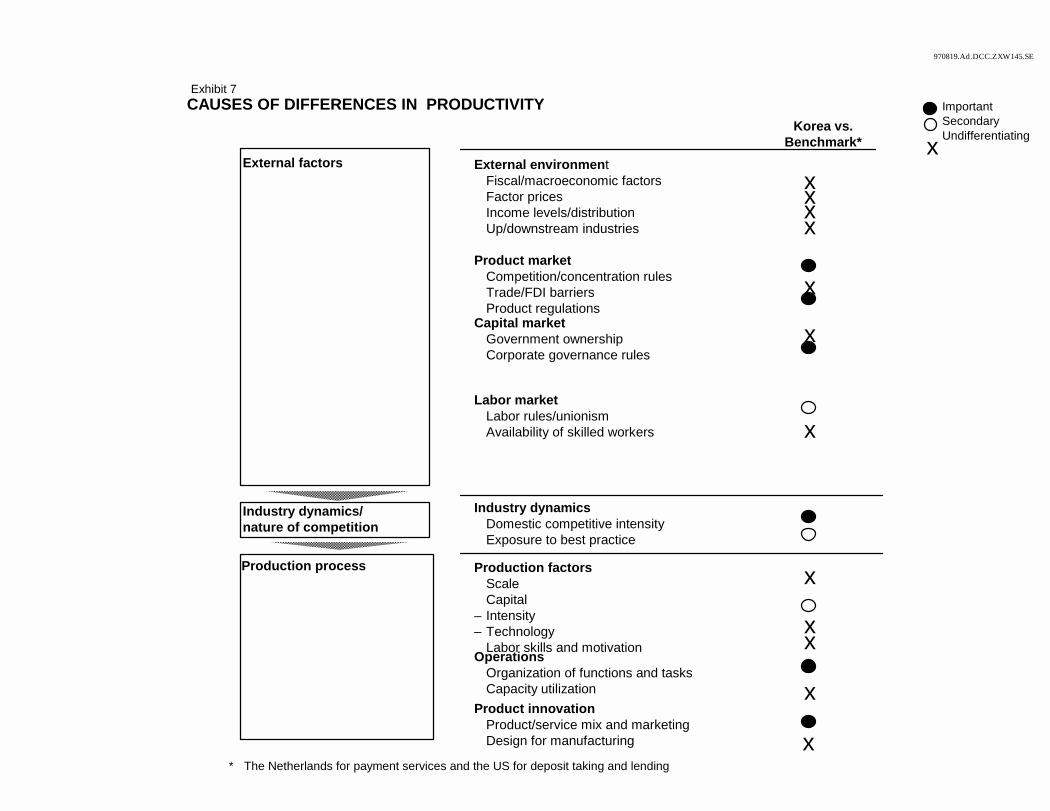
970819.Ad.DCC.ZXW145.SE
Korea vs. Benchmark*
External environment� Fiscal/macroeconomic factors� Factor prices� Income levels/distribution� Up/downstream industries
Product market� Competition/concentration rules� Trade/FDI barriers� Product regulations Capital market� Government ownership� Corporate governance rules
Labor market� Labor rules/unionism� Availability of skilled workers
Industry dynamics� Domestic competitive intensity� Exposure to best practice
Production factors� Scale� Capital– Intensity– Technology� Labor skills and motivationOperations� Organization of functions and tasks� Capacity utilizationProduct innovation� Product/service mix and marketing� Design for manufacturing
CAUSES OF DIFFERENCES IN PRODUCTIVITY
x
x
ImportantSecondaryUndifferentiating
External factors
Industry dynamics/nature of competition
Production process
x
x
x
x
xxxx
x
x
x
Exhibit 7
* The Netherlands for payment services and the US for deposit taking and lending
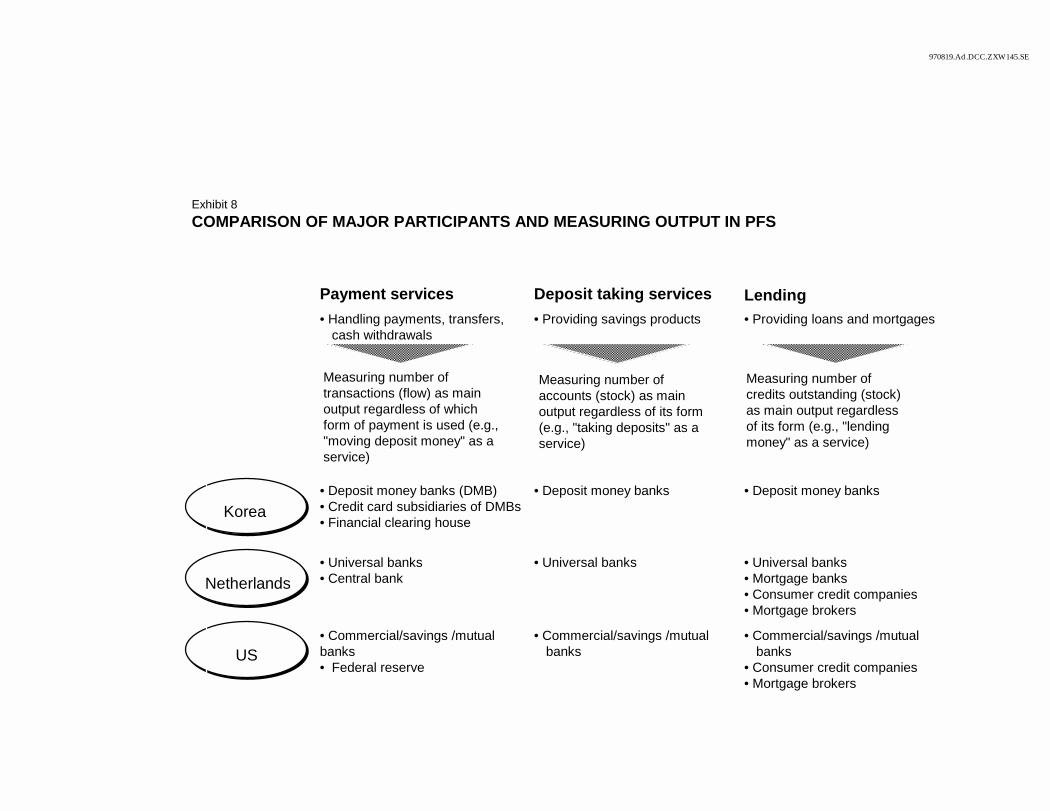
970819.Ad.DCC.ZXW145.SE
COMPARISON OF MAJOR PARTICIPANTS AND MEASURING OUTPUT IN PFS
Payment services Deposit taking services Lending• Handling payments, transfers,
cash withdrawals• Providing savings products • Providing loans and mortgages
• Deposit money banks (DMB)• Credit card subsidiaries of DMBs• Financial clearing house
• Deposit money banks • Deposit money banks
• Universal banks• Central bank
• Universal banks • Universal banks• Mortgage banks• Consumer credit companies• Mortgage brokers
• Commercial/savings /mutualbanks• Federal reserve
• Commercial/savings /mutual banks
• Commercial/savings /mutual banks
• Consumer credit companies• Mortgage brokers
Korea
Netherlands
US
Measuring number of transactions (flow) as main output regardless of which form of payment is used (e.g., "moving deposit money" as a service)
Measuring number of accounts (stock) as main output regardless of its form (e.g., "taking deposits" as a service)
Measuring number of credits outstanding (stock) as main output regardless of its form (e.g., "lending money" as a service)
Exhibit 8
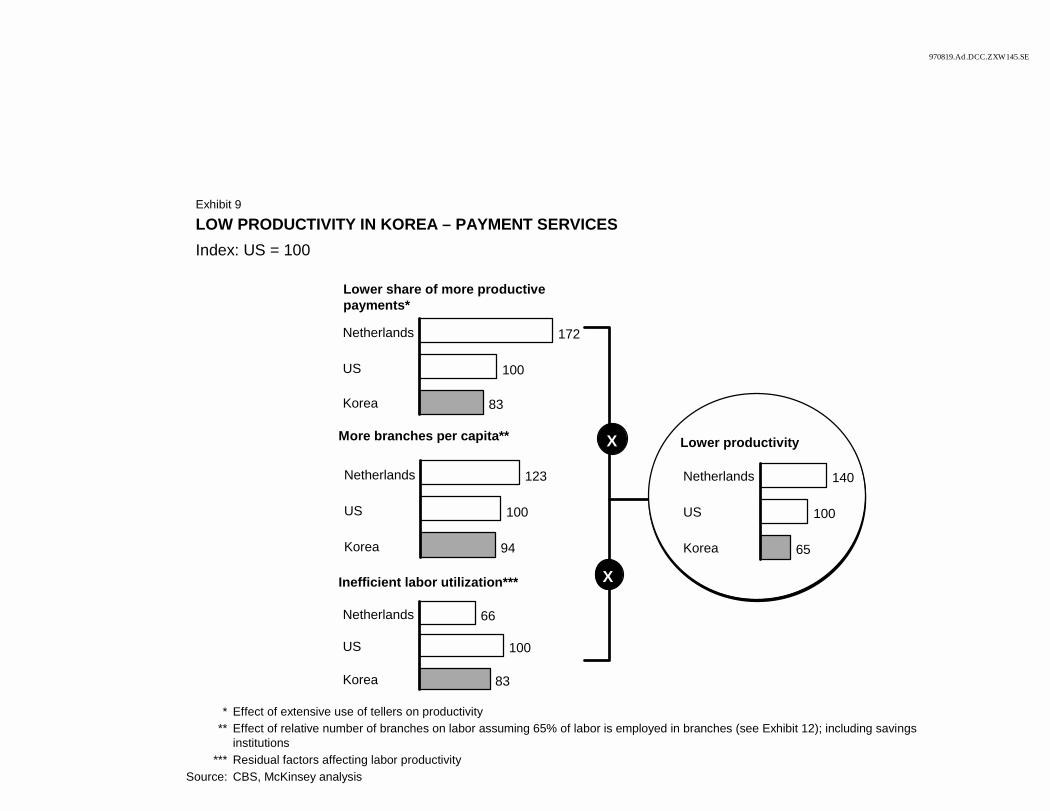
970819.Ad.DCC.ZXW145.SE
LOW PRODUCTIVITY IN KOREA – PAYMENT SERVICESIndex: US = 100
172
100
83
Netherlands
US
Korea
123
100
94
Netherlands
US
Korea
66
100
83
Netherlands
US
Korea
More branches per capita**
Inefficient labor utilization***
X
X
Lower productivity
140
100
65
Netherlands
US
Korea
* Effect of extensive use of tellers on productivity** Effect of relative number of branches on labor assuming 65% of labor is employed in branches (see Exhibit 12); including savings
institutions*** Residual factors affecting labor productivity
Source: CBS, McKinsey analysis
Lower share of more productive payments*
Exhibit 9
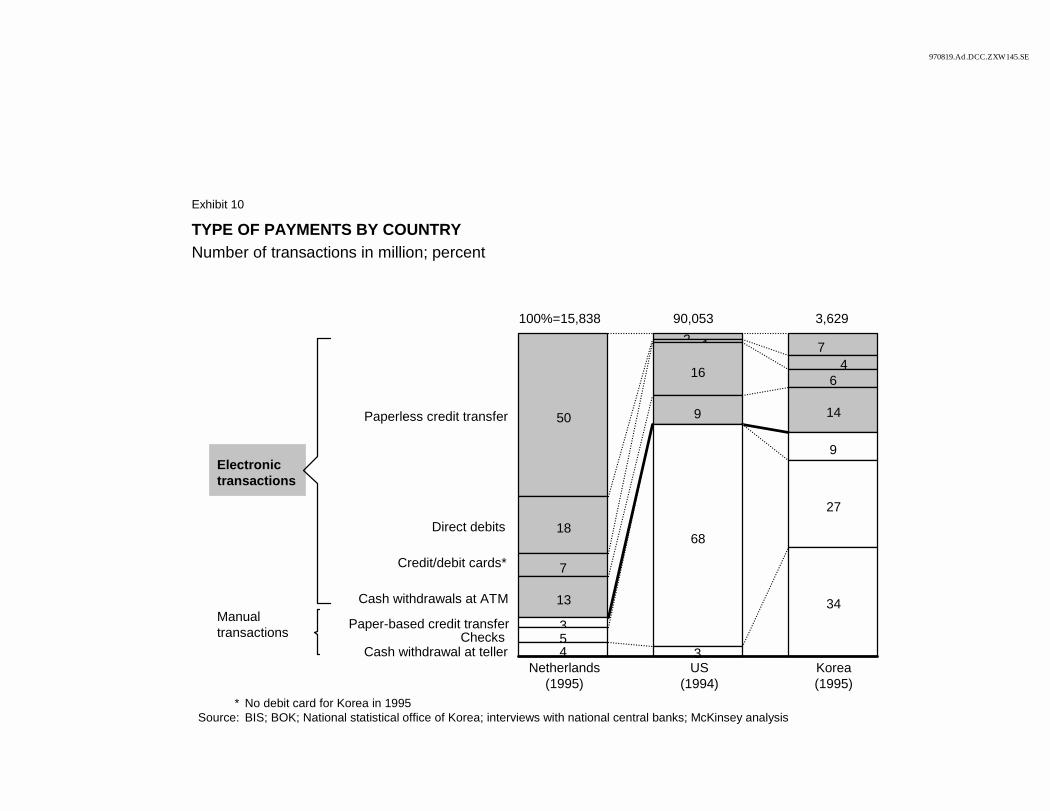
970819.Ad.DCC.ZXW145.SE
* No debit card for Korea in 1995Source: BIS; BOK; National statistical office of Korea; interviews with national central banks; McKinsey analysis
Electronic transactions
TYPE OF PAYMENTS BY COUNTRYNumber of transactions in million; percent
Manual transactions
Paperless credit transfer 50
2 7
Direct debits 18
14
Credit/debit cards* 7
16 6
Cash withdrawals at ATM 13
9 14
Paper-based credit transfer 3
9
Checks 5
68
27
Cash withdrawal at teller 4 3
34
Netherlands(1995)
US(1994)
Korea(1995)
100%=15,838 3,62990,053
Exhibit 10
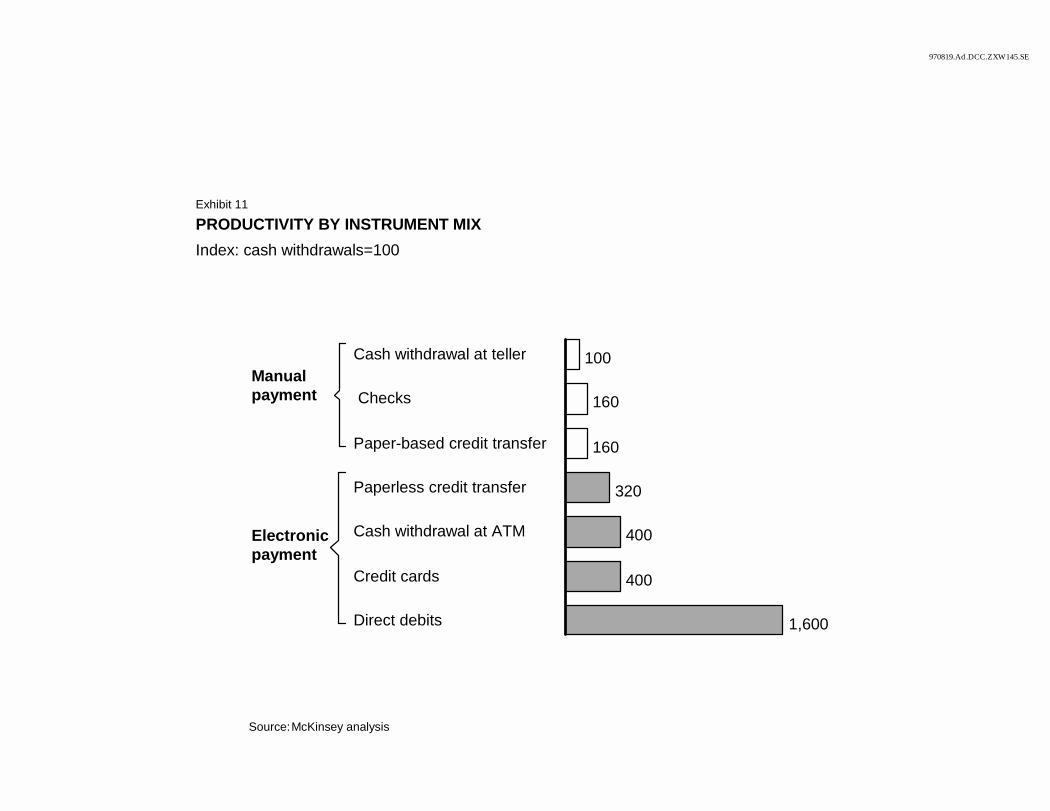
970819.Ad.DCC.ZXW145.SE
PRODUCTIVITY BY INSTRUMENT MIXIndex: cash withdrawals=100
Source:McKinsey analysis
Cash withdrawal at teller
Checks
Paper-based credit transfer
Paperless credit transfer
Cash withdrawal at ATM
Credit cards
Direct debits
100
160
160
320
400
400
1,600
Manualpayment
Electronic payment
Exhibit 11
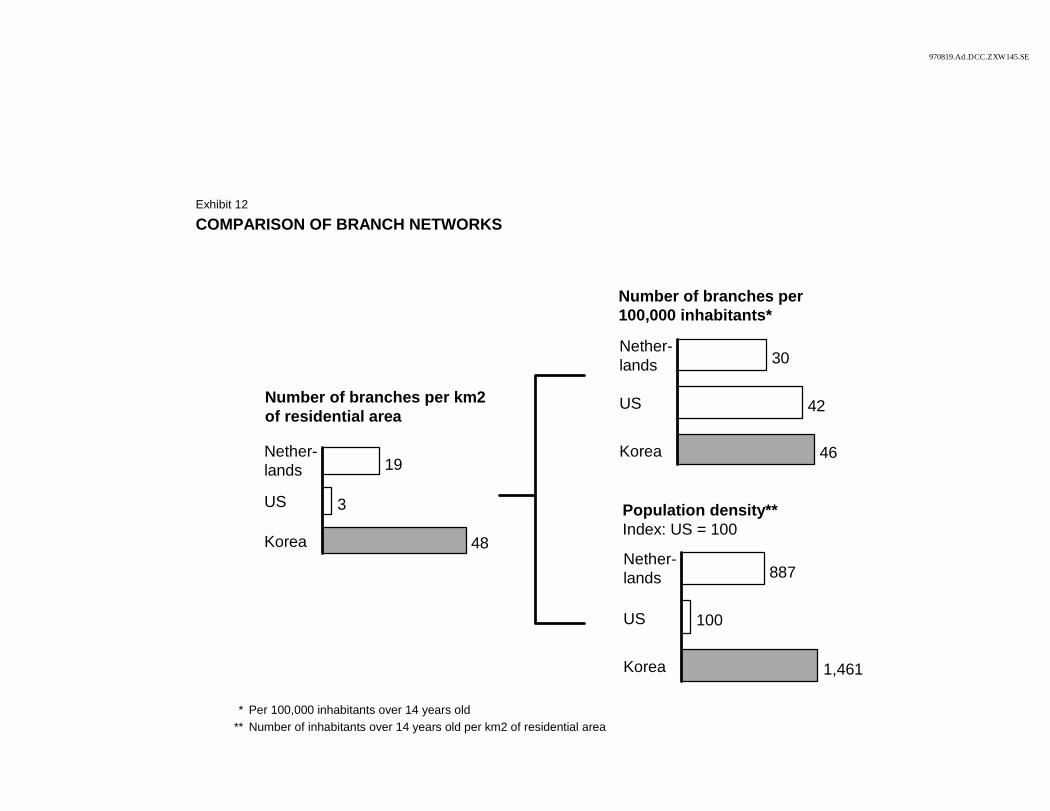
970819.Ad.DCC.ZXW145.SE
COMPARISON OF BRANCH NETWORKS
* Per 100,000 inhabitants over 14 years old** Number of inhabitants over 14 years old per km2 of residential area
Number of branches per km2 of residential area
19
3
48
Nether-lands
US
Korea
Population density**Index: US = 100
887
100
1,461
Nether-lands
US
Korea
Number of branches per 100,000 inhabitants*
30
42
46
Nether-lands
US
Korea
Exhibit 12
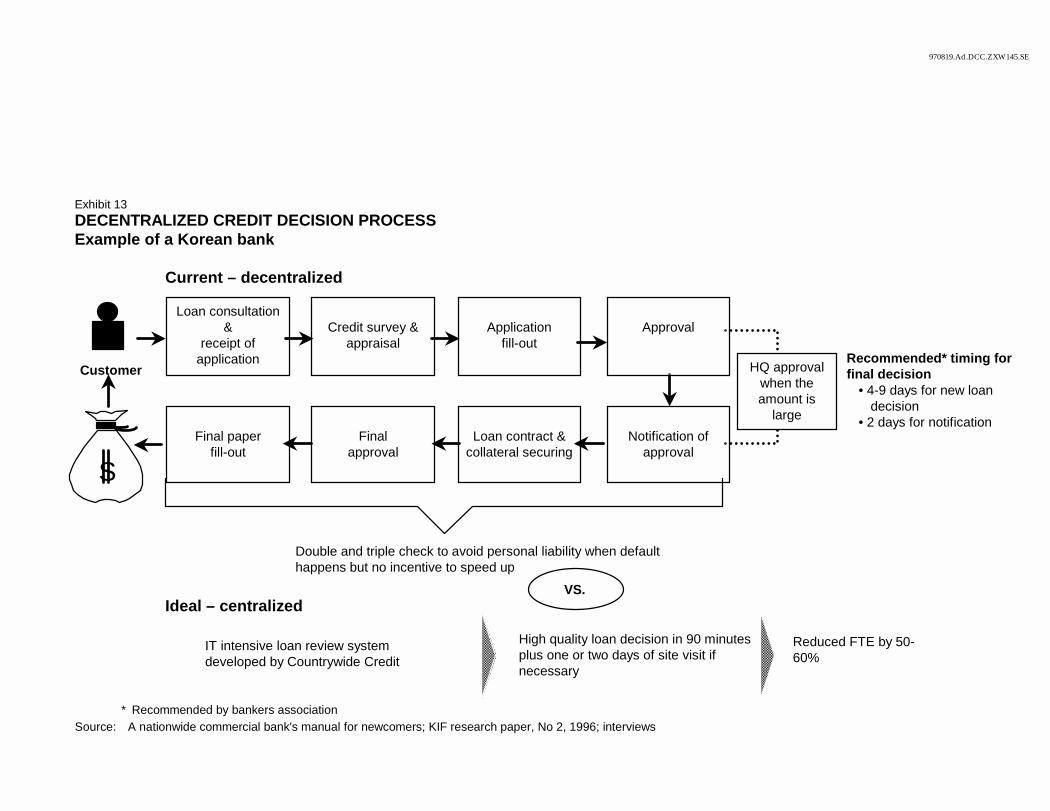
970819.Ad.DCC.ZXW145.SE
* Recommended by bankers association
DECENTRALIZED CREDIT DECISION PROCESS Example of a Korean bank
Customer
Loan consultation &
receipt of application
Credit survey &appraisal
Application fill-out
Approval
Final paper fill-out
Finalapproval
Loan contract &collateral securing
S
HQ approval when the amount is
large
Recommended* timing for final decision
• 4-9 days for new loan decision
• 2 days for notificationNotification of
approval
Source: A nationwide commercial bank's manual for newcomers; KIF research paper, No 2, 1996; interviews
VS.
IT intensive loan review system developed by Countrywide Credit
High quality loan decision in 90 minutes plus one or two days of site visit if necessary
Double and triple check to avoid personal liability when defaulthappens but no incentive to speed up
Reduced FTE by 50-60%
Exhibit 13
Current – decentralized
Ideal – centralized
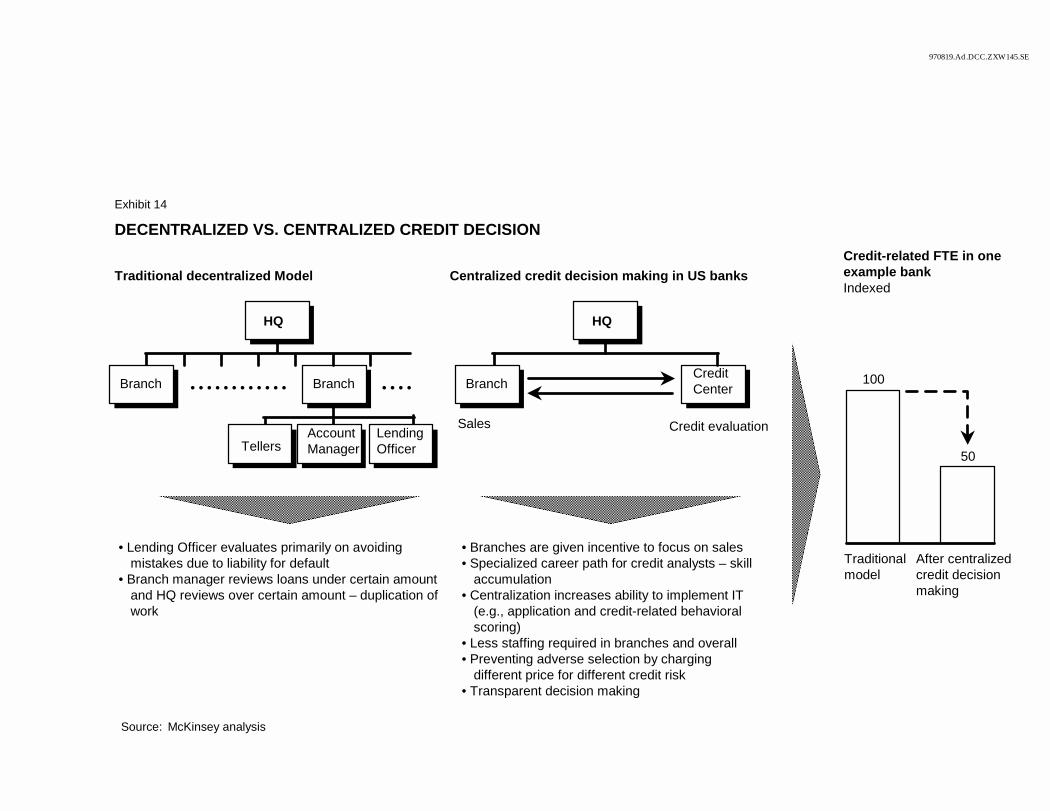
970819.Ad.DCC.ZXW145.SE
Branch
Account ManagerTellers
DECENTRALIZED VS. CENTRALIZED CREDIT DECISION
Traditional decentralized Model
LendingOfficer
• Lending Officer evaluates primarily on avoiding mistakes due to liability for default
• Branch manager reviews loans under certain amount and HQ reviews over certain amount – duplication of work
Centralized credit decision making in US banks
Sales Credit evaluation
• Branches are given incentive to focus on sales• Specialized career path for credit analysts – skill
accumulation• Centralization increases ability to implement IT
(e.g., application and credit-related behavioral scoring)
• Less staffing required in branches and overall• Preventing adverse selection by charging
different price for different credit risk• Transparent decision making
Credit-related FTE in one example bank Indexed
100
Traditional model
50
After centralized credit decision making
Source: McKinsey analysis
Branch
HQ
• • • • • • • • • • • • • • • • Branch
HQ
CreditCenter
Exhibit 14
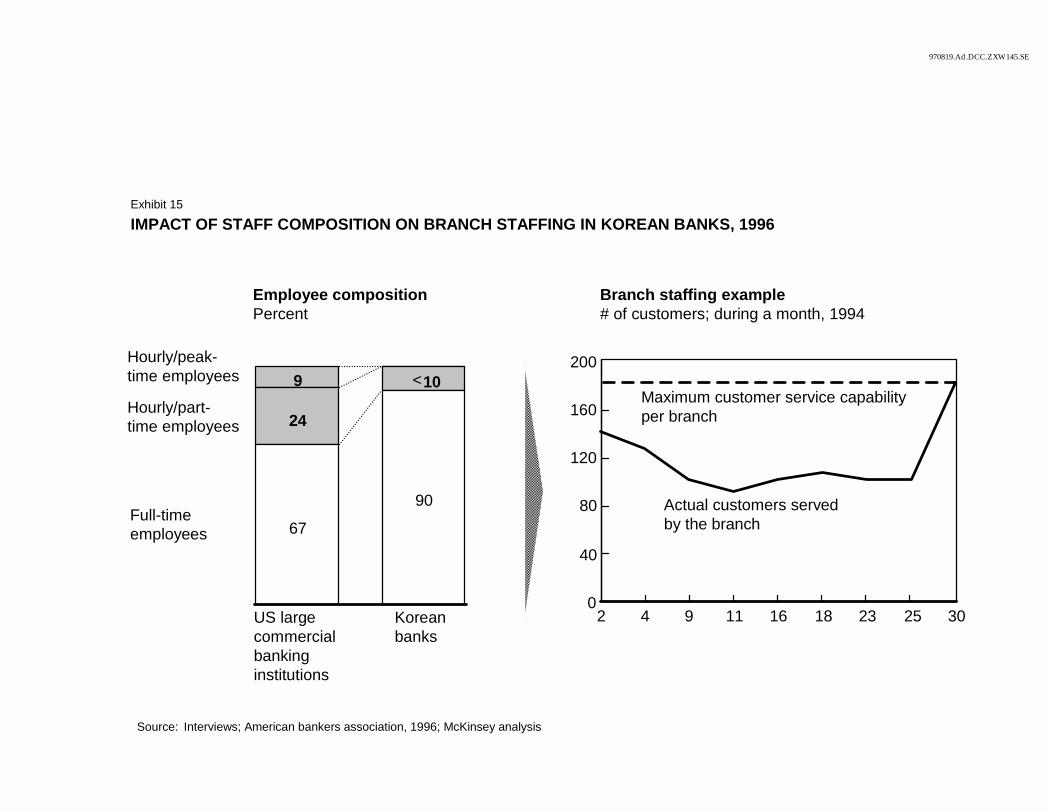
970819.Ad.DCC.ZXW145.SE
IMPACT OF STAFF COMPOSITION ON BRANCH STAFFING IN KOREAN BANKS, 1996
Source: Interviews; American bankers association, 1996; McKinsey analysis
Hourly/peak-time employees
Hourly/part-time employees
Full-time employees
US large commercial banking institutions
Korean banks
0
40
80
120
160
200
2 4 9 11 16 18 23 25 30
Branch staffing example# of customers; during a month, 1994
Actual customers served by the branch
Maximum customer service capability per branch
Employee compositionPercent
9
24
10
67
90
<
Exhibit 15
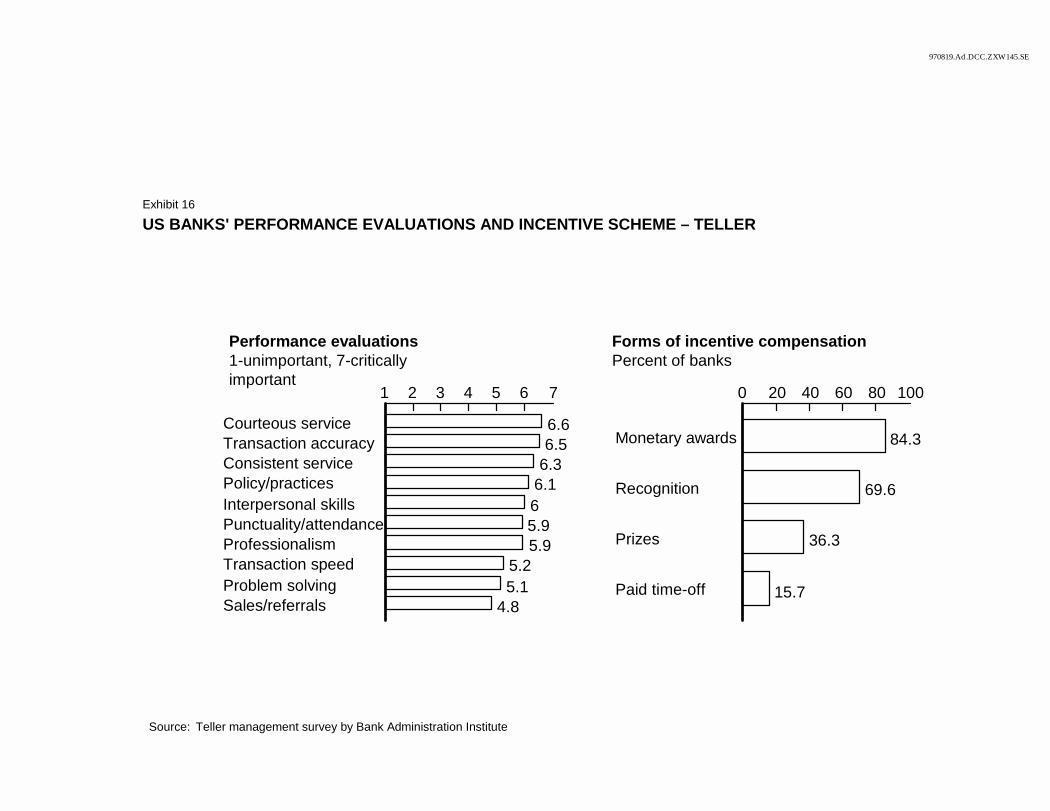
970819.Ad.DCC.ZXW145.SE
0 20 40 60 80 100
84.3
69.6
36.3
15.7
Monetary awards
Recognition
Prizes
Paid time-off
US BANKS' PERFORMANCE EVALUATIONS AND INCENTIVE SCHEME – TELLER
Source: Teller management survey by Bank Administration Institute
1 2 3 4 5 6 7
6.66.5
6.36.165.95.9
5.25.1
4.8
Courteous serviceTransaction accuracyConsistent servicePolicy/practicesInterpersonal skillsPunctuality/attendanceProfessionalism Transaction speedProblem solvingSales/referrals
Performance evaluations1-unimportant, 7-critically important
Forms of incentive compensationPercent of banks
Exhibit 16
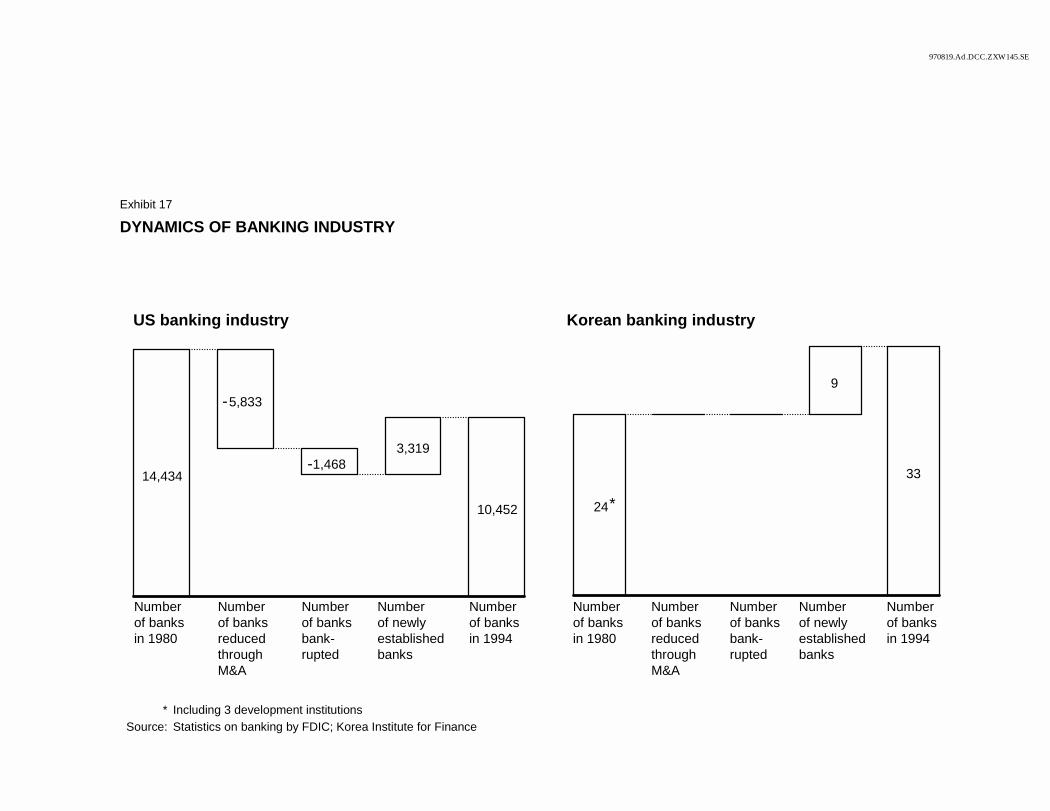
970819.Ad.DCC.ZXW145.SE
DYNAMICS OF BANKING INDUSTRY
* Including 3 development institutionsSource: Statistics on banking by FDIC; Korea Institute for Finance
14,434
5,833
1,4683,319
10,452
Number of banks in 1980
Numberof banks reduced through M&A
Number of banks bank-rupted
Number of newly established banks
Number of banks in 1994
US banking industry
24
9
33
Number of banks in 1980
Numberof banks reduced through M&A
Number of banks bank-rupted
Number of newly established banks
Number of banks in 1994
Korean banking industry
*
Exhibit 17
-
-
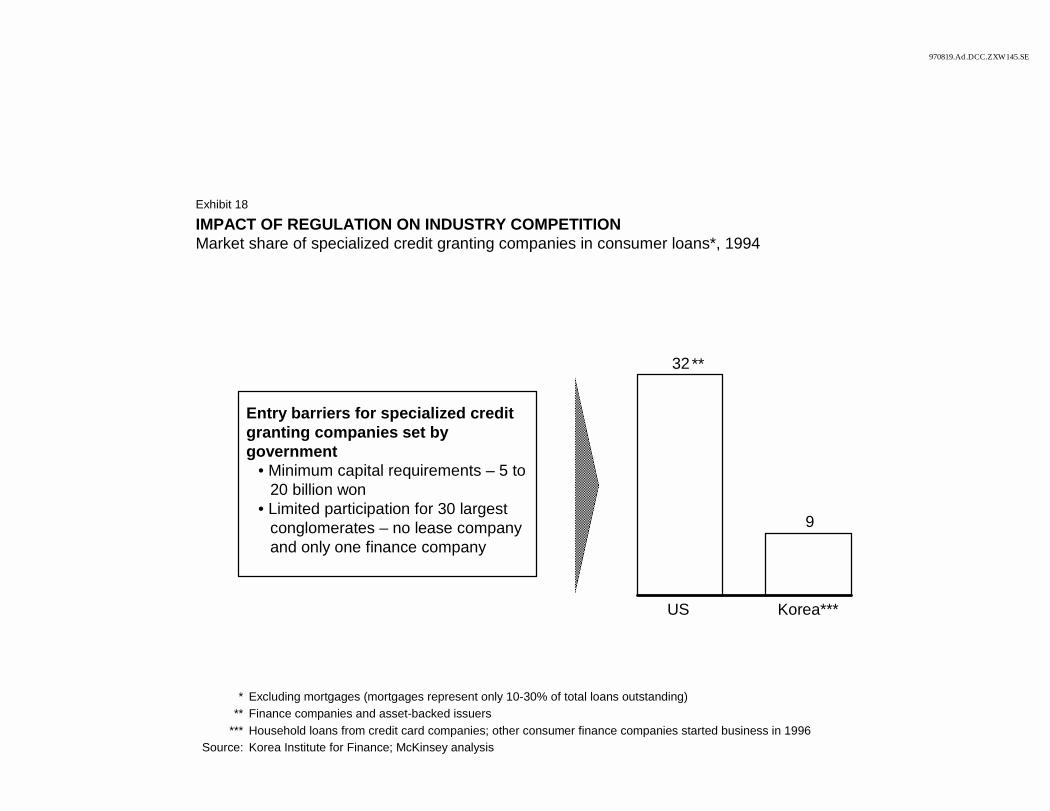
970819.Ad.DCC.ZXW145.SE
32
9
US Korea***
* Excluding mortgages (mortgages represent only 10-30% of total loans outstanding)** Finance companies and asset-backed issuers
*** Household loans from credit card companies; other consumer finance companies started business in 1996Source: Korea Institute for Finance; McKinsey analysis
IMPACT OF REGULATION ON INDUSTRY COMPETITION Market share of specialized credit granting companies in consumer loans*, 1994
**
Entry barriers for specialized credit granting companies set by government
• Minimum capital requirements – 5 to 20 billion won
• Limited participation for 30 largest conglomerates – no lease company and only one finance company
Exhibit 18
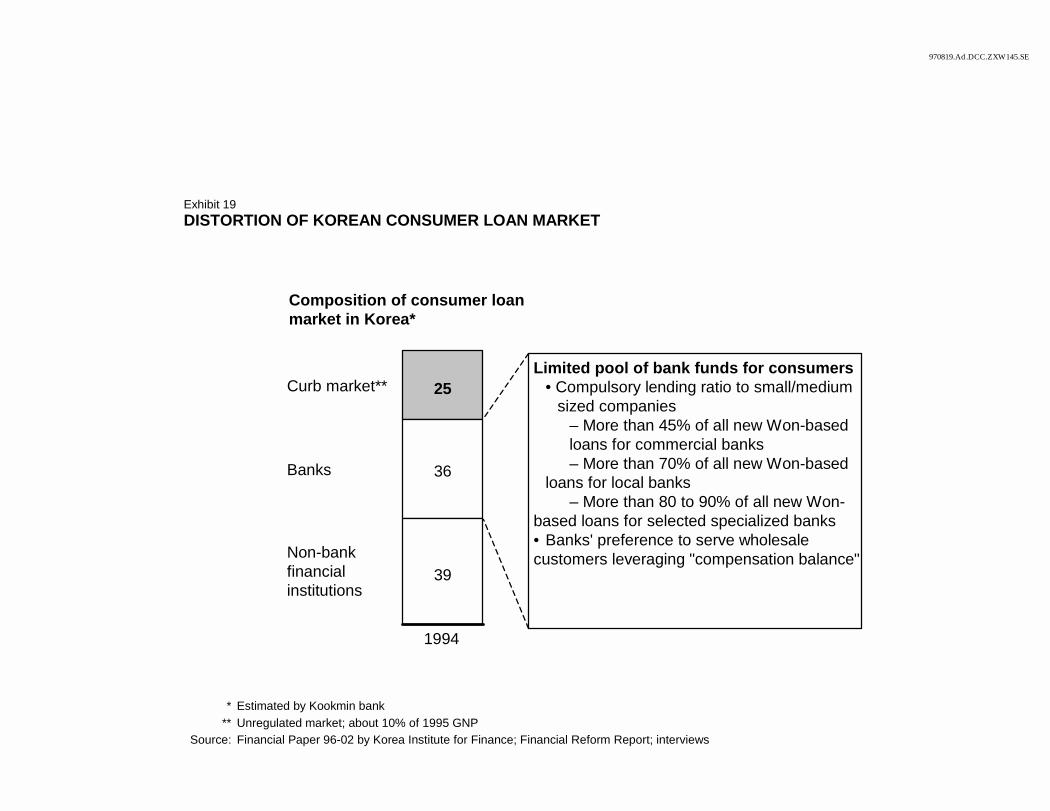
970819.Ad.DCC.ZXW145.SE
Curb market** 25
Banks 36
Non-bank financial institutions
39
1994
DISTORTION OF KOREAN CONSUMER LOAN MARKET
* Estimated by Kookmin bank** Unregulated market; about 10% of 1995 GNP
Source: Financial Paper 96-02 by Korea Institute for Finance; Financial Reform Report; interviews
Composition of consumer loan market in Korea*
Limited pool of bank funds for consumers• Compulsory lending ratio to small/medium
sized companies– More than 45% of all new Won-basedloans for commercial banks– More than 70% of all new Won-based
loans for local banks– More than 80 to 90% of all new Won-
based loans for selected specialized banks• Banks' preference to serve wholesale customers leveraging "compensation balance"
Exhibit 19
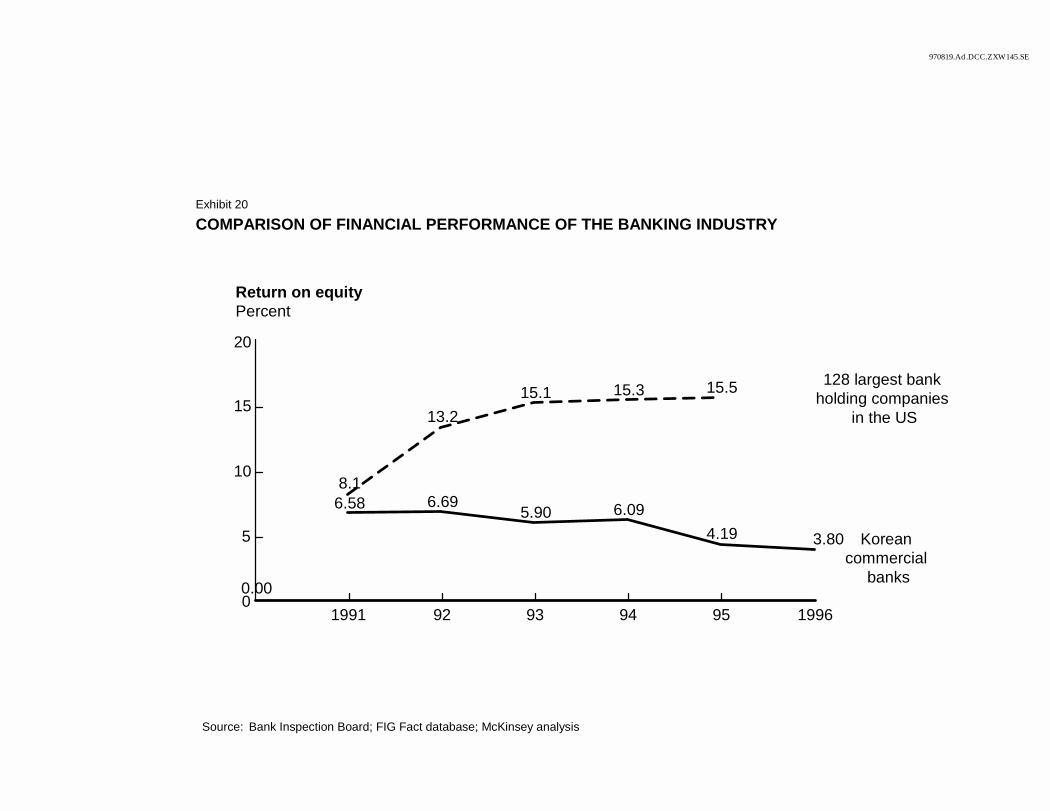
970819.Ad.DCC.ZXW145.SE
COMPARISON OF FINANCIAL PERFORMANCE OF THE BANKING INDUSTRY
Source: Bank Inspection Board; FIG Fact database; McKinsey analysis
0
5
10
15
20
128 largest bank holding companies
in the US
8.1
13.215.1 15.3 15.5
Korean commercial
banks0.00
6.58 6.69 5.90 6.094.19 3.80
1991 92 93 94 95 1996
Return on equityPercent
Exhibit 20
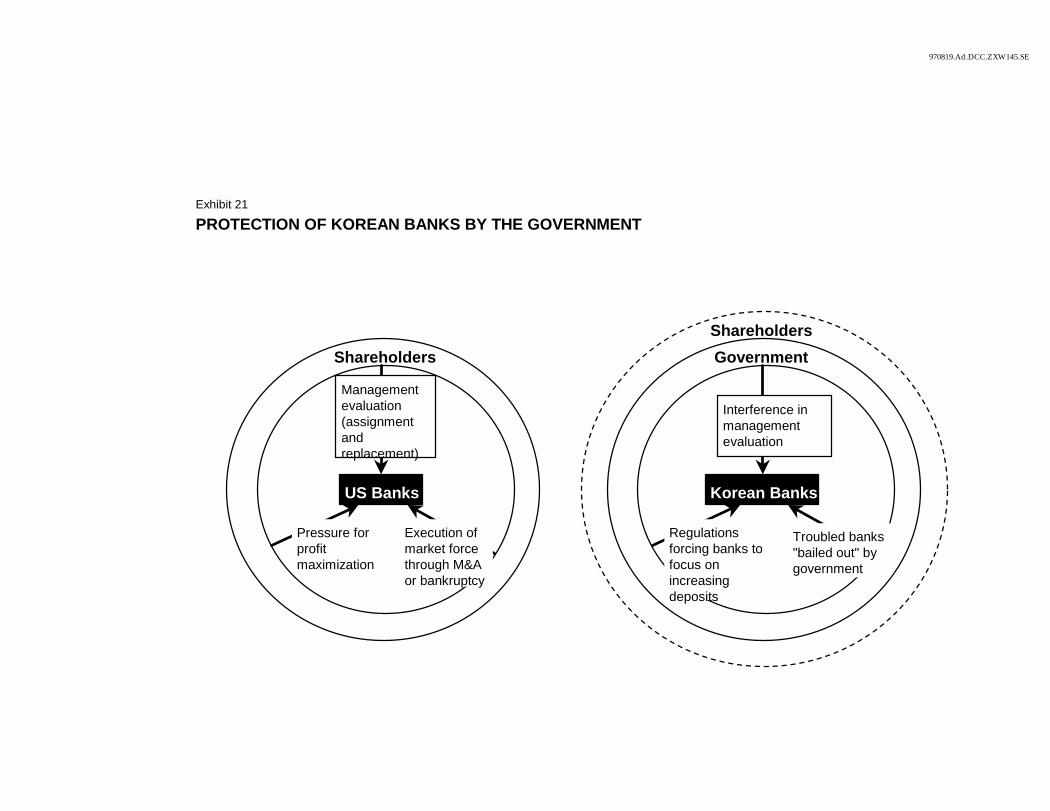
970819.Ad.DCC.ZXW145.SE
PROTECTION OF KOREAN BANKS BY THE GOVERNMENT
US Banks
Shareholders
Management evaluation (assignment and replacement)
Pressure for profit maximization
Execution of market force through M&A or bankruptcy
Korean Banks
Government
Interference in management evaluation
Regulations forcing banks to focus on increasing deposits
Troubled banks "bailed out" by government
Shareholders
Exhibit 21
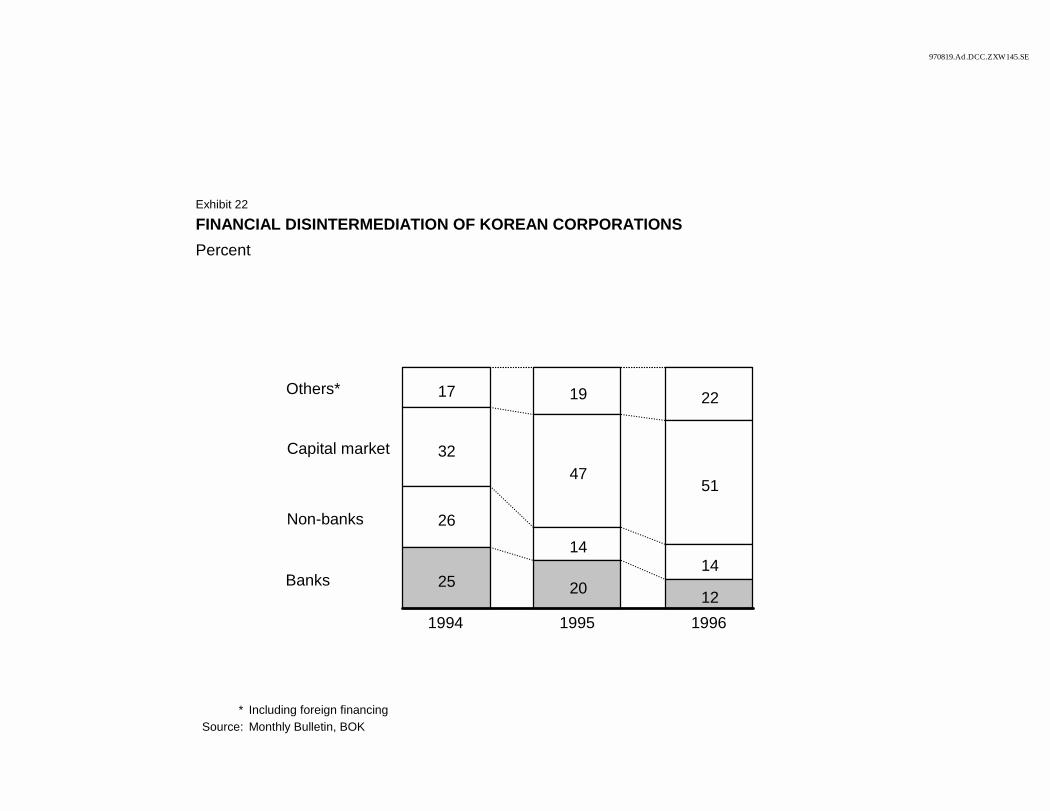
970819.Ad.DCC.ZXW145.SE
FINANCIAL DISINTERMEDIATION OF KOREAN CORPORATIONSPercent
* Including foreign financingSource: Monthly Bulletin, BOK
Others* 17 19 22
Capital market 3247
51
Non-banks 2614
14Banks 25 20 12
1994 1995 1996
Exhibit 22
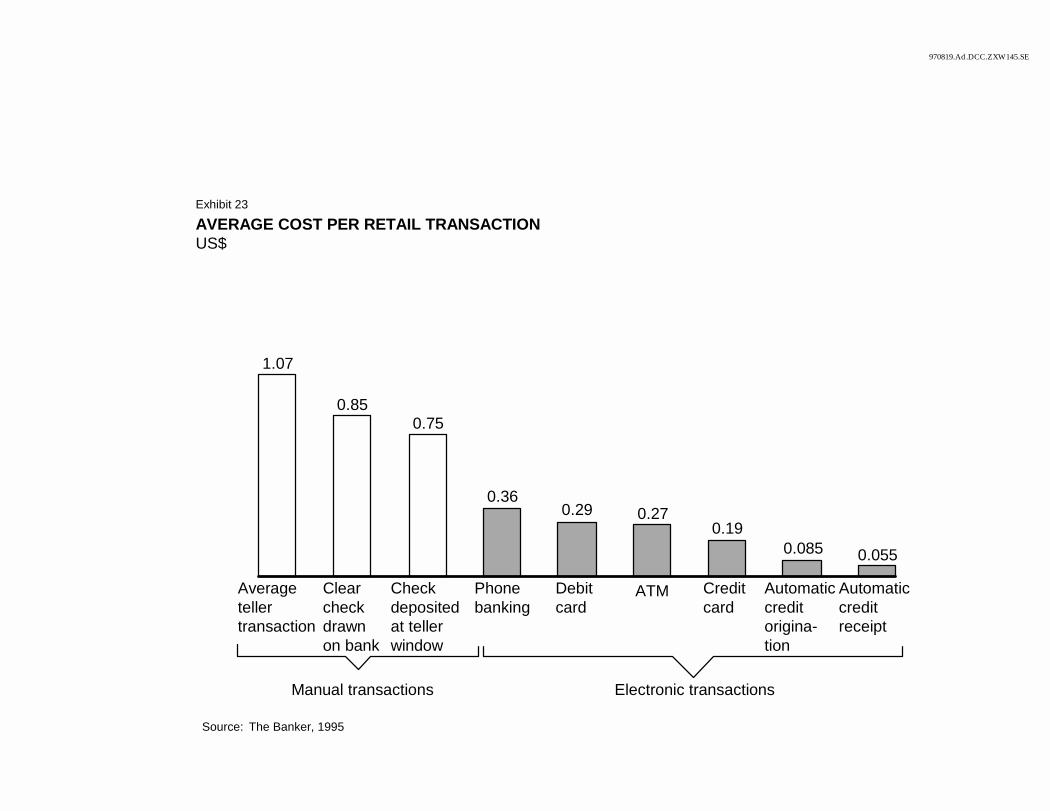
970819.Ad.DCC.ZXW145.SE
AVERAGE COST PER RETAIL TRANSACTIONUS$
Source: The Banker, 1995
Average teller transaction
Clear check drawn on bank
Check deposited at teller window
Phone banking
Debit card
ATM Credit card
Automatic credit origina-tion
Automatic credit receipt
1.07
0.850.75
0.360.29 0.27
0.190.085 0.055
Exhibit 23
Manual transactions Electronic transactions
General merchandise retail industry
Executive Summary
Retail is an important source of employment and output growth in many countries. In Korea, retail accounts for about 8% of total employment, growing at a rate of 5% over the past 10 years. As in all developed countries, Korea’s retail industry is evolving to more productive formats – from family-operated “mom & pops” to highly efficient discount stores and specialty chains – to better meet increasingly selective customer needs. However, this move has been slow, and most outlets are smaller and less advanced than might be expected for an economy of Korea’s size. Given that capital investments in Korean retail have been very limited compared to other industries, this lack of development is not surprising. Overall, Korea shows only 32%1 of the US labor productivity in retail.
¶ Unfavorable mix of retail formats. In Korea, employment is highly concentrated in mom & pops, which account for 71% of the total employment. In contrast, US retail employment is predominantly in higher-productivity outlets. About 81% of US employment comes from specialty, discount, and department stores (all of which are at least three times more productive than mom & pops).
¶ Restrictive product market regulations. In addition to a scarcity of land in Korea, restrictive zoning and land development laws reduce the use of land and its availability. Only 0.2% of the total country is completely free of regulation for building mega-size, highly productive retail formats like shopping malls – which limits the emergence of advanced retail formats.
¶ FDI regulations. Although the government removed most of the regulations imposing FDI ceilings in 1996, prior to that, FDI was restricted and currently, FDI in department stores and shopping malls remains prohibited. Furthermore, the complicated and time-consuming application process for entering the Korean market acts as an indirect barrier to foreign investment. This prevents exposure to best practice which can be vital to retail development.
The retail sector has significant potential to boost its output, employment, and
1 As of 1993, the latest year for which data was available.

productivity. In order for Korean retail to fulfill its improvement potential, the government needs to remove counter-productive barriers in the product market. First, deregulation of current zoning laws will encourage the development of large, productive, high-service formats that will generate more employment opportunities and raise productivity. Second, FDI in retail must be further facilitated to allow foreign retailers to more quickly enter the market.
2
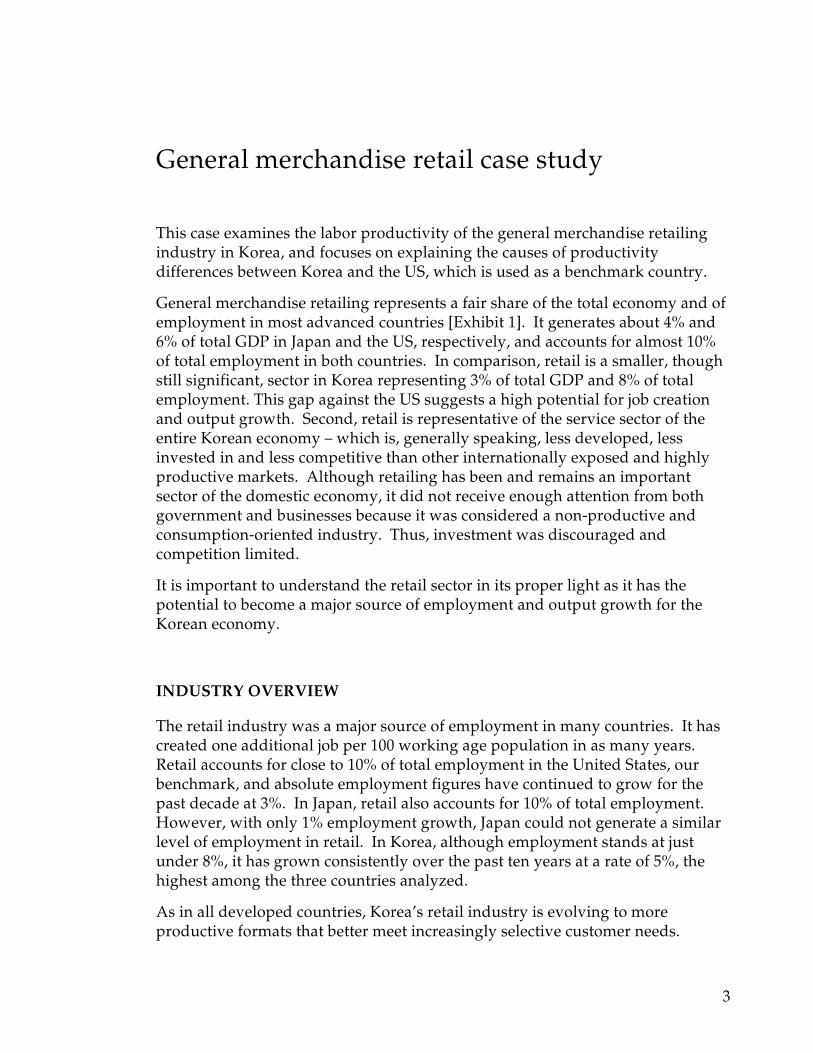
General merchandise retail case study
This case examines the labor productivity of the general merchandise retailing industry in Korea, and focuses on explaining the causes of productivity differences between Korea and the US, which is used as a benchmark country.
General merchandise retailing represents a fair share of the total economy and of employment in most advanced countries [Exhibit 1]. It generates about 4% and 6% of total GDP in Japan and the US, respectively, and accounts for almost 10% of total employment in both countries. In comparison, retail is a smaller, though still significant, sector in Korea representing 3% of total GDP and 8% of total employment. This gap against the US suggests a high potential for job creation and output growth. Second, retail is representative of the service sector of the entire Korean economy – which is, generally speaking, less developed, less invested in and less competitive than other internationally exposed and highly productive markets. Although retailing has been and remains an important sector of the domestic economy, it did not receive enough attention from both government and businesses because it was considered a non-productive and consumption-oriented industry. Thus, investment was discouraged and competition limited.
It is important to understand the retail sector in its proper light as it has the potential to become a major source of employment and output growth for the Korean economy.
INDUSTRY OVERVIEW
The retail industry was a major source of employment in many countries. It has created one additional job per 100 working age population in as many years. Retail accounts for close to 10% of total employment in the United States, our benchmark, and absolute employment figures have continued to grow for the past decade at 3%. In Japan, retail also accounts for 10% of total employment. However, with only 1% employment growth, Japan could not generate a similar level of employment in retail. In Korea, although employment stands at just under 8%, it has grown consistently over the past ten years at a rate of 5%, the highest among the three countries analyzed.
As in all developed countries, Korea’s retail industry is evolving to more productive formats that better meet increasingly selective customer needs.
3
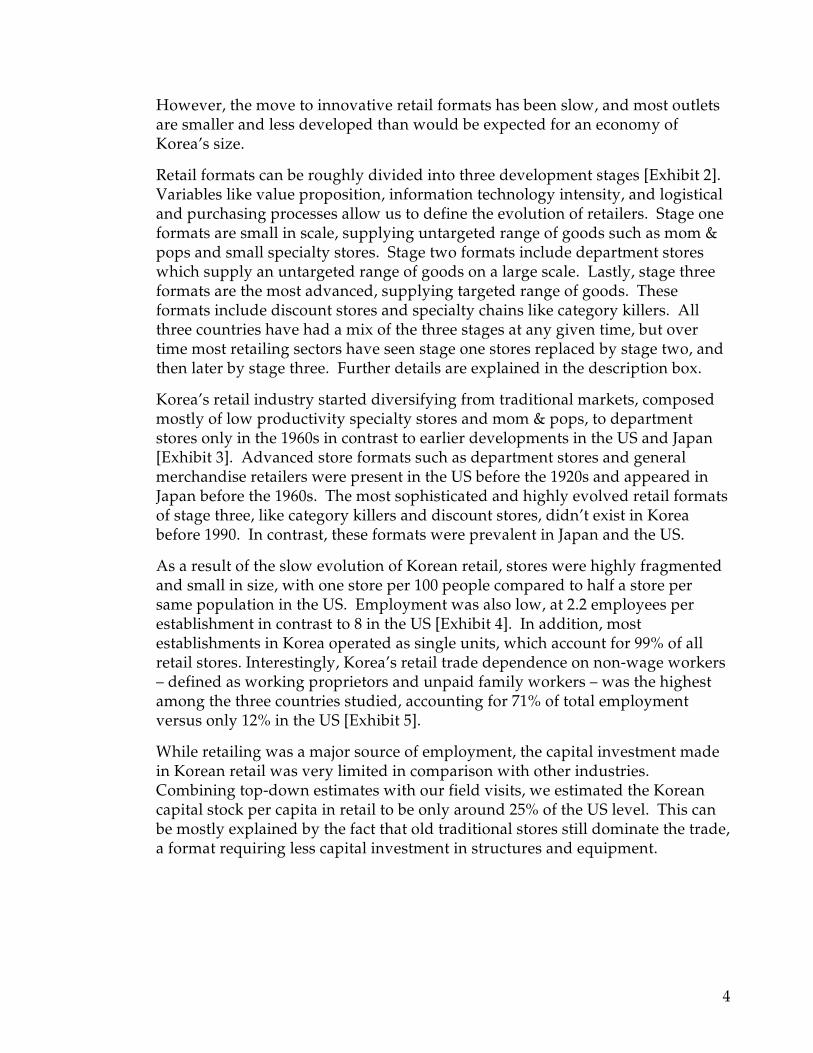
However, the move to innovative retail formats has been slow, and most outlets are smaller and less developed than would be expected for an economy of Korea’s size.
Retail formats can be roughly divided into three development stages [Exhibit 2]. Variables like value proposition, information technology intensity, and logistical and purchasing processes allow us to define the evolution of retailers. Stage one formats are small in scale, supplying untargeted range of goods such as mom & pops and small specialty stores. Stage two formats include department stores which supply an untargeted range of goods on a large scale. Lastly, stage three formats are the most advanced, supplying targeted range of goods. These formats include discount stores and specialty chains like category killers. All three countries have had a mix of the three stages at any given time, but over time most retailing sectors have seen stage one stores replaced by stage two, and then later by stage three. Further details are explained in the description box.
Korea’s retail industry started diversifying from traditional markets, composed mostly of low productivity specialty stores and mom & pops, to department stores only in the 1960s in contrast to earlier developments in the US and Japan [Exhibit 3]. Advanced store formats such as department stores and general merchandise retailers were present in the US before the 1920s and appeared in Japan before the 1960s. The most sophisticated and highly evolved retail formats of stage three, like category killers and discount stores, didn’t exist in Korea before 1990. In contrast, these formats were prevalent in Japan and the US.
As a result of the slow evolution of Korean retail, stores were highly fragmented and small in size, with one store per 100 people compared to half a store per same population in the US. Employment was also low, at 2.2 employees per establishment in contrast to 8 in the US [Exhibit 4]. In addition, most establishments in Korea operated as single units, which account for 99% of all retail stores. Interestingly, Korea’s retail trade dependence on non-wage workers – defined as working proprietors and unpaid family workers – was the highest among the three countries studied, accounting for 71% of total employment versus only 12% in the US [Exhibit 5].
While retailing was a major source of employment, the capital investment made in Korean retail was very limited in comparison with other industries. Combining top-down estimates with our field visits, we estimated the Korean capital stock per capita in retail to be only around 25% of the US level. This can be mostly explained by the fact that old traditional stores still dominate the trade, a format requiring less capital investment in structures and equipment.
4
INDUSTRY DEFINITIONS
Our productivity analysis for this case was confined to non-food, or general merchandise, retail. This sub-sector accounts for more than half of total retail sales and employment in all three countries studied. Hereafter, retail will refer only to general merchandise retail [Exhibit 6].
The sector was also reclassified to negate cross-country variations and allow for apple to apple comparisons. Specifically, eating and drinking, gasoline service stations, and automotive dealers in the US; gasoline service stations in Japan; and personal and household goods repair in Korea were all excluded from our study [Exhibit 7].
5
RETAIL FORMAT DEVELOPMENT STAGES
Stage one These formats typically supply an untargeted range of goods to a variety of customers on a small scale. The most traditional stage one retailer is the mom & pop store – still the most popular format in Korea. In Korea, the majority of specialty stores, such as exclusive franchise operations, are also included in this category. The main value proposition of this early format is in convenience of location or the very lack of substitute formats.
Stage two These formats supply an untargeted range of goods on a large scale, benefiting from scale economies in logistics and increased bargaining power in procurement. Stage two formats include department stores as well as mass merchandisers such as the European hypermarket. These retailers emerged 30 to 40 years ago in the US and slightly later in Europe. The main value proposition of stage two is in the better combination of quality and price (e.g. mass merchandisers) offered.
Stage three These formats supply a targeted range of goods and customers on either a small or large scale. Stage three includes specialty chains and discounters. These advanced format retailers did not exist in Korea for the year studied. As a group, specialty chains offer higher customer value by providing the specific merchandise sought by a narrow target group. Discount stores provide value to the customer by focusing on efficiency and low prices. They are differentiated from mass merchandisers by their focus on only those products they can provide at “category killing” prices.
The relative productivity of the three stages is different. In terms of sales per employee, stores in modern stages are more productive as a group than those in more traditional stages.
FORMAT CATEGORIES
We selected four broadly defined formats as the basis for our productivity analysis of the non-food retail industry, which includes traditional mom & pop stores, department stores, discount stores, and specialty stores [Exhibit 8]. Together with the variables considered in our discussion on retail stage development, the number of employees per establishment as a proxy for store size allows us to classify groups of similar stores as one particular format for the purposes of analysis.
6
These formats are largely categorized into high service and low service formats depending on the variety and quality of the services provided to customers. Only specialty stores are included in both high- and low-service formats. Some small specialty stores provide high services such as home delivery. On the other hand, larger specialty stores may operate like discount stores and provide only limited service to customers.
High Service ¶ Department stores are high-service, high-price formats such as Lotte,
Shinsegae, and Hyundai in Korea which employ more than 50 employees per establishment.
¶ Small specialty stores, which normally employ more than five people but less than fifty, sell a specific type of product and provide high-service. Large franchise operations, such as electronics outlets, are included in this category.
¶ Mom & pops are small neighborhood stores that are often run by members of the immediate family and employ fewer than five people. Smaller franchise retailers, such as E-land outlets and stores in apartment complex commercial malls, are included in this category.
¶ Shopping malls often incorporate both department stores and small specialty stores. Shopping malls are highly prevalent in many advanced countries like the US while virtually nonexistent in Korea. In most cases, shopping malls occupy large land areas as they accommodate department stores, many small specialty stores, and require significant parking space. For example, in the US, many shopping malls occupy more than 100,000 m2 of land. We did not categorize shopping malls as a separate format in our productivity calculation as they are operated as a hybrid format.
Low Service ¶ Large specialty stores, which normally employ more than fifty people, sell
a specific type of product at a discount price. They include specialized chains and category killers like Toys ‘R Us, Home Depot, Circuit City, and The Gap in the US.
¶ Discount stores are low-service retail formats offering low prices and a wide variety of goods. They typically employ more than 50 people per establishment. Examples include Wal-mart, K-mart and Price Club.
7
METHODOLOGY
We compared retail performance in Korea with that of the US and Japan mainly in terms of labor and capital productivity.
Labor productivity Labor productivity was calculated by measuring value-added per labor hour, with value-added defined as gross margin. Lack of detailed data rendered the use of other measures, e.g., the sum of EBIT (operating profit), depreciation, rent and wages, inappropriate for cross-country comparisons. One weakness of this rather broad measure, however, is that value-added can run the risk of being exaggerated because of purchased services which are included in the accounting figures. However, given that the methodology applied is the same across countries, it allows for accurate comparison of productivity levels, the basis of our analysis [Exhibit 9].
Also, due to data unavailability, productivity for each country was calculated using different base years – Korea 1993, US 1992, and Japan 1994.
Capital productivity Capital productivity seeks to measure retail industry value-added per capital input. Due to data availability, we estimated retail capital productivity by using a wider industry category, trade (including retail, wholesale, hotels and restaurants). Trade output is measured with value added converted to common currency using consumption PPP. Capital service estimates are constructed from past investment flows using Perpetual Inventory Method and average US service lives of 11 years for equipment and 35 years for structures. The capital service figures exclude the cost of land. Given the unavailability of investment data by detailed sectoral category, the capital productivity value has a higher margin of error than observed in the other sectors.
8
KOREA’S PRODUCTIVITY PERFORMANCE
Korea’s labor productivity in retail in 1993 was only 32% of the US level (labor is the dominant input factor in this industry) [Exhibit 10]. Value-added per employee remained low at 42%, despite the longer working hours in Korea. Fewer sales per employee and lower value-added per sales contributed to the poor performance. Korea’s labor productivity performance was also below Japan’s, though not as significantly, given Japan’s similarly low value-added per employee at 52% of the US benchmark.
Korea’s capital productivity was estimated to be about 150% of the US level. This higher capital productivity was driven by lack of investment rather than efficient capital utilization (the mechanical effect of a lower denominator).
1993 productivity percentage vs. US benchmark
Country
Labor
Capital (rough estimate)
Korea 32 150
Japan 54 n/a
The key drivers causing the productivity differences between Korea and the benchmark are summarized in Exhibit 11. They can be categorized into three groups: production process, industry dynamics, and external factors. The key causes for productivity gap are not being broken down into labor and capital in the exhibit as most of the gap in capital productivity is captured in the format mix.
Production Process
At the company level, the critical causes of low productivity in Korean retail versus the benchmark are format mix and scale. Poor organization of functions and tasks also contribute to the productivity gap.
Retail Format Mix Most of Korea’s productivity gap with the US can be explained by the unfavorable mix of retail formats [Exhibit 12]. In Korea, employment is highly concentrated in mom & pops which account for 71% of total employment [Exhibit 13]. This format has significantly lower productivity than specialty or department stores. In contrast, US retail employment is predominantly in higher-productivity outlets. About 81% of the employment in the US comes from specialty, discount, and department stores which are at least three times
9
more productive than mom & pops. Larger, more advanced formats benefit primarily from economies of scale that traditional formats cannot achieve. Furthermore, the more targeted value proposition of advanced formats allows for higher value added through higher prices or lower costs.
Organization of Functions and Tasks The remaining productivity gap of Korea vs. the US can be explained by poor organization of functions and tasks [Exhibits 12 and 13]. Korea’s department stores are only approximately 60% as productive as US department stores and specialty stores are only 35% as productive as US specialty stores.1 Some of the gap in specialty store productivity may be explained by format mix within categories. Specifically, there is a mix issue because Korean specialty stores were in stage one while US specialty stores were in stage three, with formats such as category killers which are highly productive. Nonetheless, poor organization of functions and tasks was found to be an additional cause of the gap, as shown, for example, in poor service quality despite high staffing levels, ineffective use of POS information, and long store operating hours. Furthermore, merchandising skills were not best practices, as seen, for example, in the lack of category management skills which are common among US retailers.
Scale and Technology Contrary to conventional wisdom, scale was not a key cause of the productivity gap. Certainly, Korea’s small, less advanced stores suffer scale disadvantages versus larger stores. However, within formats, Korean stores are as large as the US stores, and therefore, format mix is seen to be the key cause of the gap. Conventional wisdom also says that low technology is a cause of low productivity in retail. However, in larger advanced stores in Korea, POS and other modern information systems are used, similar to those used in the US Smaller mom & pop stores do not make use of such systems, as they are not economical. Therefore, again, format mix is the key cause of low technology level.
Capital intensity The capital intensity of Korea’s retail industry is estimated to be very low at only 23% of the US level due to the historically limited capital investments made. Lack of proper investment in Korean retail in the past is consistent with today’s limited number of modern formats. The latter often requires more investment in structure and equipment than more traditional formats.
Industry Dynamics
Competition within Korea’s retail industry has been severely lacking until very
1 A productivity comparison for discount stores is not included as there were no discount stores in Korea during the year of our study.
10
recently. In the United States, development of new retail formats forced older, more unproductive, retailers out of business. Such competition among different formats has been limited in Korea because there has been no significant evolution to higher-stage retailing.
Furthermore, retail trade remained almost exclusively a domestically-owned and operated industry during the period studied. Therefore, exposure to best practice was minimal, limiting Korea’s ability to improve management practices through knowledge transfers.
External Causal Factors
The most important factors contributing to the productivity gap between the US and Korea were explicit and implicit product market barriers which limited foreign direct investment and land use.
FDI barriers The exposure to best practice that would have stimulated the development of advanced retail formats was limited by government-imposed FDI ceilings. All the deregulation steps the government had taken during the 1980s and early 1990s were not significant enough to allow entry of more advanced retail formats. Basically, the government imposed extremely restrictive regulations on FDI until early 1990s.
Prior to 1984, only retailers under 200m2 in size and selling only one type of product were allowed to enter Korea. In 1984, the government took a small step to ease the regulation by allowing the selling of multiple product types and raising shop size to 700m2. In 1988, authorities announced their master plan to deregulate the retail industry in three steps. Based upon this plan, restrictions were eased to allow foreign investment in up to ten stores below 1,000m2 per lot size in 1991. Under this regulatory environment, only small specialty stores and mom & pops were allowed to operate. While the government eventually took a second deregulatory step to allow store sizes of up to 3,000m2 in 1993, the size was not large enough to accommodate even discount stores, generally considered the smallest of the larger formats.
Such lack of FDI in retailing limited local retail exposure to skill sets necessary for running advanced formats. This, in turn, contributed to the limited emergence of advanced formats in Korea. Moreover, domestic competition was highly restricted because the retail market was closed to foreign best practices.
Product market regulations (Zoning regulations) Zoning regulations, which restrict land available, particularly for large retail formats, limited the emergence of large, productive retail formats in Korea. Land space in Korea is scarce, and intricate zoning and land development laws govern both the availability of land and its use [Exhibits 14 and 15]. The original stated objectives of these zoning laws were to conserve the natural environment, control
11
excessive density, and balance the country’s property development. In retail, four zoning regulations defined the allowed area, size, and type of retail store for each zone in Korea. The National Land Usage Management Act prohibited large format stores (over 1,000m2) from operating in any area outside the urban zone until 1993. The Urban Planning Act and the Construction Act again restricted the commercial area which could be used for retail formats over 1,000m2 in size. In conclusion, only 0.2% of the total country was completely free of regulation for building large-size retail formats. Known as urban commercial areas, this zone is conveniently located to generate very high sales traffic. Unfortunately, available locations are often occupied by retailers or office buildings or too small to accommodate most stage two and three stores.
Retailers could consider re-developing these attractive commercial locations in urban areas, essentially by buying smaller buildings, tearing them down, and building a large store. However, many retailers pointed out that re-developing existing retail stores was a cumbersome option because of the long, complex negotiation process required to get agreement from multiple owners.
Other product market regulations A host of related regulations, such as restrictions on chaebol activity in retail and the arduous, bureaucratic store-opening evaluation process, contributed to Korea’s low productivity. These regulations were established with the objectives of protecting small mom & pop stores, discouraging consumption, and promoting more investment in manufacturing industries. To reduce chaebol ownership of non-operational real estate, banks were advised against extending loans for the purchase of real estate and land development. As a result, chaebols were not able to easily acquire and own strategic locations for the future retail operation. The cumbersome process through which retailers acquire the license to open large stores was also an important barrier. For formats defined as equal to or larger than 1,000m2, an approval from the relevant local government advisory board was required. Board members, who often have strong ties to existing local retailers, have the discretion either to block new openings or restrict the store’s business hours and/or operating days. Such regulations limited investment and competition levels in Korean retail, contributing to lower productivity.
Factor price2 Conventional wisdom was that the high land price lowered retailer profitability substantially and was a major cause of failure to develop larger formats. Our findings differed, for the most part, from conventional wisdom. First, using a department store example, we estimated that stores in Korea generated three to five times more sales per square meter than the US department stores which certainly helps to compensate for the significantly higher land cost [Exhibit 16]. Second, as seen in the example of a discount store [Exhibit 17], land cost did
2 Land is a factor not included in our capital productivity calculation.
12
lower ROIC (vs. US discount stores), though only below the cost of capital if built in urban areas. Thus at least outside urban areas, discount stores were an economically viable format, and the high land cost alone could not explain their underdevelopment.
CHALLENGES AND IMPLICATIONS
Going forward, the challenge for Korean retail lies in how quickly the government can allow more rapid development of the industry through format evolution. However, before we proceed to a discussion on the bold actions required to improve productivity, we need to review recent trends which have somewhat changed the competitive landscape of the retail industry since 1993, the year on which our conclusions are based.
Recent Developments
FDI regulation By 1996, Korea’s retail market was close to being fully deregulated for FDI [Exhibit 18]. In 1996, the government eliminated most of the FDI restrictions on size and number of retail stores a foreign company could open (although size was still restricted by the zoning laws described below). As anticipated, foreign retailers new to the market helped accelerate the evolution of the industry – discount formats like Carrefour and Makro appeared in 1996. According to current projections by discount retailers, the number of stores is expected to increase from 44 in 1996 to 150 by the year 20003 . Many other global players such as Wal-mart, K-mart, and Toys ‘R Us are now considering the attractiveness of entering the Korean market.
While the government tried to remove FDI restrictions on number and size, foreign direct investment in department stores and shopping malls is still prohibited, with the objective of protecting one of Korea’s most developed retail formats (department stores). As a result, current FDI regulations encourage exposure to best practice only for low-service formats like discount stores. This deregulation structure could lead to unemployment, as it promotes only low service formats. Low service formats employ fewer people than department stores and shopping malls. If low service formats grow and capture share away from mom & pops, total retail employment would decline.
Despite this legal deregulation, many other implicit barriers to FDI still exist. Bureaucracy is one. For example, the complicated and time-consuming application process acts as an indirect barrier to FDI. It can take more than 700
3 Source: Maeil Business Newspaper, Retail Industry Evolution,” November 14, 1997.
13
days to prepare, file and get approval from the government to operate large-size retail shops in Korea. This registration and approval process applies to both domestic and foreign retailers. However, it is more cumbersome to foreigners considering their lack of knowledge of the local regulatory environment which is often not transparent.
Zoning regulation The Korean government has recently taken steps to deregulate additional zones to allow larger retail formats. In 1993, the quasi-agricultural and forest areas which surround Korea’s major cities were redefined to allow retail stores which occupy less than 30,000m2 in land to be built. Previously, this zone, which occupies 27.3 percent of total land, had been restricted for the operation of retail stores. The permissible lot size, however, is still not large enough to accommodate modern, high-service retailers like shopping malls which often occupy more than 30,000m2 [Exhibit 19].
A second deregulation measure was taken in 1996 to allow large discount retailers, under 10,000m2 in land size, to do business in what is known as the green area, a large portion of which are in urban districts. Green areas account for a little more than 10% of total land. Again, the building of high-service formats like shopping malls remained prohibited because only discount type operations were permitted in the area. The objective was to promote discount formats. The government objective in promoting discount formats was to drive retail prices down by bringing about price competition in the industry.
In January 1998, authorities again announced their plan to eliminate requirements and definitions governing retail formats. By doing so, the government indirectly gave its consent to non-discount store formats, heretofore prohibited, operating in green areas. Unfortunately, due to the limitations posed by size (under 10,000m2), shopping malls still cannot be built.
As discussed above, the government has addressed and removed many counter productive regulations. However, the government still needs to address key regulatory issues which prohibit mega-size retailers like shopping malls from evolving as well as implicit barriers to efficient entry and operation for both foreign and Korean retailers. Without the evolution to such large formats, Korea will not be able to achieve productivity improvements and increased employment.
Based on our assessment of Korea’s relative performance in retail, we believe that this sector has significant potential to boost its output, employment, and productivity. In order for the Korean retail industry to fulfill its improvement potential, it needs to consider lowering or removing counter-productive barriers in the product market.
14
Government
Deregulating present zoning laws will encourage the development of large, high-service formats that will generate more employment to offset the projected increase in labor productivity. Based on our top-down estimate, the total amount of land required to raise productivity up to 69% of the US level is only 6.5 km2, which is 0.007% of total land, 0.024% of the quasi-agriculture & forest and urban green area combined, or about 4% of the existing commercial areas. While additional land would be needed for associated infrastructure, the amount of total land required will still be small. The resulting evolution to large formats, especially shopping malls, would create more employment.
In addition, FDI in retail must be facilitated to allow foreign retailers to more quickly enter the market. Current restrictions on high-service formats impede adoption of global best practices thus limiting domestic competition and sources of higher employment. Moreover, it is critical that the complex application process for opening and operating large-size retail stores be simplified to encourage foreign entry and more efficient domestic operations.
Industry
Korean retailers will face severe competition from the evolution to advanced retail formats and the entry of foreign best practice retailers. Allowing the growth of such a competitive environment, with no counter-productive barriers, is the quickest way for domestic retailers to improve their performance level. At the same time, retailers need to take active steps to survive this critical transitional phase.
First, Korean retailers must be proactive in importing best management practices and in developing unique skills in retailing such as merchandising, category management, global sourcing, and logistics. Joint venture operations with world-class players can be considered a viable option for quick skill-building.
Second, it is very important to have a differentiated and focused value proposition relative to competitors. As is observed in many advanced countries, stage three retail formats which dominate the markets are highly defined in terms of their value proposition. Unclear value promotion relative to competitors or other formats may result in poor economic performance – for example, high service formats offering low prices.
Third, retailers should continue making appropriate evaluations on capital investments to move into more advanced formats. This will be critical for survival, as the existing less developed stores will be threatened by new, advanced formats.
The importance of the retail sector to the national economy is often underestimated. Yet it accounts for almost 8% of total employment and has the
15

potential to provide jobs for many more. Achieving this potential will require drastic measures in product market regulations. Laborious though they may be, such changes will be critical to improve Korea’s standard of living. A large, competitive retail industry will benefit the manufacturing sector by providing opportunities for increased output and improved productivity through retailer price pressure. It will also provide high quality employment opportunities.
16
Double Deflated Labor Productivity
Appendix 1
The productivity calculation used for our primary comparison adjusted the gross margin using consumption PPP in calculating value-added. Thus, using such measures, labor productivity was 32% of the US level. However, as part of our research, we also calculated labor productivity adjusting both price by consumption PPP as well as cost of goods sold by consumer goods input PPP (referred to herein as “double deflation”). Using this methodology, labor productivity was 53% of the US level [Exhibit 20].
The rationale for the double deflation calculation was that there may be structural differences in Korea’s retail market which lead to lower gross margin. Korea’s aggregate gross margin percentage of sales is 29% versus 35% in the US. If this difference is due to structural differences between the two markets, an adjustment should be made in order to accurately analyze physical productivity of the industry.
Double deflation was calculated as follows. Won-denominated cost of goods sold was converted to dollar-denominated cost of goods sold using consumer goods input PPP. This number was then subtracted from sales adjusted by consumption PPP to arrive at the double deflated gross margin (used as a proxy for value added in this case study).
We decided not to base our analysis on this double deflated productivity calculation, however. Essentially, gross margin could be lower for two reasons. One reason is the structural differences described above (which might include, for example, a complex distribution system or high manufacturer dominance in Korea). Again, such structural differences need to be adjusted for to accurately calculated productivity. The second reason could be that Korean retailers offer lower service and quality than the US retailers. Thus, lower gross margin would simply be the result of the inability of retailers to charge more, as their service and quality of goods is lower. If lower service and quality explain the lower gross margin, an adjustment should not be made in calculating productivity – in fact, in measuring the performance differences between the two countries, such differences are important to capture.
Based on our study of the retail industry structure in the US and Korea, we determined that there were no significant structural differences that would lead to lower gross margin differences. We did find however, through extensive retail store visits in both countries, that service and quality of merchandise was
17
18
lower in Korea. Therefore, we determined that the double deflation calculation did not provide an accurate comparison of Korea’s productivity versus the US.
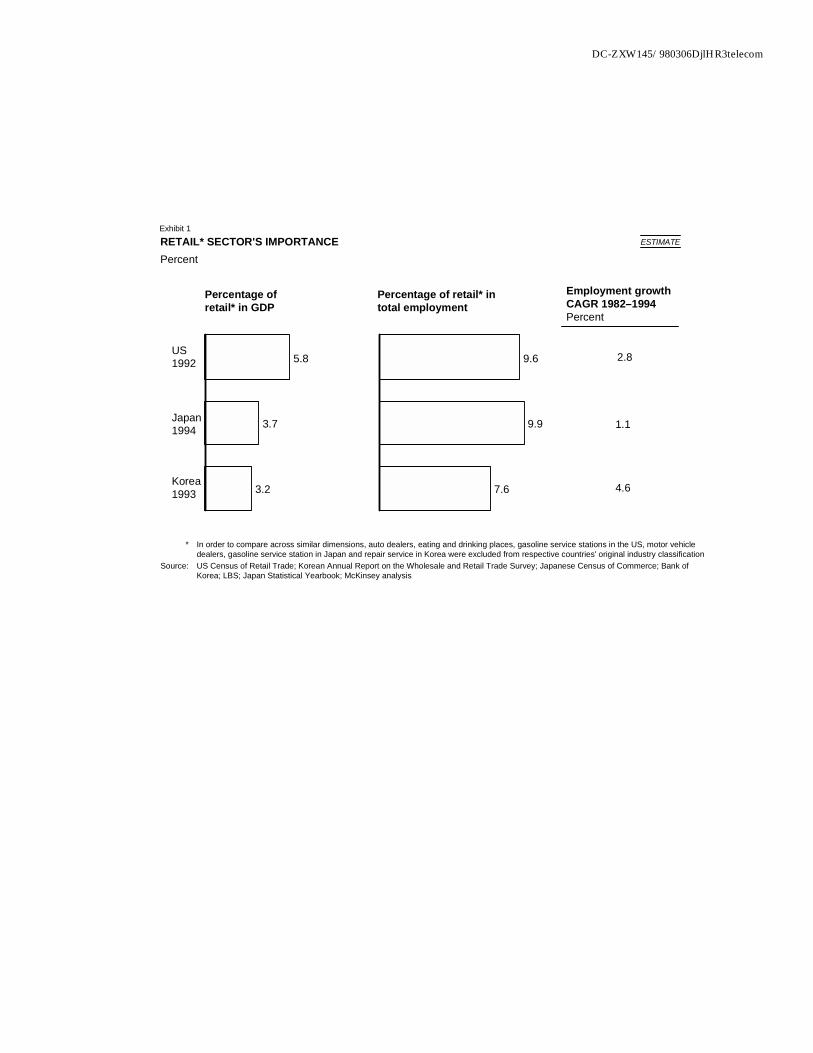
DC-ZXW145/980306DjlHR3telecom
5.8
3.7
3.2
US1992
Japan1994
Korea1993
9.6
9.9
7.6
Percentage ofretail* in GDP
Percentage of retail* intotal employment
RETAIL* SECTOR'S IMPORTANCEPercent
* In order to compare across similar dimensions, auto dealers, eating and drinking places, gasoline service stations in the US, motor vehicledealers, gasoline service station in Japan and repair service in Korea were excluded from respective countries' original industry classification
Source: US Census of Retail Trade; Korean Annual Report on the Wholesale and Retail Trade Survey; Japanese Census of Commerce; Bank ofKorea; LBS; Japan Statistical Yearbook; McKinsey analysis
Employment growthCAGR 1982–1994Percent
2.8
1.1
4.6
Exhibit 1ESTIMATE
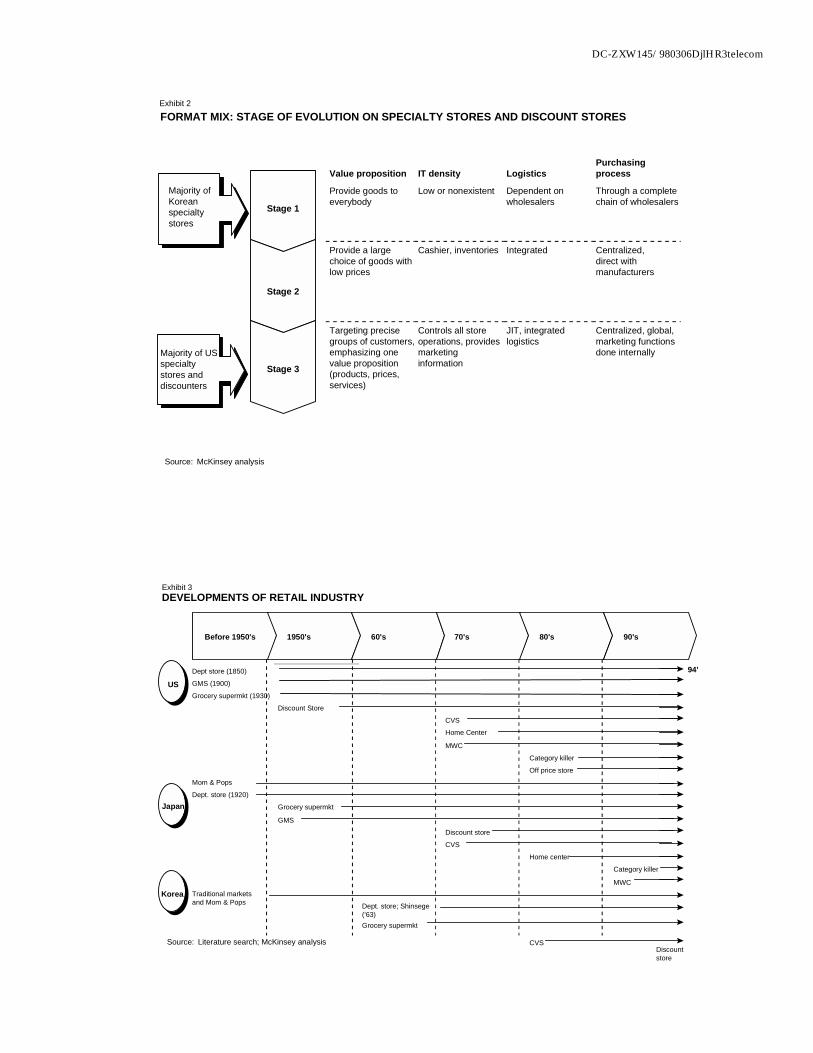
DC-ZXW145/980306DjlHR3telecom
Source: McKinsey analysis
Stage 3
Stage 2
Stage 1
Value proposition IT density LogisticsPurchasingprocess
Provide goods toeverybody
Low or nonexistent Dependent onwholesalers
Through a completechain of wholesalers
Provide a largechoice of goods withlow prices
Cashier, inventories Integrated Centralized,direct withmanufacturers
Targeting precisegroups of customers,emphasizing onevalue proposition(products, prices,services)
Controls all storeoperations, providesmarketinginformation
JIT, integratedlogistics
Centralized, global,marketing functionsdone internally
Majority ofKoreanspecialtystores
Majority of USspecialtystores anddiscounters
FORMAT MIX: STAGE OF EVOLUTION ON SPECIALTY STORES AND DISCOUNT STORESExhibit 2
Dept store (1850)
GMS (1900)
Grocery supermkt (1930)
Discount Store
CVS
Home Center
MWC
Category killer
Off price store
Mom & Pops
Dept. store (1920)
Grocery supermkt
GMS
Discount store
CVS
Home center
Category killer
MWCTraditional marketsand Mom & Pops Dept. store; Shinsege
('63)Grocery supermkt
CVS
DEVELOPMENTS OF RETAIL INDUSTRY
Before 1950's 1950's 60's 70's 80's 90's
US
Japan
Korea
Discountstore
94'
Source: Literature search; McKinsey analysis
Exhibit 3
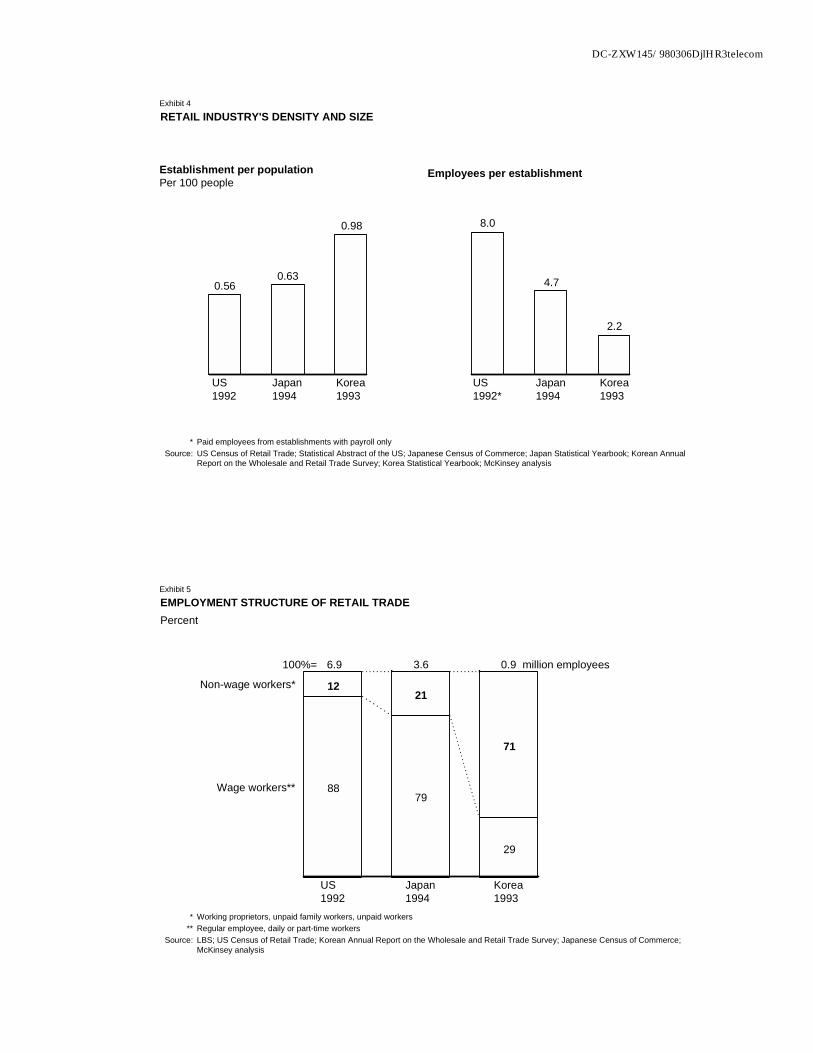
DC-ZXW145/980306DjlHR3telecom
0.560.63
0.98
US1992
Japan1994
Korea1993
Establishment per populationPer 100 people
8.0
4.7
2.2
US1992*
Japan1994
Korea1993
Employees per establishment
RETAIL INDUSTRY'S DENSITY AND SIZE
* Paid employees from establishments with payroll onlySource: US Census of Retail Trade; Statistical Abstract of the US; Japanese Census of Commerce; Japan Statistical Yearbook; Korean Annual
Report on the Wholesale and Retail Trade Survey; Korea Statistical Yearbook; McKinsey analysis
Exhibit 4
EMPLOYMENT STRUCTURE OF RETAIL TRADEPercent
* Working proprietors, unpaid family workers, unpaid workers** Regular employee, daily or part-time workers
Source: LBS; US Census of Retail Trade; Korean Annual Report on the Wholesale and Retail Trade Survey; Japanese Census of Commerce;McKinsey analysis
Non-wage workers* 1221
71
Wage workers** 8879
29
US1992
Japan1994
Korea1993
100%= 6.9 3.6 0.9 million employees
Exhibit 5
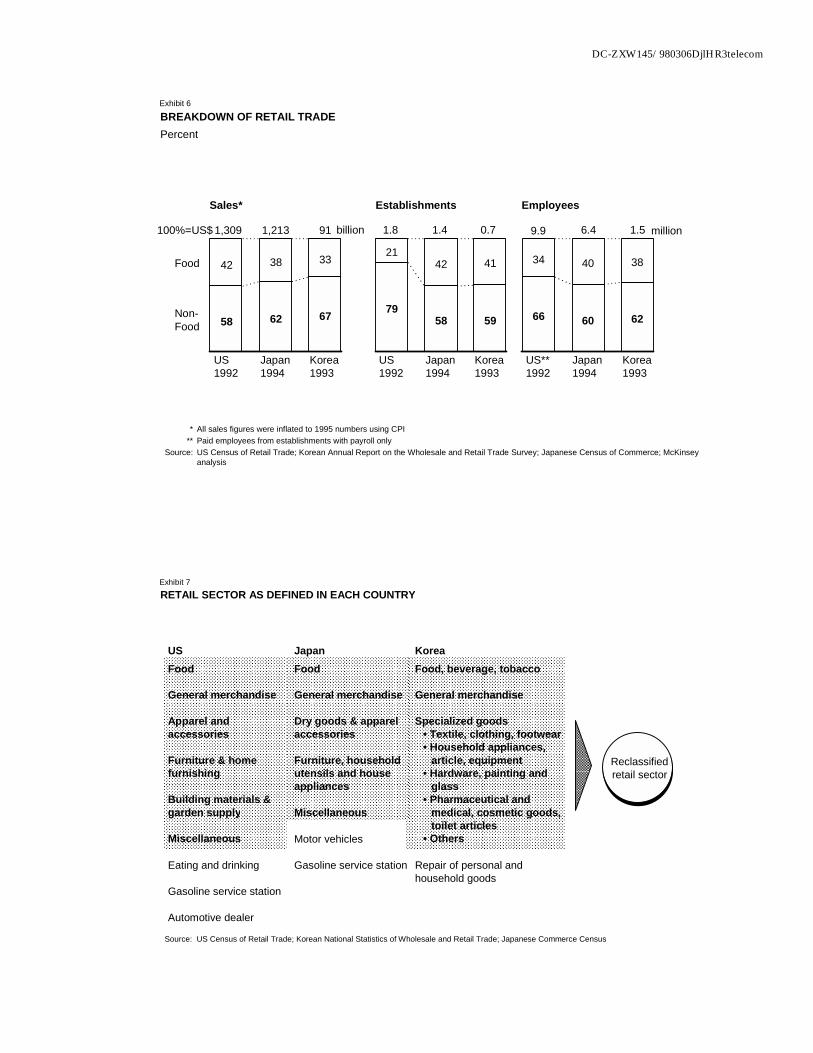
DC-ZXW145/980306DjlHR3telecom
100%=US$
BREAKDOWN OF RETAIL TRADEPercent
* All sales figures were inflated to 1995 numbers using CPI** Paid employees from establishments with payroll only
Source: US Census of Retail Trade; Korean Annual Report on the Wholesale and Retail Trade Survey; Japanese Census of Commerce; McKinseyanalysis
Food 42 38 33
Non-Food 58 62 67
US1992
Japan1994
Korea1993
Sales*
2142 41
7958 59
US1992
Japan1994
Korea1993
Establishments
34 40 38
66 60 62
US**1992
Japan1994
Korea1993
Employees
1.8 1.4 0.71,309 1,213 91 9.9 6.4 1.5 millionbillion
Exhibit 6
US Japan KoreaFood
General merchandise
Apparel andaccessories
Furniture & homefurnishing
Building materials &garden supply
Miscellaneous
Eating and drinking
Gasoline service station
Automotive dealer
Food
General merchandise
Dry goods & apparelaccessories
Furniture, householdutensils and houseappliances
Miscellaneous
Motor vehicles
Gasoline service station
Food, beverage, tobacco
General merchandise
Specialized goods• Textile, clothing, footwear• Household appliances,
article, equipment• Hardware, painting and
glass• Pharmaceutical and
medical, cosmetic goods,toilet articles
• Others
Repair of personal andhousehold goods
RETAIL SECTOR AS DEFINED IN EACH COUNTRY
Reclassifiedretail sector
Source: US Census of Retail Trade; Korean National Statistics of Wholesale and Retail Trade; Japanese Commerce Census
Exhibit 7
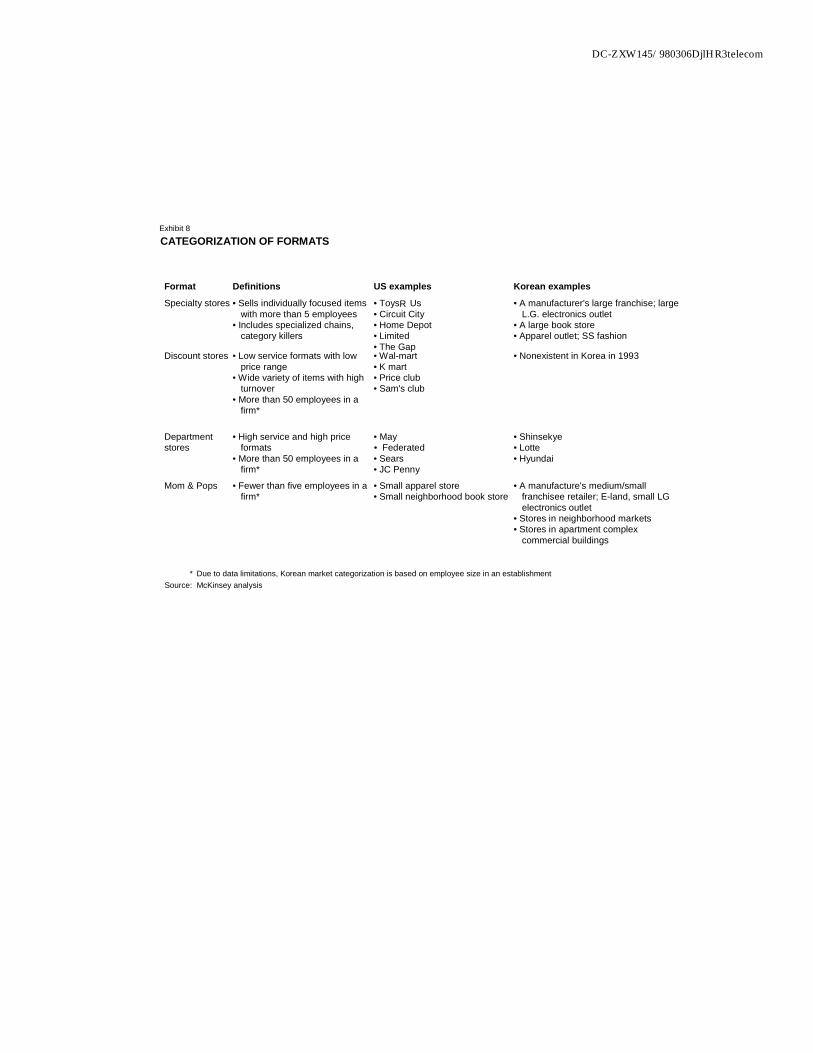
DC-ZXW145/980306DjlHR3telecom
CATEGORIZATION OF FORMATS
Format Definitions US examples Korean examples
Specialty stores • Sells individually focused itemswith more than 5 employees
• Includes specialized chains,category killers
• Toys Us• Circuit City• Home Depot• Limited• The Gap
• A manufacturer's large franchise; largeL.G. electronics outlet
• A large book store• Apparel outlet; SS fashion
Discount stores • Low service formats with lowprice range
• Wide variety of items with highturnover
• More than 50 employees in afirm*
• Wal-mart• K mart• Price club• Sam's club
• Nonexistent in Korea in 1993
Departmentstores
• High service and high priceformats
• More than 50 employees in afirm*
• May• Federated• Sears• JC Penny
• Shinsekye• Lotte• Hyundai
Mom & Pops • Fewer than five employees in afirm*
• Small apparel store• Small neighborhood book store
• A manufacture's medium/smallfranchisee retailer; E-land, small LGelectronics outlet
• Stores in neighborhood markets• Stores in apartment complex
commercial buildings
* Due to data limitations, Korean market categorization is based on employee size in an establishmentSource: McKinsey analysis
R
Exhibit 8
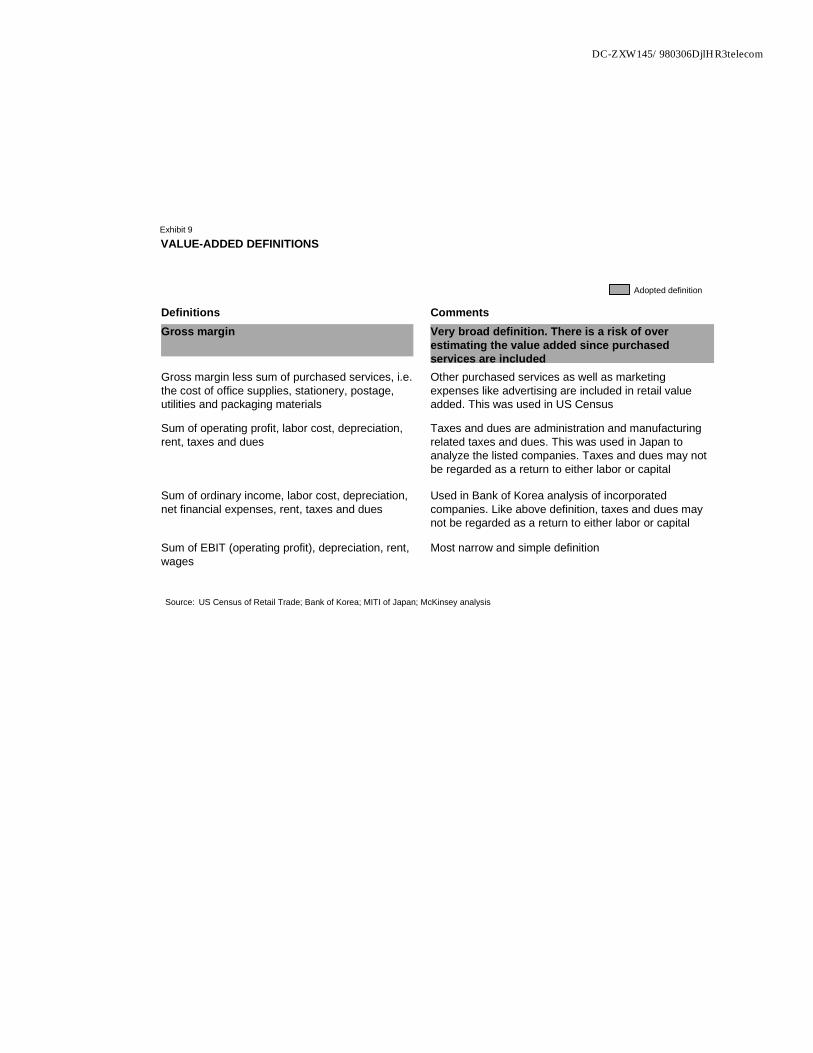
DC-ZXW145/980306DjlHR3telecom
VALUE-ADDED DEFINITIONS
Definitions CommentsGross margin Very broad definition. There is a risk of over
estimating the value added since purchasedservices are included
Gross margin less sum of purchased services, i.e.the cost of office supplies, stationery, postage,utilities and packaging materials
Other purchased services as well as marketingexpenses like advertising are included in retail valueadded. This was used in US Census
Sum of operating profit, labor cost, depreciation,rent, taxes and dues
Taxes and dues are administration and manufacturingrelated taxes and dues. This was used in Japan toanalyze the listed companies. Taxes and dues may notbe regarded as a return to either labor or capital
Sum of ordinary income, labor cost, depreciation,net financial expenses, rent, taxes and dues
Used in Bank of Korea analysis of incorporatedcompanies. Like above definition, taxes and dues maynot be regarded as a return to either labor or capital
Sum of EBIT (operating profit), depreciation, rent,wages
Most narrow and simple definition
Adopted definition
Source: US Census of Retail Trade; Bank of Korea; MITI of Japan; McKinsey analysis
Exhibit 9
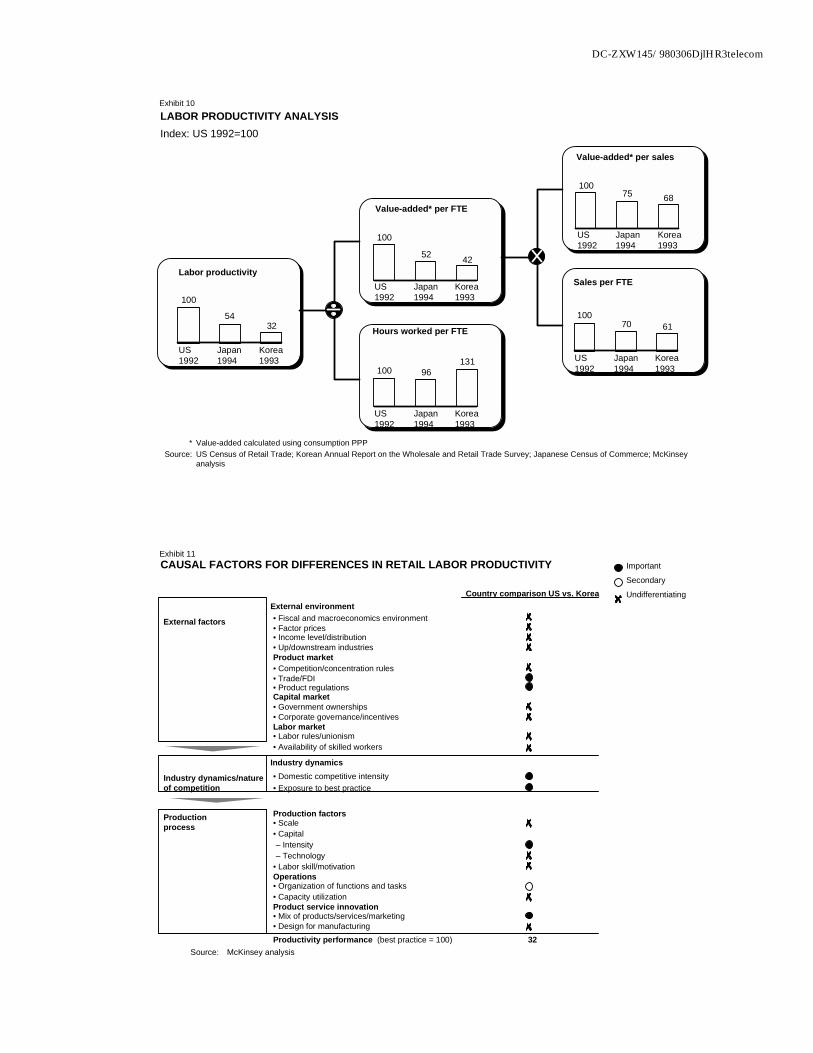
DC-ZXW145/980306DjlHR3telecom
* Value-added calculated using consumption PPPSource: US Census of Retail Trade; Korean Annual Report on the Wholesale and Retail Trade Survey; Japanese Census of Commerce; McKinsey
analysis
LABOR PRODUCTIVITY ANALYSISIndex: US 1992=100
Labor productivity
100
5432
US 1992
Japan1994
Korea1993
Value-added* per FTE
100
52 42
US1992
Japan1994
Korea1993
Hours worked per FTE
100 96131
US1992
Japan1994
Korea1993
Value-added* per sales
10075 68
US1992
Japan1994
Korea1993
Sales per FTE
10070 61
US1992
Japan1994
Korea1993
Exhibit 10
Source: McKinsey analysis
CAUSAL FACTORS FOR DIFFERENCES IN RETAIL LABOR PRODUCTIVITY
Country comparison US vs. KoreaExternal environment
External factors • Fiscal and macroeconomics environment• Factor prices• Income level/distribution• Up/downstream industriesProduct market• Competition/concentration rules• Trade/FDI• Product regulationsCapital market• Government ownerships• Corporate governance/incentivesLabor market• Labor rules/unionism• Availability of skilled workers
Industry dynamics
Industry dynamics/natureof competition
• Domestic competitive intensity• Exposure to best practice
Productionprocess
Production factors• Scale• Capital– Intensity– Technology
• Labor skill/motivationOperations• Organization of functions and tasks• Capacity utilizationProduct service innovation• Mix of products/services/marketing• Design for manufacturingProductivity performance (best practice = 100) 32
Important
Secondary
Undifferentiating
Exhibit 11
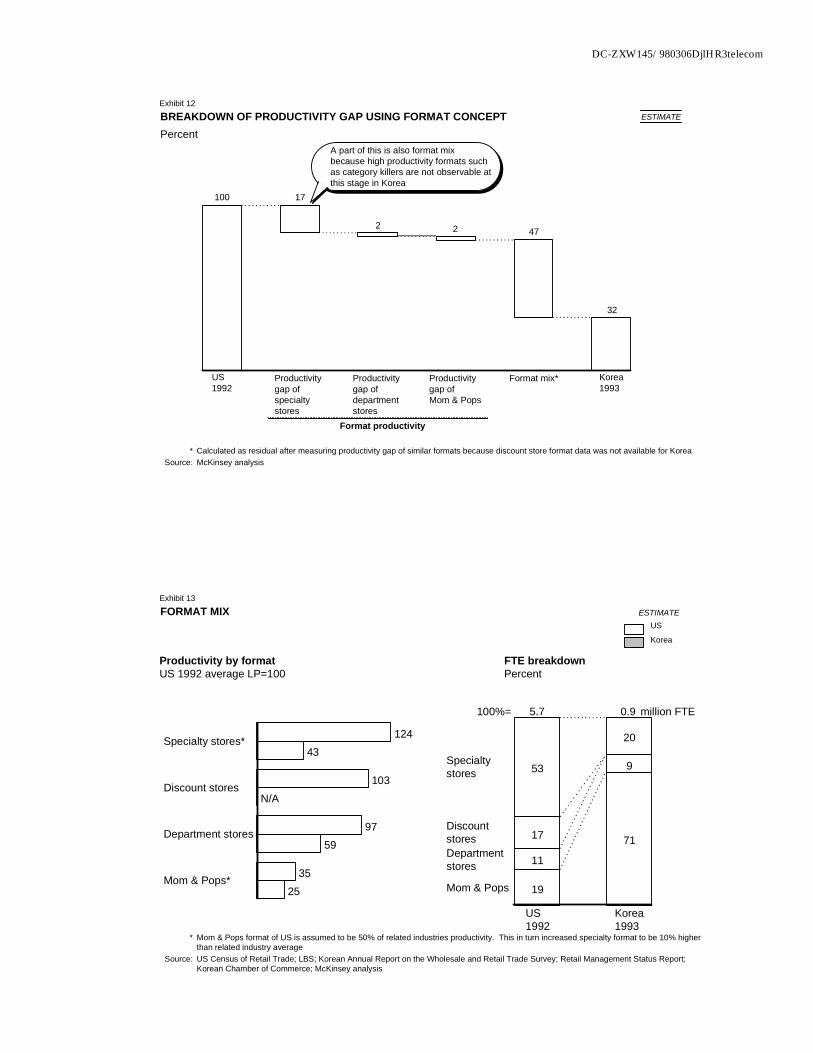
DC-ZXW145/980306DjlHR3telecom
* Calculated as residual after measuring productivity gap of similar formats because discount store format data was not available for KoreaSource: McKinsey analysis
100 17
2 2 47
32
US1992
Productivity gap of specialty stores
Productivity gap of department stores
Productivity gap of Mom & Pops
Format mix* Korea1993
Format productivity
BREAKDOWN OF PRODUCTIVITY GAP USING FORMAT CONCEPTPercent
A part of this is also format mixbecause high productivity formats suchas category killers are not observable atthis stage in Korea
Exhibit 12ESTIMATE
Specialtystores 53
20
Discountstores 17Departmentstores 11
9
Mom & Pops 19
71
US1992
Korea1993
FORMAT MIX
100%=
* Mom & Pops format of US is assumed to be 50% of related industries productivity. This in turn increased specialty format to be 10% higherthan related industry average
Source: US Census of Retail Trade; LBS; Korean Annual Report on the Wholesale and Retail Trade Survey; Retail Management Status Report;Korean Chamber of Commerce; McKinsey analysis
5.7 0.9 million FTE
43
N/A
59
25
124
103
97
35
Specialty stores*
Discount stores
Department stores
Mom & Pops*
Productivity by formatUS 1992 average LP=100
US
Korea
FTE breakdownPercent
ESTIMATE
Exhibit 13
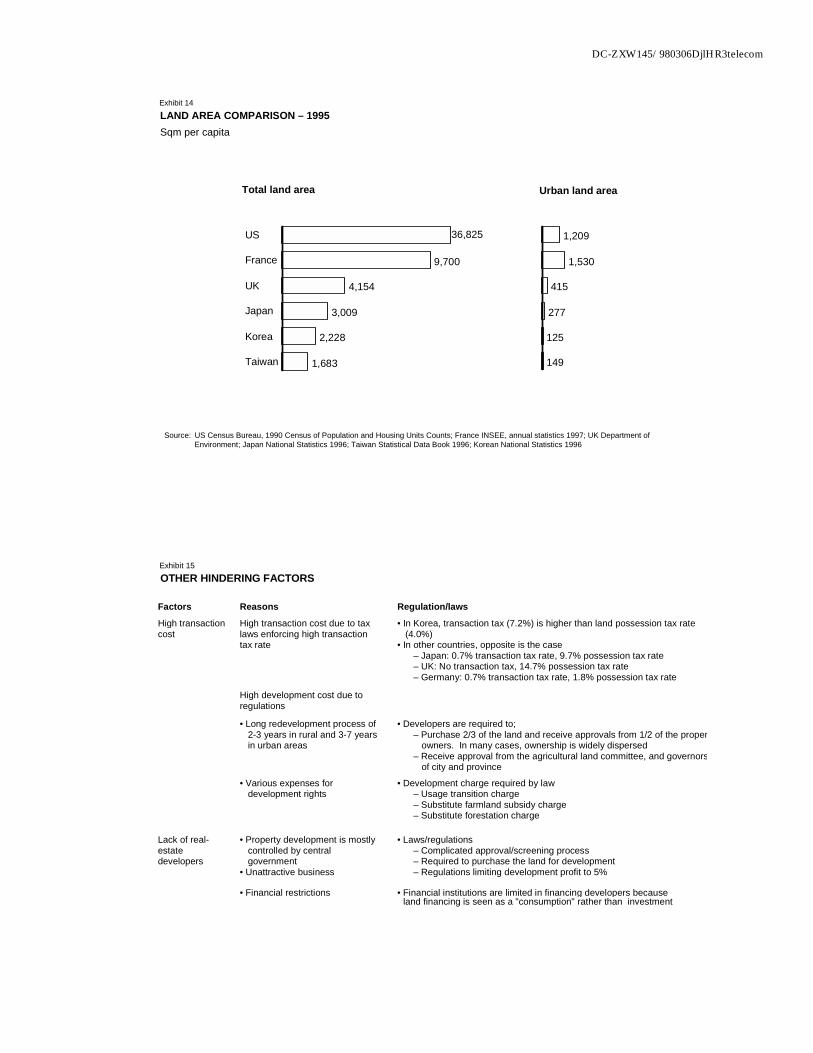
DC-ZXW145/980306DjlHR3telecom
LAND AREA COMPARISON – 1995Sqm per capita
16,000
9,700
4,154
3,009
2,228
1,683
US
France
UK
Japan
Korea
Taiwan
1,209
1,530
415
277
125
149
Total land area Urban land area
36,825
Source: US Census Bureau, 1990 Census of Population and Housing Units Counts; France INSEE, annual statistics 1997; UK Department ofEnvironment; Japan National Statistics 1996; Taiwan Statistical Data Book 1996; Korean National Statistics 1996
Exhibit 14
OTHER HINDERING FACTORS
Factors Reasons Regulation/laws
High transactioncost
High transaction cost due to taxlaws enforcing high transactiontax rate
• In Korea, transaction tax (7.2%) is higher than land possession tax rate(4.0%)
• In other countries, opposite is the case– Japan: 0.7% transaction tax rate, 9.7% possession tax rate– UK: No transaction tax, 14.7% possession tax rate– Germany: 0.7% transaction tax rate, 1.8% possession tax rate
High development cost due toregulations
• Long redevelopment process of2-3 years in rural and 3-7 yearsin urban areas
• Developers are required to;– Purchase 2/3 of the land and receive approvals from 1/2 of the proper
owners. In many cases, ownership is widely dispersed– Receive approval from the agricultural land committee, and governors
of city and province
• Various expenses fordevelopment rights
• Development charge required by law– Usage transition charge– Substitute farmland subsidy charge– Substitute forestation charge
Lack of real-estatedevelopers
• Property development is mostlycontrolled by centralgovernment
• Unattractive business
• Laws/regulations– Complicated approval/screening process– Required to purchase the land for development– Regulations limiting development profit to 5%
• Financial restrictions • Financial institutions are limited in financing developers becauseland financing is seen as a "consumption" rather than investment
Exhibit 15
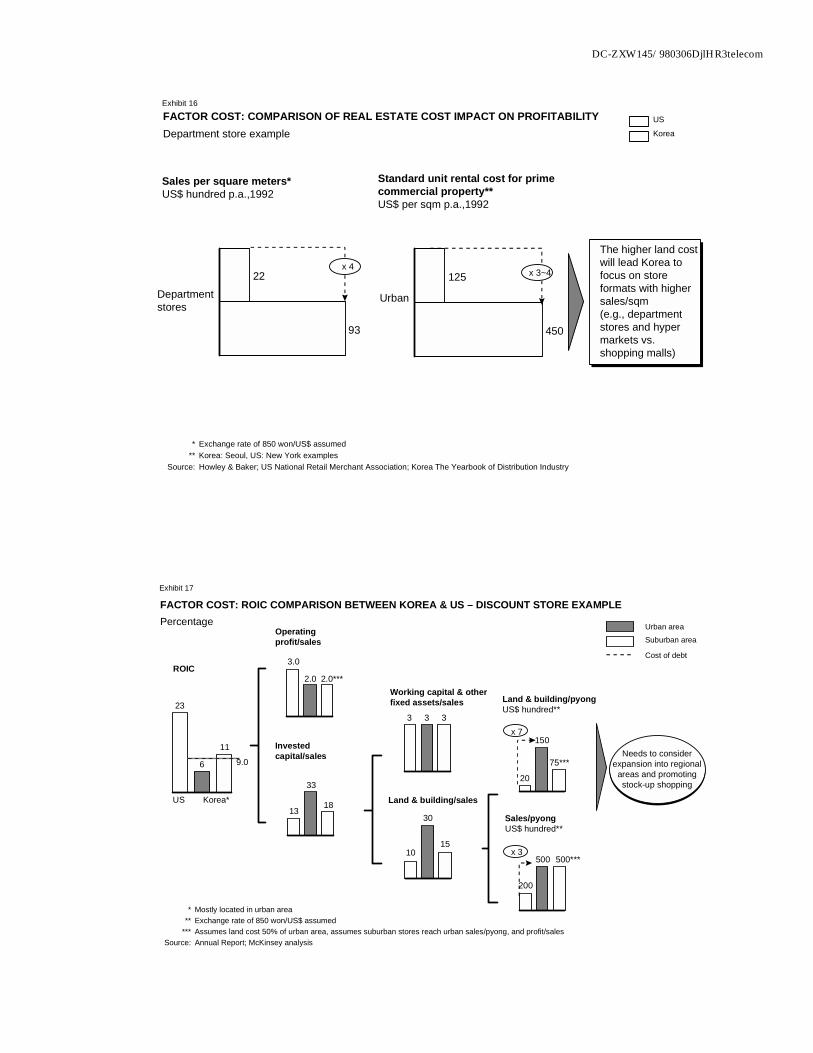
DC-ZXW145/980306DjlHR3telecom
FACTOR COST: COMPARISON OF REAL ESTATE COST IMPACT ON PROFITABILITYDepartment store example
* Exchange rate of 850 won/US$ assumed** Korea: Seoul, US: New York examples
Source: Howley & Baker; US National Retail Merchant Association; Korea The Yearbook of Distribution Industry
93
22Department stores
Sales per square meters*US$ hundred p.a.,1992
Standard unit rental cost for primecommercial property**US$ per sqm p.a.,1992
450
125
Urban
The higher land costwill lead Korea tofocus on storeformats with highersales/sqm(e.g., departmentstores and hypermarkets vs.shopping malls)
x 4x 3~4
US
Korea
Exhibit 16
FACTOR COST: ROIC COMPARISON BETWEEN KOREA & US – DISCOUNT STORE EXAMPLEPercentage
* Mostly located in urban area** Exchange rate of 850 won/US$ assumed
*** Assumes land cost 50% of urban area, assumes suburban stores reach urban sales/pyong, and profit/salesSource: Annual Report; McKinsey analysis
23
6
11
US Korea*
3.0
2.0 2.0***
13
33
18
3 3 3
10
30
15
20
150
75***
200
500 500***
Needs to considerexpansion into regional
areas and promotingstock-up shopping
ROIC
Operatingprofit/sales
Investedcapital/sales
Working capital & otherfixed assets/sales
Land & building/sales
Land & building/pyongUS$ hundred**
Sales/pyongUS$ hundred**
9.0
x 7
x 3
Cost of debt
Urban areaSuburban area
Exhibit 17
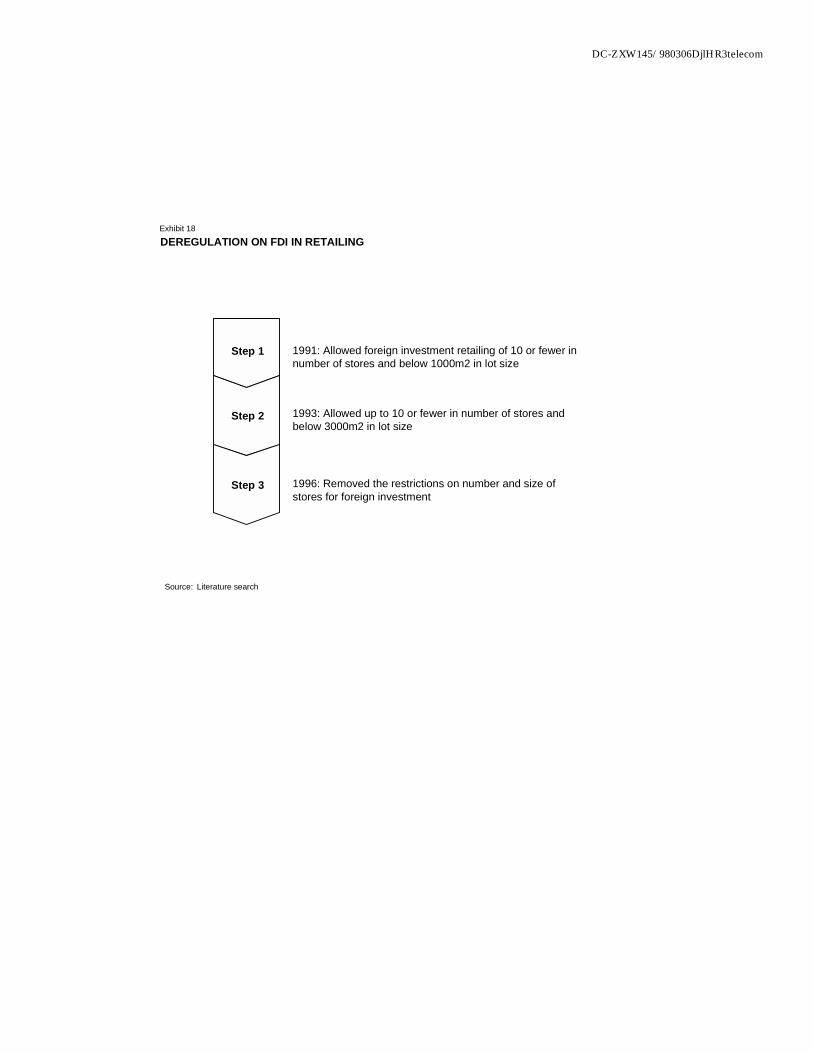
DC-ZXW145/980306DjlHR3telecom
DEREGULATION ON FDI IN RETAILING
1991: Allowed foreign investment retailing of 10 or fewer innumber of stores and below 1000m2 in lot size
Step 3
Step 2
Step 1
1993: Allowed up to 10 or fewer in number of stores andbelow 3000m2 in lot size
1996: Removed the restrictions on number and size ofstores for foreign investment
Source: Literature search
Exhibit 18
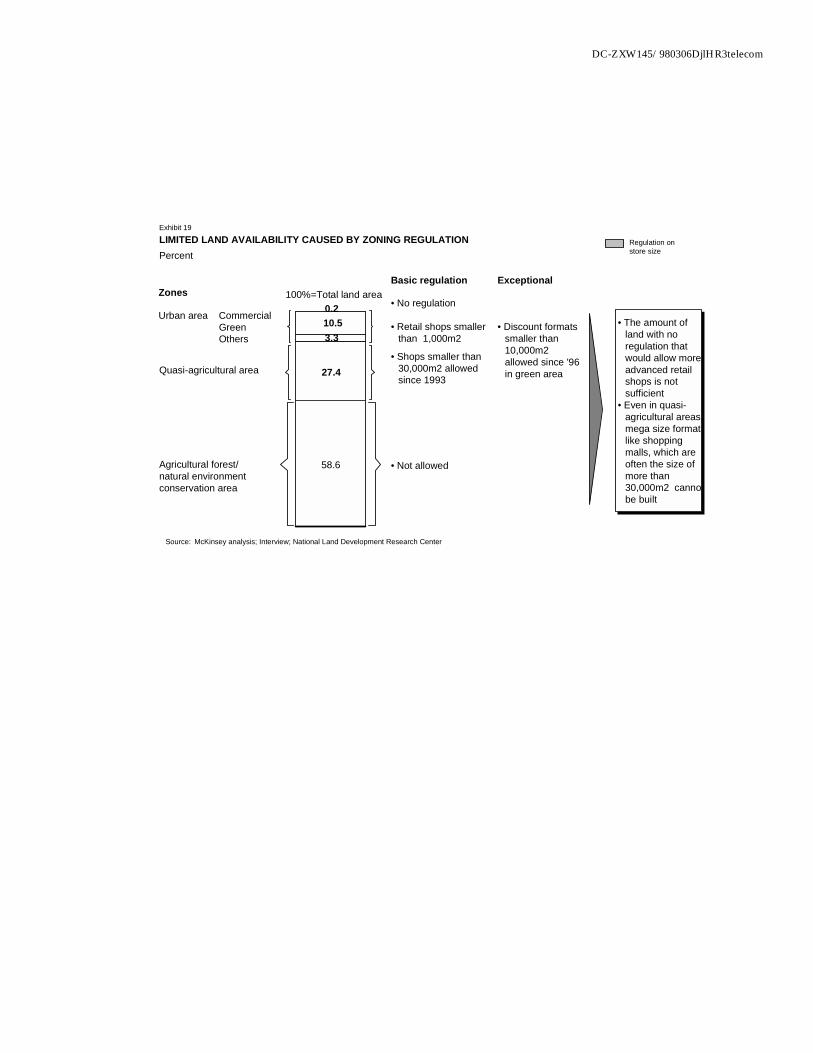
DC-ZXW145/980306DjlHR3telecom
10.53.3
27.4
58.6
LIMITED LAND AVAILABILITY CAUSED BY ZONING REGULATIONPercent
100%=Total land area
Source: McKinsey analysis; Interview; National Land Development Research Center
Regulation onstore size
0.2Zones
Urban area Commercial Green Others
Quasi-agricultural area
Agricultural forest/natural environmentconservation area
Basic regulation Exceptional
• No regulation
• Retail shops smallerthan 1,000m2
• Discount formatssmaller than10,000m2allowed since '96in green area
• Shops smaller than30,000m2 allowedsince 1993
• Not allowed
• The amount ofland with noregulation thatwould allow moreadvanced retailshops is notsufficient
• Even in quasi-agricultural areas,mega size formatlike shoppingmalls, which areoften the size ofmore than30,000m2 cannotbe built
Exhibit 19
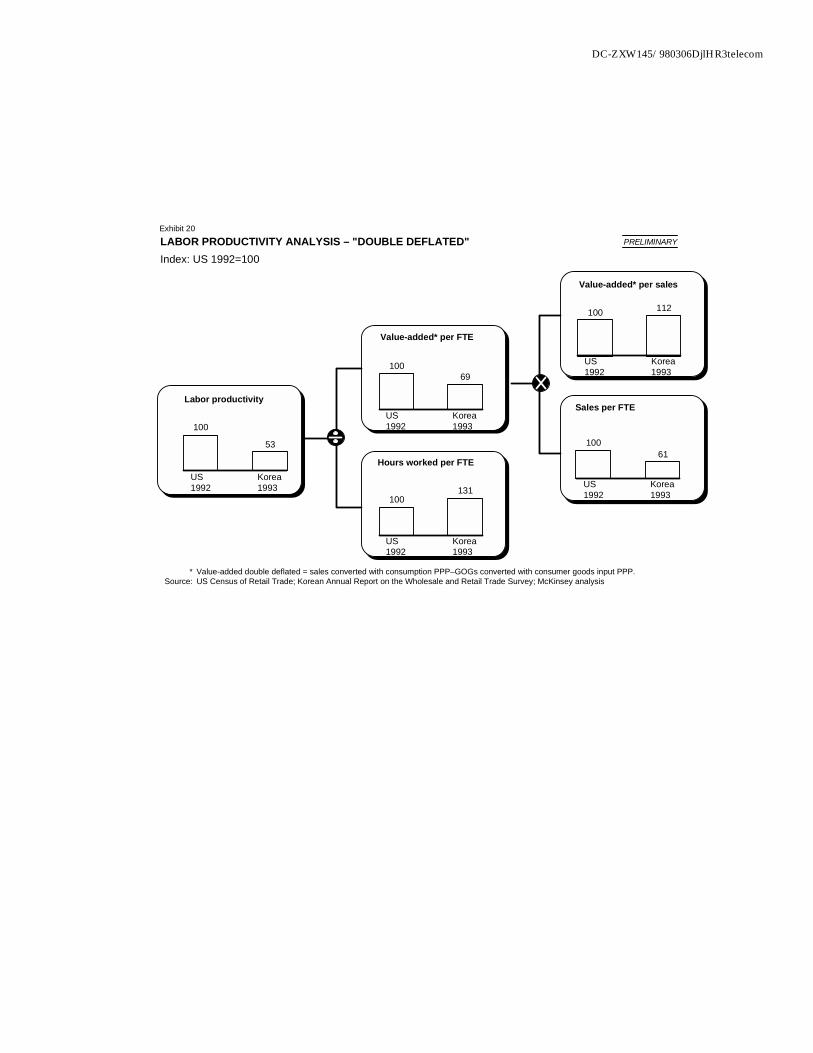
DC-ZXW145/980306DjlHR3telecom
* Value-added double deflated = sales converted with consumption PPP–GOGs converted with consumer goods input PPP.Source: US Census of Retail Trade; Korean Annual Report on the Wholesale and Retail Trade Survey; McKinsey analysis
LABOR PRODUCTIVITY ANALYSIS – "DOUBLE DEFLATED"Index: US 1992=100
Labor productivity
100
53
US1992
Korea1993
Value-added* per FTE
10069
US1992
Korea1993
Hours worked per FTE
100131
US1992
Korea1993
Value-added* per sales
100 112
US1992
Korea1993
Sales per FTE
10061
US1992
Korea1993
Exhibit 20PRELIMINARY
Steel industry
Executive Summary
Steel provided the backbone for economic development in North America, Europe, and Japan, where it supplied material to key industries such as automobile manufacturing, shipbuilding, and construction. While the steel industry has become mature in more developed countries, it continues to be a high growth industry in developing countries such as Thailand and China.
The question of how Korea has successfully achieved high productivity levels in the steel industry is thus relevant in a developmental economics context. Moreover, comparing Korea’s development with that of Brazil, whose steel industry has not met with the same success, provides a good contrast.
Using the US as a benchmark, from a total factor productivity (TFP) perspective, Korea’s steel industry shows best practice (111%) vs. Japan (110), the US (100), and Brazil (77%). Although Korea’s labor productivity (108%) exceeds the US, higher productivity from Japan (121%) provides an incentive for improvement.
¶ Minimills. Korea’s labor productivity gap versus Japan is primarily attributable to the organization of labor in Korea’s minimills. By learning from Nucor and Tokyo Steel (Japanese best practice) and taking advantage of the management flexibility possible for their smaller scale and simpler operations, minimills could operate leaner, more flexible organizations and greatly improve productivity.
¶ POSCO. Pohang Iron & Steel Company, which produces about 60% of Korean steel, demonstrates a unique combination of government leadership, company management, and good government policies that created a highly productive company. The presence of price competition for POSCO through regulatory, rather than market, forces has minimized the negative effects from a single-player industry. As a result, POSCO profitably sells many products at or below world prices.
Going forward, the Korean government and steel industry need to focus on increasing productivity. To accomplish this, the government can lower tariff and non-tariff barriers which protect the minimill sector. The resulting heightened competitive pressure could encourage productivity-improvement in the organization of minimills, which (if labor costs are sufficiently reduced) could see profound increases in ROIC. In addition, the Korean steel industry needs to avoid overbuilding capacity. A current trend toward global overcapacity indicates that export markets will not provide a profitable outlet for excess.
2
Steel case study
This report focuses on the fabrication of steel products in both integrated and minimill facilities, and excludes primary activities such as mining and first transformation activities such as foundry, forging, and welding [Exhibit 1]. The integrated mill and minimill segments in each country included generally have a number of players, and Exhibit 2 lists the top three producers for each.
Our study focuses on explaining productivity differences between the steel industries of Korea and Japan (the benchmark country for selected parts of the sector) during 1995. For comparison purposes, we also include the US and Brazil in our measurement and refer to them in our causal analysis when necessary.1
INDUSTRY OVERVIEW
The steel industry is an important contributor to the Korean economy [Exhibit 3] and holds a unique place in Korea’s economic development. In the 1960s, the Korean government targeted steel and other select industries for development, giving them special financing and access to managerial talent.
Korea’s main steel producer Pohang Iron & Steel Company (POSCO) was formed in 1968, when Korea embarked on the development of its steel industry against the advice of various international agencies. This development was extremely successful, demonstrating dramatic growth in capacity and output that fed increasing demand in Korea. This growth was heavily influenced by the timing of POSCO’s entry into the market because it occurred at a good time in Korea’s development and the development of other countries.
In a country’s less developed stage, steel demand is low because construction and steel-intensive manufacturing industries are small. As countries develop, steel-intensive industries such as construction and manufacturing grow, creating rapid demand growth for steel. In the later stages of economic development, however, the steel-intensive construction and manufacturing industries slow, causing a dramatic slow-down in steel consumption growth. As a result, the developed countries suffered excess capacity and were unable to pursue continued growth through exports, during the period when developing countries such as Korea were able to add capacity.
1 The MGI Brazil Country Study provides an in-depth analysis of the Brazilian steel industry.
3
Unlike the more developed steel industries in Japan and the US, Korea’s steel industry has grown dramatically over the last 25 years. Korean steel production also grew much faster than that of Brazil [Exhibit 4], partly due to differences in macroeconomic performance. While Korea’s economy grew at a 7% annual rate, Brazil only grew at 2%, thereby preventing a boom in Brazil’s steel industry.
The government played a dominant role in the development of the Korean steel industry through its policies toward POSCO, which currently produces about 60% of Korean steel [Exhibit 5]. POSCO is a unique case, as it demonstrates how government leadership, effective company management, and good government policies have converged to align incentives and create a highly productive, government-controlled company.
The remaining producers of steel in Korea are minimills and re-rollers (companies that process semi-finished or finished steel products purchased from other companies). Although many of these companies are actually older than POSCO, most of their growth in capacity and production did not occur until the 1980s and early 1990s. Unlike POSCO, the development of these companies was only indirectly promoted by the government through subsidized loans.2
Korean steel producers have a return on invested capital (ROIC) slightly higher than the cost of debt [Exhibit 6]. Although POSCO’s ROIC is one-half that of other Korean steel producers, its cost of debt is also only one-half that of non-POSCO companies. This reflects POSCO’s favored access to and cost of debt, as well as a series of government policies created to keep POSCO’s steel prices at a low level (discussed later in this document).
Trade intensity for POSCO and the Korean minimills shows marked differences. As in other countries, trade is much more important for the flat-product segment in Korea (made by POSCO), but less so in the long-product segment (made by minimills). While imports make up 30% of flat-product consumption, only 12% of long-product consumption is imported. Likewise, flat-product producers export 34% of their production, while long-product producers only export 6%.
2 Although Inchon Iron and Steel was government-owned until 1978, almost all of its capacity expansion occurred under private ownership.
4
Although the production process mix varies by country [Exhibit 7], these two major technologies are used to produce steel [Exhibit 8]:
¶ Integrated steel mills produce steel from iron ore. This process makes relatively high-quality steel and is generally used to produce higher value-added products, especially flat products.
¶ Minimills re-process used steel (“scrap”) into new products. Due to impurities in scrap, minimills generally make lower quality steel and create lower value-added products, especially long products.3
PRODUCTIVITY PERFORMANCE
The Korean steel industry shows best practice from a total factor productivity (TFP) perspective [Exhibit 9]:
1995 productivity percentage vs. US benchmark
Country
Labor
Capital
Total Factor Productivity (TFP)
Korea 108 115 111
Japan 121 101 110
Brazil 68 87 77
Korea’s labor productivity is below that of Japan, but is slightly higher than that of the US. While Korea produces significantly more raw tonnage compared to the US and Japan, the adjustment from raw tonnage to equivalent tons to reflect value added (e.g., minimills adjustments) lowers Korea’s labor productivity. When Korea’s performance is separated into the respective integrated and minimill segments, we find that virtually the entire labor productivity gap is created by minimills, where Japan has 50% higher productivity than Korea [Exhibit 10].
To explain the causes of the differences in labor productivity between Korea, Japan, and Brazil, we have used a causality framework broken down into three levels: production process, industry dynamics, and external factors. Using this framework, Exhibit 11 breaks down the causes of labor productivity differences between Korea, Japan, and Brazil. This framework denotes why Korea has lower labor productivity than Japan as well as why Korea has higher labor productivity than Brazil.
3 These generalizations are true for the most part, but most integrated mills do produce some long products and more advanced minimill technology allows for flat-product production.
5
METHODOLOGY
We defined labor and capital productivity in the steel industry as the amount of labor and capital needed to produce a certain amount of physical output. To make the calculations, the following approach and adjustments were used. Output We categorize steel into four broad product segments: long carbon steel, flat carbon steel, specialty products, and semi-finished steel. Carbon steel is “normal” steel, and specialty products are partly made of or coated with other metals. Carbon steel is further divided into “flat” and “long.” Flat products generally require more labor, capital, and materials to produce and are more expensive, whereas long products generally are simpler to produce and less expensive. Semi-finished products are those which cannot be sold to end-users because they require further processing. The relative mix of products produced by the countries in this study varies significantly [Exhibit 12].
We used “equivalent tons” as the output measure base4, by adjusting total (raw) tonnage of finished steel produced by the product and production process mixes of each country. For the product mix [Exhibit 13], raw output is divided into 17 product segments with each adjusted for its different value-added content. In the production process mix [Exhibit 14], raw output is split into minimill and integrated mill production and adjusted for different value-added content. Exhibit 15 details raw output and adjusted output, or “equivalent tons.” Capital The capital used was the value of the capital stock used in steel production – as determined by a survey of capital equipment. The capital employed was first surveyed, and a 1995 market price was applied to the equipment to calculate the value of the capital stock. Using the perpetual inventory method (PIM)5, we verified the validity of the survey approach of measuring capital stock. In the US and Korea, the findings using PIM were very similar to the survey method. In Japan, the PIM method yielded a higher result, possibly due to the inclusion of closed capacity in the investment figures or the inclusion of non-production related equipment investment in the manufacturing census. Regardless, capital productivity results for Korea calculated with PIM capital stock data are not materially different from those using the survey method.
4 We rejected two other options for calculating output: 1. The first would have involved using a financial value-added figure adjusted by an industry PPP.
However it is not possible to get accurate price data for steel products in the sample countries. Plus, value-added data for the Brazilian steel industry is unavailable, which would limit our comparison.
2. The second would have measured output as total tonnage without taking into account differences in product or production process mix. However, the product and production process mixes in the included countries are different enough to make calculations using raw output figures inaccurate.
5 Using PIM, the investments over the service life of the assets are summed to calculate the value of the capital stock in the respective countries.
6
Production process
While Japanese firms define best practice, a number of factors suggest that Japan could further increase its labor productivity. Most importantly, Japan is not able to fully utilize its capacity even though its net steel exports are 13% of production. This low-capacity utilization lowers Japanese productivity. In addition, Japan’s smaller scale in both integrated and minimill production lowers Japanese labor productivity vis-a-vis Korea.
Korea’s higher labor productivity compared to Brazil is primarily driven by technology and scale. Brazil’s steel mills are significantly less automated than those of Korea, and only 68% of Brazil’s production facilities utilize continuous casting, compared to 98% for Korea. Moreover, Brazil built its facilities far below optimal scale, causing less efficient use of the labor employed. These production factors, combined with a lack of skilled labor to fill both blue and white collar jobs in Brazil, contribute to Brazil’s lower productivity at the production process level.
The major operational factor affecting Brazil’s productivity as compared to Japan is the under-utilization of built capacity. Like Japan, Brazil exports a large share of production. Even so, Brazil still operates at a 21% capacity utilization gap to Korea [Exhibit 16]. Higher capacity utilization allows the Korean steel industry to maximize output with the given labor inputs, improving its labor productivity vis-a-vis Brazil. Exhibit 17 details production process causes for the productivity gap between Korea and Japan.
Organization of functions and tasks The organization of labor in Korea’s steel industry is the main reason for Korea’s lower productivity versus Japan. In comparing the Korean and Japanese steel industries, we were able to look separately at the productivity of integrated and minimill production facilities. As the productivity gap was shown to be largely due to lower productivity in Korea’s minimill sector [as shown previously in Exhibit 10], it is reasonable to infer that the organization of labor in Korea’s minimill sector vis-a-vis Japan’s minimill sector is the real issue in Korea’s productivity.
Best practice companies like Nucor and Tokyo Steel have been able to take advantage of the simple product mix and small scale of minimill production by instituting streamlined management and flexibility at their plants. Some of the key practices that enabled Japanese companies to define best practice include use of multifunctional teams, adoption of multi-tasked jobs, and use of continuous improvement and cost-reduction programs. Two key factors prevent Korean minimills from increasing labor productivity by operating leaner and more flexible organizations:
¶ Multi-tasking. The level of multi-tasking in Korea is relatively lower than in Japan. The most obvious comparison is the cross-tasking (multi-
7
tasking) of operations and maintenance (e.g., the process where scrap is inserted into the EAF consists of three basic tasks: sampling, handling, and inserting. In Japanese minimills, these tasks are handled by one person whereas each job is handled by different people in Korean minimills). Recently, companies such as Inchon Iron & Steel and Kangwon Industries started training workers to multi-task this process.
¶ Specialization. Due to a complex product mix coupled with an unspecialized rolling process, labor productivity of Korean companies is further dragged down: not only because it takes more time to adjust the rolling process to each of the different products, but also because it requires more people.
To compound the situation, Korean minimill managers made investment tradeoff decisions that resulted in higher dependence on labor and lower automation levels compared to Japanese minimills. These decisions show up in the following areas:
¶ Automation of logistics (or material flow within the plant). Korea’s lower level of automation in logistics can be found in two parts of the entire process: (1) the manual operation of cranes to transport semi-finished products between processes, which increases overhead; and (2) the manual handling of finished products, which requires more people and thereby lowers labor productivity.
¶ Automation of operation unit facility. This factor is less significant than the above and basically focuses on the EAF process (e.g., the lack of automation in the periodic replacement of electrodes in the EAF and the oxygen-blowing process).
Product mix While the productivity gap created by Korean minimills’ production of lower value-added products is relatively small, this mix difference alone accounts for 35% of minimills’ labor productivity gap. Japanese minimills produce a far higher proportion of specialty long products (e.g., H-beams), which reflects the fact that the Japanese construction industry consumes more H-beams and other high-end construction bars. Possible reasons for this demand difference include:
¶ Government regulations. Earthquake-proof construction bars are required in the construction of Japanese buildings.
¶ Construction technologies. In Korea, construction using H-beams costs more, but Japanese companies use technology which lowers the overall production cost using H-beams instead of concrete reinforcement bars.
8
Industry dynamics
Exhibit 18 presents the industry structure of producers in both the long and flat product segments of the steel industries of Korea, Japan, and Brazil. In the flat-product segment in Korea, POSCO holds a near-monopoly position with 81% of domestic production of flat products. While some imported products compete with POSCO in the Korean market, POSCO is the low-price player in the Asian region in many flat-product segments and can underprice imports.
However, this exhibit does not tell the whole story for the flat-product segment. For many flat products in Korea, competition is imposed on POSCO through government pressure to supply low-cost steel products to the domestic economy; this forces POSCO into price competition through regulatory, rather than market, forces (discussed further in the external factors section). Competition in the Korean long-product segment (e.g., minimills) does not force productivity improvements to the same extent as in Japan:
¶ No domestic competition with the integrated mills. A clear line separates the products which the minimills and POSCO produce. Although it is not explicitly stated that POSCO cannot enter the market, the government’s policy to nurture the minimills had some part in the segregation. In addition, the small scale of the market segments that are sufficiently high value added, such as the H-beams, does not make it attractive for POSCO to enter. In contrast, Japanese minimills compete with integrated mills in the H-beam product market (minimills produce 56% of total H-beams), as well as some of the flat-product markets.
¶ No competition with best practice. In the case of H-beams, which account for 20% of Korean minimill production, a special tariff protects Korean players from the best practice of Japan and US.
Compared to Korea and Japan, Brazil’s flat-product industry structure is quite concentrated, with three players making up 93% of flat-product production. However, looking at Brazilian steel industry on a product basis reveals concentration to be even higher. Exhibit 19 shows that there are only two players in common flat products like hot rolled coil, with one making up 61% of production. Specialty flat products are a true monopoly, with only one producer in that segment. Since the government does not force competitive pricing through regulation as does the Korean government, low competition in Brazil contributes to the overall low productivity of the steel industry.
In addition to protection from trade competition by high tariffs and transportation costs, the concentration of the Brazilian long-product segment suggests a further decrease in competitive intensity in the domestic market. However, it is not clear that this is significantly different from the current lack of competition in the long-product market in Korea.
9
External factors
Our analysis indicates that four key external factors are responsible for motivating corporate managers’ decisions and actions: product regulations, corporate governance, relative factor prices, and labor rules/unionism.
Product regulations Domestic dominance – like POSCO’s in the flat-product segment – could lead to monopoly pricing. However, government regulations in the form of informal price regulations offset this danger and effectively require POSCO to sell its products at or below world prices.6 This regulatory approach complements the government’s desire to promote growth in steel-consuming industries such as ship building, auto, and construction.
Comparing the prices of certain key flat products in Korea to the same products in other countries shows that Korean flat product prices were on average 12% below the sample countries’ prices [Exhibit 20]. Also, in comparing Korean domestic prices to the import prices of hot rolled coil, we see that POSCO’s prices are well below the competing import parity price [Exhibit 21].
However, due to government protection during the late 1970s - 80s, minimills do not face such indirect price regulation in the long-product segment. The government found minimills to be an attractive way to develop the steel industry (low initial investment and relatively easier technology import) and protected them through the selective enforcement of the “Steel industry nurturing and protection law.”
As a likely result, the product that comprises two-thirds of long-product production in Korea (the reinforcement bar) is actually priced 11% higher than in the comparison countries [Exhibit 20]. In Exhibit 21, we compare the domestic price to the import price of the reinforcement bar – this shows the domestic price slightly higher than the import price after tariffs, likely due to differences in transportation costs within Korea or long-term contract arrangements with domestic suppliers.
Corporate governance While POSCO is effectively a state-owned enterprise, the way it has been governed does not appear to have negatively impacted Korean integrated mill productivity. In addition to positive regulation (e.g., regulations on pricing competition vs. world prices), the appointment of a qualified person to manage POSCO in the earlier stages of its development placed pressure on management to achieve high performance and growth.
6 Though this price regulation is not expressed directly through such actions as regulatory rulings, steel industry literature and interviews acknowledge such regulation.
10
POSCO is the exception that may define best practice for government ownership. In establishing POSCO, the Korean government agreed to three conditions set forth by Taejoon Park (Chairman from 1968 to 1994):
¶ No government involvement in the procurement of equipment, goods, and services by POSCO;
¶ No government influence in hiring POSCO personnel; and
¶ No political donations, declared or otherwise, from POSCO.
These conditions along with the regulatory environment mentioned above allowed POSCO to avoid conflicts of interest common in state-owned companies. Chairman Park led the company [Exhibit 22] by instituting best practices in management (e.g., continuous benchmarking, NPV assessments of new investments), which enabled POSCO to achieve high productivity levels. In contrast, Korea’s minimills were managed differently and pursued revenue- and share-oriented strategies with less attention on profits and returns. Consequently, the current productivity gap in the Korean steel industry comes from the minimills sector.
Corporate governance issues (in the form of government ownership) appear to have had a negative impact on the Brazilian steel industry. Though the Brazilian government fully privatized the Brazilian steel industry by 1995, a legacy remains from the period of government ownership. This can be seen at the production process level as problems which can be attributed to poor management decisions under government ownership (e.g., many plants were built at inefficient scale without the most modern technology).
Relative factor prices As Exhibit 23 shows, labor costs in Korea are significantly lower than labor costs in Japan. This places profit pressure on Japan steel producers due to competition from low-cost producers such as POSCO. POSCO does not face such pressure, as discussed earlier, since the Korean government acts to place pricing pressure on POSCO. The Korean long-product producers, however, are able to take advantage of lower factor costs without strong downward price pressure from the government. Thus lower factor costs play a role in allowing the Korean minimill industry to operate without achieving high productivity.
11
Labor rules/unionism Korean minimill unions are becoming a greater force in this sector. Although unions are not against the automation of the facilities, they oppose it when the automation leads to layoffs. As a result, Korean minimills have less optimal labor productivity through passive dealings with the unions – when companies increase automation, they either place extra workers in newly built plants or continue to keep the excess workers employed.
CHALLENGES AND IMPLICATIONS
Further investment in the Korean steel industry appears unattractive over the medium term because strong demand growth is unlikely in either domestic or export markets for Korean steel producers:
¶ Slow growth in domestic market. Korea’s GDP per capita, at around $10,000 in US 1990 dollars at PPP, suggests that significant domestic demand growth is not likely to occur in the future [Exhibits 24 and 25]. However, demand for higher value-added products could substitute for lower value-added products as Korean industry begins to move toward manufacturing which utilizes such products (e.g., as Korea’s automobile industry improves the manufacturability and durability of its cars, the Korean steel industry will need to supply higher value-added coated and processed products). Thus, increased integrated mill capacity will be unlikely in Korea, but more sophisticated steel processing of current capacity will be required.
¶ Difficulty in export. The world steel industry currently suffers from overcapacity, and this condition will likely continue in the foreseeable future. Although Asian demand is projected to grow (primarily in China and Southeast Asia) while Europe, Japan, and the former Soviet Union will shut down underused capacity, Korea is unlikely to be a significant supplier for this growth – local capacity growth will likely meet much of this demand. Moreover, as Korea develops, rising steel labor costs, which have seen a rapid 10% per annum rate since 1980, will likely erode its dramatic cost advantage. Thus an export-led steel development strategy would lead to underutilized capacity and financial value destruction.
Following the pattern of development seen in the US and later in Japan, minimill technology may gradually replace integrated mill production in Korea. One factor currently preventing more significant minimill growth is the high price of and lack of high-quality steel scrap. As the Korean economy matures, such scrap will likely become more available, fueling growth in minimills. Also, new scrap substitute technologies will provide fuel for minimills. In 1996, POSCO entered the minimill industry by opening a flat products minimill at its Kwangyang
12
facilities. The now-defunct Hanbo steel also built a flat-product minimill in Korea. As minimill technology advances and scrap/scrap substitutes become more available, this sector may become a growth area for Korea’s steel industry.
A final factor that may influence steel demand is the possibility of Korean reunification. Under a peaceful scenario leading to fast growth in the North’s economy, steel demand could increase – possibly warranting capacity expansion. However, under other scenarios, steel demand in Korea might stay the same or actually decline. As the conditions for possible reunification are unclear, it is not certain whether capacity expansion based on reunification is justified.
In view of our analysis, it seems that the Korean government and steel industry could improve productivity in the following ways.
Government
Government policy should be geared toward increasing competition in the minimill sector and, to a lesser degree, on POSCO. A number of initiatives could help increase pressure on the minimill sector:
¶ Lowering tariff and non-tariff barriers (especially on long products) would heighten competitive pressure on the minimill sector.
¶ Allowing foreign partnering, foreign direct investment, or foreign takeover by best-practice players in the minimill sector would increase pressure to improve productivity.
¶ Promoting domestic competition in the minimill segment through strong regulation of any anti-competitive behavior.
It would be more difficult to increase competitive pressure on POSCO, given POSCO’s near monopoly and the unique regulatory system in flat-product pricing. However, lower tariff and non-tariff barriers could have some effect in this regard. The possible full privatization and deregulation of POSCO could have significant effects on the Korean steel industry. Depending on the regulatory scenario, splitting POSCO into two different companies could prevent a privatized monopoly in Korea’s domestic integrated steel production by placing competitive pressure on POSCO. However, a duopoly situation might not increase competition substantially. Regardless, given its solid productivity performance, it is important to maintain competitive pressure on POSCO.
Breaking up POSCO into two companies might also increase competitive pressure in the Korean flat-product market. In the long term, as POSCO’s labor costs rise into line with those in Japan, trade will play a more significant role in maintaining competition in the domestic Korean market.
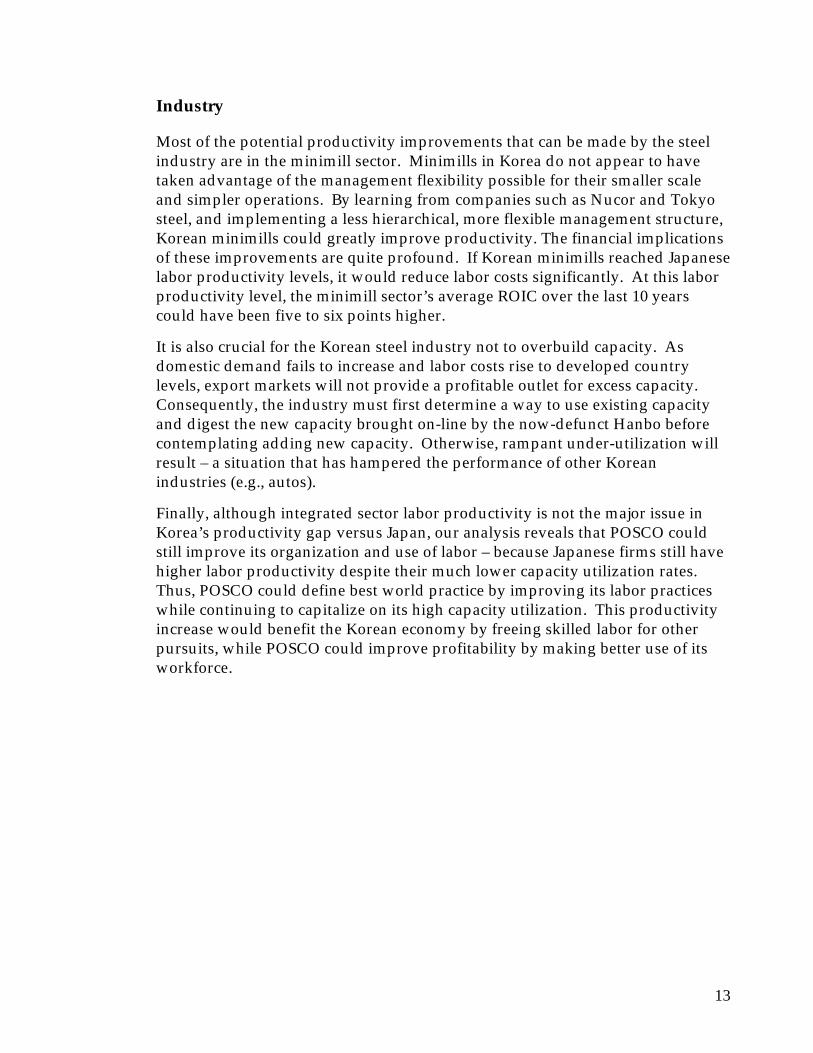
13
Industry
Most of the potential productivity improvements that can be made by the steel industry are in the minimill sector. Minimills in Korea do not appear to have taken advantage of the management flexibility possible for their smaller scale and simpler operations. By learning from companies such as Nucor and Tokyo steel, and implementing a less hierarchical, more flexible management structure, Korean minimills could greatly improve productivity. The financial implications of these improvements are quite profound. If Korean minimills reached Japanese labor productivity levels, it would reduce labor costs significantly. At this labor productivity level, the minimill sector’s average ROIC over the last 10 years could have been five to six points higher.
It is also crucial for the Korean steel industry not to overbuild capacity. As domestic demand fails to increase and labor costs rise to developed country levels, export markets will not provide a profitable outlet for excess capacity. Consequently, the industry must first determine a way to use existing capacity and digest the new capacity brought on-line by the now-defunct Hanbo before contemplating adding new capacity. Otherwise, rampant under-utilization will result – a situation that has hampered the performance of other Korean industries (e.g., autos).
Finally, although integrated sector labor productivity is not the major issue in Korea’s productivity gap versus Japan, our analysis reveals that POSCO could still improve its organization and use of labor – because Japanese firms still have higher labor productivity despite their much lower capacity utilization rates. Thus, POSCO could define best world practice by improving its labor practices while continuing to capitalize on its high capacity utilization. This productivity increase would benefit the Korean economy by freeing skilled labor for other pursuits, while POSCO could improve profitability by making better use of its workforce.
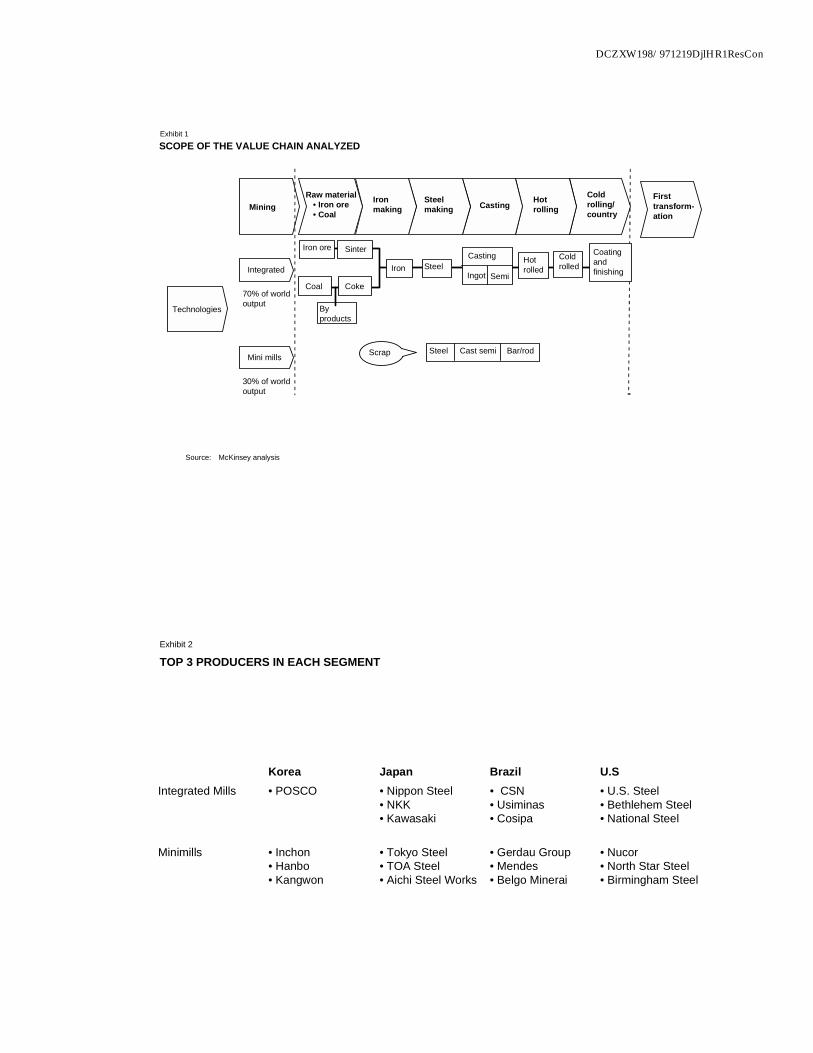
DCZXW198/971219DjlHR1ResCon
SCOPE OF THE VALUE CHAIN ANALYZED
Source: McKinsey analysis
MiningRaw material
• Iron ore• Coal
Ironmaking
Steelmaking Casting Hot
rolling
Coldrolling/country
Firsttransform-ation
Technologies
Integrated
70% of worldoutput
Mini mills
30% of worldoutput
Iron ore
Coal
Sinter
Coke
Byproducts
Iron SteelHotrolled
Coldrolled
Scrap Steel Cast semi Bar/rod
Casting
Ingot Semi
Coatingandfinishing
Exhibit 1
TOP 3 PRODUCERS IN EACH SEGMENT
Korea Japan Brazil U.SIntegrated Mills • POSCO • Nippon Steel
• NKK• Kawasaki
• CSN• Usiminas• Cosipa
• U.S. Steel• Bethlehem Steel• National Steel
Minimills • Inchon• Hanbo• Kangwon
• Tokyo Steel• TOA Steel• Aichi Steel Works
• Gerdau Group• Mendes• Belgo Minerai
• Nucor• North Star Steel• Birmingham Steel
Exhibit 2
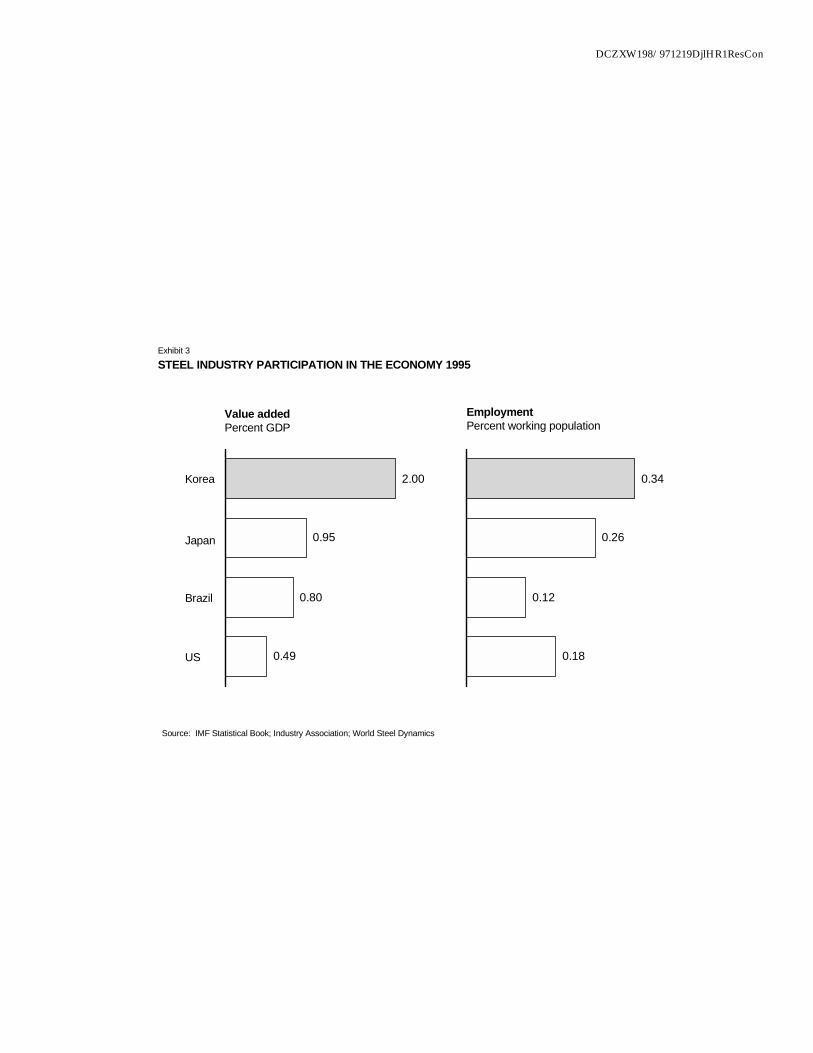
DCZXW198/971219DjlHR1ResCon
STEEL INDUSTRY PARTICIPATION IN THE ECONOMY 1995
Source: IMF Statistical Book; Industry Association; World Steel Dynamics
Korea
Japan
Brazil
2.00
0.95
0.80
0.49
0.34
0.26
0.12
0.18
Exhibit 3
US
Value addedPercent GDP
EmploymentPercent working population
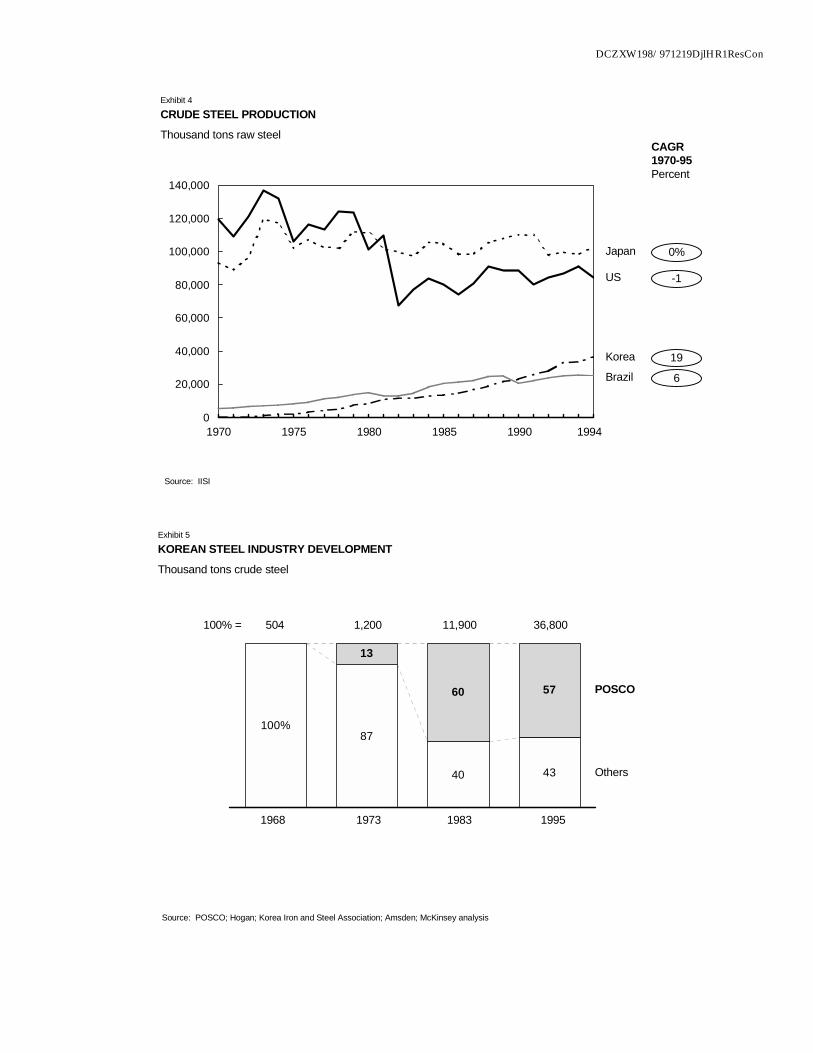
DCZXW198/971219DjlHR1ResCon
0%
-1
19
6
CRUDE STEEL PRODUCTIONThousand tons raw steel
Source: IISI
0
20,000
40,000
60,000
80,000
100,000
120,000
140,000
Exhibit 4
Japan
US
Korea
Brazil
1970 1975 1980 1985 1990 1994
CAGR1970-95Percent
KOREAN STEEL INDUSTRY DEVELOPMENTThousand tons crude steel
Source: POSCO; Hogan; Korea Iron and Steel Association; Amsden; McKinsey analysis
87
40 43
13
60 57
100%
POSCO
Others
504 1,200 11,900 36,800
1968 1973 1983 1995
Exhibit 5
100% =
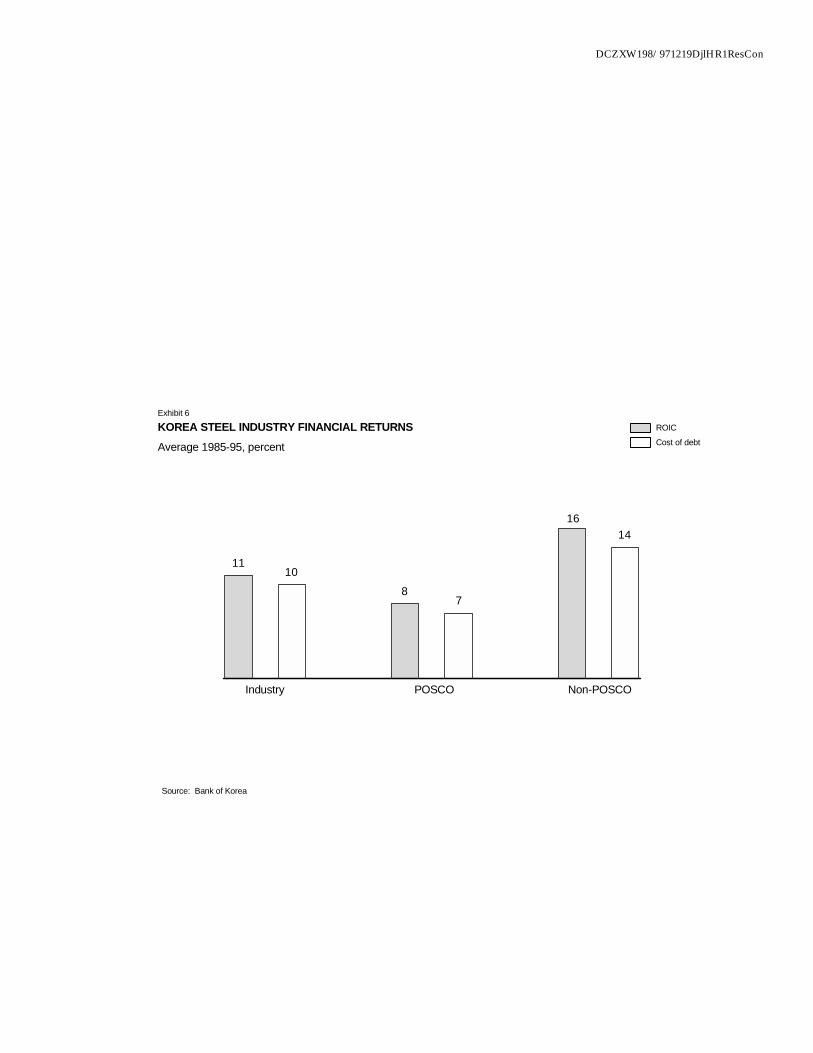
DCZXW198/971219DjlHR1ResCon
KOREA STEEL INDUSTRY FINANCIAL RETURNSAverage 1985-95, percent
Source: Bank of Korea
11
810
7
1416
Industry POSCO Non-POSCO
ROIC
Cost of debt
Exhibit 6
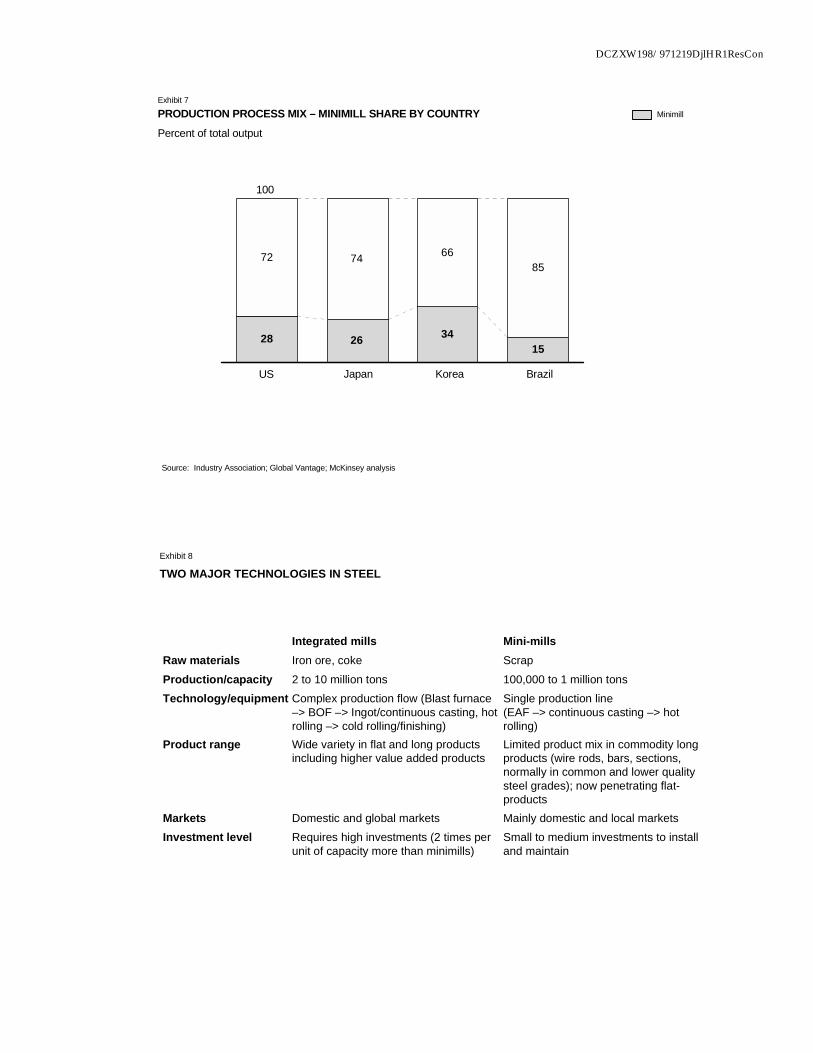
DCZXW198/971219DjlHR1ResCon
PRODUCTION PROCESS MIX – MINIMILL SHARE BY COUNTRYPercent of total output
Source: Industry Association; Global Vantage; McKinsey analysis
28 26 3415
74 6685
72
100
US Japan Korea Brazil
Exhibit 7
Minimill
TWO MAJOR TECHNOLOGIES IN STEEL
Integrated mills Mini-millsRaw materials Iron ore, coke ScrapProduction/capacity 2 to 10 million tons 100,000 to 1 million tonsTechnology/equipment Complex production flow (Blast furnace
–> BOF –> Ingot/continuous casting, hotrolling –> cold rolling/finishing)
Single production line(EAF –> continuous casting –> hotrolling)
Product range Wide variety in flat and long productsincluding higher value added products
Limited product mix in commodity longproducts (wire rods, bars, sections,normally in common and lower qualitysteel grades); now penetrating flat-products
Markets Domestic and global markets Mainly domestic and local marketsInvestment level Requires high investments (2 times per
unit of capacity more than minimills)Small to medium investments to installand maintain
Exhibit 8
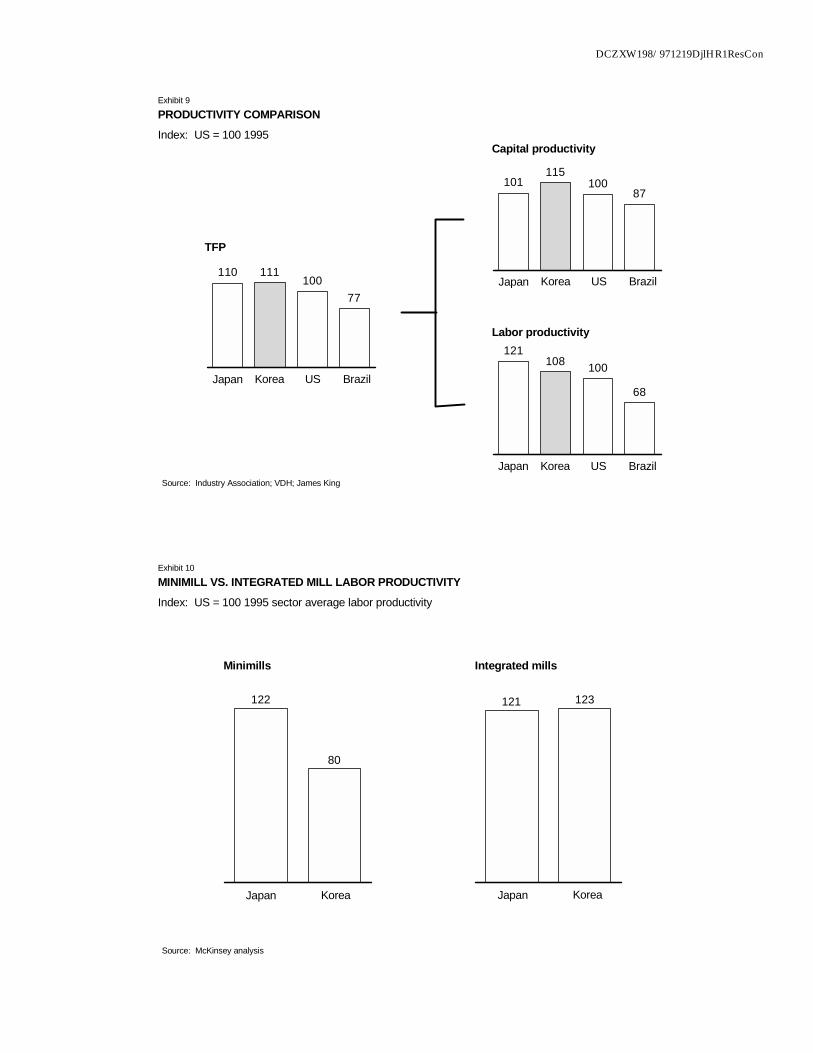
DCZXW198/971219DjlHR1ResCon
PRODUCTIVITY COMPARISONIndex: US = 100 1995
Source: Industry Association; VDH; James King
111100
77
110
Japan Korea US Brazil
Exhibit 9
108 100
68
121
115100
87101
Japan Korea US Brazil
Japan Korea US Brazil
TFP
Capital productivity
Labor productivity
MINIMILL VS. INTEGRATED MILL LABOR PRODUCTIVITYIndex: US = 100 1995 sector average labor productivity
Source: McKinsey analysis
Minimills Integrated mills
80
122
Japan Korea
123121
Japan Korea
Exhibit 10
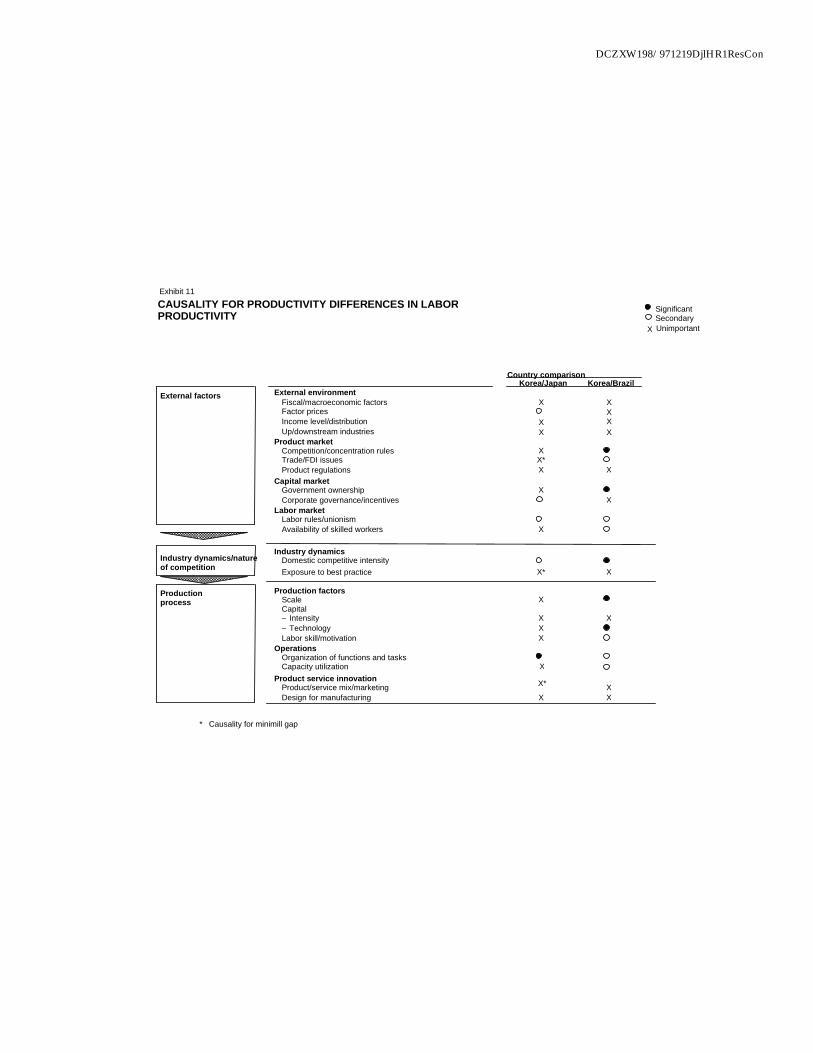
DCZXW198/971219DjlHR1ResCon
CAUSALITY FOR PRODUCTIVITY DIFFERENCES IN LABORPRODUCTIVITY
Country comparisonKorea/Japan Korea/Brazil
External factors External environment� Fiscal/macroeconomic factors X X� Factor prices X� Income level/distribution X X� Up/downstream industries X XProduct market� Competition/concentration rules X� Trade/FDI issues X*� Product regulations X XCapital market� Government ownership X� Corporate governance/incentives XLabor market� Labor rules/unionism� Availability of skilled workers X
Industry dynamics/natureof competition
Industry dynamics� Domestic competitive intensity� Exposure to best practice X* X
Productionprocess
Production factors� Scale X� Capital
– Intensity X X– Technology X
� Labor skill/motivation XOperations� Organization of functions and tasks� Capacity utilization XProduct service innovation� Product/service mix/marketing X� Design for manufacturing X X
Significant
XSecondaryUnimportant
Exhibit 11
* Causality for minimill gap
X*
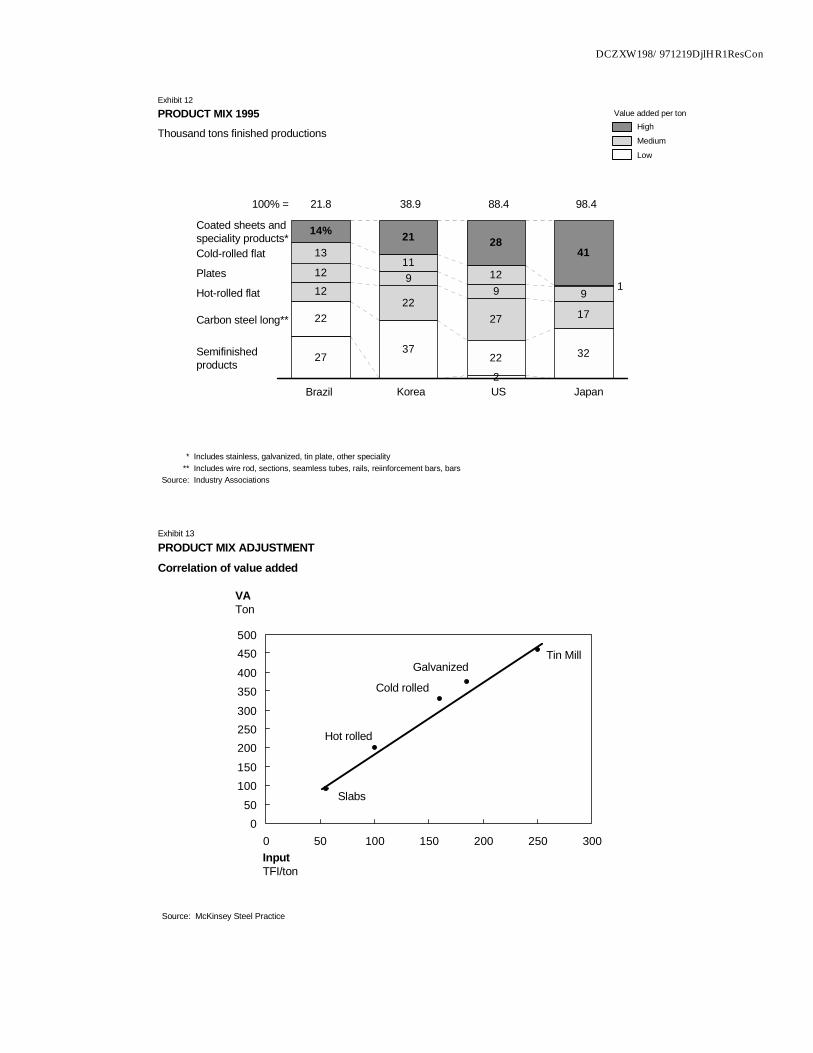
DCZXW198/971219DjlHR1ResCon
PRODUCT MIX 1995
Thousand tons finished productions
* Includes stainless, galvanized, tin plate, other speciality** Includes wire rod, sections, seamless tubes, rails, reiinforcement bars, bars
Source: Industry Associations
3722 32
1222
27 17
12 99 9
1311
12
21 2841
2
27
22
1
14%
Semifinishedproducts
21.8 38.9 88.4 98.4
Brazil Korea US Japan
Exhibit 12
100% =
Carbon steel long**
Hot-rolled flat
Plates
Cold-rolled flat
Coated sheets andspeciality products*
High
Medium
Low
Value added per ton
PRODUCT MIX ADJUSTMENT
Source: McKinsey Steel Practice
VATon
InputTFI/ton
Slabs
050
100150200250300350400450500
0 50 100 150 200 250 300
Exhibit 13
Hot rolled
Cold rolled
GalvanizedTin Mill
Correlation of value added
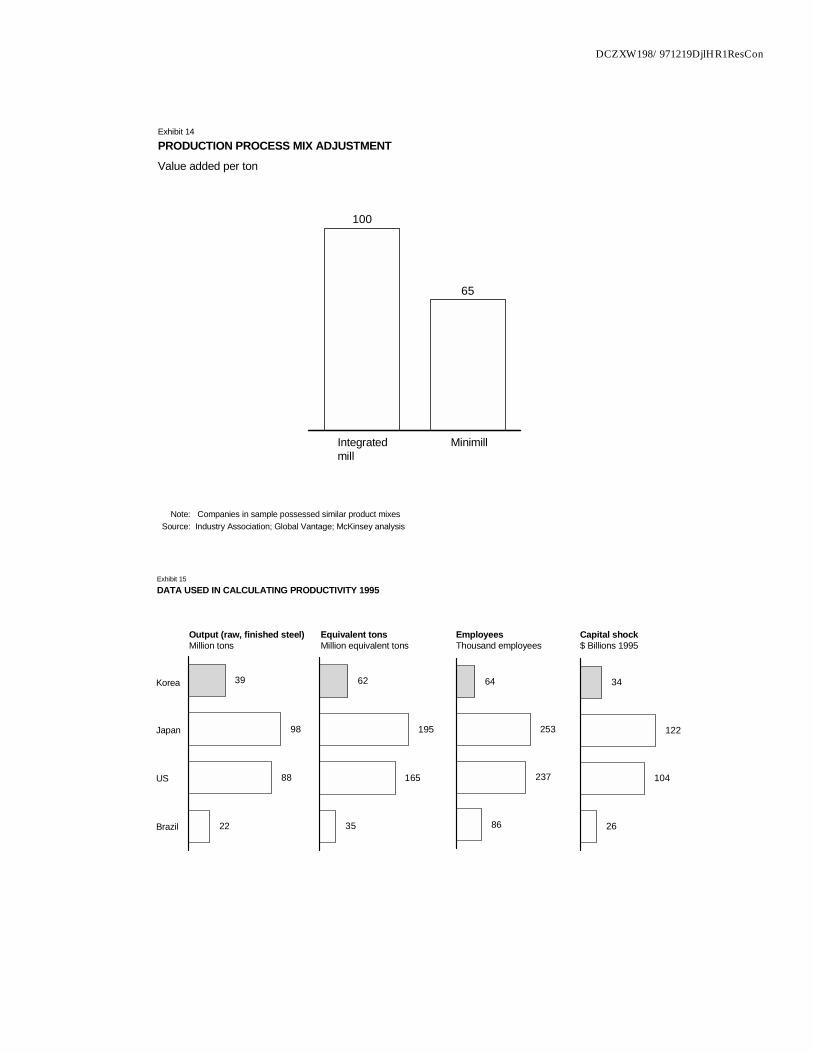
DCZXW198/971219DjlHR1ResCon
PRODUCTION PROCESS MIX ADJUSTMENTValue added per ton
Note: Companies in sample possessed similar product mixesSource: Industry Association; Global Vantage; McKinsey analysis
65
100
Integratedmill
Minimill
Exhibit 14
DATA USED IN CALCULATING PRODUCTIVITY 1995
Output (raw, finished steel)Million tons
Korea
Japan
US
Brazil
Equivalent tonsMillion equivalent tons
EmployeesThousand employees
Capital shock$ Billions 1995
39
98
88
22
62
195
165
35
64
253
237
86
34
122
104
26
Exhibit 15
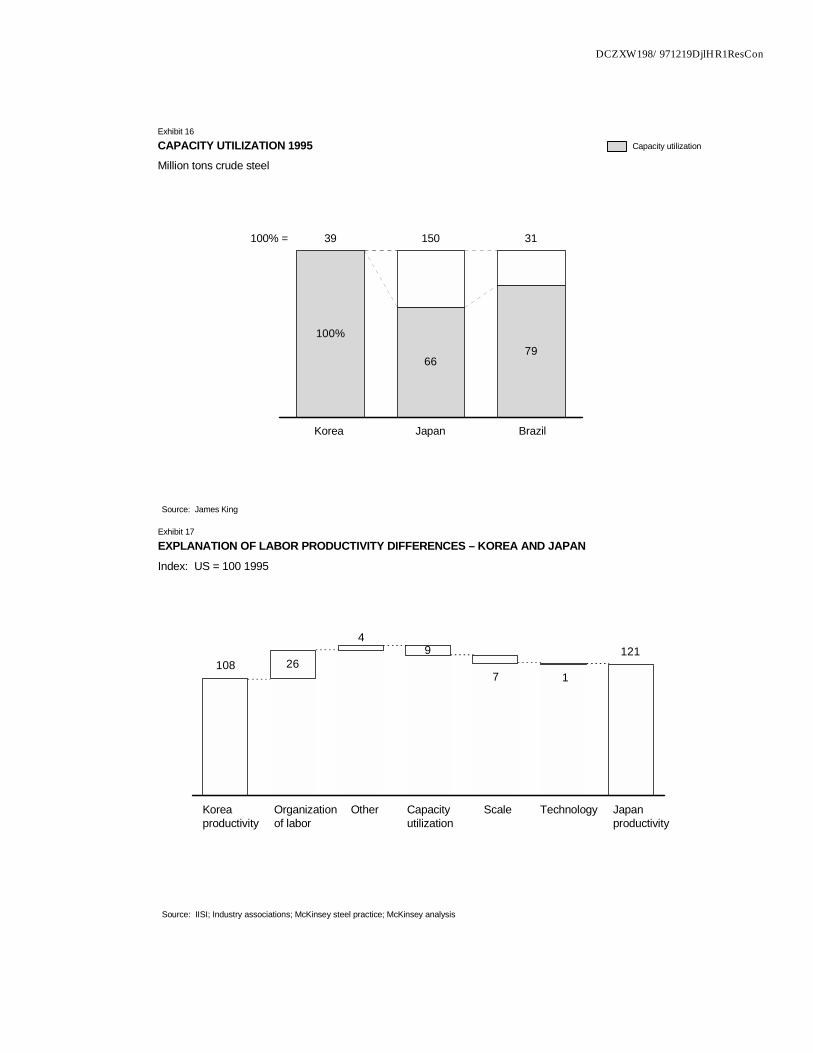
DCZXW198/971219DjlHR1ResCon
CAPACITY UTILIZATION 1995Million tons crude steel
Source: James King
6679
100%
100% = 39 150 31
Korea Japan Brazil
Capacity utilization
Exhibit 16
EXPLANATION OF LABOR PRODUCTIVITY DIFFERENCES – KOREA AND JAPANIndex: US = 100 1995
Source: IISI; Industry associations; McKinsey steel practice; McKinsey analysis
269 121
17
4
108
Technology Japanproductivity
Koreaproductivity
Organizationof labor
Other Capacityutilization
Scale
Exhibit 17
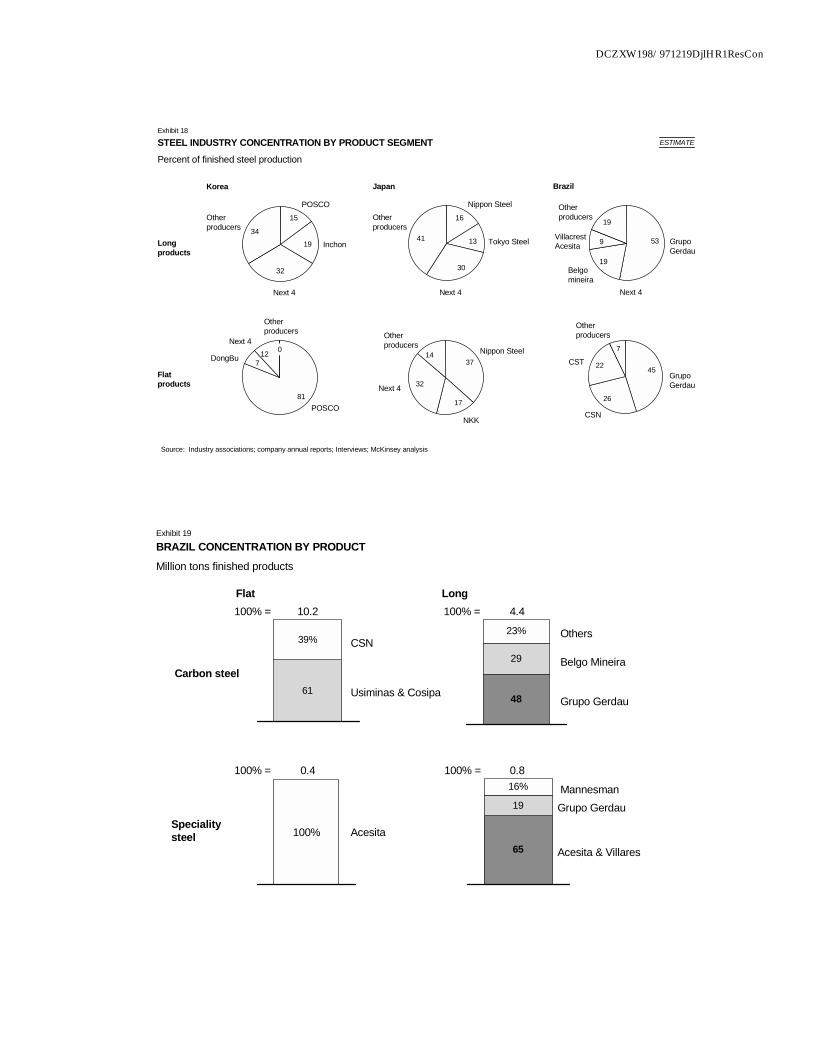
DCZXW198/971219DjlHR1ResCon
STEEL INDUSTRY CONCENTRATION BY PRODUCT SEGMENTPercent of finished steel production
Source: Industry associations; company annual reports; Interviews; McKinsey analysis
19
15
34
32
POSCO
Inchon
Next 4
Otherproducers
Korea
Exhibit 18
13
16
41
30
Nippon Steel
Tokyo Steel
Next 4
Otherproducers
Japan
19
53
19
9VillacrestAcesita Grupo
Gerdau
Next 4
Otherproducers
Brazil
Belgomineira
7
81
012
POSCO
DongBu
Next 4
Otherproducers
Longproducts
17
3714
32
Nippon Steel
NKK
Next 4
Otherproducers
26
45
7
22GrupoGerdau
CSN
Otherproducers
CSTFlatproducts
ESTIMATE
BRAZIL CONCENTRATION BY PRODUCTMillion tons finished products
61
39%
Specialitysteel
CSN
Usiminas & Cosipa
10.2100% =Flat
Carbon steel
Exhibit 19
48
29
23% Others
Grupo Gerdau
4.4100% =
Belgo Mineira
Long
100% Acesita
0.4100% =
65
19
16% Mannesman
Acesita & Villares
0.8100% =
Grupo Gerdau
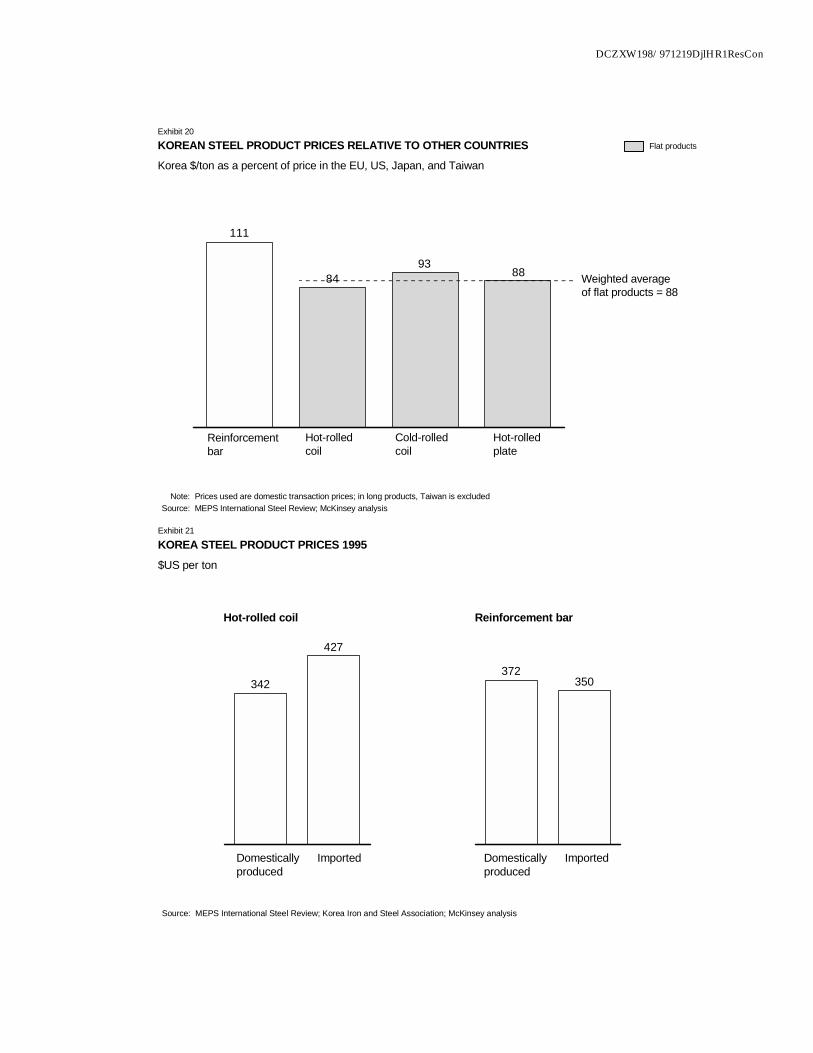
DCZXW198/971219DjlHR1ResCon
KOREAN STEEL PRODUCT PRICES RELATIVE TO OTHER COUNTRIES
Korea $/ton as a percent of price in the EU, US, Japan, and Taiwan
Note: Prices used are domestic transaction prices; in long products, Taiwan is excludedSource: MEPS International Steel Review; McKinsey analysis
8493
88
111
Reinforcementbar
Hot-rolledcoil
Cold-rolledcoil
Hot-rolledplate
Flat products
Exhibit 20
Weighted averageof flat products = 88
427
342 350372
KOREA STEEL PRODUCT PRICES 1995$US per ton
Source: MEPS International Steel Review; Korea Iron and Steel Association; McKinsey analysis
Hot-rolled coil Reinforcement bar
Domesticallyproduced
Imported
Exhibit 21
Domesticallyproduced
Imported
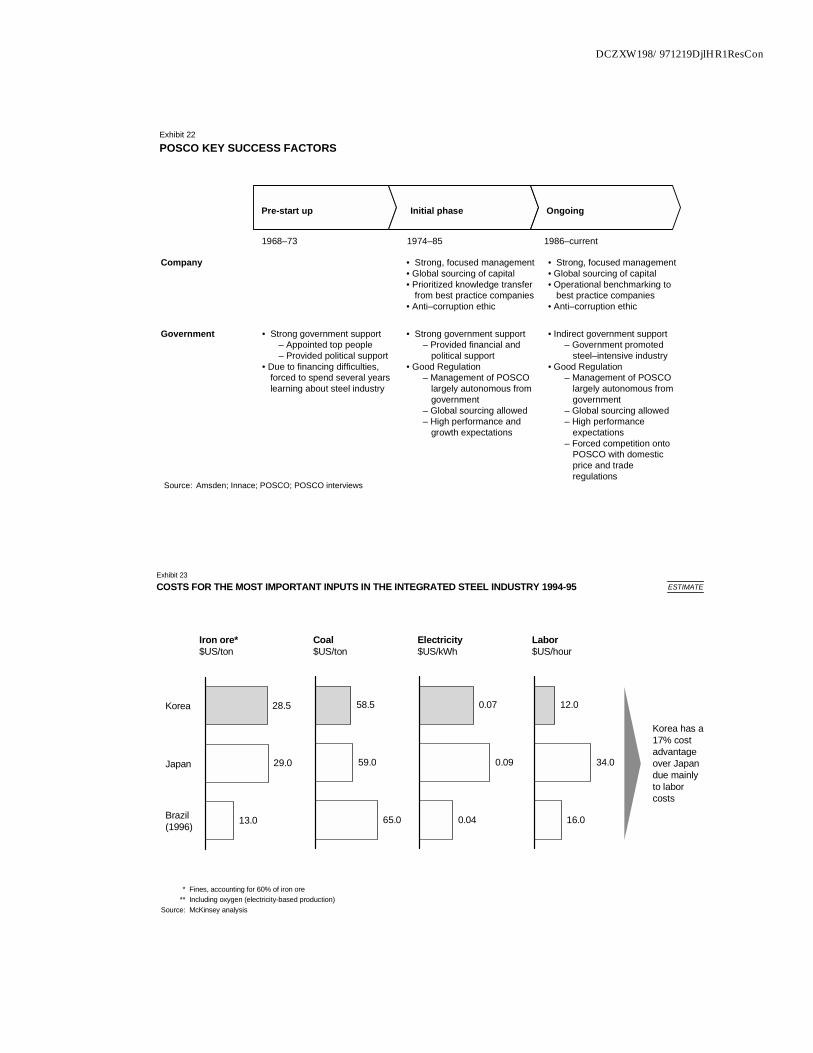
DCZXW198/971219DjlHR1ResCon
Pre-start up Initial phase Ongoing
Company • Strong, focused management• Global sourcing of capital• Prioritized knowledge transfer
from best practice companies• Anti–corruption ethic
• Strong, focused management• Global sourcing of capital• Operational benchmarking to
best practice companies• Anti–corruption ethic
Government • Strong government support– Appointed top people– Provided political support
• Due to financing difficulties,forced to spend several yearslearning about steel industry
• Strong government support– Provided financial and
political support• Good Regulation
– Management of POSCOlargely autonomous fromgovernment
– Global sourcing allowed– High performance and
growth expectations
• Indirect government support– Government promoted
steel–intensive industry• Good Regulation
– Management of POSCOlargely autonomous fromgovernment
– Global sourcing allowed– High performance
expectations– Forced competition onto
POSCO with domesticprice and traderegulations
POSCO KEY SUCCESS FACTORS
Source: Amsden; Innace; POSCO; POSCO interviews
1968–73 1974–85 1986–current
Exhibit 22
COSTS FOR THE MOST IMPORTANT INPUTS IN THE INTEGRATED STEEL INDUSTRY 1994-95
Iron ore*$US/ton
Korea
Japan
Brazil(1996)
Coal$US/ton
Electricity$US/kWh
Labor$US/hour
28.5
29.0
13.0
Exhibit 23ESTIMATE
58.5
59.0
65.0
0.07
0.09
0.04
12.0
34.0
16.0
Korea has a17% costadvantageover Japandue mainlyto laborcosts
* Fines, accounting for 60% of iron ore** Including oxygen (electricity-based production)
Source: McKinsey analysis
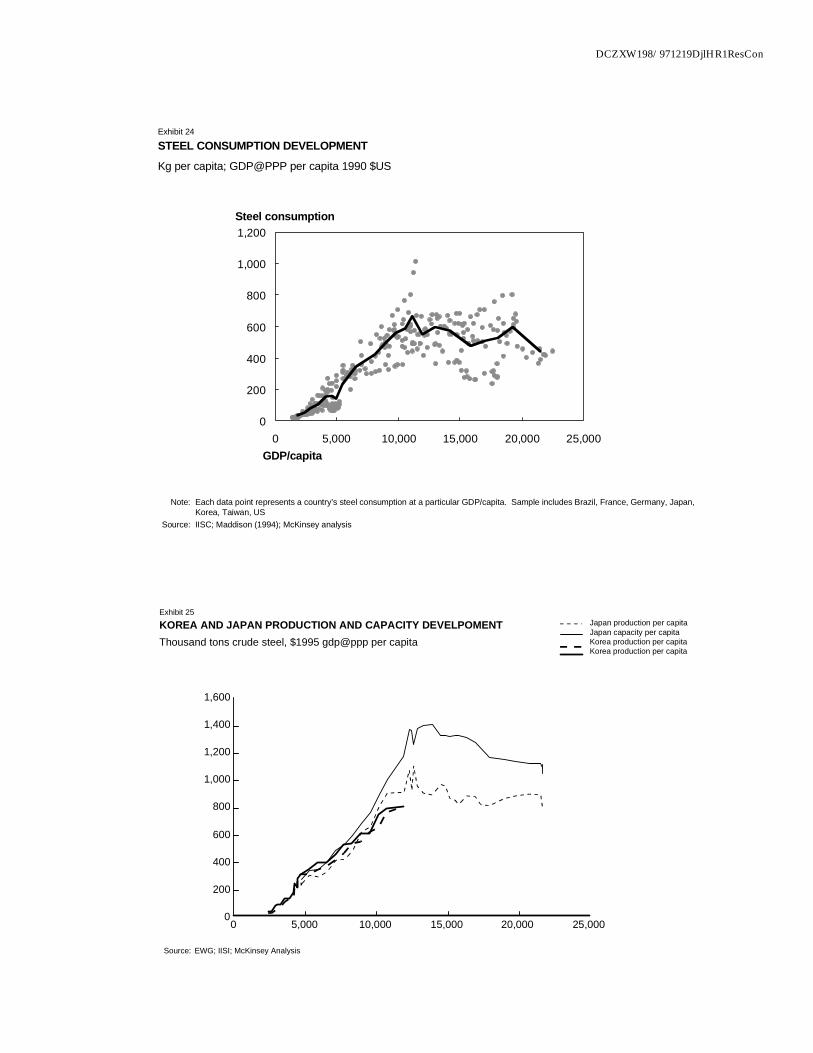
DCZXW198/971219DjlHR1ResCon
STEEL CONSUMPTION DEVELOPMENT
Note: Each data point represents a country’s steel consumption at a particular GDP/capita. Sample includes Brazil, France, Germany, Japan,Korea, Taiwan, US
Source: IISC; Maddison (1994); McKinsey analysis
Steel consumption
GDP/capita
0
200
400
600
800
1,000
1,200
0 5,000 10,000 15,000 20,000 25,000
Exhibit 24
Kg per capita; GDP@PPP per capita 1990 $US
KOREA AND JAPAN PRODUCTION AND CAPACITY DEVELPOMENTThousand tons crude steel, $1995 gdp@ppp per capita
Source: EWG; IISI; McKinsey Analysis
0
200
400
600
800
1,000
1,200
1,400
1,600
0 5,000 10,000 15,000 20,000 25,000
Japan production per capitaJapan capacity per capitaKorea production per capitaKorea production per capita
Exhibit 25
Telecommunication services industry
Executive Summary
Telecommunication services are an important part of the economy in all of the countries studied. The telecom services industry accounts for 2.1% of GDP in the US, 2.0% in Japan and Korea, and 1.3% in Brazil. It employs 0.6% of workers in the US, 0.4% in Japan, 0.3% in Korea, and 0.2% in Brazil [Exhibit 1].
In addition to a direct contribution to output and employment, the industry provides other benefits, including increased information flows, wider availability of services (e.g., home delivery, catalog shopping), and more efficient forms of business operations.1 These “spillover effects” contribute to wealth creation, suggesting that the higher the output of the telecom industry, the more valuable it is for the economy.
Korea’s network development ranks among the world’s fastest in term of speed and scope, representing a successful catch-up with the world’s advanced economies. However, in 1995, the total factor productivity in Korean telecom services was 66% of US levels (Japan at 51%; Brazil at 62%).
¶ High labor productivity. Korea’s high labor productivity (83% of US levels) shows a high ratio of access lines per employee, however that is decreased by a low ratio of call minutes per employee [Exhibit 2].
¶ Low capital productivity. Although spending per line in Korea is similar to the levels in the US and other countries, Korea’s traffic per line is only 65% of US levels [Exhibit 3], leading to low capital productivity (58% of US levels).
Korean operators and regulators can improve productivity by creating an environment that stimulates increased use of the telephone system and promotes competition. The utilization shortfall is primarily caused by the relative absence of sophisticated marketing in Korea. By making available products and services that promote call initiation and completion, introducing segmented pricing, and promoting usage through marketing, the industry could increase demand for telephone services. In addition, changes in governmental regulations would allow new entrants to effectively compete with the dominant service provider (Korea Telecom), thereby increasing competition and improving pricing.
1 For example, the operating costs of insurance companies that sell their services by telephone are up to 50% lower than those of their traditional counterparts.
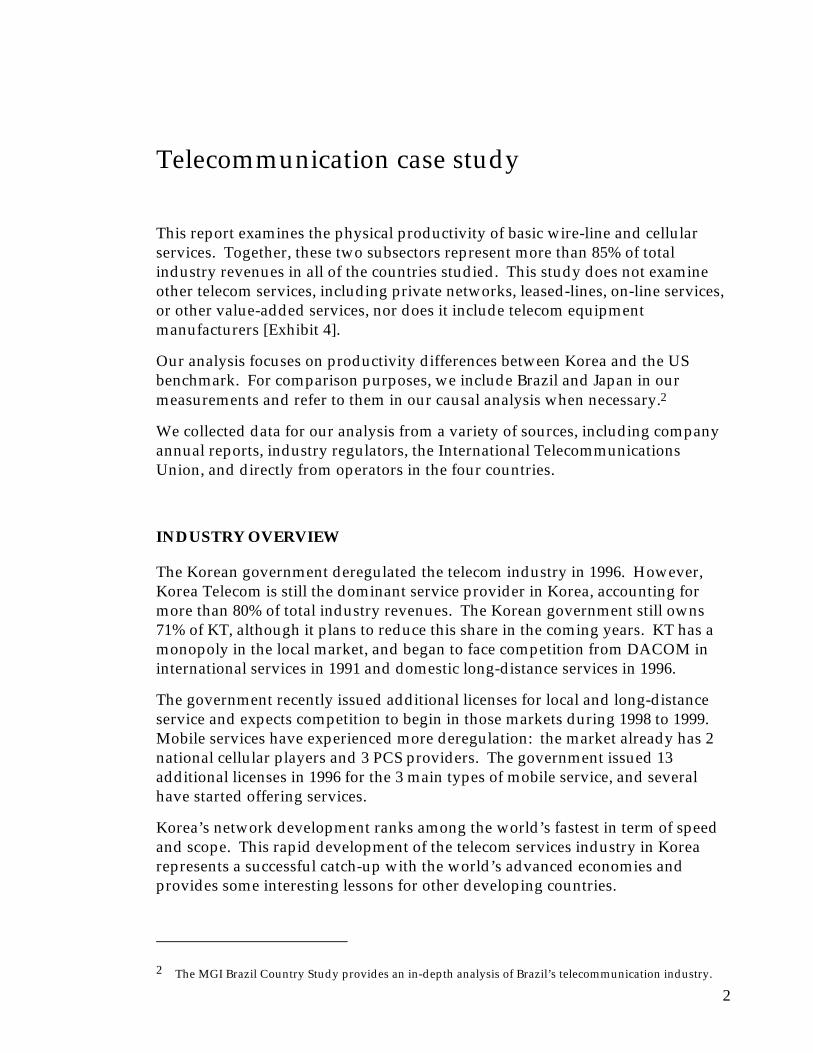
2
Telecommunication case study
This report examines the physical productivity of basic wire-line and cellular services. Together, these two subsectors represent more than 85% of total industry revenues in all of the countries studied. This study does not examine other telecom services, including private networks, leased-lines, on-line services, or other value-added services, nor does it include telecom equipment manufacturers [Exhibit 4].
Our analysis focuses on productivity differences between Korea and the US benchmark. For comparison purposes, we include Brazil and Japan in our measurements and refer to them in our causal analysis when necessary.2
We collected data for our analysis from a variety of sources, including company annual reports, industry regulators, the International Telecommunications Union, and directly from operators in the four countries.
INDUSTRY OVERVIEW
The Korean government deregulated the telecom industry in 1996. However, Korea Telecom is still the dominant service provider in Korea, accounting for more than 80% of total industry revenues. The Korean government still owns 71% of KT, although it plans to reduce this share in the coming years. KT has a monopoly in the local market, and began to face competition from DACOM in international services in 1991 and domestic long-distance services in 1996.
The government recently issued additional licenses for local and long-distance service and expects competition to begin in those markets during 1998 to 1999. Mobile services have experienced more deregulation: the market already has 2 national cellular players and 3 PCS providers. The government issued 13 additional licenses in 1996 for the 3 main types of mobile service, and several have started offering services.
Korea’s network development ranks among the world’s fastest in term of speed and scope. This rapid development of the telecom services industry in Korea represents a successful catch-up with the world’s advanced economies and provides some interesting lessons for other developing countries.
2 The MGI Brazil Country Study provides an in-depth analysis of Brazil’s telecommunication industry.
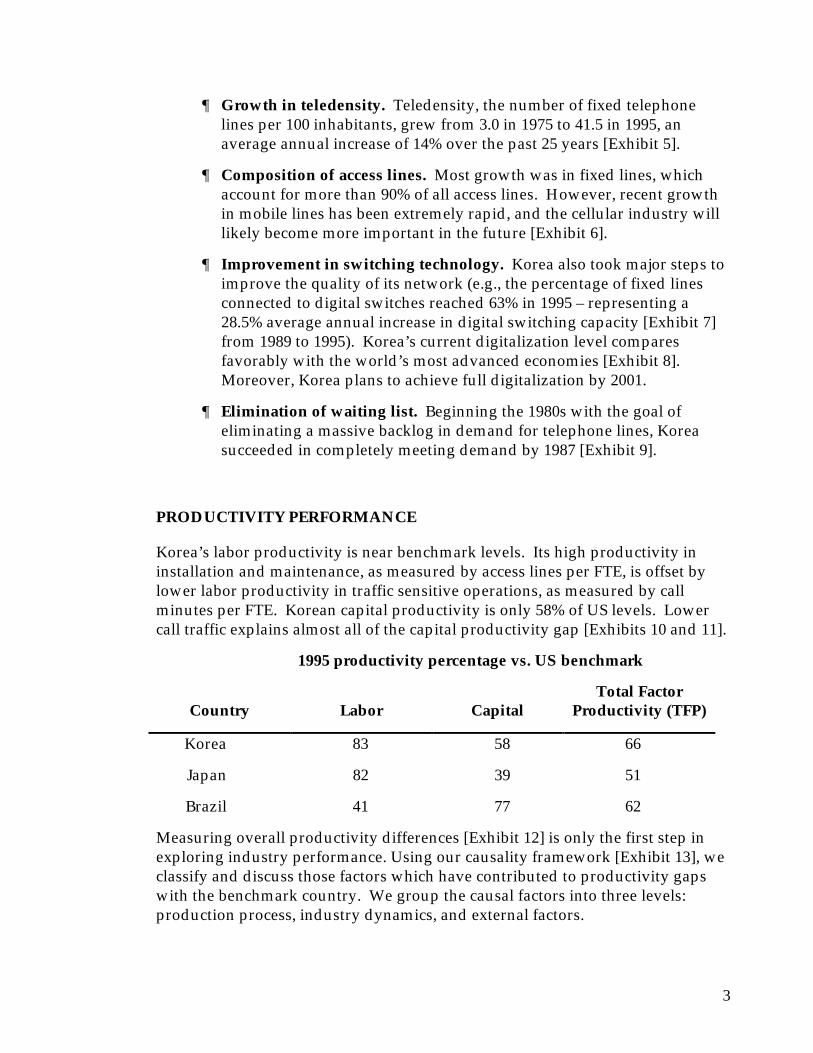
3
¶ Growth in teledensity. Teledensity, the number of fixed telephone lines per 100 inhabitants, grew from 3.0 in 1975 to 41.5 in 1995, an average annual increase of 14% over the past 25 years [Exhibit 5].
¶ Composition of access lines. Most growth was in fixed lines, which account for more than 90% of all access lines. However, recent growth in mobile lines has been extremely rapid, and the cellular industry will likely become more important in the future [Exhibit 6].
¶ Improvement in switching technology. Korea also took major steps to improve the quality of its network (e.g., the percentage of fixed lines connected to digital switches reached 63% in 1995 – representing a 28.5% average annual increase in digital switching capacity [Exhibit 7] from 1989 to 1995). Korea’s current digitalization level compares favorably with the world’s most advanced economies [Exhibit 8]. Moreover, Korea plans to achieve full digitalization by 2001.
¶ Elimination of waiting list. Beginning the 1980s with the goal of eliminating a massive backlog in demand for telephone lines, Korea succeeded in completely meeting demand by 1987 [Exhibit 9].
PRODUCTIVITY PERFORMANCE
Korea’s labor productivity is near benchmark levels. Its high productivity in installation and maintenance, as measured by access lines per FTE, is offset by lower labor productivity in traffic sensitive operations, as measured by call minutes per FTE. Korean capital productivity is only 58% of US levels. Lower call traffic explains almost all of the capital productivity gap [Exhibits 10 and 11].
1995 productivity percentage vs. US benchmark
Country
Labor
Capital
Total Factor Productivity (TFP)
Korea 83 58 66
Japan 82 39 51
Brazil 41 77 62
Measuring overall productivity differences [Exhibit 12] is only the first step in exploring industry performance. Using our causality framework [Exhibit 13], we classify and discuss those factors which have contributed to productivity gaps with the benchmark country. We group the causal factors into three levels: production process, industry dynamics, and external factors.
4
METHODOLOGY
The telecom services industry differs somewhat from other industries in that it has two primary outputs: access to the network and telephone calls. Labor creates and maintains the network that allows subscribers to make telephone calls. Once capital is installed, only minimal additional labor is required to generate the industry’s output, or network call traffic [Exhibit 14]. This view of the production process guided our measurement of labor and capital productivity, which we combined into a total factor productivity (TFP) framework3 [Exhibit 15]. Output The number of call minutes carried on the network was our standard output measure across countries. We did not distinguish local from long-distance calls and allocated international call minutes to the originating country only.
Labor input Our labor input measure, full-time equivalent employees (FTE), includes all employees and counts part-time employees as one-half. In those countries where industry outsourcing was significant (the US and Brazil), we adjust our employment figures to estimate the impact of outsourcing. In addition, we adjust our labor input measures to reflect differences in working hours across countries. In Korea, Japan, and the US, we use the most detailed measure of working hours available for the industry. In Brazil, where data on working hours was available only at the aggregate level, we use an index of total economy hours in the US and Brazil and link this estimate to the sector-specific figures used in the other comparison countries. Labor Productivity Our labor productivity measure is a weighted average of the productivity in the two major labor activities: installing the network and providing customer service, and operating and maintaining the network. The first set of activities is sensitive to the size of the network (e.g., the number of access lines per employee4), while the second set is sensitive to the volume of traffic carried on the network (e.g., call minutes per employee). We weight each function based on the share of total labor costs that it represents [Exhibit 16].
3 We tested our results using a wide variety of assumptions, including different income shares and different functional labor splits. We did not observe significant changes in relative performance between countries under the different scenarios.
4 We use full-time equivalent employees (FTE), counting part-time employees as one half of a full-time employee, and adjust the total FTE figure to reflect cross-country differences in working hours.
5
Capital Productivity We measure capital services by building capital stock estimates from annual capital expenditure data, assuming a sudden-death depreciation schedule. We then apply service-life estimates to get flow measures using standardized FCC estimates for economic service life across countries. Our capital productivity measure is the ratio of physical output (call minutes)5 to capital inputs (network capital services).
In Korea and Japan, we concluded that call quality was sufficiently close to US levels that a call quality adjustment was unnecessary. In Brazil, however, we observed significant quality differences relative to the US. We use network digitalization as a proxy for quality, and adjust Brazil’s capital inputs to reflect the additional investment required to reach US digitalization levels. Total Factor Productivity (TFP) TFP is a weighted average of capital and labor productivity. Capital represents the largest part of value added in the industry and is its largest cost component, ranging from 60-68% of value added. Because capital has a larger share of value added in all three economies, capital productivity figures more prominently in the TFP calculation. The capital intensive, high fixed cost nature of the industry creates high entry barriers and has led to the natural monopoly regulation that arose in all the countries studied.
Production process
We split our analysis of differences at the production process level into two parts; first, we examine causes for the differences in capital productivity and then in labor productivity. We make this capital/labor distinction only for explanation purposes; in practice, capital and labor productivity are interdependent and together yield TFP.
Capital productivity differences Although its labor productivity is near US levels, Korea’s telecommunication industry still has a significant capital productivity gap.6
Call traffic. The primary cause of this capital productivity difference is network capacity utilization (e.g., call traffic), which explains almost all of the capital productivity gap. Many factors influence the demand for and use of telecom services, and isolating their impact is empirically difficult. Our analyses,
5 Our physical output measure does not require PPPs. To convert foreign investment data to US$, we use investment goods PPPs from the OECD and the United Nations for equipment, civil engineering, and non-residential structures.
6 Brazil’s “high” capital productivity gap results largely from its failure to meet demand for telecom services, as witnessed by the country’s low penetration level (7.5 lines per 100 people) and the size of the waiting list (more than 1 million people in 1990). If Brazil met this excess demand and raised its penetration levels, usage (and thus capital productivity) would fall to levels similar to those observed in other countries besides the US. For a detailed discussion, refer to the MGI Brazil Country Study.
6
however, suggest that the utilization shortfall is primarily caused by the relative absence of sophisticated marketing in Korea: availability of segmented pricing plans, the offering of products and services that promote call initiation and completion, and the low level of direct consumer advertising/marketing to promote usage.
¶ Pricing. Price plays an important role in determining the demand for telephone services. Isolating the impact of pricing changes on demand, however, can be difficult, due to the many other factors that influence demand. Econometric research suggests that demand for local services is fairly inelastic, whereas demand for national and international calls is relatively price sensitive. Although most telephone subscribers in the US have long had the option of flat-rate local telephone service, the availability of flat-rate billing options does not appear to explain fully the utilization gap we observed [Exhibit 17]. In addition to flat-rate local billing, US firms offer a wider variety of pricing and billing options for long-distance services as well. These plans, such as volume discounts and calling-circle discounts (e.g., Friends & Family) are aimed at segmenting customers into appropriate usage groups and providing incentives to increase usage.
¶ Availability of products and services. Differences in the availability of optional calling services may also explain part of the utilization gap. These services, such as call waiting, call forwarding, and voice-mail, increase the functionality of telephone service and can lead to higher rates of call initiation and completion. If priced and promoted effectively, they can also lead to increased revenues for operators.
• US consumers have a wider range of calling services options than their foreign counterparts [Exhibit 18], and they subscribe to these services more often than users in other countries [Exhibit 19].
• In addition to differences in residential services, we observed cross-country differences in services available to business users. In general, US providers are more focused on offering high quality, highly functional business services than their counterparts in other countries (e.g., the use of toll-free telephone numbers7, an important tool for business, is significantly higher in the US [Exhibit 20]). In addition, although call-traffic data split by residential and business users were unavailable, interviews suggest that business usage in the
7 Toll-free numbers automatically reverse the billing charges to the receiving party. Businesses typically use these numbers to allow customers to contact them free of charge. In the US, toll-free numbers are also available to residential users.
7
US is higher than in other countries; we did observe a sizeable gap in the level of business subscribers [Exhibit 21].
¶ Marketing. US service providers devote more resources to promoting telephone use and optional services than their overseas counterparts. AT&T’s “Reach Out and Touch Someone” campaign, MCI’s “Friends & Family,” and RBOC efforts to promote usage and additional services are all examples of telephone marketing in the US. In Korea, by contrast, there has been little marketing activity. In fact, during the 1980s, when Korea was focused on expanding its network to meet demand, KT actually encouraged low usage: “Tonghwa nun kandan hee” (“Call Brief”) was one of its slogans. We also found no evidence of efforts to promote the use of optional call services. Financial analysis and interviews with industry experts confirm that such activities are comparatively rare in Korea. In 1995, for example, US telephone advertising expenses per capita were 5 times greater than in Japan and over 20 times greater than in Korea [Exhibit 22].
Supplier relationships. A secondary cause of the capital productivity gap is driven by supplier relationships. Korean operators worked closely with domestic equipment manufacturers to develop advanced switching technology. Much of this close cooperation was induced by the government, which viewed the development of domestic switching technology as a means to reduce dependence on foreign equipment makers and to provide a source of exports in the future. Korea’s efforts in this area succeeded in developing a high quality, domestically-designed switch, which is widely used in the Korean network, and in creating a new export product (e.g., the Philippines has used TDX switches in its efforts to develop its telecom infrastructure).
As part of the drive to develop domestic switching technology, however, Korea may have taken steps that led to higher capital costs. We observed that Korean investment per line was 112% of US levels. Although many factors contribute to the difference, equipment costs play an important role. Although KT initially used foreign switches (some of which were produced domestically under license), once Korean manufacturers developed the TDX switch, the government took steps to limit foreign competition, including requiring KT to source domestically and imposing restriction on foreign equipment imports. Detailed data on switch prices in Korea were not available, although industry estimates suggest that Korean prices were 10-20% higher than those in the US.
Labor productivity differences Korea’s labor productivity is relatively high, at 83% of US levels. At first glance, this result is surprising given Korea’s low labor productivity at the aggregate level and in the other industries we studied. A closer look, however, explains how the effective use of new technology helped Korea to achieve near-best-
8
practice labor productivity, providing an interesting contrast to Brazil’s relatively less successful efforts at telecom development.
The availability and effective use of new digital switching technology8 played a key role in Korea’s ability to deploy its network rapidly while maintaining low and stable employment levels relative to the US [Exhibit 23]. Korea expanded its teledensity (fixed lines per 100 people) from 27 to 41 in just 7 years, twice as fast as Japan and three times as fast as the US during comparable periods of network development. During this period, Korean network digitalization grew from 40-63%. By contrast, during comparable periods of network development, the US had no digital switching and only 25% of Japan’s switches were digital. During the period, US employment rose 50% compared to a 16% increase in Korea.
Moreover, as the US and Japan increased their digitalization levels, their employment levels dropped significantly. Although other external factors, notably deregulation in the US and Japan, undoubtedly contributed to this decline, interviews with service providers and telecommunications experts have confirmed that digital switching technology – if employed properly, and in conjunction with good management – can have significant labor-saving potential. While Korea appears to have captured these benefits as it adopted digital switching technology during its network roll-out, it failed to fully capture the benefits possible through reduction of the workforce (Korea’s employment levels have remained constant while the US and Japan dropped dramatically).
We did not observe any labor productivity benefits owing to Korea’s high population density (30% of the Korean population lives in the Seoul metropolitan area). Previous MGI research also found no correlation between network density and labor productivity among US RBOCs.
Organization of functions and tasks. When we adjust Korean labor inputs to reflect the fact that Korean telecommunication employees work longer hours than their US counterparts, labor productivity in Korea falls from 100% of US levels to only 83% – this indicates that longer hours and weekend work account for almost all of Korea’s labor productivity gap relative to the US.
The Korean tradition of working on Saturday accounts for most of the difference in working hours. Although a 6-day work week may have been appropriate during the industry’s rapid growth stage, interviews suggest that Saturday work is no longer necessary and that operators could shift to a 5-day week without having an adverse impact on productivity or service quality.9
8 Although detailed data on the type and generation of digital equipment in the Korean network are not publicly available, it is worth noting that not all digital switches are the same. Interviews in the US and Korea suggest that the switches, and the software that runs them, are more advanced in the US than in Korea. Although this difference did not lead to any observable productivity differences in our analysis, technological differences may become an issue in the future.
9 Telephone operators and essential maintenance personnel work in shifts providing 24-hour service.
9
In addition, interviews revealed that many employees work longer than expected, apparently due to informal signals from managers that encourage workers to stay as late as their supervisors; because most employees are salaried, managers have little incentive to discourage the practice.
Industry dynamics
In the countries included in this study, the telecom services industry faces vastly different competitive and regulatory environments [Exhibits 24 and 25]. However, competition in Korea only plays a secondary role in causing Korea’s lower TFP. In Korea, Japan, and Brazil, telecom services are still highly concentrated, with the dominant player controlling 70-90% of the market. By contrast, the US is far less concentrated, although local services are still dominated by regional monopolies despite recent deregulation [Exhibit 26].
The US deregulated its long-distance market in 1984. By contrast, Korea’s national long-distance market remained closed to competition until 1996. Moreover, even though the long-distance market is opening to competition, new entrants still face significant obstacles to full competition, including pricing restrictions and a lack of equal access to customers.10
Interviews suggest that despite deregulation efforts, Korea still views the incumbent as a national asset, suggesting that although some formal barriers to competition have been removed, competitive intensity is still restrained by policies favoring the incumbent. In the US, where telephone companies have a history of private ownership, regulators have less incentive to favor incumbent operators which has led to a highly competitive market.
Despite this lack of competitive pressure, Korea’s relatively late economic development [Exhibit 27] may have allowed it to take advantage of best practices and new technologies.11 Korea was able to engage in extensive knowledge and technology transfers with the more developed countries, an advantage the first movers simply did not have. In addition, interviews with Korean service providers indicate that they actively sought telecom experts from the more advanced economies and attempted to learn from their experiences.
Although new technologies played an important role in the successful development of Korea’s telecommunication industry, this success was not guaranteed. In theory, other latecomers should have had equal access to the new technologies. In practice, however, we observe very different patterns across
10 Korean subscribers who wish to use non-KT services must still dial a special access code to reach their preferred carrier. In the US, subscribers can pre-select their long-distance carrier, and need only dial “1” and the telephone number for long-distance service (“1+” access). Equal access to long-distance service helps level the playing field for new entrants and increases competitive intensity by making it easier for customers to switch carriers.
11 Although the advantage may be offset by more developed markets and usage patterns in the US.
10
countries. Comparisons of our primary labor productivity measures (access lines per employee) [Exhibit 28] suggest that catching up and keeping up are not automatic, but result from a combination of latecomer technology advantages and effective operational management.
External factors
Although differences in managerial conduct at the production process level explain the observed productivity gap, these differences do not tell the entire story. External factors can influence what managers do at the production process level. In this section, we examine the external factors that play a significant role in explaining observed productivity differences.
Economic performance The strong growth of the Korean economy provided the impetus for telecom development. High and constant rates of growth also allowed Korea to develop its infrastructure in a more controlled manner than in Brazil, where pervasive inflation and unpredictable demand led to less efficient network development. Korea’s nationwide approach stands in contrast to Brazil’s system of 27 regional operators, which further fragmented telecom development. These factors made it difficult for Brazil’s suppliers to accurately predict demand, and the industry experienced periods of over- and under-supply coupled with large price swings.
Product-market regulations Early deregulation of long-distance services in the US led to greater competition and may have stimulated productivity improvements. US deregulation began in 1984, with the breakup of AT&T into one long-distance and seven local carriers. This breakup led to the creation of a competitive long-distance market in the US, which explains part of the gap in telephone usage. However, local services in the US were monopolized until recently, therefore we do not believe differences in local competition contributed to the observed productivity differences.
By contrast, Korean regulators limited competition by sustaining Korea Telecom’s local monopoly through pricing and other regulations, and, in those markets that it did deregulate (long distance and international), failing to create equal competitive opportunities for new entrants. For example, government intervention on pricing decisions limited the ability of new entrants to compete against the incumbent on price, and a lack of equal access to subscribers further hampered their efforts to compete.
Differences in the roles played by government regulators and operators help explain why Korean development efforts were more successful than Brazil’s. Korea’s government appears to have had little negative impact and may have helped facilitate the industry’s rapid and successful development. In contrast, Brazil’s government involvement appears responsible for much of the industry’s poor performance. Brazil’s regulatory structure led to industry fragmentation
11
and may have contributed to Brazil’s less coordinated network deployment. A failure to conduct performance reviews and an apparent lack of coordination with domestic equipment suppliers (coupled with the requirement that Telebras source from those suppliers) may also help to explain the country’s poor labor productivity performance.
Up/downstream industries Up-stream industries, such as answering machines, credit cards (which require telephone authorization), and telephone-based business activity (e.g., telemarketing, insurance sales, and catalog stores), all increase demand for telephone services and help lead to higher utilization levels in the US. Although linking the penetration of such services directly with calling patterns is empirically difficult, the higher incidence of such industries in the US compared to Japan or Korea suggests that they may also play a role in explaining the utilization gap [Exhibits 29 and 30].
Corporate governance In Korea, the primary objective for telecom management was to increase network access and eliminate the waiting list, thus little effort was made to promote network use. Indeed, as we saw earlier, there were even some attempts to discourage high usage during the network expansion phase. In contrast, the corporate governance structure in the US appears to have encouraged managers to promote higher network use.12 The ostensible objective for US managers was to increase shareholder value without creating regulatory problems. Given a fixed rate of return, the primary lever to increase value is to increase the invested capital base. To justify higher capital spending to regulators, managers had the incentive to stimulate demand, leading to lower average prices per call and greater efforts to stimulate usage.
Cultural differences Finally, although difficult to quantify, cultural differences could play a role in network utilization differences (e.g., higher mobility in the US, coupled with a large area in which people speak a common language, may lead to higher usage of the network). Culture’s impact on behavior, however, changes over time. Thus, even if current cultural differences explain part of the utilization gap, we should not assume that they preclude future usage increases. For example, current business practices in Korea favor in-person discussions and transactions to telephone conversations. This may be as much due to the “Korean way” of doing business as to the fact that, historically, the telephone was not an effective or cost-efficient form of interaction. Service providers can help to change this perception through effective marketing (e.g., directory assistance, yellow pages, voice mail, conference calling, and other optional services).
12 Previous MGI research in the telecom industry found that differences in corporate governance structures created different management incentives, leading to observed differences in network usage. (e.g., in Germany, multiple and competing objectives for telephone operators – universal service, high quality infrastructure, financial support for the postal system – led to lower productivity performance.
12
Differences in income levels may also explain part of the gap. As incomes rise, people have more money to spend on telephone services and the higher income levels in the US may explain part of that country’s higher usage. Such differences do not explain all of the gap, however, since despite its relatively high income levels, Japan’s network usage is still far below US levels. Japan’s experience suggests that rising income levels alone will not allow Korea to close its capital productivity gap; effective regulation by government and promotion of use by operators will also be needed.
Finally, the US developed its telephone network more than a generation before the world’s other advanced economies. As a result, calling patterns in the US may be more mature than those in other countries [Exhibit 31]. Econometric research also suggests the existence of positive network externalities (e.g., the value of the network to subscribers – and the likelihood they will use it – increases with the size of the network). Thus, in addition to having more experience with telephone services, US subscribers may demand comparatively more telephone service due to that country’s larger network.
CHALLENGES AND IMPLICATIONS
Our analysis suggests that both operators and regulators can help create an environment that promotes competition and stimulates increased use of the telephone system, thereby improving the performance of Korea’s telecom industry. Coupled with effective management, such efforts will help Korea close its productivity gap. Next, we discuss some of the implications of our results, focusing separately on challenges for the government, and then for the industry and its operators.
Government
Telecom services play an important role in advanced economies. As a result, they have long been the subject of heavy government regulation. New technologies are changing the industry, however, and many governments are examining their roles in light of these new developments. To improve productivity in the industry, Korean regulators should reduce their direct involvement, focusing instead on creating a strong competitive framework and playing the role of impartial referee for the industry.
Now that Korea has met demand and developed its infrastructure, the remaining challenge appears to be stimulating increased network usage to improve productivity. In addition, Korean regulators also face an array of new challenges, including the introduction of domestic and foreign competition and the emergence of new technologies. Experience from other countries suggests
13
that the best way for the government to meet these challenges is to limit its direct involvement, and create a regulatory environment that promotes competition.
Remove pricing regulations Although the government has taken steps to increase competition, current regulations are preventing real competition to emerge (e.g., the existence of anti-competitive regulations requiring new entrants of a certain size to price within a certain band of Korea Telecom’s price). This one regulation has prevented the price competition that has driven down long-distance prices in the US to levels unimaginable in the past (e.g., 5 cents/minute).
Ensure an equal playing field While the new telecom law provides a general outline for new entrants, much of the regulatory details required to implement the laws are still in the process of being written. The government must address three critical issues to ensure competition in Korea:
¶ Fair interconnect rates. The fees which entrants have to pay to gain access to the incumbent’s established network are critical in determining the level of competition. Setting these rates in a fair manner (vs. setting artificially high rates to protect the incumbent) will be key driver of the resulting level of competition in Korea.
¶ Equal access to the network. In countries where regulations require consumers to dial a longer set of numbers to gain access (e.g., more than 3 digits for long-distance calls), adoption of services from new entrants is always thwarted.13 Ensuring that new entrants have equal access will be critical.
¶ Number portability. As Korea moves to pre-subscribed service providers (e.g., customers pre-select which carrier will provide telephony service), ensuring minimal switching hassles for the consumer will be critical. Without number portability (consumer keeps their existing phone number regardless of which carrier is selected), the barrier to switching can be surprisingly high. Ensuring number portability will be a key success factor in promoting greater competition in Korea.
Industry
To improve productivity, service providers should focus on increasing usage. Raising usage levels can also lead to improved industry financial performance, as well as benefits to the economy as a whole. Although not all increased telephone usage is necessarily productive (e.g., more teenagers talking on the phone), most
13 Domestic long distance players have equal access as subscribers can preregister for a preferred operator.
14
of the higher usage in the US appears to be the result of productive telephone usage, such as toll-free services and business communication, not frivolous phone calls. Moreover, we did not find the average length of a call in the US to be significantly higher than in the other countries, suggesting long calls by teenagers do not explain the usage gap.
Provide and promote expanded services Korean operators should devote more resources to creating and marketing services that increase usage and enhance telephone functionality. Below, we describe several areas in which increased activity could lead to higher call volume and improved productivity.
Increase marketing activities. Interviews and analysis revealed that market research by Korean service providers is limited, and customer segmentation is rare. Devoting more resources to collecting customer information and using that information to improve customer service will help increase usage and improve productivity. Not only do Korean operators spend less on advertising than their US counterparts, but in some cases they also lack the basic data needed to conduct effective marketing. Better market information will help Korean operators increase network utilization through two targeted efforts:
¶ Creation of custom calling plans, such as those offered by US long-distance providers, which help generate usage by providing specific customer segments with the pricing approaches that best suit their calling needs (e.g., unlimited local calls, affinity calling groups).
¶ Promotion of optional calling services, especially those that can increase call initiation and completion. The network is only used when a call is completed, thus adoption of optional services such as call waiting and voicemail/answering machines increases the completion rate of calls that currently go unanswered.
Commercial telephone use. Telephone operators in Korea should take advantage of opportunities to promote telephone-based commercial activity, which can boost industry productivity by increasing usage and reducing of transaction inefficiencies in other parts of the economy. We observed a number of such services in the US that are not widely available in Korea and that could help raise usage levels:
¶ “Yellow Pages” and other business directories allow businesses and consumers to find potential transaction partners. By promoting the use of such information services, operators can increase usage of the network, and reduce the transaction costs associated with many activities. A recent US advertising campaign, “Phone First,” emphasized the potential time savings that telephone use can generate (calling ahead to check on the availability of a particular product, for example, can save a wasted trip to the store). In addition, Korean operators can help transform the Yellow Pages from a mere listing of
15
companies by subject to an advertising tool for businesses and a way to increase telephone usage, similar to the US model.
¶ Mail order/telemarketing services create jobs and increase convenience and service, a benefit with particular importance in a country with long-working hours and a 6-day work week. Operators should work with telephone-based businesses to foster their development and promote increased usage.
¶ Telecommuting allows workers to conduct their business from home by linking them to their offices through telecom channels (e.g., telephone, fax, Internet). By promoting telecommuting, operators could simultaneously increase network usage and help create new employment opportunities by allowing part-time employees to work from home.
Avoid unnecessary addition of network capacity A large number of parties are pursuing opportunities to participate in the Korean telecom market and are exploring options for adding additional capacity to the system – new PCs and wireless networks, metropolitan access networks (MANs), new dedicated fiber optic lines, new switches for switch-based reselling, upgrades to cable TV networks for voice telephony and internet-based telecom services, etc. The critical challenge for these companies and the overall telecom market is to ensure that any new network build-out will be sufficiently utilized and that the investments required to put in place these networks will earn a sufficient return.
With passage of the new telecommunications law in late 1997, the marketplace is now more open for new entrants and competition. Chaebols and other companies are exploring opportunities in switch-based and switchless reselling, dedicated networks for voice and data communication, etc. These companies should first explore opportunities to resell telecom capacity using existing network capacity – this will provide access to a new business with minimal upfront investments, along with the added benefit of increasing utilization of the capacity already in place. New entrants should not assume that adding new capacity (e.g., dedicated fiber optic cables, MANs) is the preferred entry approach. Furthermore, new entrants intent on adding capacity should rigorously review the likely returns on the investment required to install the network and ensure that steps are taken to earn an adequate return.
The recent licensing of 3 new PCS players has led to the significant build-out of new wireless capacity – that in some sense is duplicative with the traditional cellular telephony network (which is already using the new digital CDMA standard). To avoid over-building and low capacity utilization, these companies should develop an approach to share the networks that each has built rather than put in place completely duplicative networks (Hansol and Freetol agreed to share future build-up).
16
Korea is also pursuing the deployment of a second local loop (e.g., phone lines to individual homes/businesses). This approach has proven economically unattractive in the few places around the world where it has been deployed (e.g., Australia, UK). Before proceeding, Korea should reexamine the economics of this second local loop to determine if the returns will justify the investments.
Korean telecom firms are at a crossroad that will determine the overall industry profitability for decades to come. Careful assessment of new capacity additions at this point is required to prevent further deterioration of the industry’s capital productivity and its long-term profitability.
Focus on continuous improvement Finally, although our analysis does not reveal a labor productivity gap in Korea, improvements in the organization and functions and tasks may provide an additional lever to increase productivity.
Despite providing the benchmark for telecom, the US industry is not yet fully competitive. Experts expect that deregulation will bring increased pressures on US operators and that these pressures could lead to improved productivity (e.g., recent McKinsey analysis in the US suggests that reorganizing functions and tasks can lead to labor productivity improvements and capital cost reductions, in some cases of up to 20%). The emergence of new technologies also increases the importance of keeping a close eye on capital costs. Although we observed only a small level of overinvestment in the network (compared to the US), capital costs can rise rapidly. Korea Telecom’s recent decision to abandon its “Fiber to the Home” plan and replace it with a more economic “Fiber to the Curb” plan is an encouraging sign that managers are focusing on efficient capital spending.
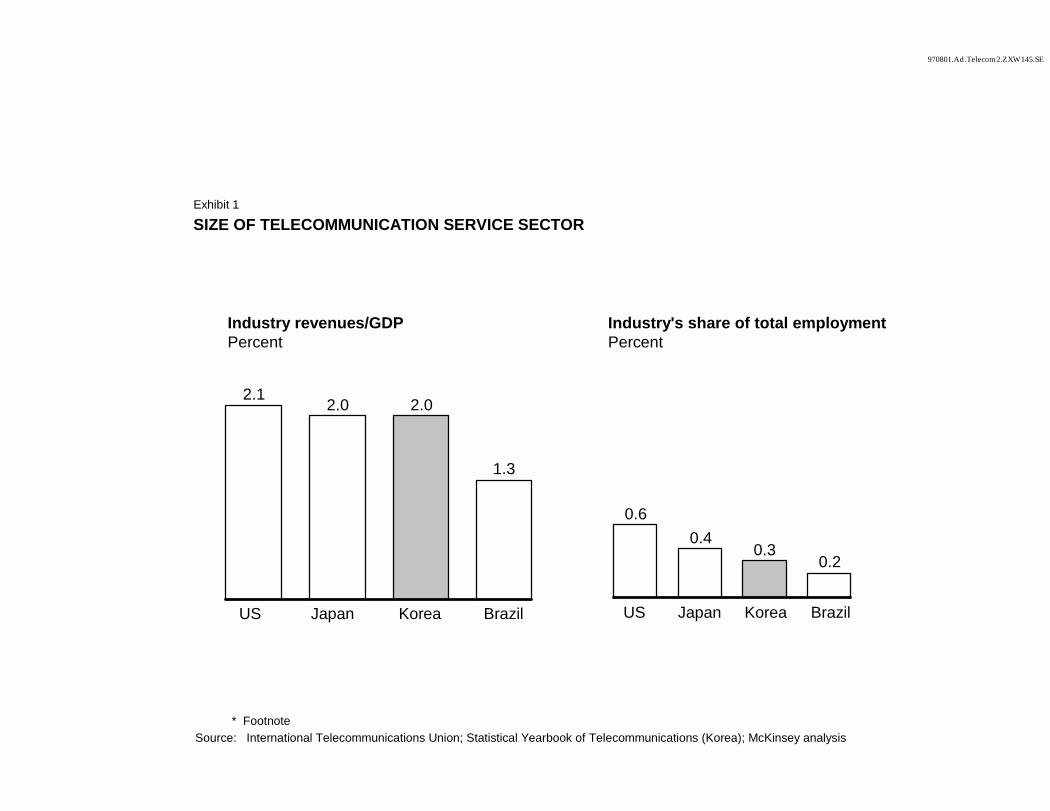
* FootnoteSource: International Telecommunications Union; Statistical Yearbook of Telecommunications (Korea); McKinsey analysis
970801.Ad.Telecom2.ZXW145.SE
SIZE OF TELECOMMUNICATION SERVICE SECTOR
2.1 2.0 2.0
1.3
US Japan Korea Brazil
0.60.4
0.30.2
US Japan Korea Brazil
Industry revenues/GDPPercent
Industry's share of total employmentPercent
Exhibit 1
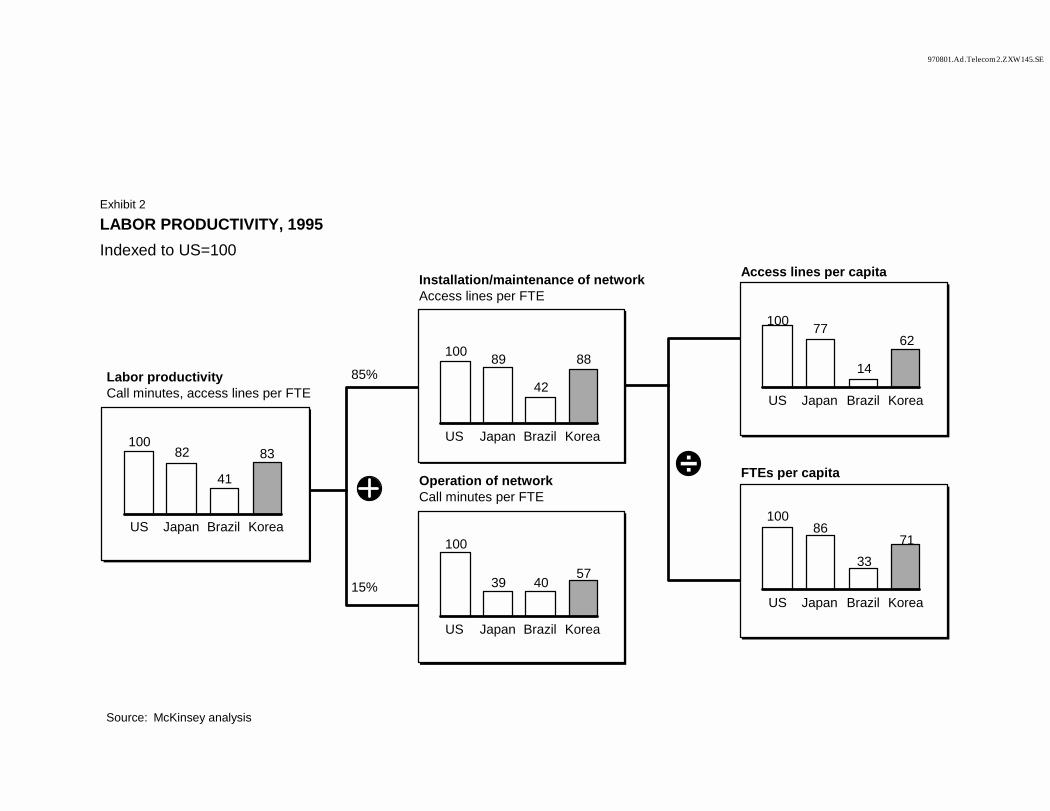
970801.Ad.Telecom2.ZXW145.SE
LABOR PRODUCTIVITY, 1995Indexed to US=100
Source: McKinsey analysis
10082
41
83
US Japan Brazil Korea
85%
15%
100 89
42
88
US Japan Brazil Korea
100
39 4057
US Japan Brazil Korea
Installation/maintenance of networkAccess lines per FTE
Operation of networkCall minutes per FTE
Labor productivityCall minutes, access lines per FTE
100 77
14
62
US Japan Brazil Korea
10086
3371
US Japan Brazil Korea
Access lines per capita
FTEs per capita
Exhibit 2
÷
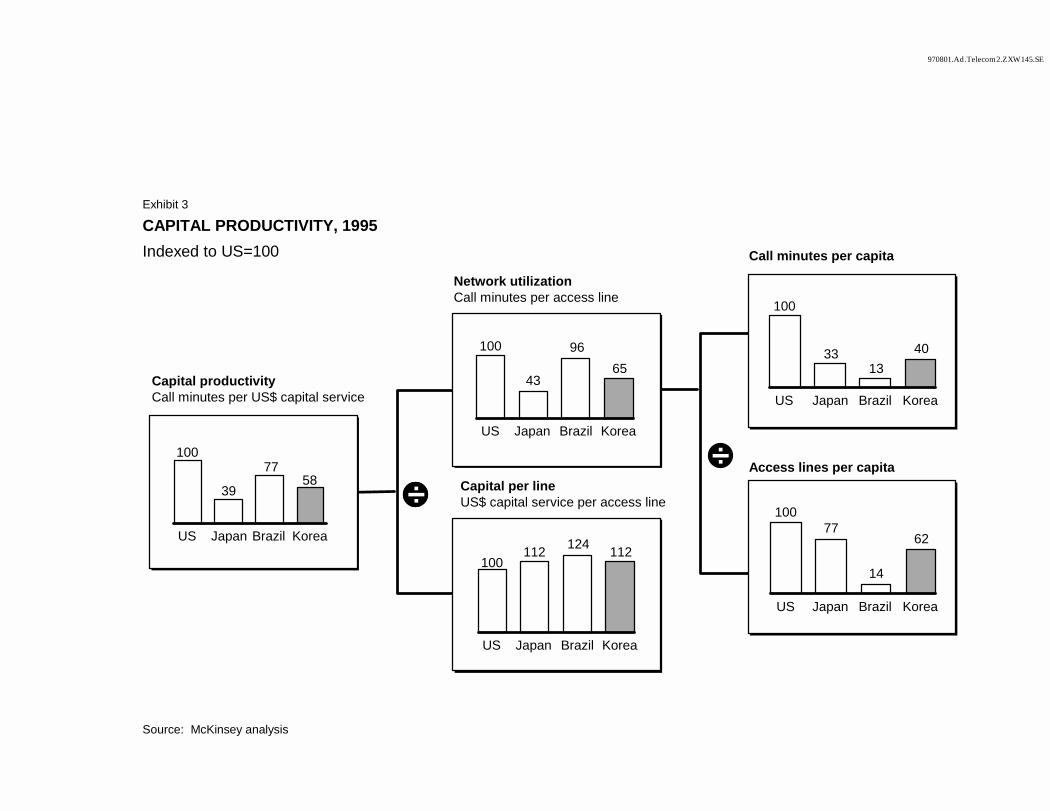
970801.Ad.Telecom2.ZXW145.SE
CAPITAL PRODUCTIVITY, 1995Indexed to US=100
Source: McKinsey analysis
100
43
9665
US Japan Brazil Korea
100112 124 112
US Japan Brazil Korea
Network utilizationCall minutes per access line
Capital per lineUS$ capital service per access line
Capital productivityCall minutes per US$ capital service
US Japan Brazil Korea
100
39
7758
100
3313
40
US Japan Brazil Korea
Call minutes per capita
Access lines per capita
10077
14
62
US Japan Brazil Korea
Exhibit 3
÷÷
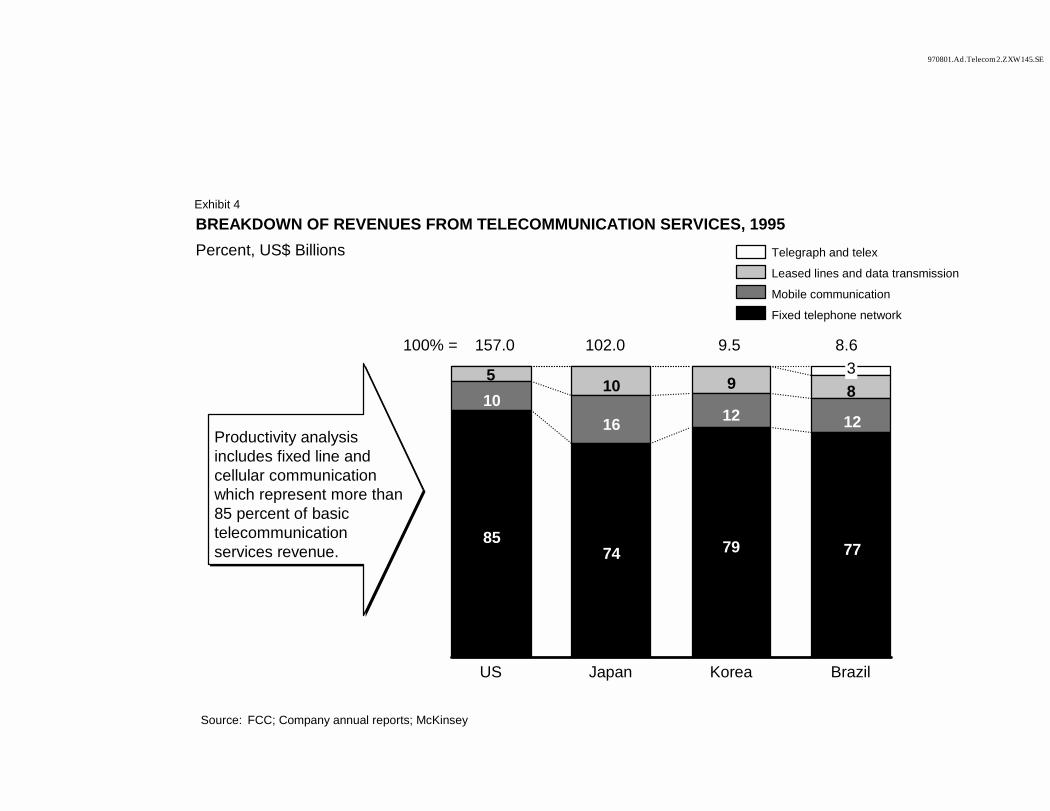
970801.Ad.Telecom2.ZXW145.SE
Source: FCC; Company annual reports; McKinsey
BREAKDOWN OF REVENUES FROM TELECOMMUNICATION SERVICES, 1995 Percent, US$ Billions
Productivity analysis includes fixed line and cellular communication which represent more than 85 percent of basic telecommunication services revenue.
100% = 157.0 102.0 9.5 8.6
5 10 9 81016 12 12
8574 79 77
US Japan Korea Brazil
Exhibit 4
Telegraph and telex
Leased lines and data transmission
Mobile communication
Fixed telephone network
3
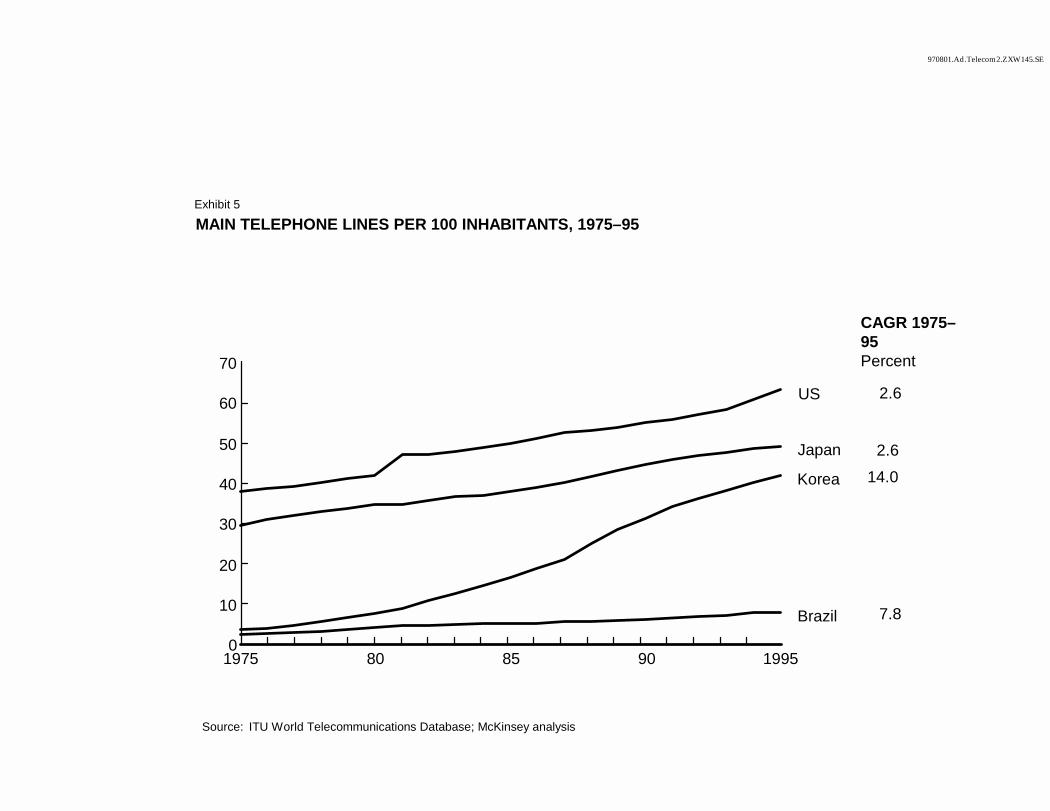
970801.Ad.Telecom2.ZXW145.SE
MAIN TELEPHONE LINES PER 100 INHABITANTS, 1975–95
Source: ITU World Telecommunications Database; McKinsey analysis
CAGR 1975–95Percent
2.6
0
10
20
30
40
50
60
70
Brazil
Korea
Japan
US
1975 80 85 90 1995
7.8
2.614.0
Exhibit 5
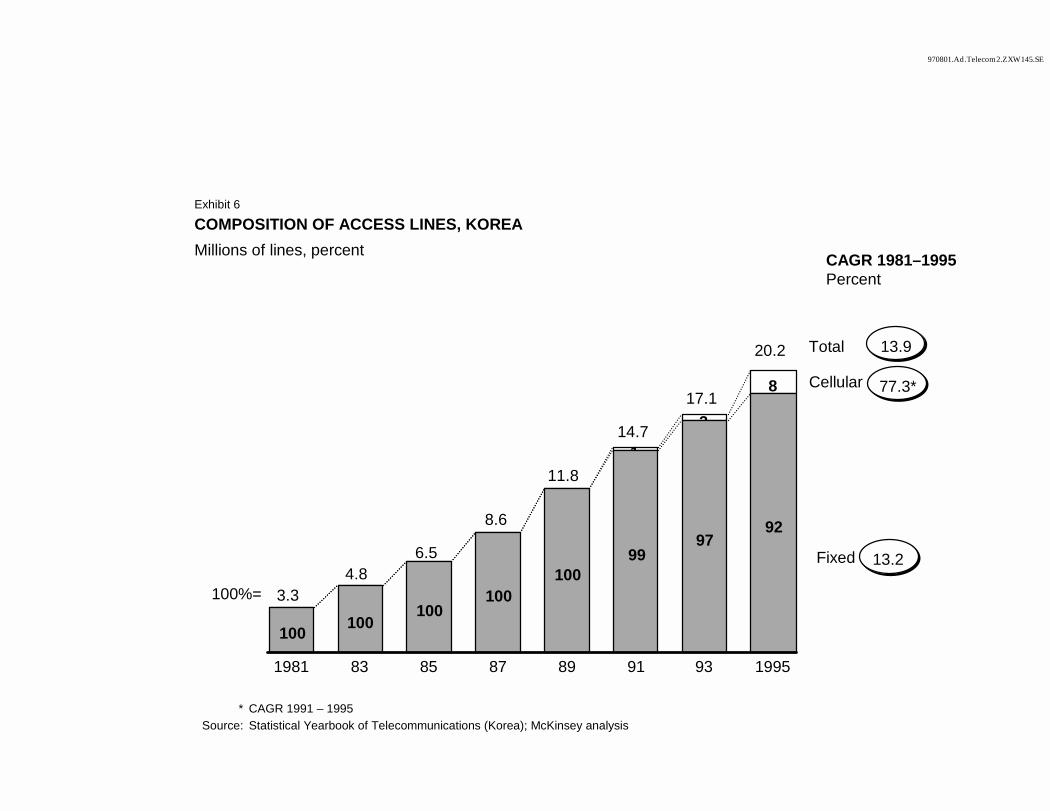
970801.Ad.Telecom2.ZXW145.SE
COMPOSITION OF ACCESS LINES, KOREAMillions of lines, percent
* CAGR 1991 – 1995Source: Statistical Yearbook of Telecommunications (Korea); McKinsey analysis
CAGR 1981–1995Percent
13.9
13.2
77.3*Cellular
Fixed
Total
1
3
8
100 100100
100100
9997
92
1981 83 85 87 89 91 93 1995
3.34.8
6.5
8.6
11.8
14.7
17.1
20.2
100%=
Exhibit 6
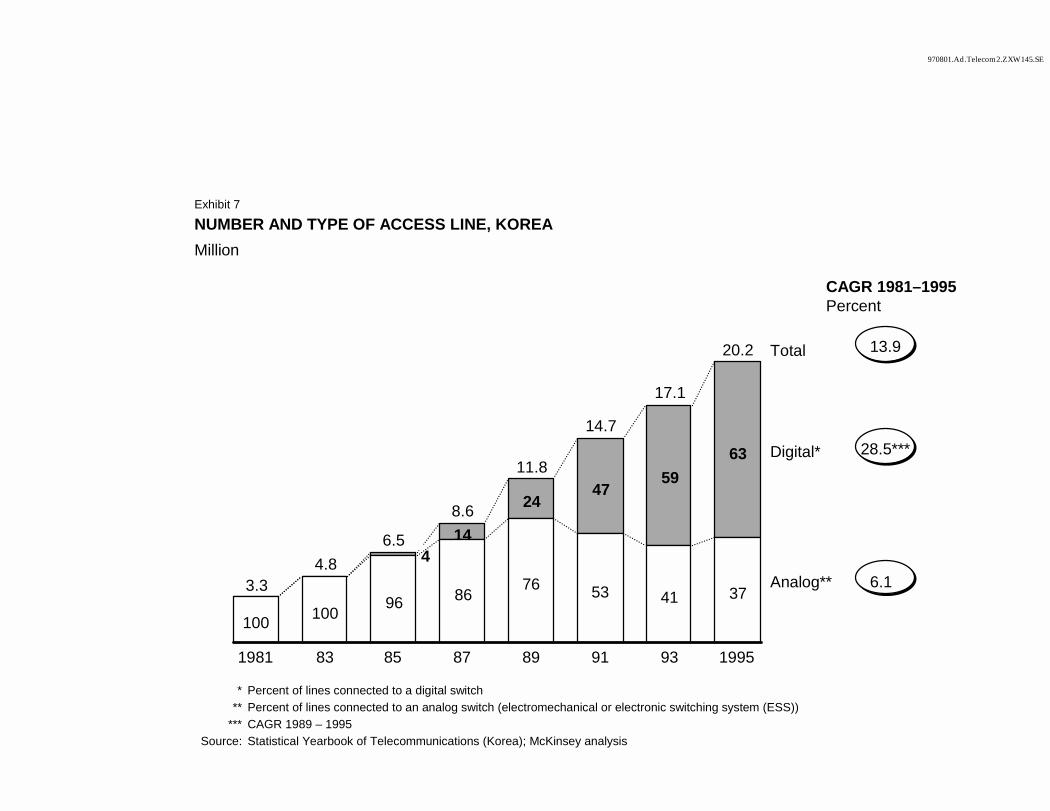
970801.Ad.Telecom2.ZXW145.SE
NUMBER AND TYPE OF ACCESS LINE, KOREAMillion
* Percent of lines connected to a digital switch ** Percent of lines connected to an analog switch (electromechanical or electronic switching system (ESS))
*** CAGR 1989 – 1995Source: Statistical Yearbook of Telecommunications (Korea); McKinsey analysis
3.34.8
6.5
8.6
11.8
14.7
17.1
20.2
414
2447
5963
100 100 96 86 76 53 41 37
1981 83 85 87 89 91 93 1995
CAGR 1981–1995Percent
13.9
28.5***
6.1Analog**
Digital*
Total
Exhibit 7
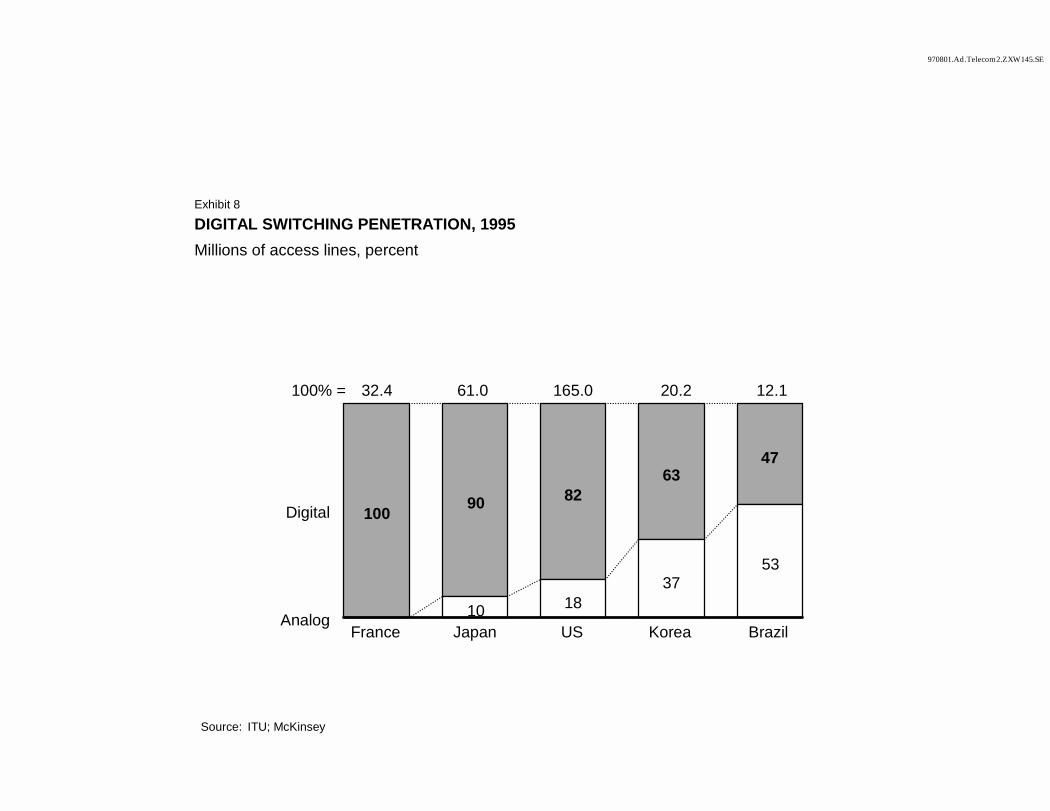
970801.Ad.Telecom2.ZXW145.SE
DIGITAL SWITCHING PENETRATION, 1995Millions of access lines, percent
Digital 100 90 8263
47
Analog 10 1837
53
France Japan US Korea Brazil
Source: ITU; McKinsey
165.061.032.4 20.2 12.1100% =
Exhibit 8
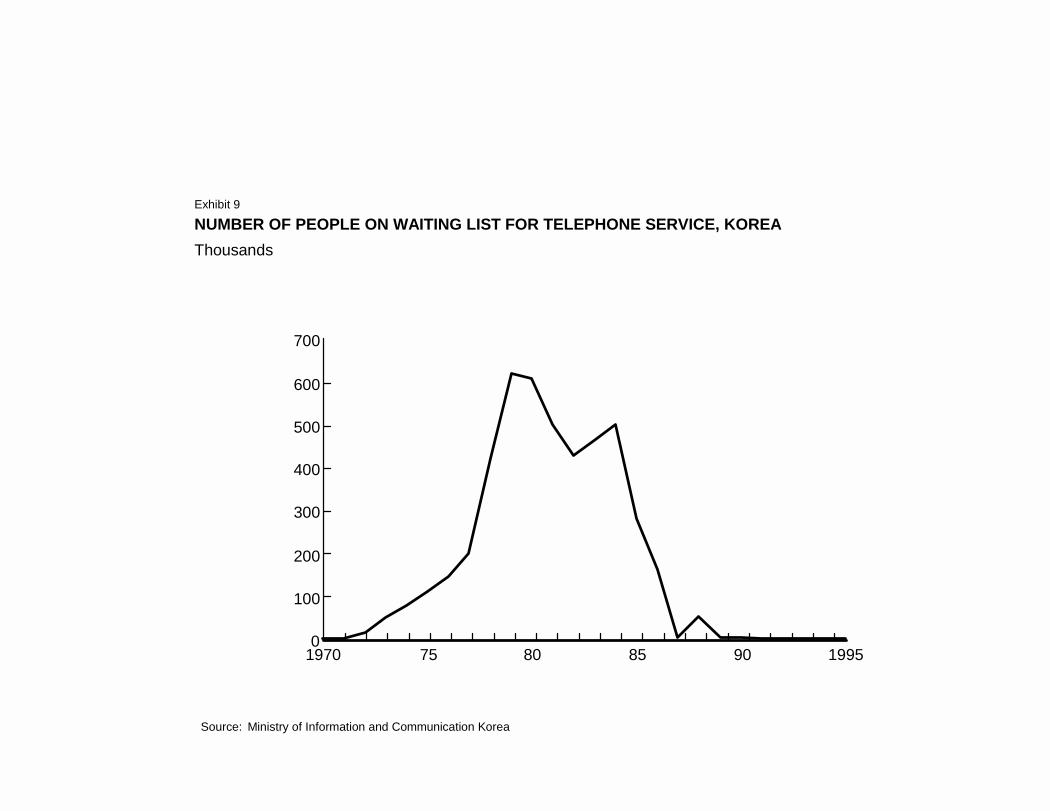
NUMBER OF PEOPLE ON WAITING LIST FOR TELEPHONE SERVICE, KOREAThousands
Source: Ministry of Information and Communication Korea
0
100
200
300
400
500
600
700
1970 75 80 85 90 1995
Exhibit 9
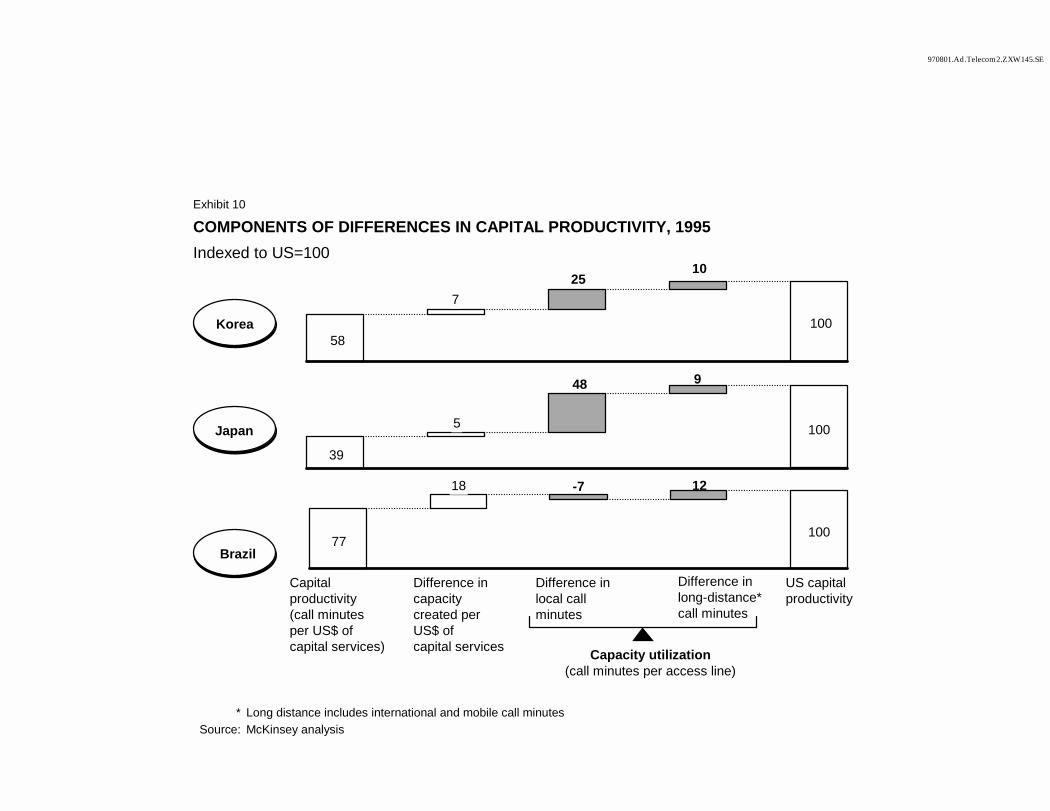
970801.Ad.Telecom2.ZXW145.SE
* Long distance includes international and mobile call minutesSource: McKinsey analysis
COMPONENTS OF DIFFERENCES IN CAPITAL PRODUCTIVITY, 1995 Indexed to US=100
58
725
10
100
39
5
48 9
100
Capitalproductivity(call minutes per US$ of capital services)
Difference in capacitycreated per US$ ofcapital services
Difference inlocal call minutes
Difference inlong-distance*call minutes
US capitalproductivity
77
18 -7 12
100
Korea
Japan
Brazil
Capacity utilization(call minutes per access line)
Exhibit 10
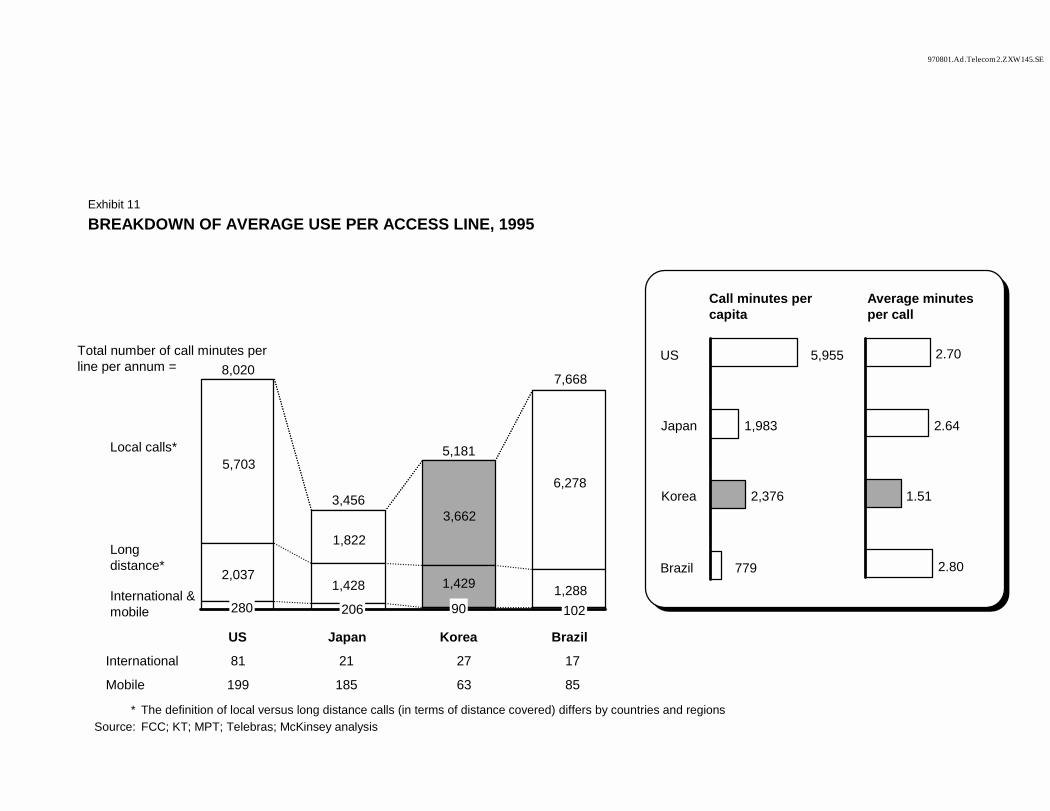
970801.Ad.Telecom2.ZXW145.SE
BREAKDOWN OF AVERAGE USE PER ACCESS LINE, 1995
8,020
3,456
5,181
7,668
Local calls*5,703
1,822
3,662
6,278
Long distance*
2,0371,428 1,429 1,288International &
mobile
US Japan Korea Brazil
* The definition of local versus long distance calls (in terms of distance covered) differs by countries and regionsSource: FCC; KT; MPT; Telebras; McKinsey analysis
Total number of call minutes per line per annum =
5,955US
1,983Japan
2,376Korea
779Brazil
2.70
2.64
1.51
2.80
Call minutes per capita
Average minutes per call
International 81 21 27 17
Mobile 199 185 63 85
Exhibit 11
280 206 90 102
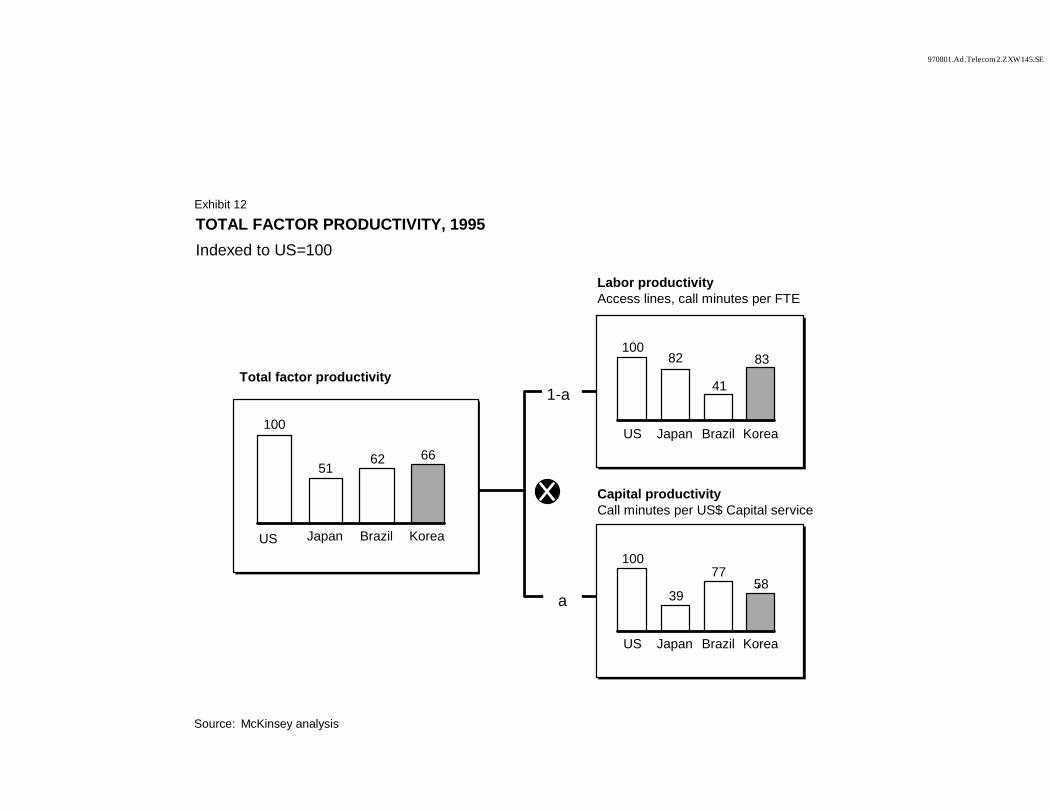
970801.Ad.Telecom2.ZXW145.SE
TOTAL FACTOR PRODUCTIVITY, 1995Indexed to US=100
Source: McKinsey analysis
100
5162 66
US Japan Brazil Korea
10082
41
83
US Japan Brazil Korea
Capital productivityCall minutes per US$ Capital service
Labor productivityAccess lines, call minutes per FTE
100
39
7758
US Japan Brazil Korea
Total factor productivity1-a
a
Exhibit 12
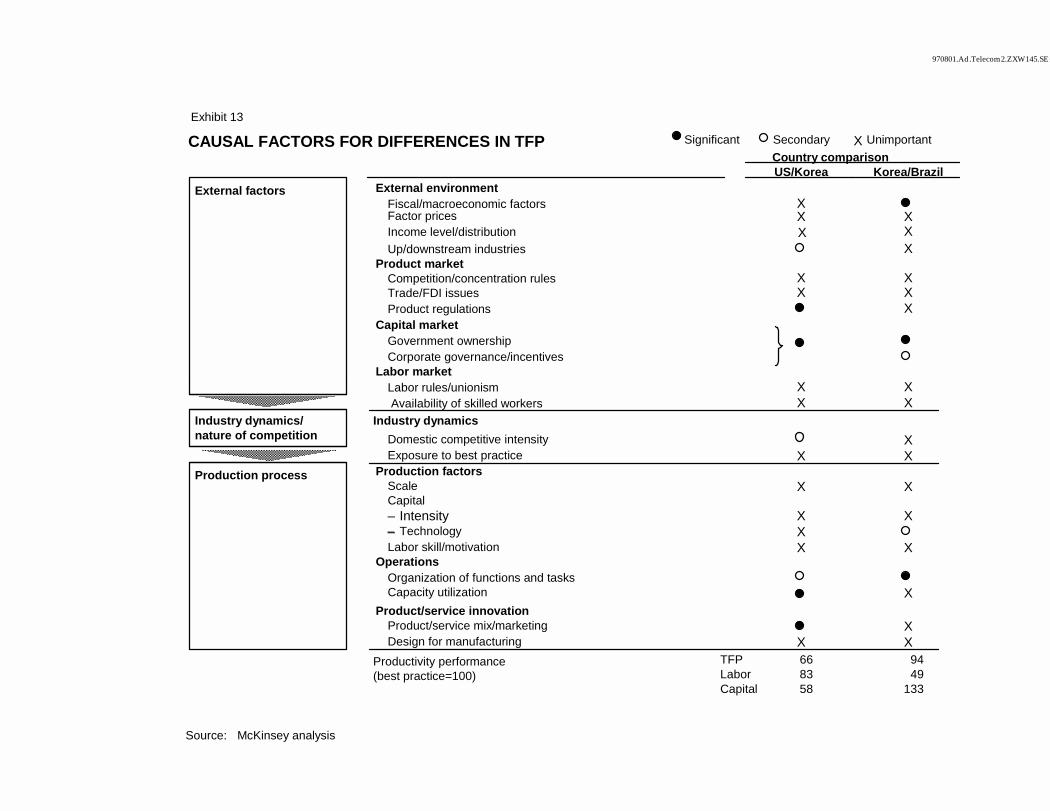
970801.Ad.Telecom2.ZXW145.SE
Country comparisonUS/Korea Korea/Brazil
External factors External environment� Fiscal/macroeconomic factors X� Factor prices X X� Income level/distribution X� Up/downstream industries XProduct market� Competition/concentration rules X X� Trade/FDI issues X X� Product regulations XCapital market� Government ownership� Corporate governance/incentivesLabor market� Labor rules/unionism X X� Availability of skilled workers X X
Industry dynamics/nature of competition
Industry dynamics� Domestic competitive intensity X� Exposure to best practice X X
Production process Production factors� Scale X X� Capital
– Intensity–
X X– Technology X
� Labor skill/motivation X XOperations� Organization of functions and tasks� Capacity utilization XProduct/service innovation� Product/service mix/marketing X� Design for manufacturing X XProductivity performance(best practice=100)
CAUSAL FACTORS FOR DIFFERENCES IN TFP
Source: McKinsey analysis
Significant Secondary UnimportantX
TFPLaborCapital
668358
9449
133
Exhibit 13
X
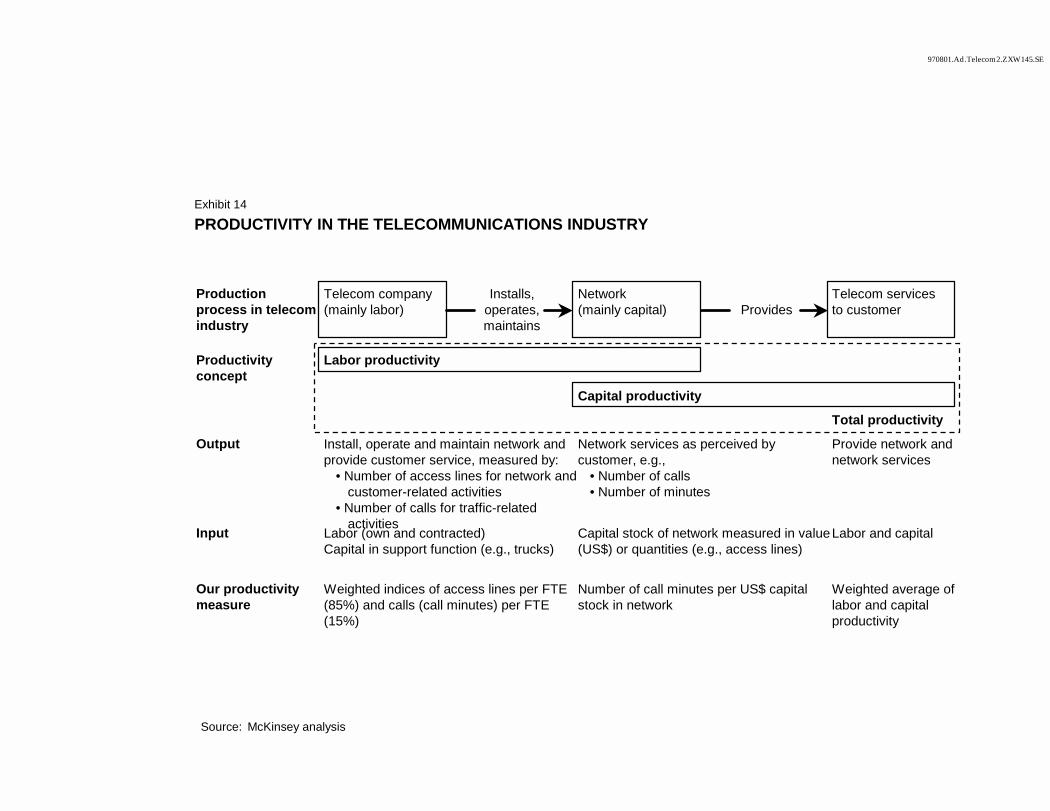
970801.Ad.Telecom2.ZXW145.SE
PRODUCTIVITY IN THE TELECOMMUNICATIONS INDUSTRY
Source: McKinsey analysis
Production process in telecom industry
Telecom company (mainly labor)
Installs, operates, maintains
Network (mainly capital) Provides
Telecom services to customer
Productivity concept
Labor productivity
Capital productivity
Total productivity
Output Install, operate and maintain network and provide customer service, measured by:
• Number of access lines for network and customer-related activities
• Number of calls for traffic-related activities
Network services as perceived by customer, e.g.,
• Number of calls• Number of minutes
Provide network and network services
Input Labor (own and contracted)Capital in support function (e.g., trucks)
Capital stock of network measured in value (US$) or quantities (e.g., access lines)
Labor and capital
Our productivity measure
Weighted indices of access lines per FTE (85%) and calls (call minutes) per FTE (15%)
Number of call minutes per US$ capital stock in network
Weighted average of labor and capital productivity
Exhibit 14
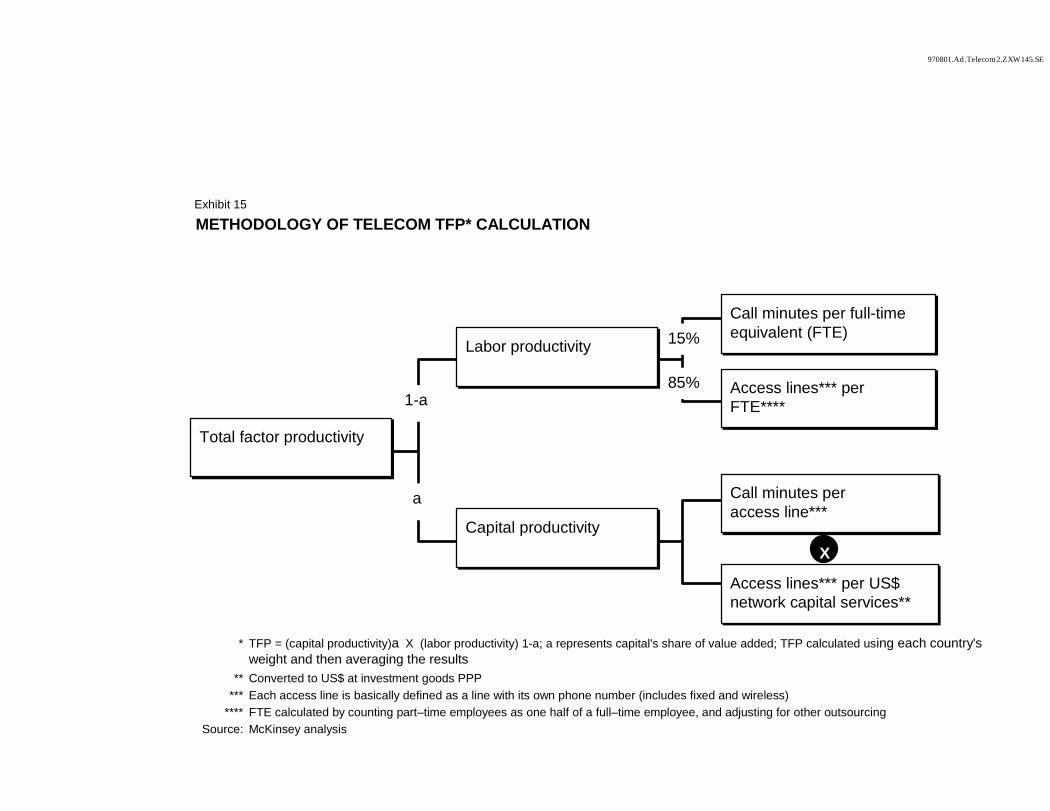
970801.Ad.Telecom2.ZXW145.SE
METHODOLOGY OF TELECOM TFP* CALCULATION
* TFP = (capital productivity)a X (labor productivity) 1-a; a represents capital's share of value added; TFP calculated using each country's weight and then averaging the results
** Converted to US$ at investment goods PPP*** Each access line is basically defined as a line with its own phone number (includes fixed and wireless)
**** FTE calculated by counting part–time employees as one half of a full–time employee, and adjusting for other outsourcingSource: McKinsey analysis
Access lines*** per US$ network capital services**Access lines*** per US$ network capital services**
Call minutes per access line***Call minutes per access line***
XCapital productivityCapital productivity
Total factor productivityTotal factor productivity
Access lines*** per FTE****Access lines*** per FTE****
Call minutes per full-time equivalent (FTE)Call minutes per full-time equivalent (FTE)
Labor productivityLabor productivity 15%
85%1-a
a
Exhibit 15
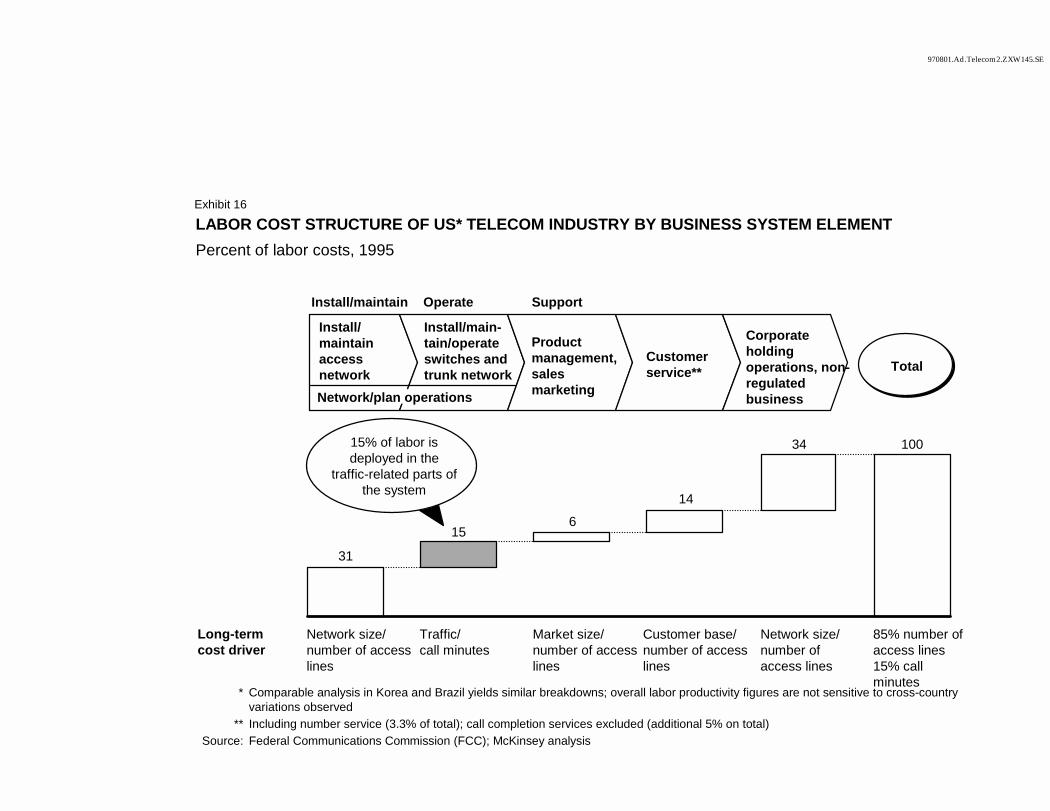
970801.Ad.Telecom2.ZXW145.SE
LABOR COST STRUCTURE OF US* TELECOM INDUSTRY BY BUSINESS SYSTEM ELEMENTPercent of labor costs, 1995
* Comparable analysis in Korea and Brazil yields similar breakdowns; overall labor productivity figures are not sensitive to cross-country variations observed
** Including number service (3.3% of total); call completion services excluded (additional 5% on total)Source: Federal Communications Commission (FCC); McKinsey analysis
Install/ maintain access network
Install/main-tain/operate switches and trunk network
Product management, sales marketing
Customer service**
Corporate holding operations, non-regulated business
31
156
14
34 100
Total
15% of labor is deployed in the
traffic-related parts of the system
Network/plan operations
Install/maintain Operate Support
Long-term cost driver
Network size/ number of access lines
Traffic/call minutes
Market size/ number of access lines
Customer base/ number of access lines
Network size/ number of access lines
85% number of access lines15% call minutes
Exhibit 16
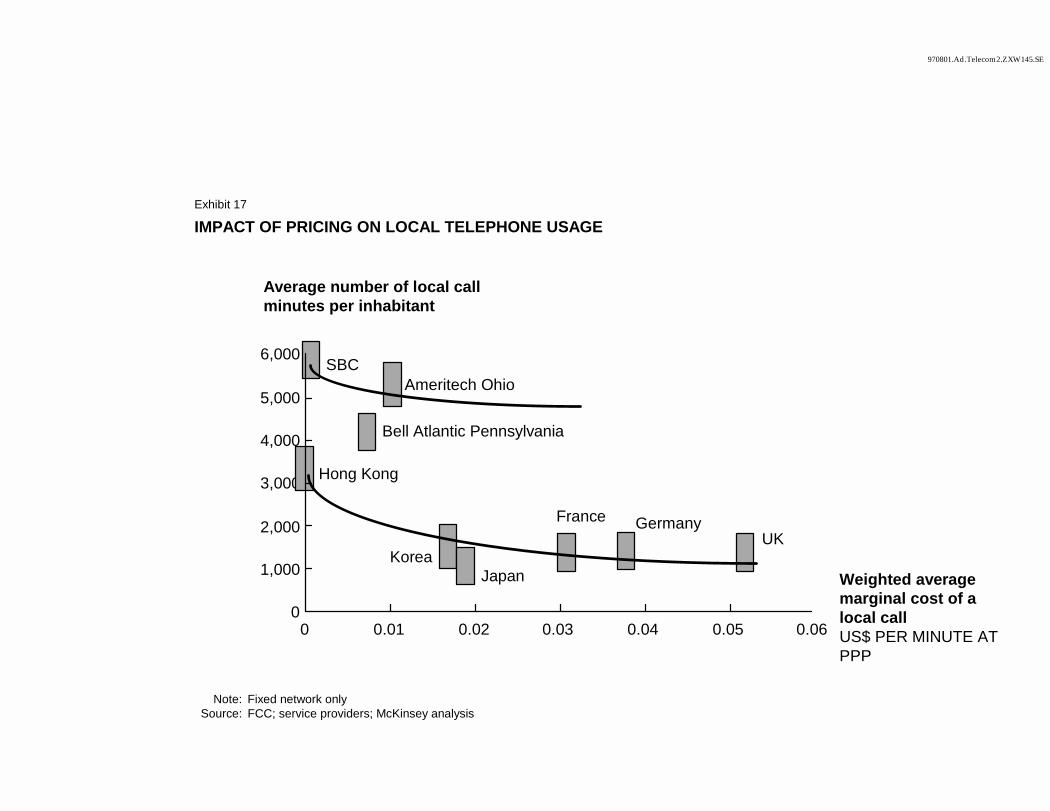
970801.Ad.Telecom2.ZXW145.SE
Note: Fixed network onlySource: FCC; service providers; McKinsey analysis
IMPACT OF PRICING ON LOCAL TELEPHONE USAGE
Weighted average marginal cost of a local callUS$ PER MINUTE AT PPP
Average number of local call minutes per inhabitant
0
1,000
2,000
3,000
4,000
5,000
6,000
Hong Kong
SBC
Bell Atlantic Pennsylvania
Ameritech Ohio
KoreaJapan
France GermanyUK
0 0.01 0.02 0.03 0.04 0.05 0.06
Exhibit 17
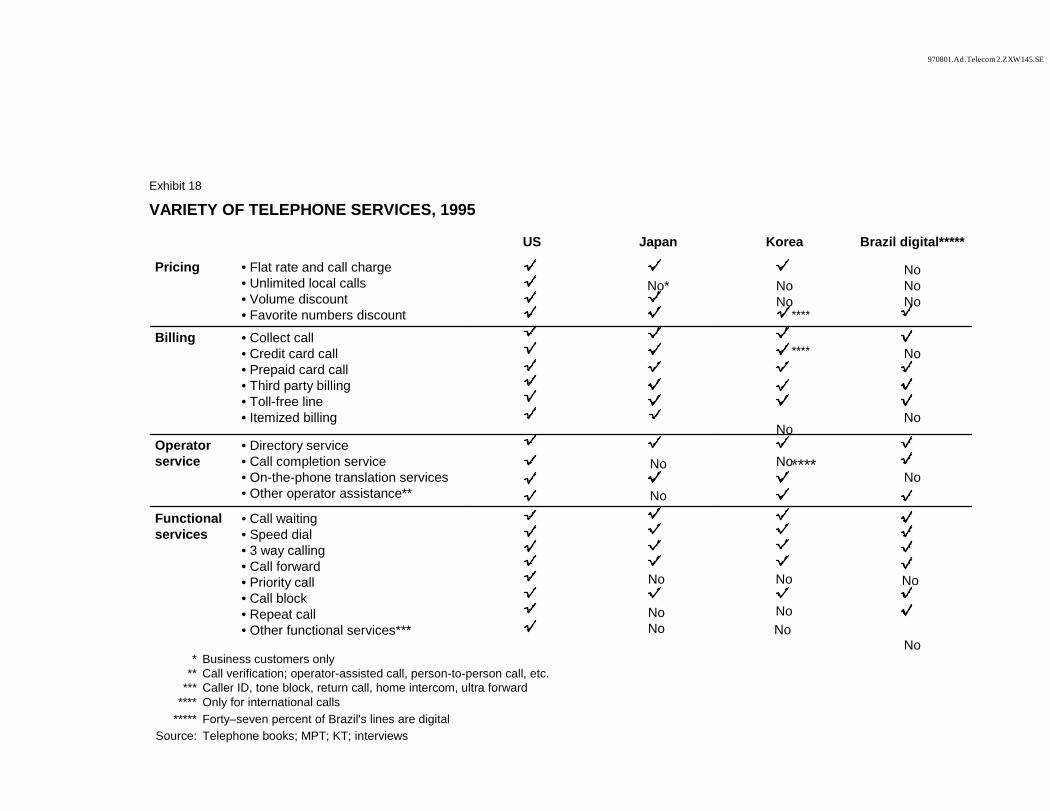
970801.Ad.Telecom2.ZXW145.SE
US Japan Korea Brazil digital*****
Pricing • Flat rate and call charge• Unlimited local calls• Volume discount• Favorite numbers discount
No* NoNo
NoNoNo
Billing • Collect call• Credit card call• Prepaid card call• Third party billing• Toll-free line• Itemized billing
No
No
No
Operator service
• Directory service• Call completion service• On-the-phone translation services• Other operator assistance**
No
No
NoNo
Functional services
• Call waiting• Speed dial• 3 way calling• Call forward• Priority call• Call block• Repeat call• Other functional services***
No
VARIETY OF TELEPHONE SERVICES, 1995
* Business customers only** Call verification; operator-assisted call, person-to-person call, etc.
*** Caller ID, tone block, return call, home intercom, ultra forward**** Only for international calls
***** Forty–seven percent of Brazil's lines are digitalSource: Telephone books; MPT; KT; interviews
****
****
NoNo No
NoNo
NoNo
Exhibit 18
****
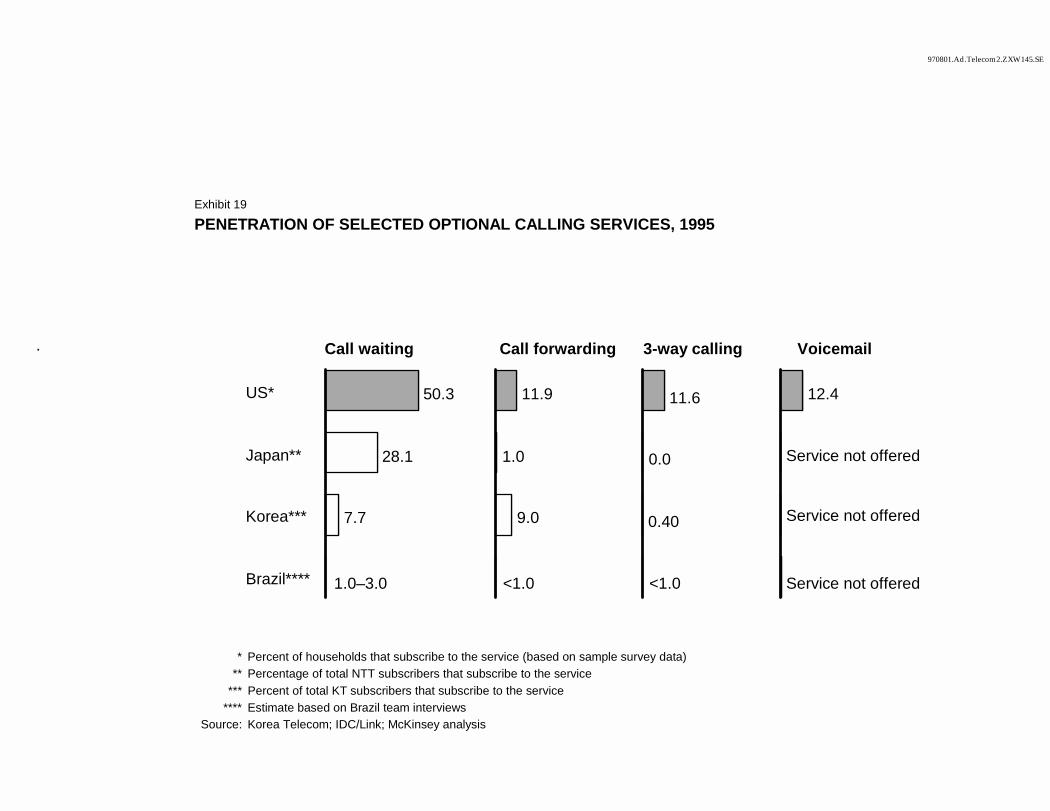
970801.Ad.Telecom2.ZXW145.SE
PENETRATION OF SELECTED OPTIONAL CALLING SERVICES, 1995
* Percent of households that subscribe to the service (based on sample survey data)** Percentage of total NTT subscribers that subscribe to the service
*** Percent of total KT subscribers that subscribe to the service**** Estimate based on Brazil team interviews
Source: Korea Telecom; IDC/Link; McKinsey analysis
Call waiting Call forwarding 3-way calling Voicemail.
50.3
28.1
7.7
US*
Japan**
Korea***
Brazil****
11.9
1.0
9.0
11.6
0.0
0.40
12.4
1.0–3.0 <1.0 <1.0
Service not offered
Service not offered
Service not offered
Exhibit 19
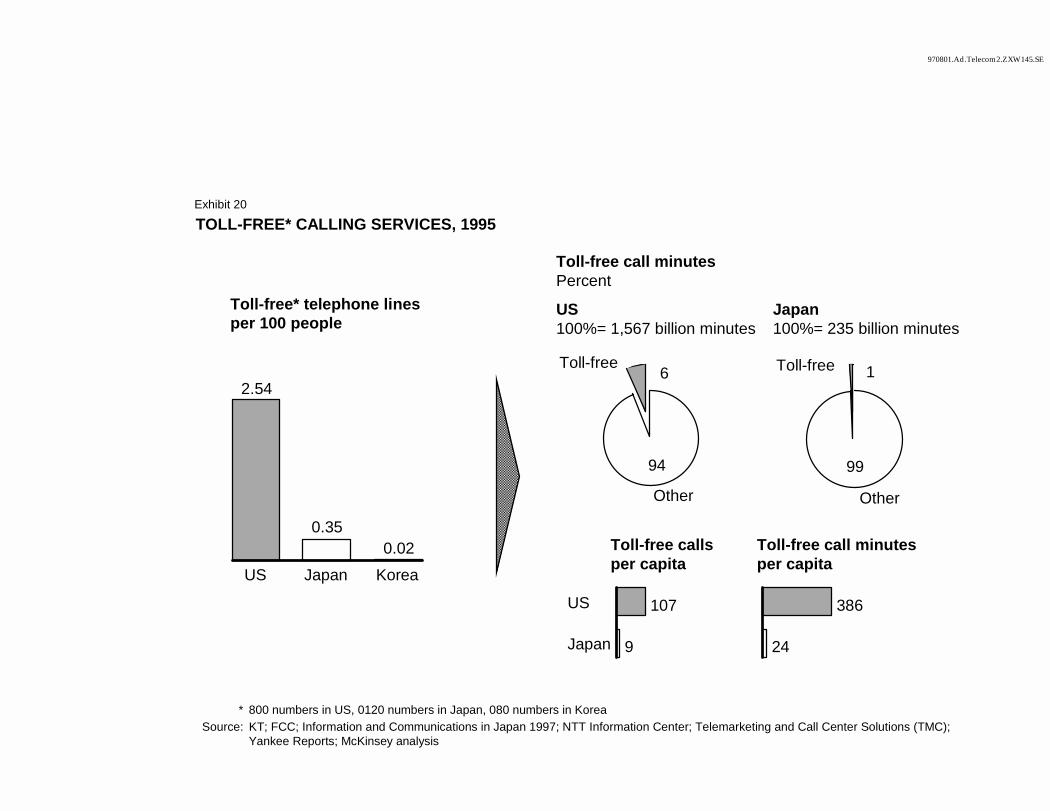
970801.Ad.Telecom2.ZXW145.SE
US100%= 1,567 billion minutes
TOLL-FREE* CALLING SERVICES, 1995
* 800 numbers in US, 0120 numbers in Japan, 080 numbers in KoreaSource: KT; FCC; Information and Communications in Japan 1997; NTT Information Center; Telemarketing and Call Center Solutions (TMC);
Yankee Reports; McKinsey analysis
Toll-free* telephone lines per 100 people
Other
Toll-free
94
6
Other
Toll-free
99
12.54
0.350.02
US Japan Korea
Toll-free calls per capita
Toll-free call minutes per capita
107
9
US
Japan
386
24
Japan100%= 235 billion minutes
Toll-free call minutes Percent
Exhibit 20
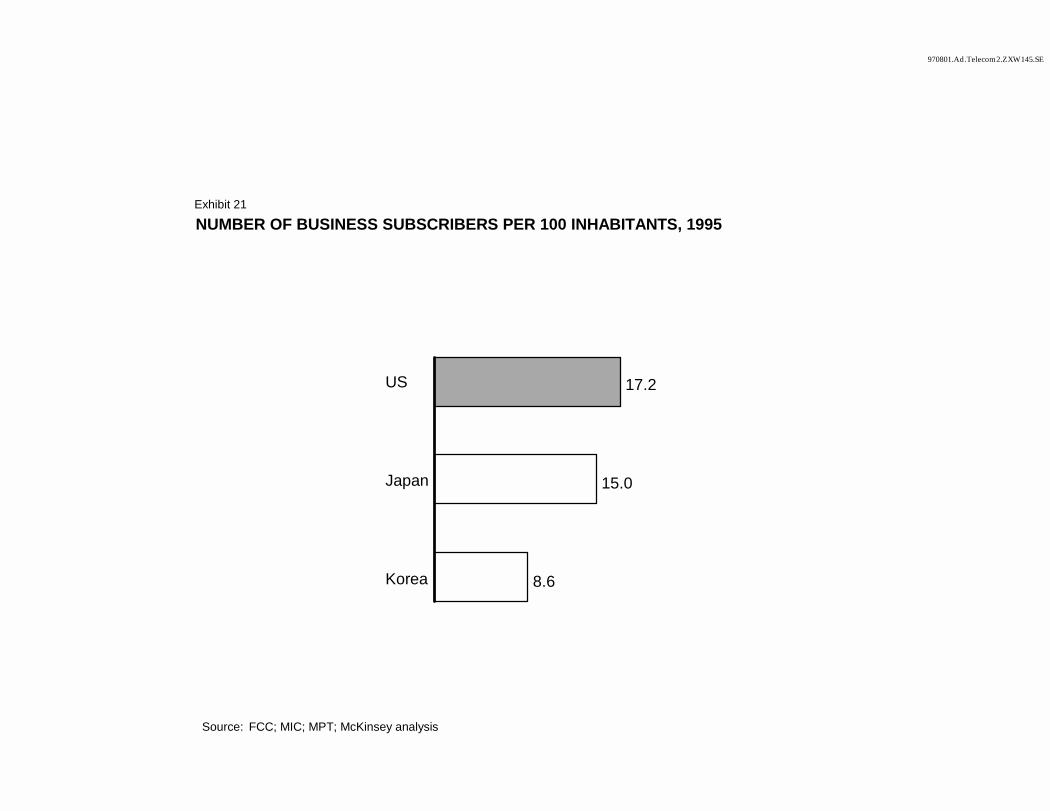
970801.Ad.Telecom2.ZXW145.SE
NUMBER OF BUSINESS SUBSCRIBERS PER 100 INHABITANTS, 1995
Source: FCC; MIC; MPT; McKinsey analysis
17.2
15.0
8.6
US
Japan
Korea
Exhibit 21

970801.Ad.Telecom2.ZXW145.SE
TELECOMMUNICATION SERVICES ADVERTISING EXPENSES, 1995
Source: FCC; annual reports; Dentsu Marketing and Advertising Year Book; Competitive Media Reporting; Korea Statistical Year Book; McKinsey analysis
Telecommunication services advertising expenses per capitaUS$ at PPP
Telecommunication services share of total advertising Percent
14
2.9
0.6
US
Japan
Korea
6.6
1.8
0.2
Exhibit 22ESTIMAT
E
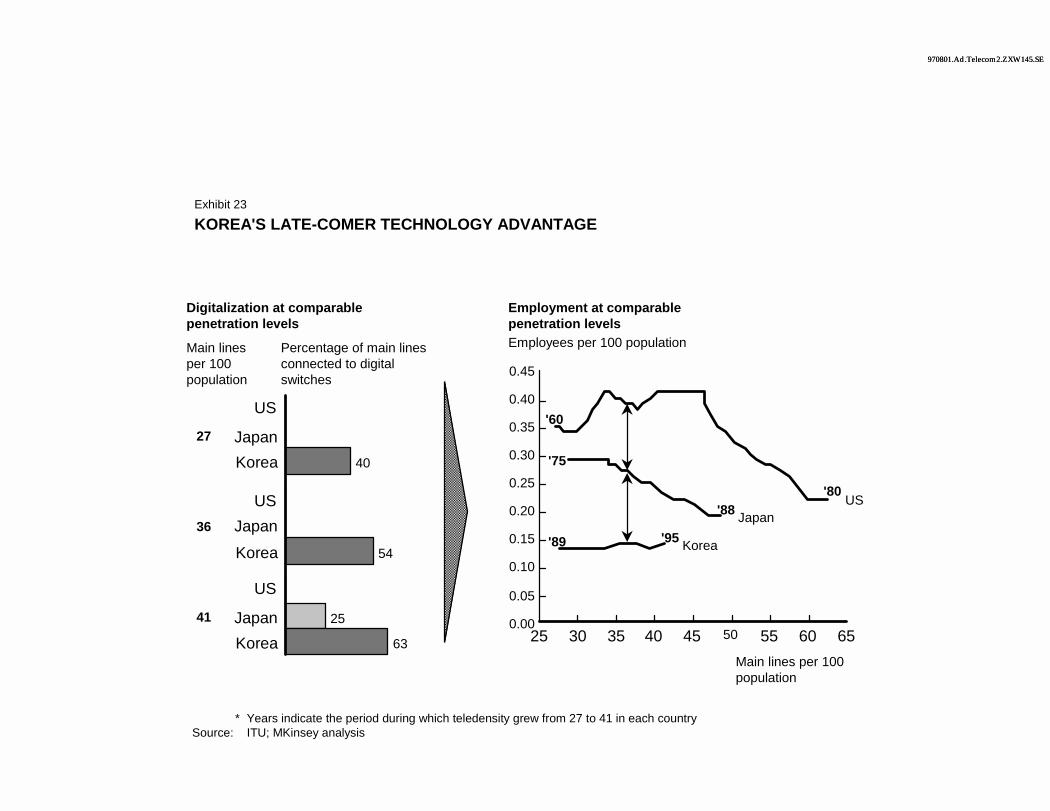
970801.Ad.Telecom2.ZXW145.SE970801.Ad.Telecom2.ZXW145.SE
* Years indicate the period during which teledensity grew from 27 to 41 in each countrySource: ITU; MKinsey analysis
KOREA'S LATE-COMER TECHNOLOGY ADVANTAGE
0.00
0.05
0.10
0.15
0.20
0.25
0.30
0.35
0.40
0.45
Korea
JapanUS
25 30 35 40 45 50 55 60 65
Employment at comparable penetration levels
Digitalization at comparable penetration levels
Employees per 100 population
Main lines per 100 population
40
54
63
25
27
36
41
Main lines per 100 population
Percentage of main lines connected to digital switches
'60
'80
'75
'88
'89 '95
Exhibit 23
US
US
US
Japan
Japan
Japan
Korea
Korea
Korea
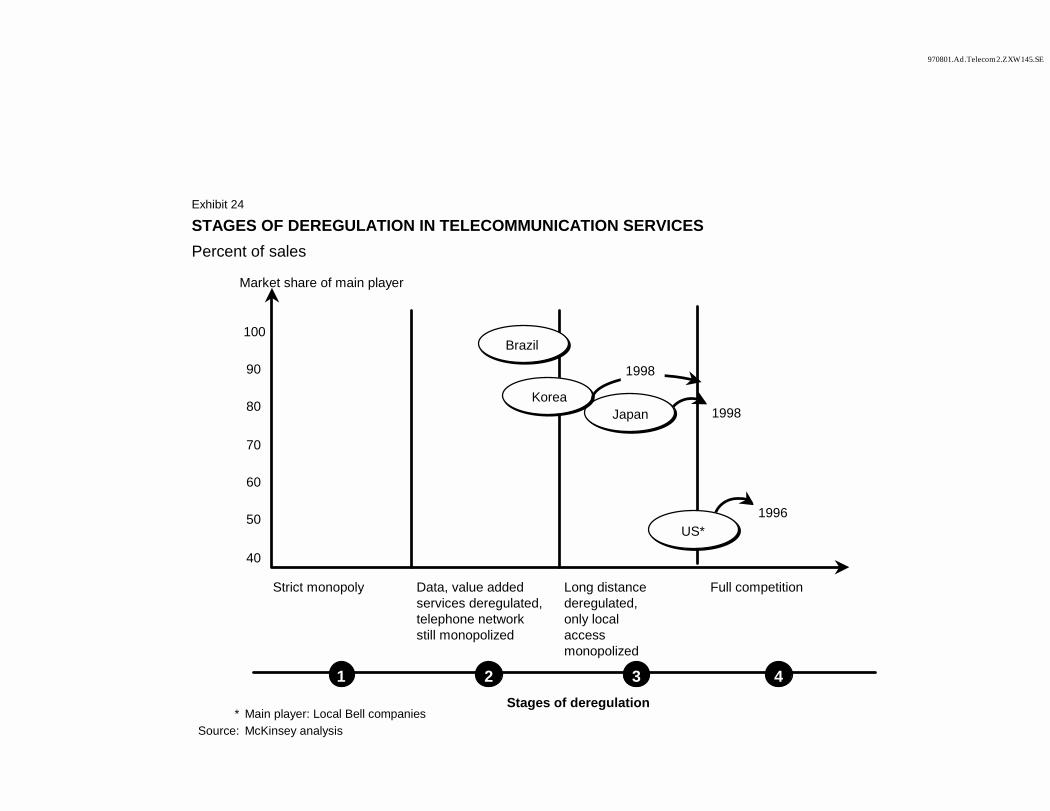
970801.Ad.Telecom2.ZXW145.SE
STAGES OF DEREGULATION IN TELECOMMUNICATION SERVICESPercent of sales
* Main player: Local Bell companiesSource: McKinsey analysis
Market share of main player
Strict monopoly Data, value added services deregulated, telephone network still monopolized
Long distance deregulated, only local access monopolized
Full competition
Japan
US*
Korea
1998
1 2 3 4Stages of deregulation
100
90
80
70
60
50
40
Brazil
1998
1996
Exhibit 24
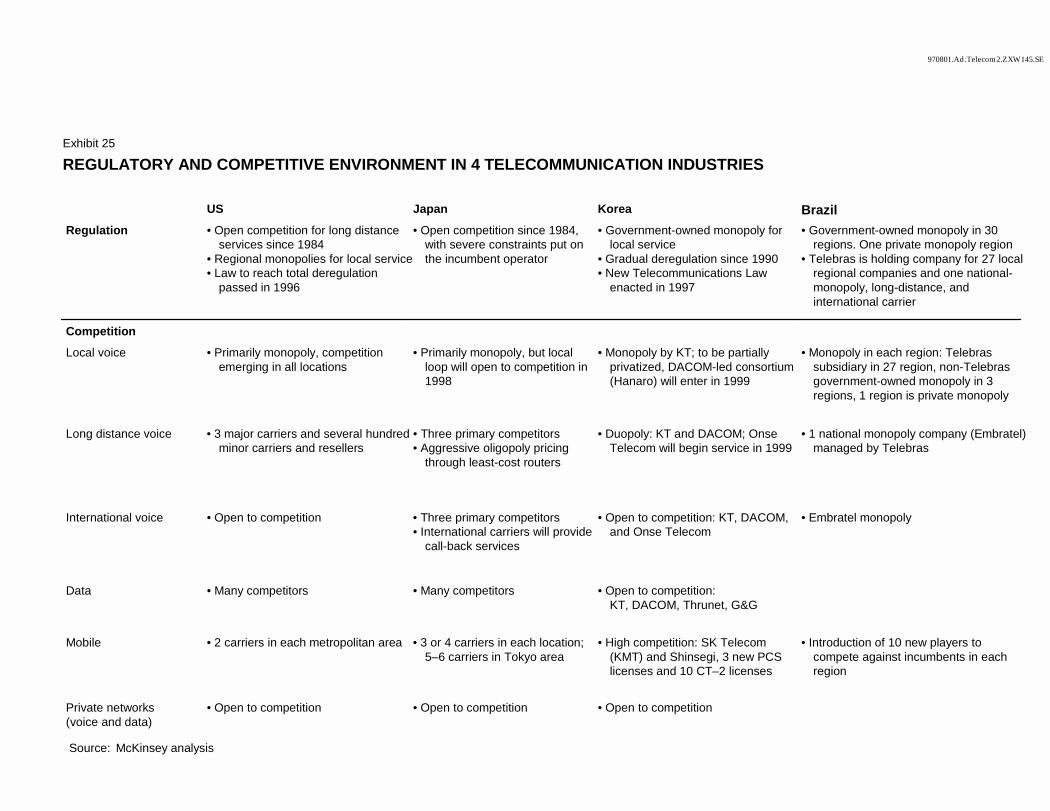
970801.Ad.Telecom2.ZXW145.SE
REGULATORY AND COMPETITIVE ENVIRONMENT IN 4 TELECOMMUNICATION INDUSTRIES
Source: McKinsey analysis
US Japan Korea BrazilRegulation • Open competition for long distance
services since 1984• Regional monopolies for local service• Law to reach total deregulation
passed in 1996
• Open competition since 1984, with severe constraints put on the incumbent operator
• Government-owned monopoly for local service
• Gradual deregulation since 1990• New Telecommunications Law
enacted in 1997
• Government-owned monopoly in 30 regions. One private monopoly region
• Telebras is holding company for 27 local regional companies and one national-monopoly, long-distance, and international carrier
CompetitionLocal voice • Primarily monopoly, competition
emerging in all locations• Primarily monopoly, but local
loop will open to competition in 1998
• Monopoly by KT; to be partially privatized, DACOM-led consortium (Hanaro) will enter in 1999
• Monopoly in each region: Telebrassubsidiary in 27 region, non-Telebrasgovernment-owned monopoly in 3 regions, 1 region is private monopoly
Long distance voice • 3 major carriers and several hundred minor carriers and resellers
• Three primary competitors• Aggressive oligopoly pricing
through least-cost routers
• Duopoly: KT and DACOM; OnseTelecom will begin service in 1999
• 1 national monopoly company (Embratel) managed by Telebras
International voice • Open to competition • Three primary competitors• International carriers will provide
call-back services
• Open to competition: KT, DACOM, and Onse Telecom
• Embratel monopoly
Data • Many competitors • Many competitors • Open to competition:KT, DACOM, Thrunet, G&G
Mobile • 2 carriers in each metropolitan area • 3 or 4 carriers in each location; 5–6 carriers in Tokyo area
• High competition: SK Telecom (KMT) and Shinsegi, 3 new PCSlicenses and 10 CT–2 licenses
• Introduction of 10 new players to compete against incumbents in each region
Private networks(voice and data)
• Open to competition • Open to competition • Open to competition
Exhibit 25
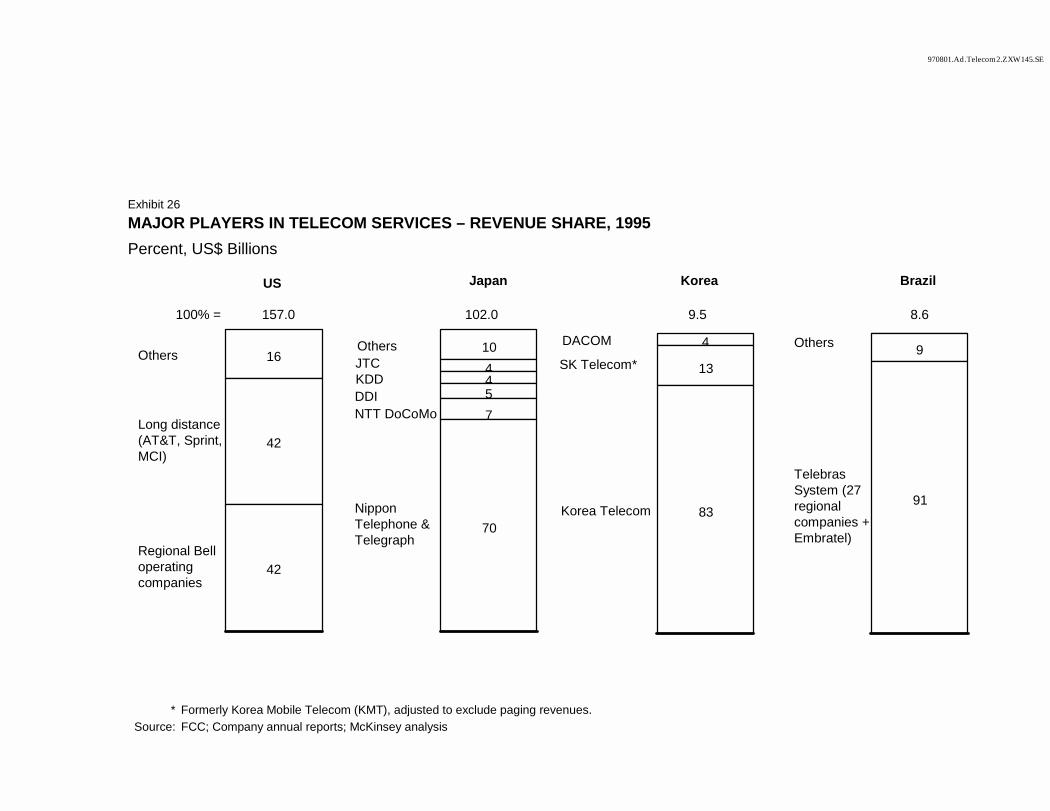
970801.Ad.Telecom2.ZXW145.SE
MAJOR PLAYERS IN TELECOM SERVICES – REVENUE SHARE, 1995Percent, US$ Billions
* Formerly Korea Mobile Telecom (KMT), adjusted to exclude paging revenues.Source: FCC; Company annual reports; McKinsey analysis
Others 16
Long distance(AT&T, Sprint, MCI)
42
Regional Belloperatingcompanies
42
US
Others 10JTC 4KDD 4DDI 5NTT DoCoMo 7
NipponTelephone &Telegraph
70
Japan
SK Telecom*4DACOM
13
Korea Telecom 83
Korea
100% = 157.0 102.0 9.5
9
91
Brazil
Others
TelebrasSystem (27 regional companies +Embratel)
8.6
Exhibit 26
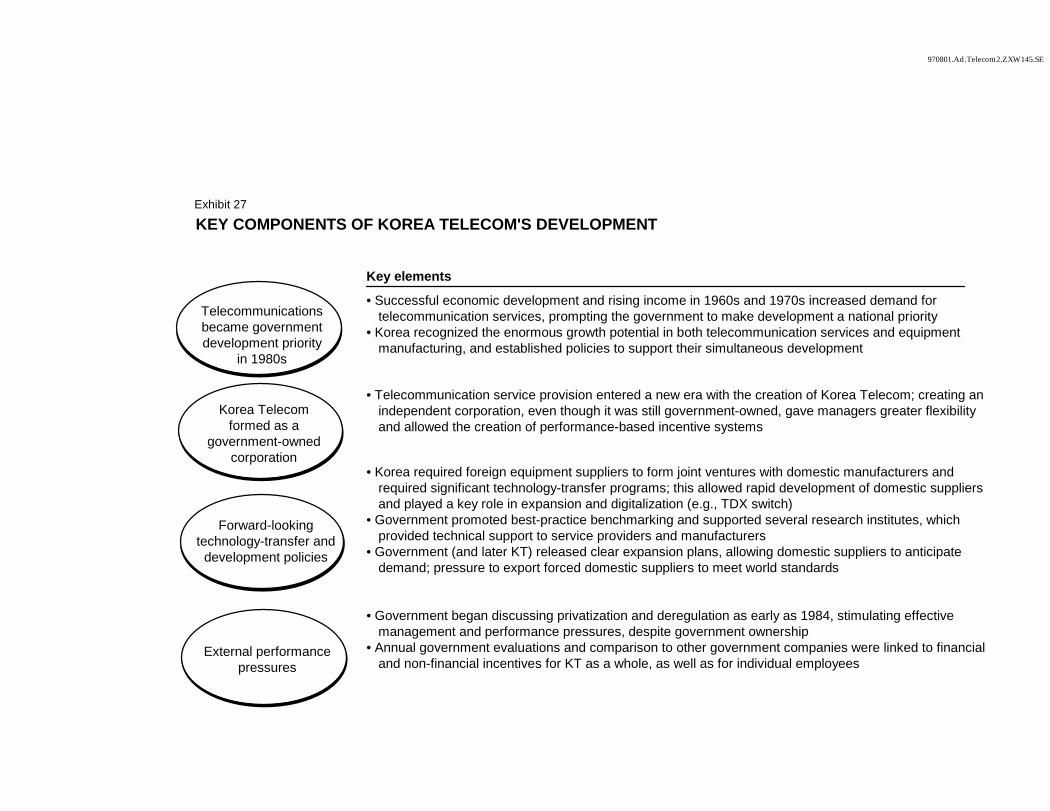
970801.Ad.Telecom2.ZXW145.SE
KEY COMPONENTS OF KOREA TELECOM'S DEVELOPMENT
Key elements
• Successful economic development and rising income in 1960s and 1970s increased demand for telecommunication services, prompting the government to make development a national priority
• Korea recognized the enormous growth potential in both telecommunication services and equipment manufacturing, and established policies to support their simultaneous development
• Telecommunication service provision entered a new era with the creation of Korea Telecom; creating an independent corporation, even though it was still government-owned, gave managers greater flexibility and allowed the creation of performance-based incentive systems
• Korea required foreign equipment suppliers to form joint ventures with domestic manufacturers and required significant technology-transfer programs; this allowed rapid development of domestic suppliers and played a key role in expansion and digitalization (e.g., TDX switch)
• Government promoted best-practice benchmarking and supported several research institutes, which provided technical support to service providers and manufacturers
• Government (and later KT) released clear expansion plans, allowing domestic suppliers to anticipate demand; pressure to export forced domestic suppliers to meet world standards
• Government began discussing privatization and deregulation as early as 1984, stimulating effective management and performance pressures, despite government ownership
• Annual government evaluations and comparison to other government companies were linked to financial and non-financial incentives for KT as a whole, as well as for individual employees
Telecommunications became government development priority
in 1980s
External performance pressures
Forward-looking technology-transfer and
development policies
Korea Telecom formed as a
government-owned corporation
Exhibit 27

970801.Ad.Telecom2.ZXW145.SE
ACCESS LINES PER EMPLOYEE*
* Telecommunication employment as reported to the ITUSource: ITU; McKinsey analysis
0
50
100
150
200
250
300
Mexico180
Korea300
Hong Kong85
Brazil131
US284
1975 80 85 90 1995
Exhibit 28

970801.Ad.Telecom2.ZXW145.SE
IMPACT OF TELEMARKETING*, 1995
* Includes dedicated telemarketing firms only; does not include other retailers or manufacturers that engage in direct telemarketing** 1994 Data
Source: Marketing Logistics Inc.; Korea Statistical Year Book; Literature search; McKinsey analysis
Estimated sales from telemarketing per capitaUS$, at PPP
Telemarketing share of retail salesPercent of retail sales
69.0
1.8
1.0
US
Japan**
Korea**
0.78
0.01
0.05
* *
Exhibit 29ESTIMAT
E
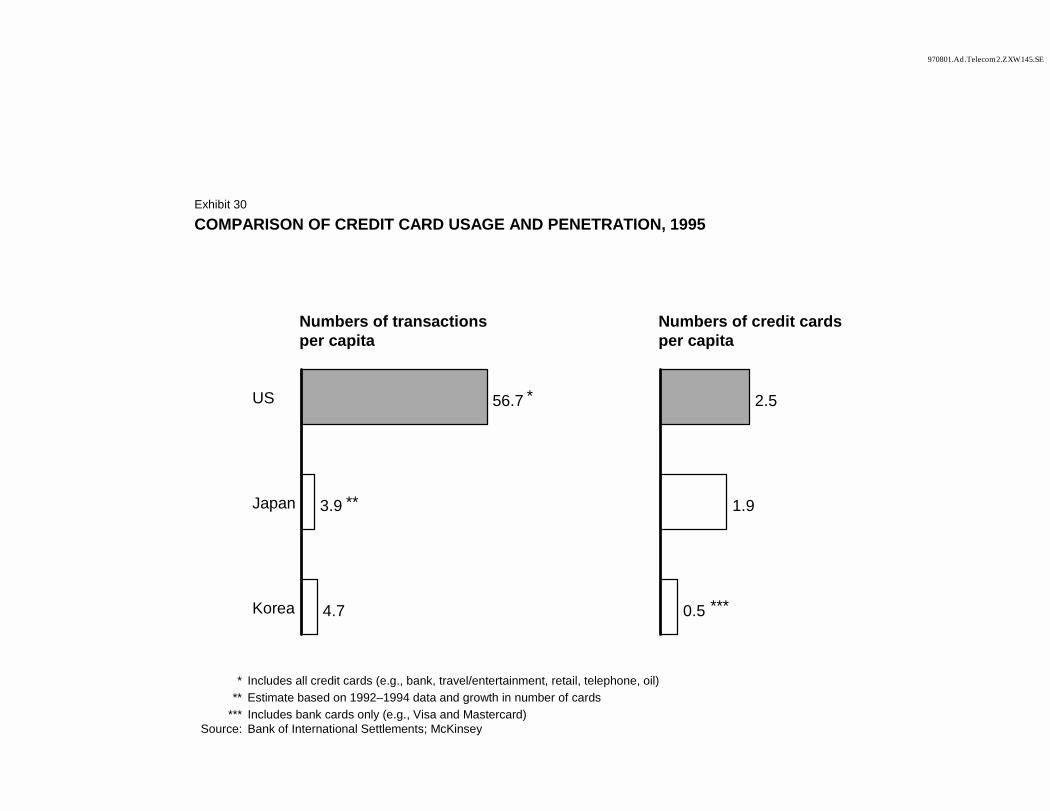
970801.Ad.Telecom2.ZXW145.SE
COMPARISON OF CREDIT CARD USAGE AND PENETRATION, 1995
* Includes all credit cards (e.g., bank, travel/entertainment, retail, telephone, oil)** Estimate based on 1992–1994 data and growth in number of cards
*** Includes bank cards only (e.g., Visa and Mastercard)Source: Bank of International Settlements; McKinsey
Numbers of transactionsper capita
Numbers of credit cardsper capita
56.7
3.9
4.7
US
Japan
Korea
*
**
2.5
1.9
0.5 ***
Exhibit 30
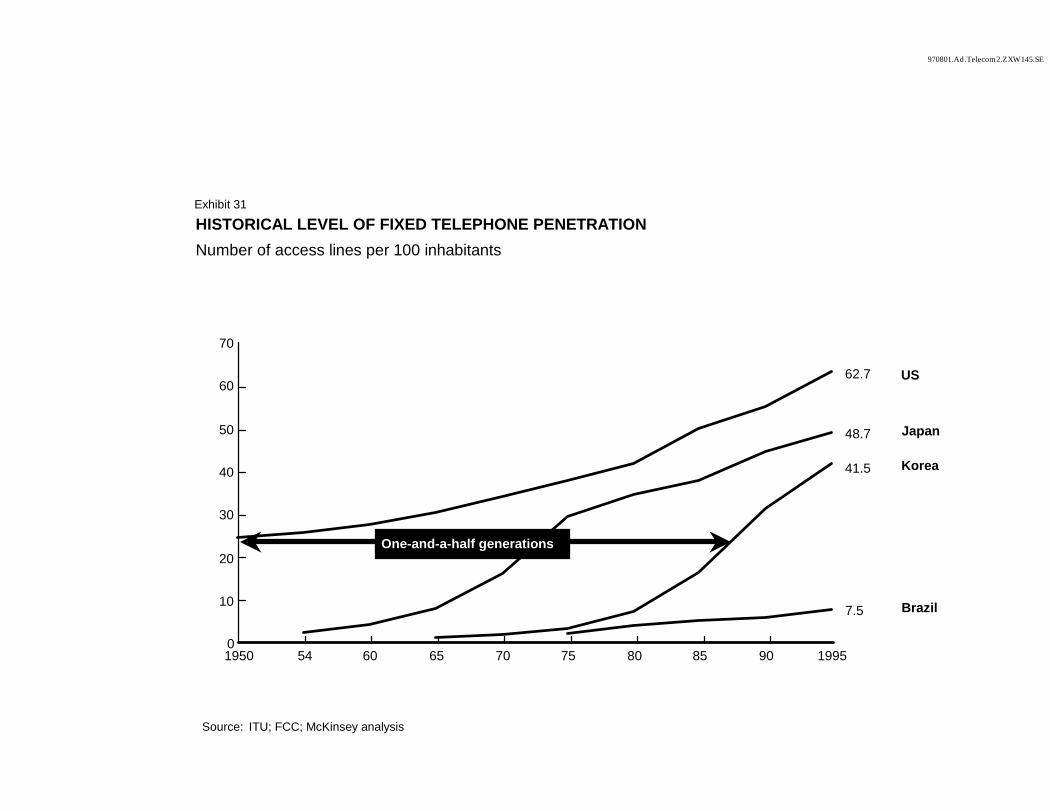
970801.Ad.Telecom2.ZXW145.SE
HISTORICAL LEVEL OF FIXED TELEPHONE PENETRATIONNumber of access lines per 100 inhabitants
Source: ITU; FCC; McKinsey analysis
0
10
20
30
40
50
60
70
Japan48.7
Brazil7.5
Korea41.5
US62.7
1950 54 60 65 70 75 80 85 90 1995
One-and-a-half generations
Exhibit 31
1
Synthesis and Implications
This chapter synthesizes the results from our year-long study of the Korean economy. The detailed microeconomic analysis of eight representative sectors has provided new insights into the fundamental causes of low productivity in Korea. Generalizing our findings to the overall economy, we found that Korea could realize and sustain 6% annual GDP per capita growth if it engages in a comprehensive economic policy reform encompassing the service sectors in addition to the financial and manufacturing sectors.
This chapter is organized around the following five sections (Exhibit 1:
1) Summary of findings (pages 2 to 6)
2) Analysis of past economic performance (pages 7 to 27)
3) Causes of the 1997 financial crisis (pages 28 to 31)
4) Economic reforms and future growth potential (pages 32 to 39)
5) Implications to policy makers and companies (pages 40 to 49)
Appendices:
A) Analytical approach for evaluating future economic performance (pages 50 to 53)
B) Detailed analysis of future growth scenarios (pages 54 to 66)
2
1) SUMMARY OF FINDINGS
This section summarizes our findings by laying out the flow of the argument; it does not provide the detailed supporting facts and analysis which can be found in the remainder of this chapter, its two appendices, the aggregate analysis and the eight case studies.
In these times of financial crisis (1998), South Korea has the opportunity to broadly reform its economy in order to follow a more balanced and sustainable growth path. These reforms should go beyond the restructuring of the financial and manufacturing sectors by also encompassing the heavily regulated service sectors. This will be the only way to restore strong economic growth and maintain high employment (Exhibit 2).
¶ The old regulatory environment led to high levels of inputs but low levels of productivity (section 2).
! Korea’s strong economic growth has been achieved by high levels of savings and hours worked; Korea has now the same level of total inputs (the weighted average of labor and capital inputs) as the US. However, total factor productivity (the efficiency at which inputs are transformed into outputs) is only 50% of the US level in most sectors of the economy. Most of the investments have been allocated to manufacturing where we found that capital productivity is at only 50% the US level in most sectors.
! Korea has invested in the best available technology but has failed to adopt best managerial practice:
– Complex managerial processes like lean manufacturing in automotive, high value chip design in semiconductors or brand management in food processing have not been successfully put in place in Korea, leading to low labor and capital productivity in the manufacturing sectors.
– Lack of investments, in addition to poor managerial practices, further depressed labor productivity in the service sectors. For example, there is much less reliance on information technology in banking than in the US and modern store formats in retail are non-existent.
! The prevailing regulatory environment has affected managers’ incentives and ability to adopt best managerial practice production processes. Sector specific (product market) regulations and, to a
3
lesser extent, poor corporate governance in banks and companies have been found to be the primary causes of low productivity:
– Labor and capital productivity are low in manufacturing because protections against imports and foreign direct investments (e.g., food processing and automotive) together with poor corporate governance in banks and companies (e.g., semiconductors) resulted in less pressure on managers to learn and adopt international best managerial practice.
– Labor productivity and investments are low in services because of numerous sector specific regulations such as zoning laws (e.g., retail and construction) and forced pricing schemes (e.g., retail banking and telecom). These regulations restricted competition and impeded the offering of higher value products and services, thus, discouraging investments, especially from best practice foreign companies (FDI).
– We did not find labor market rigidities to be a dominant explanatory factor of low productivity.
¶ The business environment created by the old regulatory approach made the Korean economy fundamentally vulnerable to a financial crisis (section 3).
! Low capital productivity, particularly in capital intensive manufacturing industries, increased the vulnerability of the whole economy by leading to poor financial returns on capital investments.
! The weakness of corporate governance in banks and industrial companies allowed for the continued injection of capital to industries/companies with capital returns below their cost of debt. This injection continued even after the end of the rise in land prices-land has been used as collateral for bank loans.
! Product market regulations also played a role. Strong competition with foreign companies (no barriers to imports and FDI) would have forced Korean manufacturers to improve their capital productivity. Furthermore, deregulation in services would have created more attractive investment alternatives for Korean companies after decreasing returns became evident in manufacturing.
¶ Looking beyond the 1997 financial crisis, Korea’s long term economic performance will depend on the extent to which it will reform its economy (section 4). Failure to undertake any fundamental reforms would make Korea vulnerable to another financial crisis and, even in the absence of further financial turmoil, would cause GDP per capita growth to drop to 3% annually as input driven growth reaches its limits.
4
If Korea reforms only its financial and manufacturing sectors, growth will increase to 4%, but at a risk of soaring unemployment due to the economy’s inability to create jobs in the service sector to absorb workers displaced in manufacturing. If, in addition, Korea reforms its service sectors by removing the often overlooked restrictive service sector regulations such as zoning laws, the annual GDP per capita growth potential would rise to 6% annually and there would be many more attractive re-employment opportunities for the ex manufacturing workers.
! The old regulatory environment can no longer bring strong sustainable growth to Korea.
– Productivity growth would drop in manufacturing as investments in best practice technology have been nearly completed and the adoption of (complex) best managerial practices would remain impeded by protectionism.
– Investment and productivity growth in services would continue to be limited by restrictive regulations.
! The current plans for reforming corporate governance in banks and lowering barriers to imports and FDI should help Korea improve the competitiveness of its manufacturing sectors and achieve higher GDP growth than otherwise (4% versus 3% annually).
The experience of countries like France, Germany and Japan shows that failure to deregulate the service sectors would prevent Korea from providing attractive job opportunities to the workers who will be laid off due to productivity gains in the manufacturing sectors. This incomplete economic reform would force many workers into low value service jobs and could even lead to high structural unemployment if Korea increases its minimum wage and unemployment benefits (level and duration).
! Strong sustainable growth and high (quality) employment can only be achieved by reforming the service sectors in addition to the financial and manufacturing sectors.
– There are no tradeoffs between manufacturing and services; on the contrary. Unleashed growth in the service sectors will create positive “spillover effects,” which would also lead to increased manufacturing output. For example, independent and modern retailers would exercise additional pressure on manufacturers, leading to lower prices and thus higher domestic consumption.
– With lower investment rates than today (30% of GDP versus 33% over the last ten years), Korea could achieve 6% annual GDP per
5
capita growth – Korea could thus reach close to current US-level prosperity by the year 2010. Across-the-board deregulation would allow for an immediate creation of many more quality jobs and for a rise in foreign direct investments, especially in services, at a time when both are badly needed.
¶ There are clear implications from our work for both policy makers and Korean, as well as foreign, companies (section 5).
! In order to sustain high growth and employment, policy makers need to undertake a thorough and comprehensive reform of the economy.
– In order to boost growth Korea needs to remove all the sector specific regulations and (opaque) processes which restrict competition (especially with global best practice) and/or impede companies to offer higher value products and services (e.g., barriers to imports and FDI, zoning laws, restrictions on products, services, and prices).
– To further improve the allocation and use of capital investments it is also necessary to reform the capital markets and corporate governance of banks and companies. In particular, Korea needs a wide ranging “equity reform” to promote the development of a strong, actively traded and widely held equity market.
– In order to facilitate the redeployment of workers from manufacturing to service sectors and avoid unemployment, Korea should make layoffs easier and limit the rise of both the minimum wage and the duration of unemployment benefits.
– Indeed, all social objectives should be pursued through “market friendly” policies. Social policies should not affect the supply side of the economy; they should be implemented through fiscal policies (e.g., earned income tax credit to supplement the income of the low wage workers instead of a higher minimum wage).
– In addition to changing the laws, legal processes should become less bureaucratic and more transparent.
! In order to be competitive in the new era, Korean companies need to:
– Strengthen corporate governance by adopting shareholder value as the explicit objective, achieving world class board governance and changing performance measurement and compensation, especially at the management level, to align incentives with the creation of shareholder value.
6
– Rationalize business portfolios by focusing on the core businesses where best practice is within reach especially in key and difficult areas such as design for manufacturing and marketing.
– Consider alliances with foreign companies to quickly acquire best managerial practices.
! There are many value creation opportunities for best practice foreign companies in Korea.
– In the manufacturing sectors, major improvement can be achieved by quickly transferring best managerial practices since most of the assets are state of the art.
– In services, foreign companies have the opportunity to establish stronghold positions since investments have been precluded by regulations in these sectors.
7
2) THE OLD REGULATORY ENVIRONMENT LED TO LOW LEVELS OF PRODUCTIVITY
We first summarize the results from the aggregate analysis of Korea’s economic performance before synthesizing the findings from our eight sector case studies. These detailed microeconomic analyses allowed us to understand the nature and causes for the performance gaps especially with respect to labor and capital productivity.
Korea’s strong economic growth has been input driven (summary of the aggregate analysis)
Korea’s past economic achievements have been well documented. Korea’s rapid growth has increased its material standard of living almost five-fold since 1970, easily surpassing other developing countries such as Brazil1. This rapid growth has brought Korea’s real income to 50% of the US GDP per capita level, up from only 25% in 1985 (Exhibit 3). Most of this growth has been achieved through high savings rate and long hours worked which have been among the highest in the world. Korea focused on exports of manufactured goods in order to import the equipment necessary to climb up the manufacturing/technological ladder (Exhibit 4).
Total factor productivity2 has increased more modestly despite its low initial level and was only half of the US level in 1995, thus despite comparable total factor (labor and capital) inputs as in the US, the Korean economy produces one half as much output (Exhibit 5). This input driven development path closely parallels Japan’s (Exhibit 6).
Digging further at the aggregate level, we could contrast the relative performance of the manufacturing and services sectors. The allocation of capital in the Korean economy has largely benefited the manufacturing sectors. There, the stock of physical capital per capita is now at 80% of the US level while it is only at around 30% the US level in the service sectors (Exhibit 7). This resulted on the one hand, in high capital productivity in the capital starved sectors (due to the mechanical effect of a very small denominator). This “abnormally” high capital productivity reflects the underdeveloped stage of these sectors, where lack of investments leads to very low labor productivity (less than 40% of the US) and subsequently
1 As discussed in the Objectives and Approach, the two comparison countries chosen for this study are the
US and Japan. The US has the highest GDP per capita of any large economy and is best practice in many industries. Japan as served as a model for Korean development and is also the best practice country in auto and steel minimills. We have also studied several European countries, and we include them in the cases in which they are global best practice (e.g. the Netherlands in personal financial services).
2 Total Factor Productivity is the aggregate measure of how well capital and labor are used to create goods and services. It is a weighted average of a country’s labor productivity and capital productivity.
8
to low total factor productivity (50% of the US). On the other hand, we found that capital productivity in the capital intensive manufacturing sectors was low compared to the US. Thus, the overall Korean capital productivity which is close to the US level hides two problems: underinvestment in services and low capital productivity in manufacturing. Labor productivity is also low in manufacturing at around 40% the US level (Exhibit 8).
Productivity gaps confirmed by the case studies
We now turn to the case study findings to confirm and explain these gaps in labor and capital productivity. We selected our eight case industries to be representative of the entire Korean market economy, including manufacturing and services, traded and non-traded industries, and both industries that have traditionally been the focus of industrial policy and those that have not. Our case studies covered 31% of service sector and 20% of manufacturing sector employment (Exhibit 9). Despite the diversity of our sample, our productivity measures were remarkably uniform and consistent with the results from the aggregate analysis (Exhibit 10).
¶ In almost all of the industries where we could measure total factor productivity, it was roughly half of best practice. In construction and retail banking, where we could only measure labor productivity, there was also a productivity gap. The only sector where we found no productivity gap is integrated steel, where POSCO has been able to implement world best practices as part of its operating practices.
¶ In most of the manufacturing cases and in telecom, capital intensity (the ratio of capital to labor inputs) was roughly equal to that of the US. In these industries the low labor productivity cannot be explained by a lack of investment.
¶ In retail and parts of processed food, capital intensity was about one-fifth of the US level. The very low level of labor productivity is in part due to a lack of investment in these sectors.
We analyze productivity differences across countries at two levels. We first explain the productivity gaps at the production level by investigating how characteristics of firms’ production processes differ between countries and companies. We then analyze how external factors, in particular the prevailing regulatory environments, affect managers’ incentives and ability to adopt best practice.
When examining the external factors, our analysis systematically considers factors arising from the “product market,” “capital market,” and labor market.”
9
¶ The “product market” analysis involves looking at the set rules and regulations that may affect competition and concentration levels, trade and foreign direct investment (FDI), and product-specific regulations (e.g., what can/cannot be offered, pricing, etc.). These factors combined determine how company managers make decisions on which products and services to offer, how they are produced, offered and priced, and how they compete with one another.
¶ The “capital market” analysis examines factors such as the availability of capital, government ownership, and corporate governance/ ownership. These factors affect how firms access and use the capital resources at their disposal.
¶ The “labor market” analysis looks at labor rules/unionism and the worker skill & trainability to understand how external labor factors affect industrial performance.
Korea has often acquired the best technology available, but has failed to adopt best managerial practices
Korea invested in the best available technology for its export driven manufacturing sectors and the telecom sector. Except in integrated steel where Korea has best practice productivity levels, labor and capital productivity is low in these industries because Korean companies have not been successful at adopting complex best practice managerial processes, such as lean manufacturing (automotive), high value chip design (semiconductors) or marketing/brand management (food processing). Lack of investments, in addition to poor managerial practices, further contributed to the labor productivity gaps in retail, retail banking and parts of food processing (Exhibit 11).
¶ Organization of functions and tasks. Differences in how work processes and workers (e.g., the organization of functions and tasks) existed in every case industry. Most industries suffered from both the absence of specific best practices which had been developed in the benchmark countries and from overstaffing the processes that were used. Among the specific best practices that were absent:
! Automotive. A large portion of the productivity gap in automotive was due to failure of the Korean firms to fully adopt three key elements of the Japanese lean production system: high standards of quality on the production line, design for manufacturability and assembly (DFMA), and collaborative supplier relationships (Exhibit 12). Korean defect rates are double that of Japanese or US plants, which increases material costs, increases the labor required in rework, and forces Korean cars to sell at a significant discount in world markets. Korean cars are more complex to manufacture and
10
have fewer common parts across models than cars produced by US or Japanese-based firms, despite the fact that the Korean OEMs produce largely volume cars. Product development teams are still highly functional and have weaker project managers than US-based firms had in the 1980s, before the US firms began to adopt the Japanese approach of a strong project team where design conflicts are resolved up front. As a result, Korean designers have had to sacrifice product quality in order to bring cars to market on time. Suppliers are less involved in collaborative design and R&D than in Japan. Finally, capital productivity is also affected by the fact that Korean manufacturers produce much less models per platform than their main foreign competitors (Exhibit 13).
! Retail banking. The productivity gap in credit and payments between Korea and the US and Netherlands was mainly due to the absence of organizational practices such as centralized credit decision making and flexible staffing of tellers. Led by specialized lenders such as Countrywide Credit and MBNA, the US banking industry has centralized and automated credit decision making, reducing staffing requirements by 50% and approval times for a home loan from 3 weeks to 90 minutes (Exhibit 14). Loan decision making in Korea is decentralized and less automated with multiple approvals for even small loans, much as it was in the US in the 1970s. Payments productivity is likewise reduced because banks are not able to staff efficiently for teller demand peaks by using part timers (Exhibit 15).
! Food processing. Differences in work practices and the organization of the production process also account for a large share of the productivity gap in food processing. In biscuits, the Korean practice of stopping production for lunch and dinner breaks creates a significant productivity penalty. Not only is the production during lunch and dinner lost, but yields are low for the first hour after the machines are restarted. Best practice plants in the US run non-stop from midnight Monday morning until midnight Friday evening to avoid these startup costs. In addition, downtime due to product changeovers and unplanned maintenance are higher in Korea.
In addition to the absence of specific managerial practices in Korea, productivity was also lower because the processes that were in place in Korea were not staffed as leanly as possible. Often this overstaffing took the form of extra hours worked. In telecom, workers still work 6-day weeks and long hours despite the fact that many managers agree that long hours are unnecessary now that the fixed line network has been built. They argued that the unnecessarily long white collar hours are driven by corporate cultures which reward face time but are less likely to recognize high personal productivity. In automotive, unions
11
have resisted multi-skilling and cuts in overtime hours. Internal industry reports have estimated even before the reduction in demand in late 1997, total hours worked could be reduced at least 15% without reducing output or changing processes. Construction sites, steel minimills, and both small retailers and department stores were similarly overstaffed.
¶ Product/service mix and marketing. In addition to less efficient and overstaffed processes, Korean productivity also suffered from a sub-optimal mix of products and services and/or from poor marketing. Korean industries suffered from three general problems: they produced lower productivity products and services (e.g., construction, retail banking, retail, semiconductors, steel minimills), too many products (e.g., auto, steel minimills), and failed to market their products well (e.g., processed food, telecom). In many cases, firms’ product mixes were directly influenced or even dictated by product market regulations; the role of these regulations will be discussed in the next section.
! Lower productivity products. The most common of these problems was producing products and services that either provided less value to the customer and/or were more input-intensive:
– Retail. Retailing in Korea is dominated by the small, inefficient, mom-and-pop stores which were common in the US and Europe in the 1950s and 1960s (Exhibit 16). Specialty chains account for only 20% of general merchandise retail employment in Korea, compared with 53% in the U.S, and discounters are only starting to make inroads in Korea. These advanced formats are 2-4 times more productive than traditional stores because they are able to simultaneously provide a better shopping experience for customers while incurring lower operational and merchandise costs. Advanced formats focus on a particular value proposition (e.g., low price, high service, convenience) or segment of customers, saving customers time by allowing them to go to a particular store for a particular shopping environment or type of item. In addition, these formats achieve lower costs through centralized purchasing marketing, integrated logistics, and information systems which allow them reduce inventory costs and better target customers’ demand.
– Retail banking. In addition to the part-time staffing issue mentioned earlier, productivity in processing payment transactions is also lower in Korea because the mix of transactions is much more paper-based than in the Netherlands and is much more reliant on the teller than in both the Netherlands and the US
12
(Exhibit 17). Since paperless transactions are 3-16 times more productive than teller transactions, this creates a substantial productivity penalty. In addition, Korean productivity is also penalized by the high density of its branch network, and thus the lower scale of each branch. There are 50% more bank branches per capita in Korea than in the Netherlands, with half the number of banking transactions per capita and higher population density. Korean banks are sacrificing productivity to offer an exceptionally high level of convenience, probably beyond the point where it is valued by the customer.
– Semiconductors. The Korean semiconductor industry has focused on producing dynamic random access memory chips (DRAMs) which require the same manufacturing capability but fundamentally less demanding design capabilities than higher value products such as microprocessors. As a result, Korea’s total factor productivity in 1996 was only 50% of the US. Furthermore, Korean companies are on average more than 30% less productive than Micron, the only specialized American DRAM producer and benchmark for the industry. Micron achieves higher productivity due to superior design for manufacturing which allows it to produce more gross die (chips) per silicon wafer and use fewer layers per chip (Exhibit 18).
– Housing construction and steel minimills. Both the construction industry and steel minimills have also suffered product mix-related productivity penalties. Construction firms have been forced to focus on standardized low value multi-family housing, which provides firms less value added per hour worked than single-family homes. Steel minimills have produced more of the least attractive long products (e.g., reinforcement bar) instead of the higher productivity products (e.g., H-beam or hot rolled coil) produced by minimills in Japan and the US.
! Product proliferation. In addition to these industries producing lower productivity products, the auto and steel minimill industries produced too great a proliferation of products. The Korean auto industry produced small quantities of luxury cars and sport utility vehicles for the domestic market, instead of focusing on producing only those models at which it could reach minimum efficient scale. Even within the volume segment, the Korean OEMs produced a wide range of both platforms and models instead adopting the Japanese and US practice of producing multiple models from a single platform. It is doubtful that producing such a wide product range would be justified based on the incremental profitability of each product. In steel minimills, individual Korean mills also produced
13
more products than their Japanese counterparts, which created a similar productivity penalty.
! Marketing. Poor marketing led to underutilization of the network in telecom and left the Korean processed food industry producing too many poorly-selling products. In the telecom industry, network utilization (and thus capital productivity) was low despite relatively low prices. US telecoms achieve higher call frequency and call completion through heavy promotion of both business and personal telephone usage and call completion services such as voice mail, call waiting, and toll-free calling. By not conducting similar marketing efforts, Korean telecoms are missing an opportunity to encourage Koreans to conduct more business over the phone, rather than in person. In processed food, product life cycles were shorter and sales per product much lower than in the US. Korean confectionery firms did less careful market research than in the US before launching products, and less marketing effort was put into creating high-value added branded products. Korean firms introduced a preponderance of “me-too” products with little unique branded appeal, and producing all of these products created a significant productivity penalty. Marketing skills are also important in other industries. For example, migrating banking customers to higher productivity payment instruments requires marketing skills, especially when the pricing of transactions is regulated.
¶ Capacity utilization. Even before the slowdown in growth in late 1997, several Korean industries had lower capital productivity due to low capacity utilization. Published capacity utilization figures are usually not comparable across countries, since managers measure capacity based on their own experience. In order to accurately determine the impact of capacity utilization, we had to visit comparable plants in Korea and in the best practice country and construct a consistent definition of capacity. When we made these comparisons we found capacity utilization differences that were often related to the product proliferation, marketing, and organizational problems discussed earlier. Differences in capacity utilization help explain how Korea had reached best practice levels of capital intensity in many industries without reaching best practice productivity.
In auto and processed food, investment in the production of small volume products lowered the true utilization of plant and equipment. In automotive, extra capital was required to produce luxury cars and sport utility vehicles (SUVs) and to support the lower degree of parts commonality in Korean volume cars. In processed food, capacity utilization was reduced by the need to switch products more frequently and by the fact that dedicated lines had been built to produce products
14
which had sold less than anticipated. In the US, firms avoid these problems by segmenting products into high-volume products, which are produced in a dedicated plant, and low-volume products, which are produced in a plant designed to handle frequent product changes (Exhibit 19). Some US firms also produce products at lower capital intensities for the first few years after introduction until their success and projected volume are well known, and only then invest in more automated production. The absence of these practices helps explain why the industry’s overall capital intensity was similar in Korea and the US while significant areas of the production process (e.g. packaging) were less automated in Korea.
Firms’ failure to correctly estimate demand and plan capacity in individual products raises questions about how effective Korean industries will be at planning their capacity if economic growth slows. In two industries, automotive and steel, there were signs of a general overcapacity developing even before the slowdown in growth in 1997. In mid-1997 the automotive industry was planning to increase its capacity from 4 million cars in 1996 to 6 million in 2000 despite the fact that domestic and export sales were forecast to increase less than 400,000 (Exhibit 20). In addition POSCO is adding another 5 million tons of blast furnace capacity at Kwangyang despite the fact that Korea appears to be at the top of the steel intensity curve and there is significant overcapacity in the world market3 (Exhibit 21).
¶ Lack of investments. On the other hand, many sectors have been left underinvested. We discussed how labor productivity has been further depressed by a lack of investment in retail, retail banking and parts of food processing.
! Retail. Traditional mom and pop stores still dominate the trade. These stores require much lower levels of investment in information technology and building structures than the large modern formats. Combining top down estimates with our field visit findings, we estimated the Korean capital stock per capita in retail to be only at around 25% the US level.
! Retail banking. Although the number of branches per capita is high in Korea, Korean banks invested much less in information technology than western banks. This was largely due to the preponderance of paper-based transactions and the failure to adopt managerial best practices in centralizing/automating back office and
3 Steel demand is sensitive to both a country’s income level and its rate of income growth. If Korean
economic growth slows dramatically in 1998, steel demand could be significantly below the curve in Exhibit 19.
15
credit approval processes. We estimated the IT stock (per unit of output) in Korea to be at around 40% the US level, and despite the need to catch up, current IT spending per output is only at around 60% the US level.
! Parts of food processing. Even, within manufacturing, we found that some (non export driven) food processing subsectors like wet corn milling or noodles have also been left underinvested. Plants in these sectors are far from the efficient scale, and processes much less automated. Here again, capital intensity was only at around 30% the US level.
Transfer of managerial knowledge impeded by product, capital, and labor market barriers
It is conceivable that the absence of managerial best practices in Korea could just be a result of its stage of development and lack of experience in industries in which managerial best practice can only be developed by learning-by-doing. This would be a very pessimistic conclusion, since it would imply that there is little potential to quickly close the productivity gap and that improvements in the microeconomic performance of industries will not be a source of macroeconomic improvement to help Korea out of the 1997-98 economic crisis. Fortunately, we find that Korea’s relative lack of experience is no more a barrier to transferring managerial practices from high productivity countries than it was a barrier to transferring technical knowledge. Experience is important in some industries (e.g. semiconductors, automotive, processed food), but experience can be substituted for by foreign direct investment or joint ventures.
The major reason managerial best practices are absent from Korea is that barriers in the product, capital, and, to a lesser extent, labor markets reduce managers’ incentive and ability to adopt best practices (Exhibit 22). Product market regulations restrained the development of more productive products and services and reduced the competitive pressure on managers, especially from global best practice companies. In the capital market, the corporate governance system in Korea reduced managers’ incentives to focus on productivity. In the labor market, regulations and union-negotiated work rules reduced the ability of managers to improve productivity in some industries. Despite the attention that these labor market barriers received, the capital and, even more so, the product market barriers are actually much more important in explaining low productivity in Korea.
¶ Product market. Product market barriers contributed significantly to lower productivity in every industry except semiconductors and integrated steel. These product market barriers affected productivity in three broad ways. Product regulations prevented the development or
16
entry of more productive products or services and closed off opportunities for profitable investment. Barriers to imports and FDI reduced the competitive pressure on managers from best practice competitors. Competition and concentration rules limited the scope and intensity of competition among domestic firms.
! Product regulations. As alluded to earlier, many of the differences in the mix of products and services which firms produce are due to regulations. These regulations limit potential productivity improvements by both domestic firms and potential foreign entrants. In some industries (e.g. retail) these barriers are actually more important than explicit barriers to FDI in limiting the transfer of higher productivity to Korea by foreign firms. Product regulations have been found to be the most important barriers to productivity and output growth in all the four service sectors we studied. Product market regulations are usually put in place to achieve specific policy goals, such as protecting small firms or promoting rapid growth of a particular type of output, but often have the unintended consequence of reducing productivity. In the last section of this chapter, we will discuss potential alternative ways of meeting these policy goals that have smaller productivity costs.
– Retail. The Construction and Urban Planning Acts prohibit stores of over 1000 square meters on over 98% of the urban land in Korea. Since most advanced formats require stores larger than 1000 square meters, this regulation severely limits the development of more advanced stores. In addition, the National Land Usage Management Act restricts the construction in agricultural areas of large stores especially department stores and high service specialty chains (shopping malls) which require larger land lots than discounters and hypermarkets (Exhibit 23). These regulations are designed to protect small independent stores and promote agricultural self-sufficiency but they do so at the cost of reducing by at least 50% the productivity of one of Korea’s largest industries. Furthermore, the absence of large independent retailers reduces the competitive intensity among suppliers.
– Housing construction. Strict zoning laws also constrained drastically the supply of single family houses which only account for 20% of new housing construction against 70% in the US. Although land is more scarce in Korea than in the US, large land areas (for example within the greenbelts) could be made available for large single family housing programs (the most productive form of housing construction which is non existent in Korea). For example, 50% of new housing construction in The Netherlands
17
(which is also land constrained) consists of large single family housing programs. As part of its program to construct 2 million new affordable housing units in 1989, the government set a maximum price which can be charged for an apartment in a building with 20 units or more. This price, which was relaxed recently in areas outside of Seoul, is currently only 65.8 million Won for a basic apartment or 74.2 million Won for an apartment with higher quality fixtures. This price cap, while well intended, reduces productivity by encouraging builders to construct only units with low quality materials and limited content. Many Koreans immediately renovate their units after purchase or pay a premium to live in smaller buildings were the regulations do not apply. The overall effect of this regulathory approach is the creation of a less efficient construction sector than allowing builders to build units with the quality and content demanded by their customers (Exhibit 24).
– Telecom. Telecom regulators have set higher marginal prices for local calls than regulators in the US, where most customers pay only a monthly charge and can make unlimited local calls. This pricing scheme is economically more efficient, since once the network is built the marginal cost of a call is almost zero. The availability of free local calls over a long period of time has contributed to the very high levels of usage in the US. Regulators also put in place rules that limit price competition. For example, DACOM was required to maintain a limited discount once its market share grew to a preset level. In addition, regulators have not encouraged the development and marketing of call completion services which further increase usage. These policies date from the 1980s, when regulators actively discouraged usage since Korea was still building its network and had limited switching capacity. Now that the network is built, its utilization and thus its value to society could be increased by revising these policies.
– Retail banking. Pricing restrictions is preventing banks to price payment transactions to cost. As a result, the payment mix is biased towards inefficient means of payment such as cash withdrawal at counters. Product regulations also prevent banks to differentiate the offering and the price of lending and investment products which directly affects both productivity and output.
! Barriers to imports and FDI. In addition to using product regulations, the Korean government has also sought to protect existing firms from foreign competition through barriers to trade and
18
FDI. Isolating firms from foreign competition reduces the pressure on managers to adopt best practices. In addition, barriers to foreign direct investment prevent foreign-based firms from bringing best practices and the associated high productivity levels into Korea.
– Automotive. The auto industry is perhaps the most widely discussed example of trade barriers in Korea. In the late 1980s, the industry was protected by tariffs of up to 50%. As part of the GATT and WTO process, Korea has reduced these tariffs to 10% in 1996, but imported cars still account for less than 1% of the Korean domestic market (Exhibit 25). Non-tariff barriers continue to limit the penetration of imported cars; examples include an outright ban on importing cars assembled in Japan, limitations on the size and ownership of dealer networks, restrictions on advertising, taxes which disproportionately affect imported cars, and tax audits of foreign car owners.
. This protection has had three negative effects on productivity. Protection has led to lower productivity by encouraging Korean managers to focus on volume at the expense of quality by allowing the Korean industry to sell 60-70% of its output in a domestic market where higher quality products are not available. Protection has also encouraged OEMs to excessively diversify their product lines and serve the entire domestic market instead of focusing on the models that they can produce with high productivity. Furthermore, protection has allowed labor unions more leverage in resisting reductions in overtime and reform of work rules and in not cooperating to reduce absenteeism.
. A rationale that is sometimes used to justify protectionism involves the need to protect “infant industries” with long learning processes (e.g., automotive) to allow them to develop. There are two main problems with the infant industry protectionism that has been given to Korean industry, however. First, Korea did not need to develop its own industry from scratch.4 Some countries (e.g. the UK, Spain) have markedly increased the productivity of their industry by attracting transplants and, often after a honeymoon period, exposing them to international competition.5 With both low labor costs
4 It is worth noting that so long as Korean investors have an opportunity to invest in the multinational
which is entering Korea, the Korean economy receives the same benefit (i.e. high productivity jobs and the opportunity to own high productivity capital) from attracting FDI as it does from developing its own industry.
5 Exposing automotive transplants to international competition has proven to be the key to ensuring that the industry both enters at and maintains high productivity. Many countries have attracted transplants
19
and a growing domestic market, Korea would have been an attractive location for a transplant in the mid-1980s.
. Second, even with the decision to develop a Korean-controlled industry, infant industry protection has lasted too long – it is difficult to consider Korea’s auto industry as an infant when it is the 5th largest auto producer in the world. A lack of experience and small scale cannot explain the whole productivity gap with Japan; productivity could be higher if the Korean industry had been exposed to more competition earlier. Korean productivity is much lower than Japanese productivity was after a similar amount of experience. The number of vehicles produced per employee of Hyundai (the most productive Korean automaker) in 1996 was only 60% of Toyota’s productivity in 1974, the years in which each company had 20 years of experience producing at least moderate volumes (Exhibit 26). This was despite the fact that Hyundai had the advantages of more automation and Toyota’s example to follow. Scale is no longer a significant factor limiting productivity, the scale of the Korean industry is now large enough that all of its non-SUV or luxury car models can be produced above minimum efficient scale.
– Steel minimills. The steel minimill industry has also been protected from foreign competition by tariff and non-tariff barriers on long products. Infant industry protection is much less justified in the minimill industry than in the auto industry, since the minimill industry is an easier industry in which to reach best practice. The US minimill industry contains over 20 competitors, some of whom are recent entrants. The intense competition among the US minimills has forced all of these minimills to operate at very close to best practice productivity levels, and the firms have proven that it is possible to do so with limited experience.
– Food processing. Since food is bulky, often perishable, and vary more than for other manufactured goods due to local tastes, international competition in processed food occurs more through FDI than through trade. Restrictions on foreign ownership and cumbersome registration requirements have kept best practice food processing firms from producing in Korea or forming joint ventures with Korean companies. These foreign companies could have brought experience in test marketing, launching products,
but then protected them for long periods of time, which has resulted in low productivity (e.g., Brazil, Australia, South Africa).
20
and developing branded products. This would have helped avoid the low capacity utilization that resulted from the high number of poorly selling products.
! Competition rules. In addition to reducing the pressure from foreign competition, Korean regulations also distorted and limited domestic competition in some industries. For example, entry barriers such as permission and/or registration requirements were still required for 205 out of 325 sectors (4-digit sic code) in 1995. Regulations limited the expansion of high productivity companies into other segments of the industry and prevented firms from competing on consumers’ key buying factors (price and product offerings), forcing them to compete wastefully on less important issues.
– Steel. In the steel industry, POSCO has been implicitly encouraged to not compete with minimills in specific long products. This has removed another potential source of competition which could have forced the minimills to improve their productivity. The regulators do have legitimate concerns that POSCO, as a state-owned firm with a strong market position in flat products, could cross-subsidize its long products and thus have an unfair competitive advantage.
– Retail banking. Until recently, regulators fixed deposit and lending interest rates and restricted the introduction of new deposit and transaction products, preventing banks from competing on either price or product offerings. As a result, banks competed instead on convenience, building a dense branch network and taking a very conservative approach toward migrating their customers to more productive transactions. In order to limit personal borrowing and thus increase the national savings rate, regulators have also restricted the development of new loan products such as high loan-to-value home loans and prevented the entry of specialized lenders (e.g., Countrywide Credit) which have higher productivity business systems. This has further reduced productivity in lending and competitive pressure in the whole industry.
– Food processing. There are in Korea regulations which specify the sectors in which companies can compete according to their size. This effectively prevented the consolidation of many food processing subsectors such as noodles, soybean curd, corn oil, polished rice and starch.
¶ Capital market. In a country in which capital is still relatively scarce (compared with developed countries) and access to large amounts
21
capital is arguably limited to a small number of firms, one would expect returns on capital to be fairly high. The fact that return on invested capital is both lower than the cost of debt in Korea and well below returns in the US suggests that capital is not being allocated properly (e.g., selected industries and favored companies received more capital than their operating performance would justify) and/or the return on capital is not being maximized once it is allocated (Exhibit 27).6 Our investigation of the corporate governance of Korean industrial and financial companies confirms that both of these problems exist in Korea (Exhibit 28).
! Industrial sector corporate governance. Effective corporate governance requires that top management’s objectives be aligned with maximizing shareholder returns, that companies have transparent measurements of aggregate and subsidiaries’ performance, and that mechanisms to remove or discipline underperforming managers are in place.
– Management objectives. Since family owners own controlling interests in most of the top 30 Chaebols, top management’s objectives should be to maximize shareholder value7. In the past Korean companies had a strong incentive to focus on sales growth rather than returns. When Korean companies were small, achieving economies of scale and distribution were critical to increasing productivity and shareholder value. In addition, land values were increasing rapidly and the government prohibited the “speculative” holding of real estate; sales growth and investment provided the additional opportunity to purchase and hold real estate. By the 1990s, these conditions had changed, sales growth and maximizing shareholder returns had become at times conflicting goals. Korean businesses have been slow to internalize these changes. Prestige is still associated with the size of sales or sometimes the volume of profits instead of return on equity or shareholder value creation. Prestige has also been associated with entering high-profile industries, such as auto or semiconductors.
6 Using ROIC as a measure of returns on operations alone may have been biased in the case of Korea if
many companies invested heavily on real estate, boosting invested capital, without using that land to increase cash flow earnings from operations. However, given that the ROIC figures are directionally consistent with both our physical return on investment measures (Exhibit 33) and capital productivity findings in our industry cases, we believe that this effect is not large enough to change the main message of exhibit 27.
7 A common measure of the shareholder value creation in a given year is Economic Value Added (EVA), defined as capital employed times the difference of the return on invested capital and the cost of capital: (ROIC - WACC) * CE. As can be seen from this formula, growth increases shareholder value ONLY IF the incremental return on capital is above the cost of capital. On average, Korean firms’ return on invested capital is at or below their cost of debt (which is, in turn, less than their weighted-average cost of capital). Thus, on average, Korean firms have been destroying shareholder value when they grow.
22
In the case examples discussed below, Korean companies traded off shareholder returns and productivity for higher sales or market share.
– Transparent measurements. In addition to, and perhaps because of, management’s objective of maximizing sales growth, Korean firms have not developed transparent measures of productivity or shareholder returns. Korean conglomerates do not report consolidated accounts and Korean accounting standards are not consistent with international standards. This reduces the ability of non-insiders (or even insiders) to evaluate the true performance of a firm. Transparency was not pushed by Korean banks as they were content with land as collateral and cross debt guarantees within Chaebols and implicit government guarantees on loans to the “preferred” companies and industries. Measures of return on invested capital are not used to evaluate the performance of individual business units, projects, or products. For example, many Korean processed food companies do not measure the profitability of individual products, and this makes it more difficult to rationalize product lines. In addition, benchmarking of operational performance measures against best practice companies is less common than in the US or Europe, especially for capital productivity-related measures. This leads to top management having less knowledge about the potential for productivity improvement.
– Disciplinary mechanisms. Internal discipline is harder to achieve due to corporate governance rules that weaken minority shareholder rights and the power of the board. The availability of debt financing up to very high degrees of leverage also reduces the number of minority shareholders. External discipline is difficult to impose because of bans on hostile takeovers, limitations on mergers and acquisitions, and the size of some of the companies involved.
The automotive, food processing, and semiconductors cases provide examples of where sales and/or prestige has been emphasized ahead of shareholder returns, situations which may have been prevented by better measurement or disciplinary mechanisms. In all three examples, greater emphasis on shareholder returns would have led to higher productivity. As mentioned earlier, government regulation of the telecom and housing construction industry also reveals a bias toward growth at the expense of productivity.
– Automotive and food processing. The excessive product proliferation in autos and high number of poorly selling products
23
in food processing can be traced to a corporate emphasis on sales growth and a lack of emphasis on productivity and shareholder returns. In auto firms, plant and corporate-level managers are evaluated on volume; quality and profitability have been secondary. In food processing, emphasis on sales growth and maintenance of market share prompted the rapid introduction of products which led to poor capacity utilization. Companies we interviewed admitted they produced “me-too” products and did not retire poorly selling products in order to maintain market share even if these decisions hurt their long-term profitability.
– Semiconductors. Korean managers have concentrated on market share or sales growth rather than shareholder value. This provided Korea with the opportunity to attain higher market share and sales in DRAMs and become a major player in a prestigious “high-tech” industry. An enormous amount of capital was therefore allocated to the industry with a questionable risk/reward tradeoff in traditional returns measures, particularly given that three firms entered the industry at about the same time. This is a high fixed cost business with relatively low barriers to entry. Even Micron, the best DRAM manufacturer (at least 30% more productive than the Korean players) had lower returns on equity than the average S&P company (16 versus 17% in the last 14 years).
! Financial sector corporate governance. Parallel problems exist in corporate governance in the financial sector. The Korean government owns significant shares of some of the largest banks, and is very influential in the appointment of the CEOs of all the most important banks. The objectives of management are therefore more aligned with the government’s industrial policy or political priorities than with the shareholders of the bank. CEOs of banks change frequently, which further reduces accountability, since the quality of lending decisions is often revealed only over the long term.
These issues reduce the incentives for the financial sector to ensure that capital is allocated to the industries in which it will yield the highest return. The result has been a very uneven allocation of capital within the Korean economy. Favored industries have received so much capital that they have capital intensities which are comparable with or higher than countries with aggregate capital per worker 2-3 times higher than Korea. This is despite the fact that capital productivity and returns in most of these industries are low, and that much higher returns and marginal capital productivity are available in less favored industries (e.g., retail).
24
¶ Labor market. In addition to having their incentive to increase productivity reduced by product and capital market barriers, in some industries managers also had their ability to increase productivity constrained by labor market regulations and union-negotiated work rules. Due to the high growth environment, labor market barriers were relatively less important than product or capital market barriers in explaining current Korean productivity. Nevertheless, these barriers are worth examining since they, like the product and capital market barriers, will require reform if Korea is to close the productivity gap.
The three broad issues are firms’ inability to layoff workers, barriers to using part-time workers and more flexible working hours, and barriers to production process reorganizations that involve redefining workers’ job content.
! Barriers to layoffs. Our case studies revealed that the steel minimill, auto, and parts of the processed food industry (e.g., corn milling) were constrained by the Korean tradition of not laying off workers. In addition, the personal financial services, telecom, construction, and retail industries have overstaffing problems which may require layoffs to correct fully. In the case of corn milling, layoff barriers slowed the modernization of the industry, since firms could not justify investment in modern equipment when they already had surplus labor.
! Barriers to part-time/flexible hours. In processed food and retail banking, productivity could have been improved if firms were able to use more part-time workers (e.g., as tellers) and/or more flexible working hours (e.g., operating confectionery machines on three shifts and staggering lunch and dinner breaks). In addition, developing a modern retail industry will require extensive use of part-time and seasonal workers. In the US, 35% of retail workers are part-time.
! Work rules. In the auto industry, implementing lean production requires workers to work in teams and lead the process of identifying potential improvements. As the production process becomes lean, it also becomes more fragile and thus less able to absorb absenteeism, poor quality work, or low effort levels – characteristics that are widely seen in Korean auto companies. Korean unions have resisted the implementation of lean production by resisting revision of job descriptions or increases in work intensity.
In one industry, semiconductors, industry experts told us that the development of the industry was limited by the failure of the Korean education system to produce engineers with the creativity needed to be good chip designers. Many others have criticized the Korean education
25
system in the same way. Unfortunately, these arguments are very difficult to test rigorously. There are several reasons, however, to be suspicious of arguments that place too much blame on the Korean educational system.
! These types of arguments about education have been wrong before. In the mid-1980s, US auto manufacturers blamed their quality and productivity problems on the fact that US high school graduates did not enter the workplace with sufficient discipline or with the math needed for statistical process control. It took the entry of the Japanese transplants, who reached Japanese quality and productivity with US high school graduates, to dispel this myth.
! The Japanese educational system is also criticized for not teaching creativity, and yet its graduates design Toyota and Honda cars, the most manufacturable and highest productivity cars in the world. Interestingly, the Japanese education system has not been a barrier to the transfer or even the development of management best practices in industries like auto, steel, metalworking, and consumer electronics. This suggests that the explanation for low productivity in other industries in Japan (e.g., food processing, retail) lies elsewhere.8
! Even if the Korean system fails to teach creativity as well as the US system, international tests suggest that it teaches math and science (which involve critical thinking and problem solving) better than the US system. It is not clear why the net effect of the differences between the Korean and US education systems should be negative for Korea.
Improving the Korean educational system is certainly a topic for further discussion, but it is almost certain that significant progress can be made towards solving Korea’s productivity problem without waiting for the benefits of improved education.
¶ Lower income levels. The fact that Korea is at 50% of US level of GDP per capita has a relatively small indirect impact on productivity as it leads to a lower value product mix being produced (very often by the same machines and workers). For example, lower income would lead to less demand for higher value houses (more productive to build) and for higher value banking services. In addition there would be, as a result of lower income, less payment transactions and presumably call minutes (affecting the utilization of the payment and telecom networks). In fact, we have seen that product market restrictions are directly impeding the evolution towards an higher value product mix in retail banking,
8 See McKinsey Global Institute, Manufacturing Productivity, 1993.
26
telecom and housing construction). Thus, lower income levels should be seen much more as an effect of lower productivity rather than as a primary cause.
Combined impact of these regulations on competitive intensity
The most important driver of productivity growth is intense competition, notably with global best practice companies. Although many Korean companies feel that they are subject to intense competition both in Korea and in export markets, they were in fact relatively protected, especially from foreign best practice companies, by the prevailing regulatory environment.
¶ In the manufacturing sectors, explicit or implicit (e.g., no access to distribution channels) barriers to imports of manufactured goods and FDI effectively kept foreign companies out of the Korean markets. In addition, we found that, although in most sectors there were several Korean companies “competing” in Korea, they rarely did so on prices which are consistently higher than in export markets (e.g., cars). Several factors explain this:
! Korean manufacturers tended to develop new markets at the same time, with similar technology (e.g., semiconductors). Thus, there are very few cases of a Korean company capturing a decisive competitive advantage over its domestic competitors.
! Even when a manufacturer captured a significant advantage over its competitors, there was little chance to drive a competitor out of business because of cross subsidization and privileged access to bank financing.
! Furthermore, distribution channels are either fragmented or controlled by manufacturers, making price-based competition more difficult.
! Finally, this herd mentality allowed Chaebols to be more competitive on export markets due to higher domestic prices. In effect, one of the key conditions to benefit from privileged access to bank financing was to be a major exporter.
¶ In the service sectors, product market restrictions limited competition:
! In retail, although there is some competition among existing players, zoning restrictions prevented the development of large modern formats, notably by foreign companies.

27
! In housing construction, the scarcity of land due to zoning laws and the price cap also led to lower competitive intensity; housing is being allocated through lottery and product differentiation is very difficult.
! Price regulations on interest rates prevented price-based competition in retail banking, and product restrictions impeded the entry of foreign specialized providers.
28
3) CURRENT CRISIS CAUSED BY POOR ECONOMIC FUNDAMENTALS
We believe that the 1997 financial crisis is more than a mere liquidity crisis caused by inflexible foreign exchange policies by the Central bank. Based on our sector case findings, we can explain how the regulatory barriers and poor corporate governance in banks led to low capital productivity, which fundamentally made Korea vulnerable to a financial crisis.
Starting in early 1997, a number of Korean Chaebols went bankrupt due to weak operational performances and high leverage ratios. Given their presence in the Korean economy in terms of overall size and bad debt levels, the collapse of these Chaebols created a ripple effect throughout an already shaky financial system – especially the merchant banks and commercial banks. The magnitude of these corporate bankruptcies and their impact on financial institutions created nervousness among international investors, who started to withdraw funds and stop lending to Korean institutions. This situation turned into a foreign exchange crisis when the government depleted foreign reserves through a series of inadequate actions to protect the Won and help merchant banks meet foreign obligations – all done without full disclosure of the situation. As a result of this process, foreign investors started refusing to roll-over maturing loans, which initiated a chain reaction that created a liquidity crisis in the economy and necessitated an appeal to the IMF for help. Financial institutions helped cause a downward spiral of entire sectors in the Korean economy by tightening lending and calling loans when they were no longer able to raise funds in the international market. A significant number of companies, including relatively healthy ones, started suffering from a credit crunch and went into bankruptcies (Exhibit 29).
Poor corporate governance in banks and companies which led to poor use and allocation of capital is often cited as the main cause for the financial crisis. While these two factors are true, we believe that product market regulations also played a role. These regulations encouraged companies to enter businesses in which they had no competitive advantages (barriers to imports and FDI) and prevented them to enter industries in which the returns could have been higher (zoning laws in retail). At the micro-level our study shows that the current crisis was largely caused by low capital productivity, especially in capital-intensive manufacturing industries.
29
Low capital productivity, particularly in capital intensive manufacturing industries, led to low financial returns
Although Korean firms record operating profits, the average return on invested capital (ROIC) has been below the cost of debt9 in many industrial sectors (Exhibit 30). This means that many industries and companies actually destroyed value over several years since they were unable to generate sufficient profits to repay their loans. Bankers may have been content with the rapid appreciation of land collateral until the early nineties. But lending to these companies continued even after their poor operational performance was no longer compensated by profits on land (Exhibit 31).
Given that capital return (ROIC) is driven by capital productivity, the increased vulnerability of the Korean economy can actually be traced back to the inefficient use of capital observed in our cases. Many capital-intensive industries (e.g., semiconductors, auto, and processed foods) have low capital productivity while using US-levels of capital inputs (Exhibit 32). This in turn led to low returns on capital investments (Exhibit 33). We explained in the previous section how, not only weak corporate governance of banks and companies, but also barriers to imports and FDI led to low levels of productivity, notably capital productivity in the capital intensive manufacturing sectors.
Poor corporate governance and, to a lesser extent, product market regulations are among the fundamental causes of the crisis
The failure of corporate governance in both banks and companies led to the continuous injection of capital to industries/companies with low capital returns. While some of these corporate governance problems were unique to Chaebols, most of them are generally applicable to all Korean companies.
Korean companies started in an environment where growth was the key driver of increasing shareholder value. Growth was based on investments financed by leveraging constantly appreciating asset prices and high domestic prices in protected markets. In addition, large companies had privileged access to the best human capital and government favors.
The way Korean companies implicitly pursued their objectives, however, became ineffective as the environment changed in the nineties, which brought a brutal stop to the continued increase in land prices, wages rising faster than labor productivity and less protected markets. These environmental changes drove Korean companies’ profitability substantially lower, and the old size and sales
9 Since most Korean companies are highly leveraged, the cost of debt was used as a proxy for the
weighted average cost of capital (WACC). Land value changes, either realized or unrealized, are not included in the ROIC measure.
30
metrics no longer correlated with favorable factors unrelated to real business performance. Despite this, companies continued, with the support from banks, to make undisciplined capital investments in pursuit of growth.
This failure in corporate governance in industrial companies resulted from a series of factors:
¶ Korean companies failed to adopt explicit measures such as ROIC (return on invested capital) and EVA (economic value analysis), which would have reflected their true profitability. Lack of transparency, also resulted from the Korean business practice of cross-guarantees. These practices prevented business managers and their creditors from understanding the true performance of their businesses.
¶ Poor performing firms were not penalized due to a series of factors, including vague rules governing bankruptcies, lack of mergers and acquisitions activities, no possibility of hostile takeovers, weak minority shareholder rights and continued access to bank financing (even after land prices stopped rising). Consequently, poor performing companies were allowed to persist in situations where they should have been removed from the market (e.g., executives replaced by better ones or companies shut down).
¶ Korean companies also lacked the guidance and discipline imposed by an external board of directors, which would have balanced decision-making among the interests of the largest shareholders, minority shareholders, and professional management.
In addition, corporate governance failures also occurred within financial institutions (Exhibit 34). In the fast growing Korean environment, bank loans (rather than retained earnings) were the key source for business financing. Furthermore, Korean banks had a quasi monopoly in the intermediation of funds because of underdeveloped capital markets and regulations preventing Korean savers to invest abroad. Financial discipline was not imposed by banks because of the long history of government protection and interference (implicit or explicit guarantees on both banks’ assets and liabilities). The banks have been historically the government’s instrument to ensure that most financial resources are allocated to the export driven manufacturing sectors.
Under these conditions debt has been the financing vehicle of choice – it was cheaper than equity and prevented ownership dilution. High growth, preference for and unlimited access to bank financing led, together with depressed earnings, to extraordinarily high debt to equity ratios.
The combination of poor operational performance (low capital productivity caused by product market regulations and poor corporate governance in companies) and high debt to equity ratio (caused by poor corporate governance in banks) fundamentally made Korea vulnerable to a financial crisis. In addition,

31
regulations inhibiting growth in the service sectors, such as zoning regulations in the retail and housing construction industries, also indirectly contributed to the crisis by precluding companies from potentially attractive investment opportunities.
32
4) KOREA’S FUTURE OUTLOOK
Following the 1997 financial crisis, Korea is at a crossroads with respect to its future long term economic policies. We believe that Korea has essentially the choice between three possible routes:
¶ Scenario 1: No fundamental reforms. Korea could decide not to engage in any fundamental reform of the economy in the belief that the old regime would allow it to return to its past strong growth, the 1997 financial crisis being a mere unfortunate liquidity accident along this path.
¶ Scenario 2: Reforms of the financial and manufacturing sectors. The second route would be for Korea to profoundly reform its financial and manufacturing sectors. This would be achieved by improving the supervision and governance of the banks and by removing the explicit barriers to imports and foreign direct investments (FDI). This route would be consistent with the program agreed with the IMF. We do not discuss in this report the macroeconomic dimension of the IMF program.
¶ Scenario 3: Additional reforms in services. Finally, we believe that there is a third route open today to Korea. Korea could turn the current crisis into a “once in a life time” opportunity to engage in a systematic and thorough process of economic reforms. The required reforms would go far beyond the structural reforms included in the IMF program by also encompassing the removal of the restrictive product market regulations in services such as the stringent and opaque zoning laws in retail. Because they are deeply entrenched in the sectors and because they tend to benefit existing players, these barriers are often overlooked and their aggregate impact on the economy is widely underestimated.
Approach and methodology to evaluate policy options
In order to help policy makers “visualize” the implications of their future decisions, we have evaluated these three broad strategic options along both economic and social yardsticks. Our quantitative evaluations are based on the unique microeconomic fact base that we have accumulated over the last year in Korea (Exhibit 35). They also crucially rely on similar analyses that we have conducted for the countries which have preceded Korea in terms of economic development, namely, Japan, France, Germany and the US. We summarize below our approach; more details can be found in Appendix A.
33
¶ Our quantitative estimates for each scenario are averages over a ten year period. The year 2000 has been chosen as the starting point because our intention is to estimate Korea’ s growth potential once the effects of the current financial crisis have been overcome as well to allow sufficient time for the proposed reforms to be implemented. Given that our intention is to illustrate the effects of alternative sets of economic policies, not to predict likely outcomes, we have chosen to use the 1995 numbers for the year 2000 starting point estimates because it is the last year for which a complete and consistent set of measures are available at both the aggregate and case levels.
¶ Output growth can be decomposed into labor productivity growth and labor input growth. Our labor productivity growth is derived from generalizing our industry level estimates for future labor productivity growth. The evolution in labor input is based on demographics as well as an assumption on the future level of voluntary labor inputs. We then use benchmark countries to estimate the future allocation of output in the economy; because of general equilibrium effects, output allocation can not be estimated from the bottom up.
¶ The investment rate required to accommodate the growth potential is determined by generalizing the case-based estimates for the evolution in capital productivity.
¶ The future employment allocation is derived from the case-based labor productivity estimates and the benchmark-based output allocation. The structural unemployment rate is based on the future productivity distribution (as a proxy for wages) and assumptions on the future level of the minimum wage and unemployment benefits.
We synthesize below our results by contrasting the three scenarios with respect to output growth, investment requirement and employment. An overview for each scenario can be found in BOX 1 and the detail facts and analyses, notably the case-based estimates, are in Appendix B.
Findings from the scenario analyses
We found that the only way for Korea to restore high growth and employment is by reforming its service sectors in addition to the financial and manufacturing sectors. The old growth model based on ever increasing investments in the manufacturing sectors (at the expense of services) is approaching its limits. Not reforming the financial and manufacturing sectors would cause GDP per capita growth to drop and, as discussed in the previous section, would make Korea vulnerable to another financial crisis. Reforming only the financial and manufacturing sectors may lead to serious social problems as failure to unleash growth in services would leave released manufacturing workers with little
34
attractive reemployment opportunities. High sustainable growth in the future will have to come from higher productivity in manufacturing and investment in services (Exhibit 36).
¶ Much higher output growth if economic reforms encompass services. The output growth potential is significantly higher in scenario 3 (6% per capita growth versus 3 and 4% for scenarios 1 and 2) because of much stronger overall labor productivity growth, especially in services, resulting in multiple positive spillover effects between sectors (described below). We expect in all scenarios that labor inputs per capita would decline by 1% a year as Koreans choose to work shorter hours. This would mean that Korea would follow a trend similar to that in other developed countries when they were at a similar development stage (Exhibit 37).
! Labor productivity growth would drop in scenario 1 from 6% in the last ten years to 4%, because of much lower productivity growth in manufacturing and a marked slowdown in the employment shift out of the low productivity agricultural sector. The strong past labor productivity growth in manufacturing was investment based starting from very low levels and this process of technological transfer is now ending. From now on productivity can grow only if Korea improves managerial practices. Best managerial practices are expected to be adopted much faster in scenarios 2 and 3 for the manufacturing sectors due to higher pressure on managers, following the opening of the markets and more careful lending from banks. Our experience in working with financial institutions around the world has shown that, provided the right incentives, control mechanisms, financial software and help from foreign institutions, underwriting skills can be rapidly improved in Korea, from a very low level. We estimate that they could reach close to Western standards in as little as two years. The real jump in overall labor productivity growth occurs in scenario 3 with the deregulation of the service sectors, where most of the employment is. Deregulating services also allows for further productivity growth in manufacturing (e.g., higher pressure from modern independent retailers on manufacturers) (Exhibits 38 and 39).
! The output growth potential derives directly from the labor productivity growth with the assumption that there will be sufficient demand, investment and foreign currencies to accommodate it. In order to assess the output breakdown by sector in each scenario, we use the experience of benchmark countries at a similar stage in development. The benchmark countries used are Japan in 1986 and 1989 for scenarios 1 and 2 respectively, and the US in 1988 for the third scenario. An important finding is that there are no tradeoffs
35
between manufacturing and service sector output. On the contrary, across the board deregulation will foster additional output growth in both services and manufacturing due to positive spillover effects (Exhibit 40).
– In scenario 1, output continues to grow primarily in manufacturing due to continued and “forced” high investments (despite rapidly decreasing returns) and protection of the domestic market from imports. The protection of the domestic markets also enables high export levels (despite low productivity) because of the indirect subsidies provided by high domestic prices. The 3% growth potential may not even be achieved in this scenario as Korea would continue to be vulnerable to another financial crisis.
– In scenario 2, the manufacturing output remains as high as in scenario 1 but for very different reasons. Higher productivity and lower trade barriers increase domestic consumption through lower prices (compensating for more imports of consumer goods) and allow exports to remain competitive despite the loss of subsidies. Higher productivity in manufacturing leads to (slightly) increased service sector output because there would be more throughput of goods in retail (higher domestic consumption) and manufacturers would have to rely more on business services to improve productivity (e.g., IT, financial and technical services). These are examples of positive spillover effects.
– As for scenario 3, deregulating the service sectors allows output to grow further in both manufacturing and services. Service regulations restrict directly both productivity and output growth in these sectors. Unlike in manufacturing, output in services is not threatened by imports. Relaxing zoning laws allows the construction of more and larger houses and high service shopping malls. Removing pricing restrictions benefits the consumption of both telecom and banking services due to economic pricing and the offering of higher value products (e.g., retail investment products). In addition, and because of further positive spillover effects, reforming services will increase manufacturing output in the same way that reforming the manufacturing sector led to higher service output in scenario 2. Important spillover effects include:
. Lower retail prices will further increase the consumption of manufactured goods. The wholesale and retail sectors should be seen as the natural extensions of the manufacturing sector.
36
. Higher competitive intensity will force banks and retailers to invest more in IT as can be shown by the experiences of France and, even more so, the US (Exhibit 41).
. People employed in the new high value service jobs will purchase more manufactured goods.
¶ Investment and foreign exchange requirements within Korea’s reach for the high growth scenario. The investment rate (30% of GDP) required to realize the output growth potential of scenario 3 is, relative to the other scenarios, low because of much higher capital productivity in manufacturing. This investment requirement is within Korea’s reach given the high domestic saving rates (33% of GDP on average for the last ten years) and the possibility for Korea to sustain, under this scenario, a higher current account deficit (3% of GDP).
! Despite much higher investments in services, the investment rate requirement for scenario 3 is lower than in scenario 1 (Exhibit 42). This is because capital productivity is 25% higher in scenario 3 than in scenario 1. This results from 40% higher capital productivity in manufacturing due to the forced rapid adoption of best managerial practice following the opening of the markets, tighter lending from banks and increased pressure from shareholders (Exhibit 43).
– For example, lean manufacturing will significantly increase the throughput of cars, and there will be less investment in the low return (low capital productivity) DRAM business. In scenario 3 capital productivity would further benefit from higher value product mix due to higher income levels and economic pricing in utilities (e.g., telecom) allowing for a better utilization of the networks. In this scenario, Korea should be able to reach the current US level of capital productivity in most manufacturing sectors within ten years.
– In scenario 3, the higher capital productivity in manufacturing more than compensates for the inevitable decline in capital productivity in services as deregulation would open the door to attractive investment opportunities (e.g., construction of shopping malls) causing capital productivity to grow for the total economy.
– The investment rate is also lower in scenario 3 because the relative prices of capital goods should decline further due to higher productivity growth in manufacturing and construction. Relative prices of capital goods are today more than 20% higher in Korea than in the US.
37
! Despite more consumption opportunities and stimulation in the third scenario, the 30% of GDP required investment rate is within Korea’ s reach:
– Koreans have a high propensity to save; the domestic saving rate has been 33% of GDP on average for the last ten years, and above 35% since 1990. Furthermore, the higher growth rate would allow Korea to have an higher current account deficit (3% of GDP) while maintaining the stock of external debt below 50% of GDP. Thus, domestic savings could be limited to 27% of GDP (Exhibit 44).
– The expected returns on savings should be higher due to higher capital productivity and a wider choice of more attractive saving vehicles (e.g., mutual funds).
! The implied requirement for foreign currencies in scenario 3 should also not be a constraint. Under this scenario, Korea could afford a 1% of GDP trade deficit (consistent with a 3% current account deficit). And higher productivity in manufacturing should more than compensate, from a trade balance point of view, the opening of the domestic markets to the imports of consumer goods (Exhibit 45):
– The import requirement of foreign machines would be much lower because of higher capital productivity (e.g., less imports of semiconductor production equipment and telecom machines). Furthermore, the new investments in services would not require much imports (e.g., shopping malls). We estimate that this reduction in imports would allow for the additional importing of 10% of all consumer goods.
– Exports (as a percentage of GDP) should also be maintained. Lower unit costs, resulting from much higher total factor productivity, should compensate for the loss of the implicit subsidy derived from higher prices in the domestic markets. It should also be noted that, under scenario 1, maintaining the past export levels will become increasingly difficult as foreign best practice companies establish, at an increasingly rapid pace, operations in countries with lower labor costs than Korea.
! Across the board deregulation will result in much stronger incentives for foreign companies to invest in Korea, especially in the service sectors. Foreign retailers will be able to enter the Korean markets as a result of relaxed zoning laws and it will be possible for foreign providers of personal financial services to sell their products. Increased FDI will not only help Korea to meet its investment and foreign currency requirements, it will also be the best way to ensure that best managerial practice is transferred to Korea. FDI will create
38
a pool of domestic talents through on-the-job-training, and domestic competitors will be strongly stimulated to copy best practice. It should also be noted that FDI financing is potentially less expensive and certainly much less risky than borrowings from foreign banks or capital markets. In effect, wages and taxes are paid locally and earnings will be reinvested as long as the business environment remains favorable and competitive. Finally, Korean savers would benefit from the success of global best practice companies if they are allowed to invest in them.
¶ More quality jobs and less unemployment with comprehensive reforms. The industry level labor productivity growth estimates and benchmark based output allocation implies for each scenario the future allocation of employment between sectors. In scenario 3, the reduction in manufacturing employment is more than compensated for by the strong growth in high value service jobs, notably in business services. Reforming only the manufacturing and financial sectors (scenario 2), on the other hand, would create social problems since there would not be enough employment pull from the service sectors to provide attractive jobs for the laid off manufacturing and construction workers (Exhibit 46). This would lead to either high underemployment or high unemployment levels (Exhibit 47).
! In scenario 3, manufacturing employment will decrease by 20% over a ten year period because labor productivity growth will be higher than output growth. This is what happened in all the developed economies. This decline would be more than compensated by the 60% increase in finance and business services employment. Furthermore, there will be, in scenario 3, a strong employment pull out of agriculture due to the 15% increase in retail and other trade employment resulting from much higher output in (modern and high service) retail stores, hotels and restaurants.
! Scenario 2 shows the social risks associated with partial deregulation. If the minimum wage is raised to the (relatively low) US 1995 level, structural unemployment could reach 12% of the labor force against “only” 5% for scenario 3. The high social risk in scenario 2 is explained by the fact that deregulation in manufacturing would create “winners” and “losers”, with a net positive impact on output, but also with losers having little chance to find attractive employment alternatives if the service sectors remain clamped by regulations. The employment situation is marginally better in scenario 1 compared to scenario 2, because employment and wages would remain protected in manufacturing by the barriers to imports and FDI (lower productivity and “subsidized” output).
39
! It should also be noted that an immediate and comprehensive reform of the economy would also help reduce the short term unemployment associated with the current financial crisis by allowing for the immediate creation of jobs in services (e.g., construction of shopping malls and selling of new retail banking products).
Conclusion
Exhibit 48 summarizes our findings with respect to output and productivity growth for the three scenarios. Korea will face significantly slower growth and continued threat of a financial crisis if it does not reform its financial and manufacturing sectors. Only reforming its financial and manufacturing sectors would not allow Korea to achieve its full growth potential and cause serious social problems since insufficient (quality) jobs would be created in services to compensate for the decline in manufacturing and construction employment. This point can be best illustrated by the experience of France, which failed to thoroughly reform its service sectors and substantially increased the minimun wage and unemployment benefits in an attempt to support ex manufacturing workers who could not find attractive reemployment opportunities in services. As a result and quite extraordinarily, hours worked per capita in France are less than half the current Korean level (Exhibit 49). Thus, scenario 3 seems to be the only alternative to maintaining both strong output growth and quality employment in the future.
The positive impact of scenario 3 reforms on the quality of life of Koreans would be quite dramatic. Koreans would enjoy better jobs, much higher income, fewer hours worked, much larger (single family) homes, much better shopping experiences, higher returns on savings, wider choice of cheaper cars, free local calls, and more opportunities to exchange with foreigners.
The real challenge for the Korean government will be to gather sufficient political support around this vast change program in order to overcome the status quo vested interests (e.g. current landowners). The 1997 financial crisis may, in that respect, provide a unique opportunity to take all the medicine at the same time.
40
5) IMPLICATIONS FOR POLICY MAKERS AND COMPANIES
Based on our belief that scenario 3 is the most attractive one for Korea to pursue, we have outlined the types of changes that will be required to enable Korea to fully realize its growth potential. We emphasize the importance of a comprehensive economic reform agenda, encompassing notably the often overlooked product regulations in services such as zoning laws, in order to avoid the adverse social consequences associated with only reforming the manufacturing and financial sectors. It is not our intention to provide a detailed implementation blue print for how to put in place these required changes. Furthermore, this section will outline only those changes that have been identified in our eight sector case studies; a careful and systematic review of all the remaining sectors would be required to complete the policy reform agenda. We discuss in turn the implications to policy makers and to companies (Exhibit 50).
Implications to policy makers (Exhibit 51)
Scenario 3 reform agenda is the most comprehensive. We did not find in our work any economic or social rationale for purposefully delaying or sequencing the reform process. On the contrary, our work shows that more reforms sooner lead in principle to higher productivity growth, investments and job creation. Furthermore, it is very difficult to anticipate the aggregate effects of partial reforms. Scenario 2 demonstrates that partial reforms is not sufficient to return to high growth and entail major social risks. We thus believe that the government should confront the political and implementation challenges of reforming everything at once.
¶ Political challenge. From a political point of view, the 1997 financial crisis may provide the government with a unique window of opportunity for across-the-board reforms, since hardship and dramatic changes are already a reality. Furthermore, it may be easier to push forward a reform agenda which affects and benefits everybody. Any uncertainty about both the reform agenda and process can have serious economic affects by discouraging entrepreneurs and investors.
¶ Implementation challenge. Implementing scenario 3 reforms will require both new institutional skills and mindset: from directing to enabling and controlling. Regulations will have to define the boundaries of what cannot be done rather than prescribe what should be done. The new set of regulations will have to be consistent and unequivocal. Law enforcement processes will have to be transparent and fair.
41
We list below the main reform areas that should be put forward to the Korean people in order for Korea to realize its full growth and employment potential:
¶ Reforms of product markets. We found product market regulations to be the most important barriers to productivity and output growth. The government need to engage in a systematic review of the product market regulations (including the processes by which they are being enforced) in all economic sectors in order to remove or replace those that impede strong competition and exposure to global best practice and/or prevent companies from developing new products and services.
! Removing restrictions on products, services, and prices in all sectors, especially in services. Examples from our sector case studies include:
– Telecom: government pricing rules and procedures that limit price-based competition among service providers
– Retail banking: pricing/product restrictions on payment transactions, investment and lending instruments
– Processed foods: rules governing operating practices (e.g., advertising) and bureaucratic registration processes that effectively keep foreign companies out.
! Removing explicit and implicit barriers to FDI and imports in all sectors. Examples from our sector case studies include:
– Steel: special tariffs protecting minimills; tacit guidance that prevents POSCO from competing against minimills
– Auto: tariff and non-tariff rules that prevent large-scale foreign imports, especially from Japan
– In addition to the explicit barriers to FDI and imports, Korea has erected a series of implicit and non transparent obstacles, including complex administrative rules and practices. Examples include the great number of documents and approvals required to open a retail store and local governments’ unclear criteria and processes for changing land usage rules. For these reasons, FDI into Korea has been very low compared to other countries (less than 1% of GDP). The government needs to systematically identify and remove these implicit barriers to foreign investment in all manufacturing and service sectors.
– Korea should not raise tariffs to attract FDI. This has been the strategy of Brazil. As a result FDI became complacent, were no
42
longer importing best practice, stopped investing and were able to milk and repatriate large profits from their Brazilian operations.
! Relaxing zoning laws and simplifying approval processes is especially important and is of the highest priority. Strict and opaque zoning laws have been the major impediment to productivity and output growth in retail and housing construction, two of the largest economic sectors. In addition, relaxing zoning laws would diminish the risks of future land speculation and force banks to focus on the operational performance of companies rather than on the value of their real estate. The additional land requirement, although substantial, could be accommodated without posing any threats to the Korea’s environment and landscape:
– In retail, we have estimated that if zoning laws were relaxed the amount of selling space would nevertheless only represent a 4% increase of the existing commercial area.
– In housing construction, accommodating for a balanced mix of single and multi family houses would require an increase of 50% in the amount of land available for new housing. The additional land required over the next ten years would, however, only amount to 1.3% of the quasi-agricultural and green land areas.
! Rationalizing and enforcing competition rules (e.g. removing licensing requirements to enter industries and regulations specifying the sectors in which companies can compete according to their size).
¶ Reforms of capital markets. The second most important set of barriers to productivity and output growth has been found in the capital markets. Poor corporate governance in both banks and companies has also been the primary cause of the 1997 financial crisis. In order to improve the allocation and use of capital in the Korean economy the government should:
! Complete the privatization of banks and sever the remaining ties with the government. Korean banks should be put under the strict supervision of an independent central bank.
! Promote consolidation around the healthiest banks, and expedite reform of corporate governance – using best practice FDI participation where appropriate. Strong boards of directors who have the authority to hire and fire bank CEOs and the senior management team should be encouraged.
! Ensure strong and independent bank supervision and guarantee deposits of only small depositors.
43
! Ensure free flow of domestic and foreign capital inside and outside Korea (e.g., allow foreigners to invest in Korea and Koreans to invest abroad).
! Strengthen bankruptcy laws to ensure that poor performing companies are either restructured or forced out of business orderly and rapidly.
! Promote widespread equity holdings via stock market and pension reforms. In addition, allow the development of an actively traded equity market to provide real-time feedback to shareholders and thus, company managers.
! Allow mergers and acquisitions activities, including hostile takeovers to ensure that corporate executives are maximizing shareholder value.
! Develop and implement the appropriate corporate laws establishing the obligations and liabilities of board members with respect to negligence.
¶ Reforms of labor markets. Although labor market rigidities, such as restrictions on lay-offs and use of part time workers, was found to have a “secondary” role in limiting productivity and output in the past, ensuring maximum flexibility is required going forward to avoid high unemployment.
! Legislation allowing lay-offs must be adopted and fully implemented. Unless companies are allowed to lay-off excessive workers, Korean firms will not be able to capture labor productivity gains made possible through better organization and more capital investments. The appropriate short term unemployment benefits must be provided to minimize the overall impact of the inevitable frictional unemployment that will result from the 1997 financial crisis.
! Looking beyond the crisis, Korea should avoid putting in place regulations that would limit the flexible redeployment of workers. France and Germany’s mistake of adopting high minimum wages and long duration unemployment benefits, in addition to having not sufficiently deregulated their service sectors, led to record levels of unemployment in these countries. Avoiding France and Germany’s mistakes will be the single factor that will prevent high unemployment in Korea.
¶ Market friendly social (and fiscal) policies. Targeted government interventions in the form of need-based subsidies aimed at supporting
44
those unable to support themselves can accompany other deregulation steps. Two examples from the US:
! Earned income tax credit. The US government supplements the income of the people employed at very low wages by providing an “earned income tax credit,” whereby the government pays a subsidy instead of seeking tax payments from the individual. This allows the government to keep the minimum wage low. Providing an earned income tax credit and setting high minimum wages are alternative approaches for achieving the same social objective. Setting a high minimum wage, however, would actually prevent the least able people from being economically employed and would force the government to put in place high and long term unemployment benefits and expensive early retirement schemes.
! Life line telecom subsidies. In the US, local calls are free in exchange for a higher subscription fee. This pricing scheme allows a much higher utilization of the telecom network than the Korean one since it reflects the telecom cost structure (high fixed costs and negligible marginal cost). The US government subsidizes the subscription fee of the poorest who would have difficulty to afford it.
¶ Streamlining government bureaucracies and creating transparency on how government decisions are made. Korea is considered to have the most bureaucratic and non transparent government agencies in Asia (Exhibit 52). This has been a major factor behind why foreign companies have not been interested in entering Korea in a major way. In order to promote FDI and to help companies become more productive, government processes need to be simplified (e.g., the bureaucracy needs to be dismantled) and made more transparent (e.g., historical practices of guiding business decisions – such as setting market share for market participants – needs to end).
¶ Changing the mindset on how regulations are written – from defining what can be done to defining the boundaries of what cannot be done. The Korean government needs to redefine its role from directing industrial policies to actively creating a market mechanism. To help facilitate this role change, new rules and regulations should be written from the mindset of defining and enforcing what companies cannot do – e.g., setting the boundary conditions within which firms are allowed to compete. This approach allows companies to innovate and find new ways of differentiating themselves from others through the pursuit of new products and services. When the opposite approach of regulating individual products and services that could be offered is used (e.g., in Europe), economic output and productivity is far lower. This is because firms are not given the freedom to pursue more productive innovations.
45
Implications to Korean companies
The policy recommendations discussed above will lead to new competitive conditions for companies. The fact that Korean companies are lagging significantly behind many of their foreign competitors in terms of best managerial practices implies that they will face both tremendous opportunities and challenges once the product and capital markets are reformed. Korean companies should immediately and proactively start to reform themselves with respect to their corporate governance, business portfolio and management practices. Korean companies should not hesitate to forge alliances with foreign companies in order to help them to be ready by the time the new competitive era unfolds:
¶ Reform corporate governance. Korean companies need to reform the elements of corporate governance – from setting the right objectives to reinforcing discipline within the organization – in order to improve productivity performance and develop world class practices. This reform should be pursued by both Chaebol and non-chaebol companies. Key actions required include:
! Adopt maximizing shareholder value as the explicit objective for the company. Korean companies should move away from sales as the management objective to value-based measures such as ROIC (return on invested capital) or EVA (economic value added).
! Adopt world class board governance practices.
– Establish outside boards made up of tough-minded business people. In the US, two-thirds of outside board members are current or retired CEOs, who bring invaluable experience and insights into the strategic direction of any company. Korean companies could benefit from this diversity of experiences as it makes the required changes to adapt to a new competitive and governmental environment.
– Establish the key board processes to ensure effective strategic and appropriate operational decision-making. While composition of the board is important, use of world class processes for running the board is equally critical – otherwise, board member’s limited time would be wasted. Effective board processes usually involve creation of the appropriate committees (e.g., compensation, succession, etc.) and an agreed upon approach for: 1) full board and committee meetings; and 2) how decisions will be made.
– Ensure that the board has the authority to hire/fire senior executives – including the Chairman and CEO
46
– Streamline corporate center and reinforce the CFO role. The CFO should have the responsibility of monitoring/maximizing shareholder value.
! Adopt a new set of performance measurements and the complementary reward practices. Reformation of corporate governance can only be effective if Korean companies monitor the appropriate measures and reward people based on the company’s true objectives (e.g., shareholder value, productivity). Depending on the objectives, reward approaches based on cash bonuses, stock grants, stock options, and non-monetary compensation provide plausible alternatives for aligning managers’ incentives with those of shareholders’.
¶ Reform business portfolio from point of view of global best practices. Korean companies need to focus on their core businesses. The core businesses should be defined as the ones which have the potential of achieving world class best practices.
¶ Pursue world best practice in the area of organization of work processes, marketing skills/product mix, and capacity utilization.
! Best practice organization of work processes. Korean companies should zealously pursue local adoption of world-class management practices in addition to the best technologies. This can be achieved by various actions such as institutionalization of bench-marking against the world best companies (not just other Korean companies), removing excess workers through substitution with flexible workers and providing out-placement services to laid off workers, and hiring the best people (even foreigners) to help the organization develop new capabilities. Adoption of a less hierarchical and more flexible management structure is another enabling mechanism.
! World class product management and marketing skills. As illustrated in the case examples, development of world class product management and marketing skills has been relatively weak due to the rapid growth and protection in the Korean economy for the past three decades. Once the manufacturing facilities were put in place, Korean firms did little to stimulate demand for their products: firms assumed that their products would sell themselves. In light of the upcoming open market, Korean companies should strengthen product development and marketing skills. For this purpose, the companies need to learn to differentiate their products. Korean companies also need to redefine and strengthen the role of marketing by: 1) understanding what customers really want and are willing to pay for; 2) developing unique value propositions to capture customers’ interest; and 3) creating lasting brands. They also should
47
rigorously test and validate a product’s financial returns to avoid deterioration of product profitability and product proliferation.
! High capacity utilization. Poor capacity planning in the past created excess capacity, contributing to low capital productivity and ROIC. Korean firms need to increase their capacity utilization through:
– Improved capital budgeting processes. New capital investments were historically based on limited understanding of how the products to be manufactured will perform in the market. More rigorous project-based assessment and more realistic capacity planning based on average demand levels (versus peak levels) will be required going forward.
– Capacity consolidation/restructuring. The current asset base (especially subscale plants) needs to be restructured and many revamped to enable the remaining companies to earn a real return. The current practice of keeping all plants and companies alive prolongs sub-optimal asset usage and corporate performance. The retiring of the least productive assets will increase the performance of the remaining asset base.
¶ Pursue value creating business opportunities in the service sectors. Future growth of the Korean economy depends on a vibrant service sector that creates new jobs to absorb workers laid off from manufacturing. Companies, both large and small, should explore where and how they can create new businesses in areas they can achieve competitive advantage. These new service sector opportunities are wide spread from relatively lower value/quality retailing and restaurants to extremely high value/quality computer software, financial services (e.g., investment banking, credit analysis), and business services. While we do not intend to prescribe or identify specific opportunities in this report, we are convinced that market reform will help sustain the spirit of innovation and entrepreneurship in Korea.
¶ Forge alliances with best practice foreign companies. The quickest and surest way to quickly learn and adopt best managerial practices would be for Korean companies to form strategic alliances with foreign best practice companies. These alliances can take many forms (such as licensing agreements or limited joint ventures) and allow the Korean partner to preserve his independence and sovereignty. We discuss below the opportunities for foreign companies to create value (with or without a Korean partner) that we have identified in our case studies.
48
Implications to foreign companies
Korea will become one of the most attractive countries for best practice foreign investors if and when it reforms its economy. Korea is already the world’s 11th largest economy with a population of 45 million people with average income close to the level of Spain and Portugal. It has the potential to rapidly catch up with the richest countries in the world. Until recently, this very attractive market has been practically closed to foreign investors. Direct barriers have kept total foreign direct investment volume below 1% of GDP. Once these barriers are removed, global best practice companies will have great opportunities to create value in Korea in both manufacturing and service sectors (Exhibit 53):
¶ In many manufacturing sectors, we found that local companies have already invested in state-of-the-art equipment and reached the technological frontier. However, these facilities are frequently not optimally used because of poor managerial practices. Foreign companies with world best practice skills in organization of functions and tasks, capacity utilization, and marketing have great potential for improving returns on these assets, either by engaging in joint ventures or purchasing local companies. In the automotive sector, some US car makers have already expressed interest in taking advantage of this. A Japanese car maker like Toyota, which has mastered lean manufacturing far beyond any other manufacturer, would be in that respect an even better partner for a Korean car maker. In food processing and semiconductors it is the contrary; US companies have a clear edge over their Japanese counterparts. Nabisco, Sara Lee, or Philip Morris would be in a good position to infuse best practice marketing skills in Korea and help the rationalization of production facilities. In semiconductors this process is already underway, Intel and Samsung have, at the start of 1998, agreed to join forces in the production of a new high capacity chip.
¶ In the service sectors, opportunities lie mainly for companies willing to enter relatively underdeveloped markets and restructure and even redefine the terms of competing in them. While the risks in breaking new ground are inevitably higher, our findings suggest that the returns from service sectors are potentially very large. Carrefour, the main foreign retailer in Korea with only five hypermarkets, managed to reap large profits so far in Korea. There would be many more value creation opportunities for foreign retailers if the zoning laws and processes are relaxed and simplified. US developers would be in the best position to import the management and financial skills required to orchestrate the operations of a shopping mall with hundreds of stores and leisure activities. In retail banking, because of the past regulated environment, little attention was paid to providing state of the art financial services to Korean consumers. Best practice specialized providers like Fidelity
49
(investment products) or Countrywide (mortgages) would thus have the opportunity to develop large untapped markets.
¶ Foreign commercial and investment banks would be both attracted and indispensable to Korea. They will bring the deal making and underwriting skills required to revamp the corporate structure, reallocate the existing manufacturing assets to the best possible owners and help Korean and foreign companies join forces to develop new markets in services.
50
APPENDIX A: ANALYTICAL APPROACH FOR ASSESSING FUTURE ECONOMIC PERFORMANCE
The estimate for the GDP growth potential is based on the industry-level labor productivity growth projections and assumptions on future levels of voluntarily labor inputs. The investment rate requirement is also based on the industry specific estimates of evolution in capital productivity and depreciation rates. The future employment allocation is derived from the case-based labor productivity estimates and benchmark-country output allocation. The structural unemployment rate is based on the future wage distribution as well as assumptions on the future level of the minimum wage and unemployment benefits.
¶ Given assumptions on the future regulatory environment with respect to product and capital market regulations we have estimated for each of our eight industry cases the future evolution of both labor and capital productivity. These estimates are based on explicit assumptions on how the industry dynamics and structure would evolve (e.g. new foreign entrants, consolidation among existing players or process improvement allowed for by new technology) as well as on a detailed understanding of what needs to happen on the shop floor or in the marketing department for Korean companies to catch up with best practice.
¶ We then generalize our estimates for the evolution of labor and capital productivity evolution to the whole economy. We do this by dividing the Korean economy into seven aggregate sectors into which we can map case studies (e.g. our retail sector is assumed to be representative of the overall trade sector, which also encompasses hotels and restaurants).10
¶ The labor productivity growth generalization allows us to derive an output growth potential given an assumption on the evolution of voluntary labor inputs in the economy.11 At this stage, we assume that future labor inputs are not affected by labor market conditions (e.g. labor markets are very flexible). Our estimates of future voluntary labor inputs are based on the experience of the other more developed economies. We assumed that Korean men will want to work less (e.g., 10% less hours in ten years for scenarios 1 and 2) and that Korean women, provided the opportunity, would participate more (scenario 3).
10 Given that our industry studies did not include government services, we have based our economy-wide
productivity analyses on the private sector and assume that government services grow at the average rate of the private sector.
11 All of our growth projections are real per capita growth measures expressed in 1995 relative prices. This implies that our figures would not necessarily coincide with the GDP per capita growth rates observed in 2010 if measured in relative prices of 2010, even if the economy were to follow our projections exactly.
51
At this stage, we do not consider the potential effects of potential aggregate constraints such as insufficient demand, insufficient labor skills, lack of public infrastructure, lack of savings to be invested and lack of foreign currencies to import the required machines.
¶ We then estimate the future allocation of output among our seven aggregate sectors. We do this by looking at the development which occurred in other countries at the same stage in development. We choose benchmark countries with both similar output levels and regulatory environments as implied for Korea in each of the studied scenarios. If necessary, we make some adjustments to take into consideration differences in their starting point resource allocations. We can only rely on the natural experiences of other countries, since general equilibrium effects associated with evolution of demand and relative prices are impossible to model from the bottom up. The output allocation is a crucial step in our analysis for two reasons:
! First, it allows us to estimate the future investment required since economic sectors have very different levels of capital intensity (e.g. utilities are much more capital intensive than personal services).
! Second, the output allocation allows us to derive future allocation of employment in the economy given our estimates of future labor productivity levels by sector.
¶ We then test whether the aggregate constraints might be binding. We do not think that lack of aggregate demand (provided that macroeconomic policies remain accommodating) would be a problem in Korea under any of our scenario given the very fast growth achieved in the past and the fact that Korea is only at 50% the GDP per capita level of the US. Also, we do not think that there would be a significant lack of labor skills or infrastructure given Korea’s performance in the past and current government plans. The two crucial potential constraints to be tested are the feasibility for Korea to meet the future requirements in terms of savings and foreign currencies needed to invest and import the raw materials, fuel and machines not available domestically. We test these two constraints (which are linked) by estimating the future investment rate requirement for each of the scenario.
¶ The investment rate requirement is derived from the generalization of future capital productivity levels from our cases, which, given the future output level and allocation implies a future level of overall capital stock. The investment rate requirement is obtained by computing the difference between the end point and starting point capital stocks to which has to be added our estimate of depreciation. The depreciation rate depends on the age and quality of the existing capital stock as well as on the amount of revamping required to be consistent with our
52
productivity growth estimates (e.g. replacement of five subscale wet corn milling plants by a best practice one or relocation of city center department stores to suburban shopping malls). The differences in the nature of investments for each scenario allow us to qualitatively assess the foreign exchange constraint (e.g., scenario 1 requires the continued importing of semiconductor fabrication machines while no imports are required for the construction of shopping malls under scenario 3). The investment rate also depends on the future evolution of relative prices of capital goods in Korea. There are today more than 20% higher than in the US. We assume that they will converge to US levels in scenario 3, being on average 10% higher over the period (15% and 20% higher for scenarios 1 and 2 respectively) (Exhibit A1). Finally, we also took into consideration the expected growth of the population (1% p.a.). The investment rate (as a percentage of GDP) has to be increased by almost two percentage points to accommodate this growth in population.
¶ Finally, we evaluate each scenario from a social point of view by analyzing the employment outlook in terms of future allocation by sector (implying the level of redeployment required), skill level and unemployment. Unemployment outlooks are discussed both for the short and longer term. We feel that it is crucial to understand the impact of deregulations with respect to both output and employment in the current crisis environment, since this crisis could last (hopefully not) for some time. Long term structural unemployment rates will depend on future labor market conditions. If the current very low minimum wage and unemployment benefits are maintained, then long term unemployment should remain very low, since people have little choice but to work at whatever wage. If the minimum wage is raised, but not the unemployment benefits, than unemployment would also remain low but the proportion of self employed would increase. Thus, to assess the future prospects for both unemployment and level of skills required, we computed a long term unemployment rate assuming that Korea has adopted US levels of minimum wage and unemployment benefits. We do this by estimating the wage distribution of employment for each scenario (the wage level can be grossly approximated by the labor productivity level). Our estimates of wage distribution are based on the US wage distribution for scenario 3 from which the results for scenarios 1 and 2 are derived. Our unemployment rate estimates are obtained by assuming that half the workers who are earning less than the US minimum wage would end up in unemployment, the other half being socially treated by other means such as early retirement or disability. We understand the limitations of such an exercise; here again our purpose is to illustrate, with numbers, significant differences in outcome between the three scenarios.
53
APPENDIX B: DETAILED SCENARIO ANALYSIS
Each scenario is discussed in turn following the steps of the methodology described in Appendix A. We start with scenario 1 in order to build up the case for scenario 3 for reasons which are unique to Korea. In effect, the strong growth which we believe is achievable under scenario 3 would require a U-turn in economic policy. We thus need to first explain why past policies would no longer work, before building the case for new economic policies. Furthermore, it is also important to discuss scenario 2 before scenario 3, because it allows us to specify and quantify the positive spillover effects from deregulating the service sectors at the same time as the manufacturing sectors. Indeed, these spillover effects are the key to understanding why the GDP growth is so much higher under scenario 3 compared to scenario 2. For example, allowing for the rapid development of independent modern high productive and high service retail formats would lead to additional pressure on manufacturers to become more productive, leading to increased output in both manufacturing and retail (increased throughput) thanks to lower prices and more sophisticated (targeted) sales stimulation.
Scenario 1: the old regulatory environment would not allow Korea to recover strong economic growth
Returning to the old growth path model at the end of the current financial crisis would lead Korea to only 3% GDP per capita growth on average for the next ten years notwithstanding the potential downside risk associated with another financial crisis. As we will see in scenario 3, this performance would seriously undershoot Korea’s real potential. Labor productivity growth would drop in manufacturing as Korea nears the technological frontier while it fails to quickly adopt best managerial practices in the absence of direct pressure from foreign best practice companies (protected domestic markets allowing to subsidize exports), banks, shareholders and retailers. For the same reasons, capital productivity would continue to be very low in manufacturing forcing Koreans into continued high savings (32% of GDP investment rate would be required for this low growth). Restrictive regulations would lead to continued slow investment and labor productivity growth in the service sectors. Although manufacturing employment would be maintained thanks to protected markets and subsidized exports, the slow growth would cause construction employment to drop and there would be little attractive employment opportunities for the young entering the labor force. With US labor market conditions, structural unemployment could reach 8%. Exhibit B1 summarizes our key findings for scenario 1. In this scenario Korea would continue to follow “the Japanese growth
54
path”. Japan also experienced a similar drop in GDP growth at this stage in its development (Exhibit B2).
¶ Labor productivity growth (Exhibits B3 and B4). Generalizing our case estimates, we expect that labor productivity growth would drop from an annual 6% in the ten years before the crisis to around 4% in the next decade as a result of the drop in manufacturing and the end of the massive employment shift from agriculture to manufacturing. Because our estimate for future labor productivity growth is the cornerstone for estimating output growth (for all the scenarios, since we use scenario 1 as our base case), we present our results in detail here:
! Labor productivity growth would drop in the manufacturing sectors to around 4% a year (down from 7% for the last ten years). The drop would mostly take place in the higher value capital intensive manufacturing sectors (such as the one we studied). In these sectors we forecast productivity growth to fall from 13% in the last ten years to less than 5% since investments in best practice technology have been nearly completed and rapid adoption of best managerial practice would remain impeded by protectionism. Productivity growth in the other (labor intensive) parts of manufacturing such as apparels and light electronics is assumed to remain constant. We provide below the detailed rationales for our case estimates:
– Steel. Slow labor productivity growth (3% p.a.) since Korea is best practice in integrated steel and it is questionable how much POSCO, being a State owned company, will be able to reduce hours worked to meet the big drop in demand as a result of much slower economic growth. Mini mills would continue to inefficiently produce the lower value long products as long as they are protected by tariffs.
– Automotive. Labor productivity growth would drop to 5% a year. There are little opportunities to improve labor productivity through investments since Korea is now close to best practice capital intensity. Rapidly climbing the lean manufacturing curve will be difficult in the absence of plant/product range rationalization and consolidation between the existing OEMs and suppliers. Protection from imports and FDI have thus far impeded this process to start; to the contrary, more Chaebols were getting ready to enter this industry before the crisis. Our labor productivity growth estimate is actually quite aggressive if compared to the development of the French and German auto industries in the last ten years. They were in a similar situation as Korea’s today (same starting point productivity level, protection from the Japanese best practice and poor corporate governance)
55
and only managed to grow labor productivity at 2 and 3% per annum respectively.
– Food processing. Only 3% labor productivity growth in confectionery which is the growth achieved by Japanese companies under similar conditions. Like in automotive, there are little opportunities to further invest (except in packaging) and in the absence of exposure to best practice it would take a long time to master the management skills required to rationalize the product portfolios and specialize the production plants accordingly between high and low volume products. Protections from FDI in wet corn milling would allow the industry to remain fragmented and subscale.
– Semi conductors. The estimate reflects the productivity gap in relation with best practice at any point in time in the future. In effect, physical labor productivity growth rates are very high in this industry (above 30% a year) because technological breakthroughs are realized every three years on average. We have limited our projection to a five year horizon for that same reason. We will, for all scenarios, discuss this case, as well as the telecom case, in the context of capital productivity.
! Labor productivity growth in services would continue to be slow at around 4% a year as competitive intensity and investment would continue to be limited by the restrictions on land use and product offerings.
– Retail banking. The relatively high labor productivity growth of the past was more a reflection of the overall strong growth in the demand for basic retail banking products (e.g. current accounts) as the urban population quickly increased and got richer. The restrictions on pricing and products would drive productivity growth down by preventing product based competition (notably with foreign providers) and the shift towards a more efficient payment mix.
– Housing construction. Korea achieved around 4% annual labor productivity growth in the last ten years, but it has now come close to best practice in producing large apartment buildings. We expect annual labor productivity growth to drop to 2% a year as long as strict zoning laws prevent large single family housing programs.
– Retail. We expect labor productivity to continue to grow at a relatively slow 4% a year as strict zoning laws prevent a rapid evolution of the retailing format mix. We forecast that the format
56
mix would mirror the current Japanese one, whose slow evolution also bears the marks of heavy land regulations. Shopping malls are virtually absent in Japan and discounters/large specialty chains only managed to capture 20% of the market (against 40% in most developed countries).
¶ Output growth potential. Assuming no aggregate constraints (e.g., not enough savings in the economy) the overall 4% annual labor productivity growth would yield 3% GDP per capita growth a year; we expect hours worked per capita to decrease on average by 1% a year as a result of increased preference for leisure. Hours worked are among the highest in the world in Korea today; our estimate is based on the Japanese evolution at a similar stage in development. We have also chosen Japan as our output benchmark given the great similarities between the Japanese and (past) Korean growth paths. 3% GDP per capita annual growth would bring Korea to Japan’s 1986 output levels in ten years (Exhibit B5).
¶ Capital productivity and required investment rate. To translate this productivity growth into output growth, continued high capital investment rates of around 32% will be required because of continued low capital productivity in both the existing and new manufacturing capacity put in place. Exhibit B6 details our capital productivity estimates for the capital intensive sectors. Most of the drivers leading to continued low capital productivity in the capital intensive manufacturing sectors are the same as the ones which would cause labor productivity growth to drop; namely protectionism and poor corporate governance in banks and companies which are not forcing the rapid adoption of best managerial practices. We expect, for the service sectors, capital productivity to continue to decline from “abnormally” high levels because of (slowly in this scenario) increase in capital intensity (Exhibit B7). Exhibit B8 shows the gross increase in capital stock required over the next ten years (implying the required business investment rate) given our estimates of future capital productivity and depreciation rates.
¶ Foreign exchange constraint. In this scenario, Korea will be forced to export more than necessary (at the expense of domestic consumption) to pay for the underutilized imported machines (e.g. semiconductors and telecom). In addition, as discussed in section 3, another financial crisis could be looming further down the road. The crisis would be domestic if Korea becomes like Japan a net exporter of capital. This could very well happen, since in this scenario, the required investment rate is lower than the past saving rate and consumption opportunities remain subdued. The crisis would be foreign if Korea has to rely once again on foreign financing. Exhibit B9 shows that, in order to maintain the
57
external debt below 50% of GDP, the current account deficit would have to remain below 2% of GDP implying a minimum of 30% domestic savings and 0.5% of GDP trade surpluses.
¶ Employment outlook. Many manufacturing jobs will be maintained by the implicit subsidy to exports resulting from domestic consumers having to pay high prices (Exhibit B10). This subsidy results in higher output than would otherwise be tolerated by the world markets given the low productivity levels. Nevertheless, the relatively low labor productivity and output growth would result in a lack of creation of quality jobs in both manufacturing and services. As a result, unemployment, especially among young people, could rise to high levels (e.g. 8%) if the minimum wage and unemployment benefits are increased substantially (we assumed US levels), as it is proposed today by the unions (Exhibit B11).
Scenario 2: the current (limited) restructuring plans are necessary but not sufficient to restore high growth and employment
Surprisingly, although it is clear that the current restructuring plans being discussed as part as the IMF program are steps in the right direction, our findings point to only slightly higher GDP per capita growth than in scenario 1 (4% versus 3%) and much higher risk of structural unemployment (12% versus 8% with US labor market conditions). Indeed, if such labor market conditions are put in place, the output growth would be similar to scenario 1. The key reason for this finding is that, under scenario 2 conditions, Korea would become much more productive (labor and capital) in manufacturing but its output would be the same as in scenario 1 (higher domestic consumption compensated by increased imports). Thus, Korea would have additional human and capital resources available to be invested outside manufacturing. Unfortunately, restrictive regulations in services would prevent their full re-employment in the domestic economy, thus forcing excess labor into low value service jobs or unemployment like in France and Germany. Also, eventual excess savings would be invested in public infrastructure or short term US securities, like in Japan. Exhibit B12 summarizes our key findings for scenario 2.
¶ Labor productivity growth (Exhibits B13 and B14). Labor productivity growth could reach 5% a year on average. Productivity growth in manufacturing would remain strong at around 7% due to increased pressure (and help) from FDI, imports and banks. Korea could reach or surpass in ten years the current best world practice levels in labor productivity in almost all the manufacturing sectors. In services, on the other hand, productivity growth would remain low at around 4% since product market regulations would be untouched. We thus assumed
58
similar development in the service sectors as in scenario 1, except in retail banking where productivity growth should be higher as a result of improved corporate governance in banks. Examples of how labor productivity gains would be achieved in manufacturing include:
! Steel. 5% labor productivity growth due to greater automation and higher value product mix in minimills – created by closer relationships (e.g. Joint Ventures) and/or pressure from imports following the removal of tariffs on long products.
! Automotive. 9% growth (against 5% in scenario 1) due to more rapid implementation of lean manufacturing resulting from the forced consolidation of the sector around two full range manufacturers, one of them fostering a long term alliance with a Japanese best practice OEM.
! Food processing. As in automotive, industry consolidation and alliances with FDI would result in rationalization of product range and production facilities in confectionery allowing Korea to reach current US levels of labor productivity in ten years. Lifting of tariffs in wet corn milling would allow a new entrant to force the industry to consolidate around two to three plants (instead of fifteen) at best practice scale. Overall labor productivity growth could reach 9% in this sector.
¶ Output growth potential. With the same assumptions for the voluntarily decline in labor inputs as in scenario 1 (e.g. 1% decline a year), the annual growth in GDP per capita would only be slightly higher than in scenario 1 at 4% per annum versus 3%. In this scenario Japan 1989 becomes our benchmark (Exhibit B15). Output growth in manufacturing is the same as in the first scenario. Lower prices, resulting from the removal of trade protections and increased productivity, would boost domestic consumption. This would allow domestic producers to maintain the level of their domestic sales despite a marked increase in imports. Similarly, export sales should not be affected as higher productivity compensates for the loss of the “implicit” subsidy (we discuss these issues in more details below as part as the discussion related to the trade balance and foreign exchange constraint). Thus, although the growth rates are similar between scenario 1 and scenario 2, the Korean people enjoy significantly more consumption under scenario 2. Indeed, as we will now discuss, Scenario 2 requires a lower investment rate than scenario 1.
¶ Capital productivity and required investment rate (Exhibits B16 to B18). While this scenario provides (slightly) higher output growth than scenario 1, it “only” requires 27% of GDP investment rate, due to much higher capital productivity in
59
manufacturing. This investment rate does reflect, more than in scenario 1, the need for Korean industries to replace some existing capital base – subscale operations would be scrapped (e.g. wet corn milling) and to revamp many of the existing capacity (e.g. specialization of confectionery plants and adaptation of automotive plants to allow them to carry multiple models on the same platforms). Capital productivity would increase substantially from scenario 1 estimates in all the capital intensive sectors we studied (Exhibit B16). Korea would nevertheless remain far from best practice levels in both semiconductors and telecom:
! Steel. Capital productivity would remain around the current levels. The decrease in demand would be lower than in scenario 1 (higher overall GDP growth) and higher value product mix would compensate for increased automation in minimills.
! Automotive. Capital productivity would double. Plans for increased capacity would be canceled, product range rationalized, common parts used, multiple models would run on the same platform and lean manufacturing would allow to increase throughput.
! Semiconductors. Much less financing from more careful banks would force Korean manufacturers to keep focusing on DRAM, allowing them to catch up with Micron levels of capital productivity, which would still not be sufficient to reach the best practice levels of microprocessor producers.
! Telecom. Improved corporate governance in banks should also prevent redundant investments in local fibre telecom networks. The existing network, on the other hand, would continue to be underutilized as economic pricing would not be allowed.
¶ Foreign exchange and saving constraints. Although, under this scenario, imports of manufactured goods would increase markedly (e.g. based on the experience of other countries, Japanese car imports could amount to 20% of the markets) and exports would no longer be subsidized by high prices in the domestic markets, the trade balance should not be significantly affected in comparison to scenario 1. In effect, the need to import machines would be much lower than in scenario 1 due to much higher capital productivity. We estimate that the reduction in imports of machines could amount to around 2% of GDP. Thus, close to 10% of all consumer goods could be imported instead. Exports should remain strong since much higher labor and capital productivity should compensate for the loss of the indirect subsidy to exports. In effect, under this scenario, wages in manufacturing should increase at a slower pace than productivity, since, as we will discuss below, the demand for manufacturing labor would drop. Exhibit B19 shows that in this scenario domestic savings could be
60
limited to 25% of GDP with a current account deficit of 2%. If domestic savings were to be higher, Korea, like Japan, would run a trade surplus.
¶ Employment outlook. Incomplete deregulation would yield to serious social consequences as the creation of quality jobs in services would not be in scenario 2 sufficient to compensate for the inevitable accelerated decline in manufacturing and construction employment.
! Allocation. There would be a marked decline in manufacturing employment as output growth (same as in scenario 1) would be outweighed by much faster labor productivity growth in manufacturing (this has been a general trend in all developed countries for the last twenty to thirty years). The drop in construction and manufacturing employment could amount to 5% of total employment. Since restrictive regulations would limit the creation of attractive jobs in services, the employment pull out of agriculture would remain as limited as in scenario 1 (Exhibit B20).
! Unemployment. Scenario 2 is the most risky in terms of unemployment, not only for the short term but also in the long term, especially if the minimum wage is raised in exchange for the ability to lay off.
– Short term prospects. Mexico provides a good example on how unemployment rose and fell in a three year time period under similar economic hardships and with similar labor market conditions (very low minimum wage and unemployment benefits)(Exhibit B21).
– Medium to long term prospects. Structural long term unemployment could reach 12% if the minimum wage and unemployment benefits are raised to US levels. We saw that the drop in manufacturing and construction employment would amount to 5% of total employment. Furthermore, the current partial zoning deregulation in retail, would also cause employment to drop as low service discount stores would replace mom and pop stores. In effect, the new regulations are allowing the development of discount stores while they still impede the development of high service shopping malls which require much larger land areas. A similar development took place in the French retail sector with serious employment consequences. Similarly in retail banking, the combination of the current product restrictions with improved corporate governance could also lead to important reduction in employment levels. Thus, the lack of quality job creation in services would, depending on future labor market conditions, force displaced low skilled labor into either
61
unemployment, early retirement or very low value service jobs (Exhibit B22).
Scenario 3: deregulating services immediately would allow for significantly higher growth and help address the short term social issues
The immediate removal of the restrictive product market regulations in services would not only allow for the reemployment of the human and capital resources (freed from scenario 2 restructuring), it would also (due to positive spill over effects) lead to higher productivity and output growth in manufacturing. Thus, the GDP growth per capita would reach 6% (versus 4% and 3% for scenario 2 and 1 respectively) and assuming US labor market conditions (unemployment would be limited to 5% versus 12% and 8% for scenario 2 and 1). Following this path could allow Korea to reach 90% of the current US level of GDP per capita (Exhibit B23). Finally, the deregulation of the service sectors would immediately create new jobs and attract FDI in services at a time when both are badly needed.
¶ Labor productivity growth potential (Exhibits B24 to B26). Product market deregulation in services would foster much faster productivity growth in all the service sectors (7% versus 4% in scenarios 1 and 2). Productivity growth would also be higher in manufacturing thanks to spillover effects (8% versus 7% in scenario 2 and 4% in scenario 1). Across the board deregulation would carry Korea to more than 90% of US levels on average for our eight cases.
! Services.
– Telecom. Economic pricing on local calls following pricing deregulation would lead to increased network utilization.
– Retail banking. Economic pricing of payment transactions would shift customer towards the higher productive means of payments (e.g. direct debits, image checks and credit cards). Product deregulation in deposits and loans would result in increased output and higher value products and services (e.g. customized loans and mutual funds).
– Housing construction. Productivity growth in housing construction would be fueled by the development of large single family housing programs once allowed by relaxed zoning laws.
– Retail. Relaxed and simplified zoning laws and processes should also lead to much higher productivity growth in retail not only from the more rapid development of discount stores but also from large suburban high service shopping malls if large enough lots are made available for them. Under these conditions, the format
62
mix is thus assumed to shift towards the current US format mix, rather than the Japanese or French ones where land for shopping malls is virtually impossible to obtain (Exhibit B25).
! Manufacturing. Productivity growth would even be stronger in manufacturing than in scenario 2. Modern and independent retailers would put much more pressure on manufacturers to reduce prices. The mix of manufactured goods should be higher due to much higher income levels. These are examples of positive spillover effects from deregulating simultaneously the manufacturing and service sectors (see output growth discussion below).
! Shift out of agriculture. Another, even more indirect, positive spillover effect, would be the employment shift out of agriculture, which would be significantly higher than in the other two scenarios, and brings a positive impact on overall productivity growth (mix effect). We have estimated that this effect would add another half a percentage point to the overall annual labor productivity growth (it accounted for 1% a year in the last ten years).
¶ Output growth potential. We also assumed in this scenario that, labor inputs would voluntarily decrease by 1 % a year but for different reasons than in the other two scenarios. The decrease in hours worked per employed should be higher due to markedly higher income levels. This effect should be compensated by increased female participation which tend to increase with higher income, especially if part time work is facilitated. Thus, the output growth potential would be at least 6% and the benchmark country becomes the US in 1988 (Exhibit B27). It is important to note that the growth in services is not achieved at the expense of manufacturing. On the contrary, higher growth in services would generate higher overall income and thus higher domestic consumption for manufactured goods. Exhibit B28 provides some examples of positive spillover effects from deregulating at the same time the services and manufacturing sectors.
¶ Capital productivity and required investment rate (Exhibits B29 to B33). Our estimate for the investment rate required to reach this high growth potential is 30% of GDP. Thus, the same investment rate as in scenario 1 allows GDP to grow twice as fast. This reflects the impact of 40% higher capital productivity in manufacturing allowing “excess” capital to be invested in the deregulated service sectors. Exhibit B29 details our estimates for the future level of capital productivity in the capital intensive sectors. Exhibits B30 and B31 provide bottom up estimates on how fast capital productivity would decrease in the service sectors as they become significantly more capital intensive. Exhibit B32 generalizes our case findings to the overall
63
economy, it shows that overall capital productivity would be higher than in the US (at par in manufacturing and higher in services as many of the more fragmented sectors such as retail would remain more labor intensive). Exhibit B33 derives from our estimates of future capital productivity and output levels, together with an (aggressive) estimate of depreciation, the business investment rate required.
! Capital intensive sectors. In steel, automotive and food processing capital productivity should increase in the same proportion as in scenario 2. Increased automation (stimulated by higher labor costs) should be compensated by an higher value product mix running through the same equipment and further improved managerial practice under the pressure of independent retailers. In semiconductors, capital productivity would be even higher than in scenario 2 (with lower investments) as improved corporate governance in companies and more attractive investment opportunities in services would result in only the best Korean manufacturer to remain active in this (risky) sector. Capital productivity would also be much higher in telecom. The network would be fully utilized as a result of economic pricing (free local calls would be available in exchange to an higher subscription fee) and much increased demand from companies in services, notably retailers and banks-another positive spillover effect (Exhibit B29).
! Previously low capital intensive sectors. Much increased investments in IT and in new retail outlets would cause capital productivity to decrease by as much as 30% in retail and retail banking (for the benefit of total factor productivity). Much higher capital intensity and output growth in these two sectors would cause their capital stock to more than triple (Exhibits B30 and B31). Overall we estimate that the capital stock per capita in the service sectors would more than double taking the entire capital stock to 84% of the current US level, from 47% today (Exhibit B32).
¶ Investment and foreign exchange constraints. We believe that despite more opportunities and stimulation to consume, the 30% investment rate should be within Korea’s reach. The requirement for foreign currencies should also be met for the reasons discussed under scenario 2 since the additional service sector investments would lead to very little increase in imports (e.g. no imported equipment are required to build shopping malls). In any case, Korea would be under scenario 3 a much more attractive place for FDI, which would help overcome both these constraints. Accommodating monetary and exchange rate policies would be necessary to maximize growth and trade.
64
! There would be more choices of saving vehicles and the returns should be higher (higher capital productivity).
! In the case domestic savings are not sufficient, Korea could (safely) rely on increased FDI for the short to medium term. In effect, the removal of the obstructing product market regulations in services would make it possible and attractive for FDI to come. As a matter of fact, with high and growing income levels, Korea would be one of the most attractive countries for best practice service companies. Exhibit B34 shows that because of much stronger growth the current account deficit could be as high as 3% and the trade deficit 1% of GDP.
¶ Additional benefits of FDI. FDI would not only bring foreign capital, but more importantly, it is the best and quickest way to introduce and diffuse best managerial practice in Korea. FDI will create a pool of domestic talent through on-the-job training, and domestic competitors will be strongly stimulated to copy best practice. It should also be noted that such forms of financing are less expensive and safer for Korea than borrowings from foreign banks or capital markets. In effect, FDI are committed long term to the country – more than 90% of the value added created remains in the country (notably through the wages) and a large share of their profits tend to be reinvested in the country (as long as they are exposed to fair competition). Finally, Korean savers would benefit from the success of global best practice FDI if they could participate in these investments.
¶ Employment outlook.
! Allocation. Manufacturing employment should be expected to decline in the same proportion as in scenario 2 – labor productivity and output would both increase in the same proportion from scenario 2 (1% p.a.). Construction employment should be much higher (despite higher productivity) than in scenarios 1 and 2 because of continued overall strong economic growth and relaxed zoning laws in housing construction. There would be many high quality jobs created in business services-their share of total employment would increase from 8% today to 13%. For example, new investment products and rapidly developing capital markets would cause employment to soar in financial services. Job creation should also be very strong in software services following a dramatic increase in demand from service sectors such as retail, retail banking and telecom. Overall, strong across the board productivity and output growth should also provide more attractive employment alternatives to people currently employed in agriculture (Exhibit B35).
65
! Unemployment.
– Short term prospects. Unleashing growth in services immediately should ease the unemployment problem related to the financial crisis. For example, foreign retailers would immediately invest to build new formats thus immediately creating additional construction jobs (while the shopping mall is under construction) and relatively attractive jobs for (laid off and/or young) low skilled workers (once the shopping mall is built). Relaxing zoning laws in housing construction should lead, even in these times of crisis, to the development of large single family housing programs given the high latent demand. Removing product restrictions in retail banking, would immediately create new jobs in marketing and sales of investment products.
– Medium to long term prospects. Given any set of labor market conditions (e.g., minimum wage, unemployment benefits), scenario 3 would always lead to lower unemployment than scenarios 1 and 2 due to the creation of many more high skilled jobs, especially in services. In effect, this strong upward employment pull would allow many more people to pass over any minimum wage hurdle (Exhibit B36).
66
BOX 1: OVERVIEW OF FINDINGS FOR EACH GROWTH SCENARIO
¶ Scenario 1: No fundamental reforms. Under the old regulatory environment, where the government continues to play a significant role in directing economic development, annual GDP growth per capita would drop to 3% on average over a ten year horizon from 7% for the last ten years and Korea would remain vulnerable to another financial crisis. The drop in GDP growth would result from the inevitable decline in labor input growth (due to less favorable demographics) and the end of the technology led productivity growth in manufacturing. Manufacturing employment would remain stable due to trade protections. However, despite continued high investment rates (32% of GDP would still be required), there would be, under this scenario, a significant drop in the creation of attractive new job opportunities both in manufacturing and services for the young people. This growth path mirrors the one of Japan, which also saw a drop in its economic growth at around the same stage in its development.
¶ Scenario 2: Reforms of the financial and manufacturing sectors. This path would significantly reduce the risks of another financial crisis and lead to slightly higher economic growth than the “no reforms” path (4% versus 3% annual GDP growth). However, it could result in high structural unemployment, if in exchange for the permission to lay off in manufacturing, the minimum wage and unemployment benefits are raised. Employment in manufacturing would decline by 20% over the next ten years as firms would be forced to be more productive under the increased pressure from both foreign competitors and lenders. Unfortunately, there would be few attractive reemployment opportunities in the service sector as long as it remains clamped by product market regulations. We have estimated that structural unemployment could reach 12% if Korea were to adopt the US level of minimum wage and unemployment benefits. This bleak outlook is reminiscent of the current social problems faced by France and Germany, which also have failed to thoroughly deregulate their service sectors.
¶ Scenario 3: Additional reforms in services. Unleashing growth in the service sectors by removing as soon as possible all the counter-productive regulations reforms would allow Korea to restore strong sustainable growth (6% annual GDP per capita growth) and provide attractive reemployment opportunities to the released manufacturing workers. For example, relaxing the zoning laws in retail and removing product restrictions in retail banking would allow for the immediate creation of new jobs as shopping malls were built and new financial products were designed, marketed and sold. Furthermore, and counter intuitively, deregulating services would cause output to grow further in manufacturing due to positive spillover effects.
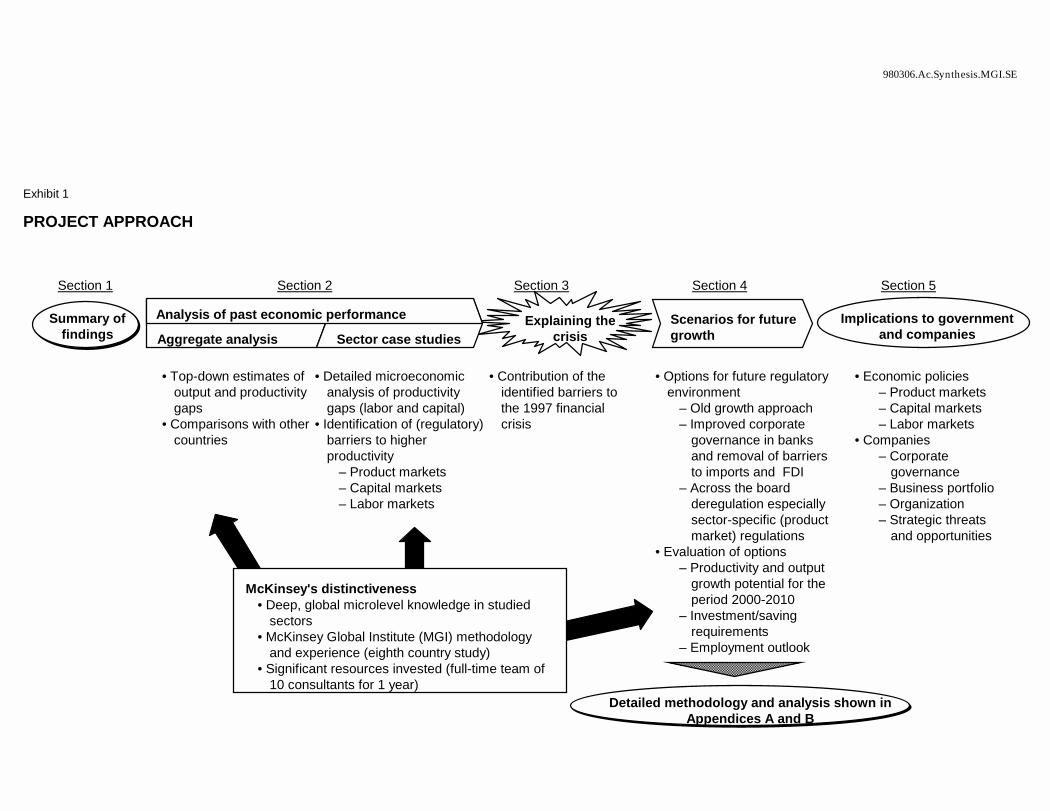
980306.Ac.Synthesis.MGI.SE
PROJECT APPROACH
• Top-down estimates of output and productivity gaps
• Comparisons with other countries
• Detailed microeconomic analysis of productivity gaps (labor and capital)
• Identification of (regulatory) barriers to higher productivity
– Product markets– Capital markets– Labor markets
• Contribution of the identified barriers to the 1997 financial crisis
• Options for future regulatory environment
– Old growth approach– Improved corporate
governance in banks and removal of barriers to imports and FDI
– Across the board deregulation especially sector-specific (product market) regulations
• Evaluation of options– Productivity and output
growth potential for the period 2000-2010
– Investment/saving requirements
– Employment outlook
• Economic policies– Product markets– Capital markets– Labor markets
• Companies– Corporate
governance– Business portfolio– Organization– Strategic threats
and opportunities
Scenarios for future growth
Explaining the crisis
McKinsey's distinctiveness• Deep, global microlevel knowledge in studied
sectors• McKinsey Global Institute (MGI) methodology
and experience (eighth country study)• Significant resources invested (full-time team of
10 consultants for 1 year)
Exhibit 1
Implications to government and companiesAggregate analysis Sector case studies
Section 2 Section 3 Section 4 Section 5
Analysis of past economic performanceSummary of findings
Section 1
Detailed methodology and analysis shown in Appendices A and B
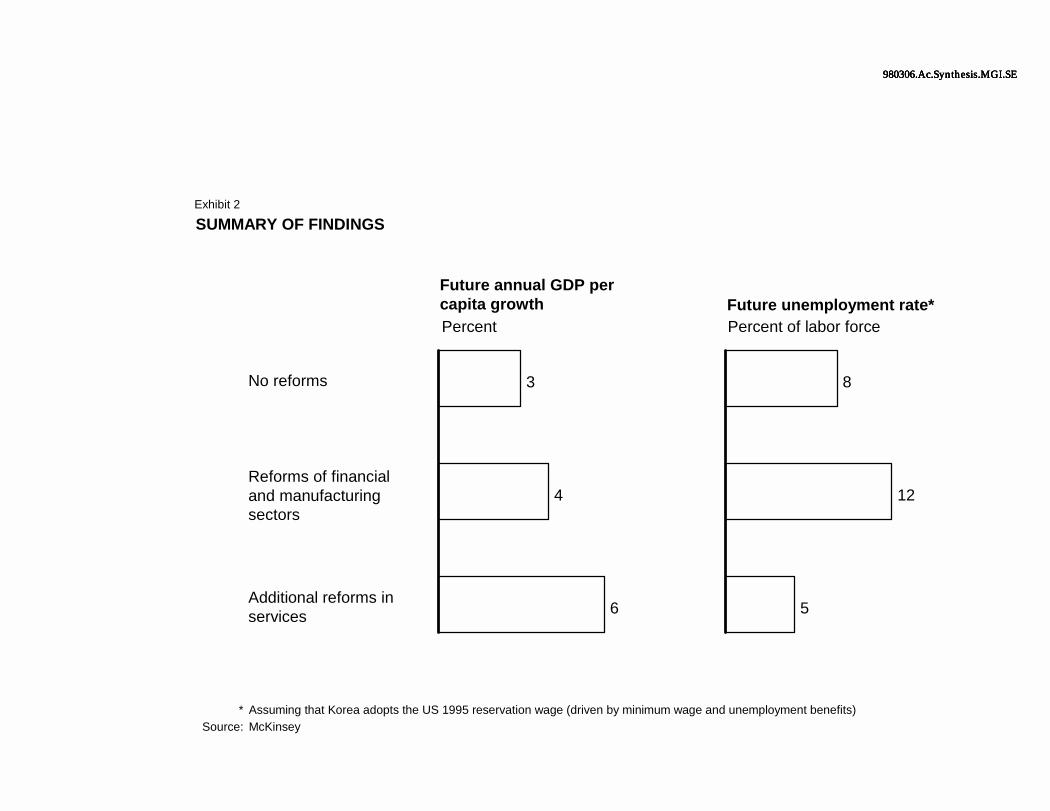
980306.Ac.Synthesis.MGI.SE980306.Ac.Synthesis.MGI.SE980306.Ac.Synthesis.MGI.SE980306.Ac.Synthesis.MGI.SE
SUMMARY OF FINDINGS
* Assuming that Korea adopts the US 1995 reservation wage (driven by minimum wage and unemployment benefits)Source: McKinsey
Future annual GDP per capita growth
3
4
6
No reforms
Reforms of financial and manufacturing sectors
Additional reforms in services
Future unemployment rate*
8
12
5
Percent Percent of labor force
Exhibit 2
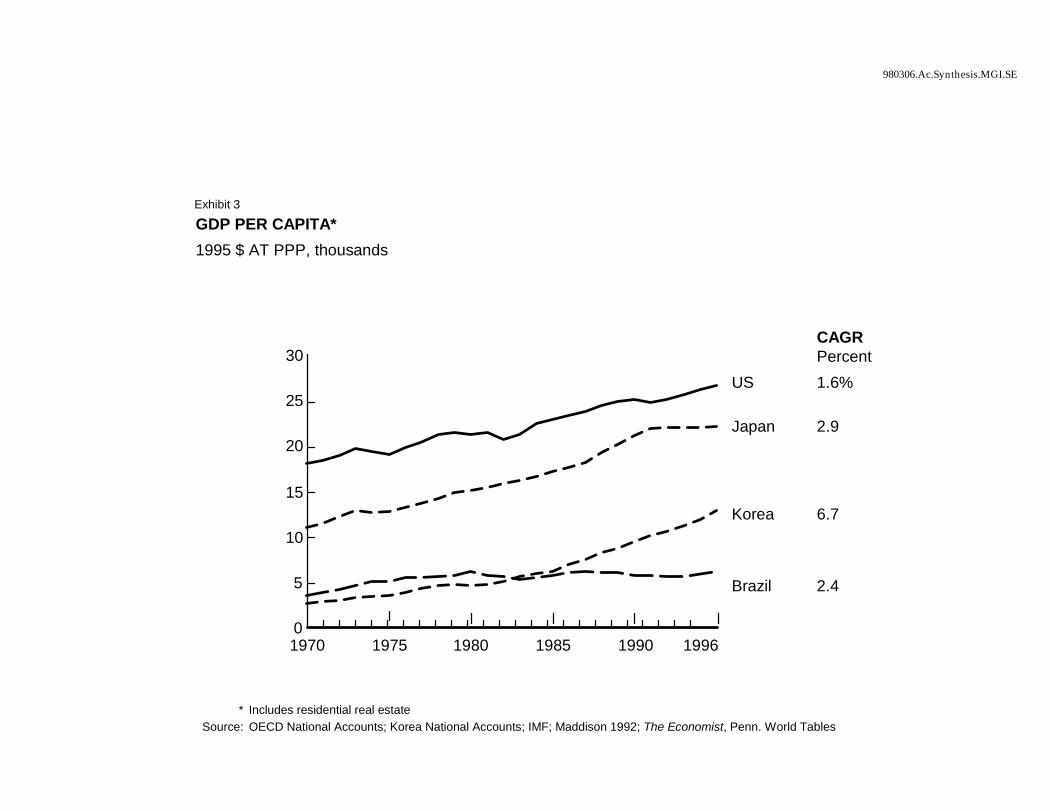
980306.Ac.Synthesis.MGI.SE
1.6%US
GDP PER CAPITA*1995 $ AT PPP, thousands
0
5
10
15
20
25
30
1970 1975 1980 1985 1990 1996
CAGRPercent
2.9
6.7
2.4
Japan
Korea
Brazil
* Includes residential real estateSource: OECD National Accounts; Korea National Accounts; IMF; Maddison 1992; The Economist, Penn. World Tables
Exhibit 3
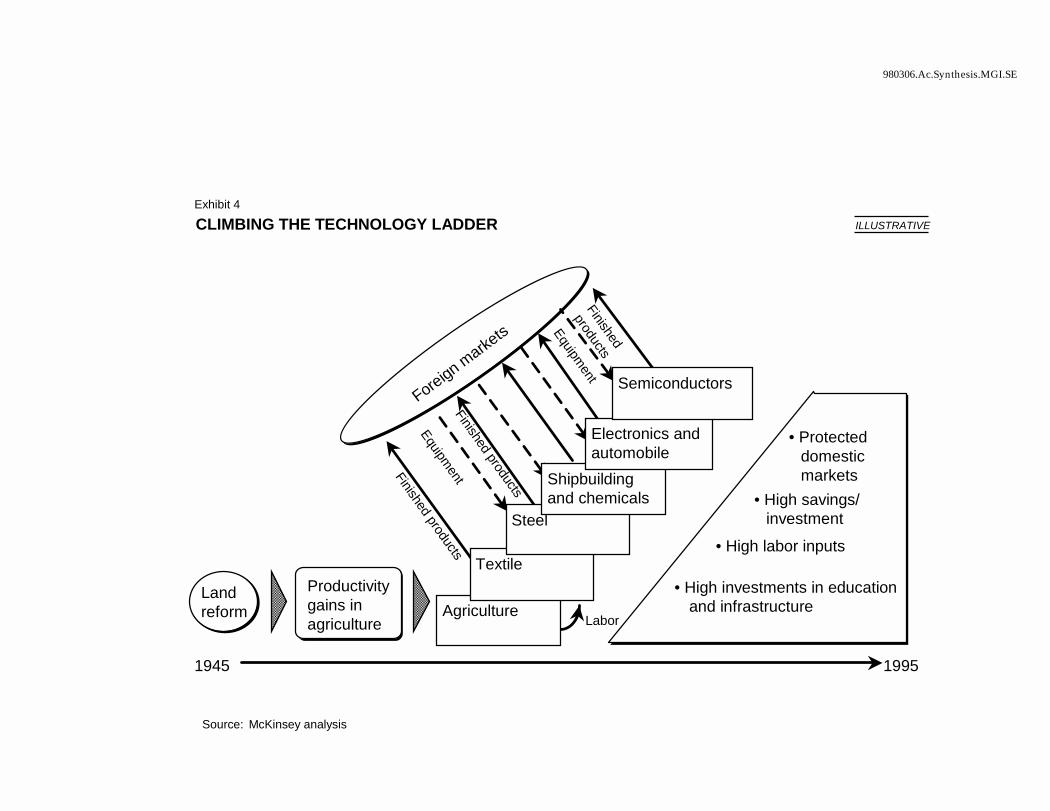
980306.Ac.Synthesis.MGI.SE
CLIMBING THE TECHNOLOGY LADDER
Landreform
1945 1995
Productivity gains in agriculture
• Protected domestic markets
Foreign markets
Finished products
Equipment
Finished products
Equipment
Finished
products
LaborAgriculture
Textile
Steel
Shipbuilding and chemicals
Electronics and automobile
Semiconductors
• High savings/ investment
• High labor inputs
• High investments in education and infrastructure
Source: McKinsey analysis
Exhibit 4
ILLUSTRATIVE
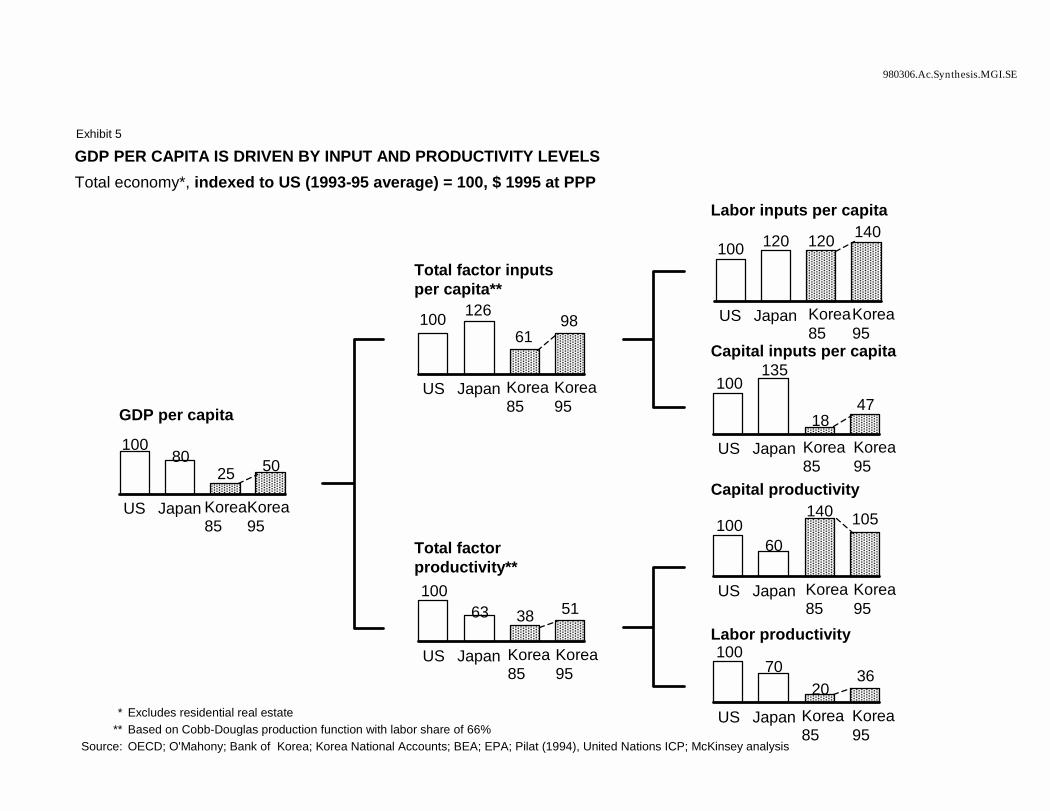
980306.Ac.Synthesis.MGI.SE
10080
25 50
US Japan Korea85
Korea 95
10063 38
US Japan Korea 85
Korea 95
GDP PER CAPITA IS DRIVEN BY INPUT AND PRODUCTIVITY LEVELSTotal economy*, indexed to US (1993-95 average) = 100, $ 1995 at PPP
* Excludes residential real estate** Based on Cobb-Douglas production function with labor share of 66%
Source: OECD; O'Mahony; Bank of Korea; Korea National Accounts; BEA; EPA; Pilat (1994), United Nations ICP; McKinsey analysis
GDP per capita
Total factor inputs per capita**
Total factor productivity**
51
100135
1847
US Japan Korea 85
Korea95
Capital inputs per capita
100 120 120 140
US Japan Korea85
Korea95
10060
140 105
US Japan Korea85
Korea95
10070
2036
US Japan Korea85
Korea95
Labor inputs per capita
Capital productivity
Labor productivity
100 12661
98
US Japan Korea85
Korea95
Exhibit 5
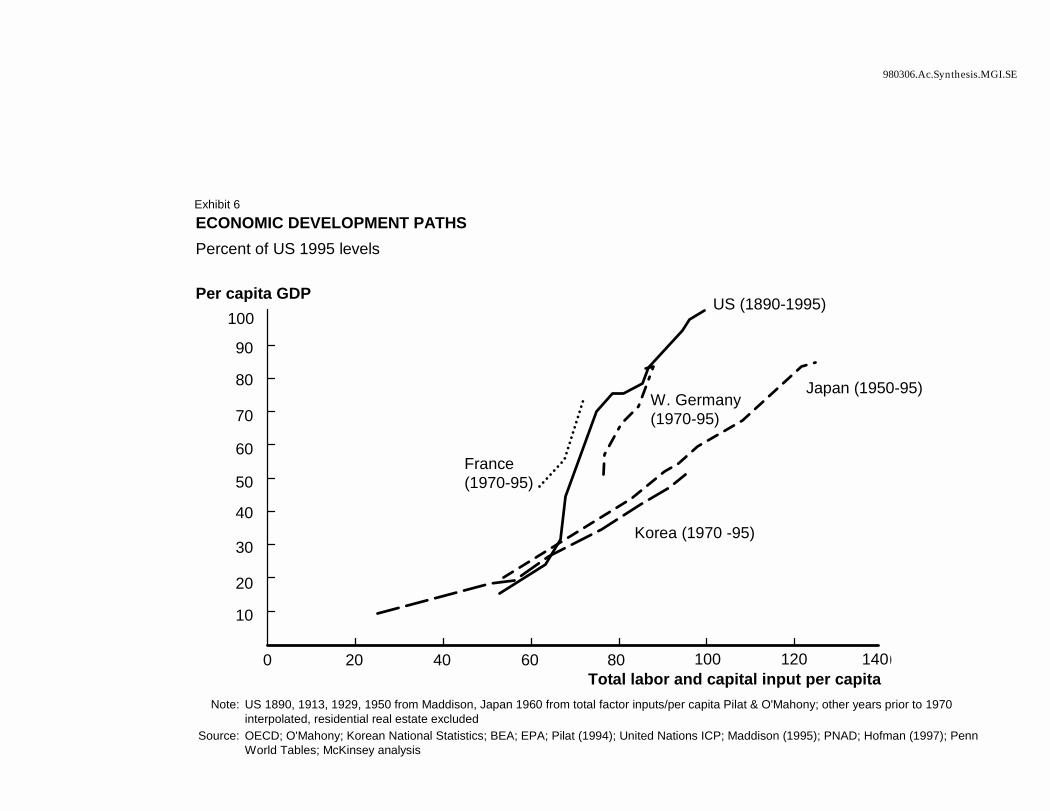
980306.Ac.Synthesis.MGI.SE
ECONOMIC DEVELOPMENT PATHSPercent of US 1995 levels
0 20 40 60 80 100 120 140
Per capita GDP
W. Germany (1970-95)
France(1970-95)
Korea (1970 -95)
US (1890-1995)
Japan (1950-95)
100 120 140
100
90
80
70
60
50
40
30
20
10
Total labor and capital input per capitaNote: US 1890, 1913, 1929, 1950 from Maddison, Japan 1960 from total factor inputs/per capita Pilat & O'Mahony; other years prior to 1970
interpolated, residential real estate excludedSource: OECD; O'Mahony; Korean National Statistics; BEA; EPA; Pilat (1994); United Nations ICP; Maddison (1995); PNAD; Hofman (1997); Penn
World Tables; McKinsey analysis
Exhibit 6
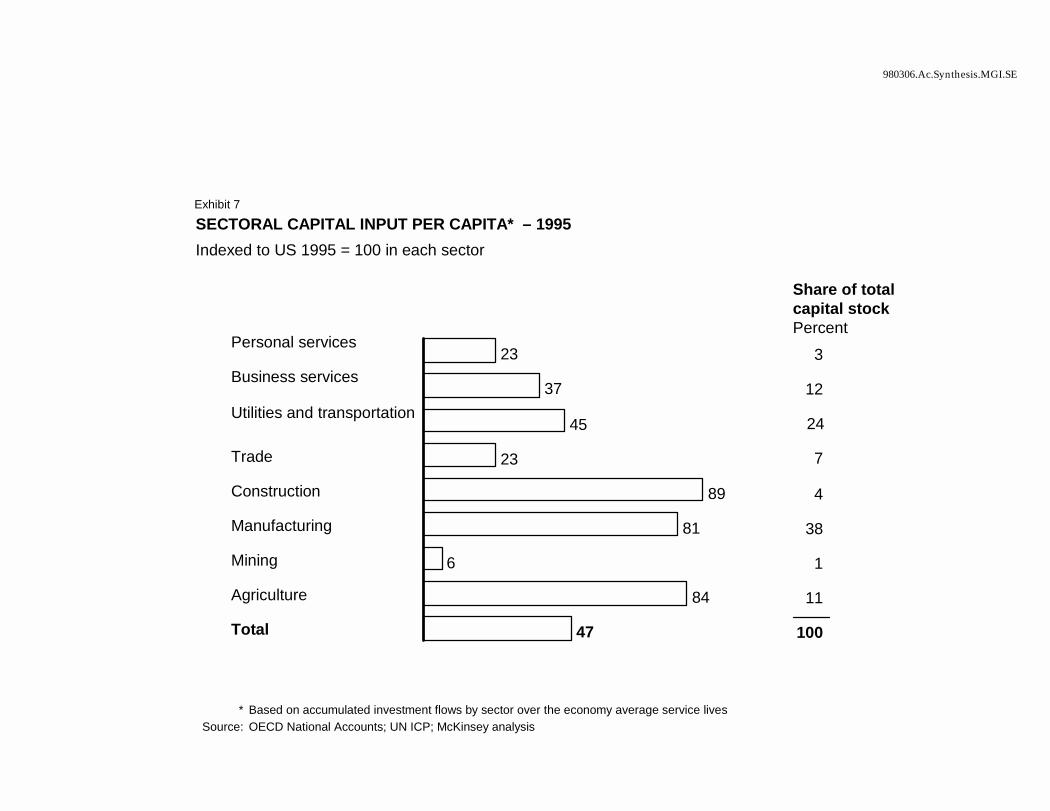
980306.Ac.Synthesis.MGI.SE
SECTORAL CAPITAL INPUT PER CAPITA* – 1995Indexed to US 1995 = 100 in each sector
23
37
45
23
89
81
6
84
47
Personal services
Business services
Utilities and transportation
Trade
Construction
Manufacturing
Mining
Agriculture
Total
* Based on accumulated investment flows by sector over the economy average service livesSource: OECD National Accounts; UN ICP; McKinsey analysis
Share of total capital stockPercent
3
12
24
7
4
38
1
11
100
Exhibit 7
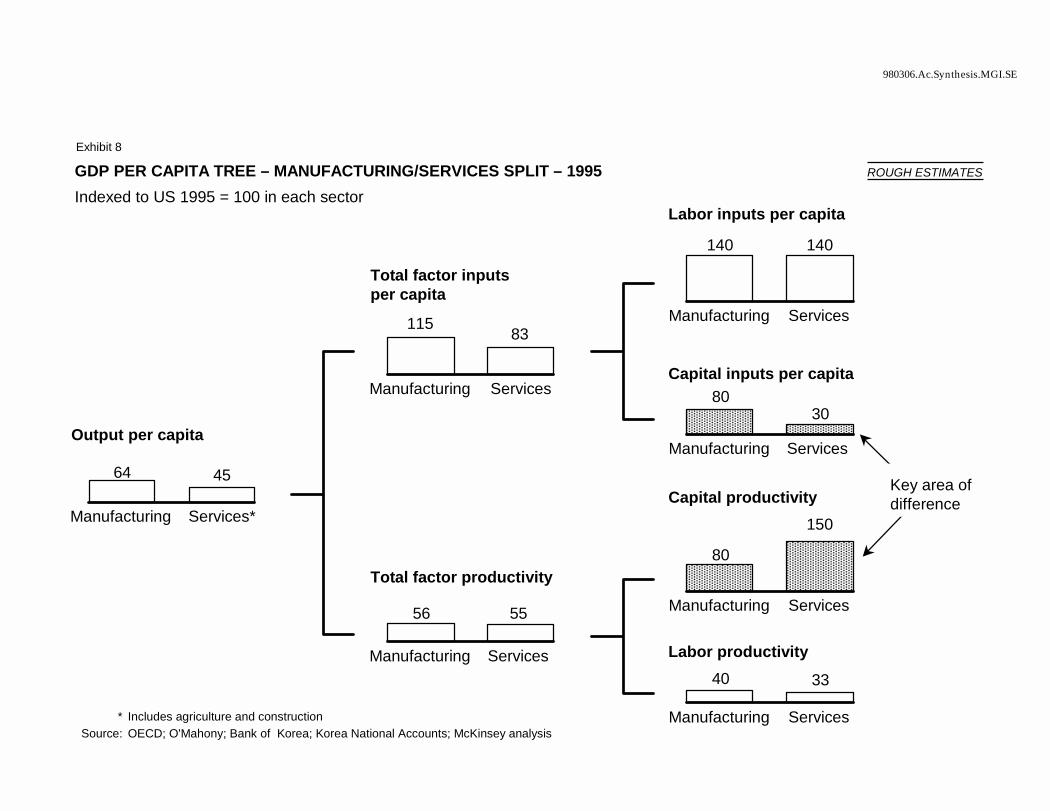
980306.Ac.Synthesis.MGI.SE
64 45
Manufacturing Services*
56 55
Manufacturing Services
GDP PER CAPITA TREE – MANUFACTURING/SERVICES SPLIT – 1995Indexed to US 1995 = 100 in each sector
* Includes agriculture and constructionSource: OECD; O'Mahony; Bank of Korea; Korea National Accounts; McKinsey analysis
Output per capita
Total factor inputs per capita
Total factor productivity
8030
Manufacturing Services
Capital inputs per capita
140 140
Manufacturing Services
80
150
Manufacturing Services
40 33
Manufacturing Services
Labor inputs per capita
Capital productivity
Labor productivity
115 83
Manufacturing Services
Exhibit 8
ROUGH ESTIMATES
Key area of difference

980306.Ac.Synthesis.MGI.SE
EMPLOYMENT COVERAGE OF OUR INDUSTRY CASE STUDIESPercent
Source: OECD National Accounts; Census of Establishments and Households; McKinsey analysis
Services and construction 61
Manufacturing and utilities 26
Agriculture 13
100% = 20 million
Total employment
Construction
15Retailing12
Retail banking4
Others69
Food processing
8Automotive
8 Semiconductors2 Telecom1 Steel
Service sector employment100% = 12.2 million
Industrial employment100% = 5.2 million
1
Exhibit 9
1
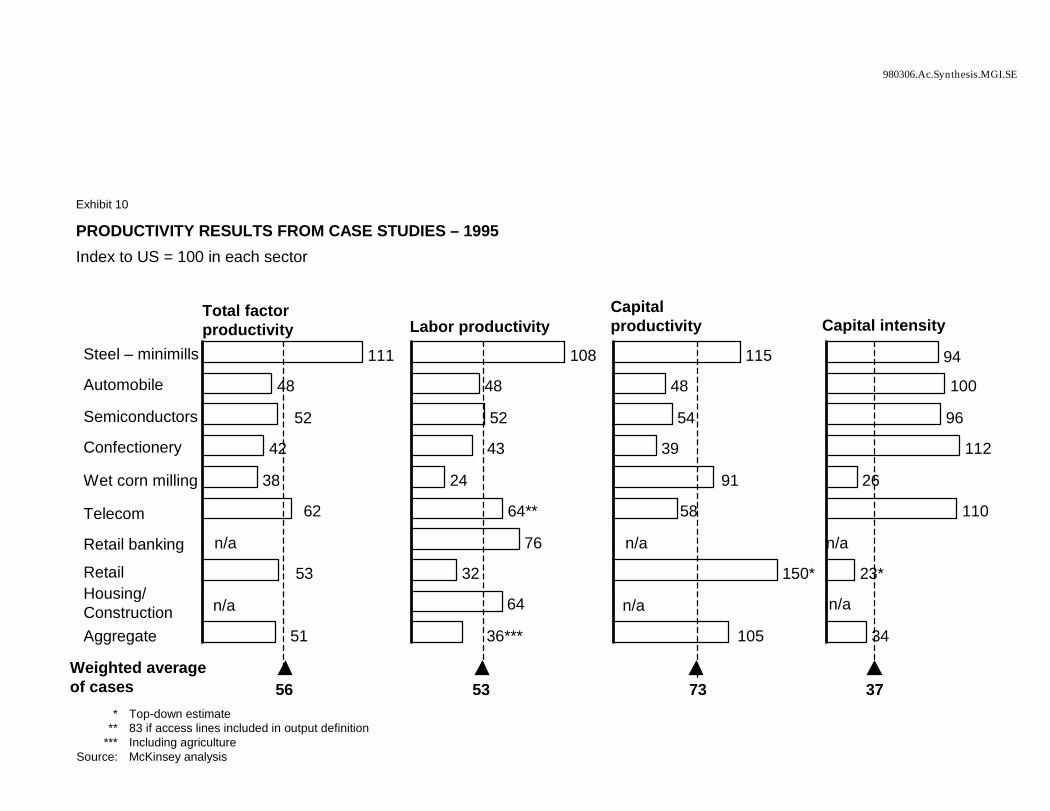
980306.Ac.Synthesis.MGI.SE
PRODUCTIVITY RESULTS FROM CASE STUDIES – 1995Index to US = 100 in each sector
111
48
52
42
38
62
n/a
53
n/a
51
Steel – minimills
Automobile
Semiconductors
Confectionery
Wet corn milling
Telecom
Retail banking
RetailHousing/ ConstructionAggregate
108
48
52
43
24
64**
76
32
64
36***
115
48
54
39
91
58
n/a
150*
n/a
105
94
100
96
112
26
110
n/a
23*
n/a
34
Total factor productivity Labor productivity
Capital productivity Capital intensity
Weighted average of cases
* Top-down estimate** 83 if access lines included in output definition
*** Including agricultureSource: McKinsey analysis
56 53 73 37
Exhibit 10
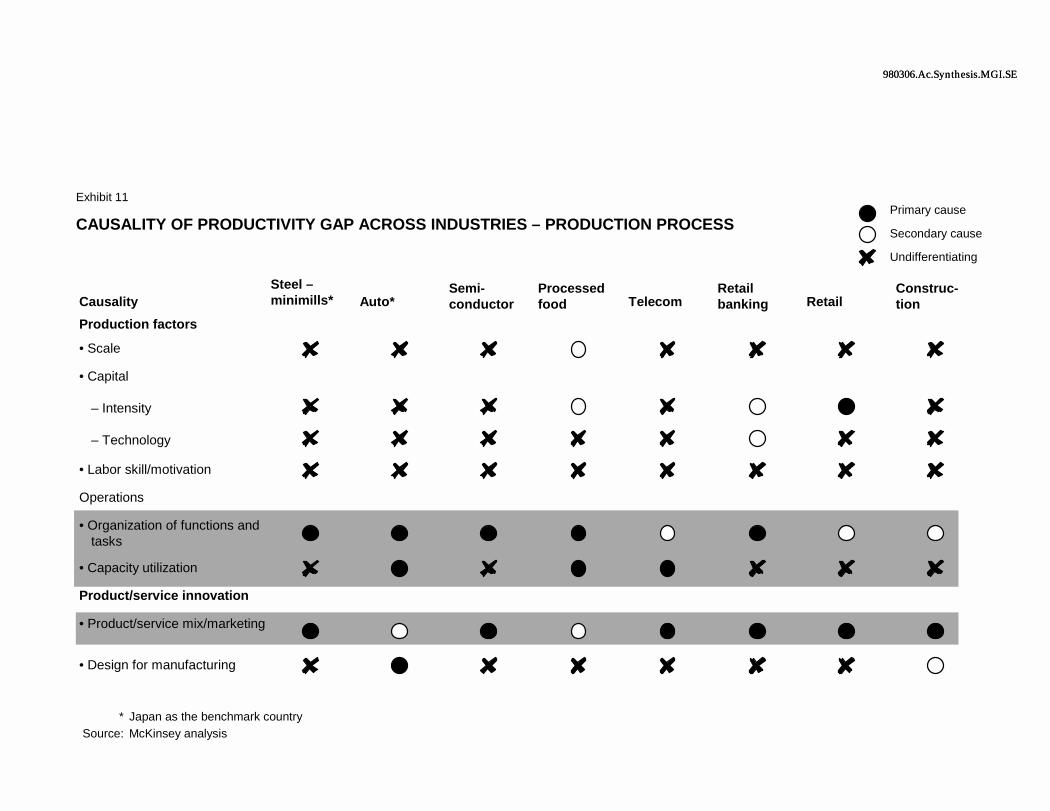
980306.Ac.Synthesis.MGI.SE980306.Ac.Synthesis.MGI.SE
CAUSALITY OF PRODUCTIVITY GAP ACROSS INDUSTRIES – PRODUCTION PROCESS
* Japan as the benchmark countrySource: McKinsey analysis
CausalitySteel –minimills* Auto*
Semi-conductor
Processed food Telecom
Retail banking Retail
Construc-tion
Production factors
• Scale
• Capital
– Intensity
– Technology
• Labor skill/motivation
Operations
• Organization of functions and tasks
• Capacity utilization
Product/service innovation
• Product/service mix/marketing
• Design for manufacturing
Primary cause
Secondary cause
Undifferentiating
Exhibit 11
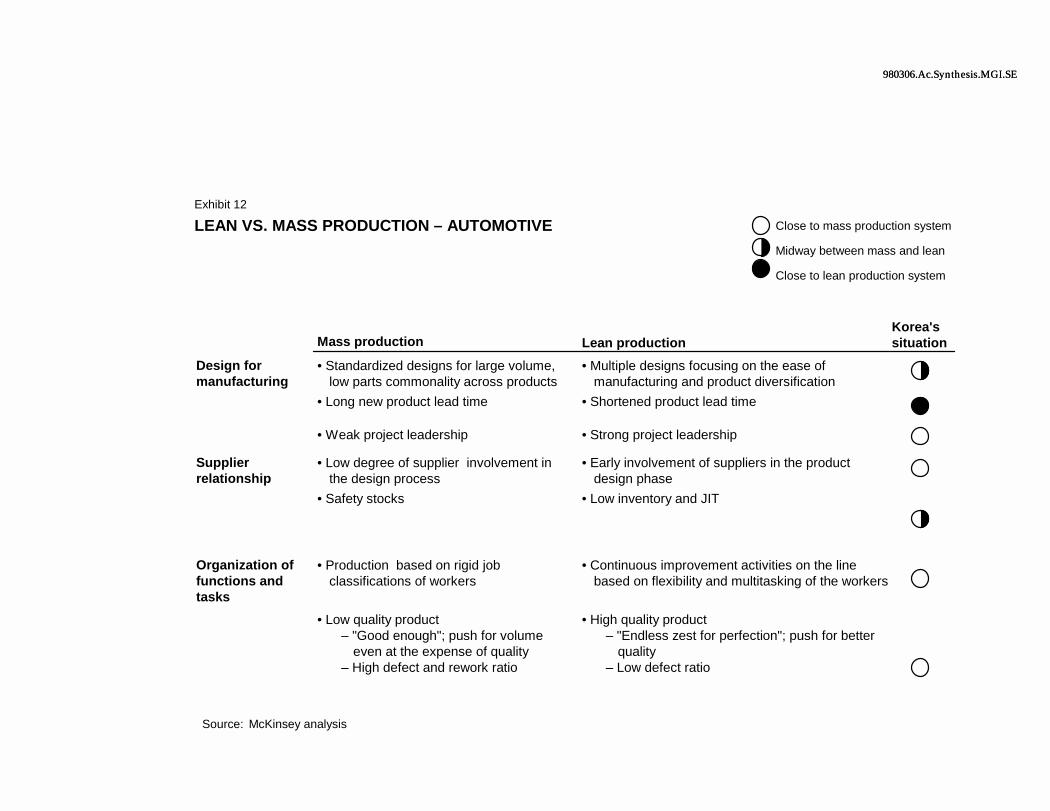
980306.Ac.Synthesis.MGI.SE980306.Ac.Synthesis.MGI.SE
Mass production Lean productionKorea's situation
Design for manufacturing
• Standardized designs for large volume, low parts commonality across products
• Multiple designs focusing on the ease of manufacturing and product diversification
• Long new product lead time • Shortened product lead time
• Weak project leadership • Strong project leadership
Supplier relationship
• Low degree of supplier involvement in the design process
• Early involvement of suppliers in the product design phase
• Safety stocks • Low inventory and JIT
Organization of functions and tasks
• Production based on rigid job classifications of workers
• Continuous improvement activities on the line based on flexibility and multitasking of the workers
• Low quality product– "Good enough"; push for volume
even at the expense of quality– High defect and rework ratio
• High quality product– "Endless zest for perfection"; push for better
quality– Low defect ratio
LEAN VS. MASS PRODUCTION – AUTOMOTIVE
Source: McKinsey analysis
Close to mass production system
Midway between mass and lean
Close to lean production system
Exhibit 12
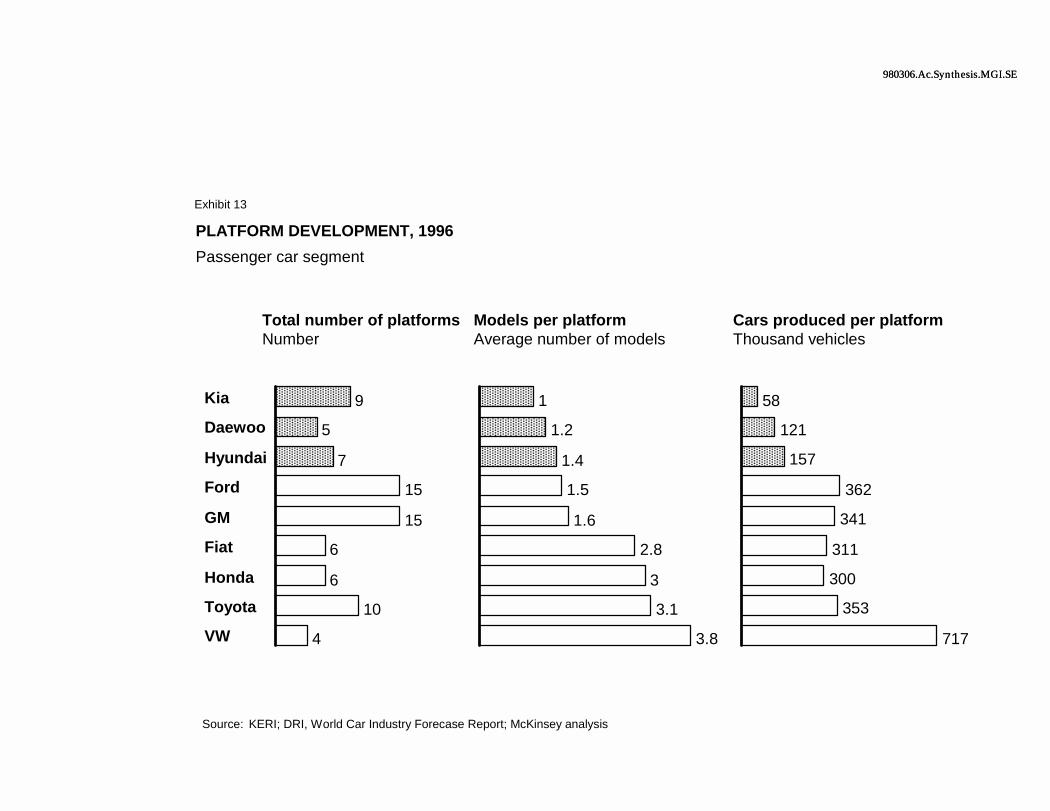
980306.Ac.Synthesis.MGI.SE980306.Ac.Synthesis.MGI.SE
PLATFORM DEVELOPMENT, 1996Passenger car segment
Source: KERI; DRI, World Car Industry Forecase Report; McKinsey analysis
Total number of platformsNumber
Models per platformAverage number of models
Cars produced per platformThousand vehicles
9
5
7
15
15
6
6
10
4
Kia
Daewoo
Hyundai
Ford
GM
Fiat
Honda
Toyota
VW
1
1.2
1.4
1.5
1.6
2.8
3
3.1
3.8
58
121
157
362
341
311
300
353
717
Exhibit 13
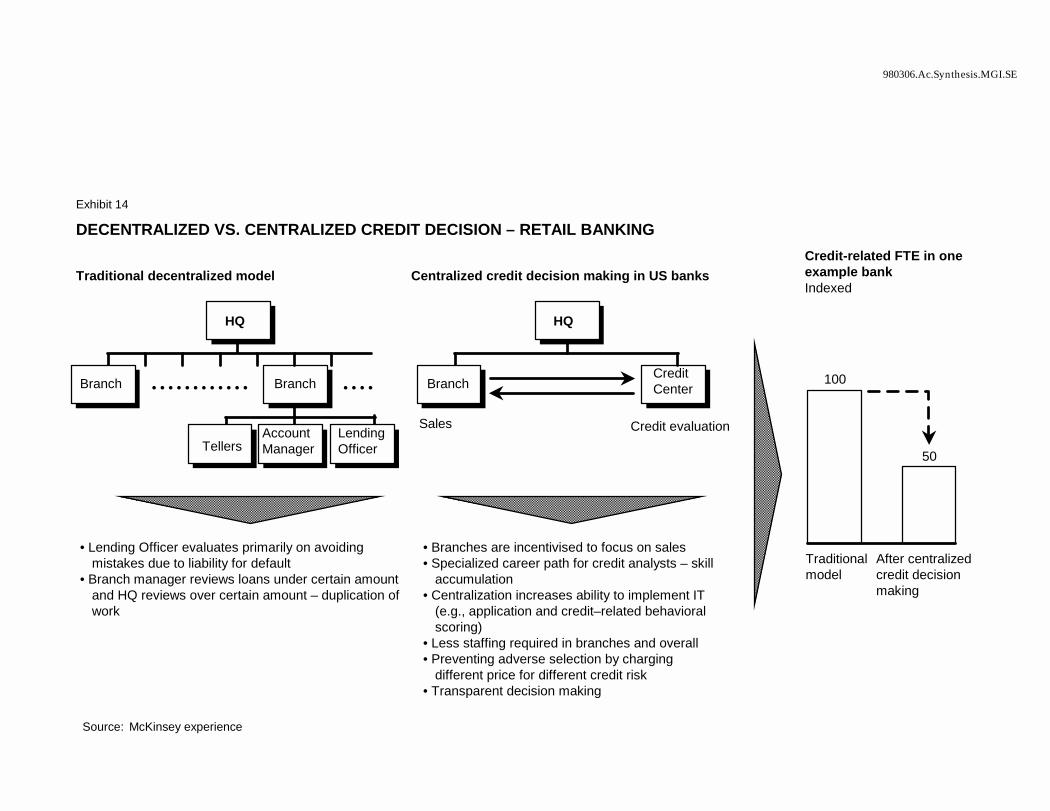
980306.Ac.Synthesis.MGI.SE
Branch
Account Manager Tellers
DECENTRALIZED VS. CENTRALIZED CREDIT DECISION – RETAIL BANKING
Traditional decentralized model
LendingOfficer
• Lending Officer evaluates primarily on avoiding mistakes due to liability for default
• Branch manager reviews loans under certain amount and HQ reviews over certain amount – duplication of work
Centralized credit decision making in US banks
Sales Credit evaluation
• Branches are incentivised to focus on sales• Specialized career path for credit analysts – skill
accumulation• Centralization increases ability to implement IT
(e.g., application and credit–related behavioral scoring)
• Less staffing required in branches and overall• Preventing adverse selection by charging
different price for different credit risk• Transparent decision making
Credit-related FTE in one example bank Indexed
100
Traditional model
50
After centralized credit decision making
Source: McKinsey experience
Branch
HQ
• • • • • • • • • • • • • • • • Branch
HQ
CreditCenter
Exhibit 14
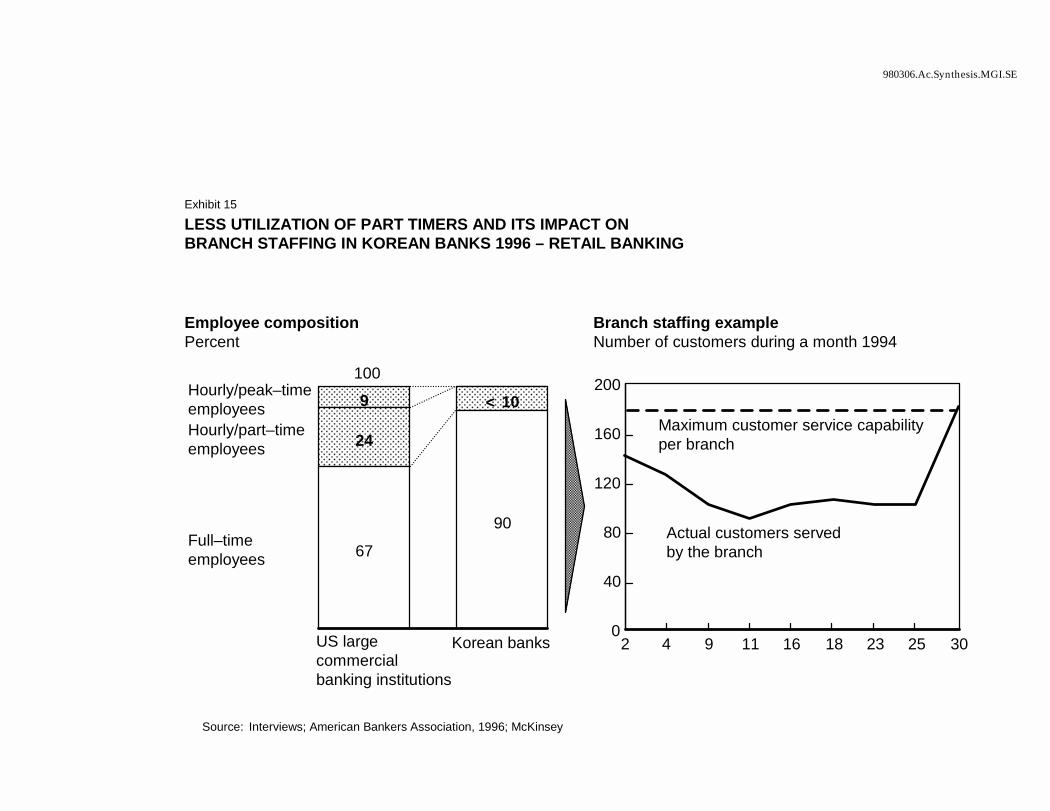
980306.Ac.Synthesis.MGI.SE
LESS UTILIZATION OF PART TIMERS AND ITS IMPACT ONBRANCH STAFFING IN KOREAN BANKS 1996 – RETAIL BANKING
Source: Interviews; American Bankers Association, 1996; McKinsey
0
40
80
120
160
200
2 4 9 11 16 18 23 25 30
Branch staffing exampleNumber of customers during a month 1994
Actual customers served by the branch
Maximum customer service capability per branch
Hourly/peak–time employees 9
Hourly/part–time employees 24
10
Full–time employees 67
90
US largecommercial banking institutions
Korean banks
Employee compositionPercent
<
100
Exhibit 15
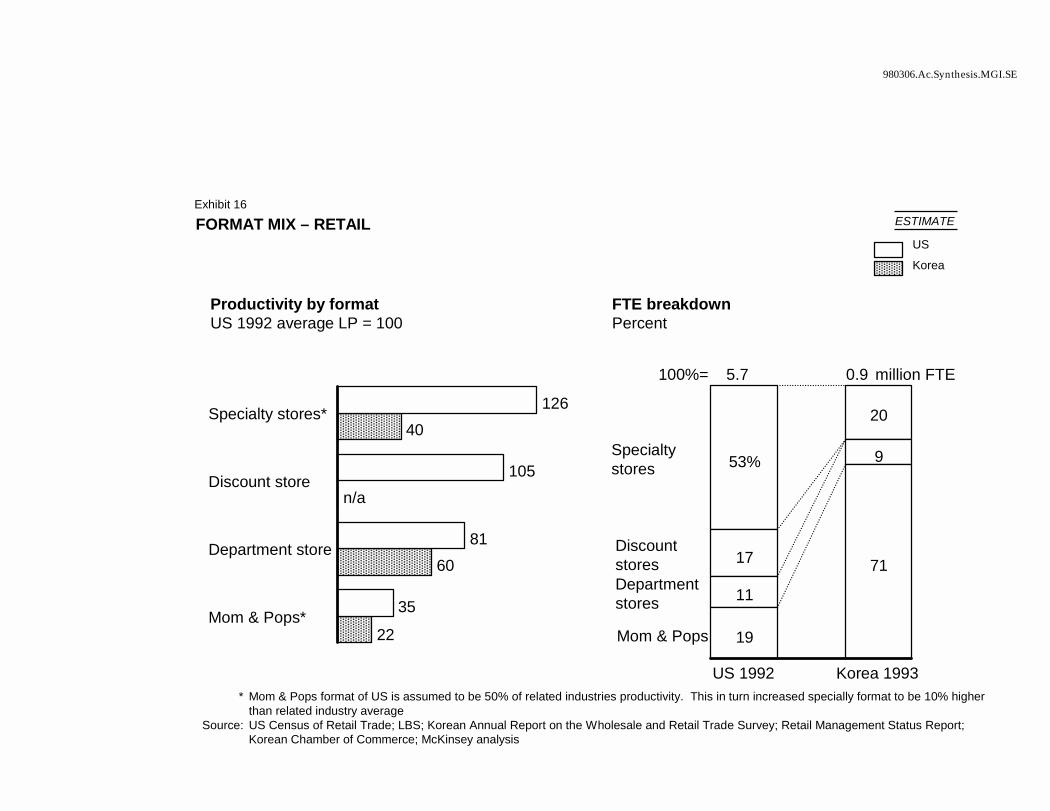
980306.Ac.Synthesis.MGI.SE
Specialty stores 53%
20
Discountstores 17Departmentstores 11
9
Mom & Pops 19
71
US 1992 Korea 1993
FORMAT MIX – RETAIL
100%=
* Mom & Pops format of US is assumed to be 50% of related industries productivity. This in turn increased specially format to be 10% higher than related industry average
Source: US Census of Retail Trade; LBS; Korean Annual Report on the Wholesale and Retail Trade Survey; Retail Management Status Report; Korean Chamber of Commerce; McKinsey analysis
5.7 0.9 million FTE
40
n/a
60
22
126
105
81
35
Specialty stores*
Discount store
Department store
Mom & Pops*
Productivity by formatUS 1992 average LP = 100
US
Korea
FTE breakdownPercent
ESTIMATEExhibit 16
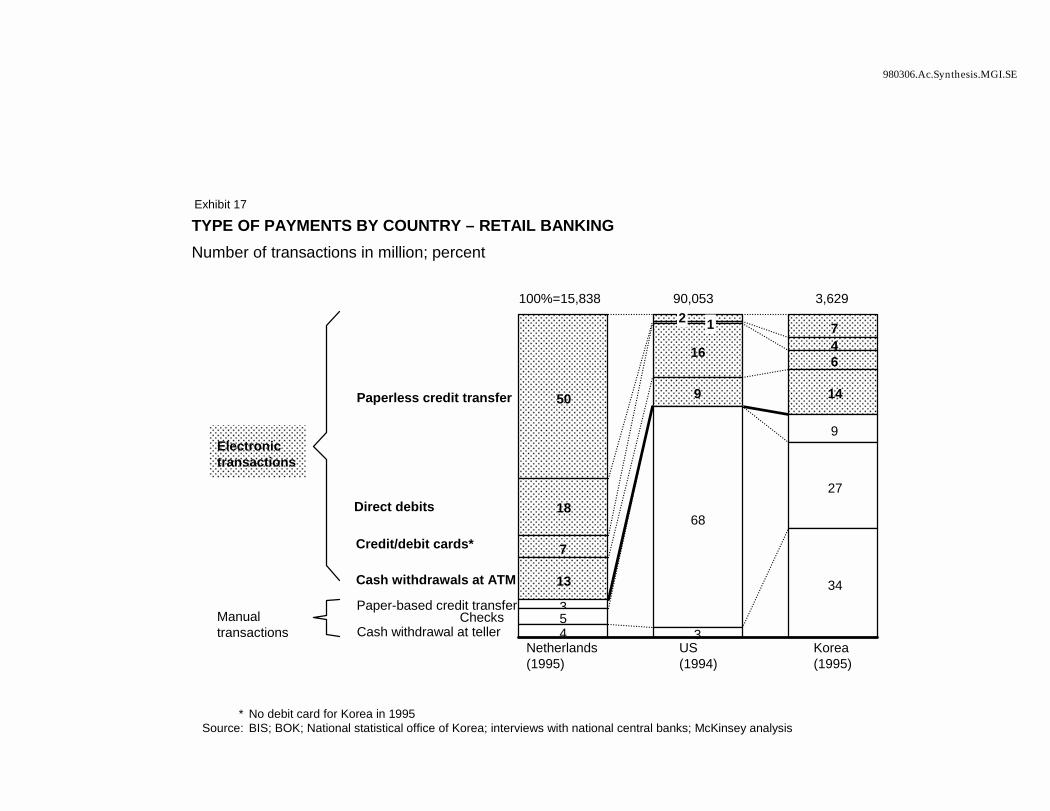
980306.Ac.Synthesis.MGI.SE
* No debit card for Korea in 1995Source: BIS; BOK; National statistical office of Korea; interviews with national central banks; McKinsey analysis
Electronic transactions
TYPE OF PAYMENTS BY COUNTRY – RETAIL BANKING
Paperless credit transfer 50
7
Direct debits 18
4
Credit/debit cards* 7
16 6
Cash withdrawals at ATM 13
9 14
Paper-based credit transfer 3
9
Checks 5
68
27
Cash withdrawal at teller 4 3
34
Netherlands(1995)
US(1994)
Korea(1995)
Number of transactions in million; percent
100%=15,838 3,62990,053
Manual transactions
Exhibit 17
2 1
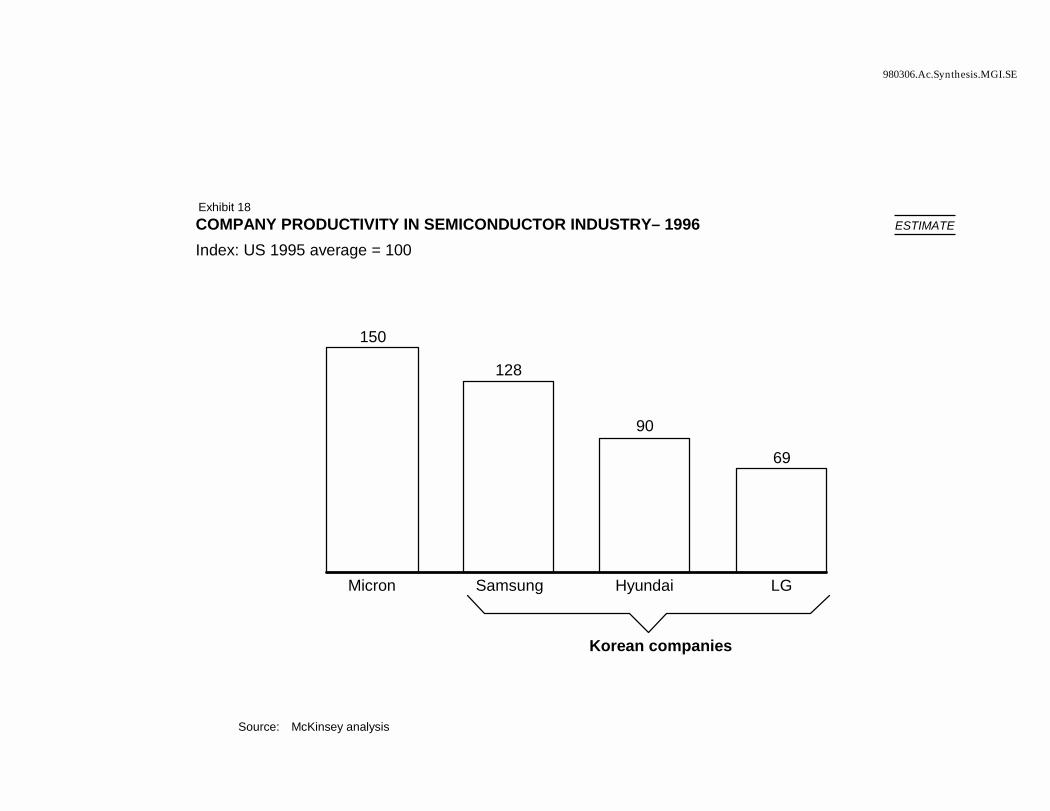
980306.Ac.Synthesis.MGI.SE
COMPANY PRODUCTIVITY IN SEMICONDUCTOR INDUSTRY– 1996Index: US 1995 average = 100
Source: McKinsey analysis
Exhibit 18
150
128
90
69
Micron Samsung Hyundai LG
Korean companies
ESTIMATE
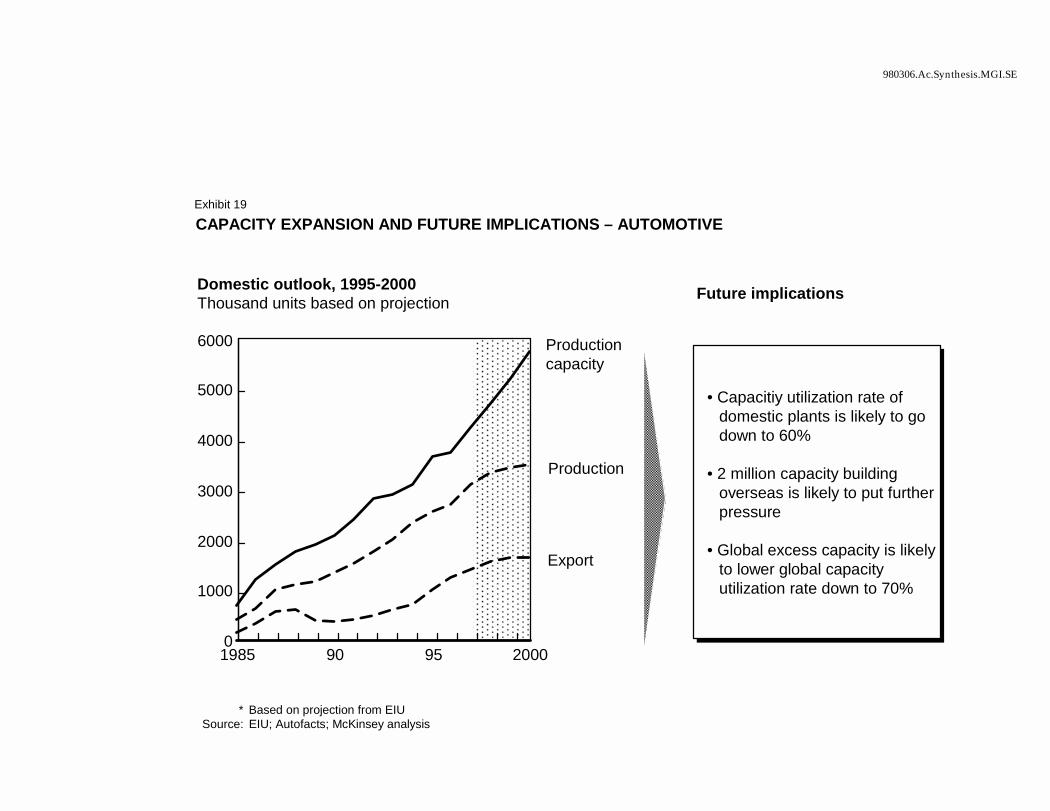
980306.Ac.Synthesis.MGI.SE
CAPACITY EXPANSION AND FUTURE IMPLICATIONS – AUTOMOTIVE
0
1000
2000
3000
4000
5000
6000
Export
Production
Production capacity
1985 90 95 2000
* Based on projection from EIUSource: EIU; Autofacts; McKinsey analysis
Domestic outlook, 1995-2000Thousand units based on projection Future implications
• Capacitiy utilization rate of domestic plants is likely to go down to 60%
• 2 million capacity building overseas is likely to put further pressure
• Global excess capacity is likely to lower global capacity utilization rate down to 70%
Exhibit 19
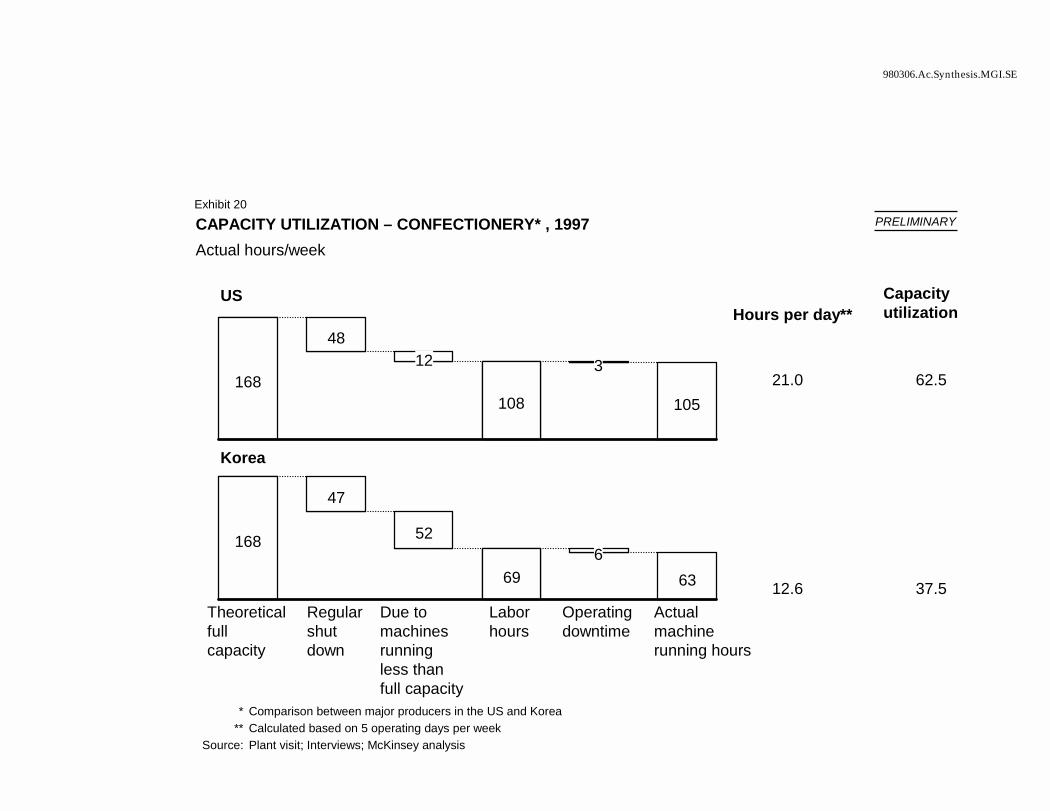
980306.Ac.Synthesis.MGI.SE
* Comparison between major producers in the US and Korea** Calculated based on 5 operating days per week
Source: Plant visit; Interviews; McKinsey analysis
US
168
4812
108
3
105
Korea
168
47
52
696
63
Theoreticalfullcapacity
Regularshutdown
Due tomachinesrunningless thanfull capacity
Laborhours
Operatingdowntime
Actualmachine running hours
Hours per day**
21.0
12.6
Capacityutilization
62.5
37.5
CAPACITY UTILIZATION – CONFECTIONERY* , 1997Actual hours/week
PRELIMINARYExhibit 20
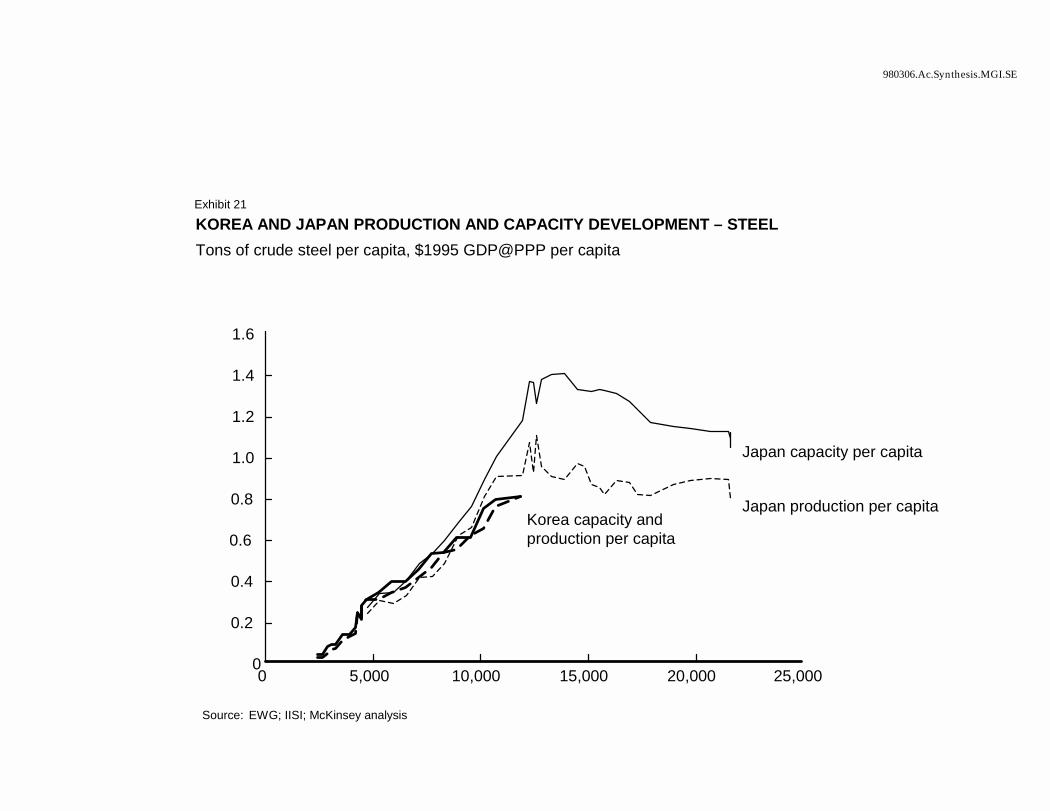
980306.Ac.Synthesis.MGI.SE
0
0.2
0.4
0.6
0.8
1.0
1.2
1.4
1.6
0 5,000 10,000 15,000 20,000 25,000
KOREA AND JAPAN PRODUCTION AND CAPACITY DEVELOPMENT – STEELTons of crude steel per capita, $1995 GDP@PPP per capita
Source: EWG; IISI; McKinsey analysis
Korea capacity and production per capita
Japan production per capita
Japan capacity per capita
Exhibit 21
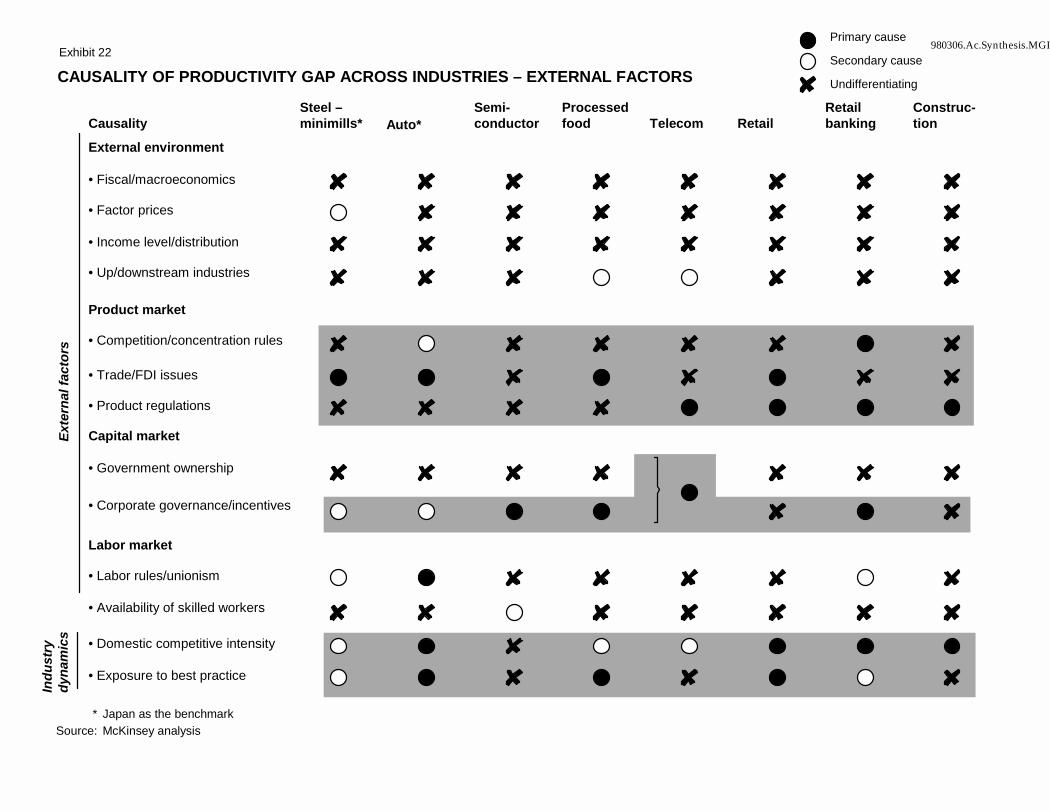
980306.Ac.Synthesis.MGI.
CAUSALITY OF PRODUCTIVITY GAP ACROSS INDUSTRIES – EXTERNAL FACTORS
CausalitySteel –minimills* Auto*
Semi-conductor
Processed food Telecom Retail
Retail banking
Construc-tion
External environment
• Fiscal/macroeconomics
• Factor prices
• Income level/distribution
• Up/downstream industries
Product market
• Competition/concentration rules
• Trade/FDI issues
• Product regulations
Capital market
• Government ownership
• Corporate governance/incentives
Labor market
• Labor rules/unionism
• Availability of skilled workers
• Domestic competitive intensity
• Exposure to best practice
Exte
rnal
fact
ors
Indu
stry
dy
nam
ics
* Japan as the benchmarkSource: McKinsey analysis
Exhibit 22Primary cause
Secondary cause
Undifferentiating
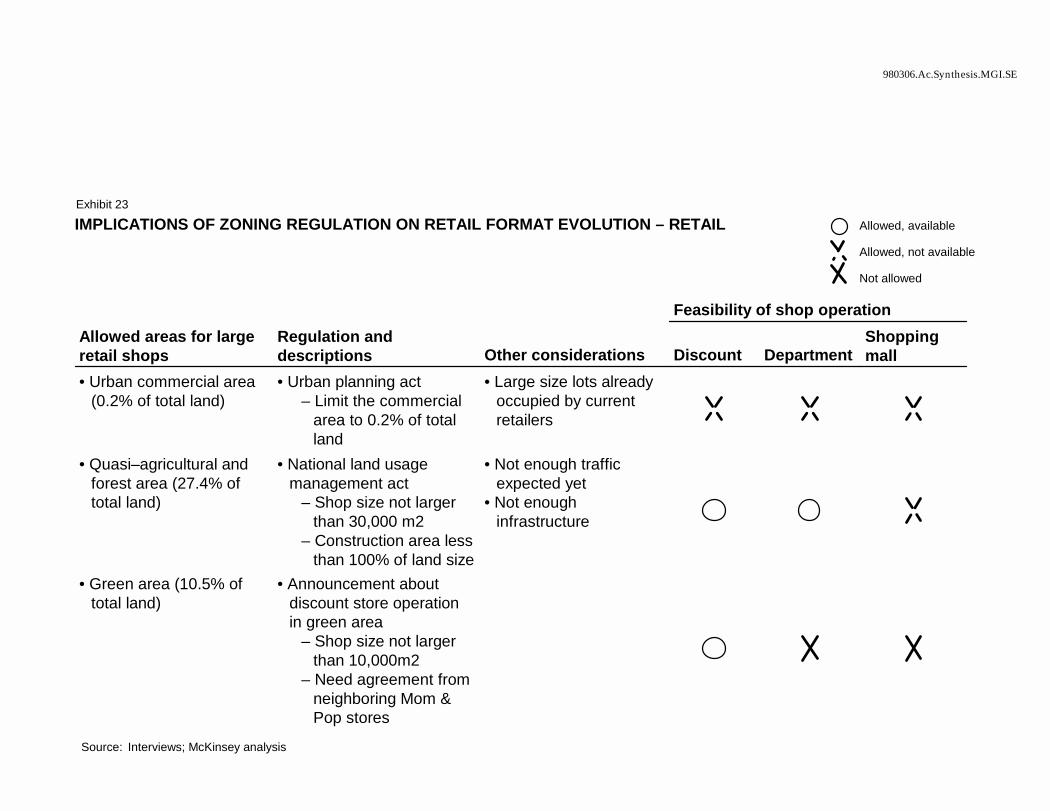
980306.Ac.Synthesis.MGI.SE
Feasibility of shop operationAllowed areas for large retail shops
Regulation and descriptions Other considerations Discount Department
Shopping mall
• Urban commercial area (0.2% of total land)
• Urban planning act – Limit the commercial
area to 0.2% of total land
• Large size lots already occupied by current retailers
• Quasi–agricultural and forest area (27.4% of total land)
• National land usage management act
– Shop size not larger than 30,000 m2
– Construction area less than 100% of land size
• Not enough traffic expected yet
• Not enough infrastructure
• Green area (10.5% of total land)
• Announcement about discount store operation in green area
– Shop size not larger than 10,000m2
– Need agreement from neighboring Mom & Pop stores
Exhibit 23
Allowed, available
Allowed, not available
Not allowed
IMPLICATIONS OF ZONING REGULATION ON RETAIL FORMAT EVOLUTION – RETAIL
Source: Interviews; McKinsey analysis
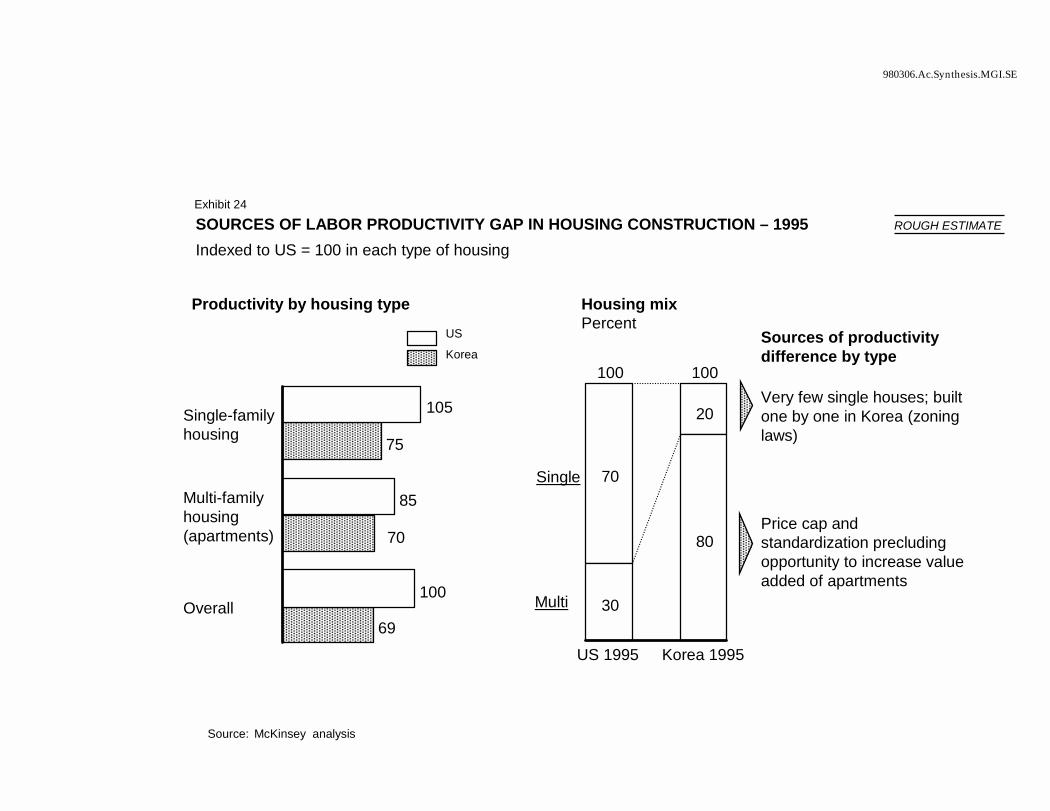
980306.Ac.Synthesis.MGI.SE
100 100
70
20
30
80
US 1995 Korea 1995
SOURCES OF LABOR PRODUCTIVITY GAP IN HOUSING CONSTRUCTION – 1995Indexed to US = 100 in each type of housing
Source: McKinsey analysis
75
70
69
105
85
100
Single-familyhousing
Multi-familyhousing(apartments)
Overall
Productivity by housing typeUS
Korea
Housing mixPercent
Sources of productivity difference by type
Very few single houses; built one by one in Korea (zoning laws)
Price cap and standardization precluding opportunity to increase value added of apartments
Single
Multi
Exhibit 24
ROUGH ESTIMATE
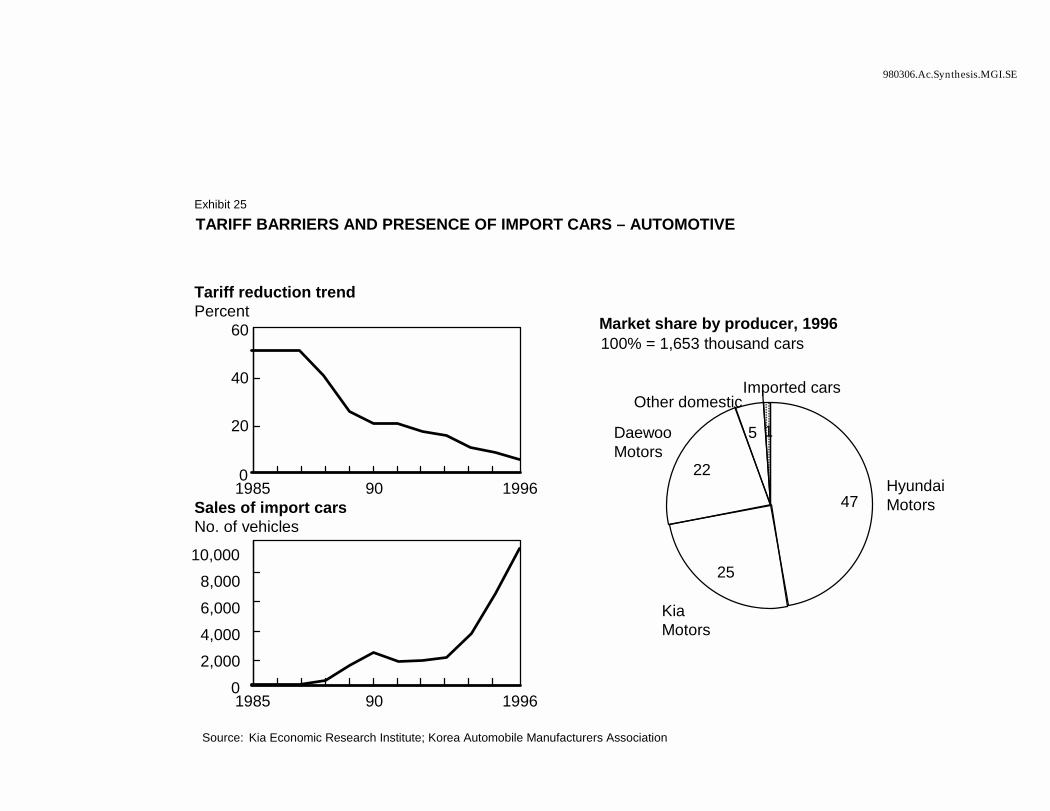
980306.Ac.Synthesis.MGI.SE
TARIFF BARRIERS AND PRESENCE OF IMPORT CARS – AUTOMOTIVE
Source: Kia Economic Research Institute; Korea Automobile Manufacturers Association
0
20
40
60
1985 90 1996
02,0004,0006,0008,000
10,000
1985 90 1996
Tariff reduction trendPercent
Sales of import carsNo. of vehicles
100% = 1,653 thousand carsMarket share by producer, 1996
HyundaiMotors 47
KiaMotors
25
DaewooMotors
22
Other domestic
5
Imported cars
1
Exhibit 25
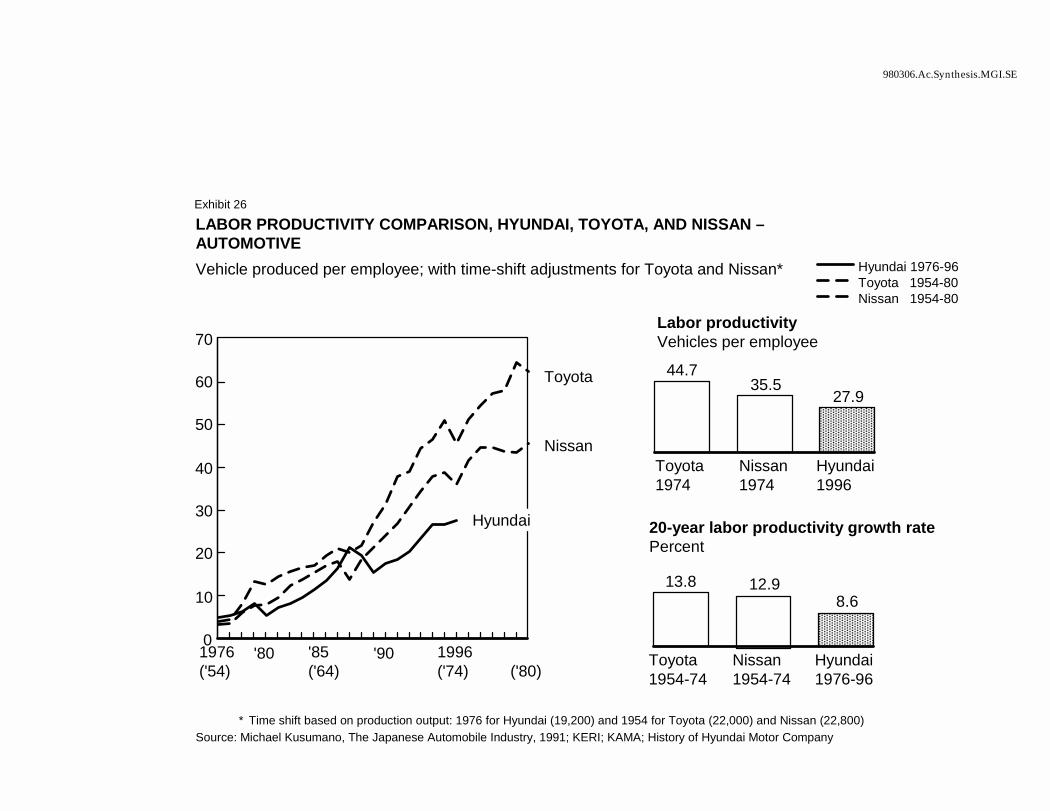
980306.Ac.Synthesis.MGI.SE
LABOR PRODUCTIVITY COMPARISON, HYUNDAI, TOYOTA, AND NISSAN –AUTOMOTIVEVehicle produced per employee; with time-shift adjustments for Toyota and Nissan*
0
10
20
30
40
50
60
70
Nissan
Toyota
Hyundai
1976('54)
'80 '85 ('64)
'90 1996('74) ('80)
* Time shift based on production output: 1976 for Hyundai (19,200) and 1954 for Toyota (22,000) and Nissan (22,800)Source: Michael Kusumano, The Japanese Automobile Industry, 1991; KERI; KAMA; History of Hyundai Motor Company
Hyundai 1976-96Toyota 1954-80Nissan 1954-80
Labor productivityVehicles per employee
44.735.5
27.9
Toyota 1974
Nissan 1974
Hyundai 1996
13.8 12.98.6
Toyota 1954-74
Nissan 1954-74
Hyundai 1976-96
20-year labor productivity growth ratePercent
Exhibit 26
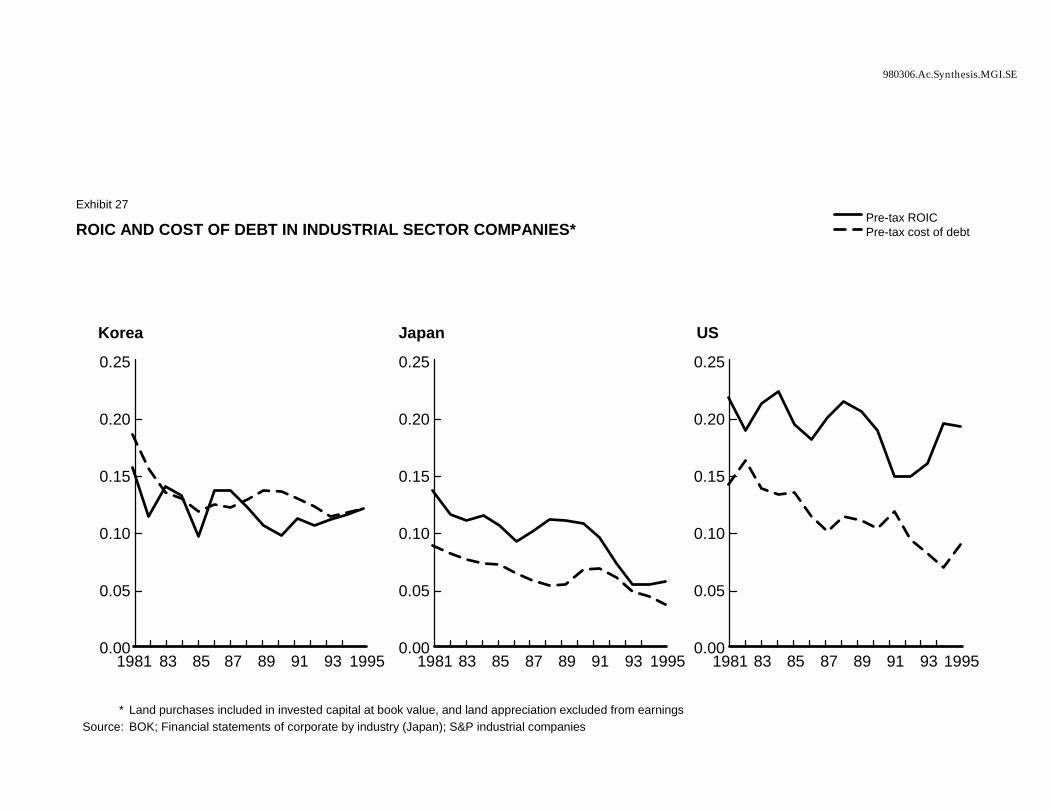
980306.Ac.Synthesis.MGI.SE
ROIC AND COST OF DEBT IN INDUSTRIAL SECTOR COMPANIES*
* Land purchases included in invested capital at book value, and land appreciation excluded from earningsSource: BOK; Financial statements of corporate by industry (Japan); S&P industrial companies
Korea
0.00
0.05
0.10
0.15
0.20
0.25
1981 83 85 87 89 91 93 1995
Japan
0.00
0.05
0.10
0.15
0.20
0.25
1981 83 85 87 89 91 93 1995
US
0.00
0.05
0.10
0.15
0.20
0.25
1981 83 85 87 89 91 93 1995
Pre-tax ROICPre-tax cost of debt
Exhibit 27
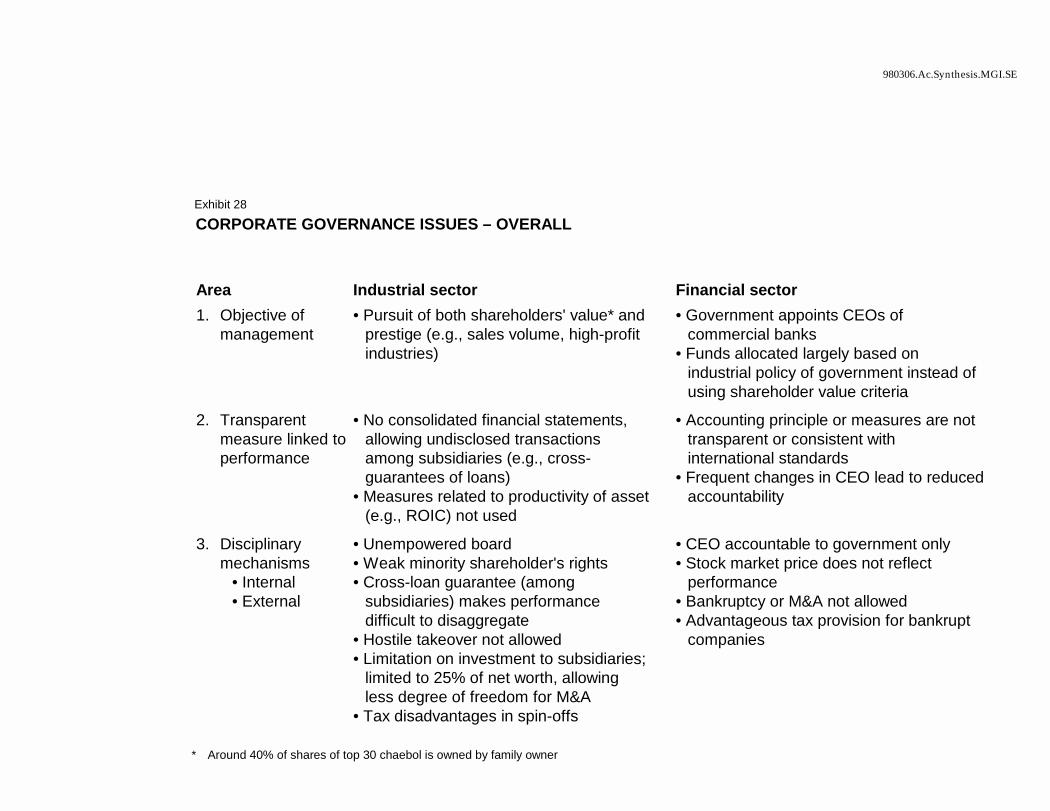
980306.Ac.Synthesis.MGI.SE
* Around 40% of shares of top 30 chaebol is owned by family owner
CORPORATE GOVERNANCE ISSUES – OVERALL
Area Industrial sector Financial sector1. Objective of
management• Pursuit of both shareholders' value* and
prestige (e.g., sales volume, high-profit industries)
• Government appoints CEOs of commercial banks
• Funds allocated largely based on industrial policy of government instead of using shareholder value criteria
2. Transparent measure linked to performance
• No consolidated financial statements, allowing undisclosed transactions among subsidiaries (e.g., cross-guarantees of loans)
• Measures related to productivity of asset (e.g., ROIC) not used
• Accounting principle or measures are not transparent or consistent with international standards
• Frequent changes in CEO lead to reduced accountability
3. Disciplinary mechanisms
• Internal• External
• Unempowered board• Weak minority shareholder's rights• Cross-loan guarantee (among
subsidiaries) makes performance difficult to disaggregate
• Hostile takeover not allowed• Limitation on investment to subsidiaries;
limited to 25% of net worth, allowing less degree of freedom for M&A
• Tax disadvantages in spin-offs
• CEO accountable to government only• Stock market price does not reflect
performance • Bankruptcy or M&A not allowed • Advantageous tax provision for bankrupt
companies
Exhibit 28
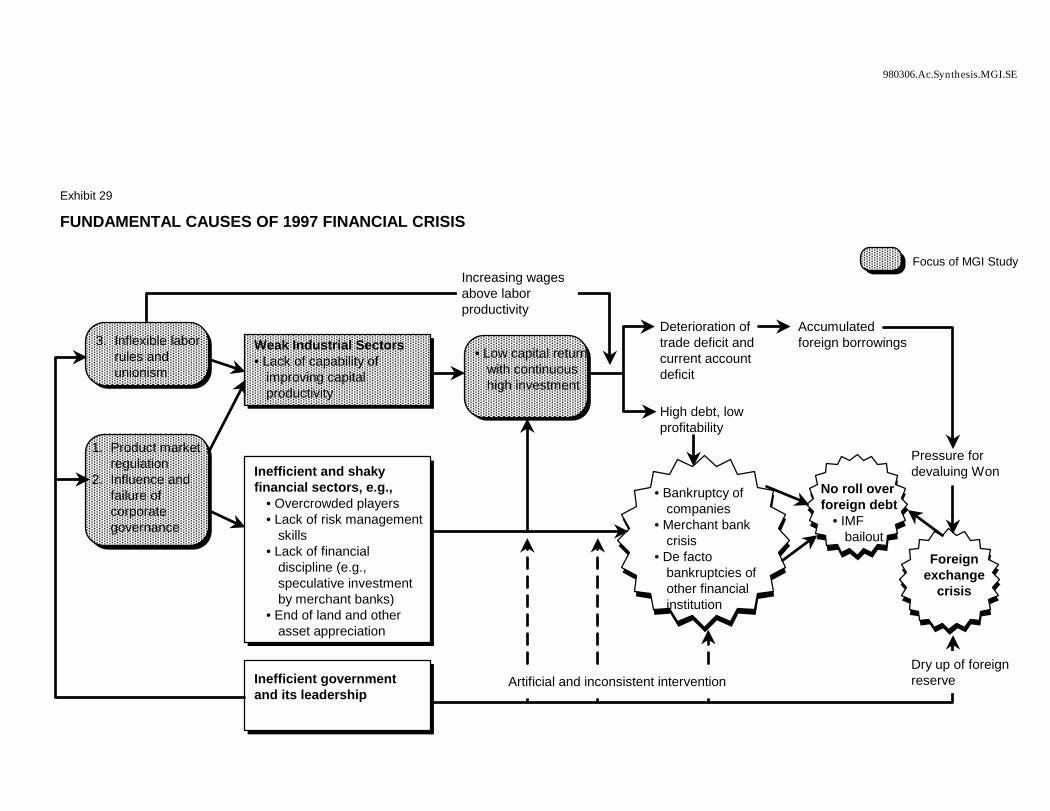
980306.Ac.Synthesis.MGI.SE
3. Inflexible labor rules and unionism
1. Product market regulation
2. Influence and failure of corporate governance
Weak Industrial Sectors• Lack of capability of
improving capital productivity
Inefficient and shaky financial sectors, e.g.,
• Overcrowded players• Lack of risk management
skills• Lack of financial
discipline (e.g., speculative investment by merchant banks)
• End of land and other asset appreciation
Inefficient government and its leadership
• Low capital return with continuous high investment
Increasing wages above labor productivity
Deterioration of trade deficit and current account deficit
High debt, low profitability
Accumulated foreign borrowings
• Bankruptcy of companies
• Merchant bank crisis
• De facto bankruptcies of other financial institution
No roll over foreign debt
• IMF bailout
Foreign exchange
crisis
Pressure for devaluing Won
Dry up of foreign reserveArtificial and inconsistent intervention
Focus of MGI Study
FUNDAMENTAL CAUSES OF 1997 FINANCIAL CRISISExhibit 29
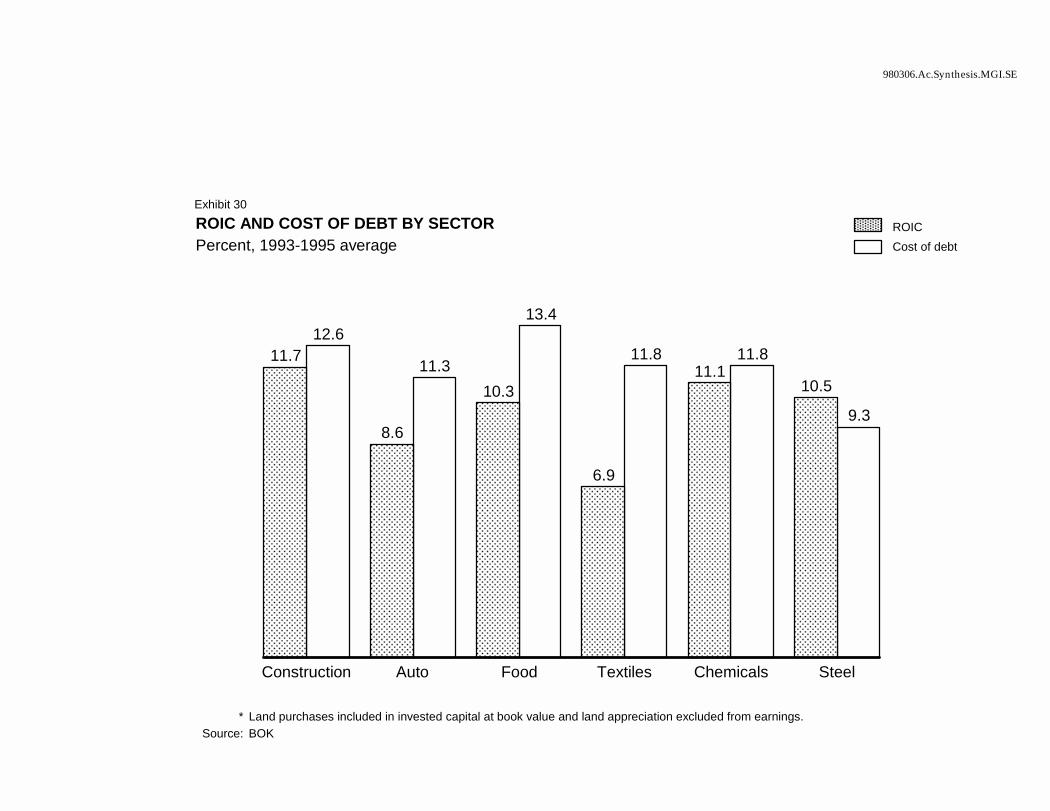
980306.Ac.Synthesis.MGI.SE
ROIC AND COST OF DEBT BY SECTORPercent, 1993-1995 average
* Land purchases included in invested capital at book value and land appreciation excluded from earnings.Source: BOK
12.6
11.3
13.4
11.8 11.8
9.3
11.7
8.6
10.3
6.9
11.110.5
Construction Auto Food Textiles Chemicals Steel
ROICCost of debt
Exhibit 30
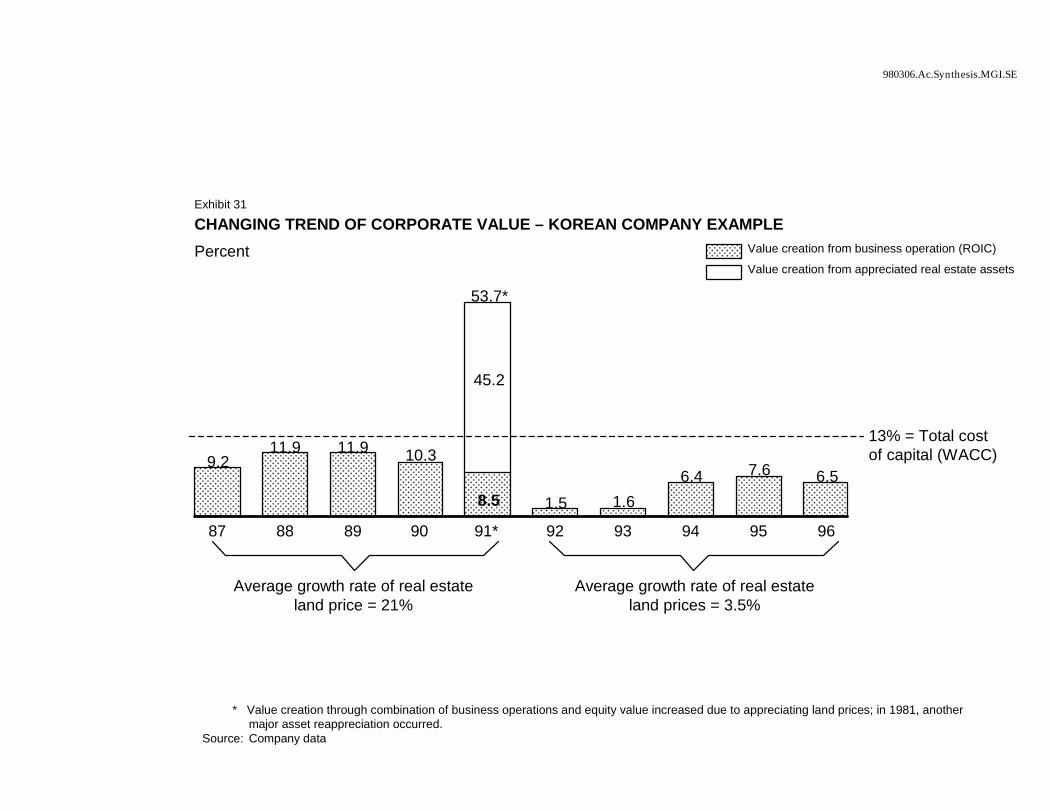
980306.Ac.Synthesis.MGI.SE
CHANGING TREND OF CORPORATE VALUE – KOREAN COMPANY EXAMPLEPercent Value creation from business operation (ROIC)
Value creation from appreciated real estate assets
9.211.9 11.9 10.3
8.5 1.5 1.66.4 7.6 6.5
87 88 89 90 91* 92 93 94 95 96
53.7*
45.2
13% = Total cost of capital (WACC)
Average growth rate of real estate land price = 21%
Average growth rate of real estate land prices = 3.5%
* Value creation through combination of business operations and equity value increased due to appreciating land prices; in 1981, another major asset reappreciation occurred.
Source: Company data
Exhibit 31
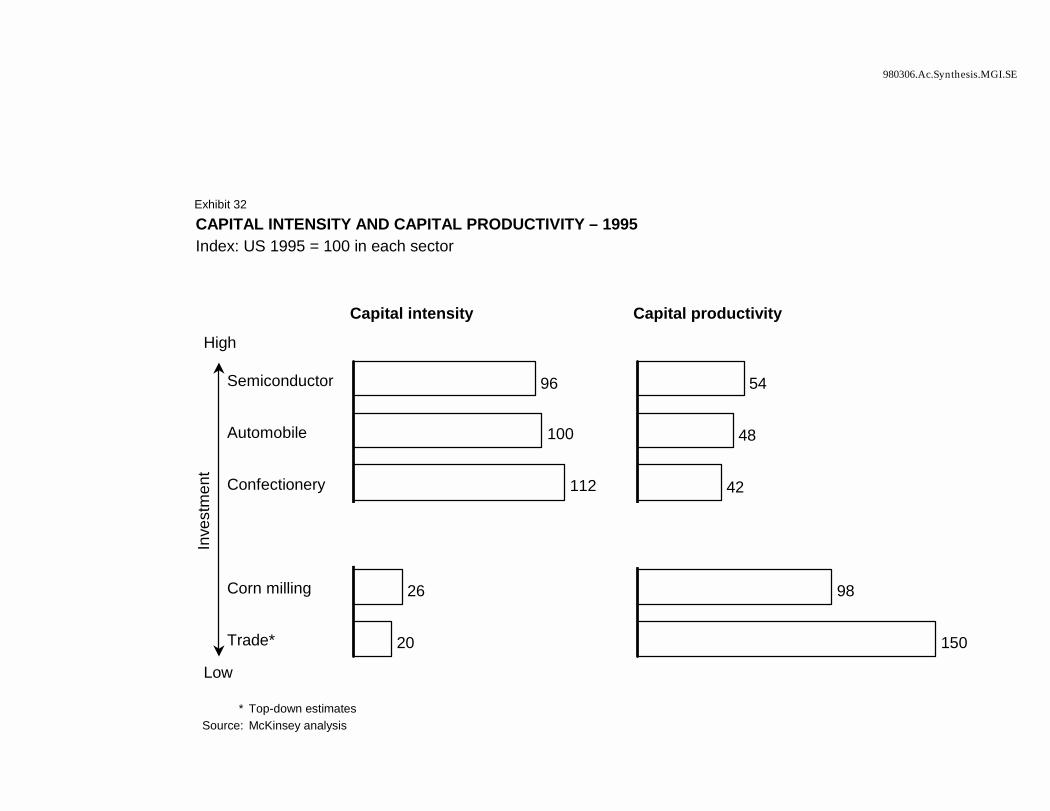
980306.Ac.Synthesis.MGI.SE
CAPITAL INTENSITY AND CAPITAL PRODUCTIVITY – 1995Index: US 1995 = 100 in each sector
* Top-down estimatesSource: McKinsey analysis
54
48
42
98
150
96
100
112
26
20
Semiconductor
Automobile
Confectionery
Corn milling
Trade*
Capital productivityCapital intensity
High
Low
Inve
stm
ent
Exhibit 32
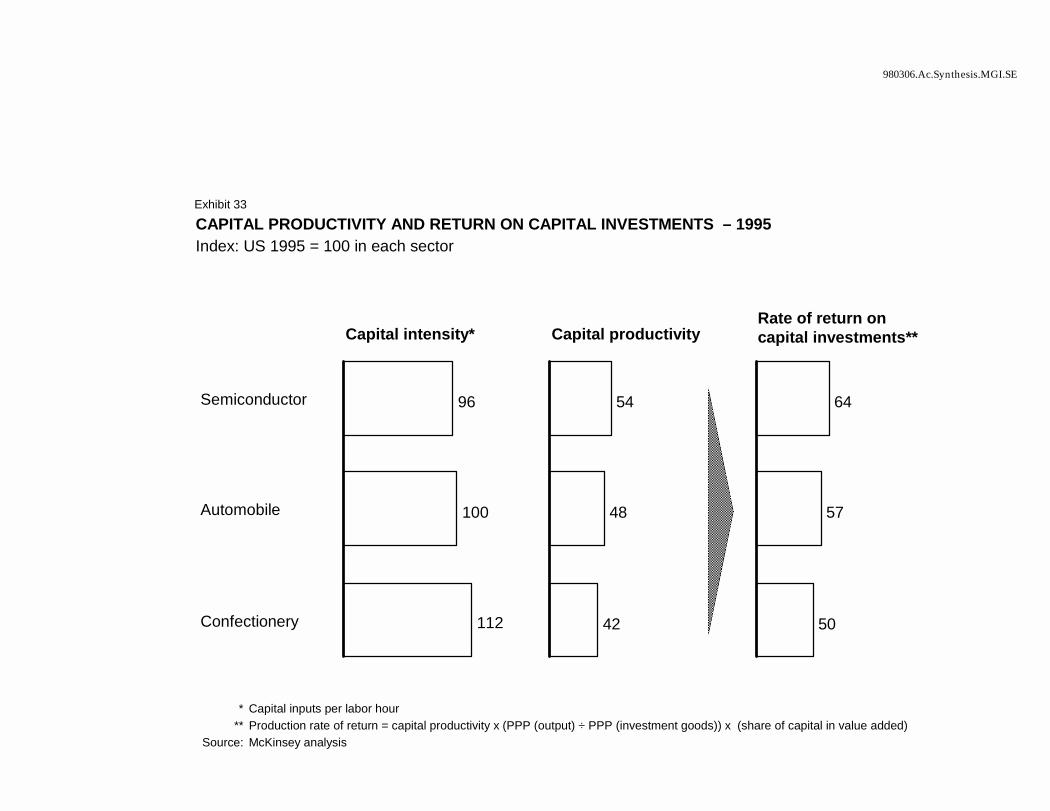
980306.Ac.Synthesis.MGI.SE
CAPITAL PRODUCTIVITY AND RETURN ON CAPITAL INVESTMENTS – 1995Index: US 1995 = 100 in each sector
* Capital inputs per labor hour** Production rate of return = capital productivity x (PPP (output) ÷ PPP (investment goods)) x (share of capital in value added)
Source: McKinsey analysis
Capital intensity*
96
100
112
Semiconductor
Automobile
Confectionery
Capital productivity
54
48
42
Rate of return on capital investments**
64
57
50
Exhibit 33
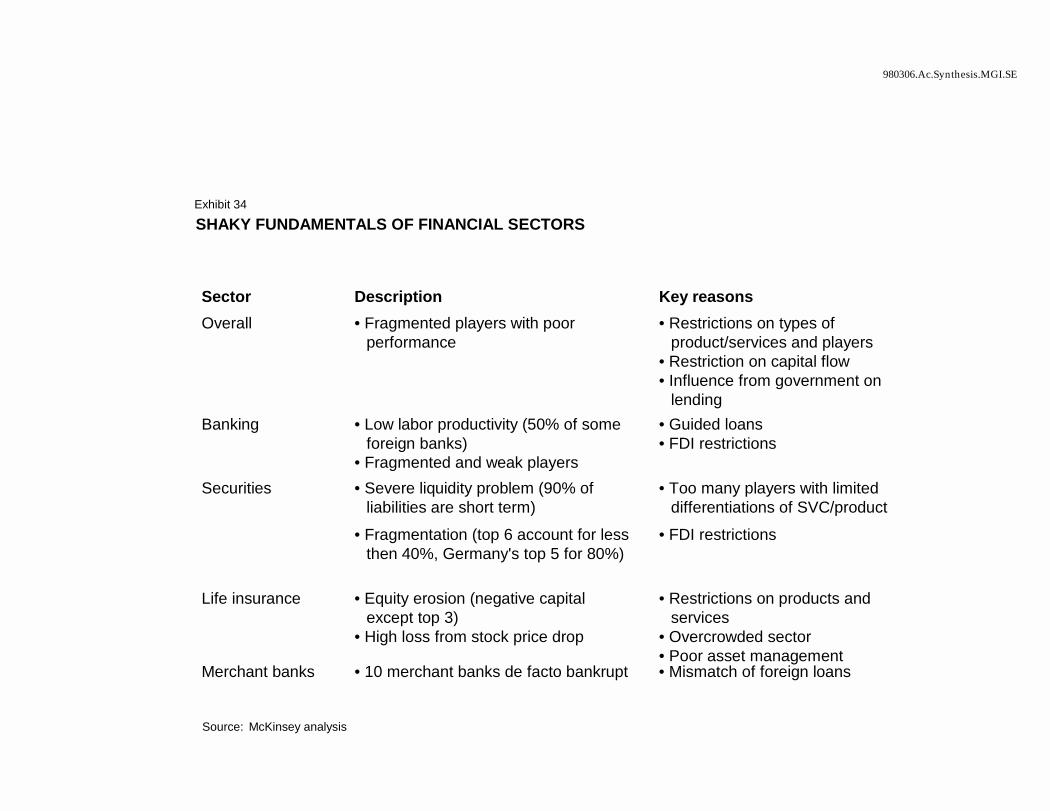
980306.Ac.Synthesis.MGI.SE
SHAKY FUNDAMENTALS OF FINANCIAL SECTORS
Source: McKinsey analysis
Sector Description Key reasonsOverall • Fragmented players with poor
performance• Restrictions on types of
product/services and players• Restriction on capital flow• Influence from government on
lendingBanking • Low labor productivity (50% of some
foreign banks)• Fragmented and weak players
• Guided loans• FDI restrictions
Securities • Severe liquidity problem (90% of liabilities are short term)
• Too many players with limiteddifferentiations of SVC/product
• Fragmentation (top 6 account for less then 40%, Germany's top 5 for 80%)
• FDI restrictions
Life insurance • Equity erosion (negative capital except top 3)
• High loss from stock price drop
• Restrictions on products and services
• Overcrowded sector• Poor asset management
Merchant banks • 10 merchant banks de facto bankrupt • Mismatch of foreign loans
Exhibit 34
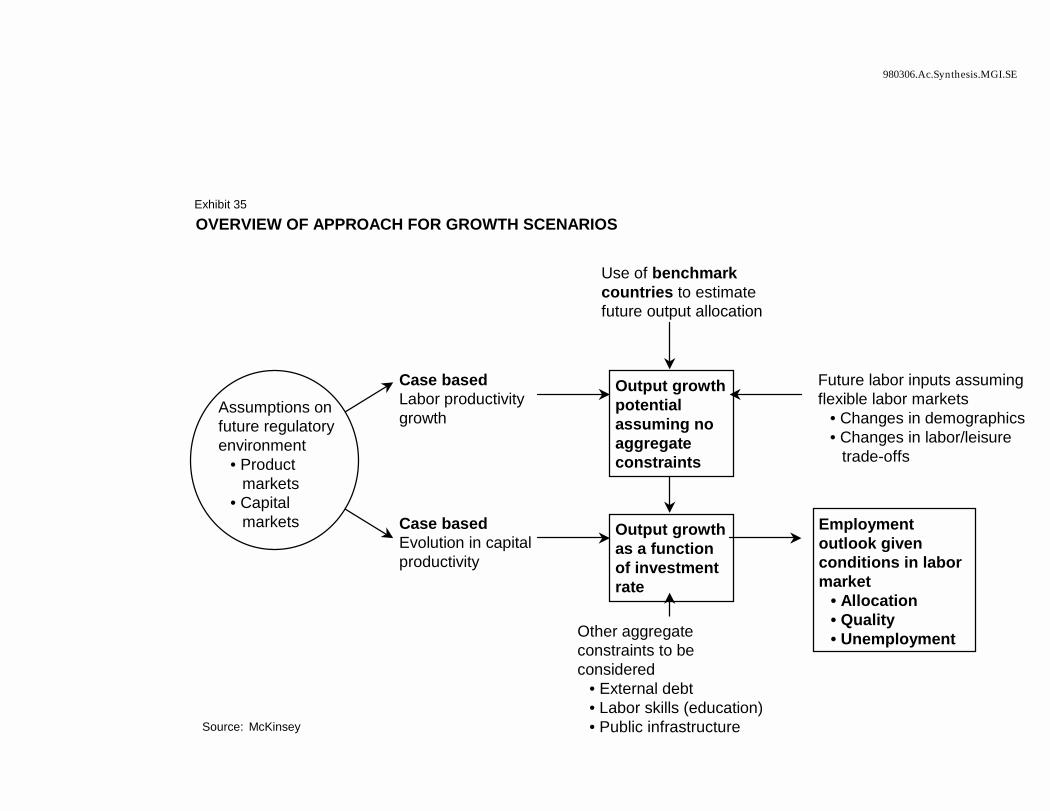
980306.Ac.Synthesis.MGI.SE
OVERVIEW OF APPROACH FOR GROWTH SCENARIOS
Assumptions on future regulatory environment
• Product markets
• Capital markets
Source: McKinsey
Future labor inputs assuming flexible labor markets
• Changes in demographics• Changes in labor/leisure
trade-offs
Case basedLabor productivity growth
Case basedEvolution in capital productivity
Employment outlook given conditions in labor market
• Allocation • Quality• Unemployment
Output growth as a function of investment rate
Output growth potential assuming no aggregate constraints
Use of benchmark countries to estimate future output allocation
Other aggregate constraints to be considered
• External debt• Labor skills (education)• Public infrastructure
Exhibit 35
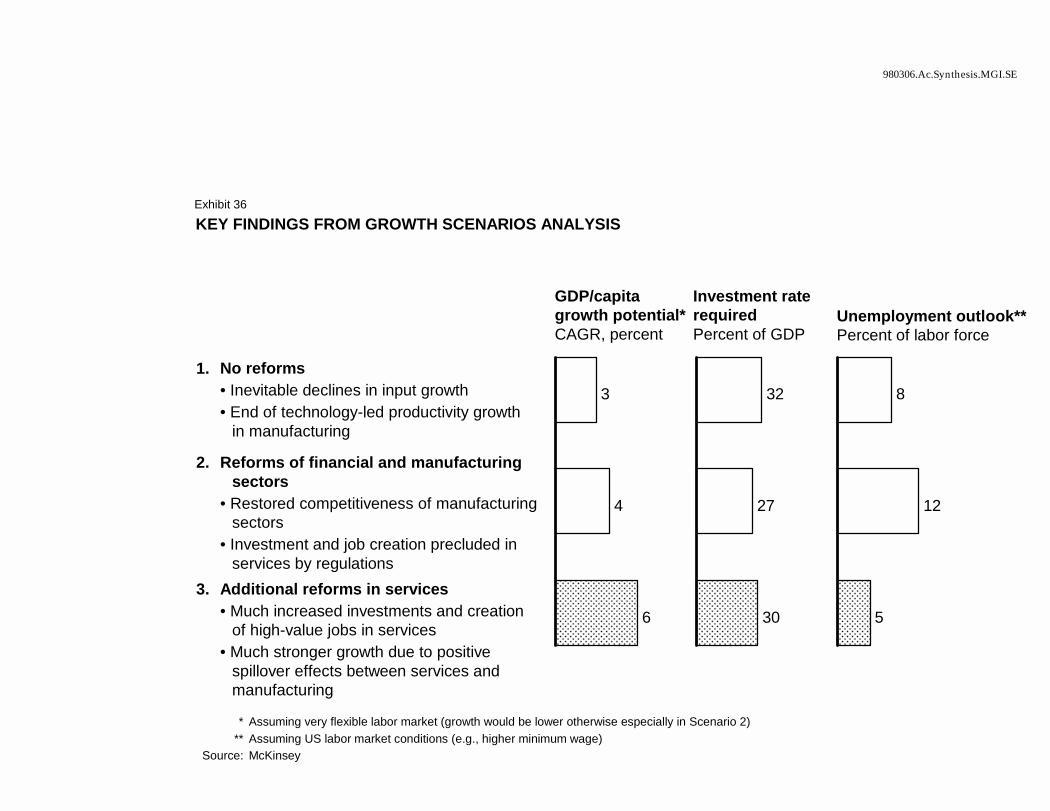
980306.Ac.Synthesis.MGI.SE
KEY FINDINGS FROM GROWTH SCENARIOS ANALYSIS
* Assuming very flexible labor market (growth would be lower otherwise especially in Scenario 2)** Assuming US labor market conditions (e.g., higher minimum wage)
Source: McKinsey
Additional reforms in services• Much increased investments and creation
of high-value jobs in services• Much stronger growth due to positive
spillover effects between services and manufacturing
Reforms of financial and manufacturing sectors
• Restored competitiveness of manufacturing sectors
• Investment and job creation precluded in services by regulations
No reforms• Inevitable declines in input growth• End of technology-led productivity growth
in manufacturing
3
4
6
32
27
30
8
12
5
GDP/capita growth potential*CAGR, percent
Investment rate requiredPercent of GDP
Unemployment outlook**Percent of labor force
3.
2.
1.
Exhibit 36
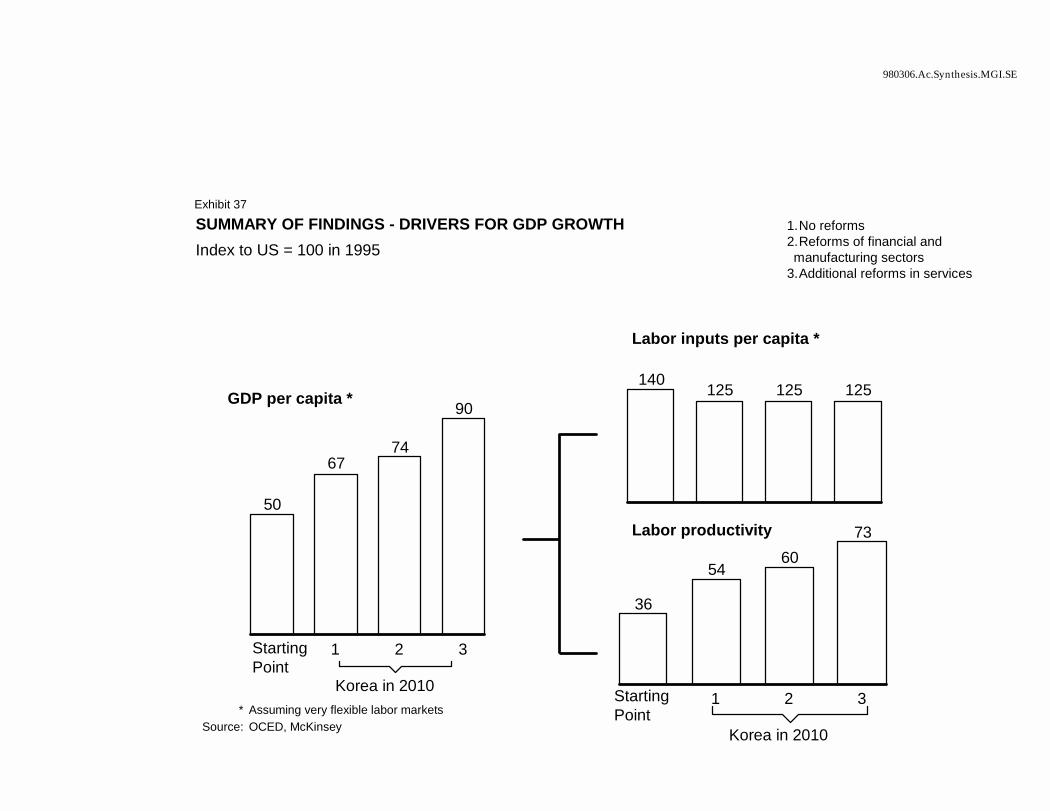
980306.Ac.Synthesis.MGI.SE
SUMMARY OF FINDINGS - DRIVERS FOR GDP GROWTHIndex to US = 100 in 1995
50
6774
90
Starting Point
1 2 3
140 125 125 125
36
5460
73
Starting Point
1 2 3* Assuming very flexible labor markets
Source: OCED, McKinsey
GDP per capita *
Labor inputs per capita *
Exhibit 37
Labor productivity
Korea in 2010
Korea in 2010
1.No reforms2.Reforms of financial and manufacturing sectors
3.Additional reforms in services
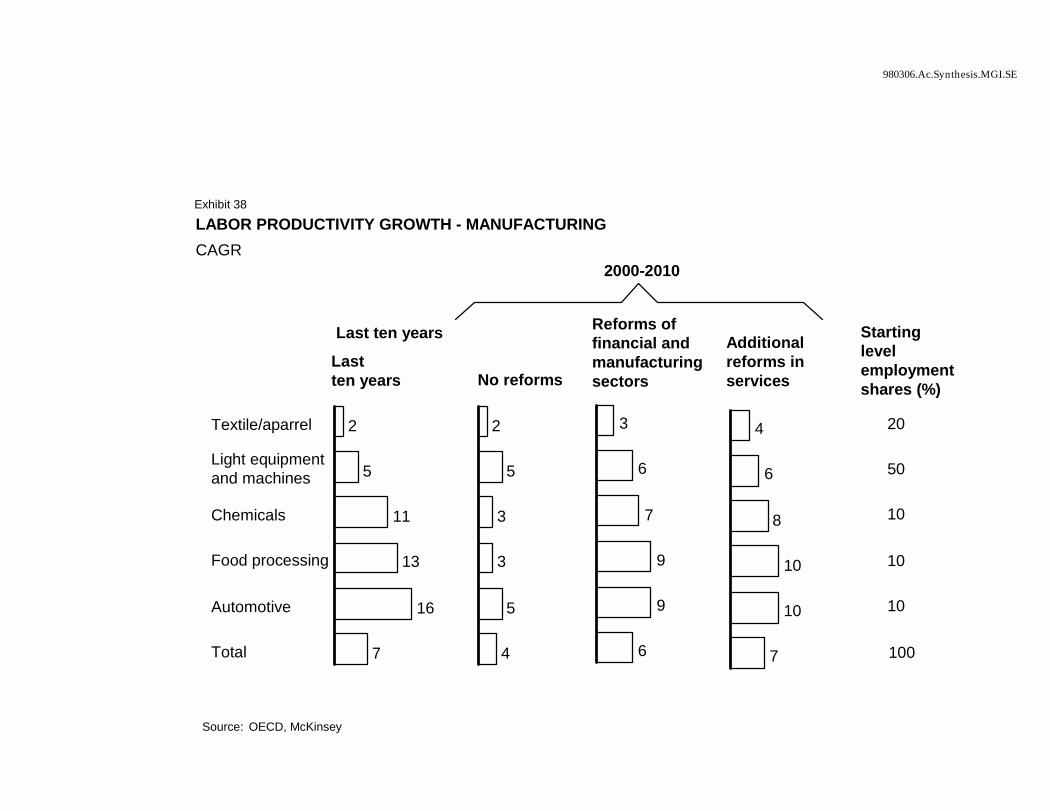
980306.Ac.Synthesis.MGI.SE
Last ten years
2
5
11
13
16
7
Textile/aparrel
Light equipment and machines
Chemicals
Food processing
Automotive
Total
2
5
3
3
5
4
4
6
8
10
10
7
Source: OECD, McKinsey
Last ten years No reforms
Reforms of financial and manufacturing sectors
Starting level employment shares (%)
LABOR PRODUCTIVITY GROWTH - MANUFACTURINGCAGR
Exhibit 38
20
50
10
10
10
100
3
6
7
9
9
6
Additional reforms in services
2000-2010
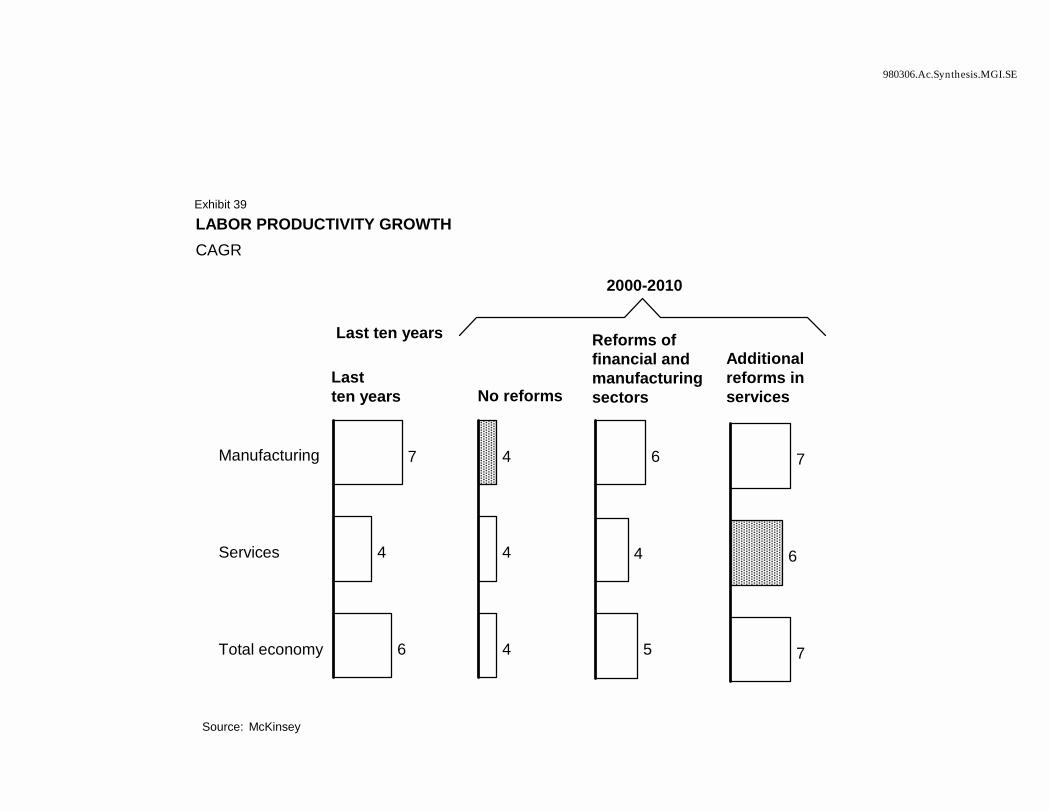
980306.Ac.Synthesis.MGI.SE
LABOR PRODUCTIVITY GROWTHCAGR
Source: McKinsey
Exhibit 39
Last ten years
7
4
6
Manufacturing
Services
Total economy
4
4
4
7
6
7
Last ten years No reforms
6
4
5
Additional reforms in services
Reforms of financial and manufacturing sectors
2000-2010
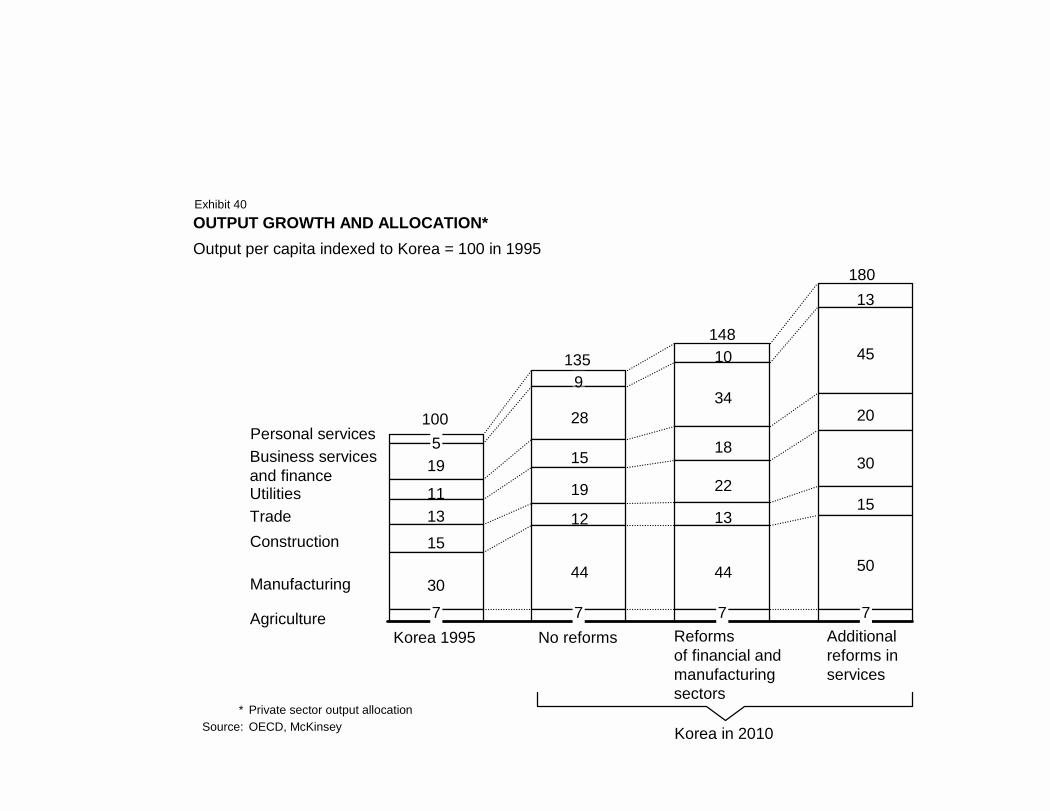
Personal services
10
13
Business services and finance 19
2834
45
Utilities 11
15 18
20
Trade 1319 22
30
Construction 1512 13
15
Manufacturing 3044 44 50
AgricultureKorea 1995 No reforms Reforms
of financial and manufacturing sectors
Additional reforms in services
* Private sector output allocationSource: OECD, McKinsey
OUTPUT GROWTH AND ALLOCATION*Output per capita indexed to Korea = 100 in 1995
Korea in 2010
100
135148
180
Exhibit 40
5
9
7 7 7 7
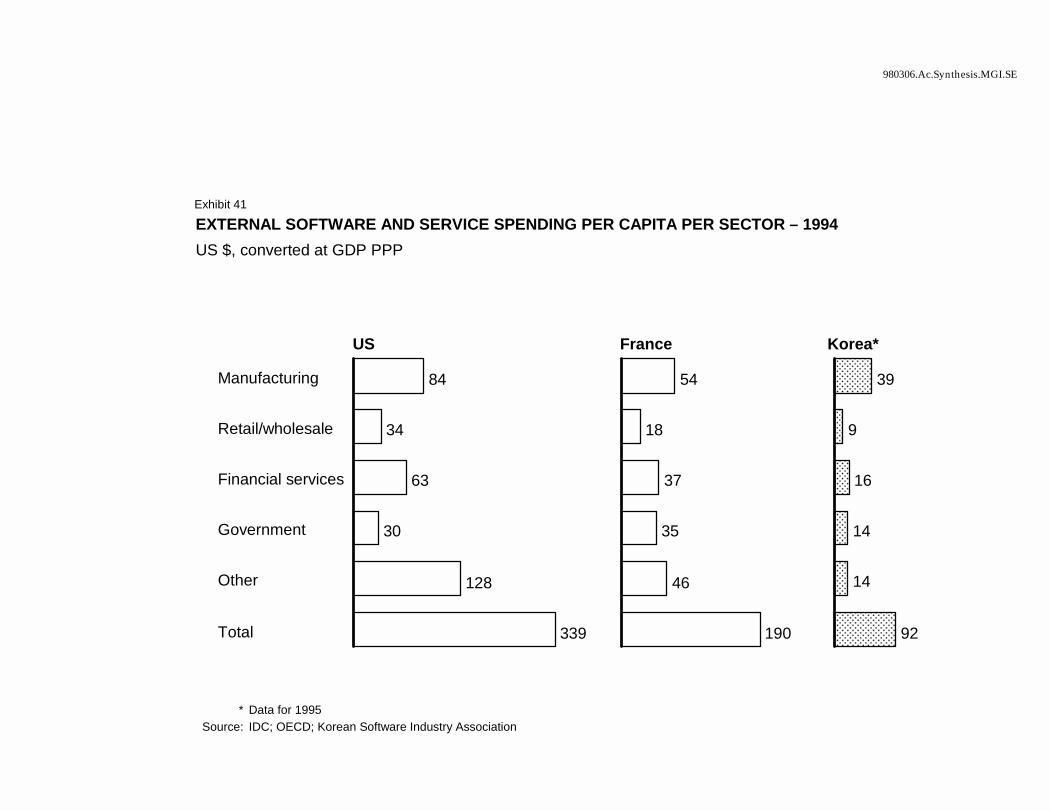
980306.Ac.Synthesis.MGI.SE
EXTERNAL SOFTWARE AND SERVICE SPENDING PER CAPITA PER SECTOR – 1994US $, converted at GDP PPP
* Data for 1995Source: IDC; OECD; Korean Software Industry Association
84
34
63
30
128
339
Manufacturing
Retail/wholesale
Financial services
Government
Other
Total
54
18
37
35
46
190
39
9
16
14
14
92
US France Korea*
Exhibit 41
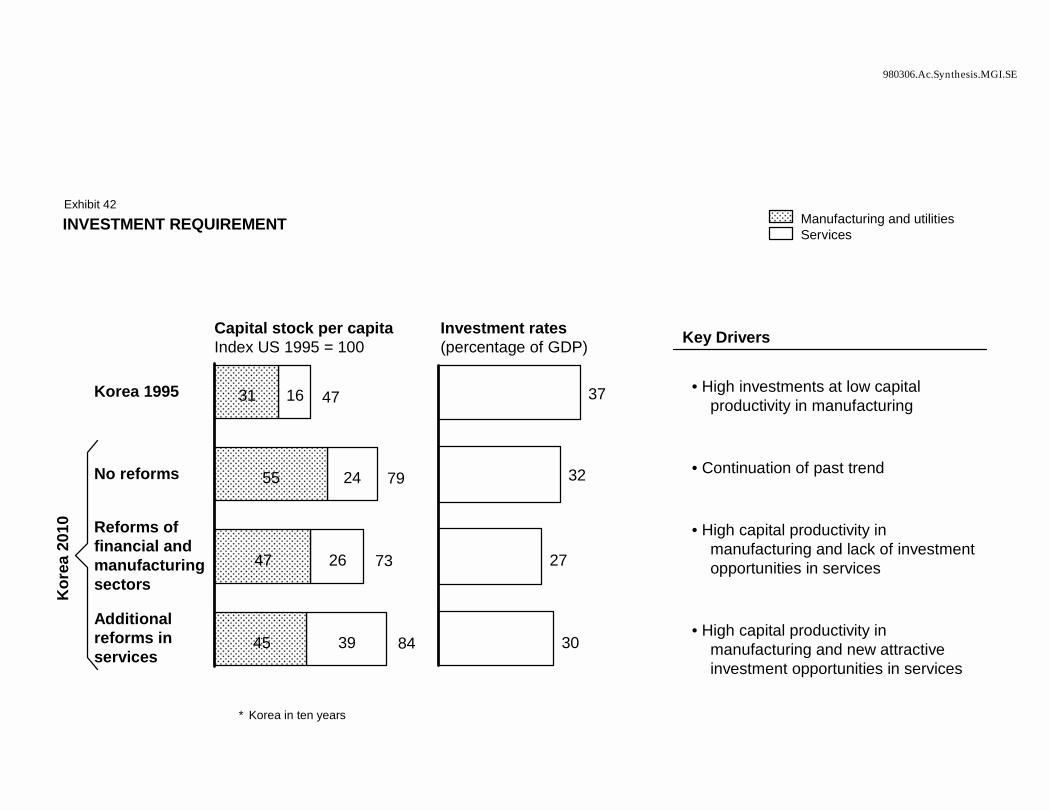
980306.Ac.Synthesis.MGI.SE
INVESTMENT REQUIREMENT Exhibit 42
16
24
26
39
31
55
47
45
Korea 1995
No reforms
Reforms offinancial and manufacturing sectors
Additional reforms in services
37
32
27
30
• High investments at low capital productivity in manufacturing
• Continuation of past trend
• High capital productivity in manufacturing and lack of investment opportunities in services
• High capital productivity in manufacturing and new attractive investment opportunities in services
Key Drivers
Manufacturing and utilitiesServices
Capital stock per capitaIndex US 1995 = 100
Investment rates(percentage of GDP)
47
79
73
84
* Korea in ten years
Kor
ea 2
010
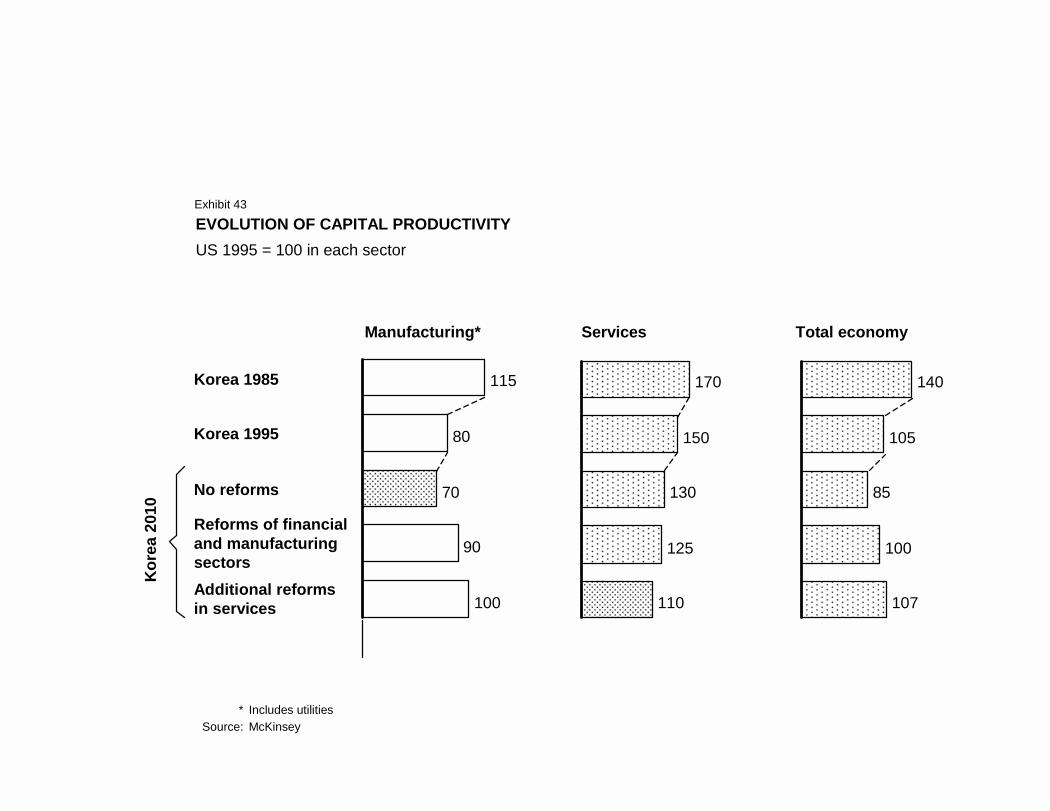
EVOLUTION OF CAPITAL PRODUCTIVITY US 1995 = 100 in each sector
115
80
70
90
100
Korea 1985
Korea 1995
No reforms
Reforms of financial and manufacturing sectorsAdditional reforms in services
170
150
130
125
110
140
105
85
100
107
* Includes utilitiesSource: McKinsey
Manufacturing* Services Total economy
Exhibit 43
Kor
ea 2
010
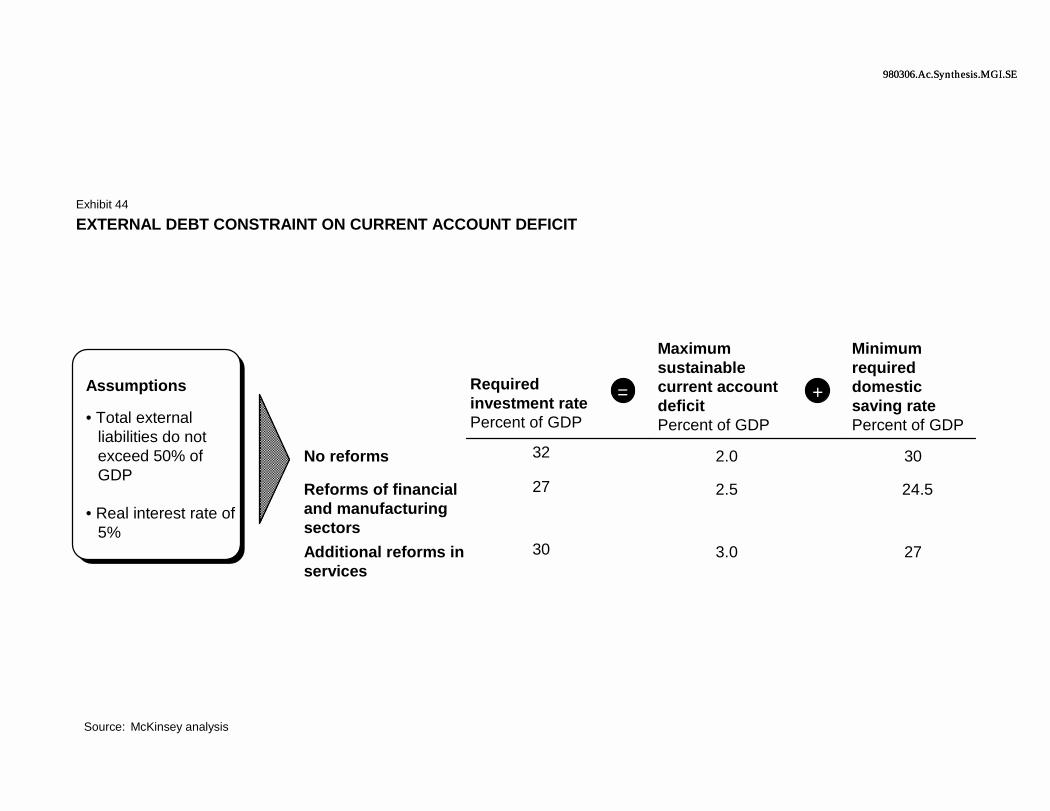
980306.Ac.Synthesis.MGI.SE980306.Ac.Synthesis.MGI.SE
Required investment ratePercent of GDP
Maximum sustainable current account deficitPercent of GDP
Minimum required domestic saving ratePercent of GDP
No reforms 32 2.0 30
Reforms of financial and manufacturing sectors
27 2.5 24.5
Additional reforms in services
30 3.0 27
Assumptions
• Total external liabilities do not exceed 50% of GDP
• Real interest rate of 5%
EXTERNAL DEBT CONSTRAINT ON CURRENT ACCOUNT DEFICIT
Source: McKinsey analysis
Exhibit 44
= +
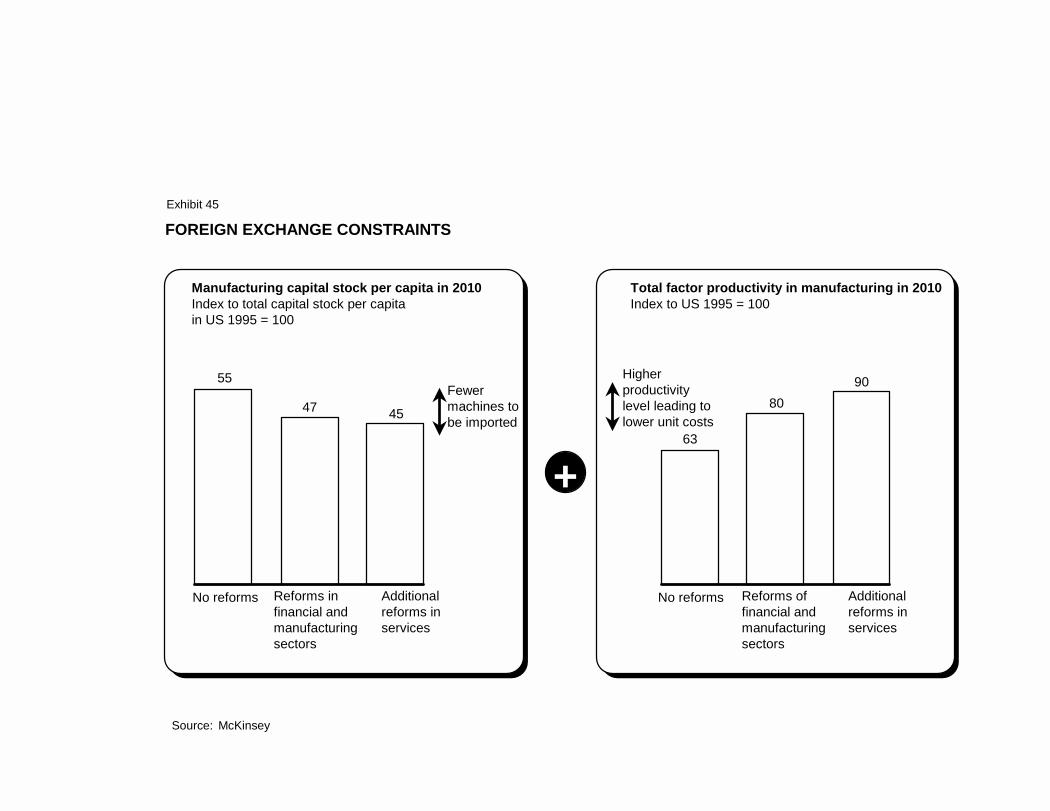
FOREIGN EXCHANGE CONSTRAINTS
55
47 45
No reforms Reforms in financial and manufacturing sectors
Additional reforms in services
Source: McKinsey
63
8090
No reforms Reforms of financial and manufacturing sectors
Additional reforms in services
Manufacturing capital stock per capita in 2010Index to total capital stock per capita in US 1995 = 100
Total factor productivity in manufacturing in 2010Index to US 1995 = 100
Fewer machines to be imported
Higher productivity level leading to lower unit costs
Exhibit 45
+
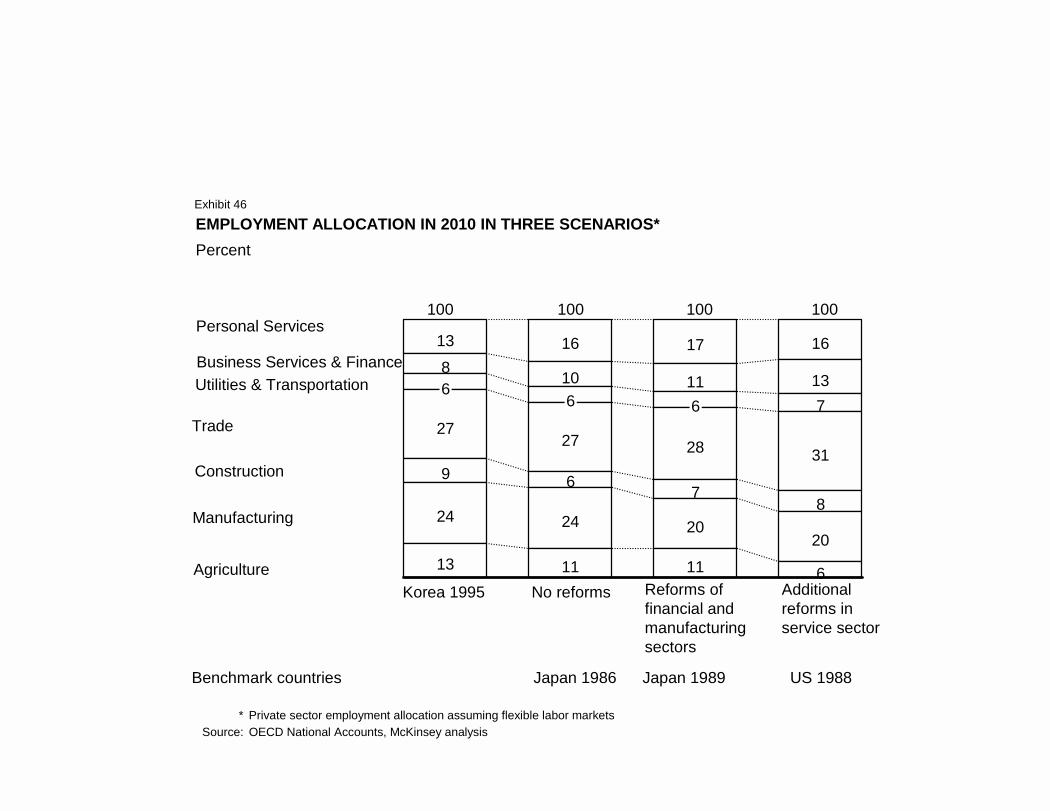
EMPLOYMENT ALLOCATION IN 2010 IN THREE SCENARIOS*Percent
Personal Services13 16 17 16
Business Services & Finance 8 10 11 13Utilities & Transportation7
Trade 2727 28 31
Construction 9 6 78
Manufacturing 24 24 2020
Agriculture 13 11 11 6Korea 1995 No reforms Reforms of
financial and manufacturing sectors
Additional reforms in service sector
* Private sector employment allocation assuming flexible labor marketsSource: OECD National Accounts, McKinsey analysis
100 100 100 100
Benchmark countries Japan 1986 Japan 1989 US 1988
Exhibit 46
66 6
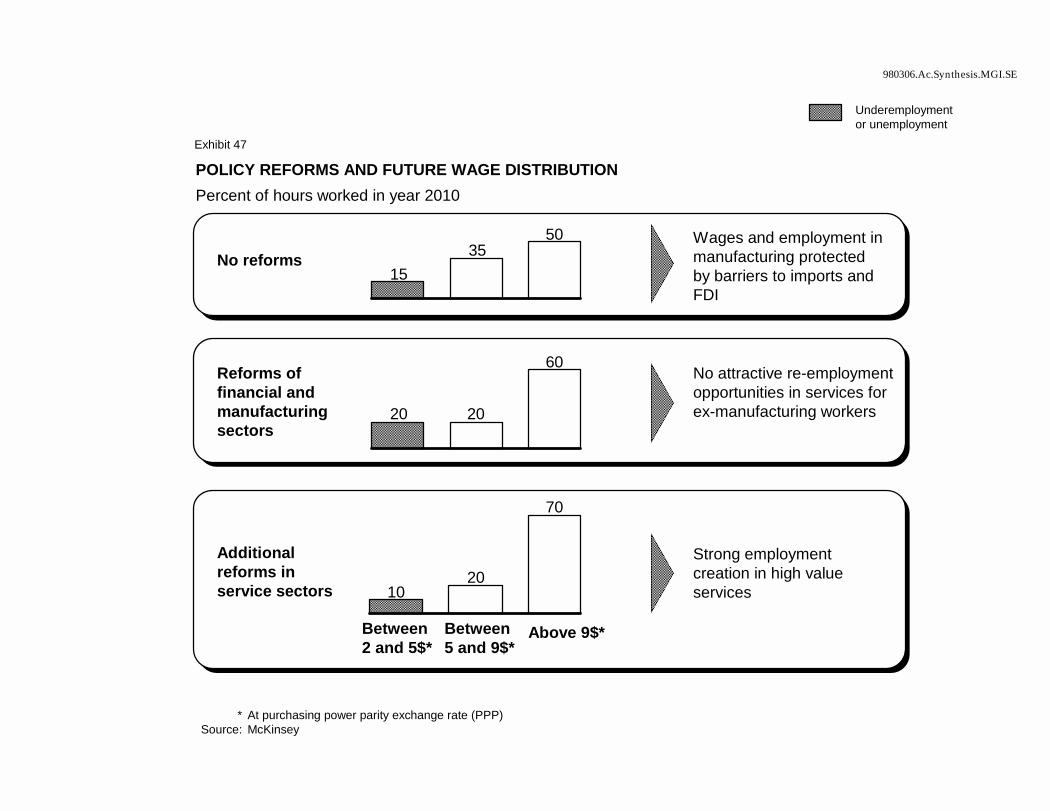
980306.Ac.Synthesis.MGI.SE
POLICY REFORMS AND FUTURE WAGE DISTRIBUTIONPercent of hours worked in year 2010
* At purchasing power parity exchange rate (PPP)Source: McKinsey
No reforms
Reforms of financial and manufacturing sectors
Additional reforms in service sectors
Underemployment or unemployment
Wages and employment in manufacturing protected by barriers to imports and FDI
No attractive re-employment opportunities in services for ex-manufacturing workers
Strong employment creation in high value services
1535
50
20 20
60
1020
70
Between 2 and 5$*
Between5 and 9$*
Above 9$*
Exhibit 47
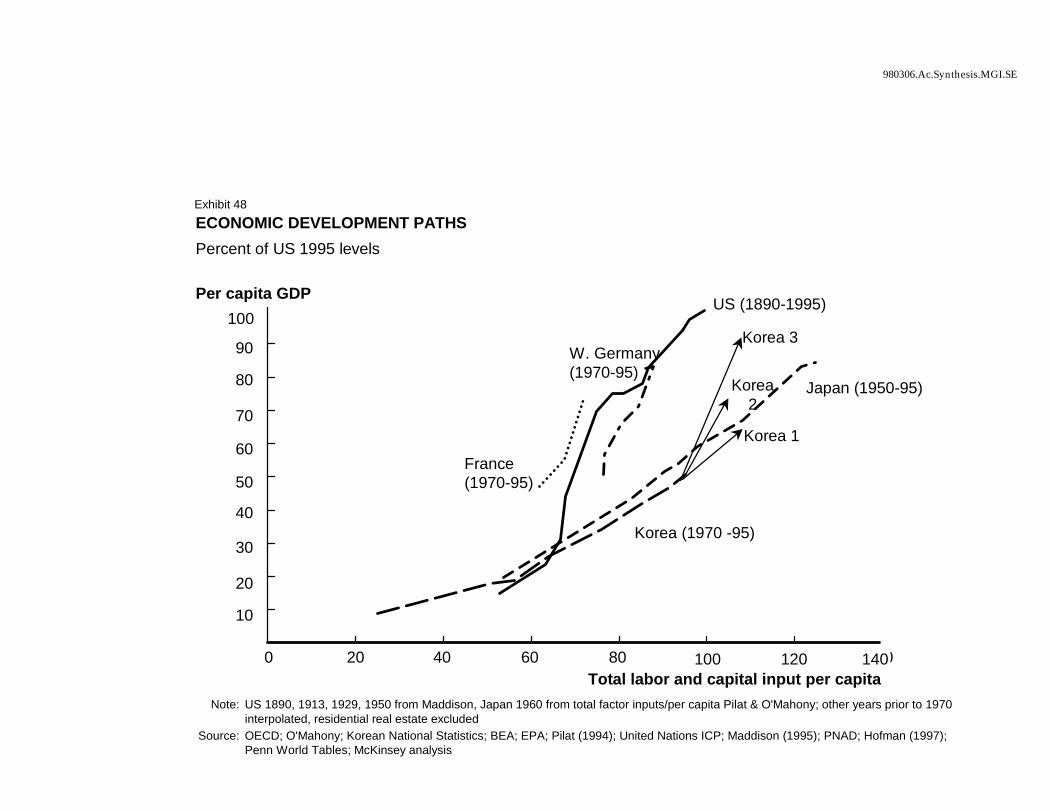
980306.Ac.Synthesis.MGI.SE
0 20 40 60 80 100 120 140
W. Germany (1970-95)
ECONOMIC DEVELOPMENT PATHSPercent of US 1995 levels
Per capita GDP
France(1970-95)
Korea (1970 -95)
US (1890-1995)
Japan (1950-95)
100 120 140
100
90
80
70
60
50
40
30
20
10
Total labor and capital input per capitaNote: US 1890, 1913, 1929, 1950 from Maddison, Japan 1960 from total factor inputs/per capita Pilat & O'Mahony; other years prior to 1970
interpolated, residential real estate excludedSource: OECD; O'Mahony; Korean National Statistics; BEA; EPA; Pilat (1994); United Nations ICP; Maddison (1995); PNAD; Hofman (1997);
Penn World Tables; McKinsey analysis
Exhibit 48
Korea 3
Korea2
Korea 1
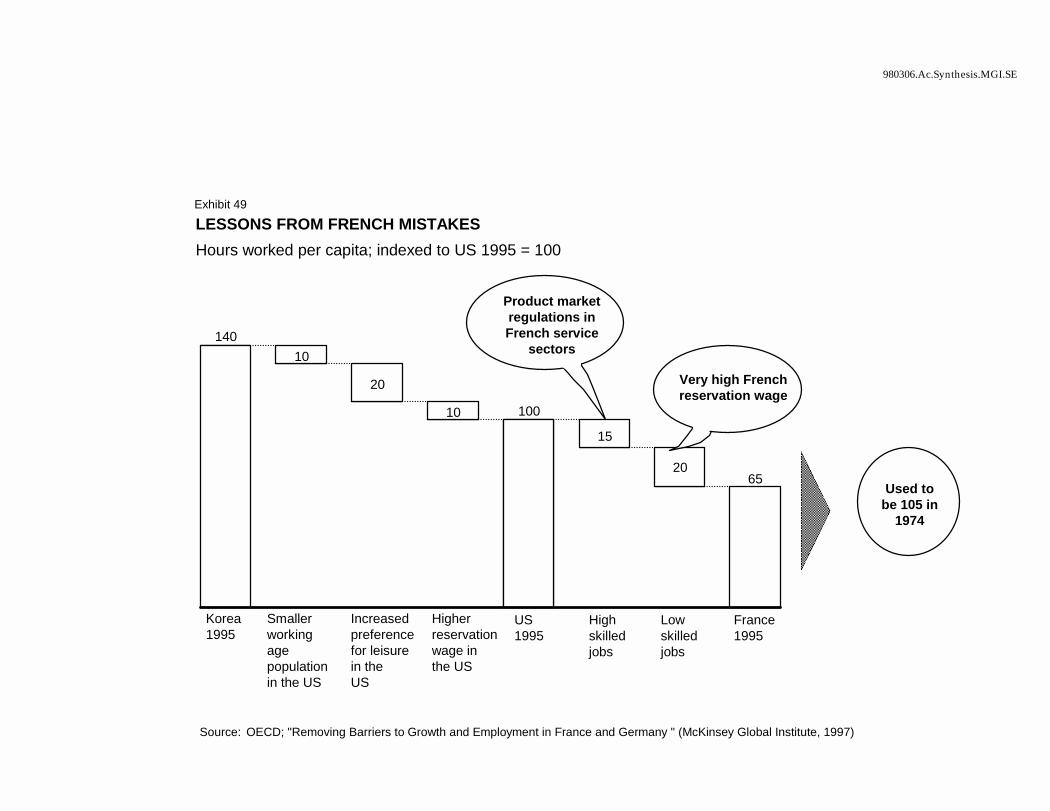
980306.Ac.Synthesis.MGI.SE
14010
20
10 100
15
20
65
Korea 1995
Smaller working age populationin the US
Increasedpreferencefor leisurein theUS
Higher reservation wage in the US
US1995
High skilledjobs
Low skilledjobs
France1995
Very high French reservation wage
LESSONS FROM FRENCH MISTAKES Hours worked per capita; indexed to US 1995 = 100
Source: OECD; "Removing Barriers to Growth and Employment in France and Germany " (McKinsey Global Institute, 1997)
Used to be 105 in
1974
Product market regulations in French service
sectors
20
Exhibit 49
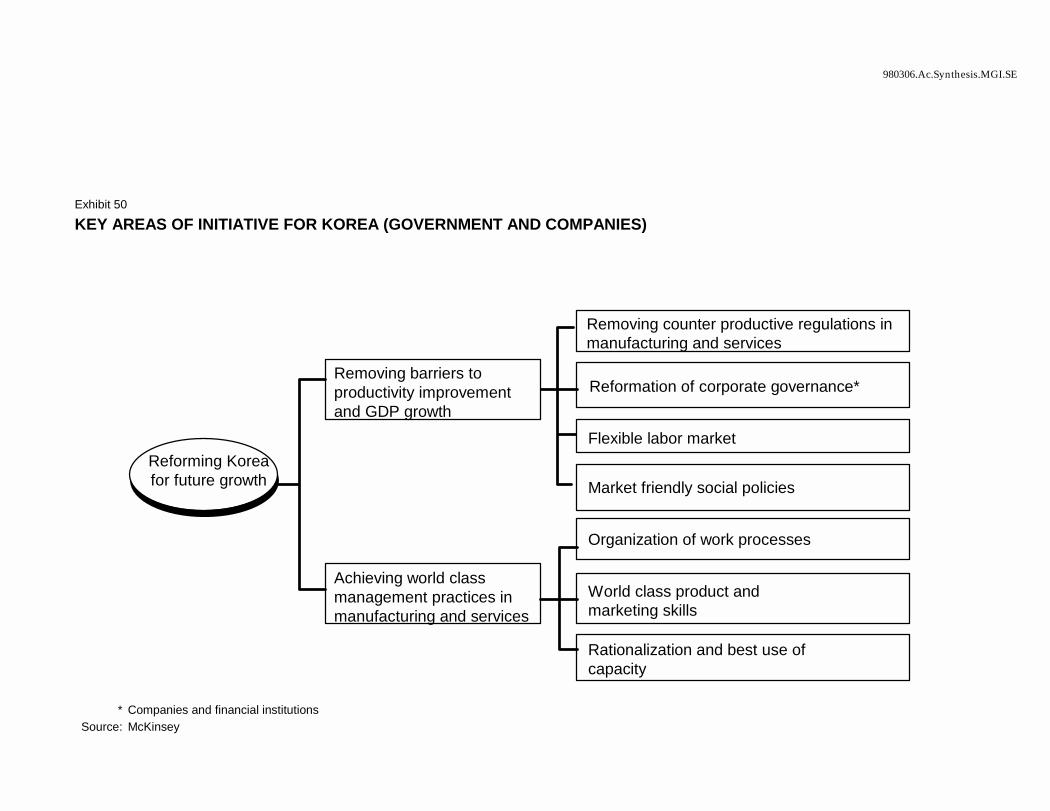
980306.Ac.Synthesis.MGI.SE
KEY AREAS OF INITIATIVE FOR KOREA (GOVERNMENT AND COMPANIES)
* Companies and financial institutionsSource: McKinsey
Reforming Korea for future growth
Removing barriers to productivity improvement and GDP growth
Removing counter productive regulations in manufacturing and services
Reformation of corporate governance*
Flexible labor market
Market friendly social policies
Organization of work processes
World class product and marketing skills
Rationalization and best use of capacity
Achieving world class management practices in manufacturing and services
Exhibit 50
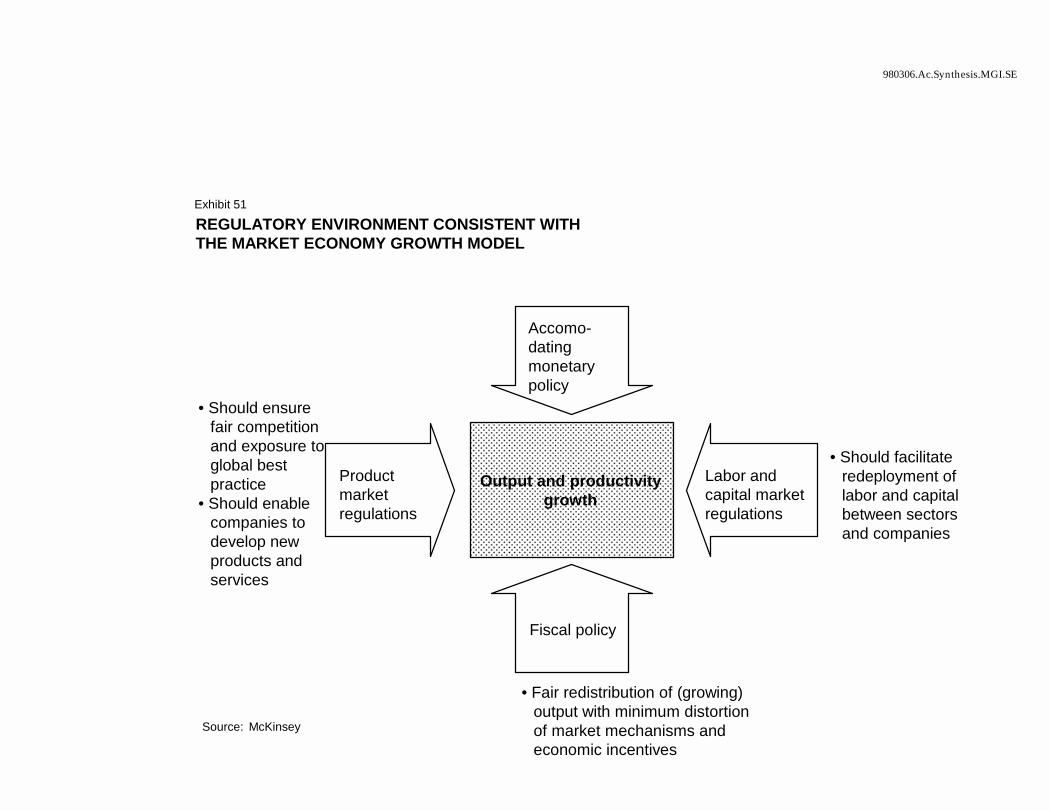
980306.Ac.Synthesis.MGI.SE
REGULATORY ENVIRONMENT CONSISTENT WITHTHE MARKET ECONOMY GROWTH MODEL
Source: McKinsey
Accomo-dating monetary policy
Labor and capital market regulations
Fiscal policy
Product market regulations
Output and productivity growth
• Should facilitate redeployment of labor and capital between sectors and companies
• Fair redistribution of (growing) output with minimum distortion of market mechanisms and economic incentives
• Should ensure fair competition and exposure to global best practice
• Should enable companies to develop new products and services
Exhibit 51
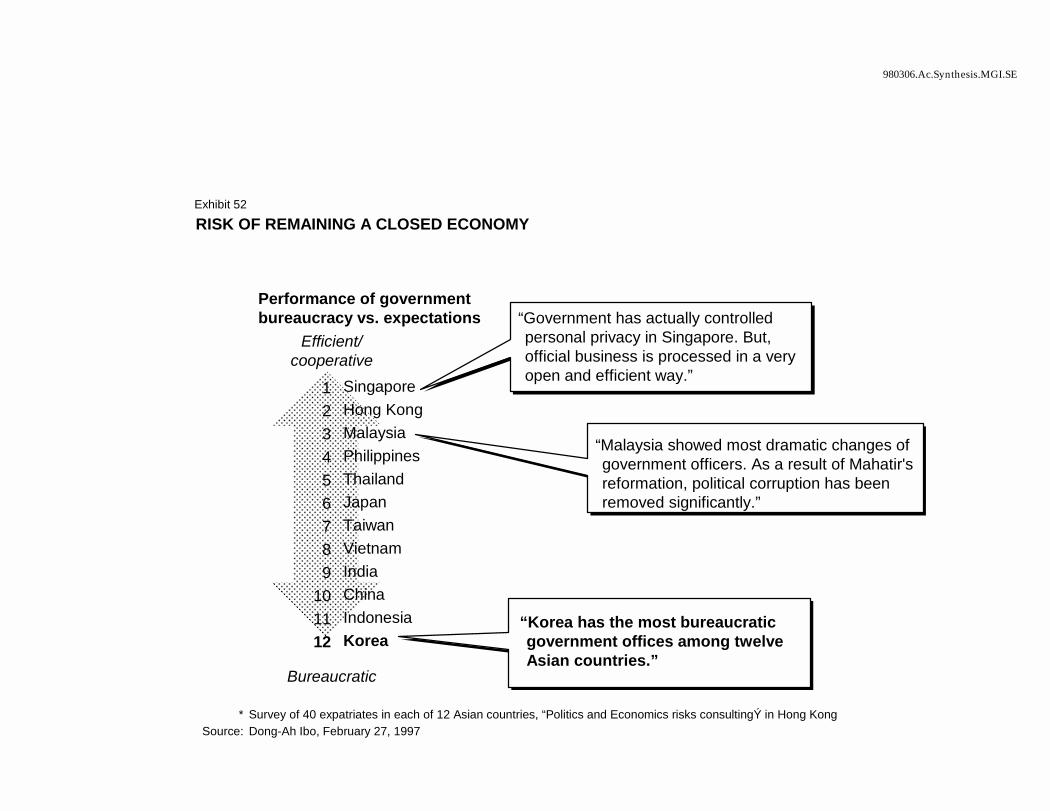
980306.Ac.Synthesis.MGI.SE
RISK OF REMAINING A CLOSED ECONOMY
* Survey of 40 expatriates in each of 12 Asian countries, “Politics and Economics risks consultingÝ in Hong KongSource: Dong-Ah Ibo, February 27, 1997
Performance of government bureaucracy vs. expectations
Efficient/cooperative
Bureaucratic
“Government has actually controlled personal privacy in Singapore. But, official business is processed in a very open and efficient way.”
“Korea has the most bureaucratic government offices among twelve Asian countries.”
“Malaysia showed most dramatic changes of government officers. As a result of Mahatir'sreformation, political corruption has been removed significantly.”
Exhibit 52
SingaporeHong KongMalaysiaPhilippinesThailandJapanTaiwanVietnamIndiaChinaIndonesiaKorea
123456789
101112
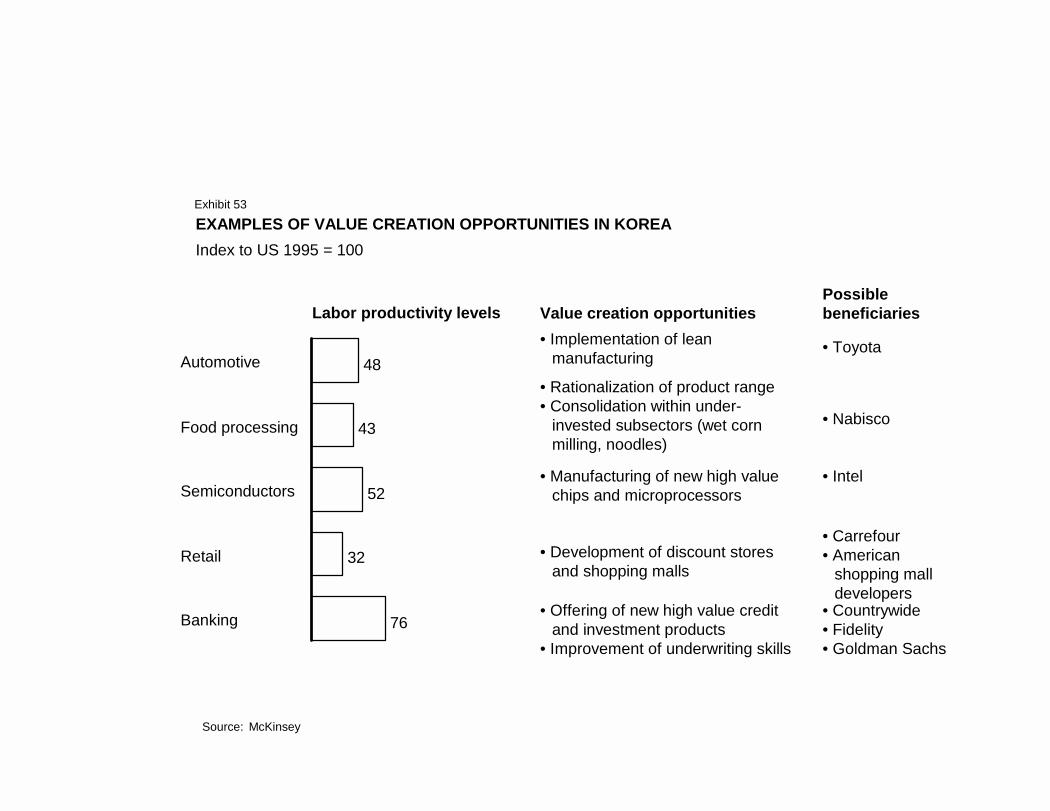
EXAMPLES OF VALUE CREATION OPPORTUNITIES IN KOREA Index to US 1995 = 100
Labor productivity levels
48
43
52
32
76
Automotive
Food processing
Semiconductors
Retail
Banking
Source: McKinsey
Value creation opportunitiesPossible beneficiaries
• Implementation of lean manufacturing
• Toyota
• Rationalization of product range• Consolidation within under-
invested subsectors (wet corn milling, noodles)
• Nabisco
• Manufacturing of new high value chips and microprocessors
• Intel
• Development of discount stores and shopping malls
• Carrefour• American
shopping mall developers
• Offering of new high value credit and investment products
• Improvement of underwriting skills
• Countrywide• Fidelity• Goldman Sachs
Exhibit 53
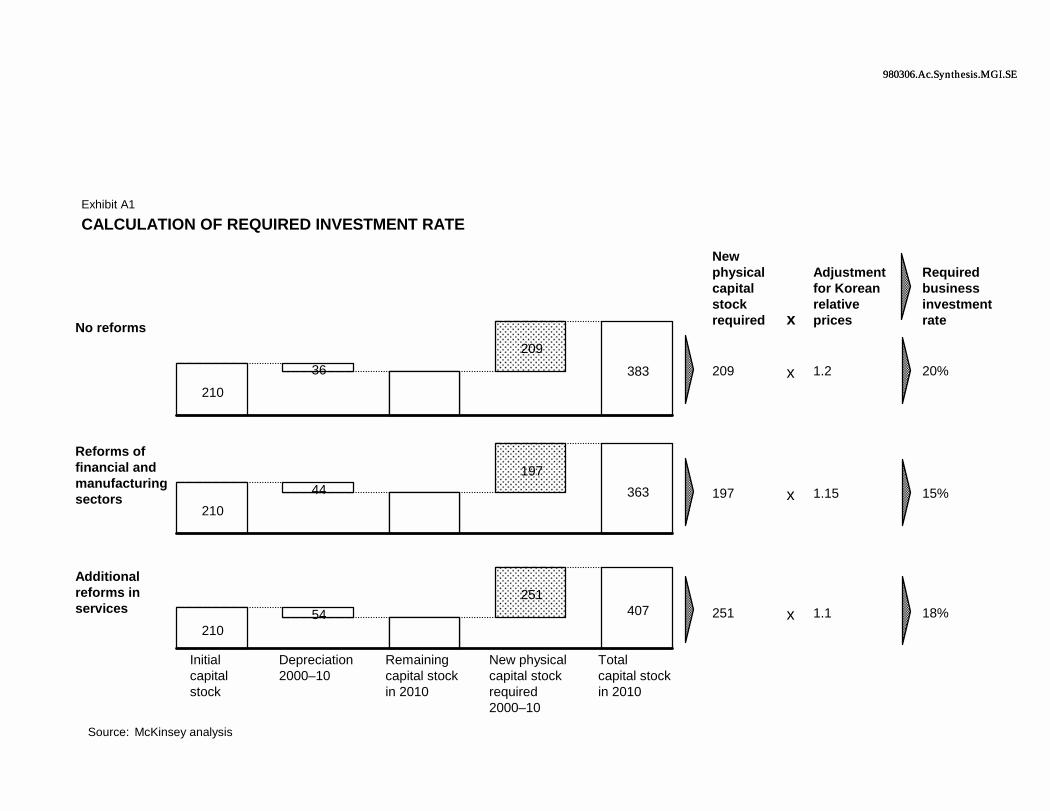
980306.Ac.Synthesis.MGI.SE980306.Ac.Synthesis.MGI.SE
CALCULATION OF REQUIRED INVESTMENT RATE
Source: McKinsey analysis
Exhibit A1
17421036
209
383
16621044
197363
15621054
251407
Initial capital stock
Depreciation 2000–10
Remaining capital stock in 2010
New physical capital stock required 2000–10
Total capital stock in 2010
No reforms
Reforms of financial and manufacturing sectors
Additional reforms in services
New physical capital stock required x
Adjustment for Korean relative prices
Required business investment rate
209 x 1.2 20%
197 x 1.15 15%
251 x 1.1 18%
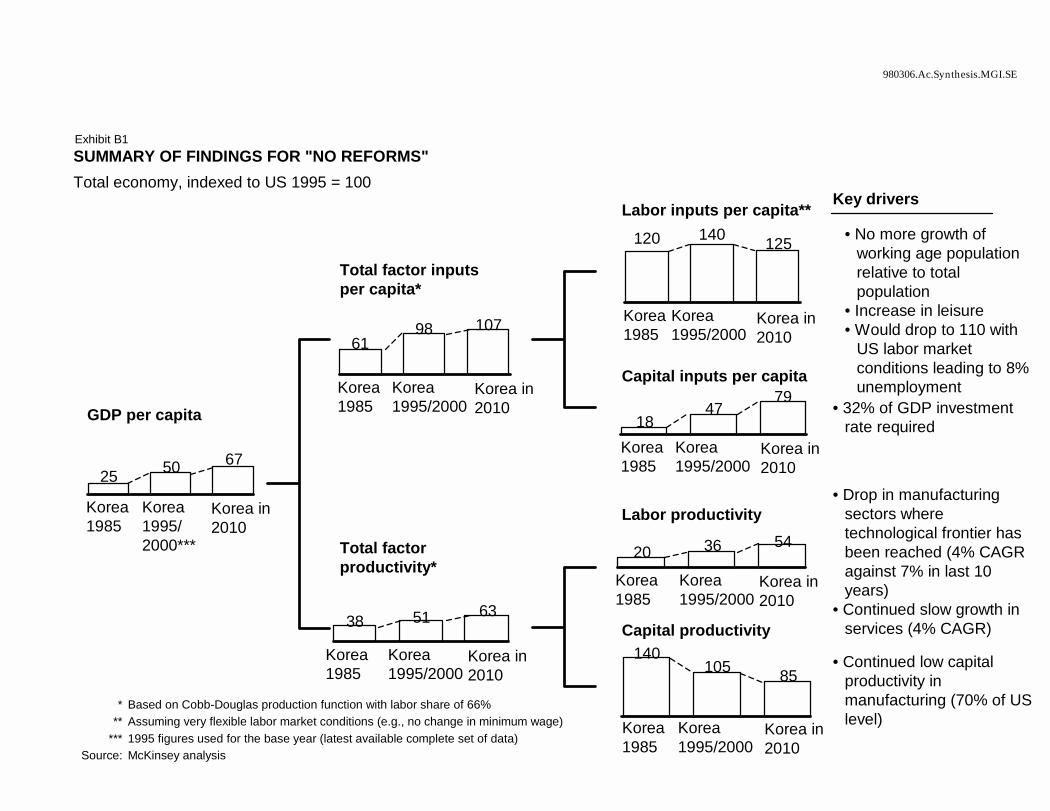
980306.Ac.Synthesis.MGI.SE
6198 107
Korea 1985
Korea 1995/2000
Korea in 2010
25 50 67
Korea 1985
Korea 1995/2000***
Korea in 2010
38 51 63
Korea 1985
Korea 1995/2000
Korea in 2010
SUMMARY OF FINDINGS FOR "NO REFORMS"Total economy, indexed to US 1995 = 100
* Based on Cobb-Douglas production function with labor share of 66%** Assuming very flexible labor market conditions (e.g., no change in minimum wage)
*** 1995 figures used for the base year (latest available complete set of data)Source: McKinsey analysis
GDP per capita
Total factor inputs per capita*
Total factor productivity*
1847
79
Korea 1985
Korea 1995/2000
Korea in 2010
Capital inputs per capita
120 140 125
Korea 1985
Korea 1995/2000
Korea in 2010
20 36 54
Korea 1985
Korea 1995/2000
Korea in 2010
140105 85
Korea 1985
Korea 1995/2000
Korea in 2010
Labor inputs per capita**
Labor productivity
Capital productivity
• 32% of GDP investment rate required
• Drop in manufacturing sectors where technological frontier has been reached (4% CAGR against 7% in last 10 years)
• Continued slow growth in services (4% CAGR)
• Continued low capital productivity in manufacturing (70% of US level)
Exhibit B1
Key drivers
• No more growth of working age population relative to total population
• Increase in leisure • Would drop to 110 with
US labor market conditions leading to 8% unemployment
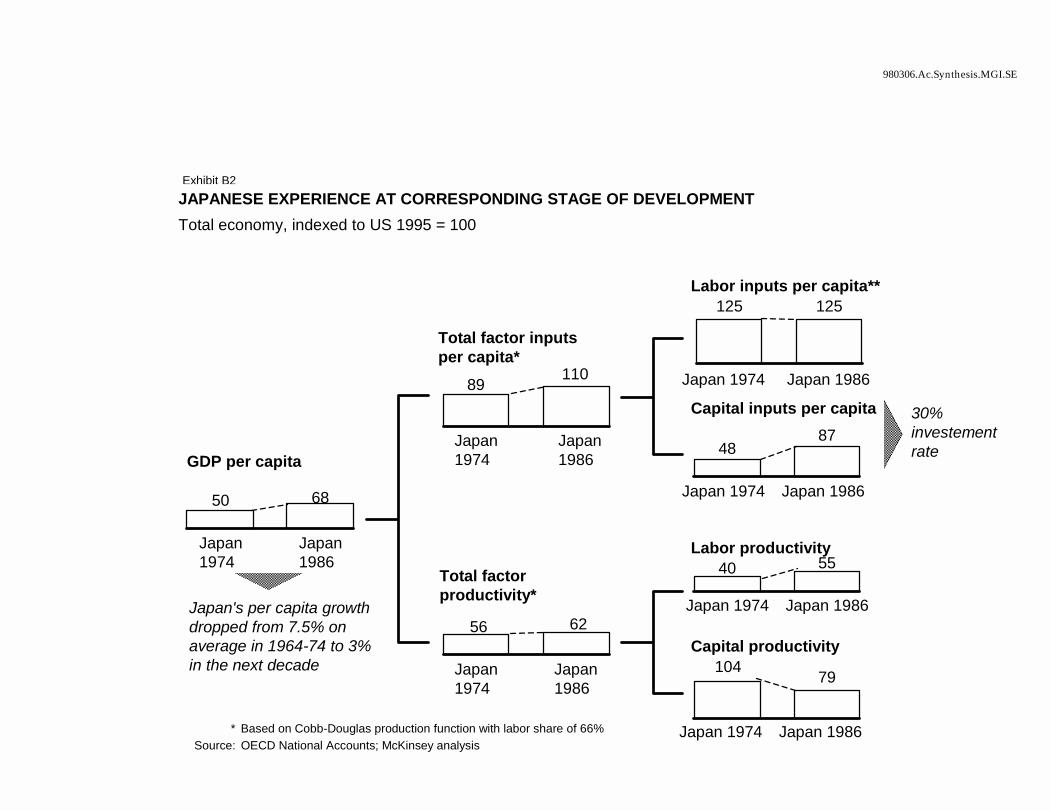
980306.Ac.Synthesis.MGI.SE
* Based on Cobb-Douglas production function with labor share of 66%Source: OECD National Accounts; McKinsey analysis
89 110
Japan1974
Japan1986
50 68
Japan1974
Japan1986
56 62
Japan1974
Japan1986
GDP per capita
Total factor inputs per capita*
Total factor productivity*
4887
Japan 1974 Japan 1986
Capital inputs per capita
125 125
Japan 1974 Japan 1986
40 55
Japan 1974 Japan 1986
104 79
Japan 1974 Japan 1986
Labor inputs per capita**
Labor productivity
Capital productivity
Japan's per capita growth dropped from 7.5% on average in 1964-74 to 3% in the next decade
30%investementrate
Exhibit B2JAPANESE EXPERIENCE AT CORRESPONDING STAGE OF DEVELOPMENTTotal economy, indexed to US 1995 = 100
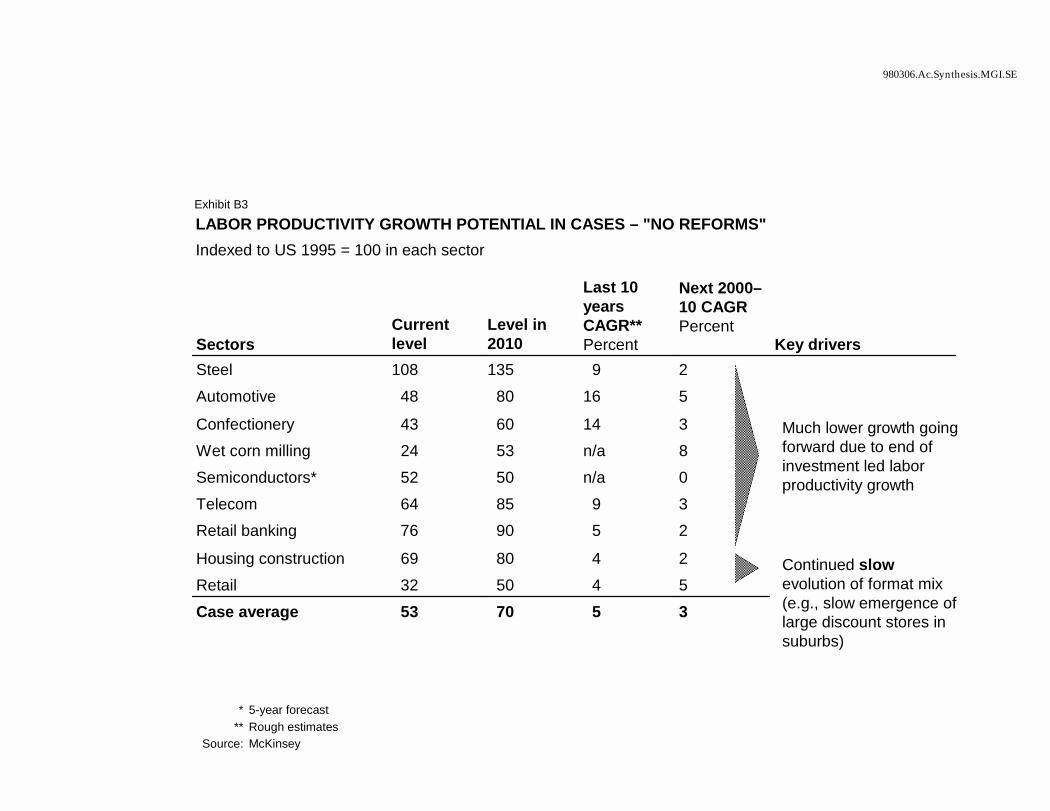
980306.Ac.Synthesis.MGI.SE
LABOR PRODUCTIVITY GROWTH POTENTIAL IN CASES – "NO REFORMS" Indexed to US 1995 = 100 in each sector
SectorsCurrent level
Level in 2010
Last 10 years CAGR**Percent
Next 2000–10 CAGR Percent
Key driversSteel 108 135 9 2Automotive 48 80 16 5
Confectionery 43 60 14 3Wet corn milling 24 53 n/a 8Semiconductors* 52 50 n/a 0Telecom 64 85 9 3Retail banking 76 90 5 2
Housing construction 69 80 4 2Retail 32 50 4 5Case average 53 70 5 3
* 5-year forecast** Rough estimates
Source: McKinsey
Much lower growth going forward due to end of investment led labor productivity growth
Continued slowevolution of format mix (e.g., slow emergence of large discount stores in suburbs)
Exhibit B3
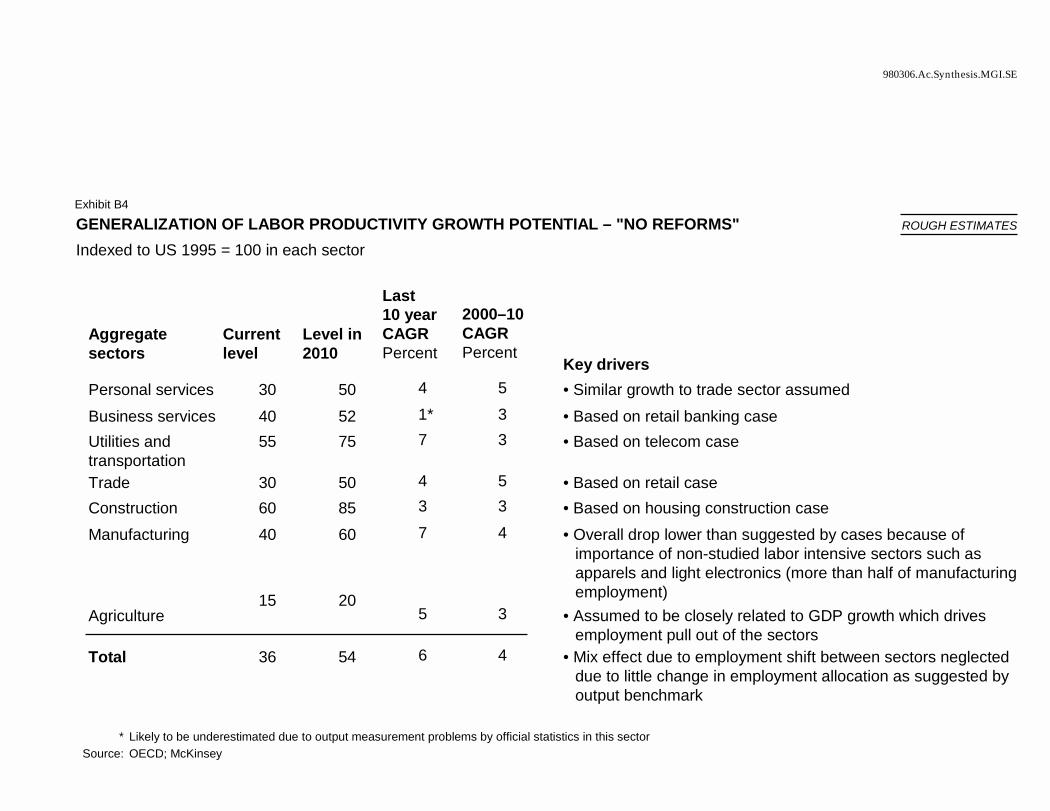
980306.Ac.Synthesis.MGI.SE
GENERALIZATION OF LABOR PRODUCTIVITY GROWTH POTENTIAL – "NO REFORMS" Indexed to US 1995 = 100 in each sector
Aggregate sectors
Current level
Level in 2010
Last 10 year CAGRPercent
2000–10 CAGRPercent
Key driversPersonal services 30 50 4 5 • Similar growth to trade sector assumedBusiness services 40 52 1* 3 • Based on retail banking caseUtilities and transportation
55 75 7 3 • Based on telecom case
Trade 30 50 4 5 • Based on retail caseConstruction 60 85 3 3 • Based on housing construction caseManufacturing 40 60 7 4 • Overall drop lower than suggested by cases because of
importance of non-studied labor intensive sectors such as apparels and light electronics (more than half of manufacturing employment)
Agriculture15 20
5 3 • Assumed to be closely related to GDP growth which drives employment pull out of the sectors
Total 36 54 6 4 • Mix effect due to employment shift between sectors neglected due to little change in employment allocation as suggested by output benchmark
* Likely to be underestimated due to output measurement problems by official statistics in this sectorSource: OECD; McKinsey
Exhibit B4
ROUGH ESTIMATES
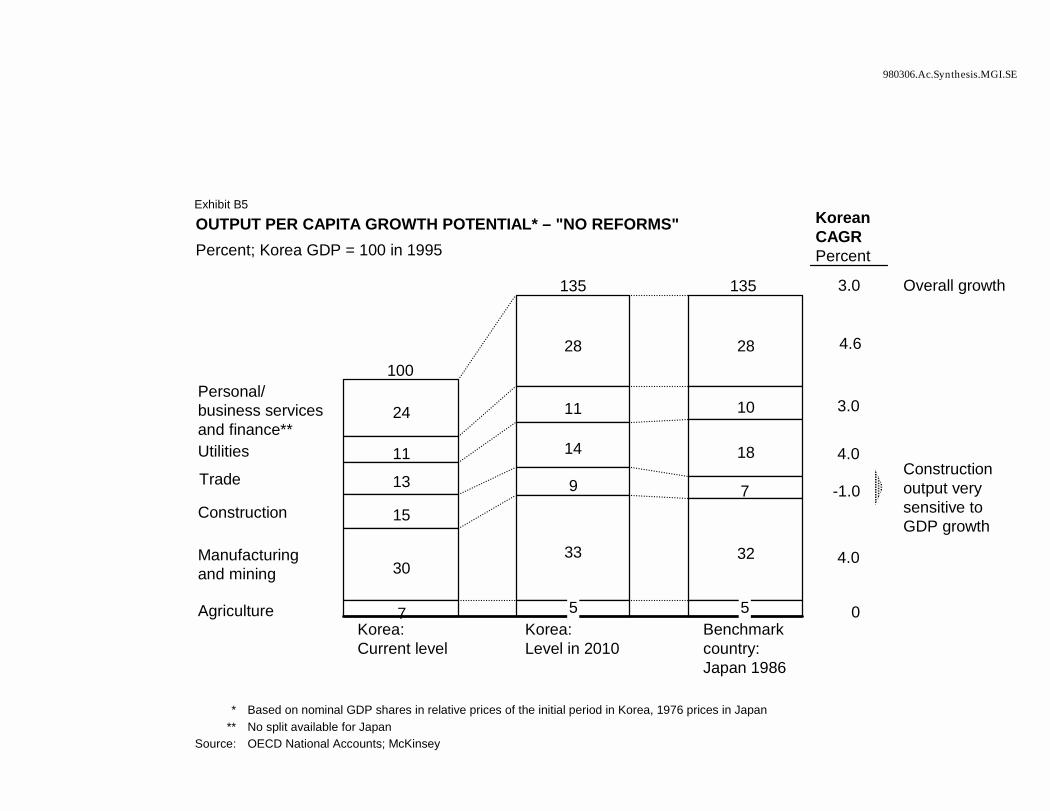
980306.Ac.Synthesis.MGI.SE
OUTPUT PER CAPITA GROWTH POTENTIAL* – "NO REFORMS" Percent; Korea GDP = 100 in 1995
Personal/business services and finance**
24
28 28
Utilities 11
11 10
Trade 13
14 18
Construction 15
9 7
Manufacturing and mining 30
33 32
Agriculture 7Korea: Current level
Korea: Level in 2010
Benchmark country: Japan 1986
* Based on nominal GDP shares in relative prices of the initial period in Korea, 1976 prices in Japan** No split available for Japan
Source: OECD National Accounts; McKinsey
Korean CAGRPercent
0
4.0
-1.0
4.0
4.6
3.0
3.0 Overall growth
Construction output very sensitive to GDP growth
135 135
Exhibit B5
100
5 5
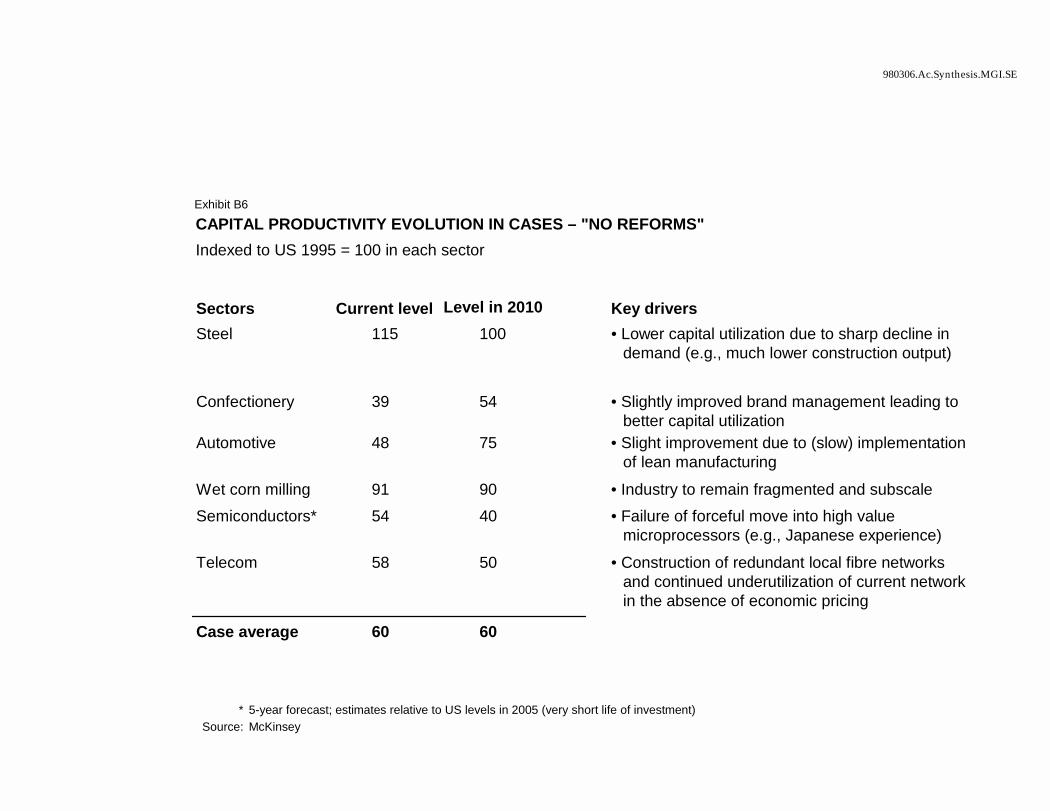
980306.Ac.Synthesis.MGI.SE
CAPITAL PRODUCTIVITY EVOLUTION IN CASES – "NO REFORMS" Indexed to US 1995 = 100 in each sector
Sectors Current level Level in 2010 Key driversSteel 115 100 • Lower capital utilization due to sharp decline in
demand (e.g., much lower construction output)
Confectionery 39 54 • Slightly improved brand management leading to better capital utilization
Automotive 48 75 • Slight improvement due to (slow) implementation of lean manufacturing
Wet corn milling 91 90 • Industry to remain fragmented and subscaleSemiconductors* 54 40 • Failure of forceful move into high value
microprocessors (e.g., Japanese experience)
Telecom 58 50 • Construction of redundant local fibre networks and continued underutilization of current network in the absence of economic pricing
Case average 60 60
* 5-year forecast; estimates relative to US levels in 2005 (very short life of investment)Source: McKinsey
Exhibit B6
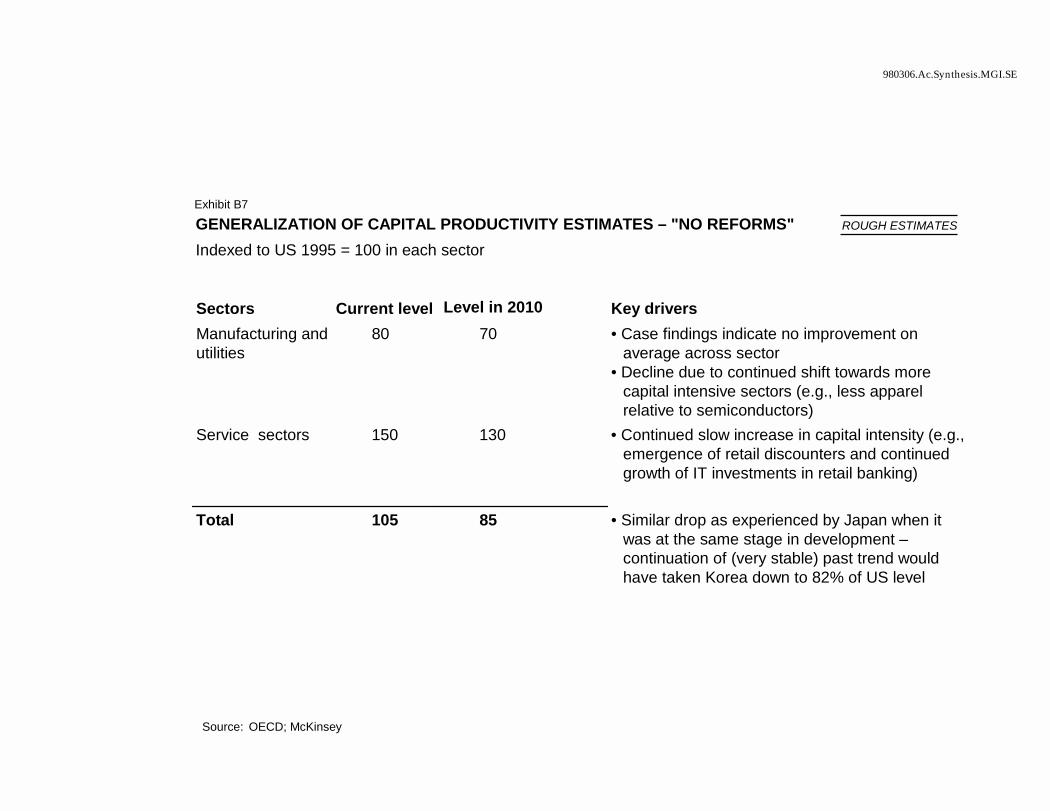
980306.Ac.Synthesis.MGI.SE
GENERALIZATION OF CAPITAL PRODUCTIVITY ESTIMATES – "NO REFORMS" Indexed to US 1995 = 100 in each sector
Sectors Current level Level in 2010 Key driversManufacturing and utilities
80 70 • Case findings indicate no improvement on average across sector
• Decline due to continued shift towards more capital intensive sectors (e.g., less apparel relative to semiconductors)
Service sectors 150 130 • Continued slow increase in capital intensity (e.g., emergence of retail discounters and continued growth of IT investments in retail banking)
Total 105 85 • Similar drop as experienced by Japan when it was at the same stage in development –continuation of (very stable) past trend would have taken Korea down to 82% of US level
Source: OECD; McKinsey
ROUGH ESTIMATES
Exhibit B7
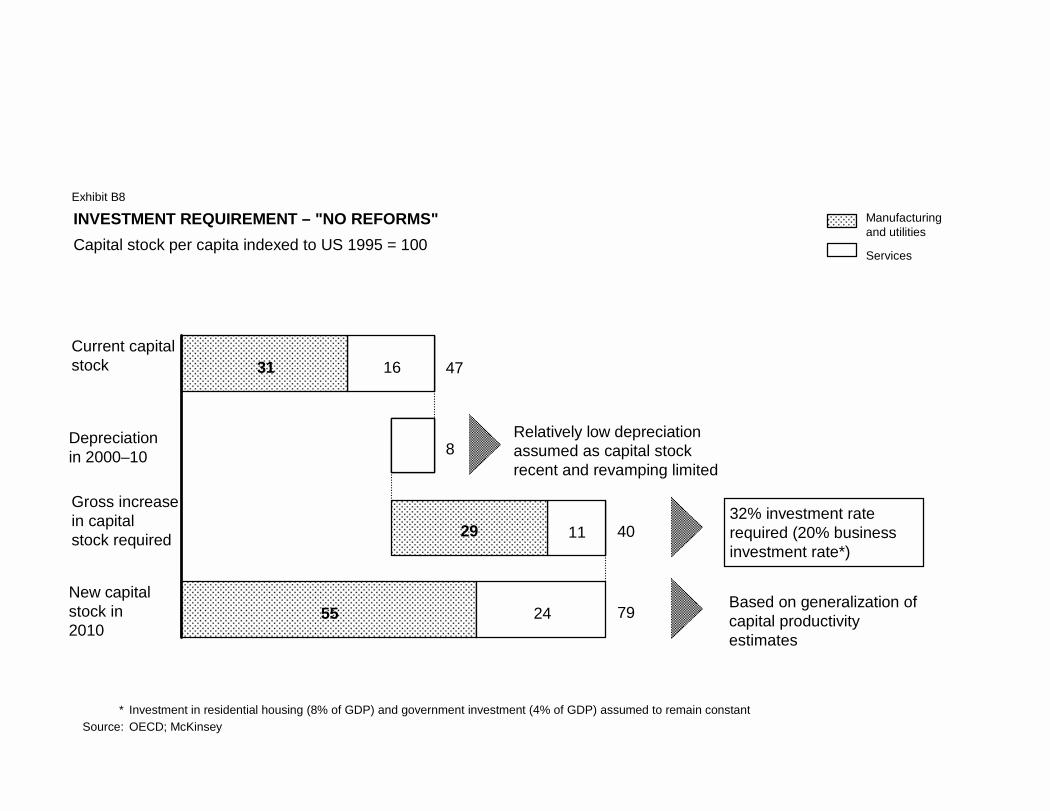
INVESTMENT REQUIREMENT – "NO REFORMS"Capital stock per capita indexed to US 1995 = 100
3
16
5
11
55
31
29
24
Current capital stock
Depreciationin 2000–10
Gross increasein capitalstock required
New capitalstock in 2010
* Investment in residential housing (8% of GDP) and government investment (4% of GDP) assumed to remain constantSource: OECD; McKinsey
Manufacturing and utilities
Services
47
8
40
79
Relatively low depreciation assumed as capital stock recent and revamping limited
32% investment rate required (20% business investment rate*)
Based on generalization of capital productivity estimates
Exhibit B8
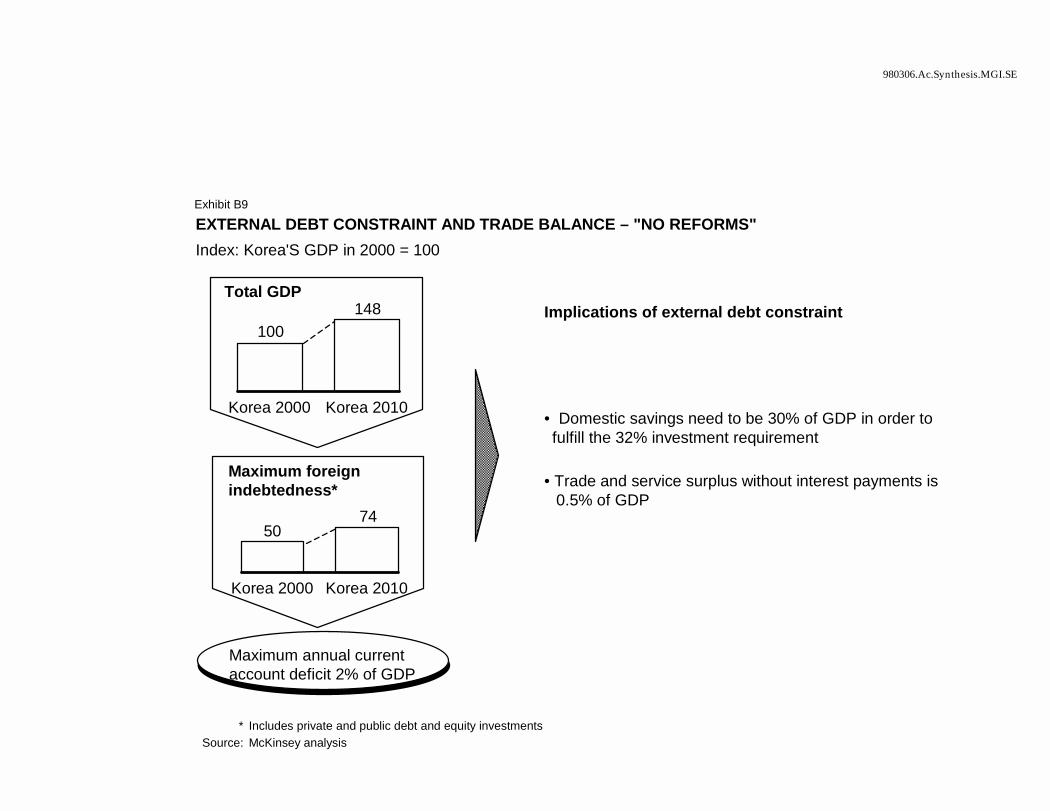
980306.Ac.Synthesis.MGI.SE
EXTERNAL DEBT CONSTRAINT AND TRADE BALANCE – "NO REFORMS"Index: Korea'S GDP in 2000 = 100
* Includes private and public debt and equity investmentsSource: McKinsey analysis
Total GDP
100148
Korea 2000 Korea 2010
Maximum foreign indebtedness*
5074
Korea 2000 Korea 2010
Maximum annual current account deficit 2% of GDP
Implications of external debt constraint
• Domestic savings need to be 30% of GDP in order to fulfill the 32% investment requirement
• Trade and service surplus without interest payments is 0.5% of GDP
Exhibit B9
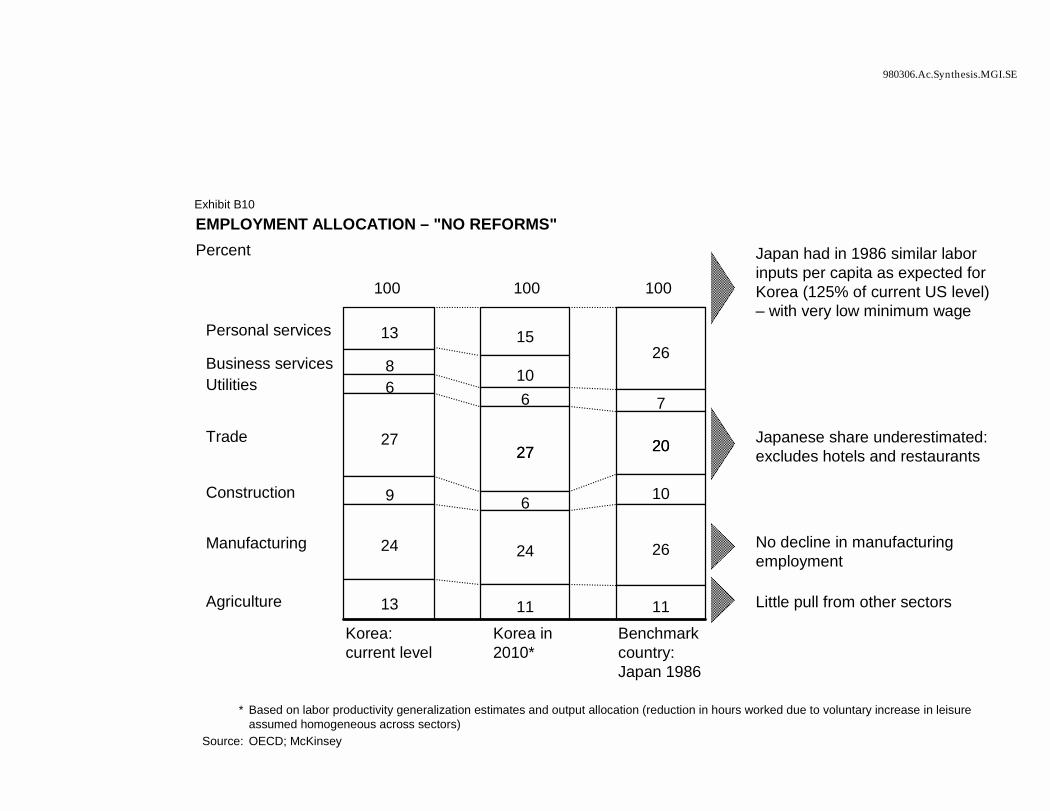
980306.Ac.Synthesis.MGI.SE
EMPLOYMENT ALLOCATION – "NO REFORMS" Percent
Personal services 13 15Business services 8 10
26
Utilities 66 7
Trade 272727 2020
Construction 9 6 10
Manufacturing 24 24 26
Agriculture 13 11 11Korea:current level
Korea in 2010*
Benchmark country: Japan 1986
* Based on labor productivity generalization estimates and output allocation (reduction in hours worked due to voluntary increase in leisure assumed homogeneous across sectors)
Source: OECD; McKinsey
100 100 100
Japan had in 1986 similar labor inputs per capita as expected for Korea (125% of current US level) – with very low minimum wage
Japanese share underestimated: excludes hotels and restaurants
No decline in manufacturing employment
Little pull from other sectors
Exhibit B10
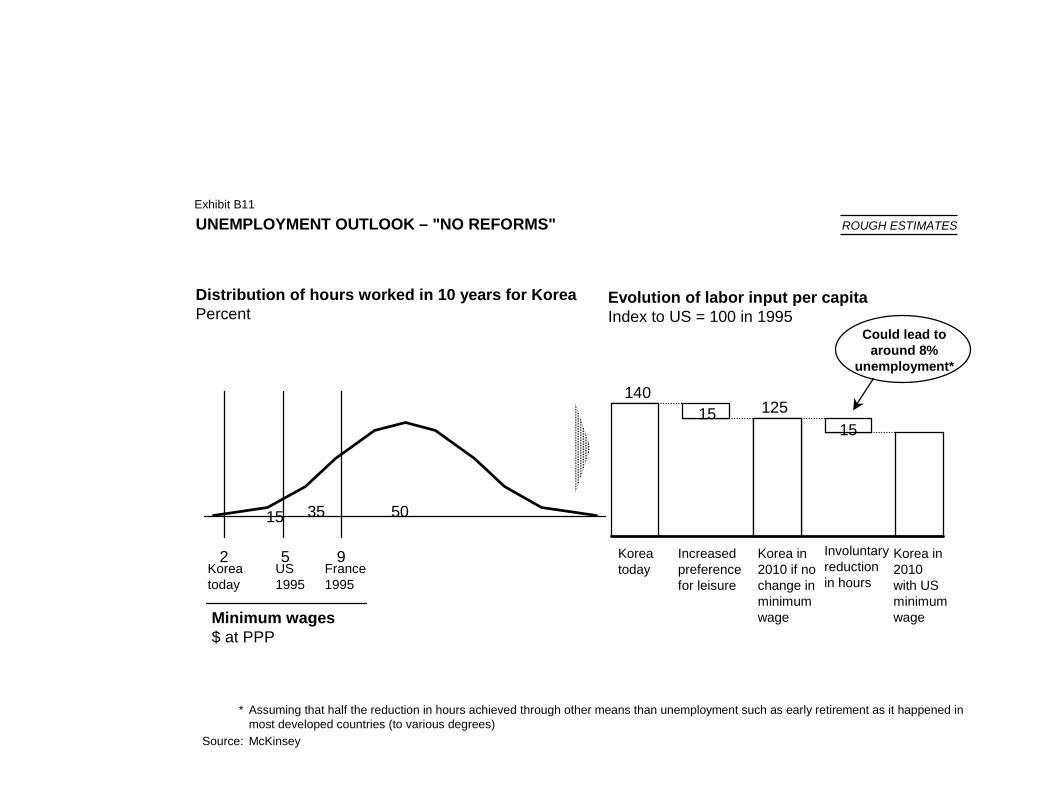
UNEMPLOYMENT OUTLOOK – "NO REFORMS"
* Assuming that half the reduction in hours achieved through other means than unemployment such as early retirement as it happened in most developed countries (to various degrees)
Source: McKinsey
15 35 50
Koreatoday
US1995
France1995
2 5 9
Minimum wages$ at PPP
125140
1515
Koreatoday
Increasedpreferencefor leisure
Korea in2010 if no change inminimumwage
Involuntaryreductionin hours
Korea in2010with USminimumwage
Could lead to around 8%
unemployment*
Evolution of labor input per capitaIndex to US = 100 in 1995
Distribution of hours worked in 10 years for KoreaPercent
Exhibit B11
ROUGH ESTIMATES
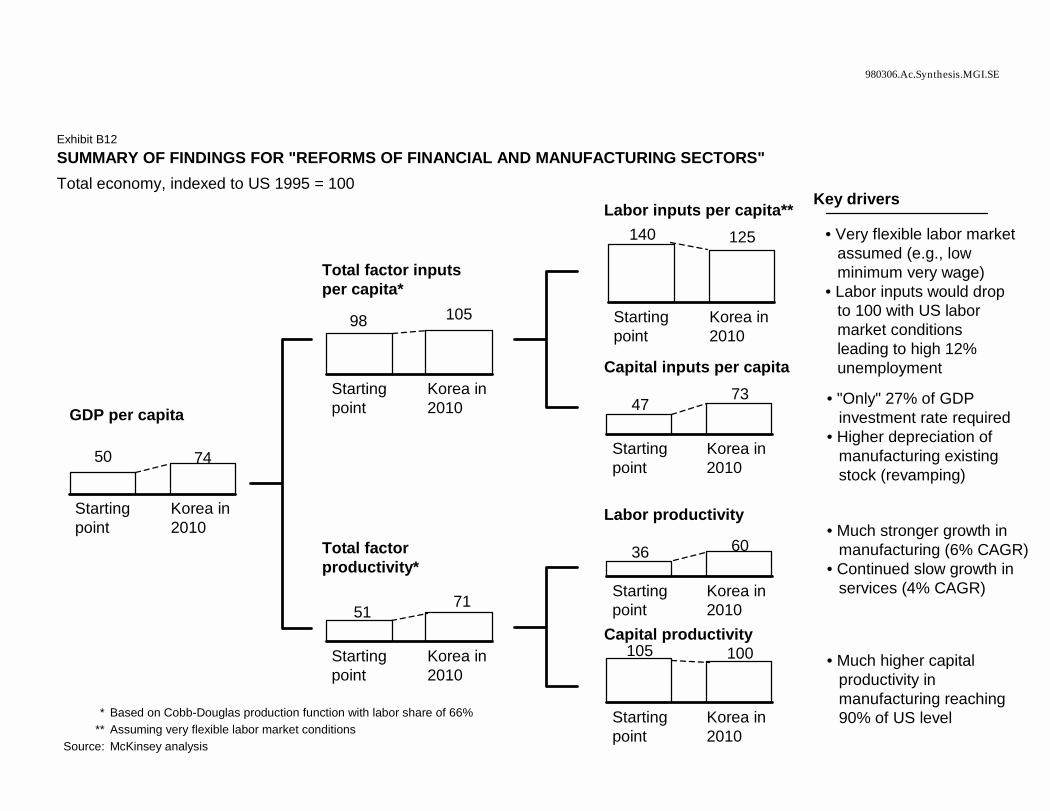
980306.Ac.Synthesis.MGI.SE
SUMMARY OF FINDINGS FOR "REFORMS OF FINANCIAL AND MANUFACTURING SECTORS"Total economy, indexed to US 1995 = 100
50 74
Startingpoint
Korea in 2010
51 71
Startingpoint
Korea in 2010
* Based on Cobb-Douglas production function with labor share of 66%** Assuming very flexible labor market conditions
Source: McKinsey analysis
GDP per capita
Total factor inputs per capita*
Total factor productivity*
47 73
Startingpoint
Korea in 2010
Capital inputs per capita
140 125
Startingpoint
Korea in 2010
36 60
Startingpoint
Korea in 2010
105 100
Startingpoint
Korea in 2010
Labor inputs per capita**
Labor productivity
Capital productivity
98 105
Startingpoint
Korea in 2010
Key drivers
• Very flexible labor market assumed (e.g., low minimum very wage)
• Labor inputs would drop to 100 with US labor market conditions leading to high 12% unemployment
• "Only" 27% of GDP investment rate required
• Higher depreciation of manufacturing existing stock (revamping)
• Much stronger growth in manufacturing (6% CAGR)
• Continued slow growth in services (4% CAGR)
• Much higher capital productivity in manufacturing reaching 90% of US level
Exhibit B12
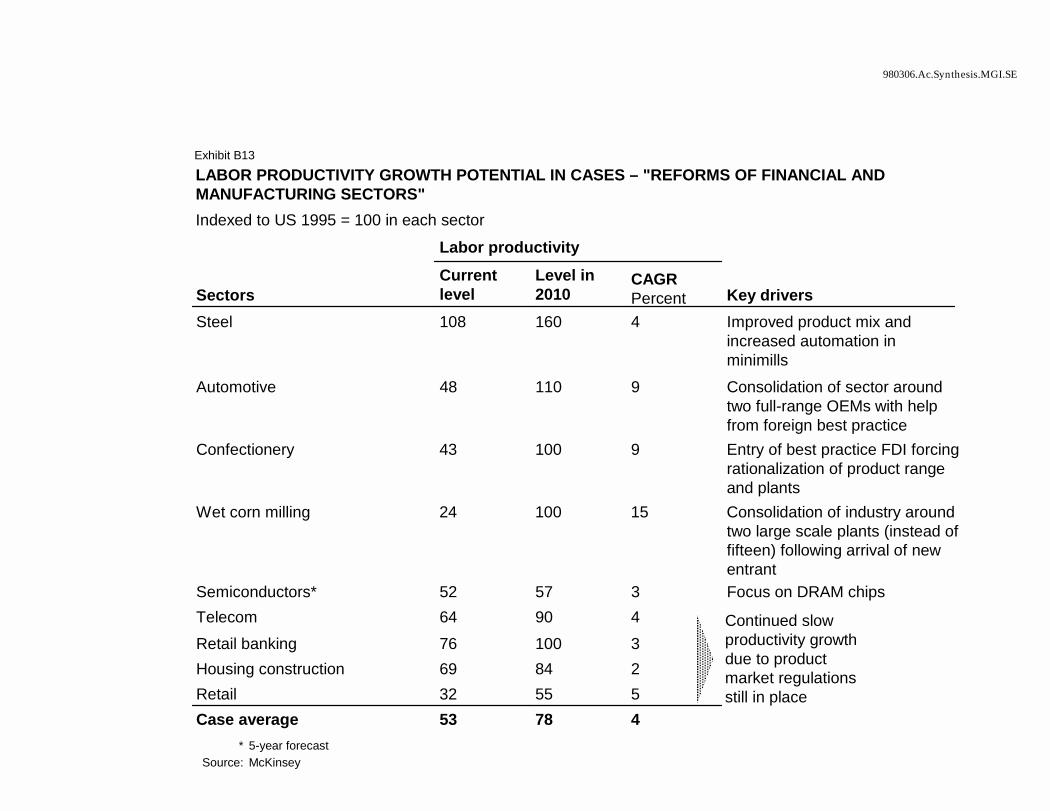
980306.Ac.Synthesis.MGI.SE
LABOR PRODUCTIVITY GROWTH POTENTIAL IN CASES – "REFORMS OF FINANCIAL AND MANUFACTURING SECTORS" Indexed to US 1995 = 100 in each sector
Labor productivity
SectorsCurrent level
Level in 2010
CAGR Percent Key drivers
Steel 108 160 4 Improved product mix and increased automation inminimills
Automotive 48 110 9 Consolidation of sector around two full-range OEMs with help from foreign best practice
Confectionery 43 100 9 Entry of best practice FDI forcing rationalization of product range and plants
Wet corn milling 24 100 15 Consolidation of industry around two large scale plants (instead of fifteen) following arrival of new entrant
Semiconductors* 52 57 3 Focus on DRAM chipsTelecom 64 90 4Retail banking 76 100 3Housing construction 69 84 2Retail 32 55 5Case average 53 78 4
* 5-year forecastSource: McKinsey
Continued slow productivity growth due to product market regulations still in place
Exhibit B13
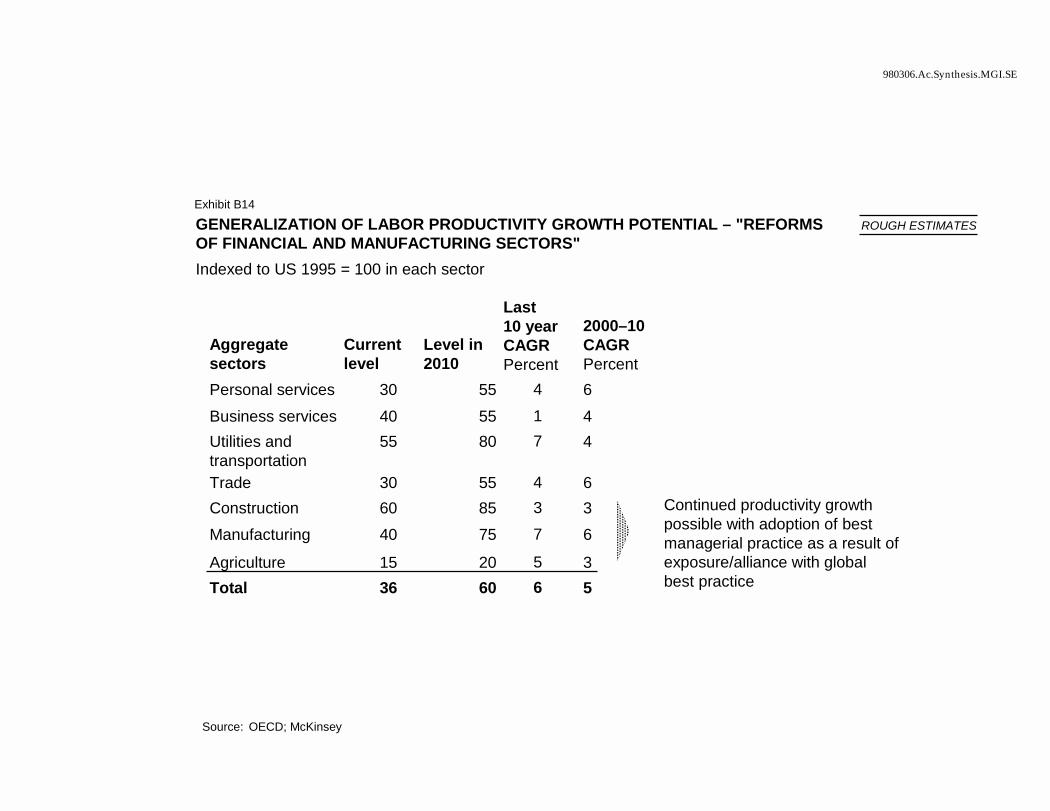
980306.Ac.Synthesis.MGI.SE
GENERALIZATION OF LABOR PRODUCTIVITY GROWTH POTENTIAL – "REFORMS OF FINANCIAL AND MANUFACTURING SECTORS" Indexed to US 1995 = 100 in each sector
Aggregate sectors
Current level
Level in 2010
Last 10 year CAGRPercent
2000–10 CAGRPercent
Personal services 30 55 4 6Business services 40 55 1 4Utilities and transportation
55 80 7 4
Trade 30 55 4 6Construction 60 85 3 3Manufacturing 40 75 7 6
Agriculture 20 5 3Total 36 60 6 5
Source: OECD; McKinsey
Continued productivity growth possible with adoption of best managerial practice as a result of exposure/alliance with global best practice
Exhibit B14
ROUGH ESTIMATES
15
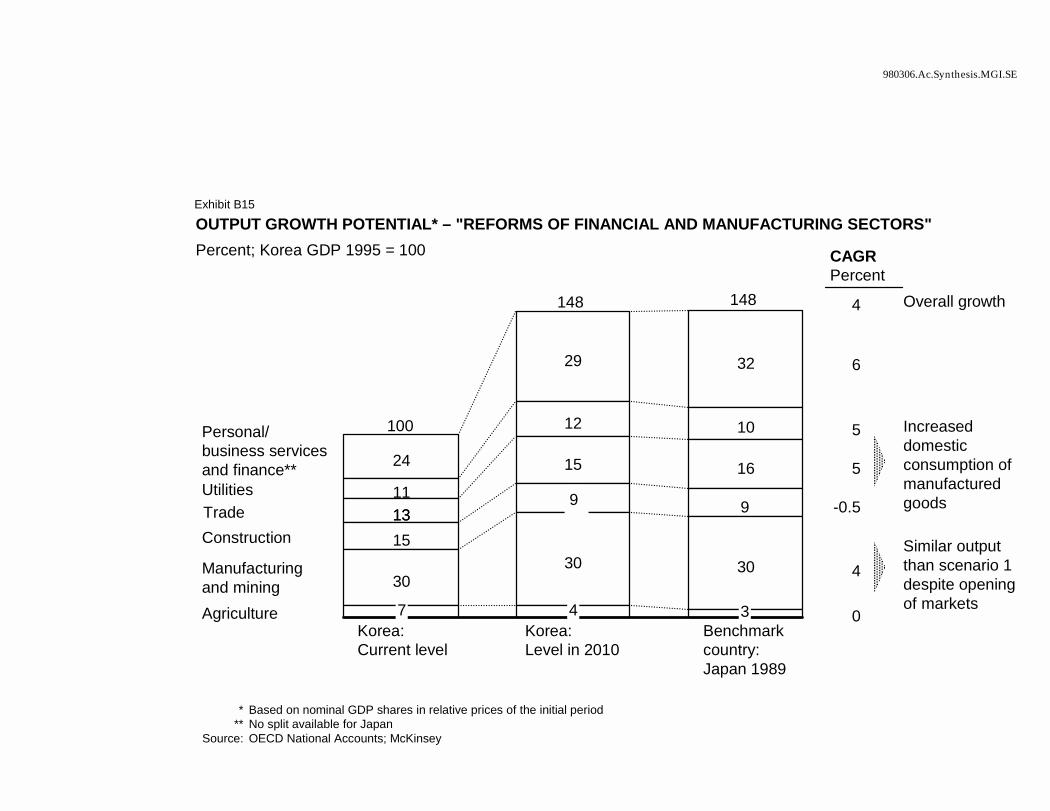
980306.Ac.Synthesis.MGI.SE
OUTPUT GROWTH POTENTIAL* – "REFORMS OF FINANCIAL AND MANUFACTURING SECTORS" Percent; Korea GDP 1995 = 100
Personal/business servicesand finance** 24
29 32
Utilities 11
12 10
Trade 1313
15 16
Construction 15
10 9
Manufacturing and mining 30
30 30
AgricultureKorea: Current level
Korea: Level in 2010
Benchmark country: Japan 1989
* Based on nominal GDP shares in relative prices of the initial period** No split available for Japan
Source: OECD National Accounts; McKinsey
CAGRPercent
0
4
-0.5
5
6
4
5 Increased domestic consumption of manufactured goods
Similar output than scenario 1 despite opening of markets
Overall growth
100
148 148
Exhibit B15
9
7 4 3
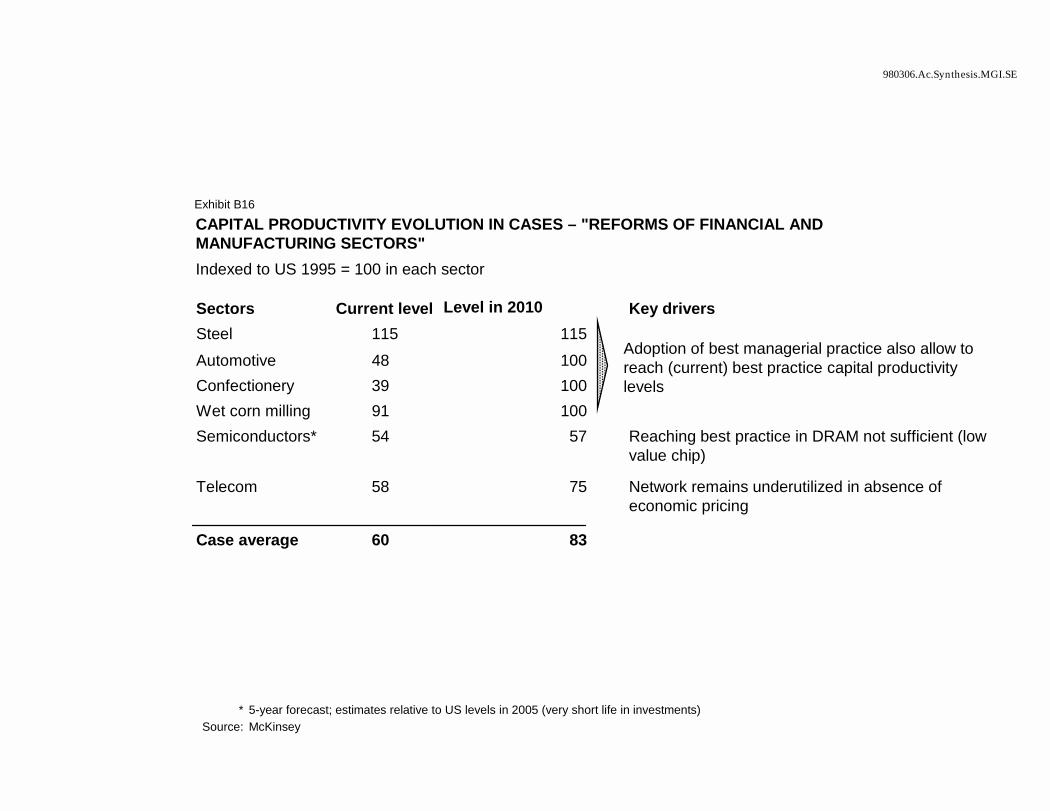
980306.Ac.Synthesis.MGI.SE
CAPITAL PRODUCTIVITY EVOLUTION IN CASES – "REFORMS OF FINANCIAL AND MANUFACTURING SECTORS"Indexed to US 1995 = 100 in each sector
Sectors Current level Level in 2010 Key driversSteel 115 115Automotive 48 100Confectionery 39 100Wet corn milling 91 100Semiconductors* 54 57 Reaching best practice in DRAM not sufficient (low
value chip)
Telecom 58 75 Network remains underutilized in absence of economic pricing
Case average 60 83
* 5-year forecast; estimates relative to US levels in 2005 (very short life in investments)Source: McKinsey
Adoption of best managerial practice also allow to reach (current) best practice capital productivity levels
Exhibit B16
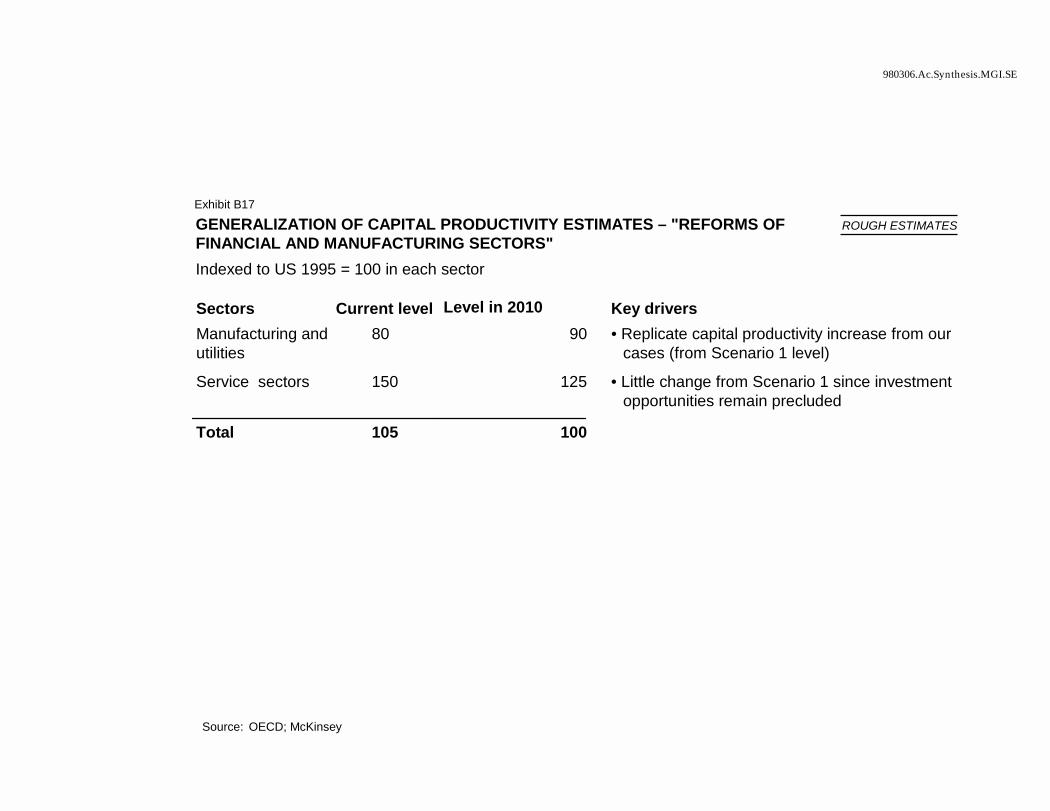
980306.Ac.Synthesis.MGI.SE
GENERALIZATION OF CAPITAL PRODUCTIVITY ESTIMATES – "REFORMS OF FINANCIAL AND MANUFACTURING SECTORS" Indexed to US 1995 = 100 in each sector
Sectors Current level Level in 2010 Key driversManufacturing and utilities
80 90 • Replicate capital productivity increase from our cases (from Scenario 1 level)
Service sectors 150 125 • Little change from Scenario 1 since investment opportunities remain precluded
Total 105 100
Source: OECD; McKinsey
Exhibit B17
ROUGH ESTIMATES
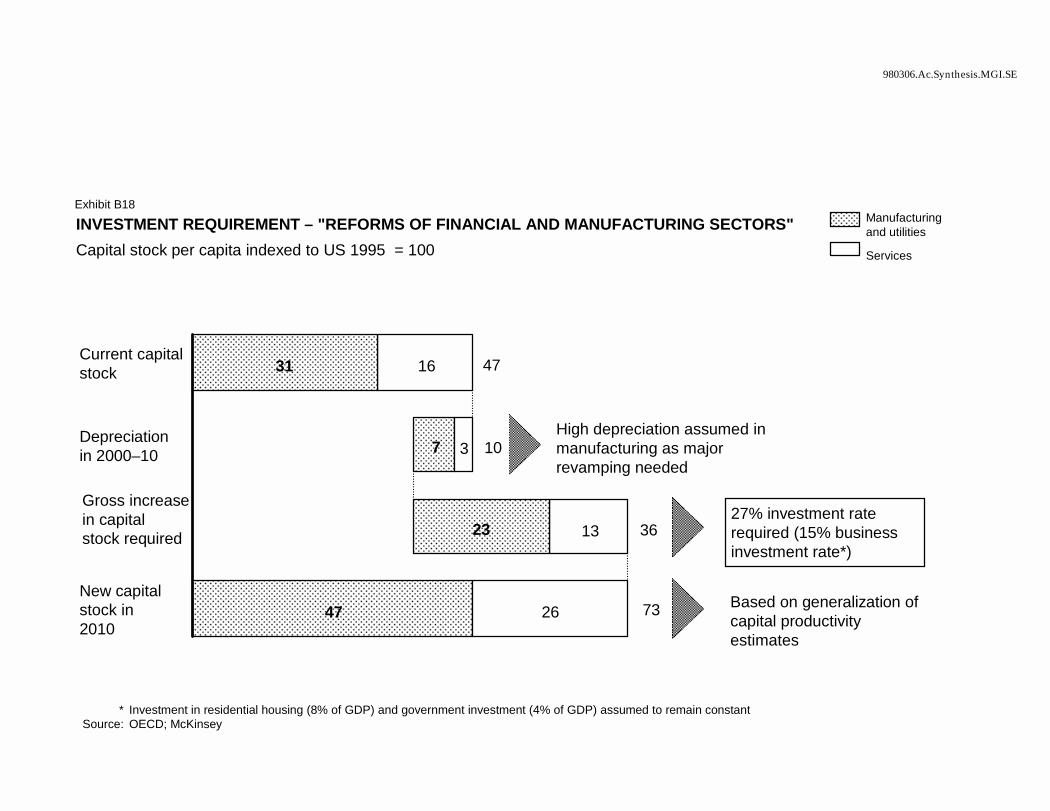
980306.Ac.Synthesis.MGI.SE
INVESTMENT REQUIREMENT – "REFORMS OF FINANCIAL AND MANUFACTURING SECTORS"Capital stock per capita indexed to US 1995 = 100
16
7
13
47
31
3
23
26
Current capital stock
Depreciationin 2000–10
Gross increasein capitalstock required
New capitalstock in 2010
* Investment in residential housing (8% of GDP) and government investment (4% of GDP) assumed to remain constantSource: OECD; McKinsey
Manufacturing and utilities
Services
High depreciation assumed in manufacturing as major revamping needed
27% investment rate required (15% business investment rate*)
Based on generalization of capital productivity estimates
Exhibit B18
47
10
36
73
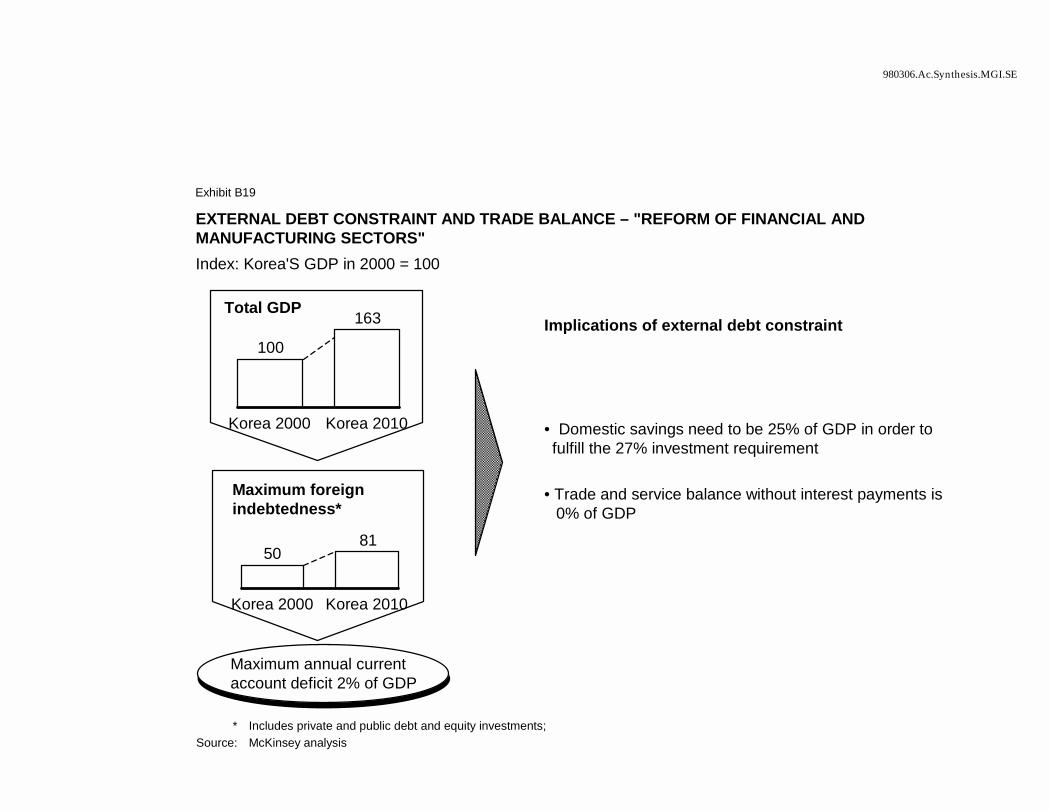
980306.Ac.Synthesis.MGI.SE
EXTERNAL DEBT CONSTRAINT AND TRADE BALANCE – "REFORM OF FINANCIAL AND MANUFACTURING SECTORS"Index: Korea'S GDP in 2000 = 100
* Includes private and public debt and equity investments;Source: McKinsey analysis
Total GDP
100
163
Korea 2000 Korea 2010
Maximum foreign indebtedness*
5081
Korea 2000 Korea 2010
Maximum annual current account deficit 2% of GDP
Implications of external debt constraint
• Domestic savings need to be 25% of GDP in order to fulfill the 27% investment requirement
• Trade and service balance without interest payments is 0% of GDP
Exhibit B19
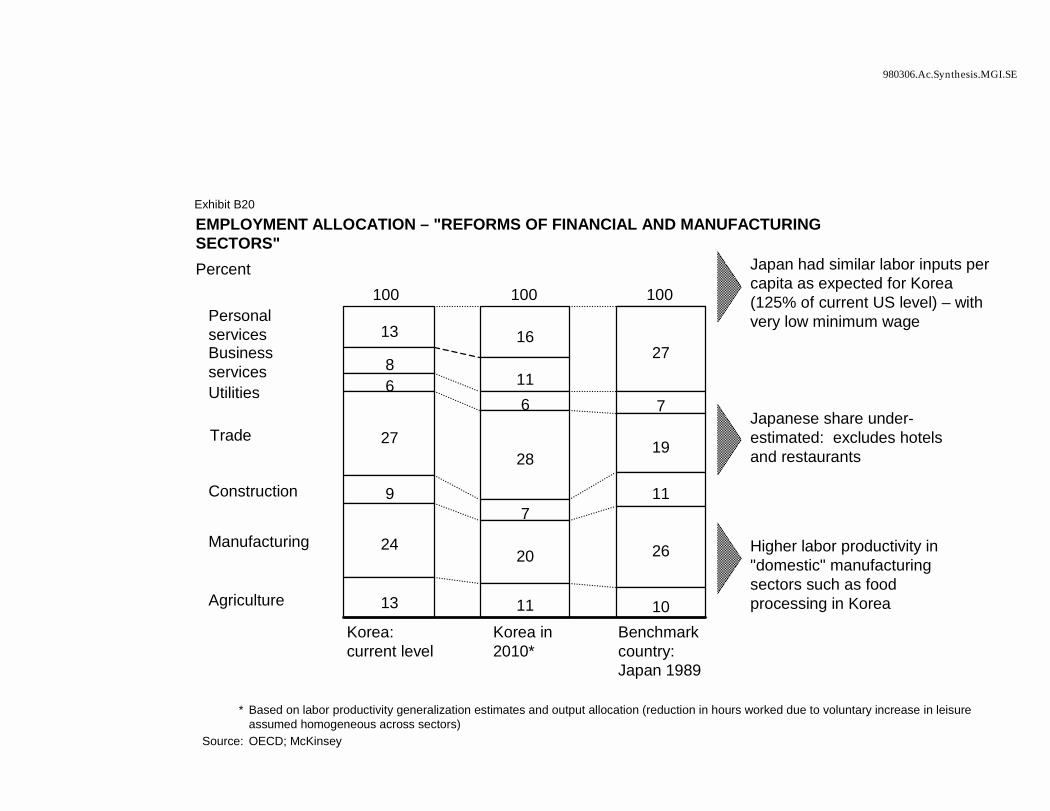
980306.Ac.Synthesis.MGI.SE
EMPLOYMENT ALLOCATION – "REFORMS OF FINANCIAL AND MANUFACTURING SECTORS" Percent
Personal services 13 16Businessservices 8
1127
Utilities 66 7
Trade 2728
19
Construction 97
11
Manufacturing 2420 26
Agriculture 13 11 10Korea:current level
Korea in 2010*
Benchmark country: Japan 1989
* Based on labor productivity generalization estimates and output allocation (reduction in hours worked due to voluntary increase in leisure assumed homogeneous across sectors)
Source: OECD; McKinsey
100 100 100
Japan had similar labor inputs per capita as expected for Korea (125% of current US level) – with very low minimum wage
Japanese share under-estimated: excludes hotels and restaurants
Higher labor productivity in "domestic" manufacturing sectors such as food processing in Korea
Exhibit B20
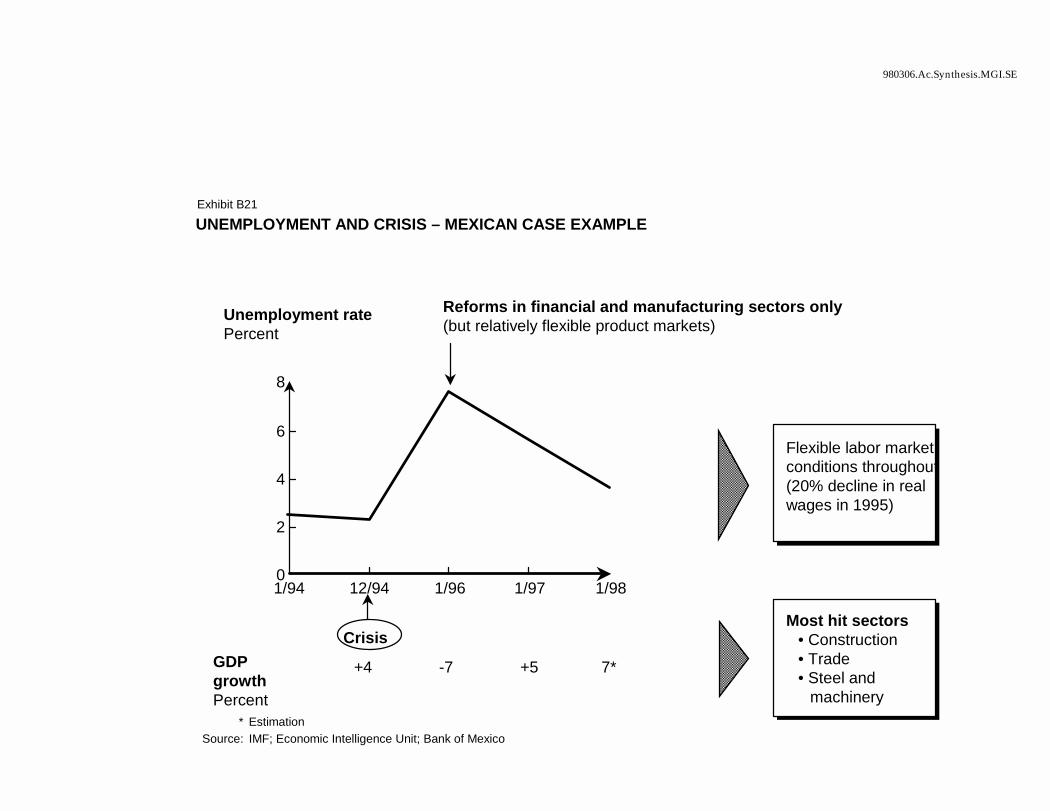
980306.Ac.Synthesis.MGI.SE
UNEMPLOYMENT AND CRISIS – MEXICAN CASE EXAMPLE
* EstimationSource: IMF; Economic Intelligence Unit; Bank of Mexico
Unemployment ratePercent
Reforms in financial and manufacturing sectors only(but relatively flexible product markets)
Flexible labor market conditions throughout (20% decline in real wages in 1995)
GDP growthPercent
+4 -7 +5 7*
Most hit sectors• Construction• Trade• Steel and
machinery
0
2
4
6
8
1/94 12/94 1/96 1/97 1/98
Crisis
Exhibit B21
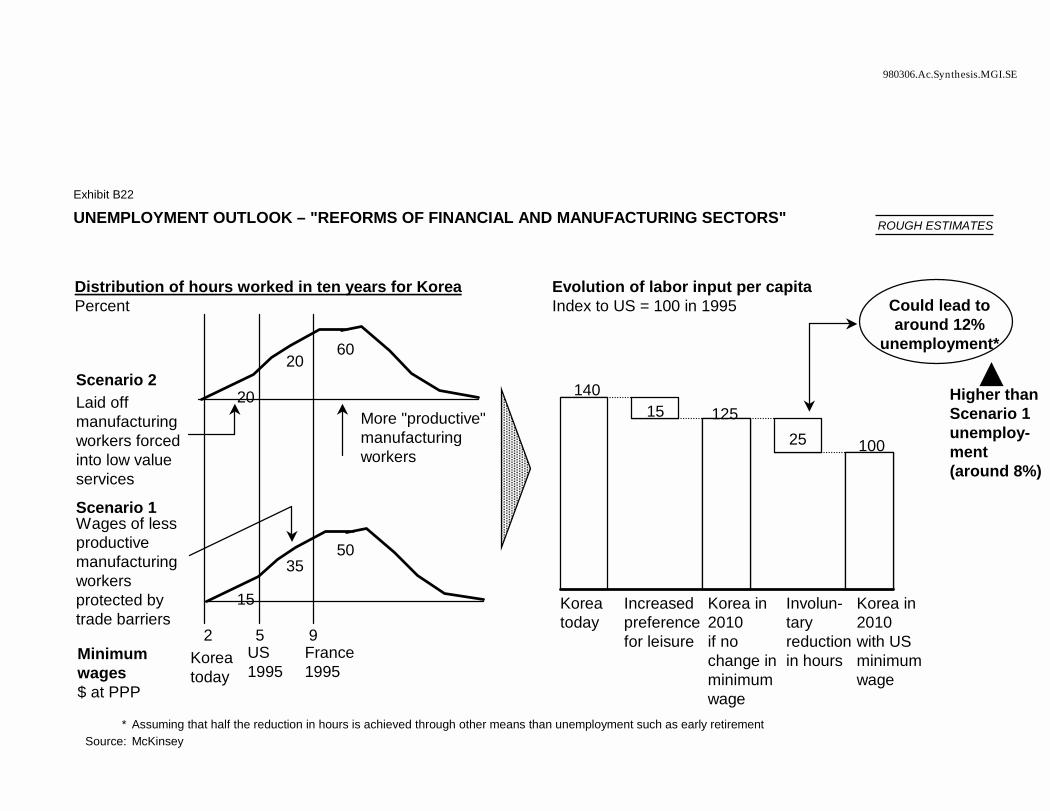
980306.Ac.Synthesis.MGI.SE
UNEMPLOYMENT OUTLOOK – "REFORMS OF FINANCIAL AND MANUFACTURING SECTORS"
* Assuming that half the reduction in hours is achieved through other means than unemployment such as early retirementSource: McKinsey
14015 125
25 100
Could lead to around 12%
unemployment*
Increased preference for leisure
Korea in 2010 if no change in minimum wage
Involun-taryreduction in hours
Korea in 2010 with US minimum wage
Higher than Scenario 1unemploy-ment(around 8%)
More "productive" manufacturing workers
20
2060
Scenario 2Laid off manufacturing workers forced into low value services
Scenario 1Wages of less productivemanufacturing workers protected by trade barriers
15
3550
2 5 9Minimum wages$ at PPP
Korea today
US1995
France1995
Evolution of labor input per capitaIndex to US = 100 in 1995
Korea today
Exhibit B22
Distribution of hours worked in ten years for KoreaPercent
ROUGH ESTIMATES
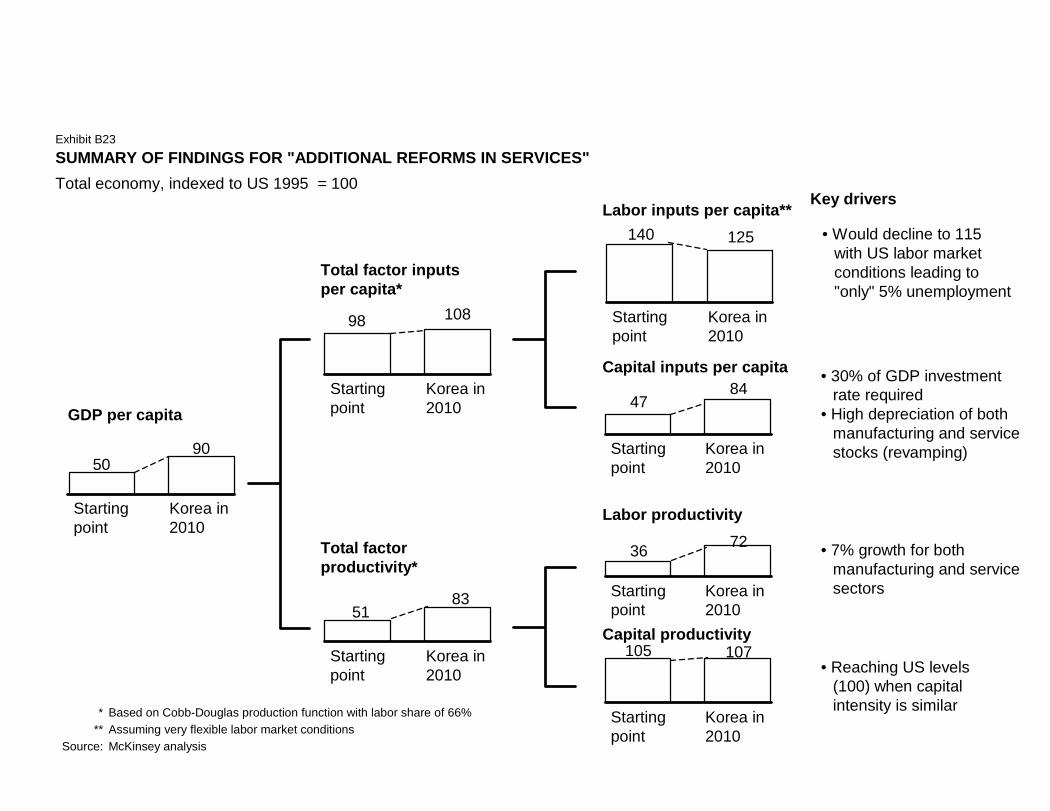
5090
Startingpoint
Korea in 2010
5183
Startingpoint
Korea in 2010
SUMMARY OF FINDINGS FOR "ADDITIONAL REFORMS IN SERVICES"Total economy, indexed to US 1995 = 100
* Based on Cobb-Douglas production function with labor share of 66%** Assuming very flexible labor market conditions
Source: McKinsey analysis
GDP per capita
Total factor inputs per capita*
Total factor productivity*
4784
Startingpoint
Korea in 2010
Capital inputs per capita
140 125
Startingpoint
Korea in 2010
36 72
Startingpoint
Korea in 2010
105 107
Startingpoint
Korea in 2010
Labor inputs per capita**
Labor productivity
Capital productivity
98 108
Startingpoint
Korea in 2010
Key drivers
• Would decline to 115 with US labor market conditions leading to "only" 5% unemployment
• 30% of GDP investment rate required
• High depreciation of both manufacturing and service stocks (revamping)
• 7% growth for both manufacturing and service sectors
• Reaching US levels (100) when capital intensity is similar
Exhibit B23
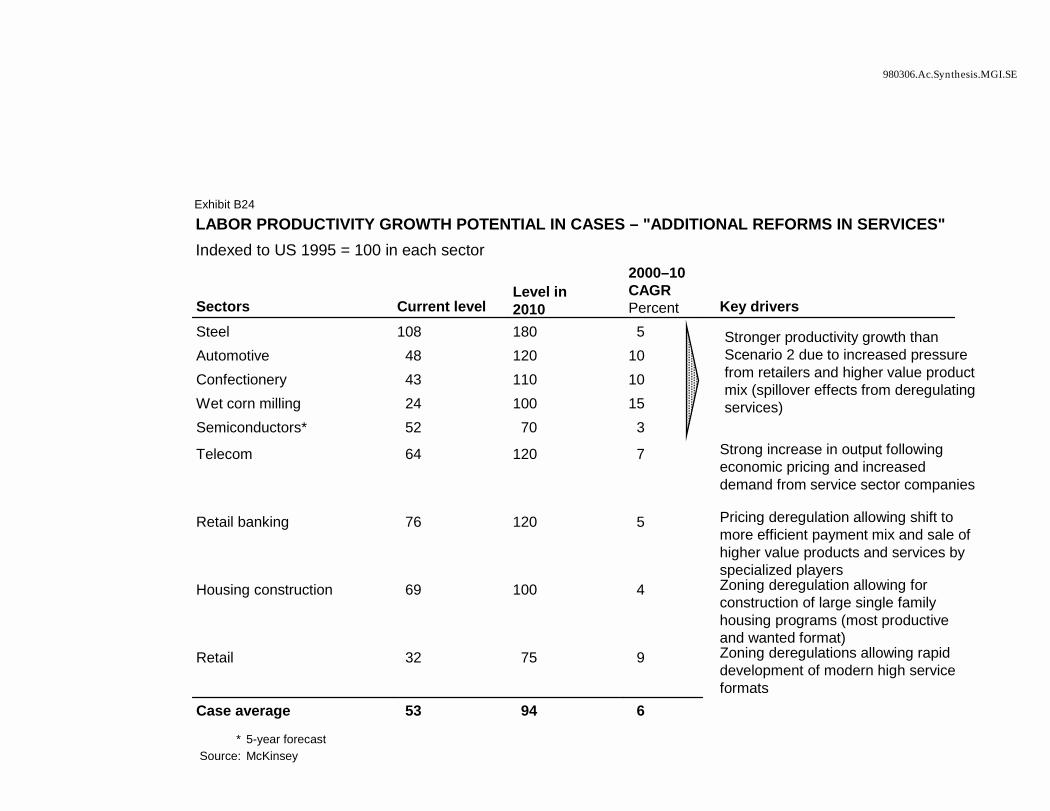
980306.Ac.Synthesis.MGI.SE
LABOR PRODUCTIVITY GROWTH POTENTIAL IN CASES – "ADDITIONAL REFORMS IN SERVICES" Indexed to US 1995 = 100 in each sector
Sectors Current levelLevel in 2010
2000–10 CAGRPercent
Steel 108 180 5Automotive 48 120 10Confectionery 43 110 10Wet corn milling 24 100 15Semiconductors* 52 70 3
Telecom 64 120 7
Retail banking 76 120 5
Housing construction 69 100 4
Retail 32 75 9
Case average 53 94 6
* 5-year forecastSource: McKinsey
Exhibit B24
Strong increase in output following economic pricing and increased demand from service sector companies
Pricing deregulation allowing shift to more efficient payment mix and sale of higher value products and services by specialized playersZoning deregulation allowing for construction of large single family housing programs (most productive and wanted format)Zoning deregulations allowing rapid development of modern high service formats
Stronger productivity growth than Scenario 2 due to increased pressure from retailers and higher value product mix (spillover effects from deregulating services)
Key drivers
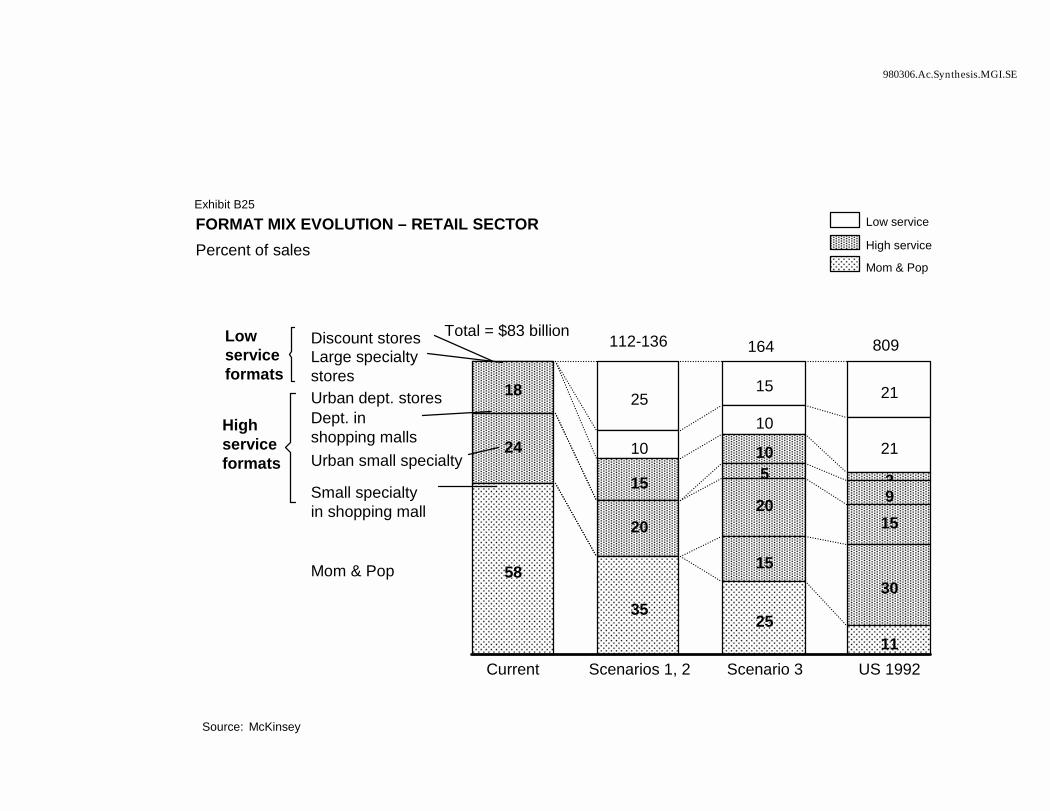
980306.Ac.Synthesis.MGI.SE
FORMAT MIX EVOLUTION – RETAIL SECTOR Percent of sales
Large specialtystores
2515 21
Discount stores
1010
21
Urban dept. stores 18
15
103
Dept. in shopping malls
59
Urban small specialty24
2020
15
Small specialty in shopping mall
1530
Mom & Pop 58
3525
11Current Scenarios 1, 2 Scenario 3 US 1992
Source: McKinsey
Low service
High service
Mom & Pop
Low service formats
Highservice formats
Total = $83 billion 112-136 164 809
Exhibit B25
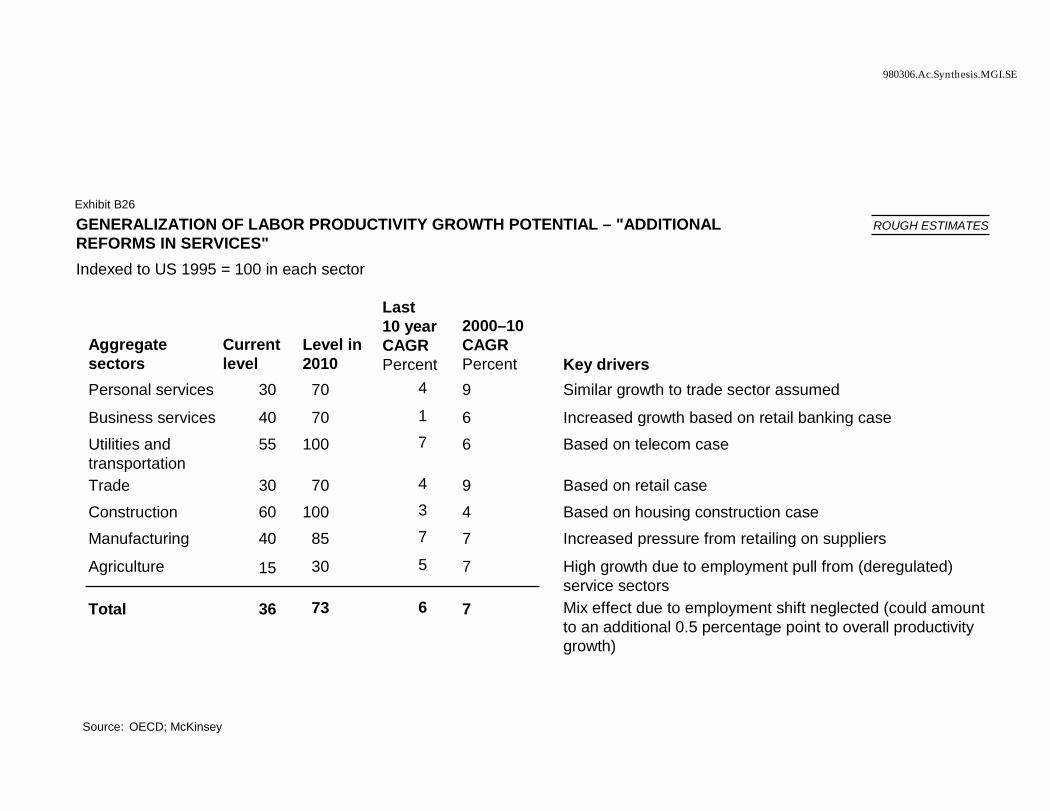
980306.Ac.Synthesis.MGI.SE
GENERALIZATION OF LABOR PRODUCTIVITY GROWTH POTENTIAL – "ADDITIONAL REFORMS IN SERVICES" Indexed to US 1995 = 100 in each sector
Aggregate sectors
Current level
Level in 2010
Last 10 year CAGRPercent
2000–10 CAGRPercent Key drivers
Personal services 30 70 4 Similar growth to trade sector assumed
Business services 40 70 1 6 Increased growth based on retail banking caseUtilities and transportation
55 100 7 6 Based on telecom case
Trade 30 70 4 9 Based on retail caseConstruction 60 100 3 4 Based on housing construction caseManufacturing 40 85 7 7 Increased pressure from retailing on suppliers
Agriculture 30 5 7 High growth due to employment pull from (deregulated) service sectors
Total 36 73 6 7 Mix effect due to employment shift neglected (could amount to an additional 0.5 percentage point to overall productivity growth)
Source: OECD; McKinsey
Exhibit B26
9
15
ROUGH ESTIMATES
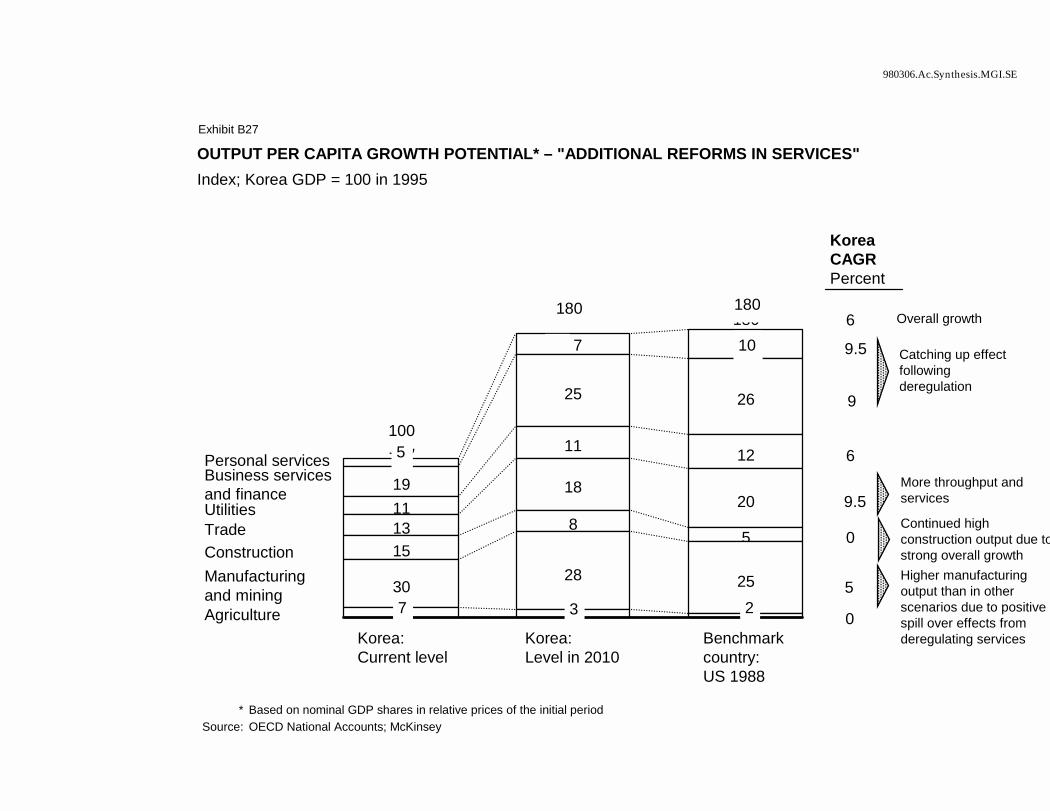
980306.Ac.Synthesis.MGI.SE
OUTPUT PER CAPITA GROWTH POTENTIAL* – "ADDITIONAL REFORMS IN SERVICES"Index; Korea GDP = 100 in 1995
100
180
Personal servicesBusiness servicesand finance 19
25 26
Utilities 11
11 12
Trade 13
1820
Construction 158
5
Manufacturing and mining 30
28 25
AgricultureKorea: Current level
Korea: Level in 2010
Benchmark country: US 1988
* Based on nominal GDP shares in relative prices of the initial period Source: OECD National Accounts; McKinsey
Korea CAGRPercent
0
0
9.5
9.5 Catching up effect following deregulation
More throughput and services
Continued high construction output due tostrong overall growthHigher manufacturing output than in other scenarios due to positive spill over effects from deregulating services
Overall growth6
9
6
5
Exhibit B27
7 3 2
7 10
100
180 180
5
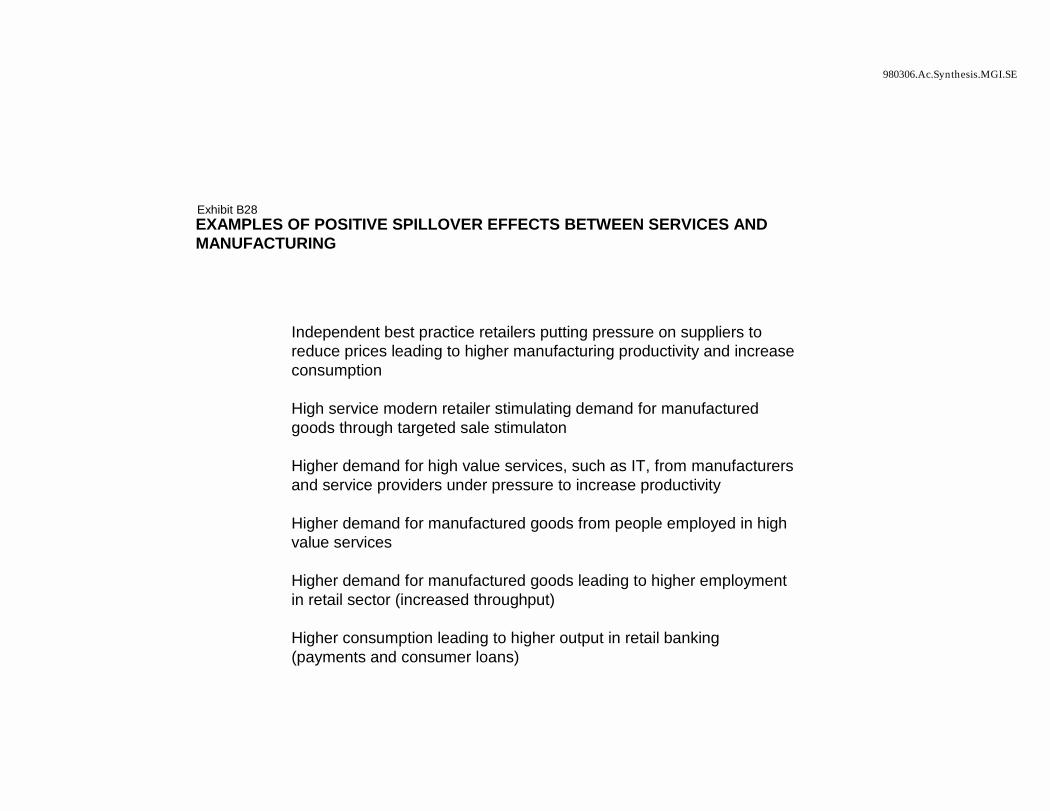
980306.Ac.Synthesis.MGI.SE
EXAMPLES OF POSITIVE SPILLOVER EFFECTS BETWEEN SERVICES AND MANUFACTURING
Independent best practice retailers putting pressure on suppliers to reduce prices leading to higher manufacturing productivity and increase consumption
High service modern retailer stimulating demand for manufacturedgoods through targeted sale stimulaton
Higher demand for high value services, such as IT, from manufacturers and service providers under pressure to increase productivity
Higher demand for manufactured goods from people employed in high value services
Higher demand for manufactured goods leading to higher employment in retail sector (increased throughput)
Higher consumption leading to higher output in retail banking (payments and consumer loans)
Exhibit B28
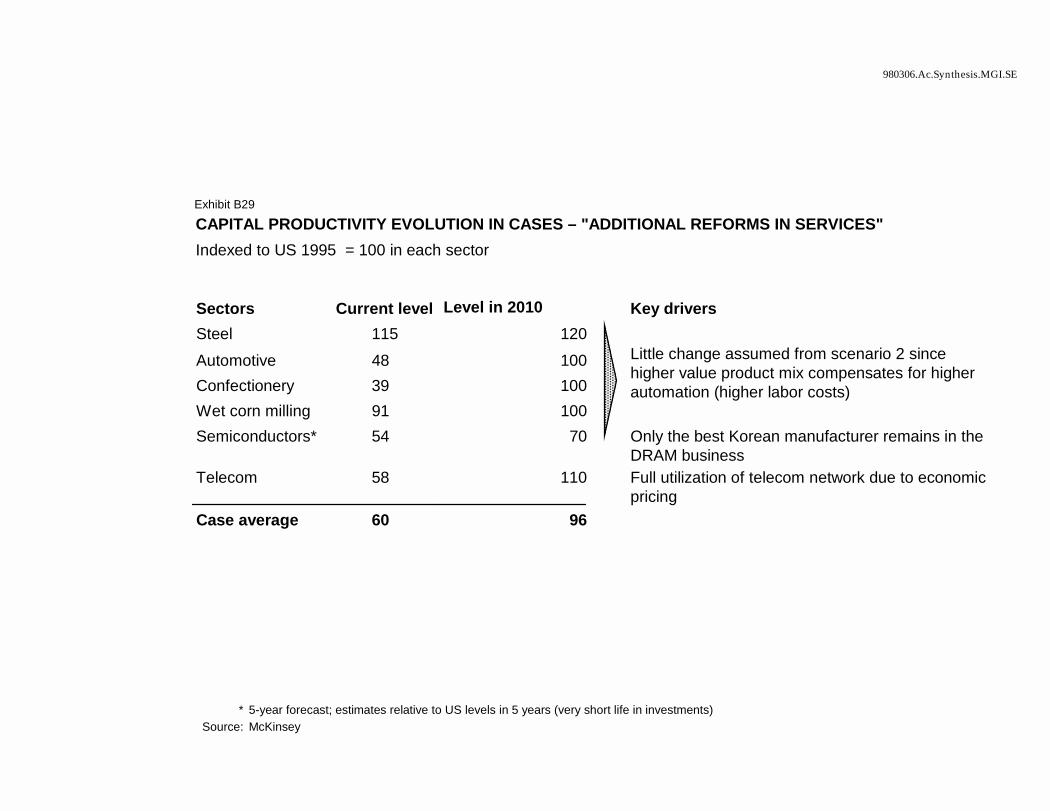
980306.Ac.Synthesis.MGI.SE
CAPITAL PRODUCTIVITY EVOLUTION IN CASES – "ADDITIONAL REFORMS IN SERVICES" Indexed to US 1995 = 100 in each sector
Sectors Current level Level in 2010 Key driversSteel 115 120
Little change assumed from scenario 2 since higher value product mix compensates for higher automation (higher labor costs)
Automotive 48 100Confectionery 39 100Wet corn milling 91 100Semiconductors* 54 70 Only the best Korean manufacturer remains in the
DRAM businessTelecom 58 110 Full utilization of telecom network due to economic
pricingCase average 60 96
* 5-year forecast; estimates relative to US levels in 5 years (very short life in investments)Source: McKinsey
Exhibit B29
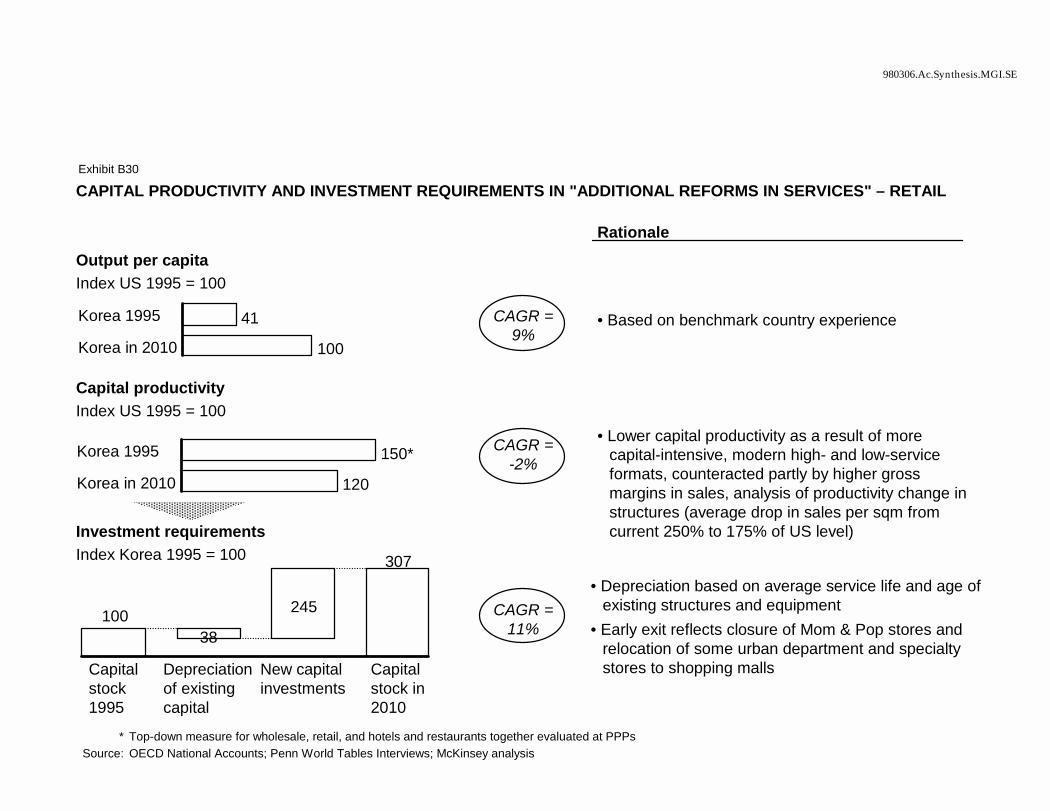
980306.Ac.Synthesis.MGI.SE
CAPITAL PRODUCTIVITY AND INVESTMENT REQUIREMENTS IN "ADDITIONAL REFORMS IN SERVICES" – RETAIL
41
100
Korea 1995
Korea in 2010
150*
120
Korea 1995
Korea in 2010
10038
245
307
Capitalstock1995
Depreciationof existingcapital
New capitalinvestments
Capitalstock in2010
Output per capitaIndex US 1995 = 100
Capital productivityIndex US 1995 = 100
Investment requirementsIndex Korea 1995 = 100
CAGR = 9%
CAGR = -2%
CAGR = 11%
• Based on benchmark country experience
• Lower capital productivity as a result of more capital-intensive, modern high- and low-service formats, counteracted partly by higher gross margins in sales, analysis of productivity change in structures (average drop in sales per sqm from current 250% to 175% of US level)
• Depreciation based on average service life and age of existing structures and equipment
• Early exit reflects closure of Mom & Pop stores and relocation of some urban department and specialty stores to shopping malls
Rationale
* Top-down measure for wholesale, retail, and hotels and restaurants together evaluated at PPPsSource: OECD National Accounts; Penn World Tables Interviews; McKinsey analysis
Exhibit B30
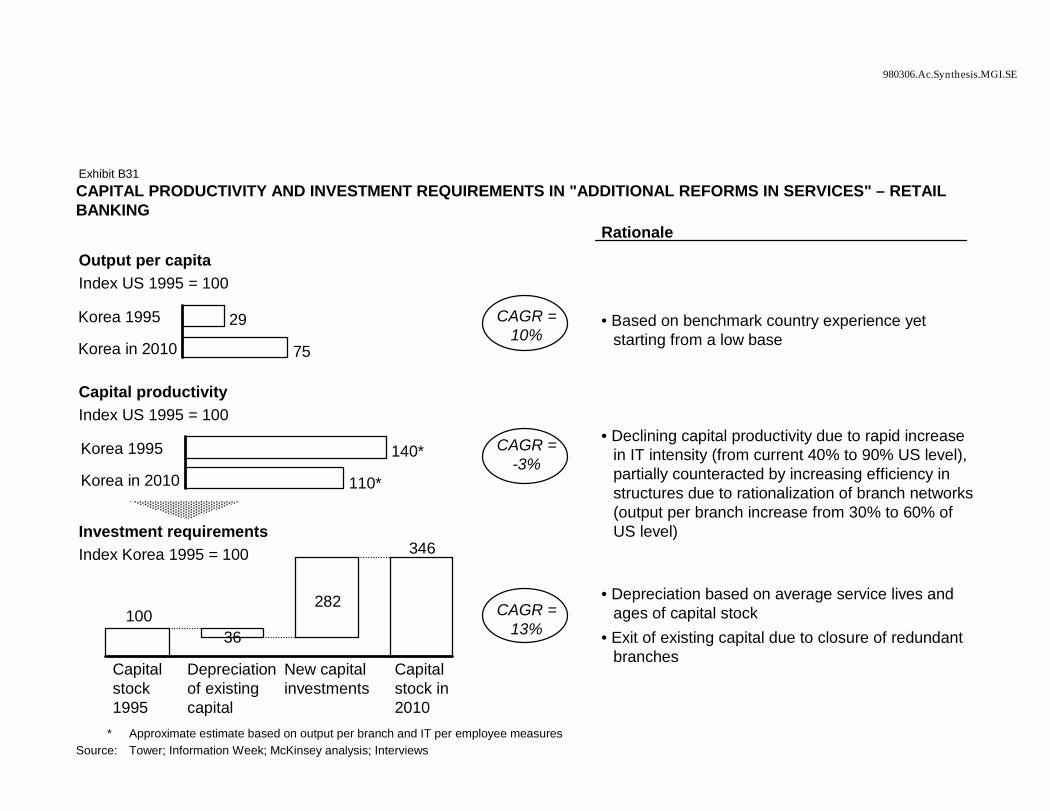
980306.Ac.Synthesis.MGI.SE
CAPITAL PRODUCTIVITY AND INVESTMENT REQUIREMENTS IN "ADDITIONAL REFORMS IN SERVICES" – RETAIL BANKING
29
75
Korea 1995
Korea in 2010
140*
110*
Korea 1995
Korea in 2010
10036
282
346
Capitalstock1995
Depreciationof existingcapital
New capitalinvestments
Capitalstock in2010
Output per capitaIndex US 1995 = 100
Capital productivityIndex US 1995 = 100
Investment requirementsIndex Korea 1995 = 100
CAGR = 10%
CAGR = -3%
CAGR = 13%
• Based on benchmark country experience yet starting from a low base
• Declining capital productivity due to rapid increase in IT intensity (from current 40% to 90% US level), partially counteracted by increasing efficiency in structures due to rationalization of branch networks (output per branch increase from 30% to 60% of US level)
• Depreciation based on average service lives and ages of capital stock
• Exit of existing capital due to closure of redundant branches
Rationale
* Approximate estimate based on output per branch and IT per employee measuresSource: Tower; Information Week; McKinsey analysis; Interviews
Exhibit B31
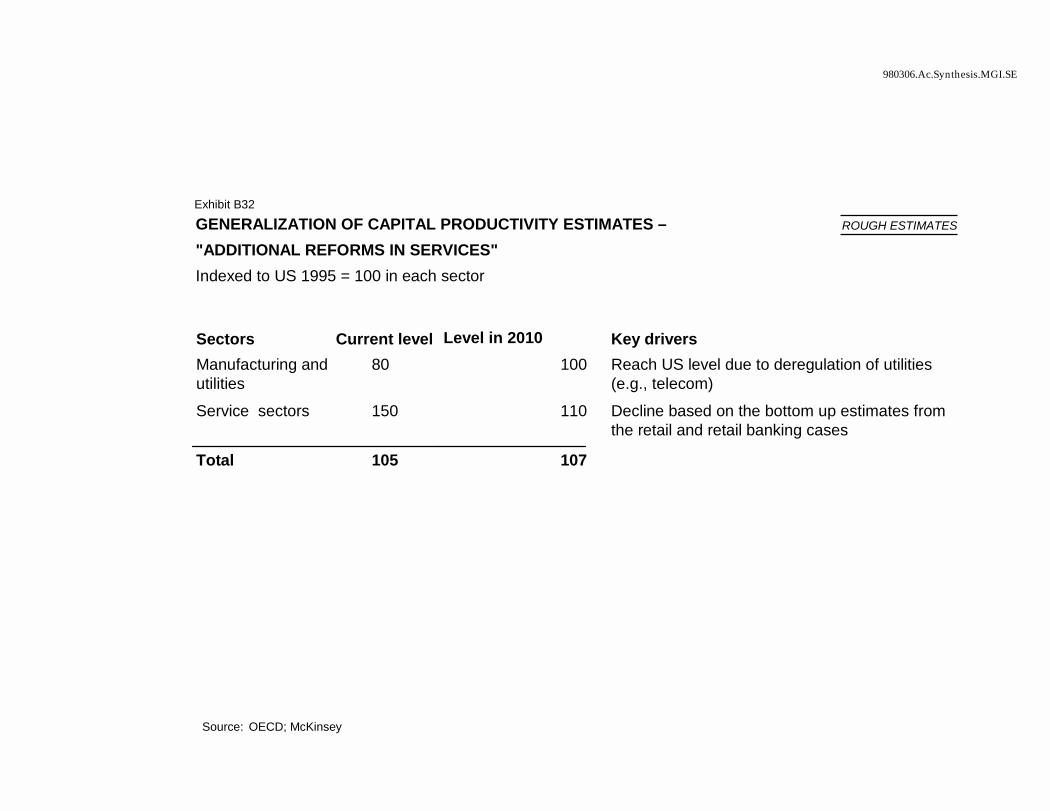
980306.Ac.Synthesis.MGI.SE
GENERALIZATION OF CAPITAL PRODUCTIVITY ESTIMATES –"ADDITIONAL REFORMS IN SERVICES" Indexed to US 1995 = 100 in each sector
Sectors Current level Level in 2010 Key driversManufacturing and utilities
80 100 Reach US level due to deregulation of utilities (e.g., telecom)
Service sectors 150 110 Decline based on the bottom up estimates from the retail and retail banking cases
Total 105 107
Source: OECD; McKinsey
Exhibit B32
ROUGH ESTIMATES
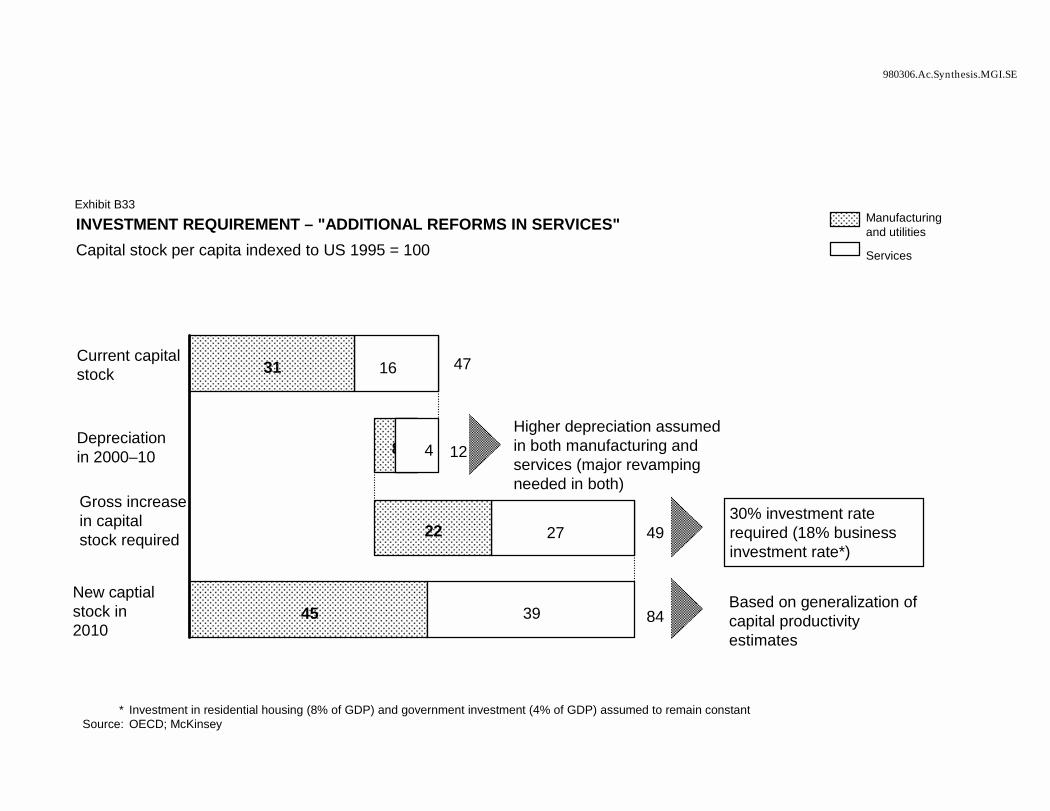
980306.Ac.Synthesis.MGI.SE
INVESTMENT REQUIREMENT – "ADDITIONAL REFORMS IN SERVICES"Capital stock per capita indexed to US 1995 = 100
8
45
31
22
39
Current capital stock
Depreciationin 2000–10
Gross increasein capitalstock required
New captialstock in 2010
* Investment in residential housing (8% of GDP) and government investment (4% of GDP) assumed to remain constantSource: OECD; McKinsey
Manufacturing and utilities
Services
Higher depreciation assumed in both manufacturing and services (major revamping needed in both)
30% investment rate required (18% business investment rate*)
Based on generalization of capital productivity estimates
Exhibit B33
4
16
27
47
12
84
49
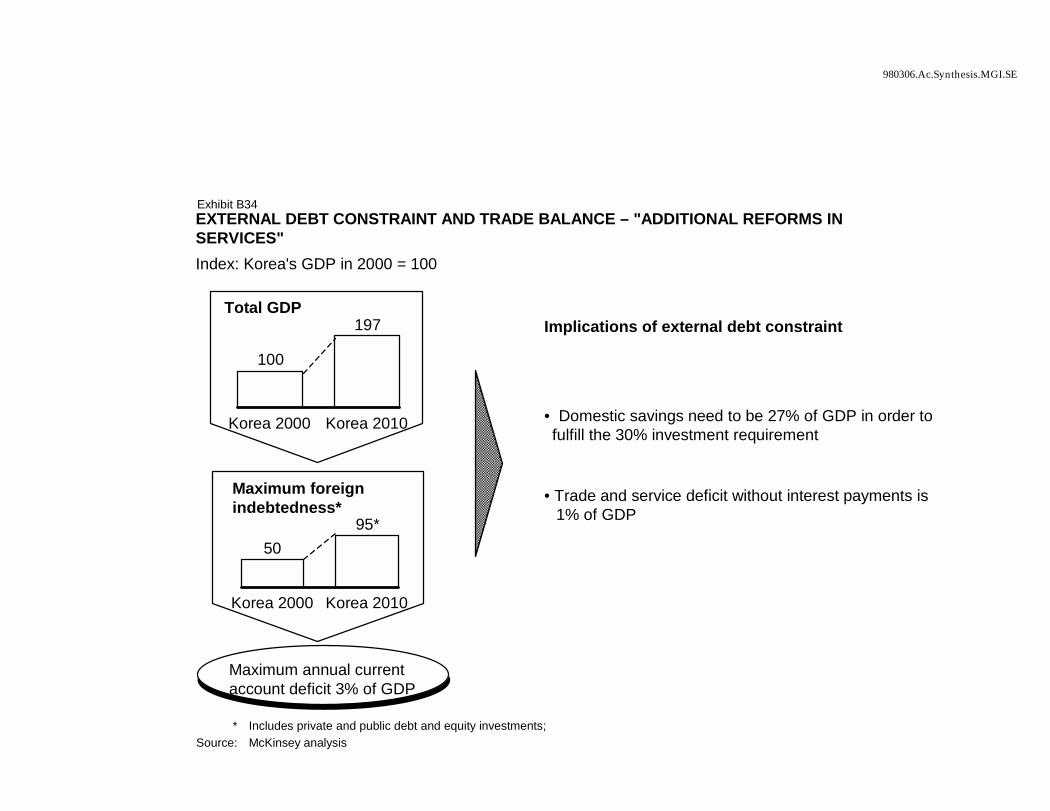
980306.Ac.Synthesis.MGI.SE
EXTERNAL DEBT CONSTRAINT AND TRADE BALANCE – "ADDITIONAL REFORMS IN SERVICES"Index: Korea's GDP in 2000 = 100
* Includes private and public debt and equity investments;Source: McKinsey analysis
Total GDP
100
197
Korea 2000 Korea 2010
Maximum foreign indebtedness*
5095*
Korea 2000 Korea 2010
Maximum annual current account deficit 3% of GDP
Implications of external debt constraint
• Domestic savings need to be 27% of GDP in order to fulfill the 30% investment requirement
• Trade and service deficit without interest payments is 1% of GDP
Exhibit B34
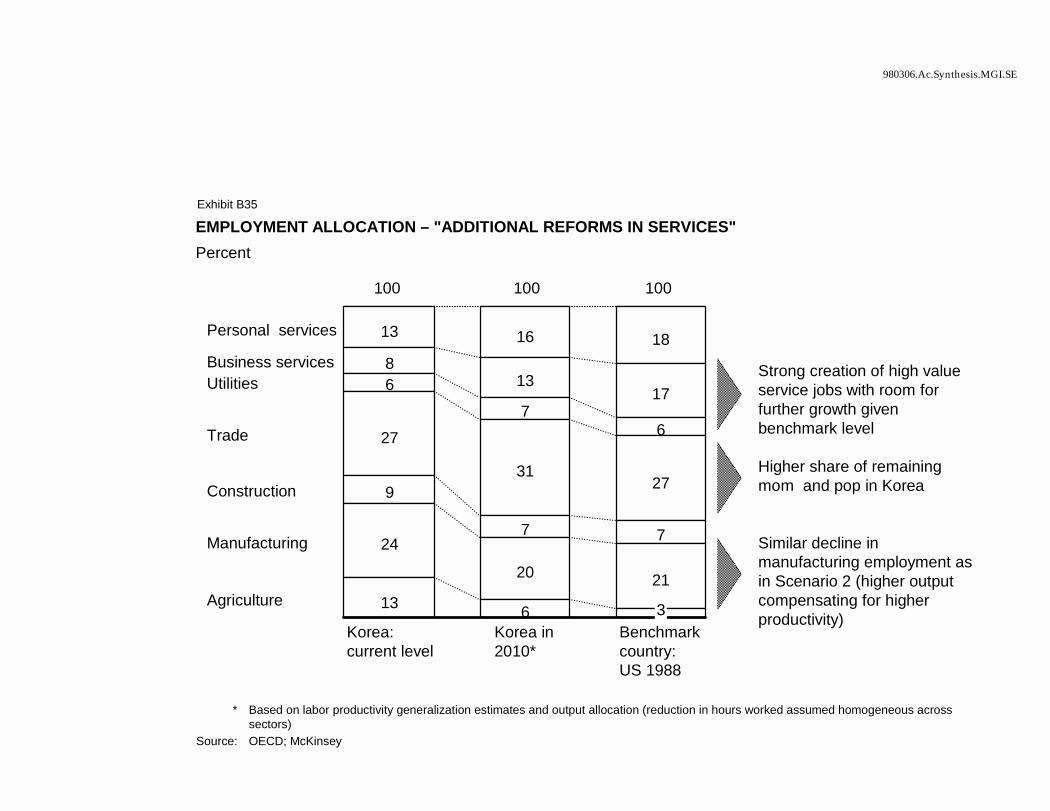
980306.Ac.Synthesis.MGI.SE
Personal services 13 16 18Business services 8
1317Utilities 6
76Trade 27
3127Construction 9
7 7Manufacturing 24
20 21Agriculture 13 6
Korea:current level
Korea in 2010*
Benchmark country: US 1988
* Based on labor productivity generalization estimates and output allocation (reduction in hours worked assumed homogeneous acrosssectors)
Source: OECD; McKinsey
100 100 100
Strong creation of high value service jobs with room for further growth given benchmark level
Higher share of remaining mom and pop in Korea
Similar decline in manufacturing employment as in Scenario 2 (higher output compensating for higher productivity)
Exhibit B35
EMPLOYMENT ALLOCATION – "ADDITIONAL REFORMS IN SERVICES" Percent
3
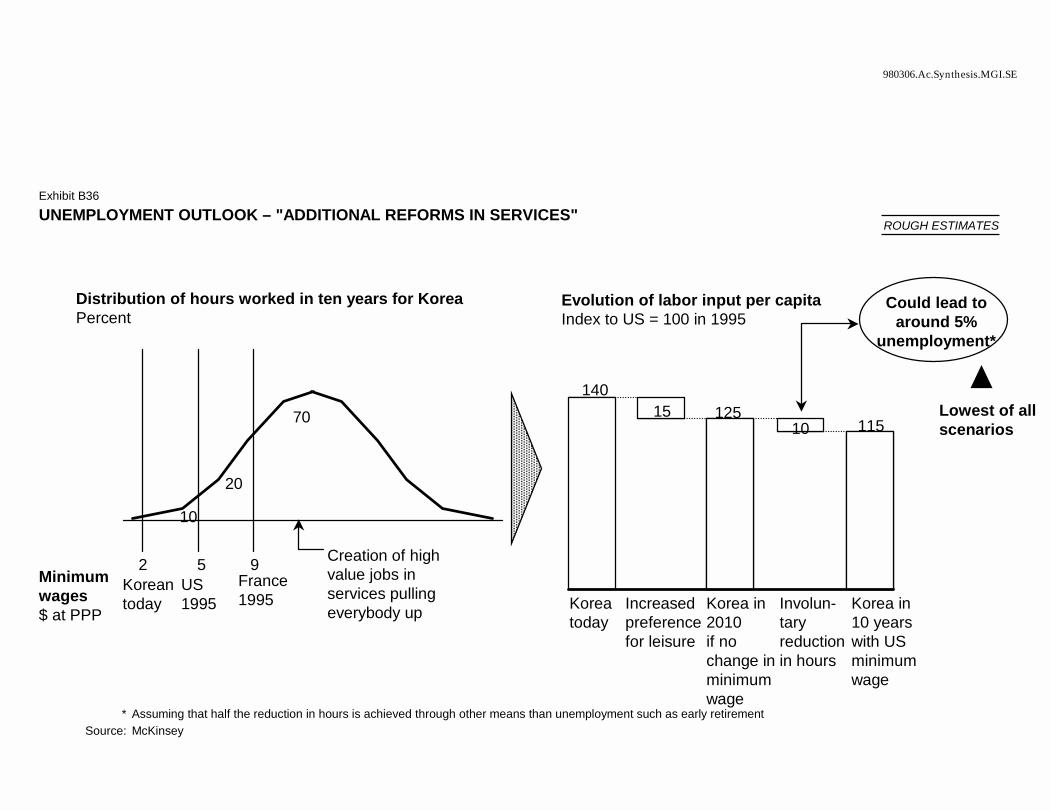
980306.Ac.Synthesis.MGI.SE
* Assuming that half the reduction in hours is achieved through other means than unemployment such as early retirementSource: McKinsey
Exhibit B36
UNEMPLOYMENT OUTLOOK – "ADDITIONAL REFORMS IN SERVICES"
14015 125
10 115
Could lead to around 5%
unemployment*
Increased preference for leisure
Korea in 2010 if no change in minimum wage
Involun-taryreduction in hours
Korea in 10 years with US minimum wage
Lowest of all scenarios
10
20
70
Korean today
US 1995
France 1995
2 5 9 Creation of high value jobs in services pulling everybody up
Evolution of labor input per capitaIndex to US = 100 in 1995
Korea today
Minimum wages$ at PPP
Distribution of hours worked in ten years for KoreaPercent
ROUGH ESTIMATES