Embed Size (px)
Citation preview

PRODUCTIVITY IMPROVEMENT IN GARMENTS
INDUSTRY THROUGH CELLULAR MANUFACTURING
APPROACH
RUPALI BISWAS
DEPARTMENT OF INDUSTRIAL & PRODUCTION ENGINEERING
BANGLADESH UNIVERSITY OF ENGINEERING AND TECHNOLOGY
DHAKA-1000, BANGLADESH
APRIL 2013

ii
PRODUCTIVITY IMPROVEMENT IN GARMENTS
INDUSTRY THROUGH CELLULAR MANUFACTURING
APPROACH
By
RUPALI BISWAS
A thesis submitted to the Department of Industrial and Production Engineering, Bangladesh
University of Engineering and Technology, in partial fulfillment of the requirements for the degree of
Master of Science in Industrial and Production Engineering.
DEPARTMENT OF INDUSTRIAL & PRODUCTION ENGINEERING
BANGLADESH UNIVERSITY OF ENGINEERING AND TECHNOLOGY
DHAKA-1000, BANGLADESH
APRIL 2013
iii
CERTIFICATE OF APPROVAL
The thesis titled “PRODUCTIVITY IMPROVEMENT IN GARMENTS INDUSTRY
THROUGH CELLULAR MANUFACTURING APPROACH” submitted by Rupali Biswas,
Roll No. 040808003(F), Session: April 2008 has been accepted as satisfactory in partial fulfillment
of the requirements for the degree of Master of Science in Industrial and Production
Engineering on 24 April 2013.
BOARD OF EXAMINERS
Dr. M. Ahsan Akhtar Hasin Chairman Professor (Supervisor) Department of Industrial and Production Engineering BUET, Dhaka-1000.
Dr. Abdullahil Azeem Member Professor and Head (Ex-officio) Department of Industrial and Production Engineering BUET, Dhaka-1000.
Dr. Sultana Parveen Member Associate Professor Department of Industrial and Production Engineering BUET, Dhaka-1000. Dr. Md. Nazrul Islam Member Director (External) National Productivity Organization (NPO) Ministry of Industry, Govt. of Bangladesh

iv
CANDIDATE’S DECLARATION
It is hereby declared that this thesis or any part of it has not been submitted elsewhere for the award
of any degree or diploma.
------------------ Rupali Biswas

v
DEDICATION
This thesis is dedicated to my parents whose tireless encouragement helps me to advance in future.
vi
ACKNOWLEDGEMENT
First, I am very much grateful to the most powerful, the gracious almighty Allah for giving me
knowledge, energy and patience for completing the thesis work successfully.
I would like to express my deepest indebtedness and gratitude to my thesis supervisor, Dr. M. Ahsan
Akhtar Hasin, Professor, Department of Industrial and Production Engineering (IPE), Bangladesh
University of Engineering and Technology (BUET), Dhaka, for his continuous guidance, invaluable
suggestions, constructive comments and endless encouragement throughout the progress of this
research work and the preparation of this thesis.
I am very much thankful to Md. Momenul Hoque, Incharge (IE), and other staffs of Lean
transformation team, HR Textile Mills Ltd. Saver, for their cordial support and cooperation by
providing me the respective information, valuable time and great support during the assessment and
implementation phase while I was working there as BKMEA consultant and also for my thesis work.
I am also thankful to my friend Engr. Anawer Sadath, Assistant manager (IE), Interstoff Apparels
Ltd. and Engr. Mamun Mahmud, Assistant manager (Planning), Interstoff Apparels Ltd. for their
support and cooperation.
In addition, thanks are due to those who helped me directly and indirectly during the different stages
of the thesis work.
Finally, I would like to convey my sincere gratitude to my parents whose continuous inspiration,
sacrifice and support encouraged me to complete the thesis successfully.
Rupali Biswas
vii
ABSTRACT
Productivity isn’t everything, but in the long run it is almost everything. Differences in GDP growth
across countries are largely due to differences in productivity growth. In Bangladesh labor
productivity is lower than that of many other competitor countries. But the low labor cost is the
primary factor that makes Bangladesh a place for outsourcing the production of RMG products.
However, low productivity is the main limitation for the garments industry in Bangladesh. As such,
application of operations management tools and techniques is essential to increase productivity.
Elimination of global textile and apparel trade quotas on January 1, 2005 has brought a dramatic shift
in the world market of textile and apparel products. The apparel industry faces a great competition
among different countries. The key factors of the competition are the Cost, Quality and Lead Time. In
the context of fierce global market competition, product prices are declining and Buyers are
demanding shorter Lead Times with good Quality. A number of measures should be undertaken to
substantially improve productivity. One of the most important tool to be implemented is Cellular
Manufacturing (Team work) system.
Cellular Manufacturing (Team work) is an approach that helps build a variety of products with as
little waste as possible. This is inline with Lean Manufacturing philosophy also. Equipment and
workstations are arranged in a sequence that creates better workers movement from the inside of the
work area which supports a smooth flow of material and components through the process, with
minimal transport or delay. Here the main idea is team work – not how many products are processed
by one worker, but how many quality products are completed by the line as a whole. Continuous flow
processing in this work cell is inherently more flexible, more visual, and more efficient, since it
eliminates unnecessary movements and enhances communications. These features also make
managing the production team easier. Once “Flow Lines” based on product groups have been created,
the rate of production can be matched to customer demand.
This thesis aims at developing the right approach to implement Cellular Manufacturing System
through reduction of WIP inventory, reduction of material movements and handling and so forth. It is
expected that these will increase productivity significantly.
viii
TABLE OF CONTENTS
CONTENTS PAGE NO
Acknowledgement vi
Abstract vii
List of Tables xiii
List of Figures xiv
List of Abbreviation xvi
CHAPTER – 1: INTRODUCTION
1.1 Introduction 1
1.2 Background of the Thesis 3
1.3 Objectives with Special Aims and Possible Outcomes of The Study 4
1.4 Outline of Methodology 4
CHAPTER – 2: LITERATURE REVIEW
2.1 Introduction 5
2.2 Historical Background of Cellular Manufacturing 6
2.3 Introduction to Lean Manufacturing 6
2.3.1 Lean Manufacturing Definitions 7
2.3.2 Toyota ways - 14 Principles 8
2.3.3 Toyota – 4 Rules 8
2.3.4 Principles of Lean Manufacturing 9
2.4 Focus on Waste Identification 10
2.5 Lean Tools 13
2.5.1 Value Stream Mapping (VSM) 13
2.5.2 Cellular Manufacturing 15

ix
2.5.3 Quick Changeover / Set up Reduction 17
2.5.4 5S (Workplace Organization) 20
2.5.5 Visual Control System 24
2.5.6 Kaizen (Continuous Improvement) 26
2.5.7 Kanban 27
2.5.8 Supermarkets 28
2.5.9 Pull Production System 28
2.5.10 Pull Quality System 29
2.6 Supporting Strategies for Lean 30
2.6.1 Takt Time 30
2.6.2 Team Building 30
2.6.3 Balanced Flow 31
2.6.4 Quality at the Source 31
2.6.5 Zero Quality Control 32
2.6.6 Poka - Yoke (Mistake-Proofing) 32
2.6.7 Employee Involvement 33
2.6.8 Stabilized Operations 34
2.6.9 Standardized Work 34
2.6.10 Equipment Replacement 35
2.6.11 Continuous Improvement 35
CHAPTER – 3: ESTABLISHING CELLULAR LAYOUT
3.1 Introduction 36
3.2 Cell Design 36
3.3 Planning and Preparation to design U-Shaped Cell 37
3.3.1 Initial Approach with Upper Management 37
3.3.2 Preparation Set Up of U – Shaped Cell 38
3.3.3 Design U – Shaped Cell 38
x
3.4 Planning, Preparing and Stabilizing the Concept 39
3.4.1 Selection of the Team 39
3.4.2 Evaluation Prior to Implementation 40
3.4.3 Management System, Responsibilities and Procedures 40
3.4.4 Team Criteria 41
3.4.5 Flexibility Development 41
CHAPTER – 4: ORGANIZATIONAL PROFILE
4.1 Factory Profile 42
4.2 Management System Attributes 42
4.2.1 Quality Practices 42
4.2.2 Planning Department 43
4.2.3 Labor 44
4.2.4 Industrial Engineering 44
4.3 Factory Performance 45
4.3.1 Financial Issues 45
4.3.2 Production and set-up issues 45
4.3.3 Labor Issues 46
4.3.4 Management Issues 46
4.3.5 Quality Issues 47
CHAPTER – 5: WORK PLAN: CURRENT STATE
5.1 Assessment (Current State) 48
5.2 Lean Metrics – Findings 49
CHAPTER – 6: IMPLEMENTING TRIAL PILOT (CELLULAR LAYOUT)
6.1 Cellular Manufacturing (Cellular Layout) 57
xi
6.2 Common Benefits Associated with Cellular Line 58
6.3 Achievements 58
6.3.1 Efficiency Status 58
6.3.2 Quality Status 59
6.3.3 WIP Status 60
6.3.4 Changeover Time Status 61
6.3.5 Throughput Time Status 61
6.4 Overall Scenario 62
CHAPTER – 7: IMPLEMENTING LINE BALANCING ALGORITHMS
7.1 Introduction 63
7.2 Objectives of Line Balancing 63
7.3 Terminology for Line Balancing 64
7.3.1 Minimum Rational Work Element (Cycle Time) 64
7.3.2 Total Work Content & Takt Time 64
7.3.3 Bottleneck Cycle Time 64
7.3.4 Precedence Constraints 64
7.3.5 Precedence Diagram 65
7.3.6 Balance Delay (Balancing Loss) & Line Balancing Efficiency 65
7.4 Steps for Line Balancing 65
7.5 Assembly Line Balancing 66
7.5.1 Precedence Diagram 68
7.5.2 Performance Criteria for Assembly Line Balancing 69
7.6 Line Balancing Algorithms 69
7.6.1 Largest-Candidate Rule (LCR) 69
7.6.2 Kilbridge and Wester Method (KWM) 72
7.6.3 Ranked Positional Weights Method (RPW) 74
7.6.4 Compare LCR, K-W, and RPW 76
xii
7.7 Factors Affecting Line Balancing & Problems Encountered 77
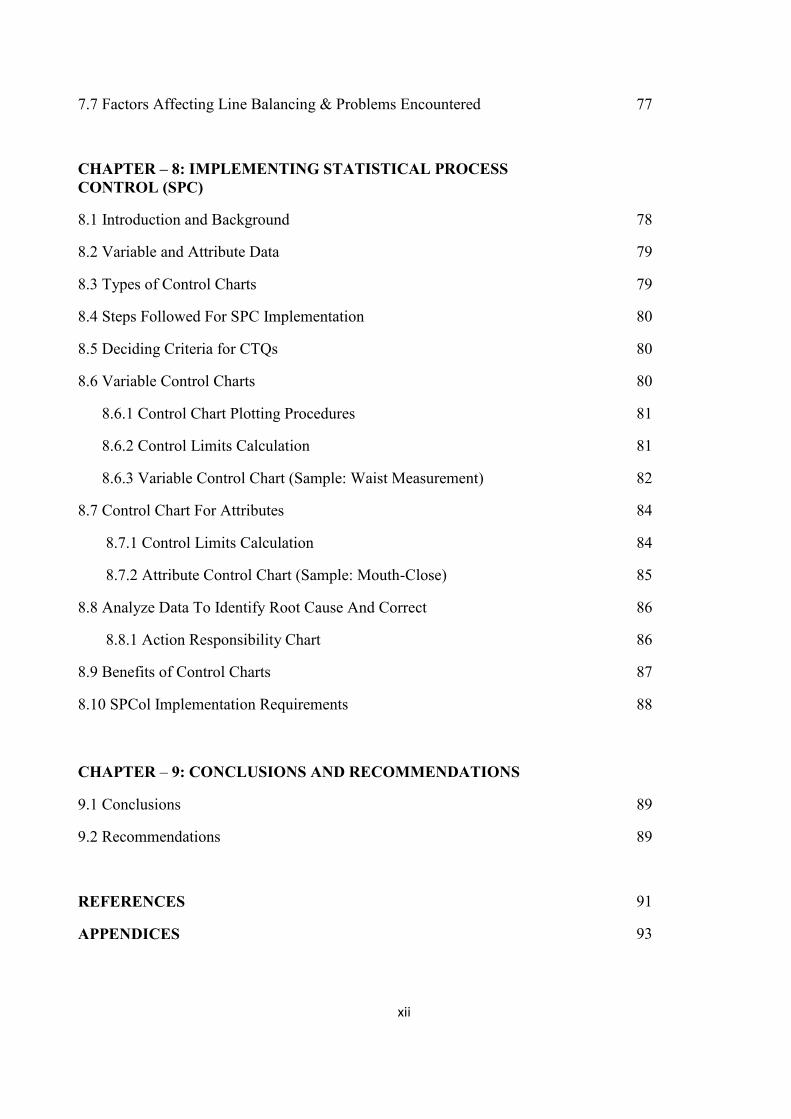
CHAPTER – 8: IMPLEMENTING STATISTICAL PROCESS CONTROL (SPC)
8.1 Introduction and Background 78
8.2 Variable and Attribute Data 79
8.3 Types of Control Charts 79
8.4 Steps Followed For SPC Implementation 80
8.5 Deciding Criteria for CTQs 80
8.6 Variable Control Charts 80
8.6.1 Control Chart Plotting Procedures 81
8.6.2 Control Limits Calculation 81
8.6.3 Variable Control Chart (Sample: Waist Measurement) 82
8.7 Control Chart For Attributes 84
8.7.1 Control Limits Calculation 84
8.7.2 Attribute Control Chart (Sample: Mouth-Close) 85
8.8 Analyze Data To Identify Root Cause And Correct 86
8.8.1 Action Responsibility Chart 86
8.9 Benefits of Control Charts 87
8.10 SPCol Implementation Requirements 88
CHAPTER – 9: CONCLUSIONS AND RECOMMENDATIONS
9.1 Conclusions 89
9.2 Recommendations 89
REFERENCES 91
APPENDICES 93

xiii
LIST OF TABLES
LIST OF TABLES PAGE NO
Table 5.1: Lead Time and Time Utilization Analysis 49
Table 5.2: Unnecessary activities 51
Table 5.3: Inventories and Work In Progress 51
Table 5.4: Quality Rework Analysis 52
Table 5.5: Changeover Time Analysis 53
Table 5.6: Productivity Analysis 53
Table 5.7: Time Utilization Analysis 54
Table 5.8: Summary of Current State 55
Table 5.9: The wide-ranging categories affecting the Cost and Lead Time 56
Table 6.1: Comparison of Efficiency Status 58
Table 6.2: Comparison of Quality Alter 59
Table 6.3: Comparison of WIP Status 60
Table 6.4: Comparison of Line Balancing Status 60
Table 6.5: Comparison of Changeover Time 61
Table 6.6: Comparison of Throughput Time 61
Table 7.1: Work Elements for Ladies T-Shirt Sewing 67
Table 7.2: Line Balancing Comparison 76
xiv
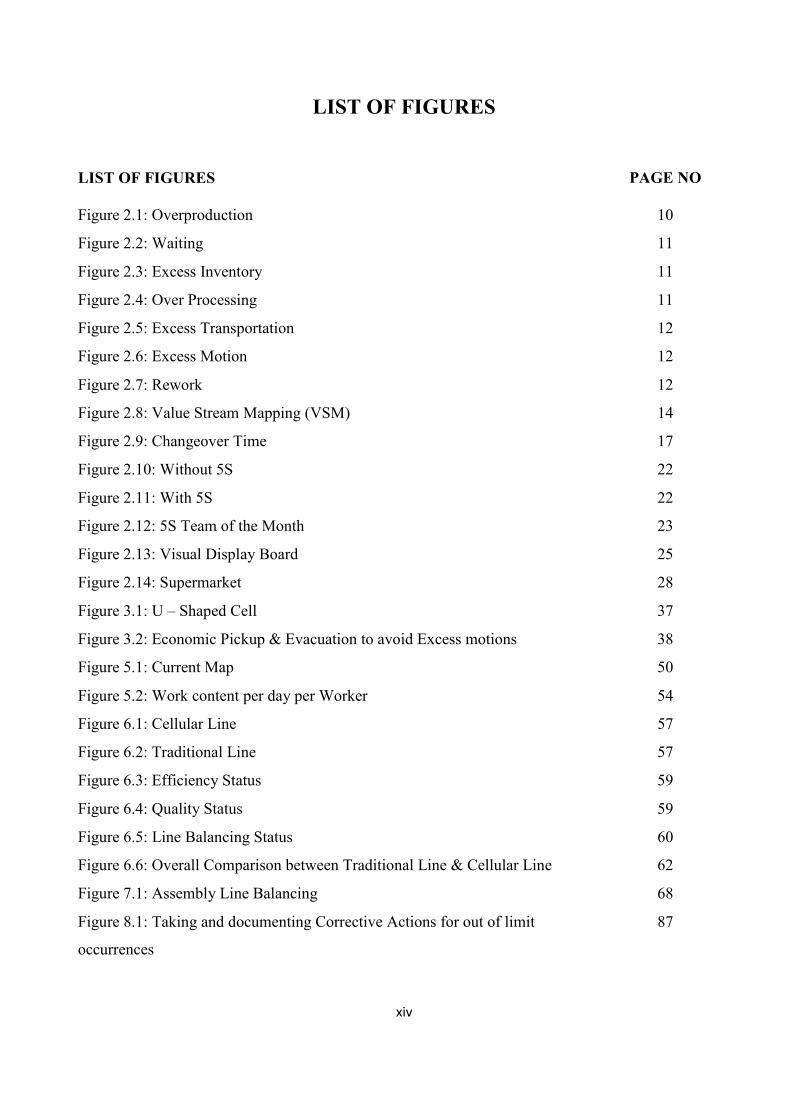
LIST OF FIGURES
LIST OF FIGURES PAGE NO
Figure 2.1: Overproduction 10
Figure 2.2: Waiting 11
Figure 2.3: Excess Inventory 11
Figure 2.4: Over Processing 11
Figure 2.5: Excess Transportation 12
Figure 2.6: Excess Motion 12
Figure 2.7: Rework 12
Figure 2.8: Value Stream Mapping (VSM) 14
Figure 2.9: Changeover Time 17
Figure 2.10: Without 5S 22
Figure 2.11: With 5S 22
Figure 2.12: 5S Team of the Month 23
Figure 2.13: Visual Display Board 25
Figure 2.14: Supermarket 28
Figure 3.1: U – Shaped Cell 37
Figure 3.2: Economic Pickup & Evacuation to avoid Excess motions 38
Figure 5.1: Current Map 50
Figure 5.2: Work content per day per Worker 54
Figure 6.1: Cellular Line 57
Figure 6.2: Traditional Line 57
Figure 6.3: Efficiency Status 59
Figure 6.4: Quality Status 59
Figure 6.5: Line Balancing Status 60
Figure 6.6: Overall Comparison between Traditional Line & Cellular Line 62
Figure 7.1: Assembly Line Balancing 68
Figure 8.1: Taking and documenting Corrective Actions for out of limit
occurrences
87
xv
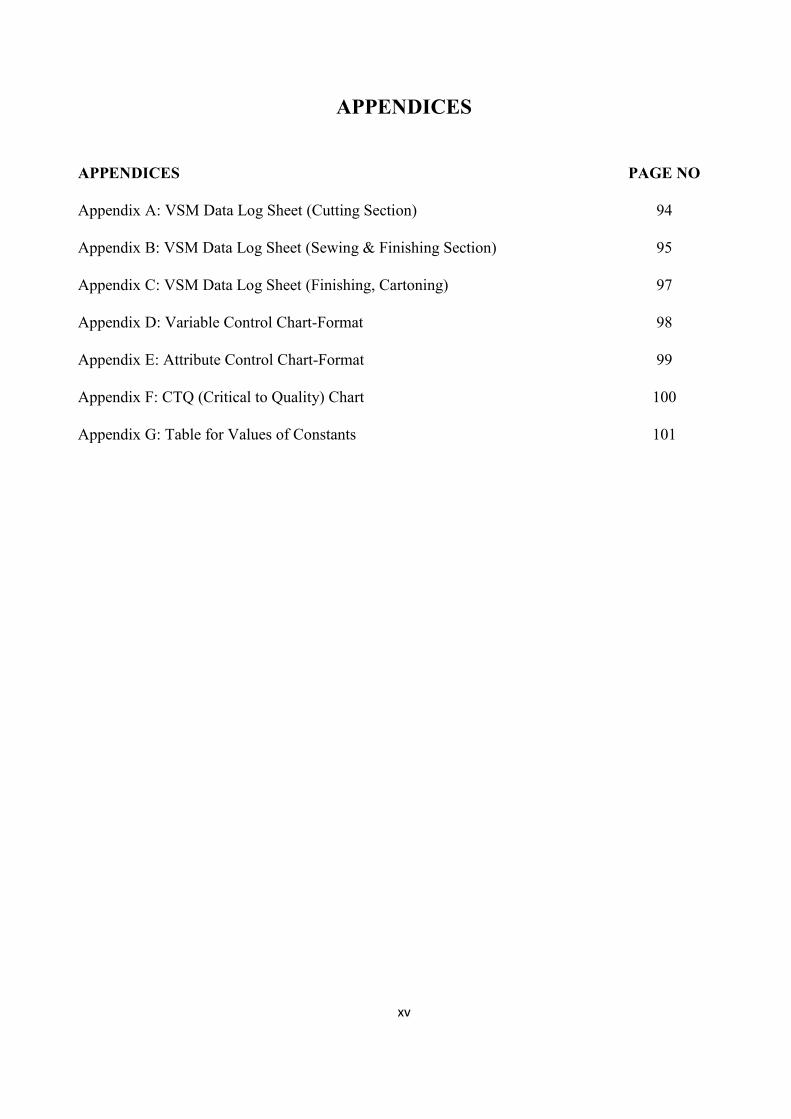
APPENDICES
APPENDICES PAGE NO
Appendix A: VSM Data Log Sheet (Cutting Section) 94
Appendix B: VSM Data Log Sheet (Sewing & Finishing Section) 95
Appendix C: VSM Data Log Sheet (Finishing, Cartoning) 97
Appendix D: Variable Control Chart-Format 98
Appendix E: Attribute Control Chart-Format 99
Appendix F: CTQ (Critical to Quality) Chart 100
Appendix G: Table for Values of Constants 101
xvi
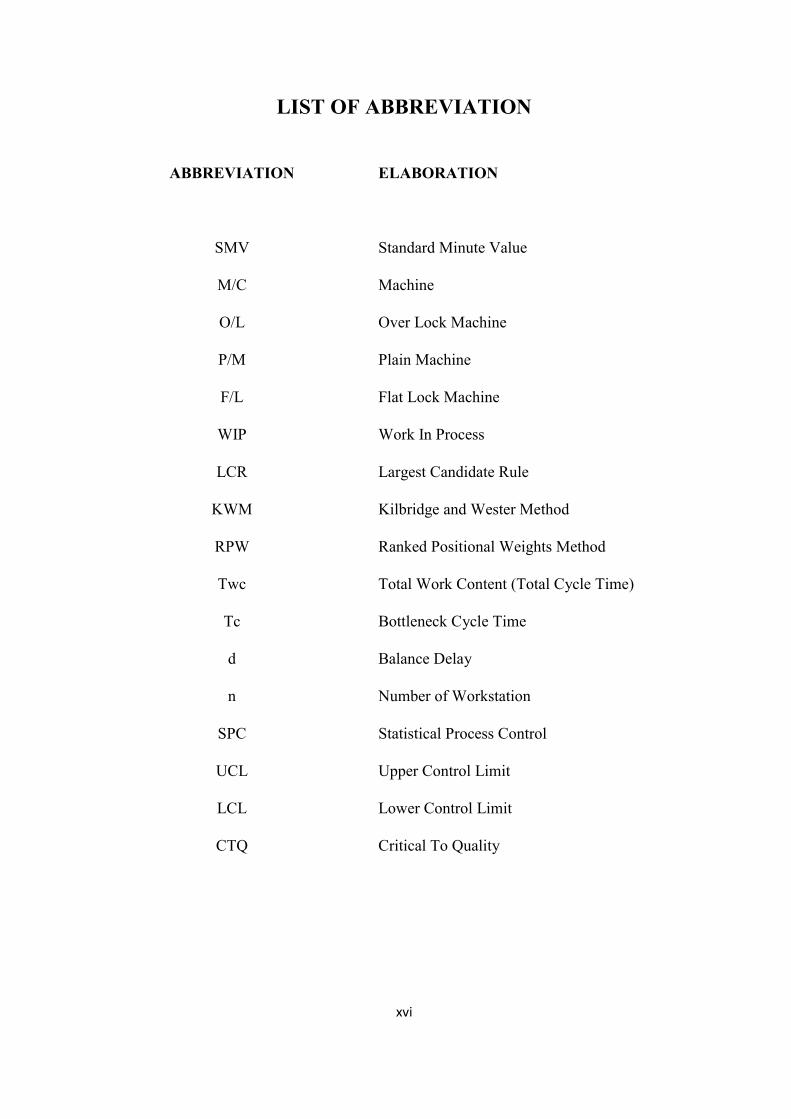
LIST OF ABBREVIATION
ABBREVIATION ELABORATION
SMV Standard Minute Value
M/C Machine
O/L Over Lock Machine
P/M Plain Machine
F/L Flat Lock Machine
WIP Work In Process
LCR Largest Candidate Rule
KWM Kilbridge and Wester Method
RPW Ranked Positional Weights Method
Twc Total Work Content (Total Cycle Time)
Tc Bottleneck Cycle Time
d Balance Delay
n Number of Workstation
SPC Statistical Process Control
UCL Upper Control Limit
LCL Lower Control Limit
CTQ Critical To Quality
- 1 -
CHAPTER – 1
INTRODUCTION
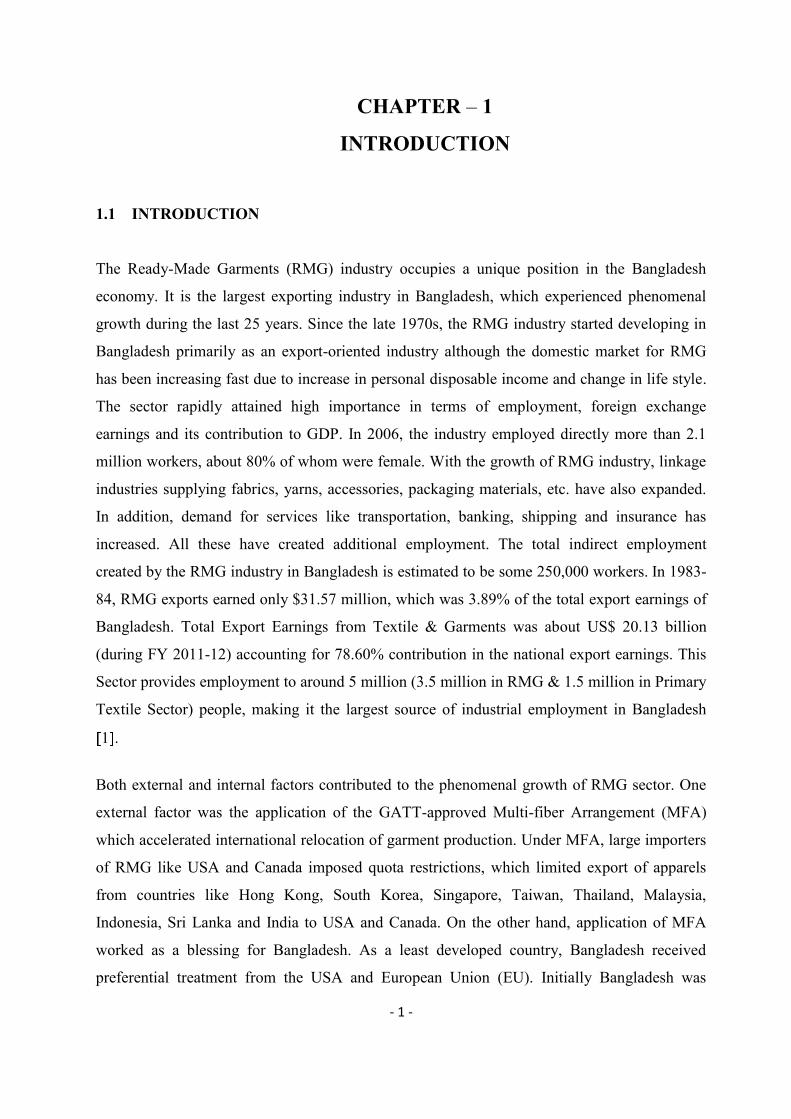
1.1 INTRODUCTION
The Ready-Made Garments (RMG) industry occupies a unique position in the Bangladesh
economy. It is the largest exporting industry in Bangladesh, which experienced phenomenal
growth during the last 25 years. Since the late 1970s, the RMG industry started developing in
Bangladesh primarily as an export-oriented industry although the domestic market for RMG
has been increasing fast due to increase in personal disposable income and change in life style.
The sector rapidly attained high importance in terms of employment, foreign exchange
earnings and its contribution to GDP. In 2006, the industry employed directly more than 2.1
million workers, about 80% of whom were female. With the growth of RMG industry, linkage
industries supplying fabrics, yarns, accessories, packaging materials, etc. have also expanded.
In addition, demand for services like transportation, banking, shipping and insurance has
increased. All these have created additional employment. The total indirect employment
created by the RMG industry in Bangladesh is estimated to be some 250,000 workers. In 1983-
84, RMG exports earned only $31.57 million, which was 3.89% of the total export earnings of
Bangladesh. Total Export Earnings from Textile & Garments was about US$ 20.13 billion
(during FY 2011-12) accounting for 78.60% contribution in the national export earnings. This
Sector provides employment to around 5 million (3.5 million in RMG & 1.5 million in Primary
Textile Sector) people, making it the largest source of industrial employment in Bangladesh
1 .
Both external and internal factors contributed to the phenomenal growth of RMG sector. One
external factor was the application of the GATT-approved Multi-fiber Arrangement (MFA)
which accelerated international relocation of garment production. Under MFA, large importers
of RMG like USA and Canada imposed quota restrictions, which limited export of apparels
from countries like Hong Kong, South Korea, Singapore, Taiwan, Thailand, Malaysia,
Indonesia, Sri Lanka and India to USA and Canada. On the other hand, application of MFA
worked as a blessing for Bangladesh. As a least developed country, Bangladesh received
preferential treatment from the USA and European Union (EU). Initially Bangladesh was

- 2 -
granted quota-free status. To maintain competitive edge in the world markets, the traditionally
large suppliers/producers of apparels followed a strategy of relocating RMG factories in
countries, which were free from quota restrictions and at the same time had enough trainable
cheap labor. So RMG industry grew in Bangladesh 1 .
But there are several weaknesses of the RMG industry of Bangladesh. Labor productivity in
the RMG sector of Bangladesh is lower than many of its competitors. Bangladeshi workers are
not as efficient as those of Hong Kong, South Korea and some other countries and in most
factories, operational systems, technologies used are not the latest. So day by day RMG of
Bangladesh is facing cut throat competition and challenge in the global market. This is because
of reduction in buyer’s price but demanding shorter Lead Times with good Quality, and
increase in manufacturing cost.
In this crucial moment factory management techniques of yesterday must be replaced by more
efficient methods that greatly minimize waste, reduce costs, lead time and improve quality
bringing in maximum value to customers. Lean Manufacturing System doesn’t tolerate any
kind of waste such as overproduction, waiting, WIP, processing waste, transportation, motion,
making defective products, underutilized people etc. Lean Manufacturing is a whole-systems
approach that creates a culture in which everyone in the organization continuously improves
processes and production. So, we can say Lean is the ultimate solution. A number of measures
should be undertaken to substantially improve productivity. One of the most important tool to
be implemented is Cellular Manufacturing (Team work) approach that helps build a variety of
products with as little waste as possible. This is inline with Lean Manufacturing philosophy
also 3 .
The thesis work aims at the application of different Lean Manufacturing concepts, including
the establishment of Cellular Manufacturing system in the Garments Industry.
- 3 -
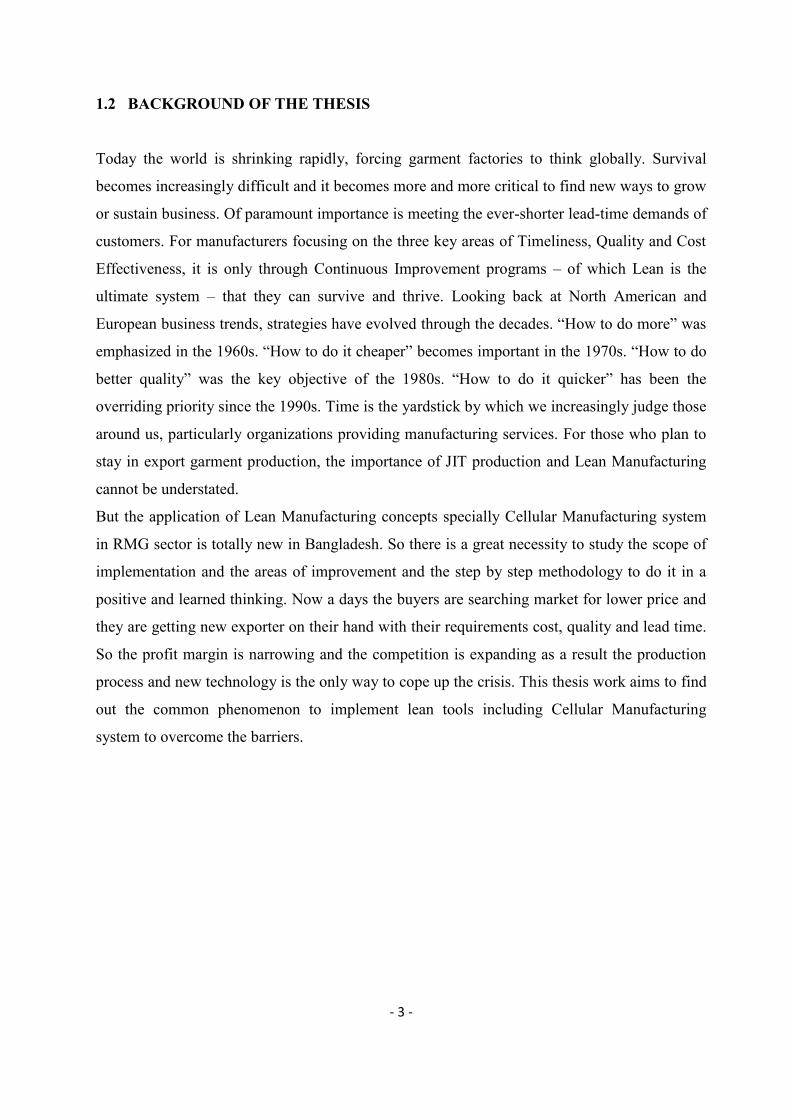
1.2 BACKGROUND OF THE THESIS
Today the world is shrinking rapidly, forcing garment factories to think globally. Survival
becomes increasingly difficult and it becomes more and more critical to find new ways to grow
or sustain business. Of paramount importance is meeting the ever-shorter lead-time demands of
customers. For manufacturers focusing on the three key areas of Timeliness, Quality and Cost
Effectiveness, it is only through Continuous Improvement programs – of which Lean is the
ultimate system – that they can survive and thrive. Looking back at North American and
European business trends, strategies have evolved through the decades. “How to do more” was
emphasized in the 1960s. “How to do it cheaper” becomes important in the 1970s. “How to do
better quality” was the key objective of the 1980s. “How to do it quicker” has been the
overriding priority since the 1990s. Time is the yardstick by which we increasingly judge those
around us, particularly organizations providing manufacturing services. For those who plan to
stay in export garment production, the importance of JIT production and Lean Manufacturing
cannot be understated.
But the application of Lean Manufacturing concepts specially Cellular Manufacturing system
in RMG sector is totally new in Bangladesh. So there is a great necessity to study the scope of
implementation and the areas of improvement and the step by step methodology to do it in a
positive and learned thinking. Now a days the buyers are searching market for lower price and
they are getting new exporter on their hand with their requirements cost, quality and lead time.
So the profit margin is narrowing and the competition is expanding as a result the production
process and new technology is the only way to cope up the crisis. This thesis work aims to find
out the common phenomenon to implement lean tools including Cellular Manufacturing
system to overcome the barriers.

- 4 -
1.3 OBJECTIVES WITH SPECIAL AIMS AND POSSIBLE OUTCOMES OF THE
STUDY
The specific objectives of the present research work are as follows:
a. Reduction of idle time in the production line through line balancing.
b. Reduction of materials movement time through change in facility layout.
c. Measurement of quality status through quantitative indices.
d. Measurement of Productivity.
e. Identification of necessary measures to implement Cellular Manufacturing System
to maximize labor utilization time and minimize waste (Non-Value-Added
activities).
The major outcomes of this research are:
a. A comprehensive guideline as to how to implement Cellular Manufacturing System
in the garments industry.
b. A prototype model of Cellular Manufacturing system.
1.4 OUTLINE OF METHODOLOGY
The step-by-step methodology of the study will be as follows:
1) Study of a typical Garments Company.
2) Collection of production data and subsequently balancing the line.
3) Study of material movement-frequency, direction, etc. and subsequently developing a
better layout that minimizes materials handling (cost).
4) Identification and measurement of Value-Added and Non-Value-Added activities and
their times, based on Value Stream Mapping (VSM).
5) Measurement and quantification of selected factors, such as Changeover Time,
Throughput Time, WIP inventory, Quality defect, etc. which are responsible for lower
productivity.
6) Development of quantitative and qualitative guidelines as to how to establish a Cellular
Manufacturing system.
7) Experimental implementation of the developed concepts of Cellular Manufacturing in a
garments factory.
8) Comparison of Productivity level of the suggested system with that of an older
traditional line.
- 91 -
REFERENCES
1. Abdullah, A.Y.M., “Bangladesh RMG Industry: Competitiveness and Productivity”,
Scholars Publishers, Mohakhali, Dhaka, pp.31-45, 2007.
2. Khaled, A.J.S.M., “Work Study & Productivity Improvement Techniques: In the apparel
Industry”, Santo-Mariam University of Creative Technology, Dhaka. pp.7-21, 2008.
3. Pitchuka, L.N., Adil, G.K. and Ananthakumar, U., “Effect of the conversion of the
functional layout to a cellular layout on the queue time performance: Some new insights”,
International Journal of Advanced Manufacturing Technology, Vol. 31, No.5/6, pp.594-601,
2006.
4. Nash, M.A. and Poling, S.R., “Improving Quality Through Lean Concepts”, Quality, Vol.
46, pp. 24-5, 2007.
5. Ohno, Taiichi, “Toyota Production System”, Productivity Press, New York, pp.24-47,
1988.
6. Shingo Shigeo, “A Study of the Toyota Production System”, Productivity Press, New
York, pp. 41-57, 1989.
7. Shingo Shigeo, “Quick Changeover for Operators: The SMED System”, Productivity
Press, Portland, Oregon, pp. 16, 1996.
8. Ortiz, C. A., “Kaizen Assembly: Designing, Constructing, and Managing a Lean
Assembly Line”, Taylor & Francis, USA, pp.40-55, 2006.
9. Drew, J., McCallum, B. and Roggenhofer, S., “Journey to Lean: Making Operational
Change Stick”, Palgrave Macmillan, USA, pp.30-50, 2004.
10. Bicheno John, “The Lean Toolbox”, 2nd edition, Picsie Books, Buckingham, England,
pp.21-24, 2000.
11. Charlene A., Yauch, H and Steudel, J., “Cellular manufacturing for small businesses: key
cultural factors that impact the conversion process”, Journal of Operations Management, Vol.
20, pp.594-614, 2002.
- 92 -
12. Black, J.T. and Hunter, S.L., “Lean Manufacturing System and Cell Design”, Society of
Manufacturing Engineers, Auburn, AL 36849 USA, pp.41-57, 2003.
13. Shah, R. and Ward, P.T., “Defining and developing measures of lean production”, Journal
of Operations Management, Volume-25, pp.785-805, 2007.
14. Liker, J.K. and Meier, D.P., “Toyota Talent”, McGraw-Hill, USA, pp. 137-142, 2007.
15. Taninecz George, “Lean Beyond Production”, Lean Enterprise Institute, Brookline, USA,
pp. 1-9, 2005.
16. Besterfield Dale H., Carol Besterfield-Michna, Besterfield Glen H. & Mary Besterfield-
Sacre, “Total Quality Management”, 3rd edition, Pearson Education, Inc.Singapore,
pp.184-464, 2003.
17. Kolarik William J., “Creating Quality”, McGraw-Hill, Inc. International Editions, pp.173-
191, 1995.
18. Rother Mike and Shook John, “Learning to See – Value Stream Mapping to Create Value
and Eliminate Muda”, The Lean Enterprise Institute, Brookline, USA, Version 1.2, pp.
13-26 , June 1999.
19. Krieg George N, “Kanban – Controlled Manufacturing System”, Springer-Verlag Berlin,
Heidelberg, pp. 3-8, 2005.
20. Kao Hsiu-Hsueh, Yeh Din-Horng and Wang Yi-Hsien, “Resource Constrained Assembly
Line Balancing Problem Solved with Ranked Positional Weight Rule”,
21. Website: http:// www.leanadvisors.com
22. Website: http://www.leanmanufacturingproducts.com
23. Website: https://www.moresteam.com/toolbox/statistical-process-control-spc.cfm

- 93 -
APPENDICES
Appendix A: VSM Data Log Sheet (Cutting Section)
Appendix B: VSM Data Log Sheet (Sewing & Finishing Section)
Appendix C: VSM Data Log Sheet (Finishing, Cartoning)
Appendix D: Variable Control Chart-Format
Appendix E: Attribute Control Chart-Format
Appendix F: CTQ (Critical to Quality) Chart
Appendix G: Table for Values of Constants

- 94 -
Appendix A
Lead Time and Time Utilization Analysis
Table for VSM Data Log Sheet (Cutting Section)
VSM Data Log Sheet
Factory Name: XY Apparels Ltd.
Product Name: Long Sleeve T-Shirt Order No: 64674
Buyer: Zara Style: A-04
Dept Activity Time (min) Quantity Manpower
Cut
ting
Sect
ion
Waiting in cutting store 1099 Waiting for Spreading 35 06 roll
Spreading 55 65 Lay 4 Pattern Marking 25 1
Quality Inspection 5 1 Cutting 40 1
Cut panel Quality checking 5 1 Transportation for Stickering 15 24 bundle 1
Waiting for Stickering 15 24 bundle 480 pieces
Stickering 40 24 bundle 480 pieces
6
Waiting for Bundling 20 24 bundle Bundling 15 24 bundle 2
Bundle waiting for Input store 10 24 bundle Bundle Transportation for Input
store 15 24 bundle 2
Bundle Inspection for Quality 18 24 bundle 4 CUTTING SECTION
Total Process Time Total Value Added Time 95
233 17% Unavoidable Non Value Added Time 138
Total Non Value Added Time 1179 83%
Total Cutting Lead Time 1,412 min
- 95 -
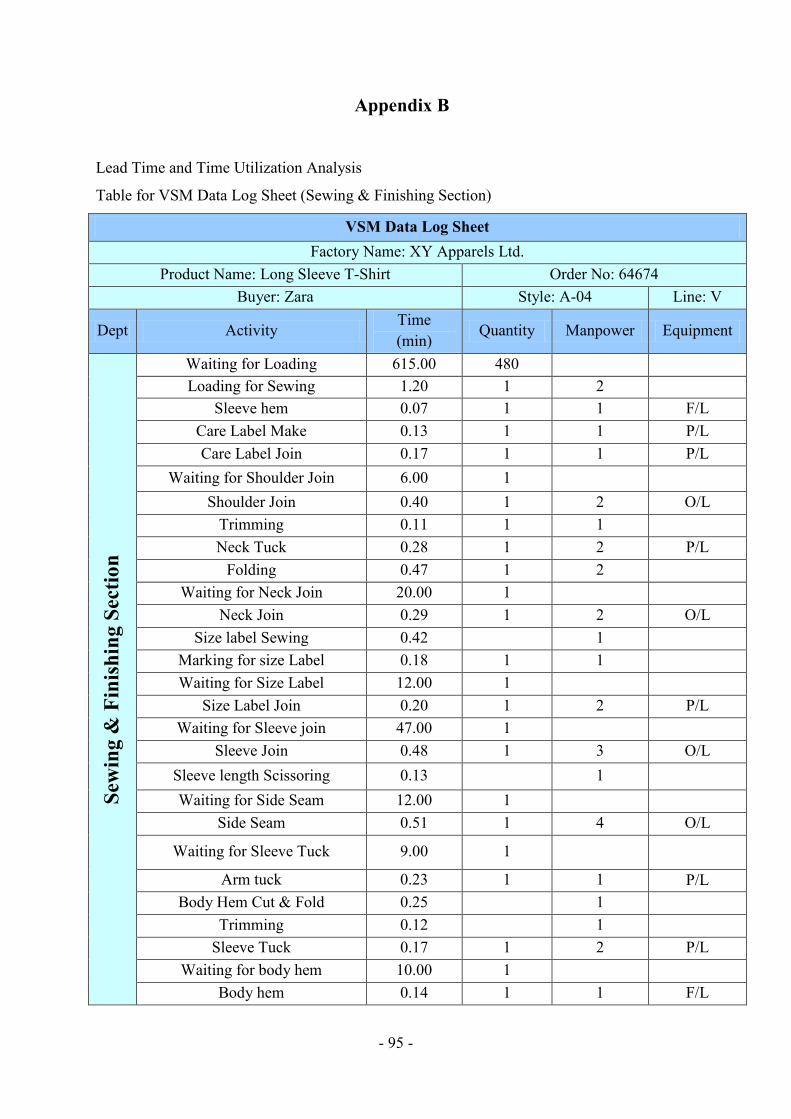
Appendix B
Lead Time and Time Utilization Analysis
Table for VSM Data Log Sheet (Sewing & Finishing Section)
VSM Data Log Sheet Factory Name: XY Apparels Ltd.
Product Name: Long Sleeve T-Shirt Order No: 64674 Buyer: Zara Style: A-04 Line: V
Dept Activity Time (min)
Quantity Manpower Equipment
Sew
ing
& F
inis
hing
Sec
tion
Waiting for Loading 615.00 480 Loading for Sewing 1.20 1 2
Sleeve hem 0.07 1 1 F/L Care Label Make 0.13 1 1 P/L Care Label Join 0.17 1 1 P/L
Waiting for Shoulder Join 6.00 1 Shoulder Join 0.40 1 2 O/L
Trimming 0.11 1 1 Neck Tuck 0.28 1 2 P/L
Folding 0.47 1 2 Waiting for Neck Join 20.00 1
Neck Join 0.29 1 2 O/L Size label Sewing 0.42 1
Marking for size Label 0.18 1 1 Waiting for Size Label 12.00 1
Size Label Join 0.20 1 2 P/L Waiting for Sleeve join 47.00 1
Sleeve Join 0.48 1 3 O/L Sleeve length Scissoring 0.13 1 Waiting for Side Seam 12.00 1
Side Seam 0.51 1 4 O/L
Waiting for Sleeve Tuck 9.00 1
Arm tuck 0.23 1 1 P/L Body Hem Cut & Fold 0.25 1
Trimming 0.12 1 Sleeve Tuck 0.17 1 2 P/L
Waiting for body hem 10.00 1 Body hem 0.14 1 1 F/L
- 96 -
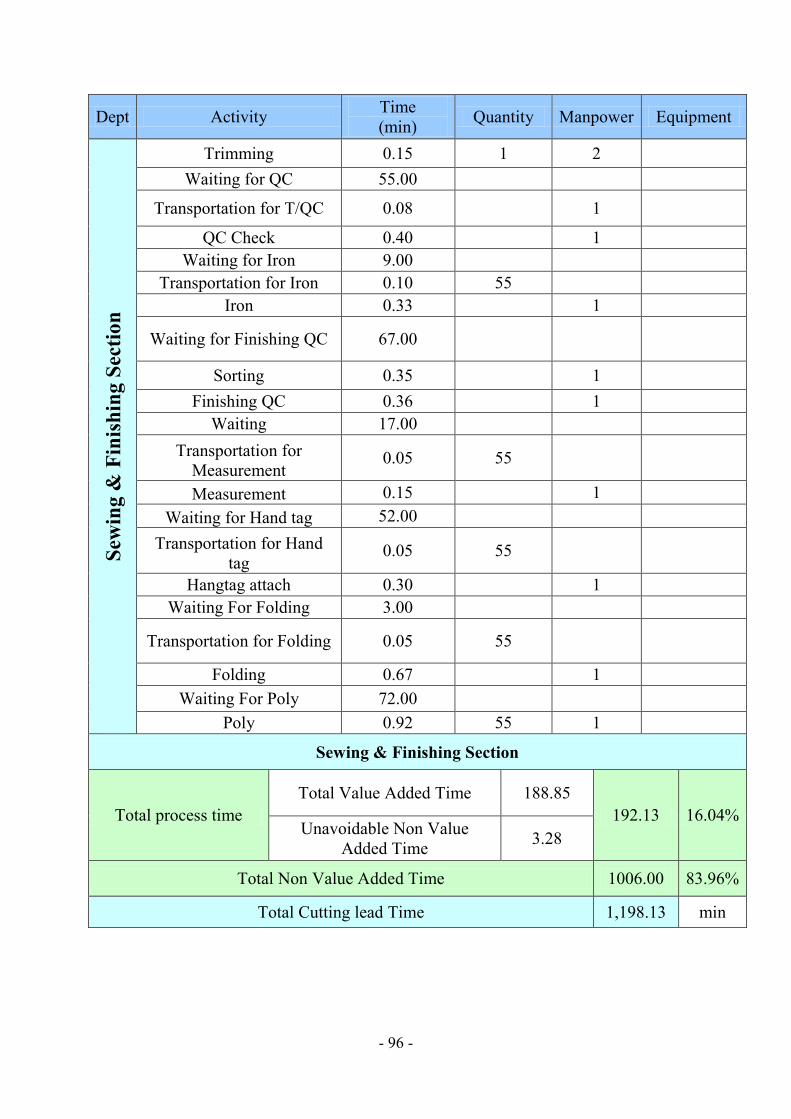
Dept Activity Time (min) Quantity Manpower Equipment
Sew
ing
& F
inis
hing
Sec
tion
Trimming 0.15 1 2 Waiting for QC 55.00
Transportation for T/QC 0.08 1
QC Check 0.40 1 Waiting for Iron 9.00
Transportation for Iron 0.10 55 Iron 0.33 1
Waiting for Finishing QC 67.00
Sorting 0.35 1 Finishing QC 0.36 1
Waiting 17.00 Transportation for
Measurement 0.05 55
Measurement 0.15 1 Waiting for Hand tag 52.00
Transportation for Hand tag
0.05 55
Hangtag attach 0.30 1 Waiting For Folding 3.00
Transportation for Folding 0.05 55
Folding 0.67 1 Waiting For Poly 72.00
Poly 0.92 55 1
Sewing & Finishing Section
Total process time Total Value Added Time 188.85
192.13 16.04% Unavoidable Non Value
Added Time 3.28
Total Non Value Added Time 1006.00 83.96%
Total Cutting lead Time 1,198.13 min
- 97 -
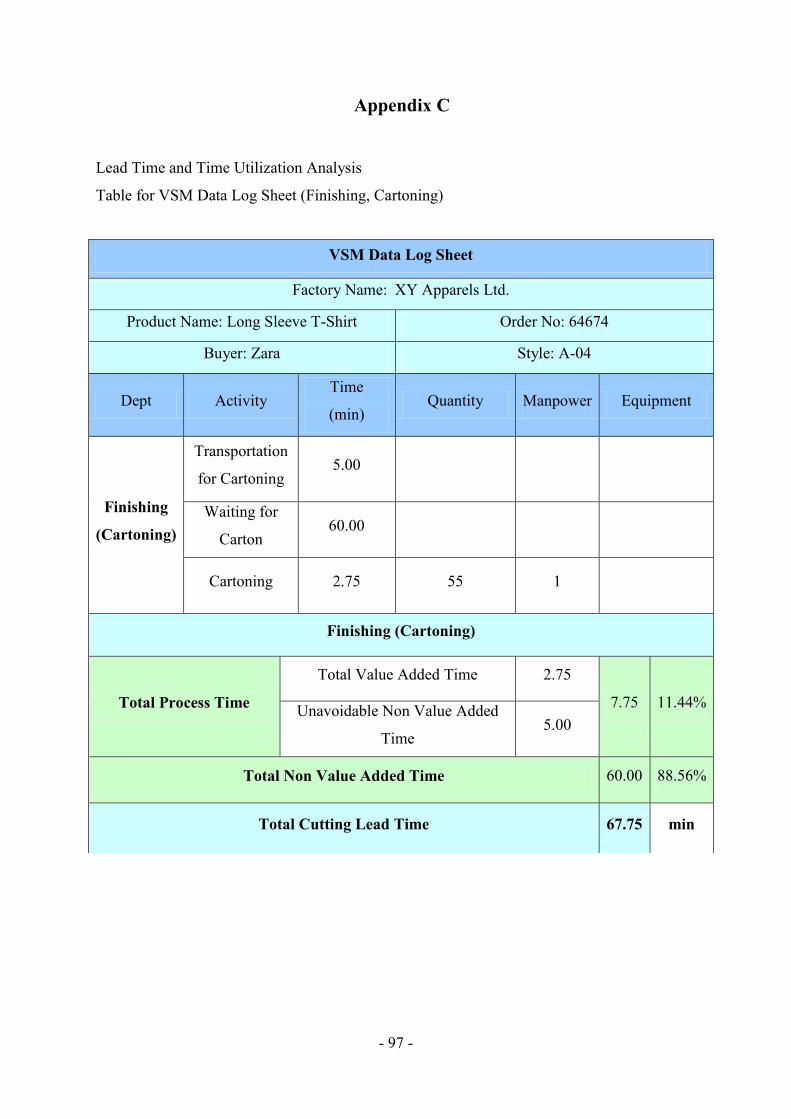
Appendix C
Lead Time and Time Utilization Analysis
Table for VSM Data Log Sheet (Finishing, Cartoning)
VSM Data Log Sheet
Factory Name: XY Apparels Ltd.
Product Name: Long Sleeve T-Shirt Order No: 64674
Buyer: Zara Style: A-04
Dept Activity Time
(min) Quantity Manpower Equipment
Finishing
(Cartoning)
Transportation
for Cartoning 5.00
Waiting for
Carton 60.00
Cartoning 2.75 55 1
Finishing (Cartoning)
Total Process Time
Total Value Added Time 2.75
7.75 11.44% Unavoidable Non Value Added
Time 5.00
Total Non Value Added Time 60.00 88.56%
Total Cutting Lead Time 67.75 min

- 98 -
Appendix D
Variable Control Chart-Format
Others
UCL= LCL=
UCL= LCL=
Interpretation Guidelines
Any Point Outside The Control Limits
1 A Trend of 7 Points-all Rising/Falling
2 A Run of 7 Points-all Above/Below
3 The Centreline
4 Any Other Obvious Non-Random
5 Pattern
6
Legend
1 = 1/8
2 = 1/4
3 = 3/8
4 = 1/2
5 = 5/8
6 = 3/4
7 = 7/8
8 = 1
TOTAL
MEDIAN (X)
RANGE (R)
Documentation
For every change in the
processwrite
the sample number and answer
Med
ian
Ran
ges
1 2 3 4 5 6 7 8 9 10 11 12 13 14 15 16 17 18 19 20 21 22 23 24 25 26 27 28 29 30
18
17
16
15
14
13
12
11
10
9
8
7
6
5
4
3
2
TIME
BUNDLE NO
VARIABLES CONTROL CHART
Measurement
SIZE
sam
ple
mesu
rem
en
ts
Chart Type
X - R / Median Chart
Median Chart
X =Ranges Chart
R =
Sample Suize / Frequency
Tolerances (Specified by Buyer)
Upper = Lower =
DATE
U What Happened ?
U Why Did It Happened ?
U How Was It Corrected ?
U Who Correctet It ?
Use The Reverse Side To Write Formula
Median:
UCLx = X + A2R
UCLx = X - A2R
Range:
UCLR = D4R, LCLR = D3R
Operation
Supervisor
Quality Racilitator
Style No/Line No
Buyer
Unit of Measure
+6
+5
+3
+2
+1
0
-1
-2
-3
-4
-5
-6
+4
A2 = 0.577
D4 = 2.114
D3 = 0
- 99 -
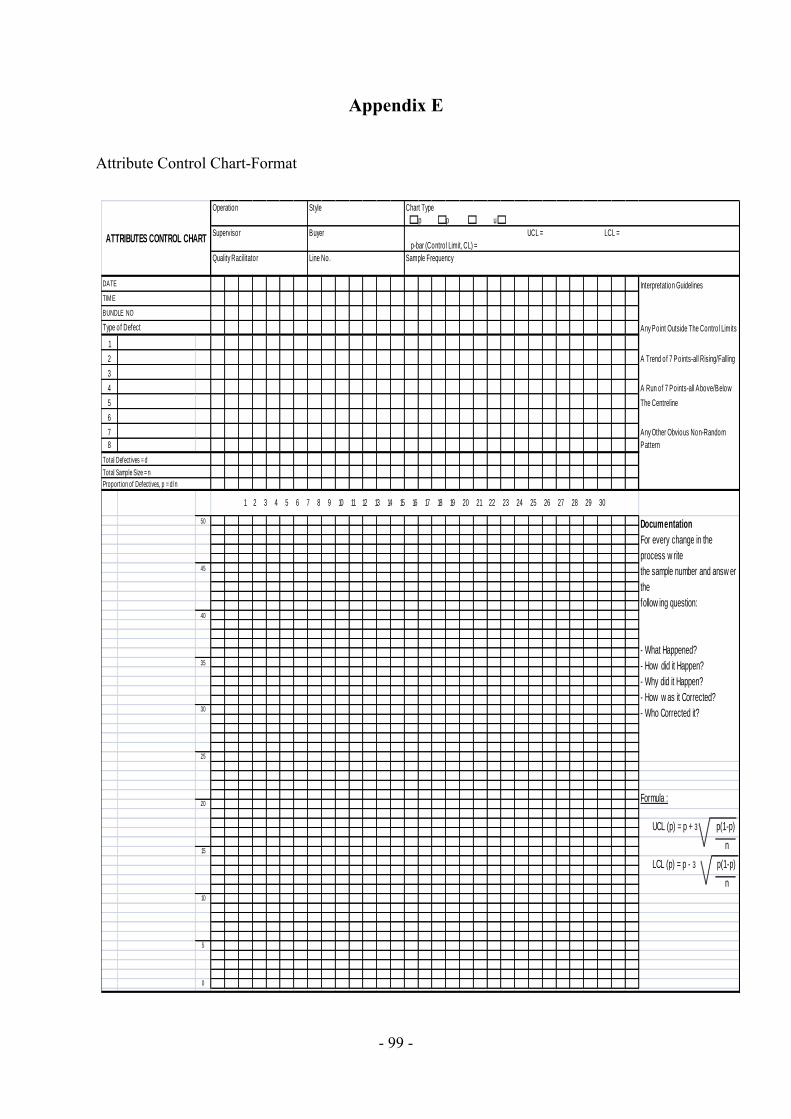
Appendix E
Attribute Control Chart-Format
Interpretation Guidelines
Any Point Outside The Contro l Limits
1
2 A Trend of 7 Points-all Rising/Falling
3
4 A Run of 7 Points-all Above/Below
5 The Centreline
6
7 Any Other Obvious Non-Random
8 Pattern
50
45
40
35
30
25
20
15
10
5
0
Style
Total Defect ives = d
Buyer
Line No.
Type of Defect
Total Sample Size = n
Proport ion of Defect ives, p = d/n
1 2 3 4 5 6 7 8 9 10 11 12 13 14 15 16 17 18 19 20 21 22 23 24 25 26 27 28 29 30
ATTRIBUTES CONTROL CHART
BUNDLE NO
TIM E
DATE
Operation
Supervisor
Quality Racilitator
LCL (p) = p - 3 p(1-p)
n
Chart Type
p np c u
UCL = LCL =
p-bar (Contro l Limit, CL) =
Sample Frequency
Documentation
For every change in the
process w rite
the sample number and answ er
the
follow ing question:
- What Happened?
- How did it Happen?
- Why did it Happen?
- How w as it Corrected?
- Who Corrected it?
Formula :
UCL (p) = p + 3 p(1-p)
n
- 100 -
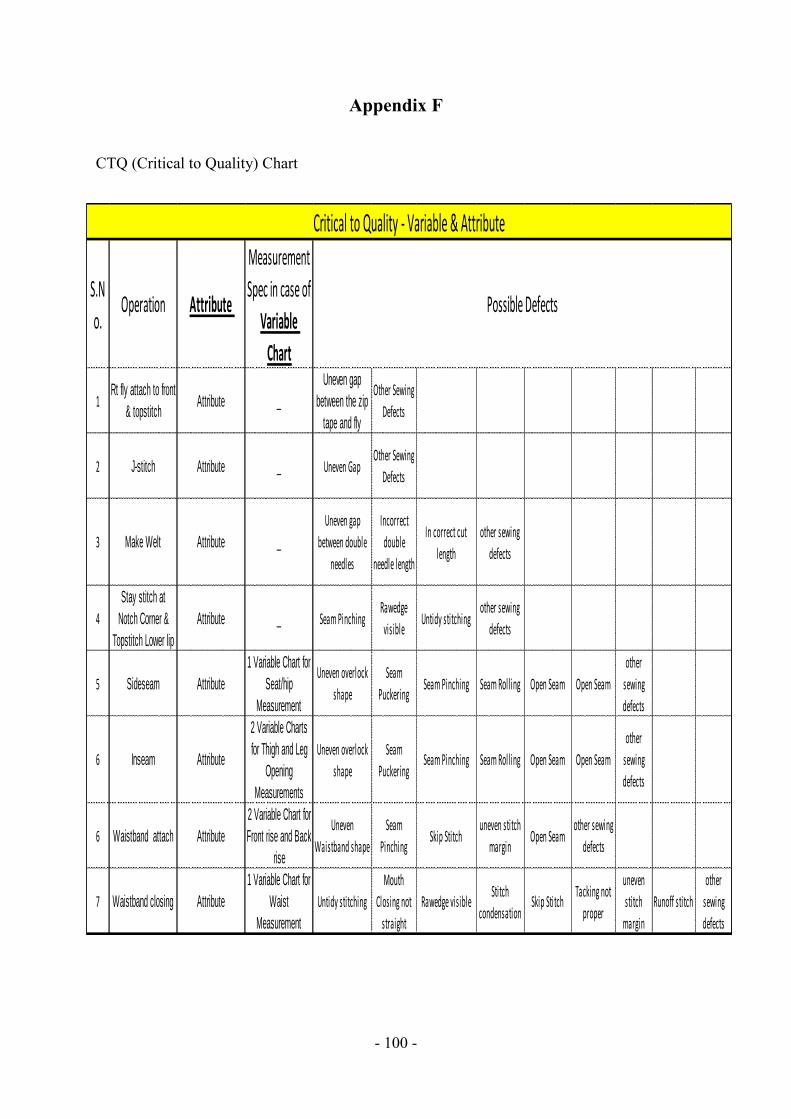
Appendix F
CTQ (Critical to Quality) Chart
S.N
o.Operation Attribute
Measurement
Spec in case of
Variable
Chart
1Rt fly attach to front
& topstitchAttribute _
Uneven gap
between the zip
tape and fly
Other Sewing
Defects
2 J-stitch Attribute _ Uneven GapOther Sewing
Defects
3 Make Welt Attribute _
Uneven gap
between double
needles
Incorrect
double
needle length
In correct cut
length
other sewing
defects
4
Stay stitch at
Notch Corner &
Topstitch Lower lip
Attribute _ Seam PinchingRawedge
visibleUntidy stitching
other sewing
defects
5 Sideseam Attribute
1 Variable Chart for
Seat/hip
Measurement
Uneven overlock
shape
Seam
PuckeringSeam Pinching Seam Rolling Open Seam Open Seam
other
sewing
defects
6 Inseam Attribute
2 Variable Charts
for Thigh and Leg
Opening
Measurements
Uneven overlock
shape
Seam
PuckeringSeam Pinching Seam Rolling Open Seam Open Seam
other
sewing
defects
6 Waistband attach Attribute
2 Variable Chart for
Front rise and Back
rise
Uneven
Waistband shape
Seam
PinchingSkip Stitch
uneven stitch
marginOpen Seam
other sewing
defects
7 Waistband closing Attribute
1 Variable Chart for
Waist
Measurement
Untidy stitching
Mouth
Closing not
straight
Rawedge visibleStitch
condensationSkip Stitch
Tacking not
proper
uneven
stitch
margin
Runoff stitch
other
sewing
defects
Critical to Quality - Variable & Attribute
Possible Defects
- 101 -
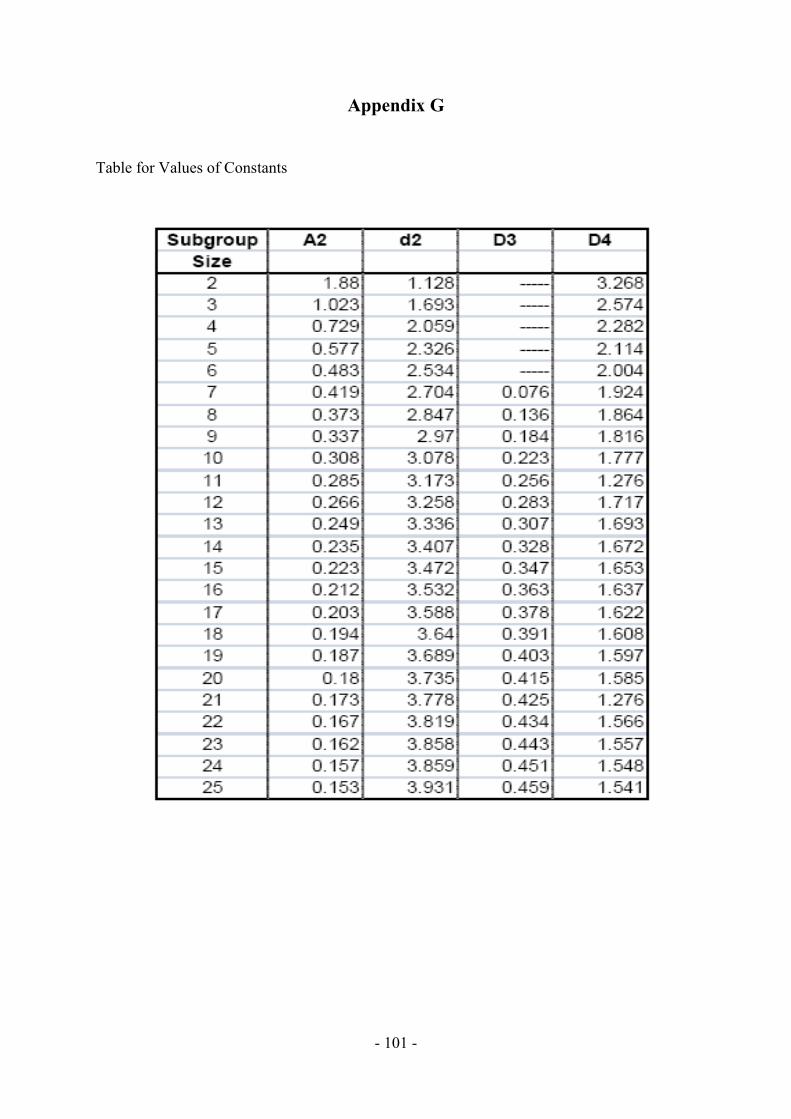
Appendix G
Table for Values of Constants
- 5 -
CHAPTER - 2
LITERATURE REVIEW 2.1 INTRODUCTION
Lean Manufacturing represents a journey that should never end since it involves the
identification and elimination of waste and inefficiencies. It is the continuous improvement of
all operations and processes involved in manufacturing. It seems to imply that there will
always be some waste and inefficiencies, and that better operations or processes will continue
to emerge due to better equipment, newer technological developments and more informed
management. The implementation of Lean production systems has saved many companies
millions of dollars over the last 20 years or so 4 .
Recent competitive economic situations demand quicker supply of newer products with more
innovative functionality to satisfy quickly changing customer requirements. In striving to
remain competitive, the concept of Cellular Manufacturing has been extensively employed to
the manufacturing systems 6 .
Cellular manufacturing, one of the main tools of Lean Manufacturing, helps to create a concept
known as single or one-piece flow. Equipment and the workstations are arranged in sequences
to allow for a smooth flow of materials and components through the process. The cell is made
up of workers and the equipment required to perform the steps in creating the product. The
layout of the equipment and the workstations is determined by the logical sequence of
production. By grouping similar products into families that can then be processed on the same
equipment in the same sequence, cellular manufacturing offers companies the flexibility to
give customers the variety they require. Factories converted to cellular manufacturing benefit
by the reduction of overproduction and waste, shorter lead time, improved quality and
productivity, improved teamwork and communication 4 .
- 6 -
2.2 HISTORICAL BACKGROUND OF CELLULAR MANUFACTURING
Cellular Manufacturing is the application of the principles of Group Technology in
manufacturing. Group Technology was proposed by Flanders in 1925 and adopted in Russia by
Mitrofanov in 1933 (although the work was translated into English in 1966). Jack Burbidge
(1978) did much to promote Group Technology in the UK. Although there appear to have been
similar applications earlier in history Portsmouth Block Mills offers what by definition
constitutes an early example of cellular manufacturing. By 1808, using machinery designed by
Marc Isambard Brunel and constructed by Henry Maudslay, the Block Mills were producing
130,000 blocks (pulleys) for the Royal Navy per year in single unit lots, with 10 men operating
42 machines arranged in three production flow lines. This installation apparently reduced
manpower requirements by 90% (from 110 to 10), reduced cost substantially and greatly
improved block consistency and quality. Group Technology is a management strategy with
long term goals of staying in business, growing, and making profits. Companies are under
relentless pressure to reduce costs while meeting the high quality expectations of the customer
to maintain a competitive advantage. Successfully implementing Cellular manufacturing allows
companies to achieve cost savings and quality improvements, especially when combined with
the other aspects of lean manufacturing tools 5 .
2.3 INTRODUCTION TO LEAN MANUFACTURING
U.S. manufacturers have always searched for efficiency strategies that help reduce costs,
improve output, establish competitive position, and increase market share. Early process
oriented mass production manufacturing methods common before World War II shifted
afterwards to the results-oriented, output-focused, production systems that control most of
today's manufacturing businesses.
Japanese manufacturers re-building after the Second World War were facing declining human,
material, and financial resources. The problems they faced in manufacturing were vastly
different from their Western counterparts. These circumstances led to the development of new,
lower cost, manufacturing practices. Early Japanese leaders such as the Toyota Motor
Company's Eiji Toyoda, Taiichi Ohno, and Shingeo Shingo developed a disciplined, process-
focused production system now known as the "Toyota Production System", or "Lean
- 7 -
Production." The objective of this system was to minimize the consumption of resources that
added no value to a product 9 & 14 .
The "Lean Manufacturing" concept was popularized in American factories in large part by the
Massachusetts Institute of Technology study of the movement from mass production toward
production as described in The Machine That Changed the World, (Womack, Jones &
Roos,1990), which discussed the significant performance gap between Western and Japanese
automotive industries. This book described the important elements accounting for superior
performance as lean production. The term "Lean" was used because Japanese business methods
used less human effort, capital investment, floor space, materials, and time in all aspects of
operations. The resulting competition among U.S. and Japanese automakers over the last 25
years has lead to the adoption of these principles within all U.S. manufacturing businesses 9 .
2.3.1 Lean Manufacturing Definitions
“A systematic approach to identifying and eliminating waste (non-value-added activities)
through continuous improvement by flowing the product at the pull of customer in pursuit of
perfection.”
“Lean is a term to describe a system that produces what the customer wants, when they want it,
with minimum waste – it is based on the Toyota Production System”.
Lean thinking focuses on value-added Lean consists of best practices, tools and techniques
from throughout industry with the aims of reducing waste and maximizing efficiency to
achieve the ultimate customer satisfaction. Flow and the efficiency of the overall system a part
sitting in a pile of inventory is waste and the goal is to keep product flowing and add value as
much as possible. The focus is on the overall system and synchronizing operations so that they
be aligned and produced products at a steady pace.
Lean manufacturing is a manufacturing philosophy that shortens the time between the customer
order and the product build/shipment by eliminating sources of waste 5 & 9 .
- 8 -
2.3.2 Toyota ways - 14 Principles
1. Base your management decisions on a long term philosophy at the expense of short
term financial goals.
2. Create continuous process flow to bring problems to surface.
3. Use “PULL” system to avoid overproduction.
4. Level out the workload (heijunka).
5. Build a culture of stopping to fix a problem. To get quality right the first time.
6. Standardize tasks are the foundation for continuous improvement and employees
empowerment.
7. Use visual controls so no problems are hidden.
8. Use only reliable, thoroughly tested technology that serves your people and processes.
9. Grow leaders who thoroughly understand the work. Live the philosophy and teach it to
others.
10. Develop exceptional people and teams who follow your company’s philosophy.
11. Respect your extended network of partners and suppliers by challenging them and
helping them improve.
12. Go and see for yourself to thoroughly understand the situation.
13. Make decisions slowly by consensus, thoroughly considering all options, implement
decisions rapidly.
14. Become a learning organization through relentless reflection (Hansei) and continuous
improvement (Kaizen).
2.3.3 Toyota – 4 rules
1. Simplify, Structure & Standardize every activity
2. Analyze, Simplify & connect every flow
3. Connect Visually workers to customers and corporate objectives
4. Improve continuously through work practices and experimentation with workers
participation
- 9 -
2.3.4 Principles of Lean Manufacturing
Key principles behind Lean Manufacturing can be summarized as follows:
1. Recognition of waste – The first step is to recognize what does and does not create
value from the customer’s perspective. Any material, process or feature which is not
required for creating value from the customer’s perspective is waste and should be
eliminated.
2. Standard processes – Lean requires an the implementation of very detailed production
guidelines, called Standard Work, which clearly state the content, sequence, timing
and outcome of all actions by workers. This eliminates variation in the way that
workers perform their tasks.
3. Continuous flow – Lean usually aims for the implementation of a continuous
production flow free of bottlenecks, interruption, detours, backflows or waiting. When
this is successfully implemented, the production cycle time can be reduced by as much
as 90%.
4. Pull-production – Also called Just-in-Time (JIT), Pull-production aims to produce only
what is needed, when it is needed. Production is pulled by the downstream workstation
so that each workstation should only produce what is requested by the next
workstation.
5. Quality at the Source – Lean aims for defects to be eliminated at the source and for
quality inspection to be done by the workers as part of the in-line production process.
6. Continuous improvement – A continuous improvement mentality is necessary to reach
the company's goals. The term "continuous improvement" means incremental
improvement of products, processes, or services over time, with the goal of reducing
waste to improve workplace functionality, customer service, or product performance.
Lean requires striving for perfection by continually removing layers of waste as they
are uncovered. This in turn requires a high level of worker involvement in the
continuous improvement process.
7. Customer Focus - A lean manufacturing enterprise thinks more about its customers
than it does about running machines fast to absorb labor and overhead. Ensuring
customer input and feedback assures quality and customer satisfaction, all of which
support sales 8 .
- 10 -
8. Value - In lean production, the value of a product is defined solely by the customer.
The product must meet the customer's needs at both a specific time and price.
Identifying the value in lean production means to understand all the activities required
to produce a specific product, and then to optimize the whole process from the view of
the customer.
9. Perfection - The concept of perfection in lean production means that there are endless
opportunities for improving the utilization of all types of assets. The systematic
elimination of waste will reduce the costs of operating the extended enterprise and
fulfills customer's desire for maximum value at the lowest price 8 .
2.4 FOCUS ON WASTE IDENTIFICATION
The aim of Lean Manufacturing is the elimination of waste in every area of production
including customer relations, product design, supplier networks, and factory management. Its
goal is to incorporate less human effort, less inventory, less time to develop products, and less
space to become highly responsive to customer demand while producing top quality products
in the most efficient and economical manner possible.
Essentially, a "waste" is anything that the customer is not willing to pay for. Typically the
types of waste considered in a lean manufacturing system include: 8 .
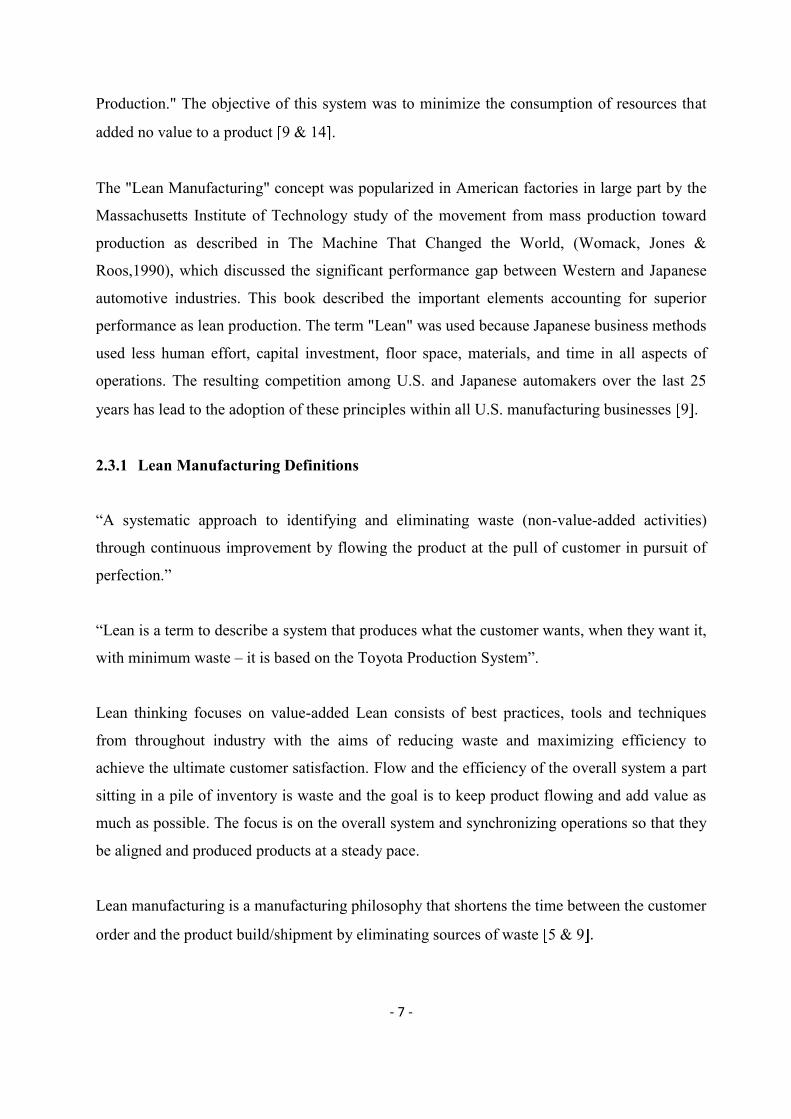
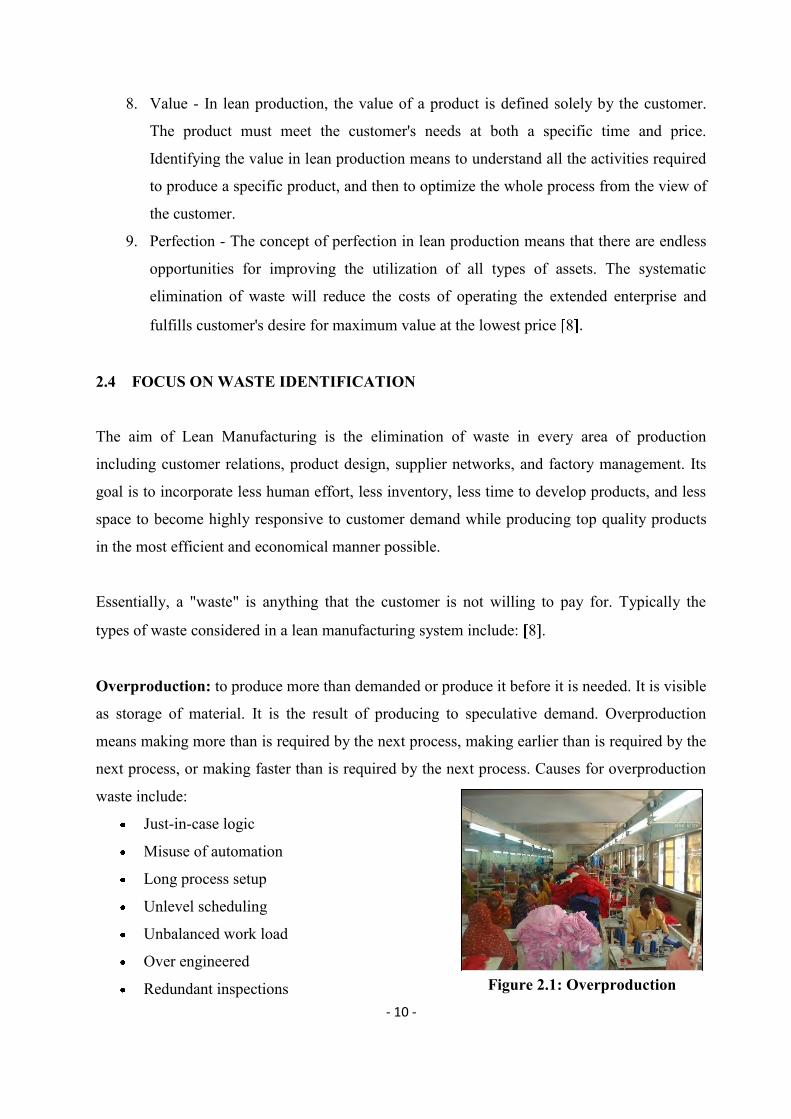
Overproduction: to produce more than demanded or produce it before it is needed. It is visible
as storage of material. It is the result of producing to speculative demand. Overproduction
means making more than is required by the next process, making earlier than is required by the
next process, or making faster than is required by the next process. Causes for overproduction
waste include:
Just-in-case logic
Misuse of automation
Long process setup
Unlevel scheduling
Unbalanced work load
Over engineered
Redundant inspections Figure 2.1: Overproduction
- 11 -
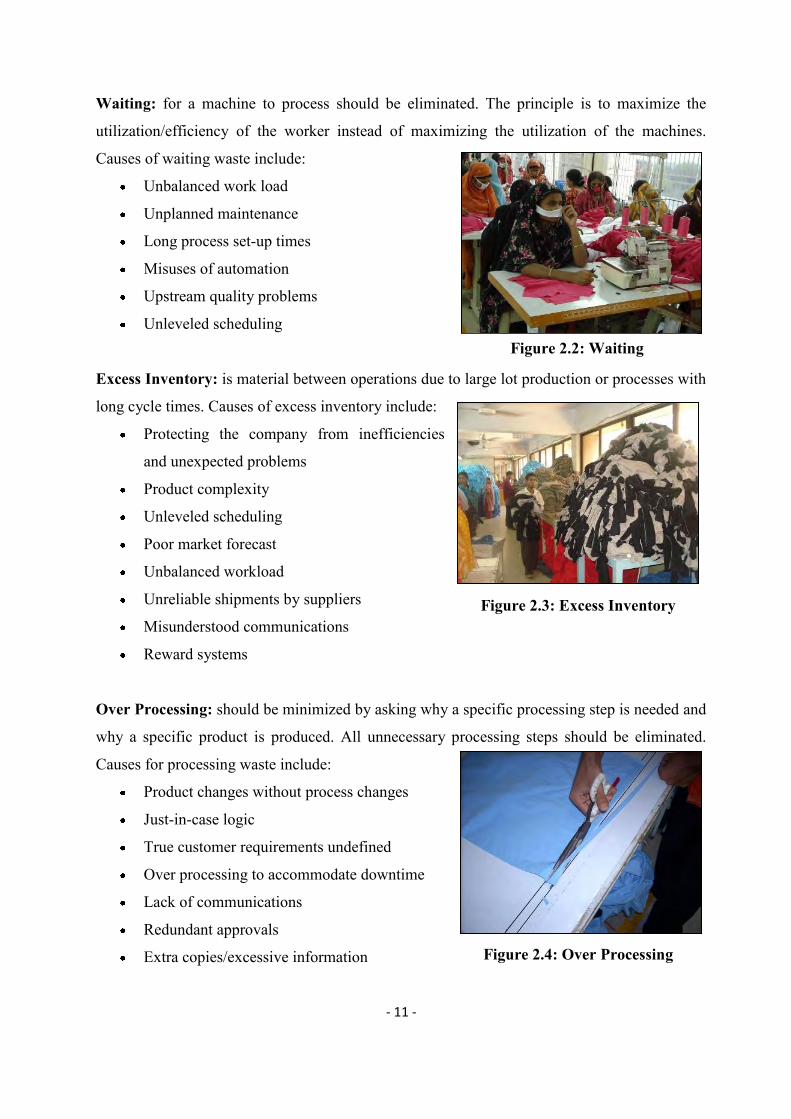
Waiting: for a machine to process should be eliminated. The principle is to maximize the
utilization/efficiency of the worker instead of maximizing the utilization of the machines.
Causes of waiting waste include:
Unbalanced work load
Unplanned maintenance
Long process set-up times
Misuses of automation
Upstream quality problems
Unleveled scheduling
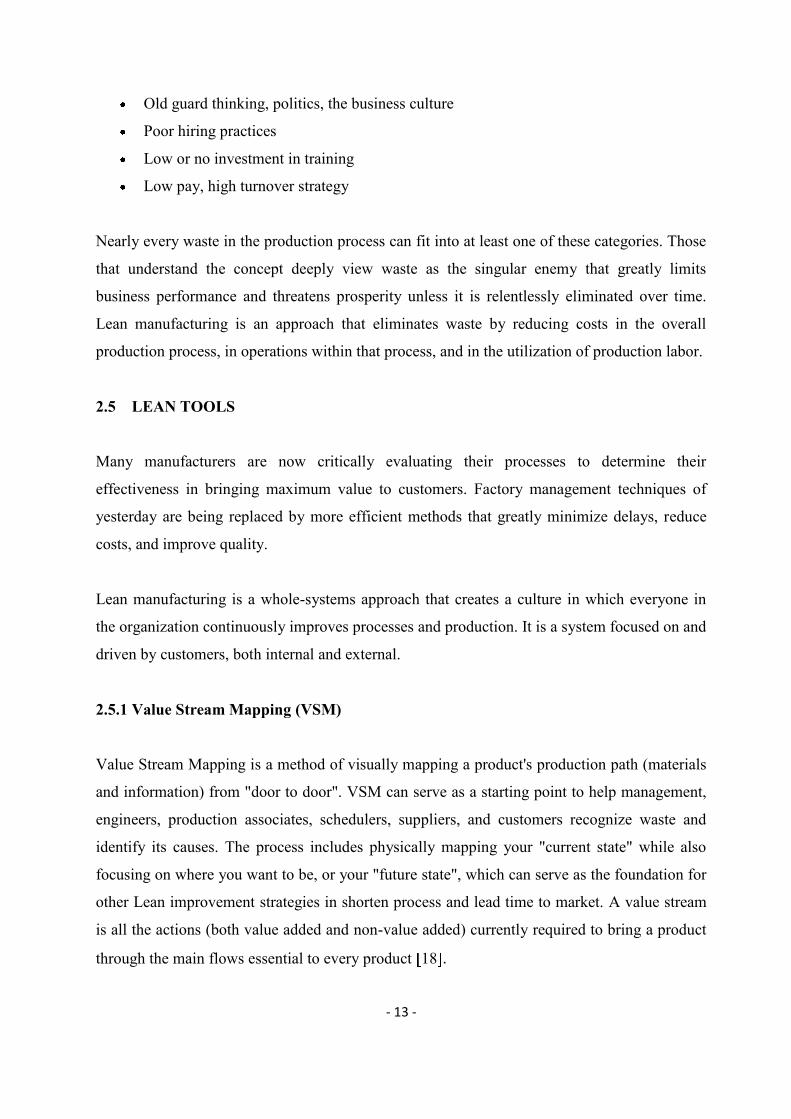
Excess Inventory: is material between operations due to large lot production or processes with
long cycle times. Causes of excess inventory include:
Protecting the company from inefficiencies
and unexpected problems
Product complexity
Unleveled scheduling
Poor market forecast
Unbalanced workload
Unreliable shipments by suppliers
Misunderstood communications
Reward systems
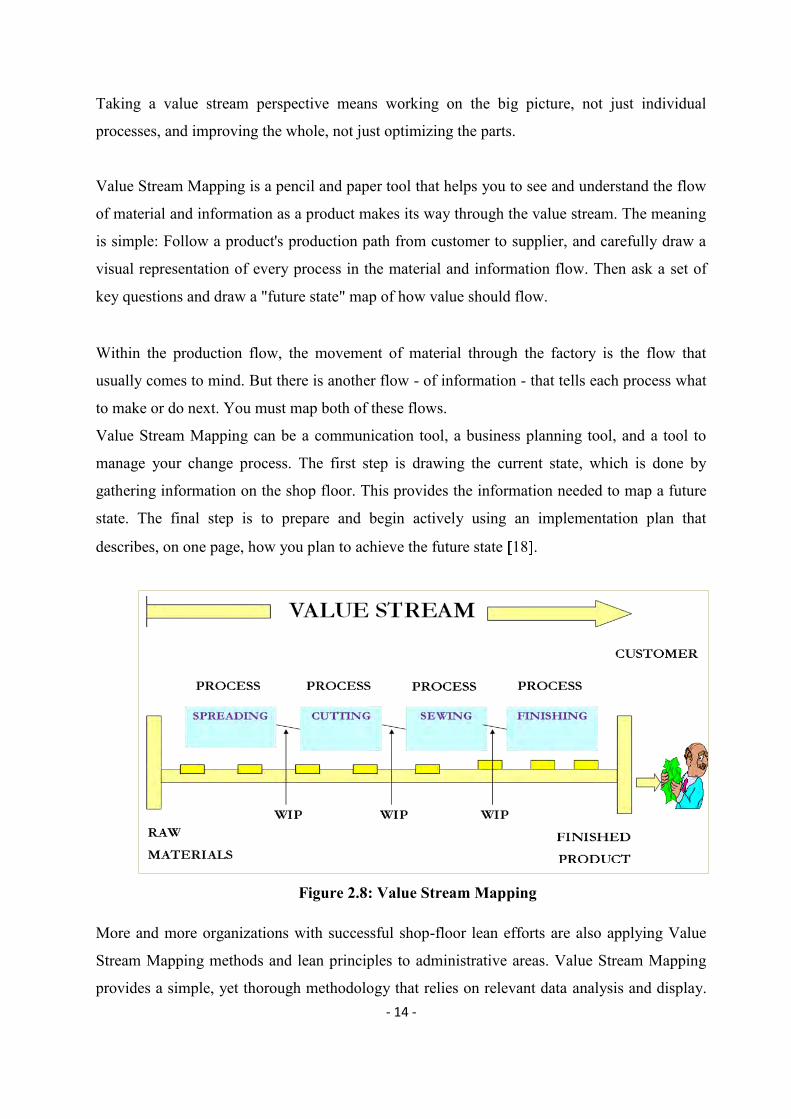
Over Processing: should be minimized by asking why a specific processing step is needed and
why a specific product is produced. All unnecessary processing steps should be eliminated.
Causes for processing waste include:
Product changes without process changes
Just-in-case logic
True customer requirements undefined
Over processing to accommodate downtime
Lack of communications
Redundant approvals
Extra copies/excessive information
Figure 2.2: Waiting
Figure 2.4: Over Processing
Figure 2.3: Excess Inventory

- 12 -
Excess Transportation: does not add any value to the product. Instead of improving the
transportation, it should be minimized or eliminated (e.g. forming cells). A cause of
transportation waste includes:
Poor plant layout
Poor understanding of the process flow for
production
Large batch sizes, long lead times, and large
storage areas
Excess Motion: of the workers, machines, and
transport (e.g. due to the inappropriate location of
tools and parts) is waste. Instead of automating wasted
motion, the operation itself should be improved.
Causes of motion waste include:
Poor people/machine effectiveness
Inconsistent work methods
Unfavorable facility or cell layout
Poor workplace organization and
housekeeping
Extra "busy" movements while waiting
Rework: is pure waste. Prevent the occurrence of defects instead of finding and repairing
defects. Causes of processing waste include:
Weak process control
Unbalanced inventory level
Deficient planned maintenance
Product design
Customer needs not understood
Inadequate education/training/work
instructions
Underutilizing People: Losing time, ideas, skills, improvements, and learning opportunities
by not engaging or listening to the employees. Causes of people waste include: 13 .
Figure 2.5: Excess Transportation
Figure 2.6: Excess Motion
Figure 2.7: Rework
- 13 -
Old guard thinking, politics, the business culture
Poor hiring practices
Low or no investment in training
Low pay, high turnover strategy
Nearly every waste in the production process can fit into at least one of these categories. Those
that understand the concept deeply view waste as the singular enemy that greatly limits
business performance and threatens prosperity unless it is relentlessly eliminated over time.
Lean manufacturing is an approach that eliminates waste by reducing costs in the overall
production process, in operations within that process, and in the utilization of production labor.
2.5 LEAN TOOLS
Many manufacturers are now critically evaluating their processes to determine their
effectiveness in bringing maximum value to customers. Factory management techniques of
yesterday are being replaced by more efficient methods that greatly minimize delays, reduce
costs, and improve quality.
Lean manufacturing is a whole-systems approach that creates a culture in which everyone in
the organization continuously improves processes and production. It is a system focused on and
driven by customers, both internal and external.
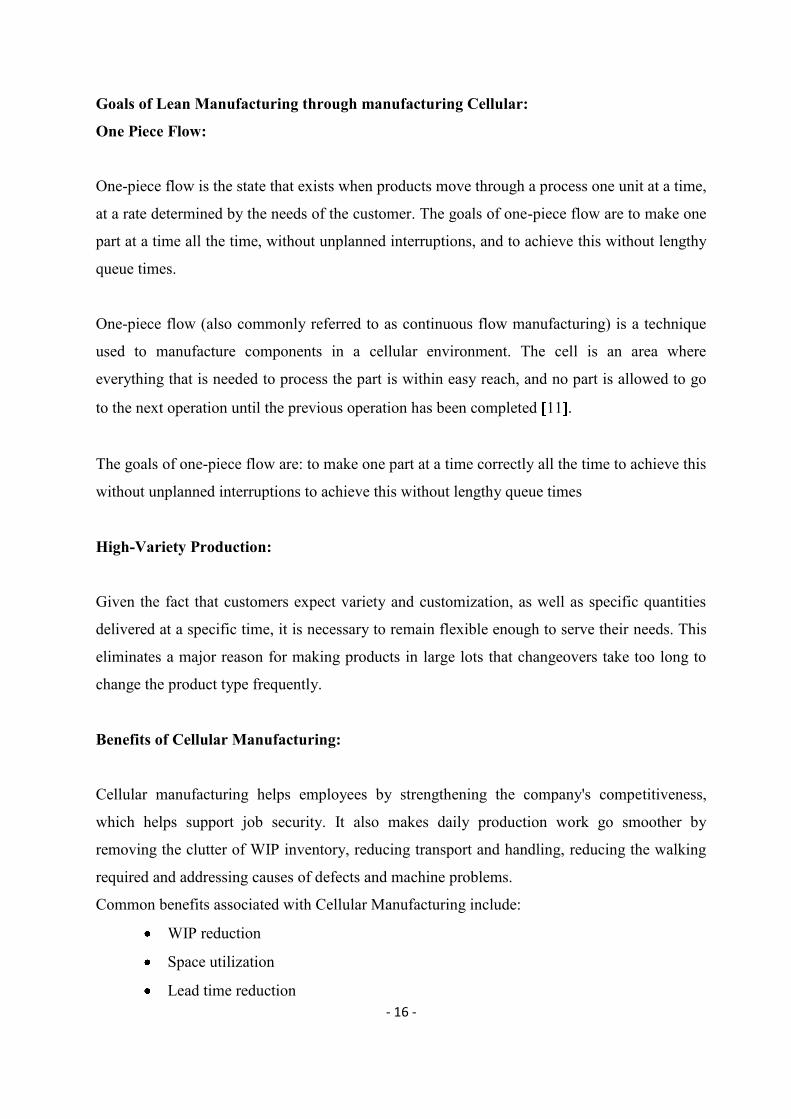
2.5.1 Value Stream Mapping (VSM)
Value Stream Mapping is a method of visually mapping a product's production path (materials
and information) from "door to door". VSM can serve as a starting point to help management,
engineers, production associates, schedulers, suppliers, and customers recognize waste and
identify its causes. The process includes physically mapping your "current state" while also
focusing on where you want to be, or your "future state", which can serve as the foundation for
other Lean improvement strategies in shorten process and lead time to market. A value stream
is all the actions (both value added and non-value added) currently required to bring a product
through the main flows essential to every product 18 .
- 14 -
Taking a value stream perspective means working on the big picture, not just individual
processes, and improving the whole, not just optimizing the parts.
Value Stream Mapping is a pencil and paper tool that helps you to see and understand the flow
of material and information as a product makes its way through the value stream. The meaning
is simple: Follow a product's production path from customer to supplier, and carefully draw a
visual representation of every process in the material and information flow. Then ask a set of
key questions and draw a "future state" map of how value should flow.
Within the production flow, the movement of material through the factory is the flow that
usually comes to mind. But there is another flow - of information - that tells each process what
to make or do next. You must map both of these flows.
Value Stream Mapping can be a communication tool, a business planning tool, and a tool to
manage your change process. The first step is drawing the current state, which is done by
gathering information on the shop floor. This provides the information needed to map a future
state. The final step is to prepare and begin actively using an implementation plan that
describes, on one page, how you plan to achieve the future state 18 .
More and more organizations with successful shop-floor lean efforts are also applying Value
Stream Mapping methods and lean principles to administrative areas. Value Stream Mapping
provides a simple, yet thorough methodology that relies on relevant data analysis and display.
Figure 2.8: Value Stream Mapping

- 15 -
It links reporting requirements, metrics, people, and lean tools to sustain improvement and
promote process learning. It gives managers and employees the same tool and language to
communicate.
Why Value Stream Mapping is a good place to start Lean Journey –
it helps you visualize more than just the single-process level, i.e. assembly, welding, etc.
it helps you see more than waste it helps you see the sources of waste in your value
stream
it provides a common language for talking about manufacturing processes
it makes decisions about the flow apparent, so you can discuss them
it ties together lean concepts and techniques helps you avoid "cherry picking"
it forms the basis of an implementation plan
it shows the linkage between the information flow and the material flow
It is much more useful than quantitative tools and layout diagrams that produce a tally of non-
value added steps, lead time, and distance traveled, the amount of inventory, and so on 18 .
2.5.2 Cellular Manufacturing
Cellular manufacturing is an approach that helps build a variety of products with as little waste
as possible. Equipment and workstations are arranged in a sequence that supports a smooth
flow of materials and components through the process, with minimal transport or delay
(Kanban production and Transport).
A manufacturing cell consists of the people and the machines or workstations required for
performing the steps in a process or process segment, with the machines arranged in the
processing sequence.
Arranging people and equipment into cells helps companies achieve two important goals of
lean manufacturing one-piece flow and high-variety production 12 .
- 16 -
Goals of Lean Manufacturing through manufacturing Cellular:
One Piece Flow:
One-piece flow is the state that exists when products move through a process one unit at a time,
at a rate determined by the needs of the customer. The goals of one-piece flow are to make one
part at a time all the time, without unplanned interruptions, and to achieve this without lengthy
queue times.
One-piece flow (also commonly referred to as continuous flow manufacturing) is a technique
used to manufacture components in a cellular environment. The cell is an area where
everything that is needed to process the part is within easy reach, and no part is allowed to go
to the next operation until the previous operation has been completed 11 .
The goals of one-piece flow are: to make one part at a time correctly all the time to achieve this
without unplanned interruptions to achieve this without lengthy queue times
High-Variety Production:
Given the fact that customers expect variety and customization, as well as specific quantities
delivered at a specific time, it is necessary to remain flexible enough to serve their needs. This
eliminates a major reason for making products in large lots that changeovers take too long to
change the product type frequently.
Benefits of Cellular Manufacturing:
Cellular manufacturing helps employees by strengthening the company's competitiveness,
which helps support job security. It also makes daily production work go smoother by
removing the clutter of WIP inventory, reducing transport and handling, reducing the walking
required and addressing causes of defects and machine problems.
Common benefits associated with Cellular Manufacturing include:
WIP reduction
Space utilization
Lead time reduction
- 17 -
Productivity improvement
Quality improvement
Enhanced teamwork and communication
Enhanced flexibility and visibility
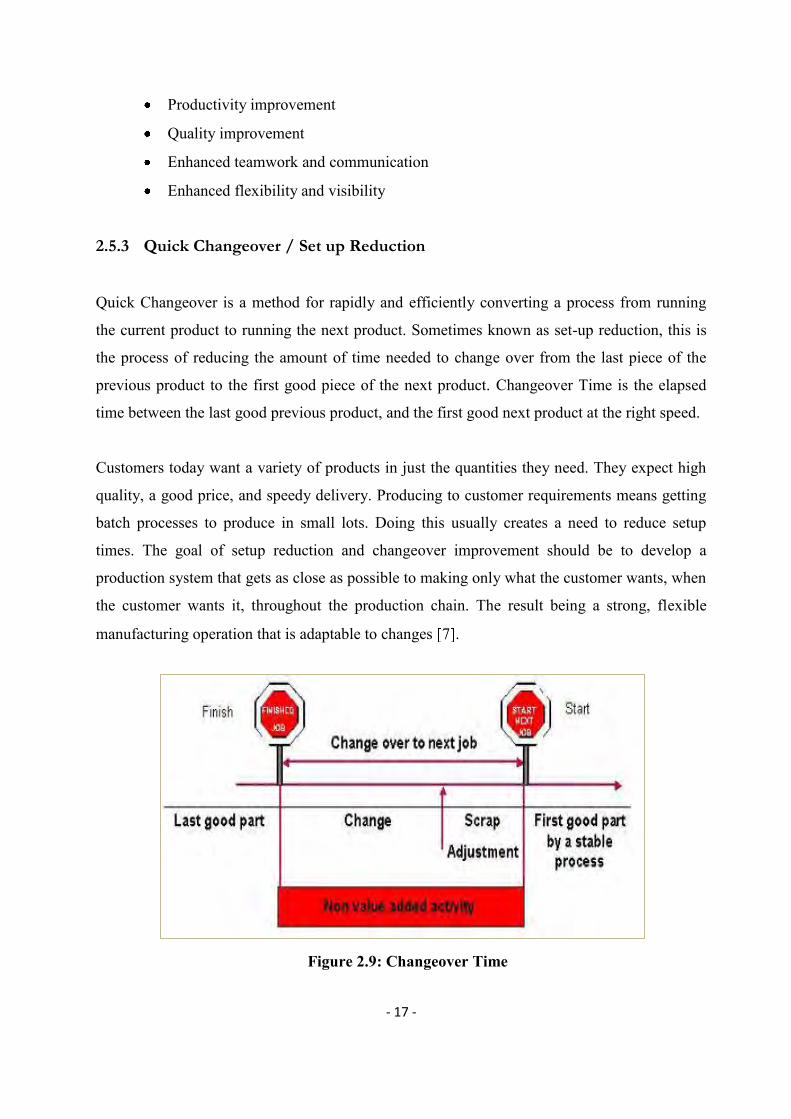
2.5.3 Quick Changeover / Set up Reduction
Quick Changeover is a method for rapidly and efficiently converting a process from running
the current product to running the next product. Sometimes known as set-up reduction, this is
the process of reducing the amount of time needed to change over from the last piece of the
previous product to the first good piece of the next product. Changeover Time is the elapsed
time between the last good previous product, and the first good next product at the right speed.
Customers today want a variety of products in just the quantities they need. They expect high
quality, a good price, and speedy delivery. Producing to customer requirements means getting
batch processes to produce in small lots. Doing this usually creates a need to reduce setup
times. The goal of setup reduction and changeover improvement should be to develop a
production system that gets as close as possible to making only what the customer wants, when
the customer wants it, throughout the production chain. The result being a strong, flexible
manufacturing operation that is adaptable to changes 7 .
Figure 2.9: Changeover Time

- 18 -
2 Key elements of Changeover :
1. Internal Activities:
Must be performed while the machine / process is stopped i.e. not making parts.
Examples of Internal Activities are:
Removing work from the machine
Removing tools dies etc
Cleaning down the work surfaces
Fixing new tools in place
Fixing the new work piece in place
Trial run and adjustment the machine
2. External Activities:
Can be performed whilst the machine / process is running i.e. making parts.
Examples of External Activities are:
Getting instructions for the next job
Getting material for the next job from stores
Getting tools for the next job from tool stores
Returning tools for the last job to tool stores
Arranging for lifting equipment to be available when required
Arranging for a setter to be available when required
6 Steps of Quick Changeover Methodology:
1. Observed the current changeover process
By video
By time study
2. Identify Internal and External Activities
Internal: Activities to be performed whilst the machine is stopped

- 19 -
External: Activities that can be performed away from the machine, while
the line is running
3. Convert activities from Internal to External setup
Example preheating
4. Increase efficiency of the remaining internal activities (or Reduce internal activities)
Minimize or eliminate adjustments
Parallel operations
Develop team work
5. Optimize the start up time
Minimize or eliminate adjustments
If you have to do adjustments, make them measurable and repeatable
6. Increase efficiency of external activities (or Reduce external activities )
Apply 5S principles
Many companies produce goods in large lots simply because long changeover times make it
costly to frequently change products. Large-lot production has several disadvantages:
Inventory waste - sorting out what is not sold costs money and ties up company
resources without adding any value to the product
Delay - customers must wait for the company to produce entire lots rather than just the
quantities a customer needs
Declining quality - storing unsold inventory increases the chance that it will have to be
scrapped or reworked, which adds cost to the product
When methods are in place to accommodate quick changeover, setups can be done as often as
needed. This means you can make products in smaller lots, which has many advantages:
Flexibility - can meet changing customer needs without the expense of excess inventory
Quicker delivery - small-lot production means less lead time and less customer waiting
time
Better quality - less inventory storage means fewer storage-related defects. Quick
changeover methods lower defects by reducing setup errors and eliminating trial runs of
the new product
- 20 -
Higher productivity - shorter changeovers reduce downtime, which means a higher
equipment productivity rate
As a broad term setup covers not only the replacement of tooling and production parts, but also
other operations, such as the revision of standards and the replacements of assembly parts and
other materials.
Usually, we begin by reducing setup time as an objective and rarely go further to change
equipment more frequently and run smaller batches. In other words, the focus is on the
technique of setup reduction rather than the objective of lean manufacturing. Setup reduction is
an important technique that supports lean manufacturing, but it is lean manufacturing that is the
driver for when and where you apply setup reduction 7 .
2.5.4 5S (Workplace Organization)
Based on Japanese words that begin with S, the 5S Philosophy focuses on effective work place
organization and standardized work procedures. 5S simplifies work environment, reduces
waste and non-value added activity while improving quality efficiency and safety 8 .
The First S: Sort (Seiri)
The first S focuses on eliminating unnecessary items from the workplace.
Sort is the first pillar of the visual work place, corresponds to the just in tine (JIT) principle of
“only what is needed, only in the amounts needed, and only when it is needed.”
Implementing this pillar creates a work environment in which space, time, money energy, and
other resources can be managed and used most effectively.
Examples:
Identify all necessary and unnecessary items.
Move unnecessary items from workplace to a designated area or “throw it out”.
Remove all excess items from working areas – work pieces, personal items etc.
Organize all remaining necessary items.
- 21 -
Designate a team to “hunt down unnecessary items”.
Red tagging: An effective visual method to identify these unneeded items is called red tagging.
A red tag is placed on all items not required to complete your job. These items are then moved
to a central holding area. This process is for evaluation of the red tag items. Occasionally used
items are moved to a more organized storage location outside of the work area while unneeded
items are discarded.
The Second S: Set-in-Order (Seiton)
The second S focuses on efficient and effective storage methods. Arrange needed items so that
they are easy to use and label them so that anyone can find them and put them away. The
second pillar, Set in order can be implemented only when the first pillar is in place. Similarly,
if sorting is implemented without Setting in order, it is much less effective. Sort and Set in
order work best when they are implemented together.
One must ask these questions in implementing Set-in-Order :
1. What do I need to do my job?
2. Where should I locate this item?
3. How many do I need?
Strategies for effective Set In Order are:
Painting floors
Outlining work areas and locations
Shadow boards
Modular shelving and cabinets
The Third S: Shine (Seiso)
It is the component that emphasizes the removal of dirt, grime and dust from the workplace. As
such shine means that we keep everything swept and clean. Having clean and bright
environment everyone can enjoy the working. When everything is kept in top condition, so that
when someone needs to use something, it is ready to be used.
- 22 -
The Fourth S: Standardize (Seiketsu)
Once the first three of the 5S’s have been implemented, one must concentrate on standardizing
best practice in the work area. Allow employees to participate in the development and
documentation of such standards. They are a valuable but often overlooked source of
information regarding their work.
Standardize means establishing “Best Manufacturing Practices, including:
Workplace Layout and Design
Materials Handling Analysis
Clear and Concise Work Instructions
Well Defined Work Methods
Safe (Ergonomic) Working Practices
Cycle Time Reduction
Training
Documentation
The Fifth S: Sustain (Shitsuke)
This is by far the most difficult S to implement and achieve. Human nature is to resist change
and more than a few organizations have found themselves with a dirty cluttered shop a few
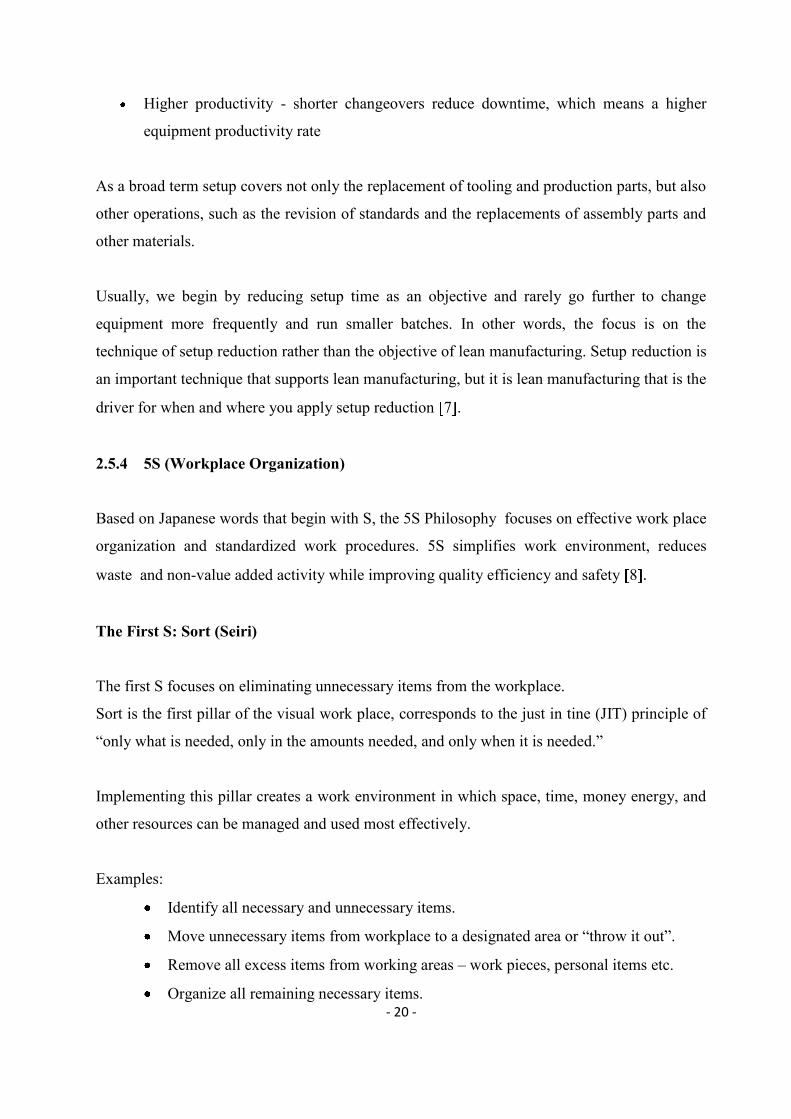
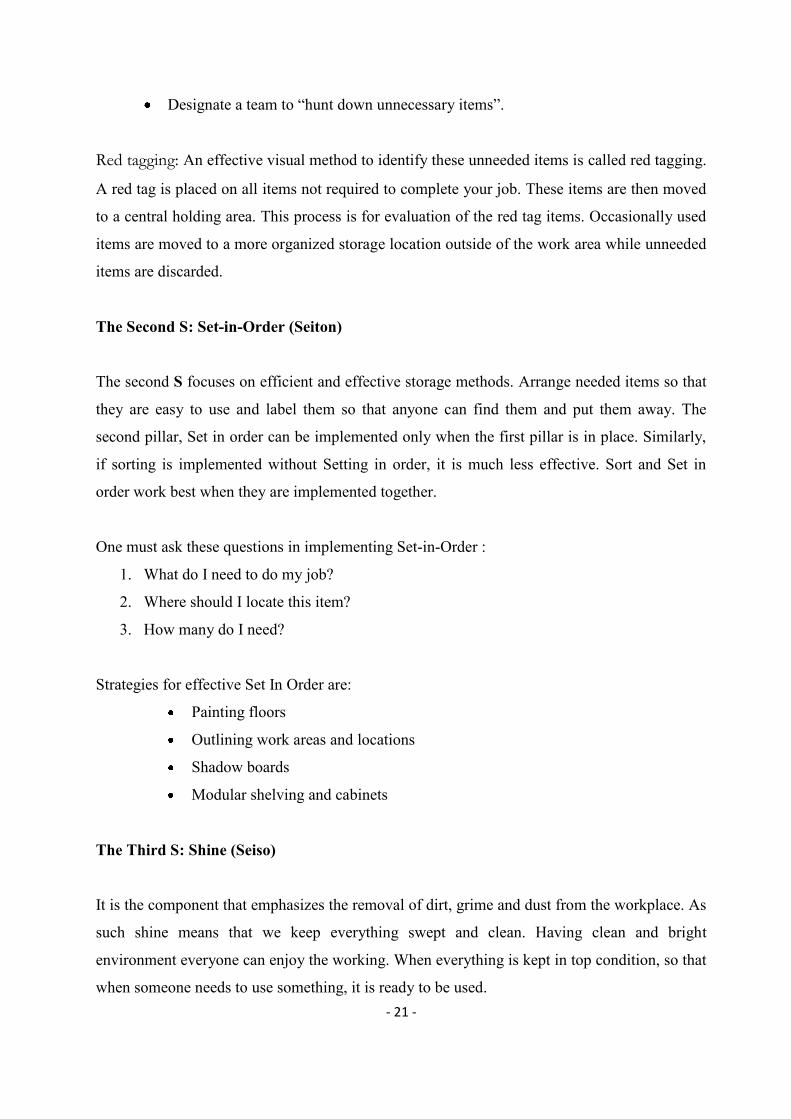
Figure 2.10: Without 5S Figure 2.11: With 5S
- 23 -
months following their attempt to implement 5S. The tendency is to return to the status quo and
the comfort zone of the "old way" of doing things.
Sustain focuses on defining a new status quo and standard of work place organization.
Factory must create conditions or structures that will help to sustain a commitment to the five
pillars such as:
Awareness: Everyone need to understand what the five pillars are and how to important
to sustain them.
Time: Everyone need to have or make enough time in the work schedule to perform 5S
daily.
Structure: Everyone need to have support for the efforts from management, in terms of
acknowledgment, leadership and resources.
Rewards & recognition: Everyones effort need to be rewarded.
Satisfaction & Excitement: Implementation of 5 Pillars must be fun and satisfying for
Everyone and the company. Excitement gets communicated from person to person
allowing 5S to build as it involves more people 8 .
Figure 2.12: 5S Team of the Month
- 24 -
Tools & Techniques to Sustain 5S Implementation:
5S Slogans: Communicate the themes of the five pillar campaign in the factory. They
can be displayed on machines, stickers, flags, or posters.
5S Posters: 5S slogans descriptions of 5S activities can be posted throughout the
workplace.
5S Photo: Story board “Picture is worth a thousand words.” Photo exhibits and Story
board showing the before and after of 5S implementation activities.
5S News letters: Are in-house news bulletin centered on five pillar topics.
5S Maps: Can also be used to get employee involved in five pillar improvement on an
ongoing basis. Those should be hung in a central location with suggestion cards
attached so anyone can suggest improvements.
5S Pocket manuals: Can be created that contains five pillar definitions and
descriptions, and is small enough to fit into the pocket of work clothes.
5S Department tours: When one department in a company has implemented the five
pillars successfully, it can serve as a model area for other departments to come visit.
Since “seeing is believing,” this technique is extremely effective for promoting 5S
implementation throughout a company.
5S Months: Campaigns should be designate two, three or four months every year as
“5S Months.” During these months, various activities such as 5S seminars, field trips,
and contests can be carried out to further promote 5S implementation in the company
8 .
2.5.5 Visual Control System
The intent of a visual factory is that the whole workplace is set-up with signs, labels, color-
coded markings, etc. such that anyone unfamiliar with the process can, in a matter of minutes,
know what is going on, understand the process, and know what is being done correctly and
what is out of place.
- 25 -
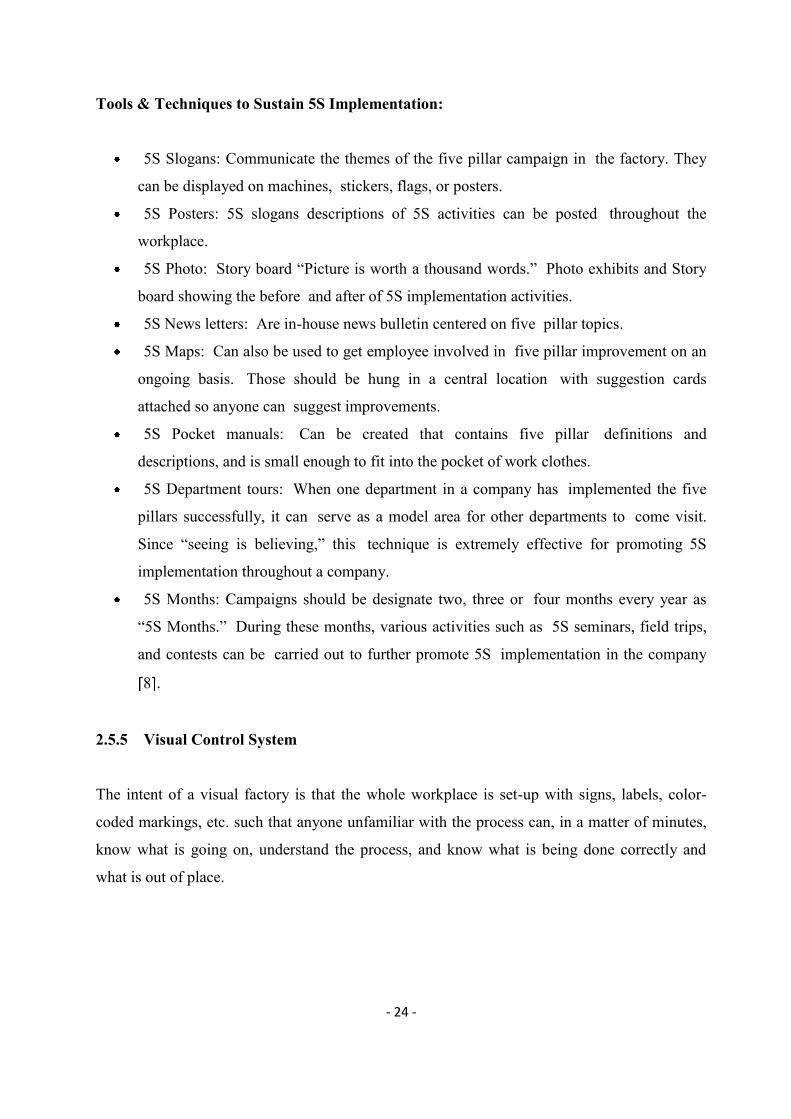
Facts and concepts:
There are two types of application in visual factory: displays and controls. A visual display
relates information and data to employees in the area. For example, charts showing monthly
revenues of the company or a graphic depicting a certain type of quality issue that group
members should be aware of.
A visual control is intended to actually control or guide the action of the group members.
Examples of controls are readily apparent in production: Inventory limits, goals, allowances of
production delays, etc.
Visual controls describe workplace safety, production throughput, material flow, quality
metrics, or other information. The most important benefit of a visual factory is that it shows
when something is out of place or missing. Visual displays and controls help keep things
running as efficiently as they were designed to run. The efficient design of the production
process that results from lean manufacturing application carries with it a set of assumptions.
Visual management is an important support for cellular manufacturing. Visual management
techniques express information in a way that can be understood quickly by everyone. Sharing
information through visual tools helps keep production running smoothly and safely. Shop
floor teams are often involved in devising and implementing these tools through 5S and other
improvement activities.
Figure 2.13: Visual Display Board
- 26 -
Visual information can also help prevent mistakes. Color coding is a form of visual display
often used to prevent errors used for sizes, part of the product.
2.5.6 Kaizen (Continuous Improvement)
Kaizen is a Japanese hybrid word. “Kai” means change and “Zen” means good (for the better).
Basically kaizen is for small incremental improvements, but carried out on a continual basis
and involve all people in the organization 8 .
Ten basic principles for Improvement in the view of Kaizen:
1. Throw out all of your fixed ideas about how to do things.
2. Think of how the new method will work-not how it won’t.
3. Don’t accept excuses. Totally deny the status quo.
4. Don’t seek perfection. A 50-percent implementation rate is fine as long as it’s done on
the spot.
5. Correct mistakes the moment they’re found.
6. Don’t spend a lot of money on improvement.
7. Problems give you a chance to use your brain.
8. Ask “why” at least five times until you find the ultimate cause.
9. Ten people’s ideas are better than one person’s.
10. Improvement knows no limit.
Kaizen steps:
Step-1 Brain Storming (5 W 1 H, 4 M)
Step-2 Theme and Goal Set-up
Step-3 Data Collection
Step-4 Classification
Step-5 Cause and Effect Analysis
Step-6 Countermeasure Set-up
Step-7 Implementation
- 27 -
Step-8 Effectiveness of Results
Step-9 Correction of Countermeasure
Step-10 Monitoring
Step-11 Standardization
2.5.7 Kanban
The Kanban system determines the production quantity in every process. It is known as the
nervous system of Lean Production. Kanban is a Japanese word that means "instruction card".
Kanbans are manual pull devices that allow an efficient means to transfer parts from one
department to another and automatically reorder products using minimum/maximum inventory
levels. A Kanban is a signal, such as an empty container returned to the start of the assembly
line, that signals the need for replenishment of materials to a user 18 .
Kanban Characteristics:
Kanban is based on management inventory system called “reordering point method”. Kanban
minimize waste by using “Level Production”. Level production depends on setup time
reduction “Quick Changeover”. Kanban system serves as the production order for the Pull
system. The order point is determined by the pacemaker based on the Takt time. Order
Information travels Upstream from sales demand to assembly to Suppliers - The Pull system
travels from Downstream to Upstream 19 .
Functions of Kanban:
The Kanban system has several important functions:
1. A communication system
2. Pick Up and work order information
3. Elimination of overproduction waste
4. A tool for visual control
5. A tool for promoting improvement
- 28 -
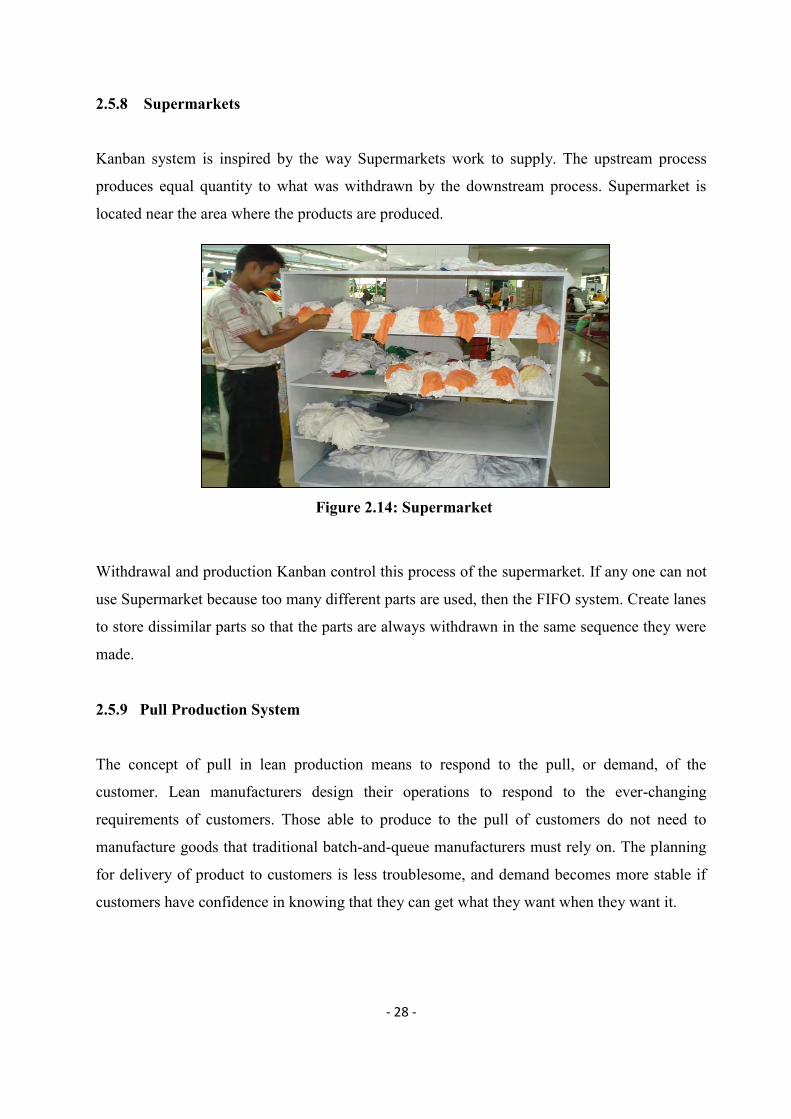
2.5.8 Supermarkets
Kanban system is inspired by the way Supermarkets work to supply. The upstream process
produces equal quantity to what was withdrawn by the downstream process. Supermarket is
located near the area where the products are produced.
Withdrawal and production Kanban control this process of the supermarket. If any one can not
use Supermarket because too many different parts are used, then the FIFO system. Create lanes
to store dissimilar parts so that the parts are always withdrawn in the same sequence they were
made.
2.5.9 Pull Production System
The concept of pull in lean production means to respond to the pull, or demand, of the
customer. Lean manufacturers design their operations to respond to the ever-changing
requirements of customers. Those able to produce to the pull of customers do not need to
manufacture goods that traditional batch-and-queue manufacturers must rely on. The planning
for delivery of product to customers is less troublesome, and demand becomes more stable if
customers have confidence in knowing that they can get what they want when they want it.
Figure 2.14: Supermarket
- 29 -
Pull Production has 2 Aspects:
1. In manufacturing, Pull production is the production of items only as demanded or consumed
by the customer.
2. In material control, Pull production is the withdrawal of inventory only as demanded by the
using operation. Materials are used only when a signal comes from the downstream user.
Three unique aspects of Pull:
1. Production is Music: In a factory the melody is the flow of work pieces down the line
Kanban and 1 Piece flow creates the melodic result.
2. The next process is Your Customer: The downstream process is the customer of the
upstream process Creates reliability, consistency and just in time compare to the PUSH
system.
3. Stop & Go versus Process & Go Production:
2.5.10 Pull Quality System
In a Pull System, quality inspection and prevention become every operator’s responsibility.
There are 5 levels of quality systems in lean production:
1. Independent Inspection
2. Operator inspection of product as they are made
3. Inspection by downstream operator as they are received
4. Mistake – proofing on errors – standardization
5. Supplier process control
The rules of quality in PULL Production:
1. Never allow a defective product to be pulled into your workstation
2. Never produce a defective product at your workstation.
3. Never allow a defective part to be pulled from your workstation.

- 30 -
2.6 SUPPORTING STRATEGIES FOR LEAN
2.6.1 Takt Time
Takt" is the German word for musical meter, which came into Japan in the 1930s when the
Japanese were learning aircraft production from German aerospace engineers.
Takt time is the tool to link production to the customer by matching the pace of production to
the pace of actual final sales. First, calculate actual Takt times for each product and part. Then
use the time required for each product and part to determine the time that should be allotted to
each actual process in the entire production chain.
Simply, Takt Time is the rate of customer demand. How often the customer requires one
finished item. Takt time is used to design assembly and pacemaker processes, to assess
production conditions, to calculate pitch, to develop containers and routes for material
handling, to determine problem-response requirements, and so on. Takt is the heartbeat of a
lean system 8 .
Takt Time as Pace of Sales:
It is used to synchronize the pace of production with the pace of sales.
Effective working time (minutes worked-breaks) Takt time = Customer demand during that time (Pieces)
2.6.2 Team Building
Building an organization that effectively uses teams throughout its operation is challenging in
and of itself. Just trying to establish teams is unlikely to do much for introducing lean
manufacturing. Good teamwork in the front office and on the shop floor does take training and
development, but it is during the development and transformation to lean manufacturing that
creates both a need and an environment for teams.
- 31 -
Establishing product- based work arrangements make individual processing steps dependent on
another. In such a production environment, individuals must be able to work as a team.
Producing only to customer requirements takes out work-in-process and demand producing and
delivering high quality throughout the production chain. These types of changes lay the
groundwork for individuals to become part of teams. The natural progression is to incorporate
team building into the implementation of lean manufacturing 14 .
2.6.3 Balanced Flow
In principle, it is best to start Lean Manufacturing improvements as close as possible to the
customer. That would mean taking the "next process is your customer" approach to all
activities. This is called vertical development of Lean Manufacturing improvements - lateral
improvements are when they are moved to other products.
Many think of leveling as leveling out two factors - capacity and load. For Lean Manufacturing
improvement, leveling means thoroughly leveling out product types and volumes in accordance
with customer needs. Begin by breaking down the production output into small (usually daily
units). Then compare the daily volume of product with the operating hours and calculate how
many minutes it should take to turn out each product unit. This unit production is "cycle time".
Then figure how many people are needed and what the capacity is.
2.6.4 Quality at the Source
In traditional manufacturing environments, quality inspections usually occur at receipt of goods
and through sampling after a product's final assembly. In lean manufacturing environments,
inspections (and product rework) are accommodated at any point in a product's life, as it is
being produced 17 .
Facts and concepts:
This is accomplished by determining equipment (or other manufacturing) parameters
that produce good parts, then rigorously monitoring and adjusting each operation to
meet these parameters.
- 32 -
Employees are empowered to stop the equipment (or the equipment is built to stop on
its own) when the process drifts outside the parameter limits.
Often combined with this is a program to error-proof each manufacturing step (called
Poka-Yoke). This involves equipping machines or workstations with devices to assure
that parts can only be made the correct way.
2.6.5 Zero Quality Control
Product defects hurt the company's reputation with its customers and waste valuable resources
in scrap and rework. Companies that pursue low-inventory production no longer have a large
buffer to absorb quality defects. To keep production moving smoothly, it is especially
important to prevent defects 17 .
Mistake proofing is an effective quality assurance approach that prevents defects by catching
errors and other nonstandard conditions before they actually turn into defects. The mistake-
proofing system known as Zero Quality Control ensures zero defects by inspecting the
processing conditions for 100 percent of the work, ideally just before an operation is
performed. If an error is discovered, the process shuts down and gives immediate feedback
with lights, warning sounds, and so on.
Zero Quality Control Elements:
Source inspection to catch errors before they become defects
100 percent inspection to check every work piece, not just a sample
Immediate feedback to shorten the time for corrective action
Poka-yoke (mistake-proofing) devices to check automatically for abnormalities
2.6.6 Poka - Yoke (Mistake-Proofing)
Because people can make mistakes even in inspection, mistake-proofing often relies on sensing
mechanisms called Poka-Yoke, which check conditions automatically and signal when
problems occur. Poka-Yoke devices include electronic sensors such as limit switches and
photoelectric eyes, as well as passive devices such a positioning pins that prevent backward
insertion of a work piece. Poka-Yoke devices may use counters to make sure an operation is
repeated the correct number of times.
- 33 -
The key to effective mistake-proofing is determining when and where defect-causing
conditions arise and then figuring out how to detect or prevent these conditions, every time.
Shop floor people have important knowledge and ideas to share for developing and
implementing poka-yoke systems that check every item and give immediate feedback about the
problem 13 .
2.6.7 Employee Involvement
All innovations and improvements start with everyone in the organization becoming aware of
the need for change and the role each will play in the realization of that change. The most
important step is to begin by catching people's attention and raising their awareness.
Lean manufacturing means more than changing production methods. The awareness for change
must begin at the top of the company and establish a sense of urgency that "trickles" down to
the next level and ultimately to the shop floor. There are many ways to start this chain-reaction
(in-house training, team building work shops, shop floor study or work teams, etc.) The one
key element is that it must be fully understood that the status quo is not enough to ensure the
company's survival in the future 14 .
Following are some considerations regarding employee involvement when implementing Lean
strategies:
Ensure that people are fully trained and truly empowered
Provide widespread orientation to continuous improvement, quality, training and
recruiting workers with appropriate skills
Create common understanding of the need to change to lean
Fully prepare and motivate people
Share information and manage expectations
Identify and empower champions, particularly operations managers
Remove roadblocks (i.e. people, layout, systems)
Create an atmosphere of experimentation, toleration, patience, risk taking
Install "enlightened" and realistic performance measures, evaluation, and reward
systems
Do away with rigid performance goals during implementation
- 34 -
2.6.8 Stabilized Operations
It is difficult if not impossible to improve your aim at a moving target. The same principle
applies to lean manufacturing. It is important to establish a baseline in order to take the next
steps in improving the capability of the production system. Having established product-based
work cells, synchronized flow and small lot production, you want to achieve not just
demonstrated performance but proven performance. Demonstrated performance is the ability to
do it once. Proven performance is the repeatability that comes from having an effective process
in place and having the supporting infrastructure holding it up.
Having made the transformation to lean, how can we keep the systems operating at a high level
of efficiency and continually improving? Without continuous improvement the lean system
will not just stay the same - they will degrade. Achieving a stabilized operation or
demonstrated performance is the first challenge - proven performance is the next 15 .
2.6.9 Standardized Work
Standard work is a term used to systematize how a part is processed, and includes man-
machine interactions and studies of human motion. Operations are safely carried out with all
tasks organized in the best known sequence and by using the most effective combination of
resources:
People, Materials, Methods, Machines
Facts and concepts:
Manufacturing engineers break down each operation into small pieces, making certain
that each worker is given all the tools to make the part quickly and with the highest
quality.
The process is documented in writing, with photographs and video, and examples of
defective products nearby. This is done to eliminate errors that waste time and money,
and ensure reproducibility from operator-to-operator.
One of the challenges of senior management is to ensure that everyone in the
organization understands the challenges of the marketplace, accepts the performance
metrics, and believes in the company's values, mission, and vision.

- 35 -
Standardization must occur not only within the area, but across the entire plant as well. This
will include paint and color standards for safety elements, equipment operation instructions,
floor markings, building interior and exterior, material labeling, etc. By creating standards and
defining procedures, there will be commonality across the entire organization 15 .
Benefits:
Successful standardization of work processes helps assure high quality product, proud workers,
satisfied customers, workplace safety, and strong factory cost performance. Reducing variation
in the shop floor environment leads to remarkable productivity improvements.
2.6.10 Equipment Replacement
There are many ways to make the same product. Sometimes all it takes is a very simple tool.
New technologies and improvements to equipment should not be overlooked. However, the
principle issue is to build in quality and designing operations and equipment so that people are
not tied to machines but is free to perform value-added work that is appropriate for humans.
If you invest in new equipment or new technology that requires people to watch them just to
make sure they are performing properly, you must ask "Who is working for whom?"
2.6.11 Continuous Improvement
The transition to a lean environment does not occur overnight. A continuous improvement
mentality is necessary to reach your company's goals. The term "continuous improvement"
means incremental improvement of products, processes, or services over time, with the goal of
reducing waste to improve workplace functionality, customer service, or product performance
(Suzaki, 1987). Continuous improvement principles, as practiced by the most devoted
manufacturers, result in astonishing improvements in performance that competitors find nearly
impossible to achieve. Lean production, applied correctly, results in the ability of an
organization to learn. As in any organization, mistakes will always be made. However,
mistakes are not usually repeated because this is a form of waste that the lean production
philosophy and its methods seek to eliminate 8 .
- 36 -
CHAPTER - 3
ESTABLISHING CELLULAR LAYOUT
3.1 INTRODUCTION
Companies converting to Cellular Manufacturing (CM) often struggle with implementation and
achieve results that are less than anticipated. The reorganization of work necessary to convert
from functional to cellular manufacturing (CM) has an impact on an organization’s culture.
However, organizational culture, acting as a strong barrier to change, also affects how cells are
designed and implemented 11 .
Conveyors and Skill centers are still well suited for mass production lines. They force everyone
to maintain a certain pace and production yield tends to reach the estimated levels. But they are
not suited for wide-variety small lot production lines, however, because they require
simultaneous changeover for the whole line and this creates changeover waste 12 .
Cellular manufacturing emerged as a production strategy capable of solving the problems of
complexity and long manufacturing lead times in batch production.
3.2 CELL DESIGN
Cell Layout Categories:
There are many shape designs depending on the type of product: Is it continuous on product or
variety of products.
U– Shaped Cell
L - Shaped Cell
II - Shaped Cell
S – Shaped Cell
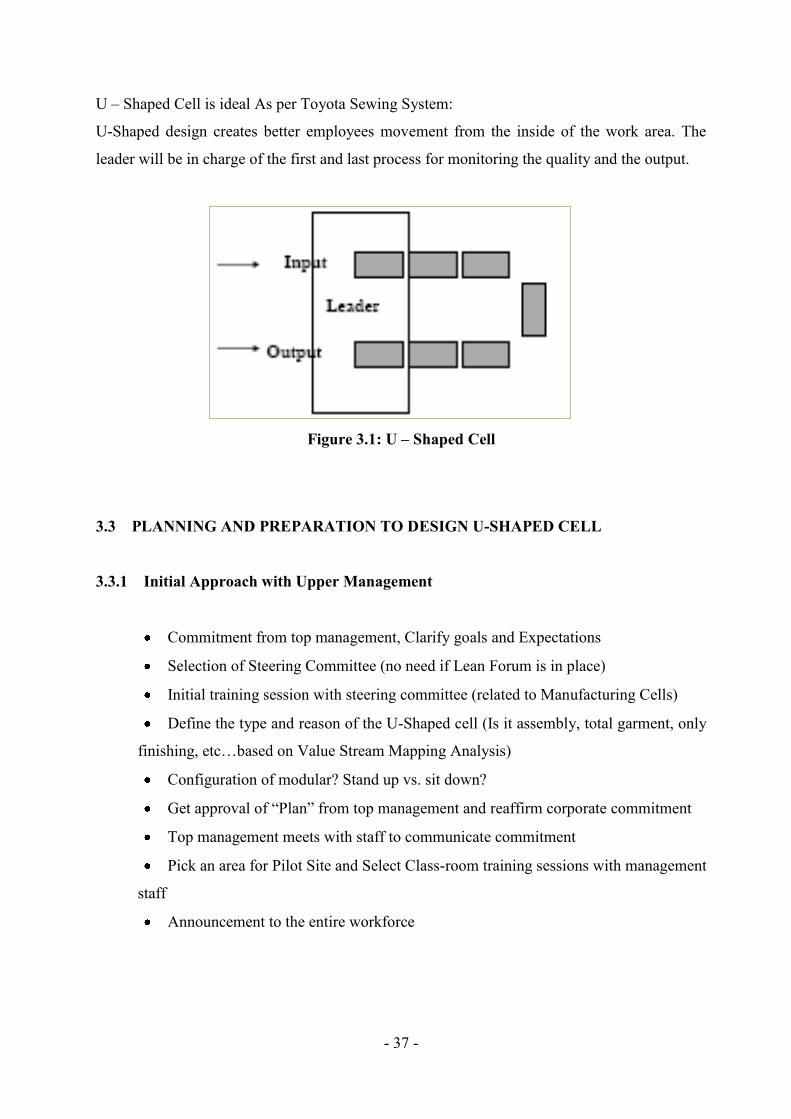
- 37 -
U – Shaped Cell is ideal As per Toyota Sewing System:
U-Shaped design creates better employees movement from the inside of the work area. The
leader will be in charge of the first and last process for monitoring the quality and the output.
3.3 PLANNING AND PREPARATION TO DESIGN U-SHAPED CELL
3.3.1 Initial Approach with Upper Management
Commitment from top management, Clarify goals and Expectations
Selection of Steering Committee (no need if Lean Forum is in place)
Initial training session with steering committee (related to Manufacturing Cells)
Define the type and reason of the U-Shaped cell (Is it assembly, total garment, only
finishing, etc…based on Value Stream Mapping Analysis)
Configuration of modular? Stand up vs. sit down?
Get approval of “Plan” from top management and reaffirm corporate commitment
Top management meets with staff to communicate commitment
Pick an area for Pilot Site and Select Class-room training sessions with management
staff
Announcement to the entire workforce
Figure 3.1: U – Shaped Cell
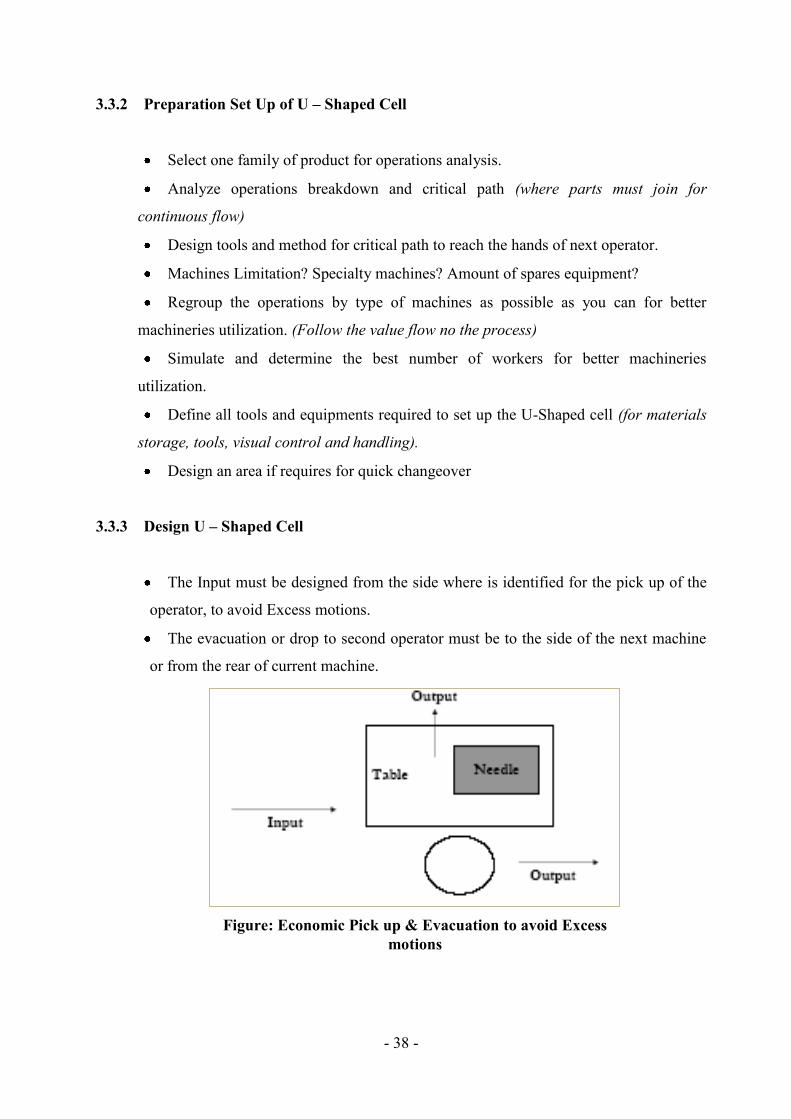
- 38 -
3.3.2 Preparation Set Up of U – Shaped Cell
Select one family of product for operations analysis.
Analyze operations breakdown and critical path (where parts must join for
continuous flow)
Design tools and method for critical path to reach the hands of next operator.
Machines Limitation? Specialty machines? Amount of spares equipment?
Regroup the operations by type of machines as possible as you can for better
machineries utilization. (Follow the value flow no the process)
Simulate and determine the best number of workers for better machineries
utilization.
Define all tools and equipments required to set up the U-Shaped cell (for materials
storage, tools, visual control and handling).
Design an area if requires for quick changeover
3.3.3 Design U – Shaped Cell
The Input must be designed from the side where is identified for the pick up of the
operator, to avoid Excess motions.
The evacuation or drop to second operator must be to the side of the next machine
or from the rear of current machine.
Figure: Economic Pick up & Evacuation to avoid Excess motions
- 39 -
The evacuation or drop to second operator must be to the side of the next machine
or from the rear of current machine.
Reduce the travel distances for all parts required or balancing action.
Design tools where parts could be placed close to the machine
Design side tables where minimum and maximum inventory can be noticeable with
a glance.
Implement Visual controls indicators that team members can visualize easily.
Place the machineries as close as to each other for quick flow
Assure parts movement close to next operators hands
Determine extra space for additional machineries for support when is needed.
3.4 PLANNING, PREPARING AND STABILIZING THE CONCEPT
If it is trial concept, the core team must assure the best selection methodology that suits the
core objectives. Trial concept is initiated to develop best practices, so having positive attitude
and good skill workers make much easier to successfully achieve the objctives.
3.4.1 Selection of the team
Method One:
Management typically, selects operators for its first module in the 95% to 120% range
performance. The selection process begins by looking at a number of criteria.
Criteria (1) Skilled operators (as per product selection)
Criteria (2) Flexibility
Criteria (3) Attitude
Criteria (4) Attendance
Criteria (5) Quality
Method Two:
Management selects two team leaders, who then select the remainder of the team.
The goal here is to select two outstanding operators. Team members actively participate in the
selection process. This typically helps to form a bond or commitment within the team.
Members should be capable to get along.
- 40 -
3.4.2 Evaluation Prior to Implementation
This is related to layout design, handling, 5S and visual management
Evaluate the Ergonomic Aspect of the Set up
Assure Pathway is clear as per compliance
Assure the set up is based 5S and visual management System
Assure parts are at the reach of each worker without incurring any Waste
Assure measurements systems are in place for workers to monitor the corporate
objectives
Assure the special machineries are used efficiently
Assure the Non start buffer is visually indicated
3.4.3 Management System, Responsibilities and Procedures
Management system and procedures must be set such as Kanban, Visuals, Quality at the
source, etc.
Further to Kaizen Events, the leader has to standardize the developed ideas within the new
concept.
Anticipated levels of inventory?
Procedures for quality and handling repairs?
Quality Procedures? In-Line? Audits? Quality grades?
Operating procedures? Size of Cut lots? Bundles sizes? Pay coupons?
Supplies - threads, tickets, etc.?
Level of group participation in decision-making? What kind of decision?
How to cover for absenteeism?
Procedure for selecting the team? By efficiency levels ? Volunteers? Self-selection ?
Type of incentive Pay Plan?
Skill, Management system and Investment:
Define Skill Requirement
Set Training / Cross training programme as per Skill requirements?
Supervision role?
Start-up Costs? Moving machines, operators training costs?
Start and time frame?
- 41 -
3.4.4 Team Criteria
Three criteria that the members should remember:
Team must perform a complete task
Team work together to achieve objectives (quality, cost, lead-time)
Their Pay is a result of group performance
3.4.5 Flexibility Development
Once the contingency plan is made, there should be a listing of topics in addition to who will
need to be cross-trained? Cross training must be completed before launching line balancing
kaizen event. Need to integrate the management information system into the Flexibility
Development.
Define Skill Requirement (as per operation simulation of the value stream)
Evaluate Team Members Skill (Use an operation matrix to determine the cross –
training requirement)
Create Cross – Training plan:
Skill development (members could help each other)
Machineries adjustment
Quality requirements, measure, adjust and correct
Teach about Lean:
Why team work? Advantages to the conventional system
Objectives, Rules and Policies
Quality Policies
5S, Quick Changeover, Zero Defect Quality
Introduction to all reports and documents
Cell Design and procedures
Role of members and Leader
Scientific elements (Takt time, Leveling, balanced flow, etc)
Team activities (empowerment, involvement, etc.)

- 42 -
CHAPTER - 4
ORGANIZATIONAL PROFILE
4.1 FACTORY PROFILE
XY Apparels Ltd. is an export oriented vendor located in Karnapara, Saver, Dhaka.
XY Apparels Ltd. typically operates on FOB Basis with average plant efficiency of 33%.
Given this poor performance compared to world standards it is clear that a major
improvement in productivity could turn the manufacturing activities into profitable
operations and thereby enable XY Apparels Ltd. to absorb the reduction in prices.
Obviously, the financial performance of the entire plant is keyed to the performance of the
sewing machine operators and other line employees, working on SMV (direct labor).
XY Apparels Ltd. produces range of Knitwear as styling depends on market requirement
and orders availability. Their core competency relies on Knitted Garments. The main
buyers are ZARA & BERSHKA on high season.
XY Apparels Ltd. total workforce consists of 2808 employees of which 2527 workers are
directly involved in the manufacturing process split over 36 production lines with 26
operators per line and 12 helpers.
4.2 MANAGEMENT SYSTEM ATTRIBUTES
4.2.1 Quality Practices
Workers :
Workers are not well informed regarding Quality issues before starting the production.
No training on new style about Quality Issues to SMO.
After entering the input the line QC checks the Quality of the garments.
Not given any paper or written documents to the SMO related to Quality.
There is not any pre-discussion with SMO, discussion only when problem rise.
- 43 -
Line QC :
Line QC Receives measurement sheet form the Quality Control Manager.
Line QC sends Production report regarding quality to the Quality Manager per day.
Line QC doesn’t attend PP meeting.
End Line QC :
Hourly Quality report to the manager but not practicing.
Measurement sheet on board by Line QC.
Quality Auditor :
Informed about all Quality issues from P.P. Meeting.
After P.P meeting QA arrange meeting with Line QC about quality issues.
Quality Control Manager :
Arrange a meeting after P.P Meeting regarding Quality
Participants: Quality Control Manger, Quality Controller, Quality Auditor and Line
Quality Controller
Line chief, Supervisor, SMO don’t attend the meeting
There is no training activities to SMO regarding Quality
There no visual control activities to SMO.
4.2.2 Planning Department
Planning executive (PE) & head of the Operations execute planning according to
merchandising dept. info
PE uses the software (Excel formula) for planning for every dept.
Planning dept. give the plan to every dept (Knitting, dyeing, cutting, sewing etc. dept.)
Sewing floor production plan done by PM
PM see the operators target provided by IE, but doesn’t exactly follow the SMV , he
actually do the sewing production plan on experiences
They do preproduction planning (IE, PM, Line Chief)
PM decide the line Chief for what style will be running
- 44 -
According to PM instruction the supervisor go to the cutting to see that style cutting
was completed
Line supervisor collect the cut fabrics & accessories, for that they collect approval
from production accounts (using KANDARI soft)
But some time accessories are not available on time at store
They are running production some times without ensuring all type of accessories, so
they face problem.
No coordination between what is planned and what is required.
4.2.3 Labor
Absenteeism is 5-7% but no action plan to control it;
Following Govt. labor law for labor issues;
Required no of workers is measured by IE dept. based on SMV but problem in
measurement process;
There is no standardization of job description and job responsibility but they are going
to make it standardize;
No incentive reward system for workers except 100% attendance bonus;
Arrangement of sewing training for newly recruited helpers which takes 1 month
Overtime is imposed in many of the cases averaging 3 hours per day per worker
XY Apparels Ltd. is going to arrange worker awareness program
Management is going to introduce KPI for worker and supportive management and
after that reword or inventive will be provided based on it.
4.2.4 Industrial Engineering
Using GSD to establish minutes.
Despite using GSD, Targets are adjusted manually based on production
recommendations
When target is not achieved, adding extra workers as the ultimate solution
They do not include time of (Helper) in SMV
Helpers are contributing to the SMV which false the productivity calculation
SMV data and skill inventory are available
Cutting plan is prepared based on cycle time
- 45 -
raining school is available.
One month training for fresh operators.
4.3 FACTORY PERFORMANCE
Performance improvement is suffering at all levels causing an increase in the unit’ cost.
XY Apparels Ltd. unknowingly invests significant amounts of resources into unprofitable
product lines or activity, rather than concentrating efforts on more profitable products and
added-value activities.
4.3.1 Financial Issues
Based upon on-site observations, It found that SMV in relation to the production process
covering the operations is based on predetermined time system, such as those developed
by GSD etc. There are many instances discrepancy and misleading data in unit costing and
productivity analyses. Productivity analysis is based only on sewing operators as a result
they do not reflect the reality of factories practices in which 12 helpers in each line are
contributing to this SMV.
4.3.2 Production and set-up issues
Variation in SMV (Standard Minutes Value) is very high as there are no industrial
engineering follow-ups to transfer methods to workers as designed. Moreover to that, the
activities are not standardized so that every activity can be performed in the same manner.
Therefore machine operators are doing their job as they want resulting different method
adaptation for same operation in different work stations.
Variation in SMOP (Sewing Machine Operator’ Paste) due to workers skill specialization.
Workers paste fluctuates continuously leading to lack of balancing amongst workstations.
Workers are more individual players rather than team player. Lack of Line balancing is
averaging in 41%.
“Production lines” are too large employing large numbers of employees. This makes it
impossible to handle order less than 4 days of production in term of line balancing and
production loading to each workstation on a continuous flow in the current condition of
parts handling.

- 46 -
Machineries changeover in the course of style change is extremely high averaging in 44.92
minutes per employee per day. Workers must change location depend on layout planning
creating another unavoidable delay related to labor utilization. This concept will make it
difficult if XY Apparels Ltd. move into only 5 to 8 days production.
“Machineries Adjustment” to the quality standards and the sewing norms is totally
dedicated to the maintenance department and sewing operator are not trained yet to
undertake any minor adjustment or to adjust the machine back in case of quality issues.
Therefore the time taken to take precaution action for any malfunction of machineries, are
very high affecting the total supply chain, one is down the entire chain is down. In many
cases sewing operators are idle while the mechanics staffs are feeding and setting new
production line.
4.3.3 Labor Issues
Sewing machines operators are not performing as well as they can despite the great
dexterity and high speed they have. Due to lack of systems and work methods, this speed
hasn’t been put into a continuous motion and high productivity and as a result is a major
contributor to hesitation, delays, and poor performance. The key to improvement is the
middle management and the integration of industrial engineering activities. The more
skills and knowledge they have the easier to improve the situation quickly.
Absenteeism among the direct workers represents 7% which is significant. This clearly
indicates that there is lot of reasons which generates within XY Apparels Ltd. for the
employees to be absent that ultimately cut into the productivity.
4.3.4 Management Issues
Line Staffs and middle management aren’t objective oriented in relation to cost and lead
time. Line supervisors’ act as general workers, middle management is chasing orders
troubleshooting, and there is no creativity input from the work-studies staffs to the
production lines.
Lack of “Industrial Engineering” through the cutting and sewing processes had resulted in
a big factor of delay for the cutting workers and sewing operators. Work-studies staffs’
role is to seek the most economical and practical method of flowing the parts from the
previous to the next operation and then implementing this among the sewing operators and
manual workers rather than having batches of chain.

- 47 -
There’s no costing analysis per section based on product - buyers – unit costing to
determine the product profitability and to specify the areas of improvement through the
development and production process. This should be done on a daily basis. The factories
have a hard time in evaluating the losses and overcoming the problems in order to
eliminate excess costs and to improve profitability. Reducing unit price becomes a puzzle
for them. Learning the techniques of problem solving and troubleshooting is must to
continuously improve.
4.3.5 Quality Issues
Quality is suffering at all levels, resulting in time waste. Generally, quality cost is too high
due to lack of knowledge of the quality standards and flexibility on behalf of the sewing
operators. Information relative to the buyer quality criteria is not communicated to the line
people in many cases.
So awareness of quality improvement techniques, initiation to the quality requirement and
what is expecting as quality result don’t get to those best able to use them, the sewing
operators.
- 48 -
CHAPTER - 5
WORK PLAN: CURRENT STATE
5.1 ASSESSMENT (CURRENT STATE)
This Lean assessment process is used as a getting-started tool to identify the waste that
blocking corporate performance. Both qualitative and quantitative, the assessment covers
8 wide-ranging categories — from material and information flow, to process razing and to
problem-solving. A quantitative score helps to measure progress year-over-year, while
qualitative feedback includes specific details, information on broad trends and issues as
well as suggestions on how XY Apparels Ltd. can eliminate the waste meeting the
management desired state.
The Lean assessment study covers the Manufacturing Processes such as: Cutting, Sewing,
Finishing, Packing and Cartooning.
XY Apparels Ltd. data:
Daily Working hours: 8 hours
Daily Overtime Peak season 2 hours
Yearly Working Days: 295
Selected Product for mapping: Long sleeve T-shirt
Absenteeism: 7%
Selected Production line: Line: V
Days for order changeover: 4 Days

- 49 -
5.2 LEAN METRICS - FINDINGS
Table 5.1: Lead Time and Time Utilization Analysis
Factory Name: XY Apparels Ltd. Product Name: Long Sleeve T-Shirt Order No: 64674
Buyer: Zara Style: A-04 Line: V
Methods of Measurement: VSM (Value Stream Mapping)
Activity category Details Cutting
(Minutes)
Sewing &
Finishing (Minutes)
Finishing (Cartooning)
(Minutes)
Current State (Minutes)
Value added 95 188.85 2.75 286.60 11%
Unavoidable Non Value
Added Activities
Marking
138 3.28 5 146.28 5%
Spreading Quality inspection Folding , unfolding Trimming Bundling Sorting Travel to next operation Travel to next process
Non Value Added
Activities
Waiting for next operation 1179 1006 60 2245.00 84%
Waiting for next process
Processing time (Value Added and Unavoidable Activities)
233.00 192.13 7.75 432.88 16%
Retention time (Non Value Added Activities)
1179.00 1006.00 60.00 2245.00 84%
Lead Time 2677.88 4.06
Day
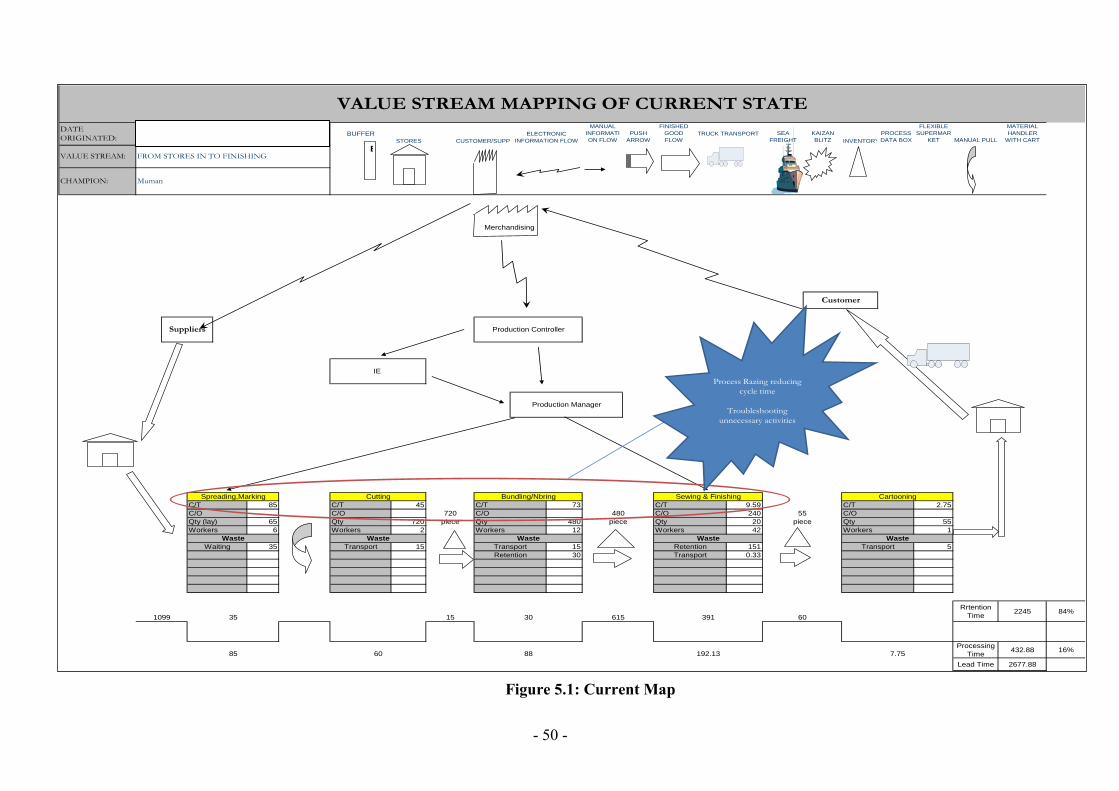
- 50 -
STORES CUSTOMER/SUPPLIER
MANUAL
INFORMATI
ON FLOW
PUSH
ARROW
R/M &
FINISHED
GOOD
FLOW
SEA
FREIGHT
KAIZAN
BLITZ INVENTORY
PROCESS
DATA BOX
FLEXIBLE
SUPERMAR
KET MANUAL PULL
MATERIAL
HANDLER
WITH CART
85 45 73 9.59 2.75
240
65 720 480 20 55
6 2 12 42 1
35 15 15 151 5
30 0.33
Rrtention
Time2245 84%
Processing
Time432.88 16%
Lead Time 2677.88
CHAMPION:
DATE
ORIGINATED:ELECTRONIC
INFORMATION FLOW
VALUE STREAM:
26-Oct-08
FROM STORES IN TO FINISHING
BUFFER
Qty (lay)
C/O
TRUCK TRANSPORT
Spreading,Marking
C/T
Suppliers
Muman
1099
Workers
Waste
Waiting
Cutting
C/T
C/O
Qty
Transport Transport
Merchandising
Production Controller
IE
Bundling/Nbring
C/T
C/O
Qty
Workers
Waste
Transport
Customer
55
piece
Sewing & Finishing
C/T
C/O
Retention
Production Manager
Retention
480
Qty
Workers
Waste
60
piece
Workers
15 61535 30
85 88
720
Waste
391
piece
Workers
Waste
Transport
Cartooning
C/T
C/O
Qty
7.75
60
192.13
VALUE STREAM MAPPING OF CURRENT STATE
B
Process Razing reducing
cycle time
Troubleshooting
unnecessary activities
Figure 5.1: Current Map
www
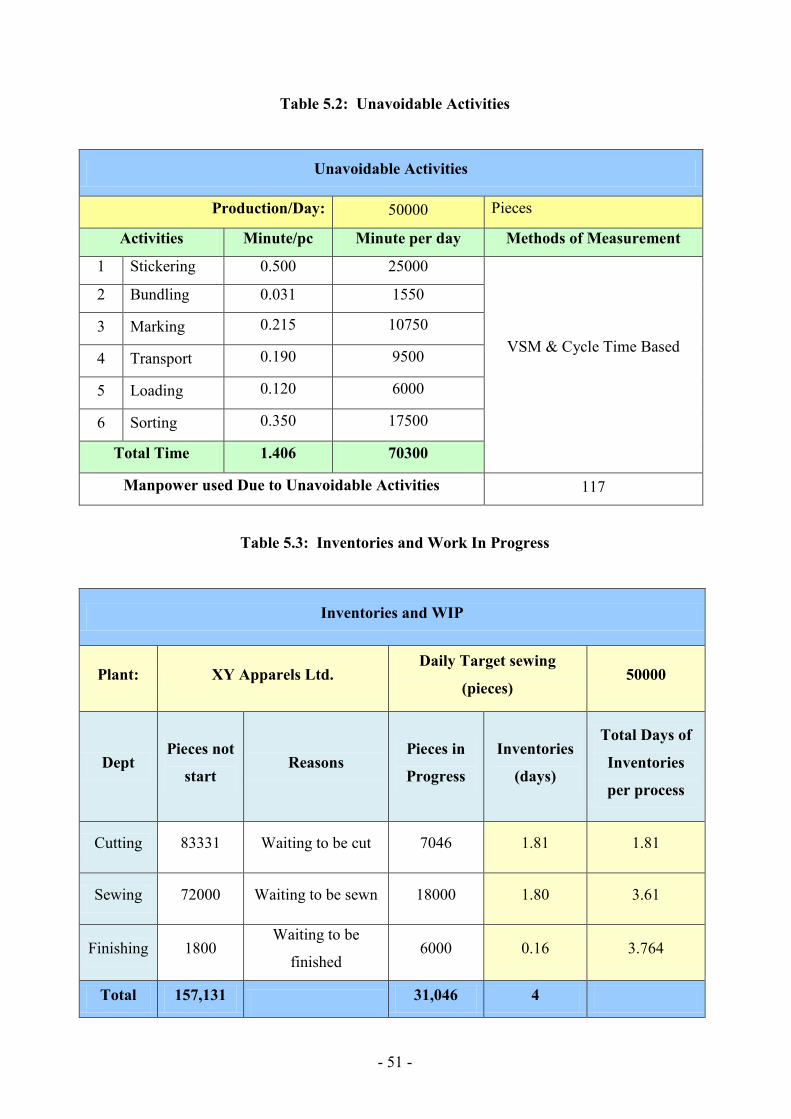
- 51 -
Table 5.2: Unavoidable Activities
Unavoidable Activities
Production/Day: 50000 Pieces
Activities Minute/pc Minute per day Methods of Measurement
1 Stickering 0.500 25000
VSM & Cycle Time Based
2 Bundling 0.031 1550
3 Marking 0.215 10750
4 Transport 0.190 9500
5 Loading 0.120 6000
6 Sorting 0.350 17500
Total Time 1.406 70300
Manpower used Due to Unavoidable Activities 117
Table 5.3: Inventories and Work In Progress
Inventories and WIP
Plant: XY Apparels Ltd. Daily Target sewing
(pieces) 50000
Dept Pieces not
start Reasons
Pieces in
Progress
Inventories
(days)
Total Days of
Inventories
per process
Cutting 83331 Waiting to be cut 7046 1.81 1.81
Sewing 72000 Waiting to be sewn 18000 1.80 3.61
Finishing 1800 Waiting to be
finished 6000 0.16 3.764
Total 157,131 31,046 4
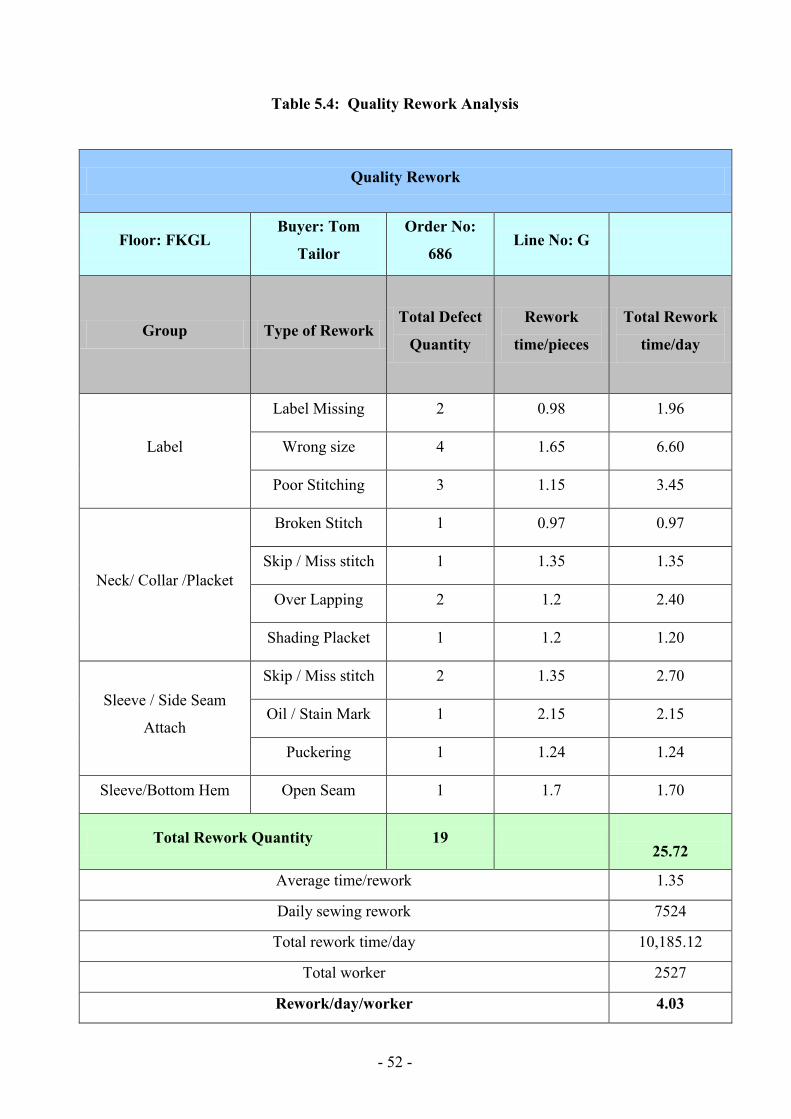
- 52 -
Table 5.4: Quality Rework Analysis
Quality Rework
Floor: FKGL Buyer: Tom
Tailor
Order No:
686 Line No: G
Group Type of Rework Total Defect
Quantity
Rework
time/pieces
Total Rework
time/day
Label
Label Missing 2 0.98 1.96
Wrong size 4 1.65 6.60
Poor Stitching 3 1.15 3.45
Neck/ Collar /Placket
Broken Stitch 1 0.97 0.97
Skip / Miss stitch 1 1.35 1.35
Over Lapping 2 1.2 2.40
Shading Placket 1 1.2 1.20
Sleeve / Side Seam
Attach
Skip / Miss stitch 2 1.35 2.70
Oil / Stain Mark 1 2.15 2.15
Puckering 1 1.24 1.24
Sleeve/Bottom Hem Open Seam 1 1.7 1.70
Total Rework Quantity 19
25.72
Average time/rework 1.35
Daily sewing rework 7524
Total rework time/day 10,185.12
Total worker 2527
Rework/day/worker 4.03

- 53 -
Table 5.5: Changeover Time Analysis
Changeover Time
Measurement Keys Waste Current State Remarks
Order Changeover
Machines Adjustment
240
Basic T-shirt / Tang
top/ Set (top or
bottom) / Polo shirt
Operators movement
Machines Movement
Training
Monthly changeover 180
Monthly changeover time (min) 43200
Total Worker / Line 32
Days for order changeover 6
Changeover/day/ worker 40.00
Table 5.6: Productivity Analysis
Productivity
Factory Name: XY Apparels Ltd.
Order No: 64674 Dept: Sewing
Buyer: Zara Product Name: Long Sleeve T-Shirt
Style: A-04 Line: V
Total Manpower 32
SMV 3.2
Output 2200
Working min 660
Productivity 33%
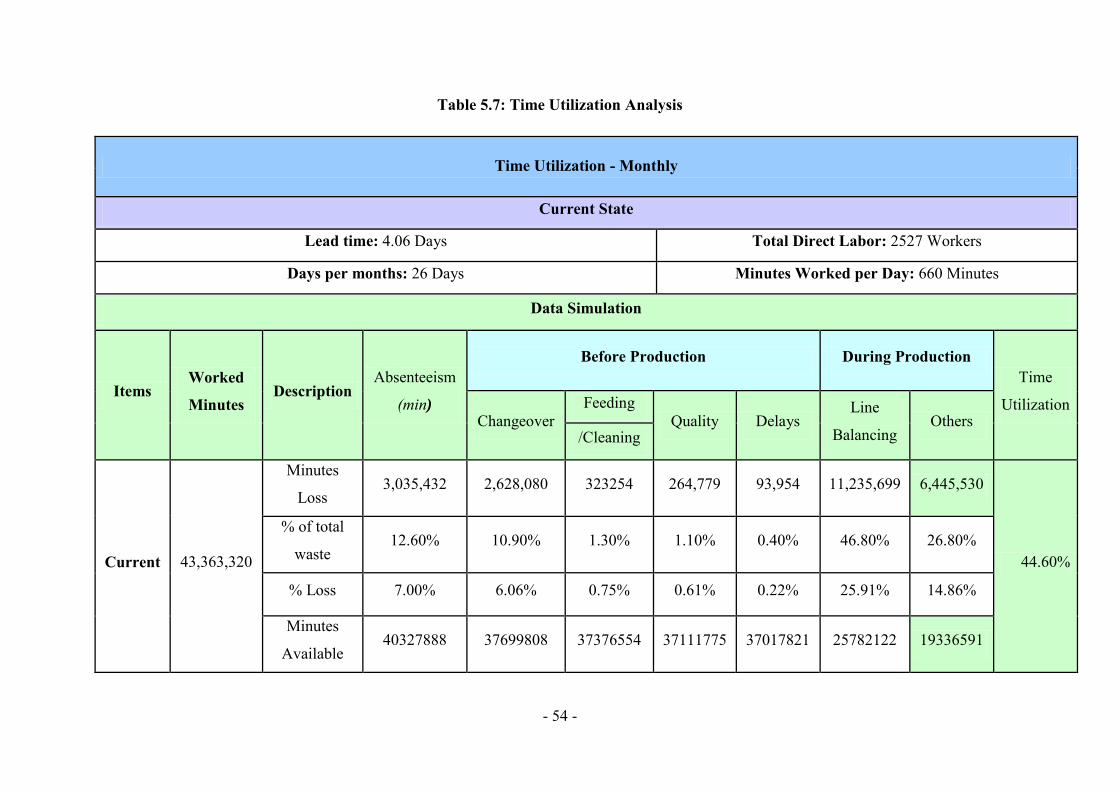
- 54 -
Table 5.7: Time Utilization Analysis
Time Utilization - Monthly
Current State
Lead time: 4.06 Days Total Direct Labor: 2527 Workers
Days per months: 26 Days Minutes Worked per Day: 660 Minutes
Data Simulation
Items Worked
Minutes Description
Absenteeism
(min)
Before Production During Production Time
Utilization Changeover
Feeding Quality Delays
Line
Balancing Others
/Cleaning
Current 43,363,320
Minutes
Loss 3,035,432 2,628,080 323254 264,779 93,954 11,235,699 6,445,530
44.60%
% of total
waste 12.60% 10.90% 1.30% 1.10% 0.40% 46.80% 26.80%
% Loss 7.00% 6.06% 0.75% 0.61% 0.22% 25.91% 14.86%
Minutes
Available 40327888 37699808 37376554 37111775 37017821 25782122 19336591
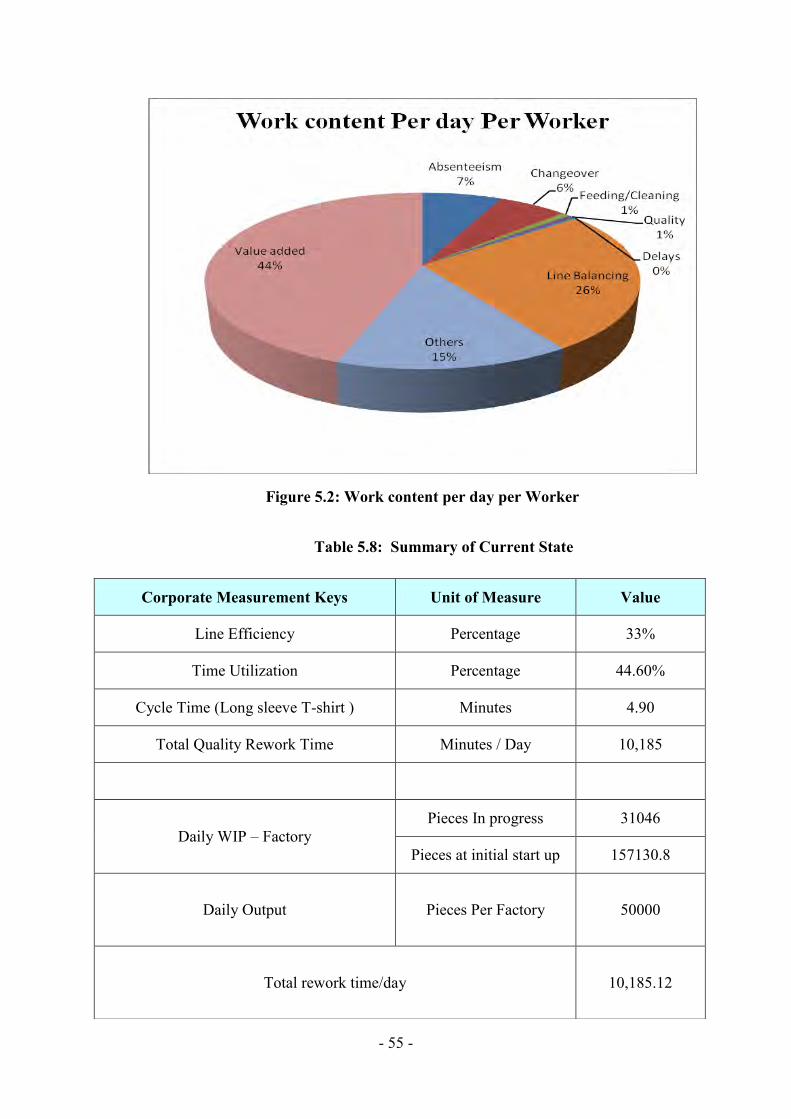
- 55 -
Table 5.8: Summary of Current State
Corporate Measurement Keys Unit of Measure Value
Line Efficiency Percentage 33%
Time Utilization Percentage 44.60%
Cycle Time (Long sleeve T-shirt ) Minutes 4.90
Total Quality Rework Time Minutes / Day 10,185
Daily WIP – Factory Pieces In progress 31046
Pieces at initial start up 157130.8
Daily Output Pieces Per Factory 50000
Total rework time/day 10,185.12
Figure 5.2: Work content per day per Worker
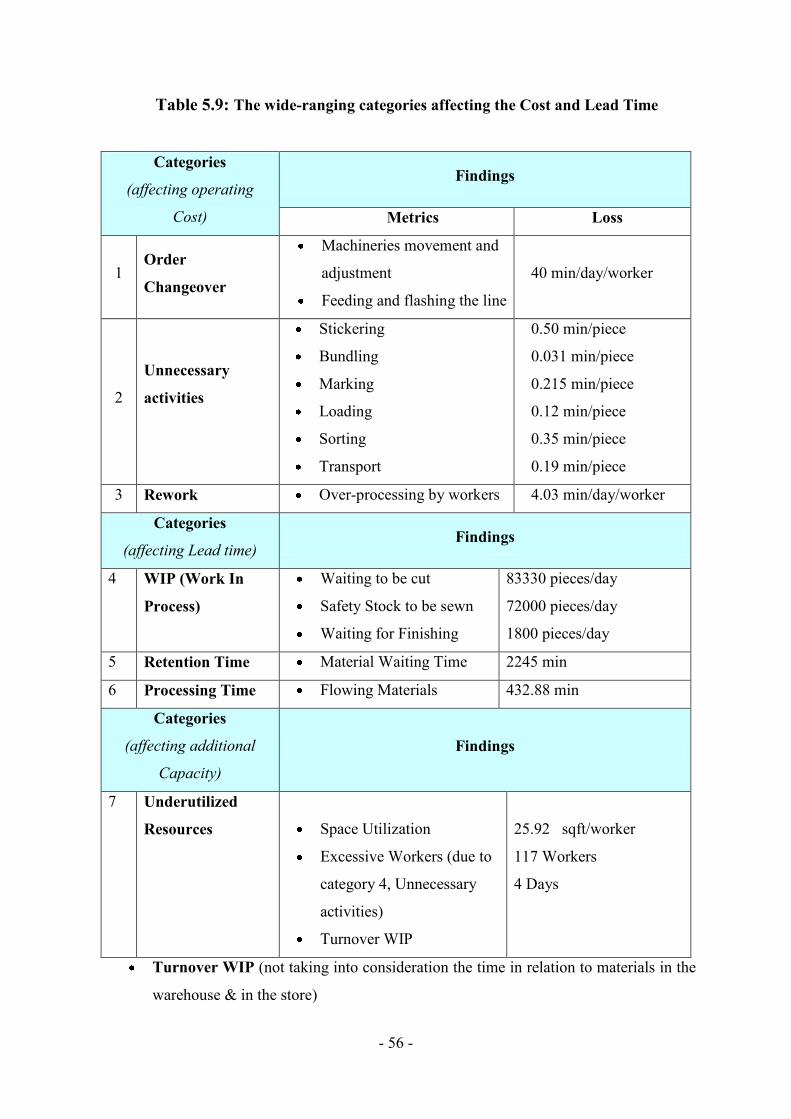
- 56 -
Table 5.9: The wide-ranging categories affecting the Cost and Lead Time
Categories
(affecting operating
Cost)
Findings
Metrics Loss
1 Order
Changeover
Machineries movement and
adjustment
Feeding and flashing the line
40 min/day/worker
2
Unnecessary
activities
Stickering
Bundling
Marking
Loading
Sorting
Transport
0.50 min/piece
0.031 min/piece
0.215 min/piece
0.12 min/piece
0.35 min/piece
0.19 min/piece
3 Rework Over-processing by workers 4.03 min/day/worker
Categories
(affecting Lead time) Findings
4 WIP (Work In
Process)
Waiting to be cut
Safety Stock to be sewn
Waiting for Finishing
83330 pieces/day
72000 pieces/day
1800 pieces/day
5 Retention Time Material Waiting Time 2245 min
6 Processing Time Flowing Materials 432.88 min
Categories
(affecting additional
Capacity)
Findings
7 Underutilized
Resources
Space Utilization
Excessive Workers (due to
category 4, Unnecessary
activities)
Turnover WIP
25.92 sqft/worker
117 Workers
4 Days
Turnover WIP (not taking into consideration the time in relation to materials in the
warehouse & in the store)

- 57 -
CHAPTER – 6
IMPLEMENTING TRIAL PILOT (CELLULAR LAYOUT)
6.1 CELLULAR MANUFACTURING (CELLULAR LAYOUT)
Trial Pilot is based on Cellular Line. It is the effective Layout System for better
Productivity as well as flexibility for the production.
Cellular manufacturing is an approach that helps manufacturing a variety of products with
as little waste as possible. Equipment and workstations are arranged in a sequence that
supports a smooth flow of materials and components through the process, with minimal
transport or delay.
Cellular manufacturing can help make the company more competitive by cutting out
costly transport and delay, shortening the production lead time, saving factory space
that can be used for other value-adding purposes, and promoting continuous
improvement by forcing the company to address problems that block low-inventory
production.
Cellular manufacturing helps employees by strengthening the company's
competitiveness, which helps support job security. It also makes daily production work
go smoother by removing the clutter of WIP inventory, reducing transport and
Figure 6.1: Cellular Line Figure 6.2: Traditional Line
Line
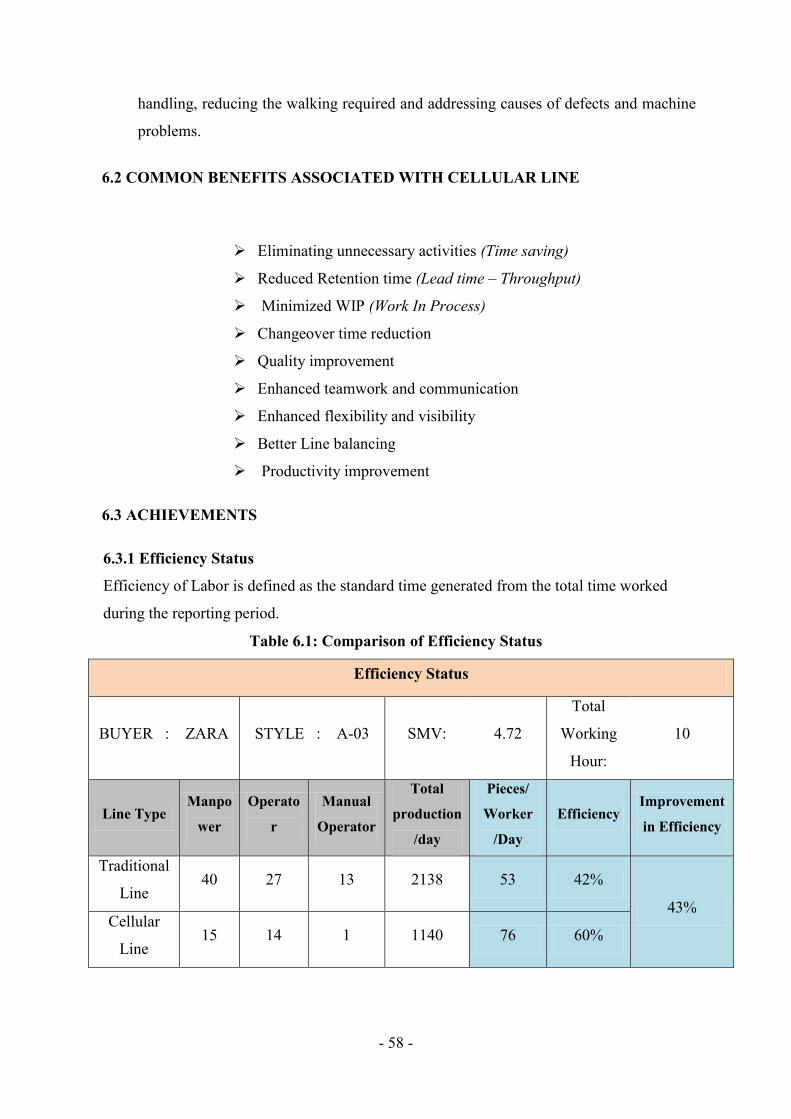
- 58 -
handling, reducing the walking required and addressing causes of defects and machine
problems.
6.2 COMMON BENEFITS ASSOCIATED WITH CELLULAR LINE
Eliminating unnecessary activities (Time saving)
Reduced Retention time (Lead time – Throughput)
Minimized WIP (Work In Process)
Changeover time reduction
Quality improvement
Enhanced teamwork and communication
Enhanced flexibility and visibility
Better Line balancing
Productivity improvement
6.3 ACHIEVEMENTS
6.3.1 Efficiency Status
Efficiency of Labor is defined as the standard time generated from the total time worked
during the reporting period.
Table 6.1: Comparison of Efficiency Status
Efficiency Status
BUYER : ZARA STYLE : A-03 SMV: 4.72
Total
Working
Hour:
10
Line Type Manpo
wer
Operato
r
Manual
Operator
Total
production
/day
Pieces/
Worker
/Day
Efficiency Improvement
in Efficiency
Traditional
Line 40 27 13 2138 53 42%
43% Cellular
Line 15 14 1 1140 76 60%
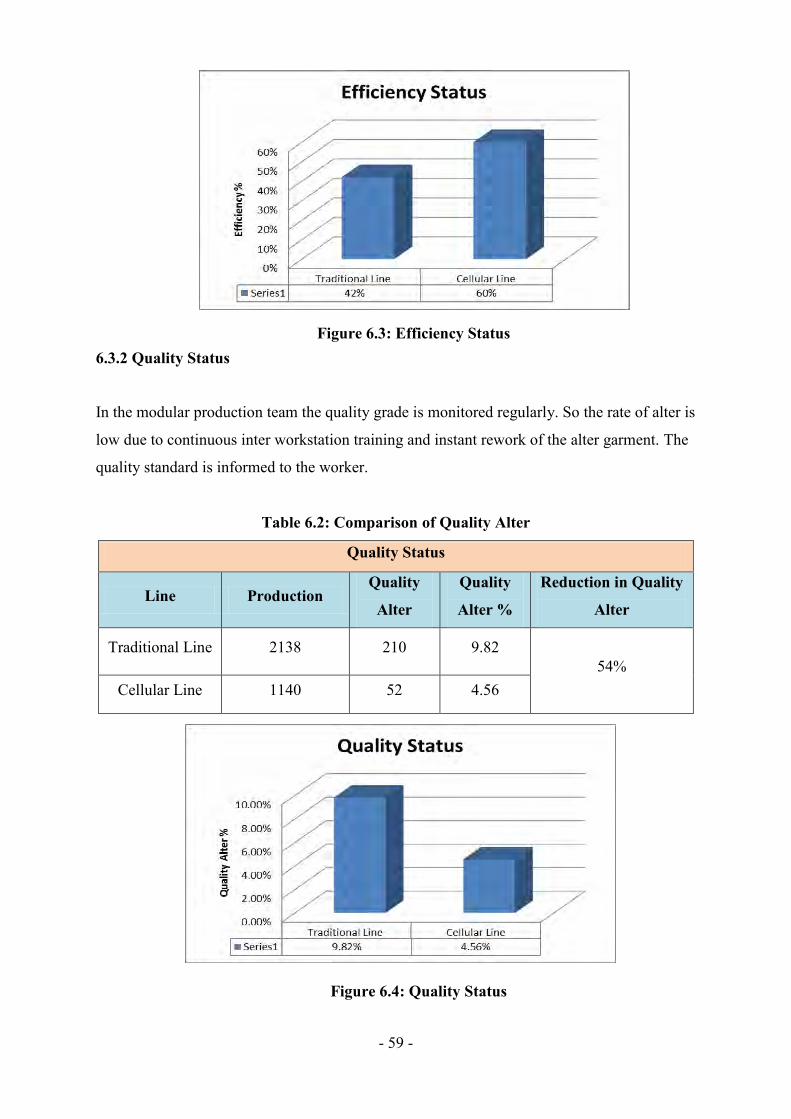
- 59 -
6.3.2 Quality Status
In the modular production team the quality grade is monitored regularly. So the rate of alter is
low due to continuous inter workstation training and instant rework of the alter garment. The
quality standard is informed to the worker.
Table 6.2: Comparison of Quality Alter
Quality Status
Line Production Quality
Alter
Quality
Alter %
Reduction in Quality
Alter
Traditional Line 2138 210 9.82 54%
Cellular Line 1140 52 4.56
Figure 6.4: Quality Status
Figure 6.3: Efficiency Status
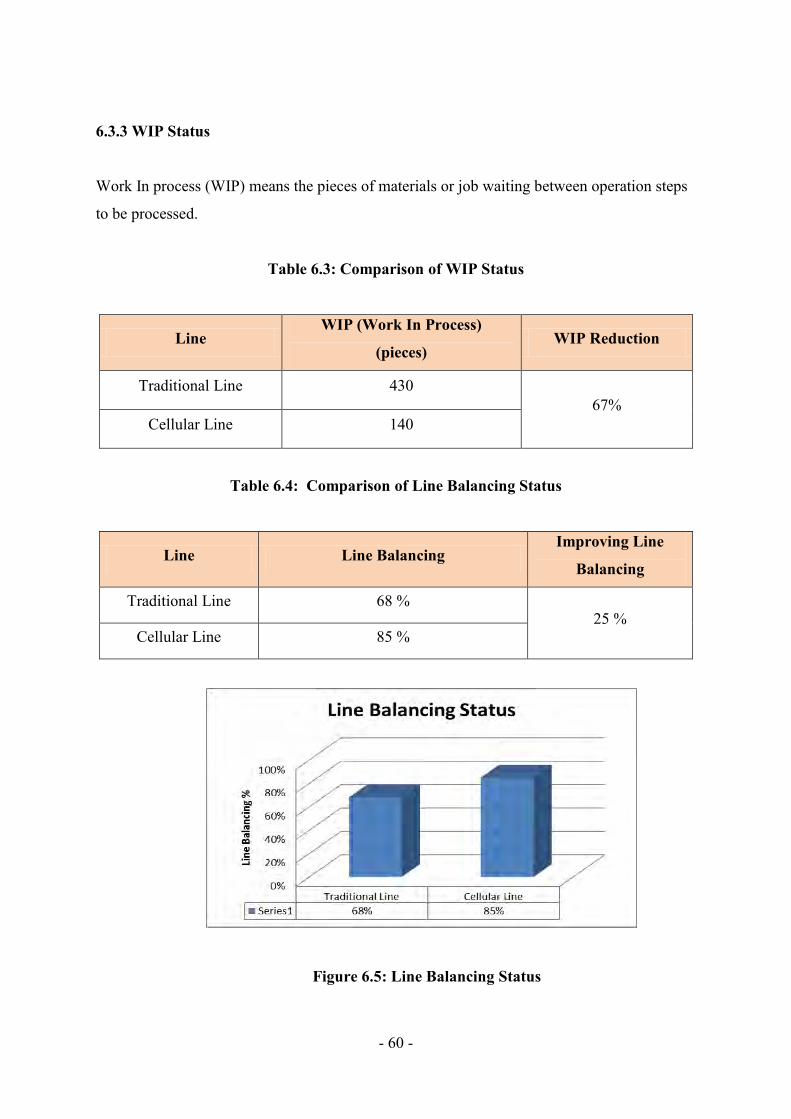
- 60 -
6.3.3 WIP Status
Work In process (WIP) means the pieces of materials or job waiting between operation steps
to be processed.
Table 6.3: Comparison of WIP Status
Line WIP (Work In Process)
(pieces) WIP Reduction
Traditional Line 430 67%
Cellular Line 140
Table 6.4: Comparison of Line Balancing Status
Line Line Balancing Improving Line
Balancing
Traditional Line 68 % 25 %
Cellular Line 85 %
Figure 6.5: Line Balancing Status
- 61 -
6.3.4 Changeover Time Status
Changeover Time is the Elapsed time between the last good piece of previous product, and
the first good piece of next product at the right speed.
Table 6.5: Comparison of Changeover Time
Line Changeover Time in Min Changeover time
Reduction
Traditional Line 240 63%
Cellular Line 90
6.3.5 Throughput Time Status
Throughput time is the total time required from “input” to “output” of finished quality
garment. In the traditional line the Throughput time is high due to huge WIP in relation to the
modular line where the WIP is low and the lead time is short.
Table 6.6: Comparison of Throughput Time
Line Throughput time in Min Throughput time Reduction
Traditional Line 180
56%
Cellular Line 80

- 62 -
6.4 OVERALL SCENARIO
Figure 6.6: Overall Comparison between Traditional Line & Cellular Line
- 63 -
CHAPTER – 7
IMPLEMENTING LINE BALANCING ALGORITHMS
7.1 INTRODUCTION
A flow line can be divided into elemental tasks. Each of these tasks will require a specified time
to complete. It also has a sequential relationship with other tasks in the flow line. In order to
ensure that the line is run efficiently, efforts have to be made to balance the line.
The line balancing problem is to arrange the individual processing and assembly tasks at the
workstations sothat the total time required at each workstation is approximately the same.
If the work elements can be grouped so that all the station times are exactly equal, we have
perfect balanceon the line and we can expect the production to flow smoothly. In most practical
situations it is very difficult to achieve perfect balance. When workstation times areunequal, the
slowest station determines the overall production rate of the line.
7.2 OBJECTIVES OF LINE BALANCING
1. To minimize the total amount of unassigned or idle times at the work station.
2. To eliminate bottlenecks, ensuring a smoother flow of production.
3. To determine the optimal number of work stations and operations in each station.
4. To maintain the morale of workers since the work content of the different workers will
not be of great difference.
5. To maximize the manpower utilization by minimizing the idle times of the operators.
6. To minimize intermediate stock or work-in-progress(zero inventory or just-in-time
concept).
7. To improve the quality and productivity of the FinalProducts.
8. To reduce waste of production and delay.
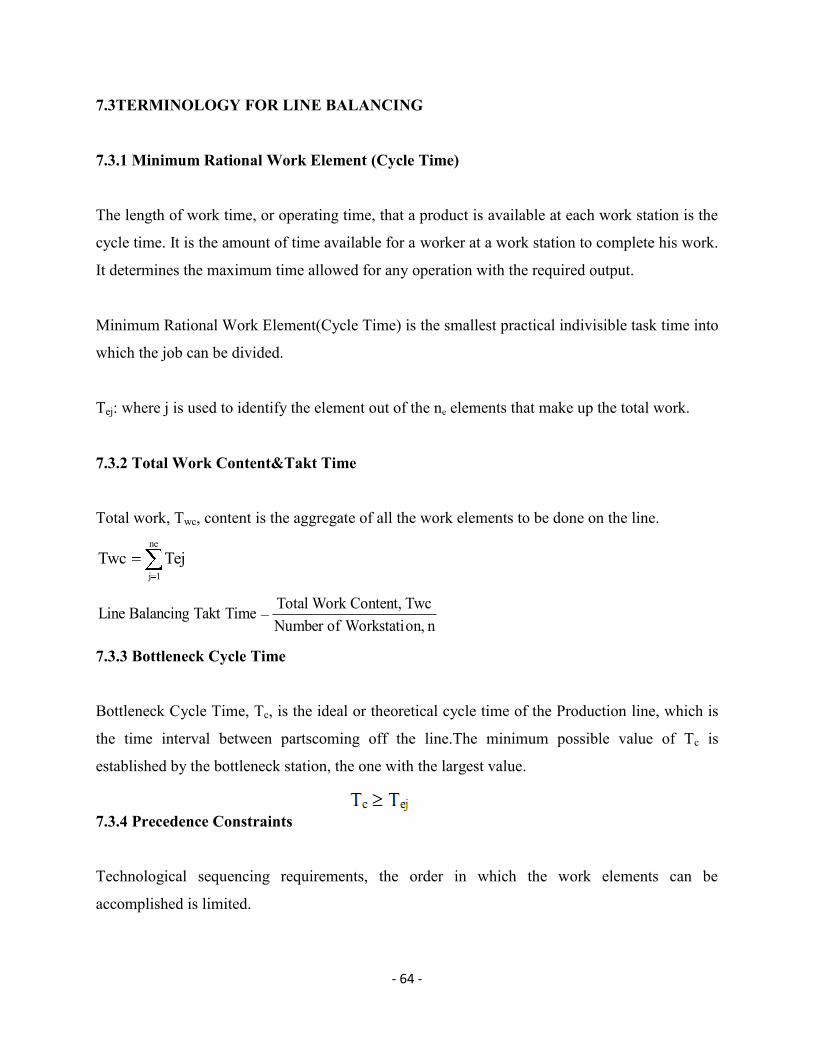
- 64 -
7.3TERMINOLOGY FOR LINE BALANCING
7.3.1 Minimum Rational Work Element (Cycle Time)
The length of work time, or operating time, that a product is available at each work station is the
cycle time. It is the amount of time available for a worker at a work station to complete his work.
It determines the maximum time allowed for any operation with the required output.
Minimum Rational Work Element(Cycle Time) is the smallest practical indivisible task time into
which the job can be divided.
Tej: where j is used to identify the element out of the ne elements that make up the total work.
7.3.2 Total Work Content&Takt Time
Total work, Twc, content is the aggregate of all the work elements to be done on the line. ne
1jTejTwc
n on, WorkstatiofNumber Twc Content, Work Total TimeTakt Balancing Line
7.3.3 Bottleneck Cycle Time
Bottleneck Cycle Time, Tc, is the ideal or theoretical cycle time of the Production line, which is
the time interval between partscoming off the line.The minimum possible value of Tc is
established by the bottleneck station, the one with the largest value.
7.3.4 Precedence Constraints
Technological sequencing requirements, the order in which the work elements can be
accomplished is limited.

- 65 -
7.3.5 Precedence Diagram
Agraphical representation of the sequence of work elements as defined by the precedence
constraints.
7.3.6 Balance Delay (Balancing Loss)& Line Balancing Efficiency
Balance delay is a measure of the line inefficiency which results from idle time due to imperfect
allocationof work among station.
%100Timeon WorkstatiTotal
Content) Work Total - Timeon Workstati(Total =Delay Balance
%100nTc
TwcnTcd Delay, Balance
Here, n = Station Number
Line Balancing Efficiency = (100- Balance Delay) %
100%Tc Time, Cycle Bottleneck
TimeTakt Efficiency Balancing Line
7.4 STEPS FOR LINE BALANCING
1. Determine tasks (operations) & task times.
2. Determine sequence of tasks.
3. Draw precedence diagram.
4. Determine the Total Work Content &Takt Timerequired.
5. Determine the theoretical minimum number of Work Stations required, n. This is done
by adding up all the task times and dividing the Total Work Content by the Takt Time.
6. Select either the Kilbridge&Wester method or the Rank Positional Weights Method to
allocate task elements to each work station.
7. Each work station should not exceed the cycle time determined earlier. Use a table,
setting out the work stations from left to right.
- 66 -
8. Use the Longest Operation Time (LOT) rule; select the task with the longest operation
time next. Consider adding to the station any task whose time fits within the remaining
time for that station.
9. Ensure that the sequencing is in order, even for the task elements in each station.
Precedence relationships may interfere with assigning two tasks to the same workstation.
10. Ensure that the restrictions or constraints for the flow line are adhered to.
11. Analyze the balanced flow line to improve efficiency and to reduce idle times. An
efficient balance will minimize the amount of idle time.
12. Calculate the idle times, and hence the Balancing Loss (Balancing Delay) or Line
Efficiency.
7.5 ASSEMBLY LINE BALANCING
Manual Assembly Lines are used in high-production situations where the work to be performed
can be divided into small tasks andtasks assigned to the workstations on the line.
Key advantage of using manual assembly line is specialization of labor –By giving each worker
a limited set of tasks to do repeatedly.

- 67 -
Table 7.1: Work Elements for Ladies T-Shirt Sewing
Work Elements
Buyer: H & M Style: Ladies T-Shirt Order: 943456 Dept: Sewing
No. Element Description (Operation) Average Cycle
Time Tej (min.)
Must be Precedence by
1 Front Part, Back Part & Hanger Loop Match 0.20 ….
2 Two Sleeve Match & Shoulder Tape Cut 0.40 ….
3 Front & Back Neck Pipping 0.70 1
4 Shoulder Band Prepare 0.10 1,2
5 Sleeve Hem 0.30 2
6 Care Label Make 0.11 3
7 Motif Folding & Tuck 0.32 3
8 Shoulder Join & Lace Folding 0.60 3,4
9 Side Seam 0.27 6,7,8
10 Lace Join with Sleeve 0.38 5,8
11 Sleeve Edge Seam & Sleeve Join 0.50 9,10
12 Body Hem 0.12 11
Total Work Content, Twc (min.) 4.00
Here, Total Work Content, Twc = 4 minutes
Bottleneck Cycle Time, Tc = 0.7 minutes
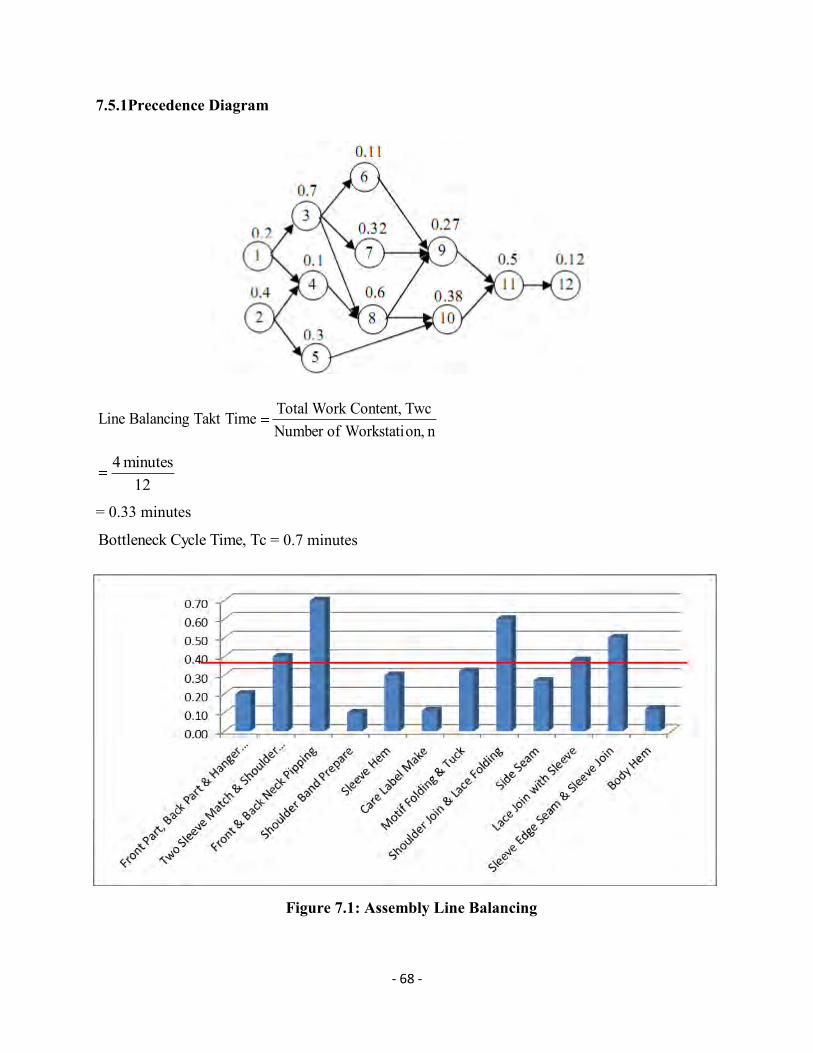
- 68 -
7.5.1Precedence Diagram
n on, WorkstatiofNumber Twc Content, Work Total TimeTakt Balancing Line
12minutes 4
= 0.33 minutes
Tc Time, Cycle Bottleneck = 0.7 minutes
Figure 7.1: Assembly Line Balancing

- 69 -
7.5.2 Performance Criteria for Assembly Line Balancing
Balance Delay is ideal time over paid time.
%100Timeon WorkstatiTotal
Content) Work Total - Timeon Workstati(Total =Delay Balance
%100nTc
TwcnTcd Delay, Balance
Where Total Workstation Time = No of Stations X Tc
%1000.7*12
4-0.7*12d Delay, Balance
= 52%
Line Balancing Efficiency = 100% - 52% = 48%
7.6LINE BALANCING ALGORITHMS
1. Largest Candidate Rule (LCR)
2. Kilbridge and Wester Method (KWM)
3. Ranked Positional Weights Method (RPW)
7.6.1 Largest-Candidate Rule (LCR)
Procedure for Largest-Candidate Rule (LCR)
Step 1. List all elements in descending order of Tej value, largest Tej at the top of the list.
Step 2. To assign elements to the first workstation, start at the top of the list and work done,
selecting the first feasible element for placement at the station. A feasible element is one that
satisfies the precedence requirements and does not cause the sum of the Tej value at station to
exceed the Bottleneck Cycle Time Tc.
Step 3. Repeat step 2.
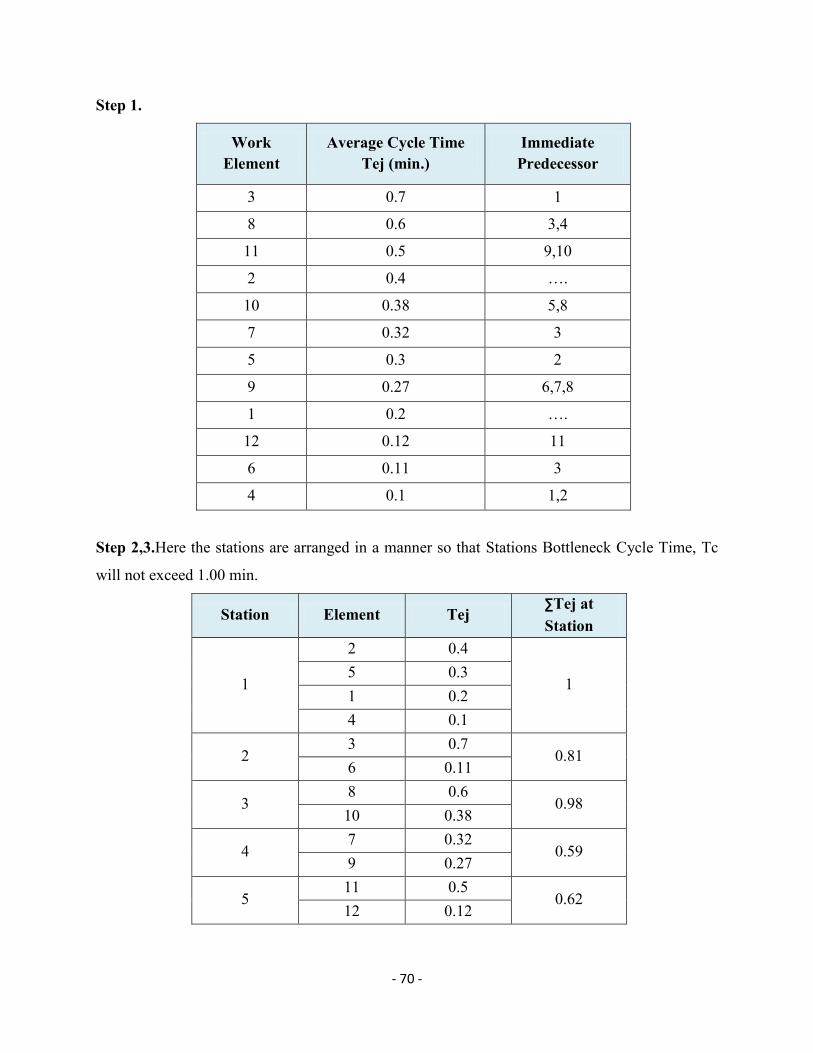
- 70 -
Step 1.
Work Element
Average Cycle Time Tej (min.)
Immediate Predecessor
3 0.7 1
8 0.6 3,4
11 0.5 9,10
2 0.4 ….
10 0.38 5,8
7 0.32 3
5 0.3 2
9 0.27 6,7,8
1 0.2 ….
12 0.12 11
6 0.11 3
4 0.1 1,2
Step 2,3.Here the stations are arranged in a manner so that Stations Bottleneck Cycle Time, Tc
will not exceed 1.00 min.
Station Element Tej ∑Tej at Station
1
2 0.4
1 5 0.3 1 0.2 4 0.1
2 3 0.7
0.81 6 0.11
3 8 0.6
0.98 10 0.38
4 7 0.32
0.59 9 0.27
5 11 0.5
0.62 12 0.12
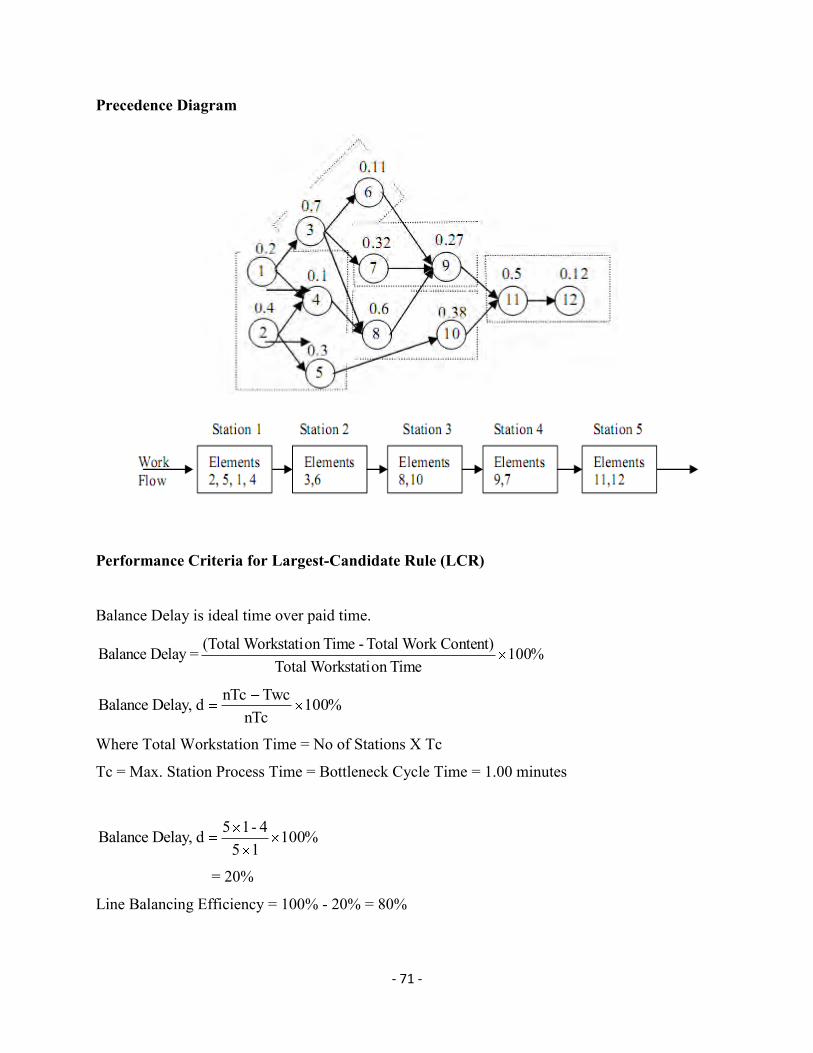
- 71 -
Precedence Diagram
Performance Criteria for Largest-Candidate Rule (LCR)
Balance Delay is ideal time over paid time.
%100Timeon WorkstatiTotal
Content) Work Total - Timeon Workstati(Total =Delay Balance
%100nTc
TwcnTcd Delay, Balance
Where Total Workstation Time = No of Stations X Tc
Tc = Max. Station Process Time = Bottleneck Cycle Time = 1.00 minutes
%10015
4-15d Delay, Balance
= 20%
Line Balancing Efficiency = 100% - 20% = 80%

- 72 -
7.6.2 Kilbridge and Wester Method (KWM)
It is a heuristic procedure which selects work elements for assignment to stations according to
their positionin the precedence diagram.
This overcomes one of the difficulties with the largest candidate rule (LCR), with which
elements at the endof the precedence diagram might be the first candidates to be considered,
simply because their values arelarge.
Procedure for Kilbridge and Wester Method (KWM)
Step 1. Construct the precedence diagram so those nodes representing work elements of identical
precedenceare arranged vertically in columns.
Step 2. List the elements in order of their columns, column I at the top of the list. If an element
can be locatedin more than one column, list all columns by the element to show the
transferability of the element.
Step 3. To assign elements to workstations, start with the column I elements. Continue the
assignmentprocedure in order of column number until the cycle time is reached (Tc).
Step 1.
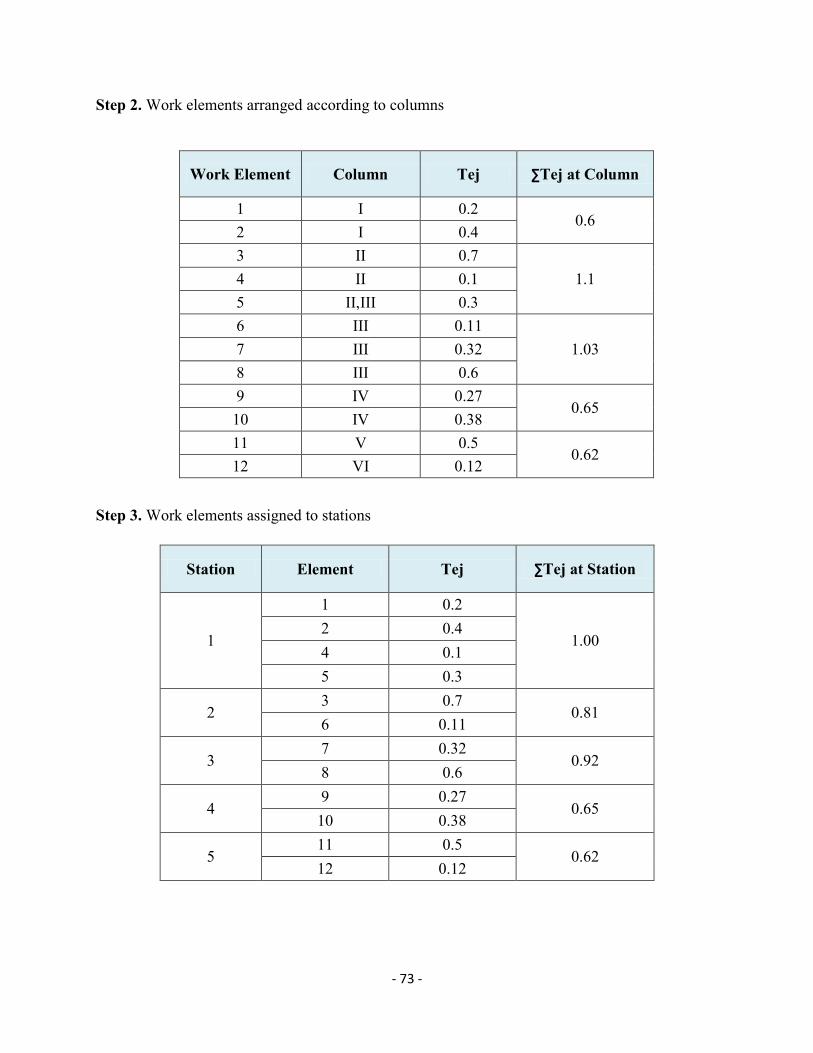
- 73 -
Step 2. Work elements arranged according to columns
Work Element Column Tej ∑Tej at Column
1 I 0.2 0.6
2 I 0.4 3 II 0.7
1.1 4 II 0.1 5 II,III 0.3 6 III 0.11
1.03 7 III 0.32 8 III 0.6 9 IV 0.27
0.65 10 IV 0.38 11 V 0.5
0.62 12 VI 0.12
Step 3. Work elements assigned to stations
Station Element Tej ∑Tej at Station
1
1 0.2
1.00 2 0.4 4 0.1 5 0.3
2 3 0.7
0.81 6 0.11
3 7 0.32
0.92 8 0.6
4 9 0.27
0.65 10 0.38
5 11 0.5
0.62 12 0.12
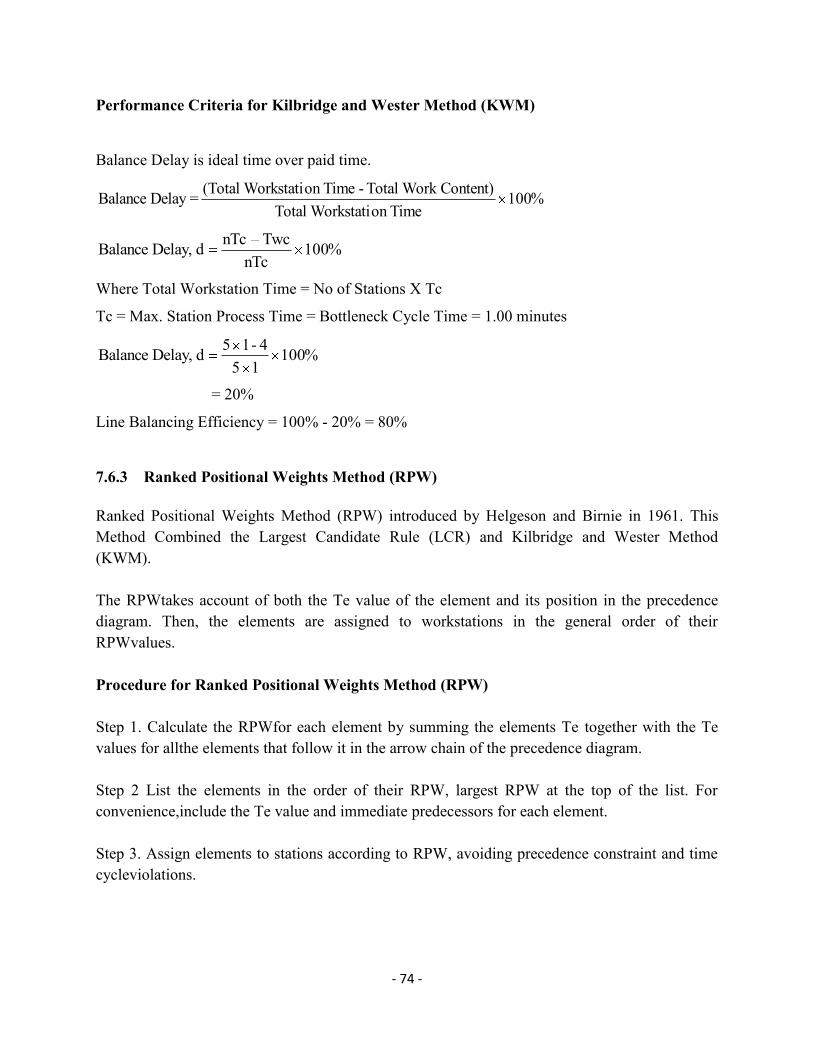
- 74 -
Performance Criteria for Kilbridge and Wester Method (KWM)
Balance Delay is ideal time over paid time.
%100Timeon WorkstatiTotal
Content) Work Total - Timeon Workstati(Total =Delay Balance
%100nTc
TwcnTcd Delay, Balance
Where Total Workstation Time = No of Stations X Tc
Tc = Max. Station Process Time = Bottleneck Cycle Time = 1.00 minutes
%10015
4-15d Delay, Balance
= 20%
Line Balancing Efficiency = 100% - 20% = 80%
7.6.3 Ranked Positional Weights Method (RPW)
Ranked Positional Weights Method (RPW) introduced by Helgeson and Birnie in 1961. This Method Combined the Largest Candidate Rule (LCR) and Kilbridge and Wester Method (KWM). The RPWtakes account of both the Te value of the element and its position in the precedence diagram. Then, the elements are assigned to workstations in the general order of their RPWvalues. Procedure for Ranked Positional Weights Method (RPW) Step 1. Calculate the RPWfor each element by summing the elements Te together with the Te values for allthe elements that follow it in the arrow chain of the precedence diagram. Step 2 List the elements in the order of their RPW, largest RPW at the top of the list. For convenience,include the Te value and immediate predecessors for each element. Step 3. Assign elements to stations according to RPW, avoiding precedence constraint and time cycleviolations.
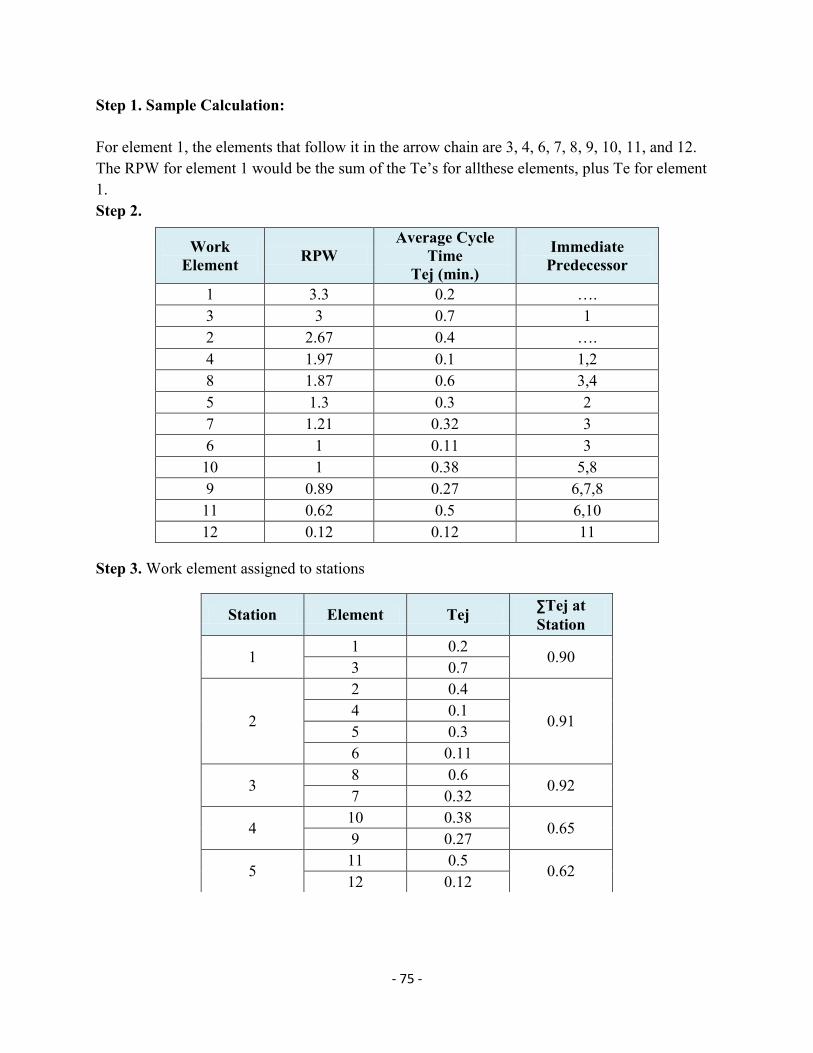
- 75 -
Step 1. Sample Calculation: For element 1, the elements that follow it in the arrow chain are 3, 4, 6, 7, 8, 9, 10, 11, and 12. The RPW for element 1 would be the sum of the Te’s for allthese elements, plus Te for element 1. Step 2.
Step 3. Work element assigned to stations
Work Element RPW
Average Cycle Time
Tej (min.)
Immediate Predecessor
1 3.3 0.2 …. 3 3 0.7 1 2 2.67 0.4 …. 4 1.97 0.1 1,2 8 1.87 0.6 3,4 5 1.3 0.3 2 7 1.21 0.32 3 6 1 0.11 3 10 1 0.38 5,8 9 0.89 0.27 6,7,8 11 0.62 0.5 6,10 12 0.12 0.12 11
Station Element Tej ∑Tej at Station
1 1 0.2
0.90 3 0.7
2
2 0.4
0.91 4 0.1 5 0.3 6 0.11
3 8 0.6
0.92 7 0.32
4 10 0.38
0.65 9 0.27
5 11 0.5
0.62 12 0.12
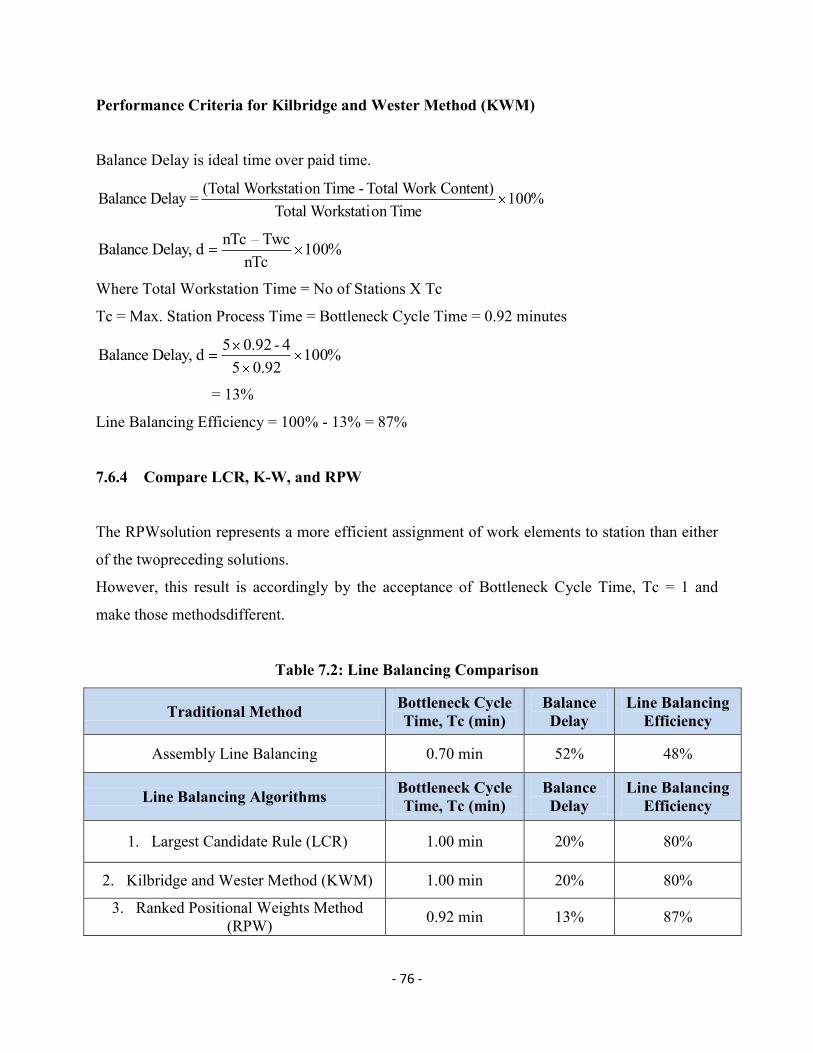
- 76 -
Performance Criteria for Kilbridge and Wester Method (KWM)
Balance Delay is ideal time over paid time.
%100Timeon WorkstatiTotal
Content) Work Total - Timeon Workstati(Total =Delay Balance
%100nTc
TwcnTcd Delay, Balance
Where Total Workstation Time = No of Stations X Tc
Tc = Max. Station Process Time = Bottleneck Cycle Time = 0.92 minutes
%10092.05
4-92.05d Delay, Balance
= 13%
Line Balancing Efficiency = 100% - 13% = 87%
7.6.4 Compare LCR, K-W, and RPW
The RPWsolution represents a more efficient assignment of work elements to station than either
of the twopreceding solutions.
However, this result is accordingly by the acceptance of Bottleneck Cycle Time, Tc = 1 and
make those methodsdifferent.
Table 7.2: Line Balancing Comparison
Traditional Method Bottleneck Cycle Time, Tc (min)
Balance Delay
Line Balancing Efficiency
Assembly Line Balancing 0.70 min 52% 48%
Line Balancing Algorithms Bottleneck Cycle Time, Tc (min)
Balance Delay
Line Balancing Efficiency
1. Largest Candidate Rule (LCR) 1.00 min 20% 80%
2. Kilbridge and Wester Method (KWM) 1.00 min 20% 80%
3. Ranked Positional Weights Method (RPW) 0.92 min 13% 87%
- 77 -
7.7FACTORS AFFECTING LINE BALANCING & PROBLEMS ENCOUNTERED
a. There are constraints in operations in terms of style variation, workers skill, machine
type, quality requirements etc.
b. The workers in the line have great variations in level of skill and aptitudes for certain
jobs. Thus, it is difficult to synchronize the time.
c. Some work content cannot be broken down further into elements.
d. Long operation times can become bottlenecks.
e. The design of parts, shape and size of materials may pose constraints.
f. Special processes, such as printing, embroidery, washing by batch, have fixed sequences.
g. Long set-up times.
h. Small production volumes do not justify the use of line balancing.
- 78 -
CHAPTER - 8
IMPLEMENTINGSTATISTICAL PROCESS CONTROL (SPC)
8.1 INTRODUCTION AND BACKGROUND
The concepts of Statistical Process Control (SPC) were initially developed by Dr. Walter
Shewhart of Bell Laboratories in the 1920's, and were expanded upon by Dr. W. Edwards
Deming, who introduced SPC to Japanese industry after WWII. After early successful adoption
by Japanese firms, Statistical Process Control has now been incorporated by organizations
around the world as a primary tool to improve product quality by reducing process variation. Dr.
Shewhart identified two sources of process variation: Chance variation that is inherent in
process, and stable over time, and Assignable, or Uncontrolled variation, which is unstable over
time - the result of specific events outside the system. Dr. Deming relabeled chance variation as
Common Cause variation, and assignable variation as Special Cause variation.
Based on experience with many types of process data, and supported by the laws of statistics and
probability, Dr. Shewhart devised control charts used to plot data over time and identify both
Common Cause variation and Special Cause variation.
The use of statistical techniques to analyze a process or output so as to take its appropriate
actions to achieve or maintain a state of statistical control.
Statistical = Use of Data, Graphical, Analysis, Capability
Process = Operation or a group of Operations
Control = Stable and Predictable, decreases Variation
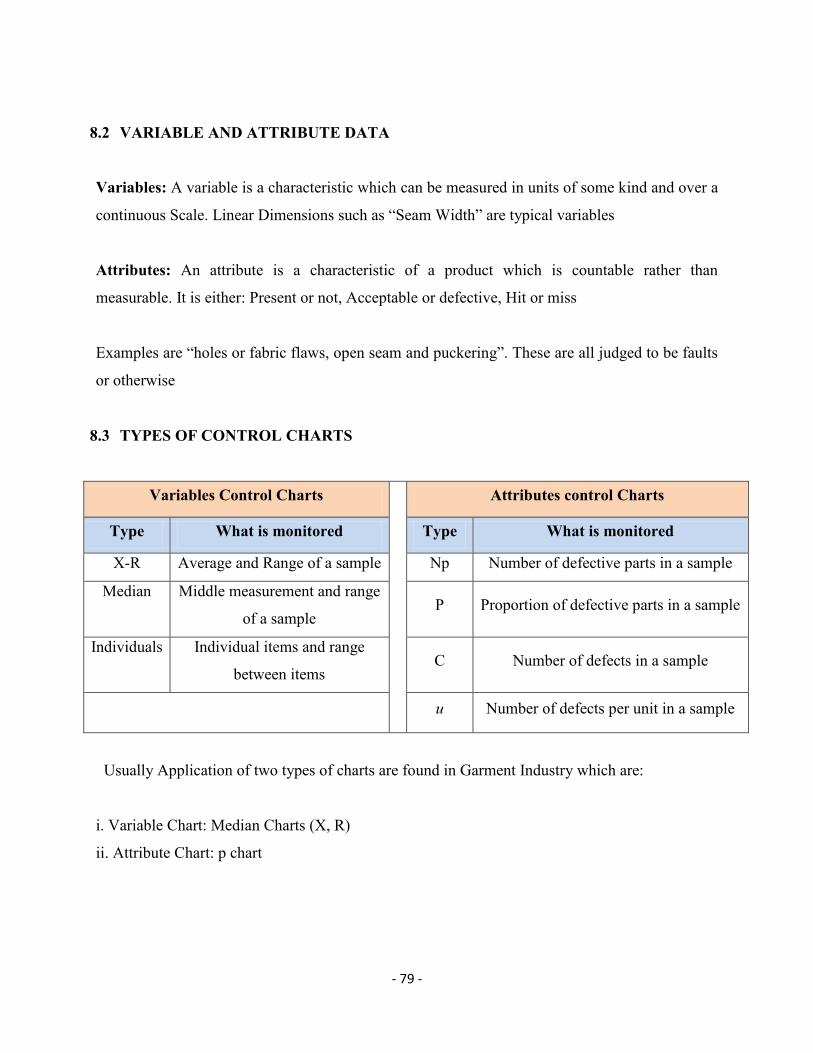
- 79 -
8.2 VARIABLE AND ATTRIBUTE DATA
Variables: A variable is a characteristic which can be measured in units of some kind and over a
continuous Scale. Linear Dimensions such as “Seam Width” are typical variables
Attributes: An attribute is a characteristic of a product which is countable rather than
measurable. It is either: Present or not, Acceptable or defective, Hit or miss
Examples are “holes or fabric flaws, open seam and puckering”. These are all judged to be faults
or otherwise
8.3 TYPES OF CONTROL CHARTS
Variables Control Charts
Attributes control Charts
Type What is monitored Type What is monitored
X-R Average and Range of a sample Np Number of defective parts in a sample
Median
Middle measurement and range
of a sample P Proportion of defective parts in a sample
Individuals
Individual items and range
between items C Number of defects in a sample
u Number of defects per unit in a sample
Usually Application of two types of charts are found in Garment Industry which are:
i. Variable Chart: Median Charts (X, R)
ii. Attribute Chart: p chart
- 80 -
8.4 STEPS FOLLOWED FOR SPC IMPLEMENTATION
a. Deciding CTQs (Critical To Quality) for both attributes and variables
b. Data collection for control charts (starts after the style has run for 3-4 days in line)
c. Control chart graph plotting for both variables and attributes
d. Calculation and drawing of control limits (first drawn based on the collected data of 8-10
hours)
e. Corrective actions for samples beyond control limits
f. Redefining, calculating and drawing new control limits further
g. Refining CTQs as per requirement
8.5 DECIDING CRITERIA FOR CTQS
Variables:
Critical measurements are selected and operations are chosen where this measurement
gets completely fixed and no chance of any variations in the further operations. It should
also be taken care of that the measurement should be taken from the operations as early
as possible (from the earliest operation where it gets fixed) for effective corrective
actions.
Attributes:
Critical operations and processes according to operation layout and bulletin
Operation-wise and defect-wise most problematic processes in terms of highest DHU
and repair percentage
CTQs chosen at the initial stage should be modified as per requirement like addition of
new CTQs (highest defect category) and subtraction of processes which are in control
8.6 VARIABLE CONTROL CHARTS
Control charts for variables are tools that can be used when measurements (linear,
volume, temperature, etc.) from a process are available.
- 81 -
Statistical Terms:
Median: The median is the middle value in the list of numbers.
R is the range of values within each sample (highest minus lowest) = a measure
of spread
X is the average of the values of a sample = a measure of location.
8.6.1 Control Chart Plotting Procedures
The number of units within a sample is ten or less. The most convenient being odd
number of units such as 3, 5, 7 or 9. Here it has been taken as 5.
All the measurements (variations) are recorded in the data table using legends and the
median and range of the set of data are calculated below that
All medians are plotted in the graph and connected by drawing a line
Range chart is also plotted same way with the range data of the samples
8.6.2 Control Limits Calculation
Median Chart:
The average of the sample medians are calculated which is referred as X
Then the control limits are calculated. The formulas for the median chart is as follows:
Upper Control Limit Median----------UCLX = X + A2R
Lower Control Limit Median----------LCLX = X - A2R
Limits are drawn in the median control chart
Range Chart:
The average of the sample ranges are calculated which is referred as R
Then the control limits are calculated. The formulas for the range chart is as follows:
Upper Control Limit Range----------UCLR = D4R
Lower Control Limit Range----------LCLR = D3R
(There are no lower control limits for ranges for sample sizes below 7)
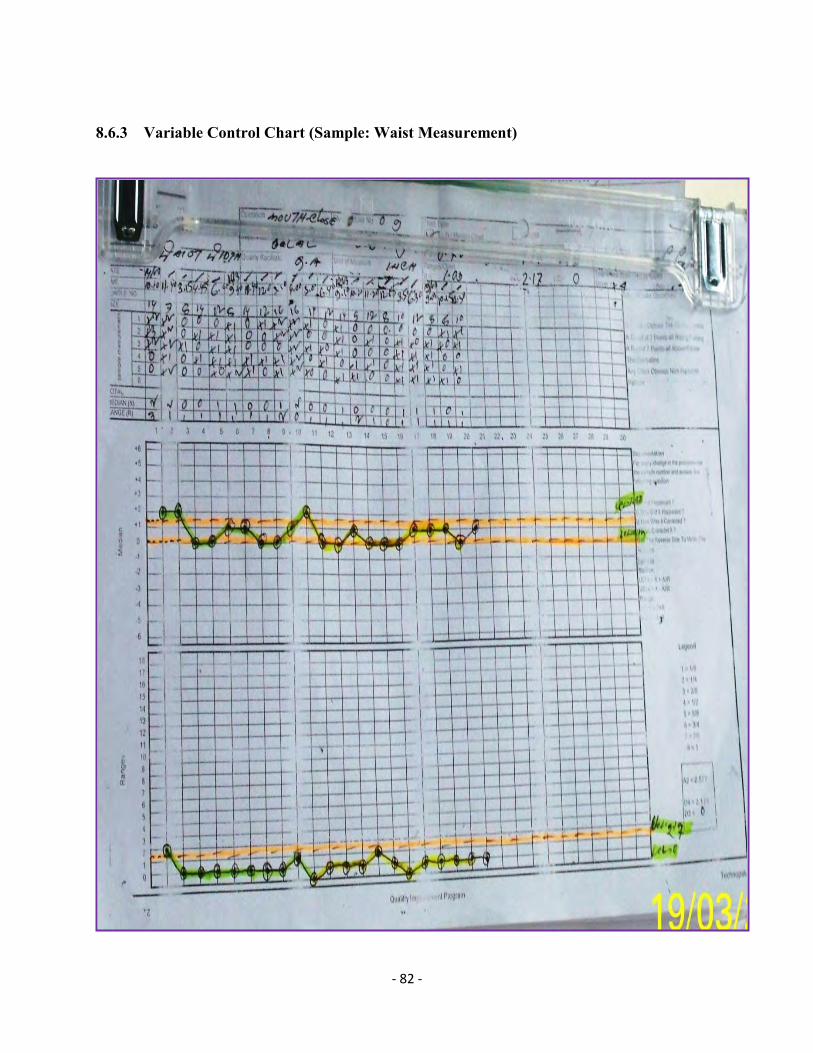
- 82 -
8.6.3 Variable Control Chart (Sample: Waist Measurement)
- 83 -
Control Limits Calculation
Here, average of all the medians, X = 0.66
and average of all the ranges, R = 1.09
For sample size= 5,
A2 = 0.577,
D4 = 2.114, D3 = 0
Median Chart:
Upper Control Limit Median, UCLX = X + A2R
UCLX= 0.66 + (0.577x 1.09) = 1.28
Lower Control Limit Median, LCL X = X - A2R
LCLX= 0.66 - (0.577x 1.09) = 0.03
Range Chart:
Upper Control Limit Range, UCLR = D4R
UCLR = (2.114 x 1.09) = 2.30
Lower Control Limit Range, LCLR = D3R
LCLR = 0
These control limits are followed for all the samples and actions taken for each point
beyond the limit

- 84 -
8.7 CONTROL CHART FOR ATTRIBUTES
Data Collection (p Charts):
Size, Frequency and number of Samples are selected (here taken as 15%-20% of hourly
production). Defects are recorded by checking sample units from the operation decided as CTQ
Proportion of defectives is calculated in this manner:
Proportion of defective, P = (Total defectives/ sample size); Values of P from all the sample
sizes are plotted in the graph below data table
8.7.1 Control Limits Calculation
The average of the samples p is calculated and this is considered as the central line and referred
as P-bar for limit calculation. The formulas are as follows:
Upper Control Limit,
Lower Control Limit,
Limits are drawn in the control chart and labeled. Right now a decided UCL is being followed in
XY Apparels Ltd. which is UCL (P)=0.1
Corrective actions are taken for all the points beyond control limits
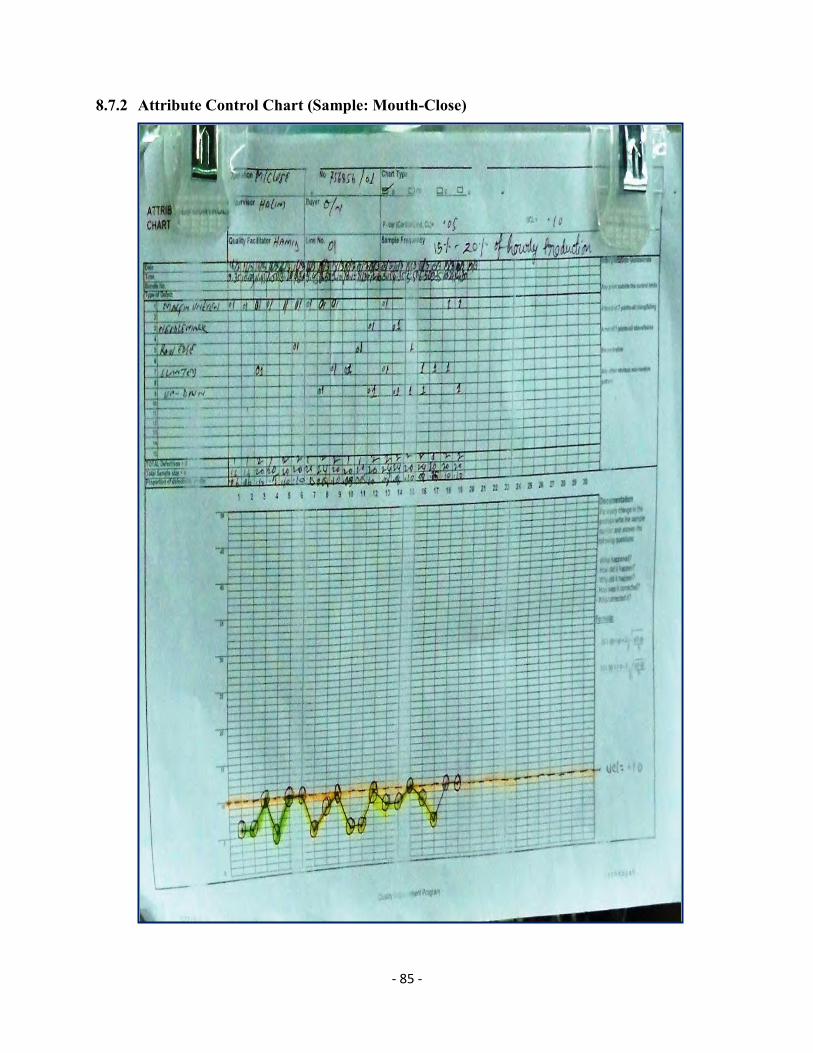
- 85 -
8.7.2 Attribute Control Chart (Sample: Mouth-Close)
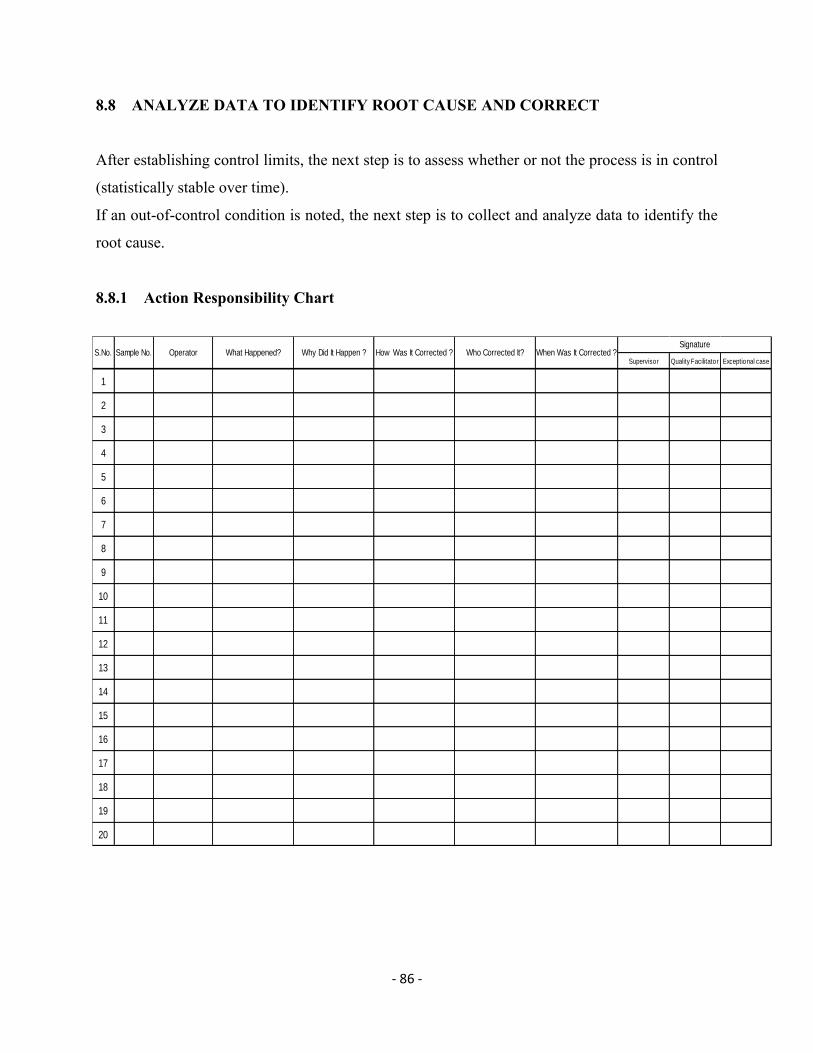
- 86 -
8.8 ANALYZE DATA TO IDENTIFY ROOT CAUSE AND CORRECT
After establishing control limits, the next step is to assess whether or not the process is in control
(statistically stable over time).
If an out-of-control condition is noted, the next step is to collect and analyze data to identify the
root cause.
8.8.1 Action Responsibility Chart
Supervisor Quality Facilitator Exceptional case
1
2
3
4
5
6
7
8
9
10
11
12
13
14
15
16
17
18
19
20
SignatureWhat Happened?OperatorSample No.S.No. When Was It Corrected ?Who Corrected It?How Was It Corrected ?Why Did It Happen ?
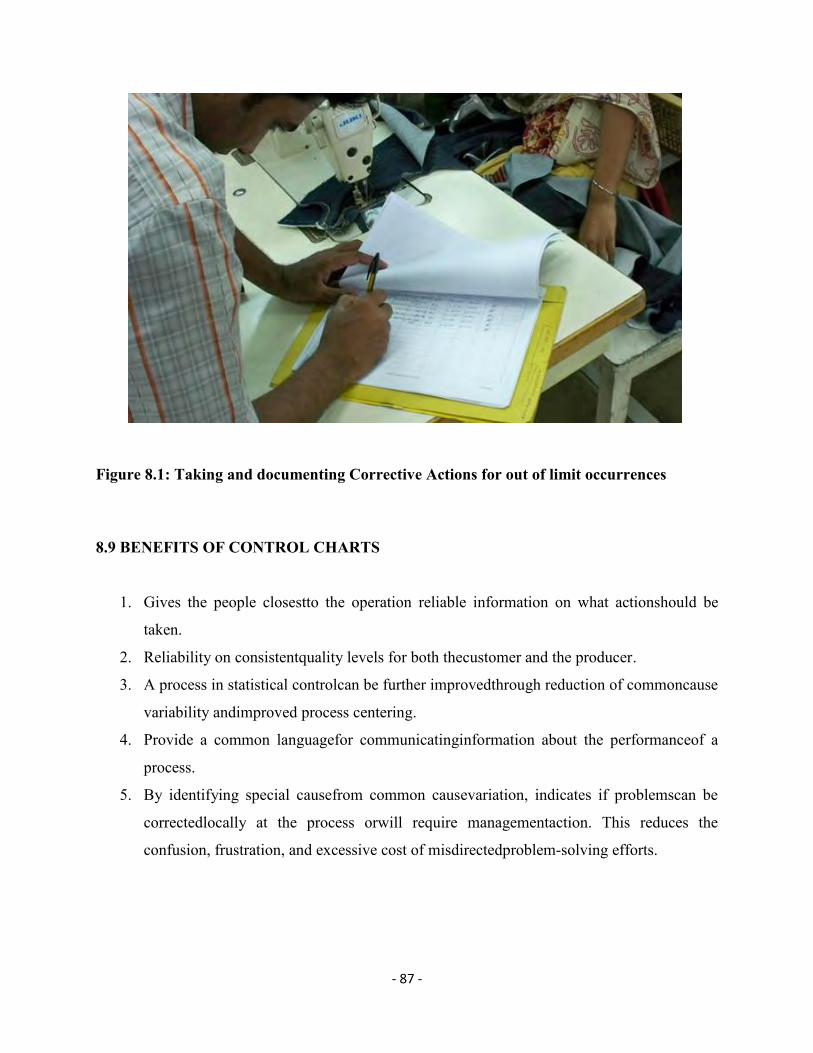
- 87 -
Figure 8.1: Taking and documenting Corrective Actions for out of limit occurrences
8.9 BENEFITS OF CONTROL CHARTS
1. Gives the people closestto the operation reliable information on what actionshould be
taken.
2. Reliability on consistentquality levels for both thecustomer and the producer.
3. A process in statistical controlcan be further improvedthrough reduction of commoncause
variability andimproved process centering.
4. Provide a common languagefor communicatinginformation about the performanceof a
process.
5. By identifying special causefrom common causevariation, indicates if problemscan be
correctedlocally at the process orwill require managementaction. This reduces the
confusion, frustration, and excessive cost of misdirectedproblem-solving efforts.

- 88 -
8.10 SPC IMPLEMENTATION REQUIREMENTS
o Top management commitment
o Project champion
o Initial workable project
o Employee education and training
o Accurate measurement system
- 89 -
CHAPTER - 9
CONCLUSIONS AND RECOMMENDATIONS
9.1 CONCLUSIONS
The Ready-Made Garments (RMG) industry occupies a unique position in the Bangladesh
economy. It is the largest exporting industry in Bangladesh, which experienced phenomenal
growth during the last 30 years. The industry plays a key role in employment generation and
in the provision of income to the poor. From the above study we see that Total Lead time for
a specific order only for Cutting to Finishing is around 2677.88 minutes or 4.06 days, where
Processing Time is only 16% and Waiting Time or Non Value Added Activity Time is 84%.
That means we work on that specific Style only 16% Time and 84% time that style waits
between the processes or workers as WIP for work or processing. If we identify that Waiting
Time or Non Value Added Activity Time and take steps to reduce or minimize time,
ultimately it will reduce the Lead Time & will increase Capacity. In this regard we
implemented Cellular Manufacturing System, Line Balancing Algorithms & Statistical
Process Control (SPC) tools & Techniques. As a result we get significant improvements.
Efficiency has been increased by 43% and Throughput Time, Changeover Time has been
decreased by respectively 56% and 63%. This type of continuous improvement will help
Bangladesh to attain a high profile in terms of foreign exchange earnings, exports,
industrialization and contribution to GDP within a short span of time as targeted level.
9.2 RECOMMENDATIONS
a. Workers and Management personnel should have trust in waste elimination
philosophy.
b. Workers should be involved in common understanding about Lean Principles by
awareness program.
c. All workers should be trained about team building and work sharing.
d. Establishment and Enrichment of Industrial Engineering Department.
e. The government and the RMG sector would have to jointly work together to maintain
competitiveness in the global RMG market.

- 90 -
f. Workers should be counseled for reduction in production output, poor quality of
garments and so on.
g. To achieve positive results like avoiding turnover and absenteeism motivation tools
such as training, appropriate wage structure and incentive along with annual
productivity linked bonus can be provided.
h. Some of the available unskilled labor force can be converted into suitable skilled
labour force.
i. Audio-Visual training can be provided in the factories daily half an hour before or
after working hours with overtime paid and during off-season of the business.
j. The work environment must be changed so that Workers will feel it a pleasant one to
work.
k. All should be involved in common understanding about Lean Principles by awareness
program.
l. Create an atmosphere of experimentation, toleration, patience and risk taking.