Embed Size (px)
Citation preview

Productivity Growthin China's Large and Medium Industrial Firms:
Patterns, Causes, and Implications
Dr. Geng XIAOThe University of Hong Kong
[email protected]/~xiaogeng
Dr. Zhengge TUPeking University
International Workshop on Competition, Innovation and Productivity: Empirical Evidence from Firm Level Data
Nice, Sophia-Antipolis, France, 19-20 December 2005

TFP Growth
• y: actual output
• Sj: share of costs by input xj
• Growth accounting equation:
j jj
TFP y S x

TFP Growth = FTP + change in TE + AE + SE
• Frontier Production Function with Technical Inefficiency:
• Total Factor Productivity (TFP) Growth due to:– Frontier Technology Progress (FTP)– Changes in Technical Efficiency (TE) Relative to the
Frontier– Allocating Efficiency (AE)– Scale Economy (SE)
, expy f x t u

FTP and TE: An Illustration
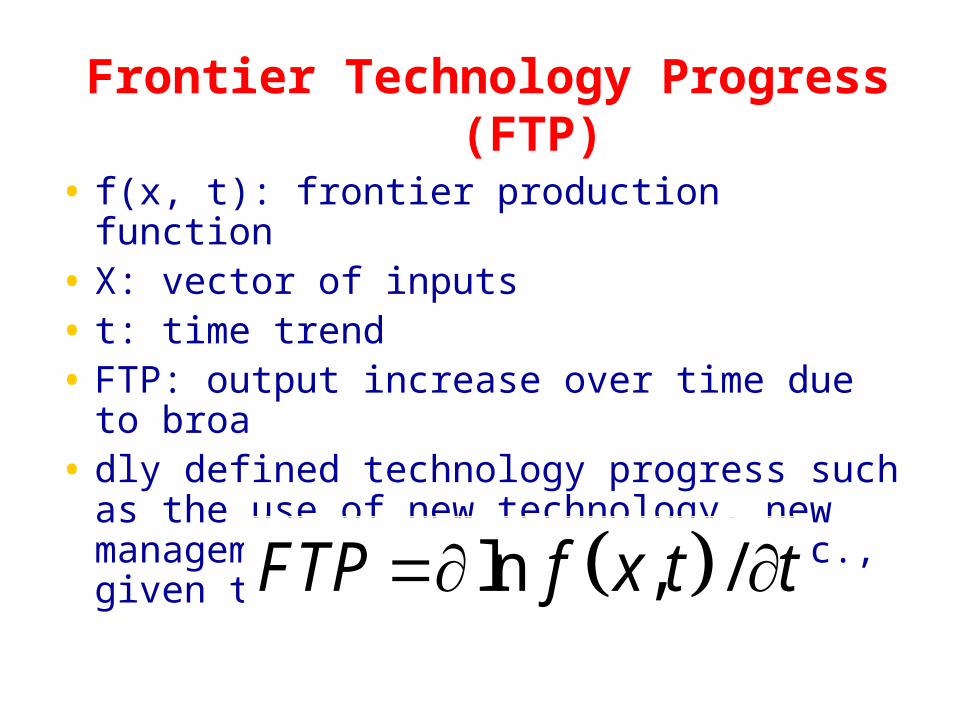
Frontier Technology Progress (FTP)
• f(x, t): frontier production function• X: vector of inputs• t: time trend• FTP: output increase over time due to broa• dly defined technology progress such as the use
of new technology, new management, new institutions, etc., given the same levels of inputs
ln , /FTP f x t t

Technical Efficiency (TE ) Relative to Frontier and its Change• TE: Ratio of actual output to frontier
output:
• Change of TE:
exp( , )
yTE u
f x t
/TE du dt

Allocative Efficiency (AE)in the Employment of Inputs
j: normalized output elasticity of input j
• Sj: share of costs by input j
• xj: input j• AE: Allocative Efficiency due to more cost-
effective employment of inputs (e.g. marginal return greater than marginal costs of inputs)
( )j j jjAE S x

Scale Economy (SE)
• RTS: total return to scale, sum of output elasticity of all inputs.
j: output elasticity of input j
• xj: input j
• Scale Economy:
1 j jjSE RTS x

Time-Varying Log Stochastic Frontier Production Function
2~ 0,i vv iid N
expi iu u t T 2~ ,i uu N
0
2
1ln ln ln ln
2
1 ln ; j,l L,k;
2
i j ji T jl li jitj j l
TT Tj ji i ij
y x t x x
t t x v u

Data Sources• National Bureau of Statistics annual survey on large and medium
industrial enterprises during 1995-2002 with about 22,000 firms each year
• After data cleaning the total observations for the imbalanced panel data set is 177,086 with about 21,000 for each year over 8 years
• The significance of sample enterprises in the Chinese economy:– Number of enterprises is about 12% of all industrial enterprises with
sales above 5 million RMB– About 16.7% of the total industrial employment– About 40% of the total industrial value added– Total value added is about 14% to 19% of GDP
• Price deflators– Estimated output deflator– Estimated fixed capital deflator

Variables Used in Estimation
• y: deflated industrial value added• K: deflated net value of fixed capital• L: average number of employees
• SK: interest expenses and current depreciation
• SL: wages, bonuses, expenses on labor welfare and insurances

1995 1998 2002
private 5 176 1,302
collective 4,008 3,577 2,138
mixed 1,233 2,934 6,135
foreign 1,000 1,579 2,935
HK-M-Taiwan 936 1,454 2,495
state-owned 15,361 12,573 7,215
total 22,543 22,293 22,220
Table A.1 Distribution of Usable Obervations by Ownership: 1995-2002
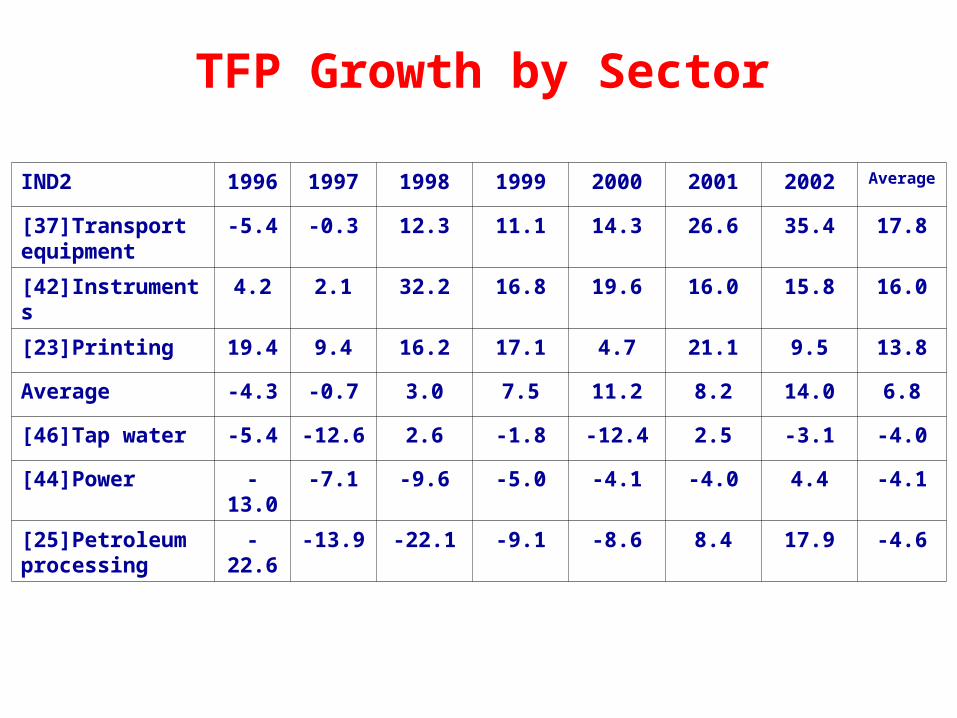
TFP Growth by Sector
IND2 1996 1997 1998 1999 2000 2001 2002 Average
[37]Transport equipment
-5.4 -0.3 12.3 11.1 14.3 26.6 35.4 17.8
[42]Instruments 4.2 2.1 32.2 16.8 19.6 16.0 15.8 16.0
[23]Printing 19.4 9.4 16.2 17.1 4.7 21.1 9.5 13.8
Average -4.3 -0.7 3.0 7.5 11.2 8.2 14.0 6.8
[46]Tap water -5.4 -12.6 2.6 -1.8 -12.4 2.5 -3.1 -4.0
[44]Power -13.0 -7.1 -9.6 -5.0 -4.1 -4.0 4.4 -4.1
[25]Petroleum processing
-22.6 -13.9 -22.1 -9.1 -8.6 8.4 17.9 -4.6

TFP Growth due to FTP
IND2 1996 1997 1998 1999 2000 2001 2002 Average
[41]Electronics and telecom 13.68 16.87 20.04 23.11 26.56 29.84 33.25 26.33
[32]Pressing ferrous 3.29 9.48 15.65 21.88 28.15 34.41 40.73 24.43
[37]Transport equipment 1.31 7.13 13.07 19.00 25.07 31.15 37.19 23.03
Average 2.80 5.94 9.01 12.30 15.30 18.89 22.60 13.95
[25]Petroleum processing -7.73 -5.35 -2.45 0.55 3.22 6.16 8.83 1.40
[7]Petroleum extraction 2.72 1.43 -0.11 1.06 3.57 0.22 -1.69 0.98
[44]Power -5.19 -3.93 -2.30 -0.73 0.76 2.40 3.89 0.17

TE: Actual to Frontier Output
IND2 1996 1997 1998 1999 2000 2001 2002 Average
[16]Tobacco 0.60 0.57 0.57 0.55 0.53 0.51 0.50 0.55
[8]Ferrous mining 0.58 0.55 0.47 0.51 0.49 0.48 0.50 0.51
[22]Paper-making 0.49 0.47 0.48 0.47 0.45 0.44 0.42 0.46
Average 0.32 0.32 0.32 0.31 0.30 0.30 0.29 0.31
[40]Electric equipment
0.17 0.17 0.16 0.16 0.16 0.15 0.15 0.16
[42]Instruments 0.15 0.14 0.16 0.15 0.15 0.15 0.15 0.15
[41]Electronics and telecom
0.13 0.13 0.14 0.13 0.11 0.11 0.10 0.12

TE by Ownership
TYPE mean(TE_whole) mean(TE_industry)type=private 0.478 0.474 type=collective 0.477 0.471 type=Mixed 0.474 0.467 type=Foreign 0.511 0.531 type=HK/Mac/TW 0.492 0.497 type=SOE 0.403 0.383 Whole sample 0.442 0.432
Simiple Average of Technical Efficiency by Ownership Type

TFP Growth due to Change in TE
IND2 1996 1997 1998 1999 2000 2001 2002 Average
[46]Tap water 0.6 0.6 0.6 0.6 0.8 0.8 0.8 0.7
[44]Power -0.4 -0.4 -0.4 -0.4 -0.4 -0.4 -0.4 -0.4
[10]Non-metal mining -2.4 -2.3 -2.4 -2.3 -2.2 -2.2 -2.4 -2.3
Average -6.4 -6.5 -6.6 -6.7 -7.0 -7.4 -7.9 -7.1
[15]Beverage -10.7 -11.0 -11.1 -11.5 -11.8 -12.1 -12.6 -11.6
[29]Rubber -9.6 -10.5 -11.3 -11.1 -12.3 -13.2 -15.3 -12.1
[41]Electronics and telecom -14.5 -14.3 -13.9 -14.6 -15.2 -15.2 -15.9 -15.0

TFP Growth due to AE
IND2 1996 1997 1998 1999 2000 2001 2002 Average
[7]Petraleum extraction
7.594 3.733 6.594 4.172 4.867 1.753 4.435 4.440
[23]Printing 6.426 5.464 4.784 4.797 2.374 3.699 2.373 3.976
[8]Ferrous mining
0.263 0.940 1.134 -0.143 2.836 3.404 9.573 3.062
Average -0.412 0.198 -0.205 -0.046 0.370 -0.260 0.285 0.019
[15]Beverage -2.664 -2.070 -2.476 -3.098 -0.951 -1.195 -1.213 -1.874
[25]Petroleum processing
-6.626 -2.700 -2.989 -3.405 -1.977 -0.257 0.145 -2.229
[44]Power -3.747 -0.158 -4.459 -2.808 -2.993 -2.680 -0.647 -2.378

Return to Scale (RTS) by Sector
IND2 1996 1997 1998 1999 2000 2001 2002 Average
[16]Tobacco 1.373 1.392 1.398 1.406 1.421 1.441 1.456 1.417
[15]Beverage 1.089 1.081 1.066 1.047 1.010 0.971 0.940 1.022
[18]Garments 0.958 0.966 0.978 0.993 1.004 1.006 1.012 0.993
Average 0.925 0.925 0.924 0.911 0.894 0.889 0.881 0.903
[42]Instruments 0.690 0.700 0.713 0.717 0.722 0.721 0.723 0.715
[20]Timber 0.665 0.677 0.693 0.708 0.713 0.728 0.724 0.708
[45]Gas production 0.524 0.548 0.588 0.630 0.674 0.688 0.714 0.657

TFP Growth due to SE
IND2 1996 1997 1998 1999 2000 2001 2002 Average
[16]Tobacco 7.31 0.15 0.95 3.98 -0.15 -0.36 -1.61 1.07
[36]Special equipment -2.40 -0.48 0.78 2.91 -0.55 2.77 0.75 0.59
[9]Nonferrous mining 0.78 -2.07 3.15 -0.05 -0.09 0.96 1.66 0.57
Average -0.58 -0.63 -0.07 -0.04 0.06 -0.53 -0.52 -0.33
[21]Furniture -7.79 -0.89 -2.21 -1.96 -0.41 -3.69 -2.20 -2.60
[45]Gas production -7.05 -12.81 -6.77 -2.99 -6.69 2.55 -1.11 -3.35
[20]Timber -11.21 -4.76 0.04 -4.67 -3.85 -2.98 -0.96 -3.53

Dynamics of TFP Growth
-150%
-100%
-50%
0%
50%
100%
150%
200%
250%
300%
350%
400%
TFP TP change in TE AE SE
1996
19971998
1999
2000
20012002
Unit: Average Annual TFP Growth during 1996-2002 (= 6.8%)

Patterns of Productivity Revolution
• Average annual growth of TFP in China’s large and medium industrial enterprises sector is as high as 6.8% with a rising trend during 1996-2002.
• The contribution to TFP growth by Frontier Technology Progress reached as much as 14 percentage points a year on average.
• The decline in Technical Efficiency (Relative to the Frontier) reduced the growth of TFP by 7.1 percentage points a year on average.
• Allocative Efficiency contributed on average only 0.02 percentage points a year to the growth of TFP.
• Scale Dis-Economy slowed the growth of TFP by 0.33 percentage points a year.
• At the turn of the century, the most important part of China’s industry is in the middle of an industrial productivity revolution driven by both frontier technological catching up and expanding gaps of technical efficiency among enterprises.

Factors Driving China’s Industrial Productivity Revolution
• Privatization
• Financial sector development
• Competition
• FDI and globalization
• Urbanization & industrialization
• Business cycle

1995 1998 2002 Change in 95-02 Change/Level in 96
private 0 11 95 95 9500.0%collective 227 287 219 -8 -3.0%mixed 231 514 1,642 1,411 505.7%foreign 152 329 619 467 201.3%HK-M-Taiwan 164 276 389 225 118.4%state-owned 2,512 3,193 2,758 246 9.0%Total 3,286 4,610 5,722 2,436 65.7%private 0.0% 0.2% 1.7% 1.7%
collective 6.9% 6.2% 3.8% -3.1%
mixed 7.0% 11.1% 28.7% 21.7%
foreign 4.6% 7.1% 10.8% 6.2%
HK-M-Taiwan 5.0% 6.0% 6.8% 1.8%
state-owned 76.4% 69.3% 48.2% -28.2%
Total 100.0% 100.0% 100.0% 100.0%
Table 1.1 Distribution of Total Liabilities in Sample Enterprises by Ownership: 1995-2002 (RMB Billion)
Privatization and Capital Markets

Explaining Technical Efficiency
• Finance (liability/asset)
• Firm size (market share)
• Competition/concentration (hfindex3)
• Ownership and privatization (type)
• Industry effect (Ind2)
• Region effect (place2)

Explaining Technical Efficiency
variables coefficient z-ratio coefficient z-ratioConstant 0.5128 [151.94]*** 0.5203 [139.66]***Liabilities-Assets ratio -0.1396 [72.32]*** -0.1427 [66.66]***Market Share -0.1669 [7.60]*** -0.1468 [6.02]***Square of Market Share 0.4863 [6.18]*** 0.3613 [4.13]***Market Concentration -0.2193 [6.32]*** -0.1522 [3.95]***type=private 0.025 [8.11]*** 0.0312 [9.12]***type=collective 0.0373 [21.92]*** 0.0436 [23.16]***type=Mixed 0.0175 [13.07]*** 0.0218 [14.68]***type=Foreign 0.0585 [24.52]*** 0.0528 [20.05]***type=HK/Mac/TW 0.0431 [17.61]*** 0.0437 [16.16]***type=SOE 0 0Observations 164870 164870
TE (whole sample) TE (by industry)Regressi ons Expl ai ni ng TE control l i ng for I ndustry and Regi on Eff ects
Absolute value of z statistics in brackets
* significant at 10%; ** significant at 5%; *** significant at 1%
type=soe ,ind2=17 ,place2=shandong are omited as benchmark.
Coefficients for Industry and Region dummies not reported in this table.

Ownership-Specific Impact on TE
variables coefficient z-ratio coefficient z-ratiotype==private 2.50% [8.11]*** 3.12% [9.12]***type==collective 3.73% [21.92]*** 4.36% [23.16]***type==Mixed 1.75% [13.07]*** 2.18% [14.68]***type==Foreign 5.85% [24.52]*** 5.28% [20.05]***type==HK/Mac/TW 4.31% [17.61]*** 4.37% [16.16]***type=SOE 0.00% 0.00%Constant 51.28% [151.94]*** 52.03% [139.66]***
TE (whole sample) TE (by industry)Margi nal Eff ect of Onwershi p on TE

Industry-Specific Impact on TE
variables coefficient z-ratio coefficient z-ratio[16]Tobacco 25.74% [26.37]*** 9.97% [9.26]***[27]Medical 10.75% [24.56]*** 1.28% [2.65]***[37]Transport equipment 6.69% [18.23]*** 1.36% [3.37]***[15]Beverage 5.85% [13.76]*** 4.73% [10.11]***[17]Textile 0.00% 0.00%[44]ElectricPower -6.58% [15.52]*** 12.06% [25.82]***[06]Coal Mining -7.57% [10.73]*** 11.12% [14.31]***[25]Petroleum Processing -8.69% [9.83]*** 6.18% [6.33]***[46]TapWater -18.98% [22.18]*** 17.44% [18.50]***[45]Gas Production -25.13% [19.84]*** 1.26% [0.90]Constant 51.28% [151.94]*** 52.03% [139.66]***
Margi nal Eff ect of I ndustry on TETE (whole sample) TE (by industry)

Region-Specific Impact on TE
variables coefficient z-ratio coefficient z-ratio[31]ShangHai 3.13% [10.43]*** 3.65% [11.02]***[32]JiangSu 1.76% [4.86]*** 1.99% [4.97]***[23]HLJ 1.50% [4.18]*** 1.58% [4.01]***[44]GuangDong 0.83% [2.61]*** 0.23% [0.66][37]ShanDong 0.00% 0.00%[22]JiLin -7.18% [15.09]*** -8.31% [15.86]***[13]HeBei -7.75% [12.22]*** -7.92% [11.33]***[15]inter Mongolia -8.03% [21.37]*** -9.30% [22.46]***[21]LiaoNing -8.07% [15.68]*** -8.95% [15.78]***[62]GanSu -8.10% [9.49]*** -8.65% [9.20]***Constant 51.28% [151.94]*** 52.03% [139.66]***
Margi nal Eff ect of Regi on on TETE (whole sample) TE (by industry)

Implications
• Clear evidences of rapid industrial productivity growth driven by technological progress
• Clear evidences of large productivity gaps across ownership, region, and industry
• Clear evidences that privatization, competition and globalization contributed to China’s industrial productivity revolution.
• The evidences uncovered here support the view that China’s economic growth is sustainable as it is based on productivity catch-up

Thank you