Embed Size (px)
Citation preview
RESOURCESFOR THE FUTURE
Productivity Change in U.S.Coal Mining
Joel Darmstadter
with the assistance of Brian Kropp
Discussion Paper 97-40
July 1997
Resources for the Future1616 P Street, NWWashington, DC 20036Telephone 202-328-5000Fax 202-939-3460
© 1997 Resources for the Future. All rights reserved.No portion of this paper may be reproduced withoutpermission of the author.
Discussion papers are research materials circulated by theirauthors for purposes of information and discussion. Theyhave not undergone formal peer review or the editorialtreatment accorded RFF books and other publications.
-ii-
This paper is one of a series of studies on “Understanding Productivity Change in NaturalResource Industries” undertaken by Resources for the Future with the assistance of a grantfrom the Alfred P. Sloan Foundation. Titles in this series are:
• PRODUCTIVITY CHANGES IN U.S. COAL MINING, by Joel Darmstadter with theAssistance of Brian Kropp (RFF Discussion Paper 97-40);
• PRODUCTIVITY GROWTH AND THE SURVIVAL OF THE U.S. COPPER INDUSTRY, byJohn E. Tilton and Hans H. Landsberg, RFF Discussion Paper 97-41(forthcoming);
• THE FOREST SECTOR: IMPORTANT INNOVATIONS, by Roger A. Sedjo, RFFDiscussion Paper 97-42 (forthcoming);
• CHANGING PRODUCTIVITY IN U.S. PETROLEUM EXPLORATION ANDDEVELOPMENT, by Douglas R. Bohi, a book from Resources for the Future(forthcoming);
• PRODUCTIVITY TRENDS IN THE NATURAL RESOURCE INDUSTRIES, by Ian W. H.Parry, RFF Discussion Paper 97-39;
and
• UNDERSTANDING PRODUCTIVITY CHANGE IN NATURAL RESOURCE INDUSTRIES,edited by R. David Simpson, a book from Resources for the Future(forthcoming).
-iii-
Productivity Change in U.S. Coal Mining
Joel Darmstadterwith the Assistance of Brian Kropp
Abstract
Labor productivity in U.S. coal mining increased at an average annual rate of slightlyover four percent during the past 45 years. This report examines key factors contributing tothat record - particularly, technological innovation in both surface and underground miningand concurrent geographic shifts in U.S. coal production. Health, safety, and environmentalregulations introduced in the sixties and seventies, as well as labor unrest, interrupted long-term productivity advance; but the interruption was of limited duration. Although ourprincipal focus is on worker productivity, steady growth in the relative importance of non-labor inputs underscores the need to consider total factor productivity. The report touches onthe productivity record using that measure.
Key Words: coal mining, productivity, technological change
JEL Classification Nos.: Q41, L72, O31
-iv-
Table of Contents
Foreword and Acknowledgments...................................................................................... viSummary ........................................................................................................................S-1Section1. Overview of Productivity Change: Pre-1970’s, 1970’s, Post-1970’s.......................... 1
A Note on Coal Mine Productivity Concepts.......................................................... 5Output Measures ................................................................................................. 5The Input Measure .............................................................................................. 6Resultant Productivity Measures ......................................................................... 6
2. Technological Change: Surface Mining..................................................................... 83. Technological Change: Underground Mining.......................................................... 13
Some Technological Basics.................................................................................. 13Productivity.......................................................................................................... 16From the Past to the Future .................................................................................. 18
4. Health, Safety and the Environment ........................................................................ 205. Labor Issues............................................................................................................ 27
Introduction ......................................................................................................... 27A Brief Look at the Coal Mine Labor Scene......................................................... 27Productivity Aspects ............................................................................................ 29The Union-vs.-Nonunion Issue............................................................................. 30
6. The Role of Labor and Nonlabor Inputs in Productivity Change.............................. 317. The Coal Resource Base: Constraint or Non-Issue?................................................. 35
Introduction ......................................................................................................... 35Coal Resource and Reserve Concepts................................................................... 35Some Estimates.................................................................................................... 36Some Caveats....................................................................................................... 36
8. Coalbed Methane .................................................................................................... 39Relevance to this Project ...................................................................................... 39Factors Behind Recent Trends in Coalbed Methane Output.................................. 40Coalbed Methane as a Productivity Issue.............................................................. 41
9. Industry Structure and Productivity ......................................................................... 4310. International Competitiveness ................................................................................. 4611. Productivity Prospects and Issues............................................................................ 5012. Bibligraphy ............................................................................................................. 54
-v-
List of Tables
1-1: Productivity Highlights ............................................................................................. 33-1: Ratio of Longwall to Room-and-Pillar Labor Productivity Levels, Selected States
and Regions, 1983-1993......................................................................................... 164-1: Major Categories of Cost Increase at CONSOL’s Underground Coal Mines........... 267-1: Estimated Coal Resources and Reserves, 1995 ....................................................... 377-2: Estimated Recoverable U.S. Coal Reserves, By Sulfur Btu Content, 1995.............. 388-1: 1995 U.S. Coalbed Methane Production and Proved Reserves ................................ 409-1: Coal Mine Productivity by Mine Production Range, 1995 ...................................... 4310-1: Selected International Cost and Productivity Comparisons, Late 1980s................... 48
List of Figures
1-1: Share of Coal in U.S. Energy Consumption and Productionand in Electricity Generation .................................................................................... 2
2-1: Coal Production, 1960-1995 ..................................................................................... 92-2: Coal Prices, 1980-1995 ............................................................................................ 93-1: Underground Mining Systems ................................................................................ 144-1: Injury and Fatality Rates in U.S. Coal Mines, 1931-1995 ....................................... 236-1: Multifactor and Labor Productivity, 1947-1991 ...................................................... 3311-1: Historic and Future Growth Rates for Coal Production and Productivity................. 51

-vi-
Foreword and Acknowledgments
This study of U.S.coal mine productivity is one of a number of case studies dealing withproductivity and technological change in U.S. natural resource industries. (Companionstudies deal with petroleum, copper, and forestry; in addition, a cross-cutting analysisconsiders these industries from a “top-down” macroeconomic perspective.) The work isbeing supported by a major grant from the Alfred P. Sloan Foundation, with additionalfunding from Resources for the Future.
In the preparation of this report, we benefited greatly from critical comments on an earlierdraft provided by William Bruno, CONSOL, Inc. (Pittsburgh); Denny Ellerman, MIT; HalGluskoter, US Geological Survey (Reston); Richard Gordon, Pennsylvania State University;as well as our RFF colleagues, David Simpson and Ian Parry. Discussions at a productivityworkshop in March 1997, at which that earlier draft was presented, proved helpful as well.Last, but certainly not least, we express our appreciation to those individuals in industry (bothin their offices and production facilities), government, academic institutions, and tradeassociations who hosted visits from us or otherwise responded to our queries constructivelyand with generosity and patience. We especially want to thank, in addition to those alreadymentioned: Emil Attanasi and David Root, USGS (Reston); Steve Bessinger, CONSOL(Morgantown WV), Hector Choy, James Kliche and Terry Walsh, Thunder Basin CoalCo./ARCO (Wyoming); Eustace Frederick, retired CONSOL official; Andy Gaudielle, ARCOCoal Co. (Denver); B. D. (Willy) Hong, EIA; Charles Perkins, Bituminous Coal OperatorsAssociation; Tim Rohrbacher, USGS (Denver); Stuart Sanderson, Colorado MiningAssociation; Stanley Suboleski, A. T. Massey Coal Co.; Bruce Watzman, National MiningAssociation; and Rolf Zimmermann, CONSOL (Pittsburgh).
The fault for misinterpretation or errors in the use of any information or suggestions conveyedto us remains ours, of course. We hope readers will alert us to additional changes andcorrections they feel are necessary.
Darmstadter RFF 97-40
S-1
Summary
This report reviews changes in U.S. coal mine productivity over the past 45 years -- a time-span long enough to encompass trends prior to, and following, an unsettling 10-year period,beginning in the late sixties, marked by labor unrest and the impact of landmark health,safety, and environmental legislation. Unlike the companion study on the petroleum industry,which concentrates principally on productivity in the exploration for and development of newreserves, this study concentrates almost exclusively on coal extraction from given reserves.The reason for this emphasis is that, notwithstanding limited expandability of coal of requisitequality in particular regions, the overall coal situation in the U.S. is one marked by vast,economically exploitable, reserves. (See section 7.)
Over the 4-1/2 decades 1950-95, coal mine labor productivity increased at an average annualrate of slightly above four percent; and that record includes a decade (1970-80) during whichthe level of productivity actually declined. To the extent that one regards that decade assomething of an aberration, the underlying long-term rate of coal mine productivityimprovement appears especially strong and steady. (See section 1.)
Labor productivity improvement has resulted from the interplay of geographic shifts andtechnological innovation. A pronounced shift in regional concentration of coal output fromthe (largely) underground mines of Appalachia and elsewhere in the East to the (largely)surface mines of the West implies in itself -- given the latter region’s substantially higherproductivity levels -- national productivity improvement even without any regionalimprovement. In fact, both surface and underground mining experienced dramatic laborproductivity increases. Surface mining benefited from increased deployment of largeelectrified draglines. Underground mining benefited from the spread of continuous and,especially, longwall mining techniques. With information technology rapidly becoming anintegral part of their operation, both surface and underground mines have seen the productiveuse of computers and remote control processes. (See sections 2 and 3.)
Steady labor productivity improvement would not mean much if capital-intensive innovationslike draglines and long-wall mining equipment required such large fixed investments as tomute the rate of total factor productivity (TFP) improvement. As it happens, TFP (capturingthe inputs of labor, capital, and other resources) has grown markedly in its own right,contributing to a steady decline in inflation-adjusted coal prices over prolonged periods oftime. (See section 6.)
One reason why the period of productivity in the seventies may be regarded as somewhatanomalous is that the world oil market upheavals of the period triggered both rising coaldemand as well as an expansion of coal production capacity on the expectation that the oil“crisis” might be the forerunner of enduring energy turmoil. The result, for both reasons, was
Darmstadter RFF 97-40
S-2
the entry of less efficient mines and miners. But that period also saw the enactment of majorfederal legislation (the Coal Mine Health and Safety Act of 1969 and the Surface MiningControl and Reclamation Act of 1977), compliance with which unquestionably caused at leasta transitory penalty in productivity growth. The new laws (described in section 4) sought tostrengthen protection against, among other things, explosive gas mixtures and vulnerable roofsupport systems in underground mines; and called for tightened reclamation of strip-minedlands. (As we elaborate in Section 8 of the report, coal mine gas concentrations represent adanger but, in some cases, an opportunity as well: a growing share -- now about five percent-- of U.S. natural gas production comes from coalbed methane.)
Labor unrest paralleled enactment and implementation of regulatory constraints, loweringoutput and compounding the negative effects on productivity noted above. Although U.S.coal mining has historically been beset with labor strife, the 1970s witnessed acute labordisruptions; these resulted in particularly large cutbacks in national coal production during1971 and 1978. In the years since, declining oil prices have put strong pressure on the coalindustry to remain competitive. The number of firms in the industry has declined, with manyof the losses coming from the less efficient among those which had entered just a few yearsearlier. The number of mines and miners also fell. Among the employers and miners thatremained, there emerged a growing perception of a mutuality of interest. Both groups see aconstant threat to the role of coal on the national and world energy scene. Labor seems nowto perceive labor-saving technology less as a threat to eliminate jobs, but rather as anopportunity to preserve those jobs that remain; labor strife has been, therefore, less of animpediment to productivity improvement. The fact that Western surface coal is largely minedby non-union labor should also be taken into account. (See section 5.)
U.S. coal mine productivity performance has been an important factor in giving the country astrong competitive position in world exports. Constant competitive pressure from establishedexporters (Australia, South Africa, Colombia) and the prospective emergence of a rationalizedindustry in Eastern Europe and countries of the former Soviet Union means that theproductivity-trade connection is one the U.S. industry undoubtedly regards as a matter ofstrategic importance. (See section 10.)
The report does not attempt to project the future course of U.S. coal mine productivity, thoughit does address several issues likely to have a bearing on that question. For example, willreturns to coal firms -- low by energy company standards in recent years -- be adequate tofinance the large capital investments needed to sustain technological advance and, thereby,productivity advance in the years ahead? (See section 9.) Apprehension over futureenvironmental constraints -- e.g. impeded access to Federally owned western coal lands orCO2 emission limitations -- could prove to be another impediment. For what it’s worth, EIA’sprojection of coal mine productivity improvement over the next twenty years, while asignificant deceleration from the pace achieved following the industry’s emergence from the

Darmstadter RFF 97-40
S-3
dismal 1970s, compares quite favorably with long-term productivity performance over theperiod 1950-95. And predicted productivity gains appear still healthy enough, in EIA’sjudgment, to maintain level, or perhaps even some continued decline in, real coal prices. (Seesection 11.)
-1-
Productivity Change in U.S. Coal Mining
Joel Darmstadter*
with the assistance of Brian Kropp
1. OVERVIEW OF PRODUCTIVITY CHANGE: PRE-1970S, 1970S, POST-1970S
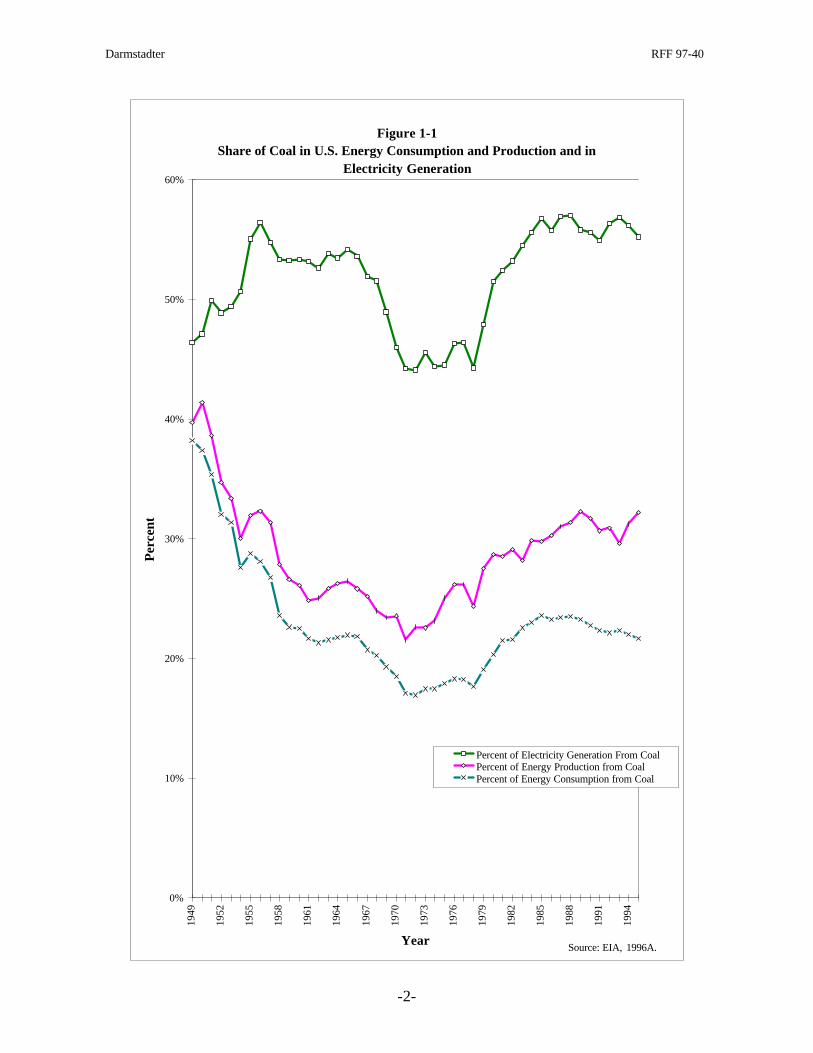
The position of the coal industry in America’s fuel and power picture remains one ofprime importance. (See Figure 1-1.) Measured in Btu terms, the industry is the country’sleading energy producer. Coal’s one-fifth share of the nation’s energy consumption is nearlyas high as that of natural gas. Coal is the electric utility sector’s principal fuel supplier,accounting for around 55 percent of electricity generated at power stations. The roughly ninepercent of coal production that is exported yields annual proceeds of approximately $4 billion.Notwithstanding the industry’s increasing obligation to accommodate health, safety, andenvironmental regulations, coal appears to retain an important competitive edge in its abilityto continue serving its traditional markets -- especially the electric power sector, whosesustained coal purchases have provided most of the momentum for the industry’s viability inrecent decades. Absent significantly more restrictive environmentally-related “downstream”constraints -- stemming, for example, from possible restrictions on greenhouse gas emissions-- DOE’s Energy Information Administration projects coal to retain its ranking importance,amidst stable or declining real prices, into the first several decades of the 21st century.Unquestionably, an important source of the industry’s success has been its productivity recordand the technological and other factors underlying that record.
The broad trends in coal mine productivity, highlighted in Table 1-1, provide aspringboard for the detailed analysis in ensuing sections. Underground and surface miningreveal roughly parallel labor productivity trends over the past 45 years: a record of strongadvance in the 1950-60 decade, maintained in the following decade by surface mining, butwith some deceleration of growth in underground mines; decisive absolute declines in bothsectors during the 1970s; and strong recovery for both since 1980, though it was only midwayin this last period that the peak productivity levels attained by underground mining in 1969and by surface mining in 1975 were again achieved. The nineties have seen somedeceleration in the rate of productivity increase, but with a pace that still compares well withthat achieved over four and a half decades.
Averaged over that 45-year time span, coal mine labor productivity -- i.e. physicaloutput per miner hour -- shows an impressive annual rate of a bit over four percent. The factthat, over the same period, inflation-adjusted coal prices declined by nearly one percent yearlysuggests that labor productivity and other efficiency improvements contributed importantly tocontaining production costs. The role of those other improvements is captured more explicitly * The author is Senior Fellow, Energy & Natural Resources Division, Resources for the Future.
Darmstadter RFF 97-40
-2-
Figure 1-1Share of Coal in U.S. Energy Consumption and Production and in
Electricity Generation
0%
10%
20%
30%
40%
50%
60%19
49
1952
1955
1958
1961
1964
1967
1970
1973
1976
1979
1982
1985
1988
1991
1994
Year
Per
cent
Percent of Electricity Generation From CoalPercent of Energy Production from CoalPercent of Energy Consumption from Coal
Source: EIA, 1996A.
Darmstadter RFF 97-40
-3-
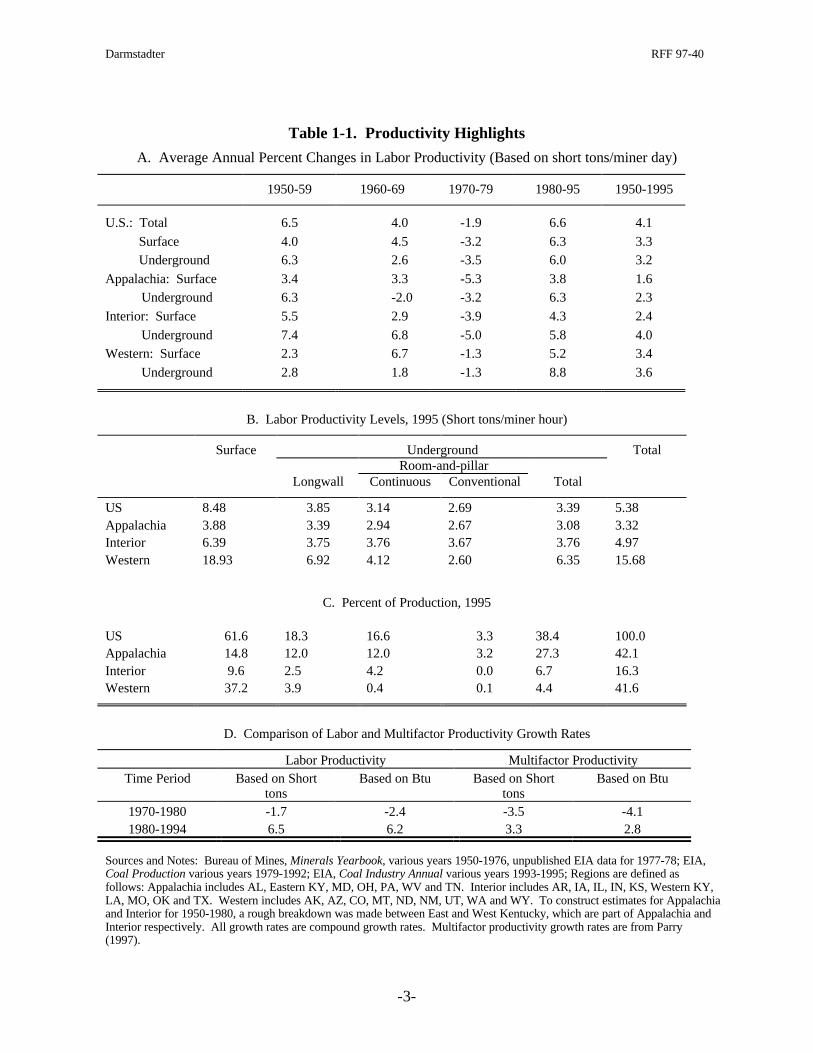
Table 1-1. Productivity Highlights
A. Average Annual Percent Changes in Labor Productivity (Based on short tons/miner day)
1950-59 1960-69 1970-79 1980-95 1950-1995
U.S.: Total 6.5 4.0 -1.9 6.6 4.1
Surface 4.0 4.5 -3.2 6.3 3.3 Underground 6.3 2.6 -3.5 6.0 3.2
Appalachia: Surface 3.4 3.3 -5.3 3.8 1.6Underground 6.3 -2.0 -3.2 6.3 2.3
Interior: Surface 5.5 2.9 -3.9 4.3 2.4
Underground 7.4 6.8 -5.0 5.8 4.0Western: Surface 2.3 6.7 -1.3 5.2 3.4
Underground 2.8 1.8 -1.3 8.8 3.6
B. Labor Productivity Levels, 1995 (Short tons/miner hour)
Surface Underground TotalRoom-and-pillar
Longwall Continuous Conventional Total
US 8.48 3.85 3.14 2.69 3.39 5.38Appalachia 3.88 3.39 2.94 2.67 3.08 3.32Interior 6.39 3.75 3.76 3.67 3.76 4.97Western 18.93 6.92 4.12 2.60 6.35 15.68
C. Percent of Production, 1995
US 61.6 18.3 16.6 3.3 38.4 100.0Appalachia 14.8 12.0 12.0 3.2 27.3 42.1Interior 9.6 2.5 4.2 0.0 6.7 16.3Western 37.2 3.9 0.4 0.1 4.4 41.6
D. Comparison of Labor and Multifactor Productivity Growth Rates
Labor Productivity Multifactor ProductivityTime Period Based on Short
tonsBased on Btu Based on Short
tonsBased on Btu
1970-1980 -1.7 -2.4 -3.5 -4.11980-1994 6.5 6.2 3.3 2.8
Sources and Notes: Bureau of Mines, Minerals Yearbook, various years 1950-1976, unpublished EIA data for 1977-78; EIA,Coal Production various years 1979-1992; EIA, Coal Industry Annual various years 1993-1995; Regions are defined asfollows: Appalachia includes AL, Eastern KY, MD, OH, PA, WV and TN. Interior includes AR, IA, IL, IN, KS, Western KY,LA, MO, OK and TX. Western includes AK, AZ, CO, MT, ND, NM, UT, WA and WY. To construct estimates for Appalachiaand Interior for 1950-1980, a rough breakdown was made between East and West Kentucky, which are part of Appalachia andInterior respectively. All growth rates are compound growth rates. Multifactor productivity growth rates are from Parry(1997).
Darmstadter RFF 97-40
-4-
in the estimates presented in panel D of the table. These show that multifactor productivity(i.e. productivity based on all factor inputs -- labor, capital, intermediate goods) tracks thelong-term trend recorded by labor productivity alone, though, with nonlabor inputs risingfaster than labor inputs, the more comprehensive productivity measure shows markedlyslower rates of increase.
The table, of course, exhibits only the aggregate and composite manifestations ofmany economic, technological, and policy crosscurrents at work during much of this period.Key among these, though in no a priori order of importance, were:
• The enactment of federal, health, safety, and environmental statutes -- principallythe Coal Mine Health and Safety Act of 1969, the Surface Mine Control and Reclamation Actof 1977, and the Clean Air Act of 1970.
• Acute labor unrest, particularly during the 1970s.• Major technological advances -- e.g. the growth of longwall underground mining
and the use of ever-larger excavation equipment in strip mines, in both cases aided byincreased computerization and sophisticated control systems.
• A market environment during the oil upheavals (coupled with labor strife) of the1970s in which coal demand -- both for current consumption as well as precautionaryinventory buildup -- experienced a significant increase, with consequences for the scale of,and employee experience in, mining operations -- that is, the extent to which the entry ofsmall, normally marginal, mines and the influx of less skilled miners are likely to have heldback productivity advance.
While unraveling their quantitative effect turns out to be complicated, as we shall see insubsequent sections, it is easy to speculate on the general bearing these and other factors had oncoal mine productivity change, positively or negatively, transitionally or more enduringly.Health, safety, and environmental safeguards, irrespective of their longer-term benefits and theability of the industry to adapt to them in due course, could not help but depress productivitylevels and growth early on in the wake of their implementation.1 On the other hand, impressivetechnological developments signaled the prospect of strong productivity boosts in both open-pitand underground mines. In the latter case, for example, note in Table 1-1 how longwall mining,with its comparatively high underground productivity level, increased its share of undergroundcoal production from 27 percent in 1983 to 47 percent in 1995.
Amid these developments, one must also note the aggregate coal mine productivityimplications of geographic shifts. Between 1970 and 1995, Western coal production increasedits share of nationwide output from 6 to close to 40 percent; and since Western coal isdominated by high-productivity surface mining, that shift in itself translates into higher overallcoal mine productivity growth. (See Figure 2-1 for more detail on regional production shifts.)
1 If one were to value the benefits of these safeguards as positive “spillovers” of safer and cleaner coal miningpractices -- as some have urged -- measured productivity need not show the extent of the downward effectreferred to.
Darmstadter RFF 97-40
-5-
Indeed, note from panel A of Table 1-1 that, for several of the periods shown,nationwide productivity growth exceeds the growth rates for the two sectors (underground andsurface) comprising the national total. This somewhat striking phenomenon simply reflectsthe strength of that westward shift. During the last decade, however, the extent of that shifthas slowed perceptibly.
Output Measures
Although most widely used, an unadjusted estimate of physical output in thenumerator of the productivity ratio can somewhat distort the analysis. Such an outputmeasure is more accurate for a homogeneous product like petroleum, which has experiencedrelatively little change over the years in the average energy content per barrel of oil or cubicfoot of gas. In comparison, the average Btu content per short ton of U.S. coal has fallen fromjust under 25 million to just over 21 million from 1949 to 1995, a decrease of almost 15%(EIA 1996A). Compared to output expressed in quantity terms, this decrease in heating valueimplies a downward adjustment in the level and rate of change in productivity. On the otherhand, since the reduced heat content associated prominently with a geographic shift in coalproduction to western surface mines was in large part spurred concurrently by the low sulfurcontent of the region’s coal, an offsetting adjustment designed to reflect the lower heatcontent would be the reduced sulfur content. (An output series expressed in constant dollarscould capture characteristics like energy and sulfur content; but it would be distorted by otherfactors causing price gyrations and therefore inappropriate for productivity measurement.)
Unless otherwise indicated, total production includes bituminous, sub-bituminous,lignite and anthracite. At times, to preserve historical consistency, anthracite (accounting for0.5 percent of coal production in 1995) is excluded. Similarly, in citations from specializedstudies, one cannot always be certain that the production total employed in the analysisconforms precisely to the above definition.
A Note on Coal Mine Productivity Concepts
The choice of alternative coal mine productivitymeasures is dictated by the purpose of the analysis andavailability of data. In the present study, availability–in termsof disaggregated detail and time series length–was theoverriding basis for the productivity indicator used. Exceptfor selective attention to a total factor (or multifactor)productivity measure, our indicator of choice is short tons ofcoal per unit of labor input. But it is useful to recognize theappropriateness of alternative productivity measures in orderto indicate the effect that use of those variants would have onobserved long term trends.
Darmstadter RFF 97-40
-6-
The Input Measure
Inputs into a labor productivity measure can be based on the number of employees,shifts or worker hours. Employee numbers -- in coal mining as in other industries -- are oftenthe most readily available and go back the longest period of time, but, for analytical reasons,are far less satisfactory than a series based on hours worked. Somewhat related, shift lengthas a measure of input lacks consistency through time. From 1986 to 1995, the averagenumber of hours per shift per miner has increased by 5 percent. Illustrative of thattransformation at the individual mine level is the fact that in 1992, at the Freedom mine inNorth Dakota, the shift length changed from 3 eight hour shifts, 5 days per week, to 2 ten hourshifts, 6 days per week (Mining Engineering April 1995, p. 336). Latitudinal comparisons aredistorted because there is no consistent measure of shift lengths across mines, regions orfirms. Miner hours thus provide the most appropriate basic measure of labor input. Thehours worked do not, however, include all employees of the coal industry. The employeesthat are included are those involved in the production, processing, preparation, development,maintenance and repair including engineering and technical professionals (EIA, Coal IndustryAnnual 1995 1996, p. 74). Typically, purely administrative and research functions -- whetherat the mine or offsite -- are excluded from worker hours. A deeper analysis of labor inputwould take into consideration changes in skills and education.
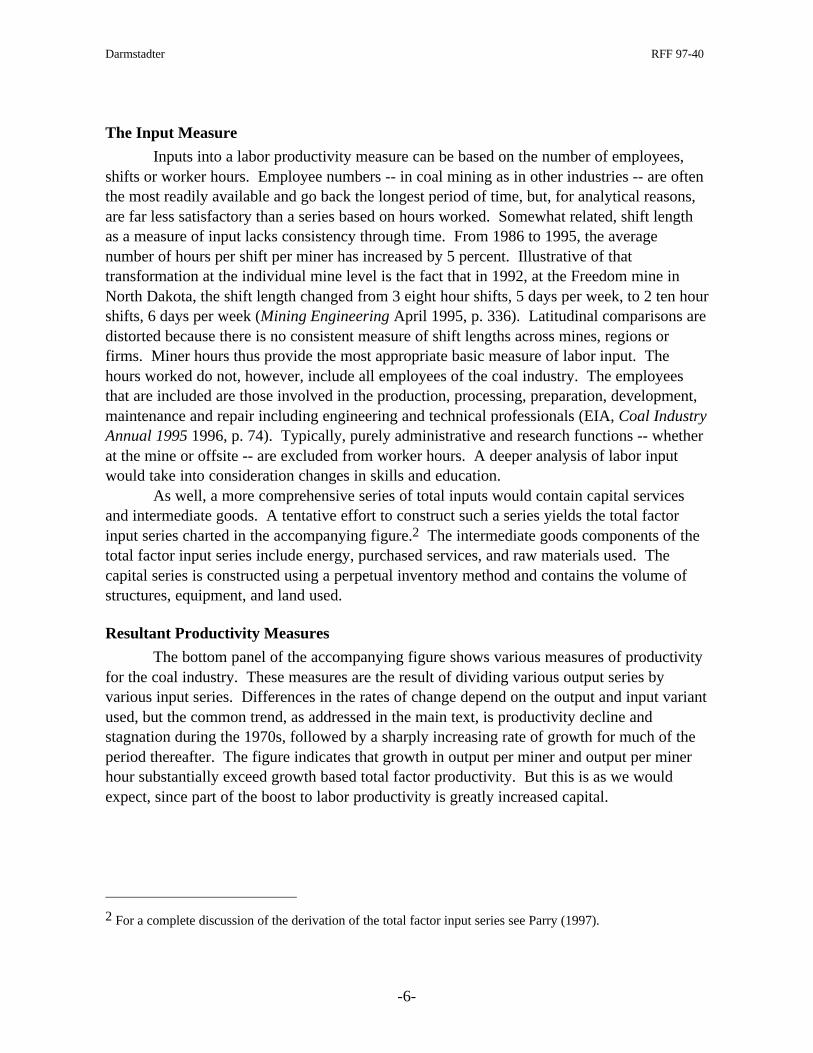
As well, a more comprehensive series of total inputs would contain capital servicesand intermediate goods. A tentative effort to construct such a series yields the total factorinput series charted in the accompanying figure.2 The intermediate goods components of thetotal factor input series include energy, purchased services, and raw materials used. Thecapital series is constructed using a perpetual inventory method and contains the volume ofstructures, equipment, and land used.
Resultant Productivity Measures
The bottom panel of the accompanying figure shows various measures of productivityfor the coal industry. These measures are the result of dividing various output series byvarious input series. Differences in the rates of change depend on the output and input variantused, but the common trend, as addressed in the main text, is productivity decline andstagnation during the 1970s, followed by a sharply increasing rate of growth for much of theperiod thereafter. The figure indicates that growth in output per miner and output per minerhour substantially exceed growth based total factor productivity. But this is as we wouldexpect, since part of the boost to labor productivity is greatly increased capital.
2 For a complete discussion of the derivation of the total factor input series see Parry (1997).
Darmstadter RFF 97-40
-7-
Output Series
0
20
40
60
80
100
120
140
160
180
1970 1972 1974 1976 1978 1980 1982 1984 1986 1988 1990 1992 1994
Year
1970
=10
0
Short Tons
Btu adjusted Tons
Input Series
0
50
100
150
200
250
1970
1972
1974
1976
1978
1980
1982
1984
1986
1988
1990
1992
1994
Year
1970
=10
0
Hours
Employees
Total Factor
Productivity Series
0
50
100
150
200
250
300
1970
1972
1974
1976
1978
1980
1982
1984
1986
1988
1990
1992
1994
Year
1970
=10
0
Short Tons per Miner Hour
Short Tons per Employee
Short Tons per Total Factor Inputs
Btu Adjusted Output per Miner Hour
Btu Adjusted Output per Employee
Btu Adjusted Output per Total Factor Inputs
Darmstadter RFF 97-40
-8-
2. TECHNOLOGICAL CHANGE: SURFACE MINING
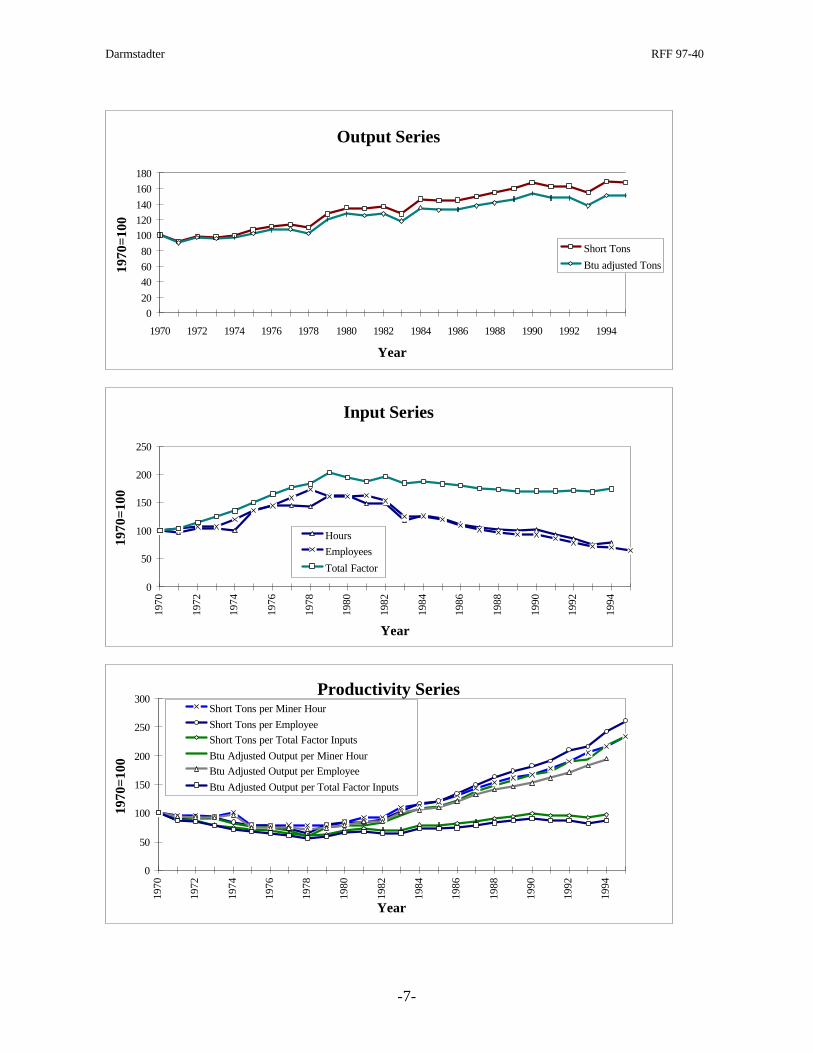
By 1974, surface mining had decisively surpassed underground extraction in its shareof total U.S. coal production. Relative shares, at decadal benchmarks, are shown below (EIA1996A):
Underground Surface
1950 75% 25%1960 67 331970 56 441980 41 591990 41 591995 36 64
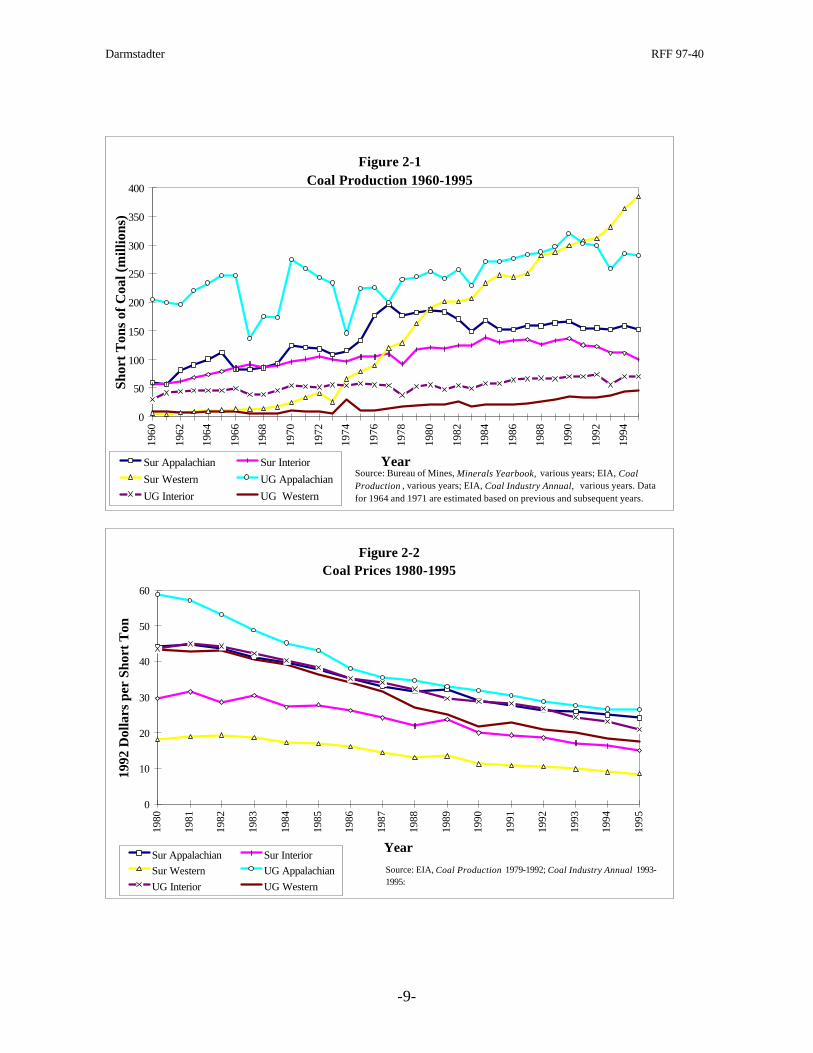
By nationwide standards, surface coal -- centered on production in Western states, as evidentin Figure 2-1 -- is relatively low in energy content. But even when expressed in Btu terms,surface mined coal still makes up around 56 percent of the U.S. aggregate. In spite of therelatively low calorific value of Western surface-mined coal, the dual attributes of highproductivity and low sulfur content -- the latter factor becoming a significant considerationafter passage of the 1970 Clean Air Act -- endow the region with a strongly competitive coalindustry. Figure 2-2, shows that prices at the mine are reflective of that fact: in 1995, coalprices averaged $10.15 per short ton in Western states, $18.81 in the Interior coal-miningregion, and $27.45 in Appalachia. Although Western coal’s principal market remains theWest itself, the West’s price advantage was decisive enough to allow the region to compete,on a delivered price basis, in markets a thousand or more miles to the East. For example, inearly 1996, some 30 percent of coal deliveries to Michigan’s electric power stationsoriginated in the three states of Wyoming, Montana, and Utah. In fact recent analysis byStanley Suboleski gives a 930 mile distance advantage to Western surface mines overAppalachian underground mines, after adjustment for operating costs, royalty payments andtaxes, and assuming equal quality of coal (Mining Engineering, July 1995, p. 659; additionalinformation on transport costs appears in Mining Engineering, Dec. 1995, p. 110.)
The West’s successful penetration of Eastern markets dates basically from a quartercentury ago. Until 1970, coal tonnage moving from west to east of the Mississippi wasessentially zero. In 1971, 4-1/2 million tons were shipped and by 1976, the volume was up to26 million tons. (Energy Modeling Forum 1978) What lay behind this rapid expansion were-- interrelatedly -- the increased importance of environmental concerns, especially the low-sulfur provisions of the 1970 Clean Air Act, which would have been costly to accommodateexclusively with Appalachian coal; the startup of transport by unit trains, dedicated solely tocarrying coal; and, notwithstanding lack of competition in rail transport out of the area, the
Darmstadter RFF 97-40
-9-
Figure 2-1Coal Production 1960-1995
0
50
100
150
200
250
300
350
400
1960
1962
1964
1966
1968
1970
1972
1974
1976
1978
1980
1982
1984
1986
1988
1990
1992
1994
Year
Shor
t T
ons
of C
oal (
mill
ions
)
Sur Appalachian Sur Interior
Sur Western UG Appalachian
UG Interior UG Western
Source: Bureau of Mines, Minerals Yearbook, various years; EIA, Coal Production , various years; EIA, Coal Industry Annual, various years. Data for 1964 and 1971 are estimated based on previous and subsequent years.
Figure 2-2Coal Prices 1980-1995
0
10
20
30
40
50
60
1980
1981
1982
1983
1984
1985
1986
1987
1988
1989
1990
1991
1992
1993
1994
1995
Year
1992
Dol
lars
per
Sho
rt T
on
Sur Appalachian Sur Interior
Sur Western UG Appalachian
UG Interior UG Western
Source: EIA, Coal Production 1979-1992; Coal Industry Annual 1993-1995:
Darmstadter RFF 97-40
-10-
stability during the 1970s, in real terms, of average rail freight charges, then still under ICCregulatory control and the continuing decline of all forms of coal transportation costs in the1980s and 1990s. (In 1990 dollars, rail transportation costs have declined from 24 mills/ton-mile in 1979 to 15.4 mills/ton-mile in 1993) (EIA 1995A). In order to increase output fromthe Powder River Basin, the two main railroads that haul coal out of the area,3 Burlington-Northern-Santa-Fe and Union Pacific-Southern Pacific, have significantly increasedinvestment into this region by not only increasing track miles, but also increasing the numberof double and triple track miles laid.
An additional factor that has contributed to the increased production of western coal isthe increased demand for electricity. Some electric utilities established coal-producingsubsidiaries or joint ventures in the West to provide coal. Other electric utilities went so faras to build power plants at the mine mouth with the coal company committed to supplying thelifetime requirements of the utility plant. The only mines large enough to meet the lifetimerequirement of the power plant were large Western surface mines (EIA 1992).
Productivity has without doubt been a central element in the trend towards surfacemining generally and the exploitation of Western open-pit mines in particular. By 1994, thelevel of labor productivity in Western surface mines -- dominated by Wyoming, the nation’slargest coal-producing state -- was over 3-1/2 times as great as nationwide coal mineproductivity overall and over 2-1/2 times as great as productivity in Western longwall mining-- itself impressively high by the national norm. (See Table 1-1.)
Specific factors aside, productivity change in surface mining has been driven byphenomena it shares with underground mining. That is, years during which productivityrecorded poor performance or a decline were strongly affected by the transitional need toadapt to significantly changed environmental and related regulations. Periods of stronglyadvancing productivity -- the predominant experience during most of the last 45 years -- areassociated with continued technological improvement, in the scale and character of the capitalinputs into the extraction process as well as the skills of the personnel responsible foroperating that equipment. An exceptionally dramatic case in point is ARCO’s Black Thundermine in the Powder River Basin of Wyoming, whose annual output of some 40 million tonswith a cadre of only 500 workers (including those at the coal face and others) underscores themarriage of machinery and skills that is the hallmark of a modern surface mining operation.(Nationally, surface mines produce an average of under 60,000 tons annually, with output perminer about one-quarter the level of Black Thunder).
3 In the seventies, Burlington Northern (now merged with Santa Fe) was the only shipper; presently, the othershipper is Union Pacific (with which Southern Pacific has merged). Additional competition may be in theoffing. The Dakota, Minnesota, and Eastern Railroad Corp. has announced plans to try and secure financing fora “$1.2 billion, super-freight hauling line” connecting the coal fields of northeastern Wyoming with the Midwest(Wall Street Journal 1997).
Darmstadter RFF 97-40
-11-
In its simplest characterization, surface mining involves the extraction of coal that isexposed once the overburden of earth or rock has been removed. Typically, the coalbed lieswithin several hundred feet of the surface. If that description implies a mining operation thatis deceptively straightforward, the following passage should dispel any such notion.
Underground coal mines tend to differ mainly in terms of seam thickness withvirtually the same type of equipment and mining plan in each (the exceptionbeing the division between longwall and non-longwall mines). Surface mines,on the other hand, tend to differ by mining methods (single-pass contour, multi-pass contour, mountaintop removal, and area stripping, for example) as well asby mix of equipment (such as large draglines vs. small draglines, truck-shovel,front-end loaders, dozers, or combinations of this equipment in the sameoperation). Operating methods add more variety. For example, the dragline maywork on the highwall side or the spoil side; it may also, through the use ofextended benches, effectively work in between. Likewise, spoil may be castedusing explosives, a dragline bench may be dug entirely by the dragline, or asignificant part may be prestripped. (Mutmansky and others 1992, p. 2080)
The particular way in which a coal extraction technology is deployed depends on thetopography of the mine site -- specifically on whether the location lends itself to “areamining” or “contour mining.” Area mining is used in near-level terrain. Draglines are thedominant technology used to remove the coal and overburden in the area. Once the coal isremoved, the overburden is replaced and then the process is repeated until the entireextraction area can no longer be profitably mined. Contour mining is mostly used inmountainous and hilly terrain. The most common variation of contour mining is block-cutmining. In this technique a box or block cut is made as close as possible to the center of themining area. The coal is removed from this area, then the overburden from the second area isused to fill the hole from the first area, and so on. Again, draglines dominate the productionprocess.
Even while appreciating the need to discriminate among the various features broughtout in the preceding paragraphs, one can readily identify some of the broad characteristics andgeneral forces underlying surface mine productivity change and levels. Unlike undergroundmining, there has not been the dramatic change in type of technology used, i.e. movementfrom room-and-pillar mining to longwall mining. The technological process that has occurredto increase productivity has been the progressive improvement of existing equipmentaugmented by the introduction and gradual enhancement of some new technologies. Thus,the last several decades have seen the evolution of the extraction process from one relyingprimarily on truck-shovel technology to one employing draglines in conjunction with truck-shovels. At the same time, the capacity of the equipment has been growing, with draglines,for instance, progressing from mobile, diesel-powered units to more powerful “walking” typesconnected to the electricity grid. In recent years, various phases of surface mine production
Darmstadter RFF 97-40
-12-
have also been facilitated by computerization. For example, dragline operations can bepositioned and directed with computer-aided analyses of seam thickness and characteristics,global positioning systems have been applied to the truck fleet to improve its performance;while post-production costs can be contained by computerized systems in coal-processing andunit train-loading stages.
Improvements in the equipment used in surface mining have also contributed toimproved productivity at the coal face. Increased computing power has allowedmanufacturers to more efficiently design, test and build equipment. Not only havemanufacturers improved the overall level of equipment, but by building equipment to suitspecific geological characteristics of coal seams, recovery has also been enhanced. Theseimprovements in technology have allowed draglines to “fill faster, more easily and morecompletely.” (White 1995) One estimate of the increased productivity from improved surfaceequipment ranges from 10 to 25%. This estimate includes improvements to draglines, shoveltrucks and the interaction between the two (Pippenger 1995).
In short, the complementarity of computerization with advances in the scale and natureof the equipment represents a development of key significance. Information technology andinstrumentation -- coupled to vast increases in horsepower of equipment -- has facilitated thelogistical coordination of a variety of stages in the mining operation: cutting, conveying,loading, transport and a myriad of other activities that occur at a modern surface mine.
The economic benefits of these technical advances are, of course, enhanced whencoupled to favorable geologic features -- notably, a low “stripping ratio” of overburden tocoal, a characteristic particularly associated with Powder River Basin coal beds, referred toearlier. The stripping ratio refers to the amount of overburden that needs to be removed inorder to gain access to a given amount of coal. Often expressed in physical volume ofmaterial per ton of coal, it is sometimes expressed as well as a ratio comparing the thicknessof overburden with that of the coal seam. Intuition would point to the stripping ratio as oneimportant element governing total factor productivity and, thereby, production cost in surfacemining. A 1989 nationwide sample survey of 39 surface mines (as reported in the cited studyby Mutmansky and others) sheds empirical light on the importance of the stripping ratio: thelower its value, the lower average coal production cost.4 The converse -- the risk toprofitability of a high stripping ratio -- is lent at least anecdotal support by the experience ofAmerican Electric Power’s Muskingum (Ohio) mine, which -- now closed -- should, in thejudgment of one observer, never have been opened, given its high stripping ratio.5
In Section 1, we saw that surface mining labor productivity had advanced stronglythroughout the coal producing regions of the country. The rate of increase was greatest in theWest, but significant as well in Appalachia and the Interior region. Whether conditions arefavorable for continued nationwide productivity performance of similar or more modest
4 The statistically-significant R2 value is 0.36.
5 Comment made at the March 1997 workshop at which a prior version of this document was reviewed.
Darmstadter RFF 97-40
-13-
dimensions is problematic. (We revert briefly to this point in Section 11.) Experts haveraised questions, in particular, as to whether Eastern coalbeds can be brought into productionwithout the incurring of heavy upfront capital expenditures and the backend reclamationrequirements to the extent seemingly feasible in the West. The benefits of scale economiesmay also be starting to pinch. Experience with ever-larger dragline deployment inmountainous parts of Appalachia appear to have led to some dampening in enthusiasm forsignificant surface mine expansion. Retreat from the large dragline/surface mine optionwould have special appeal to firms whose alternatives include startup of a large capacitylongwall operation.
3. TECHNOLOGICAL CHANGE: UNDERGROUND MINING
Some Technological Basics
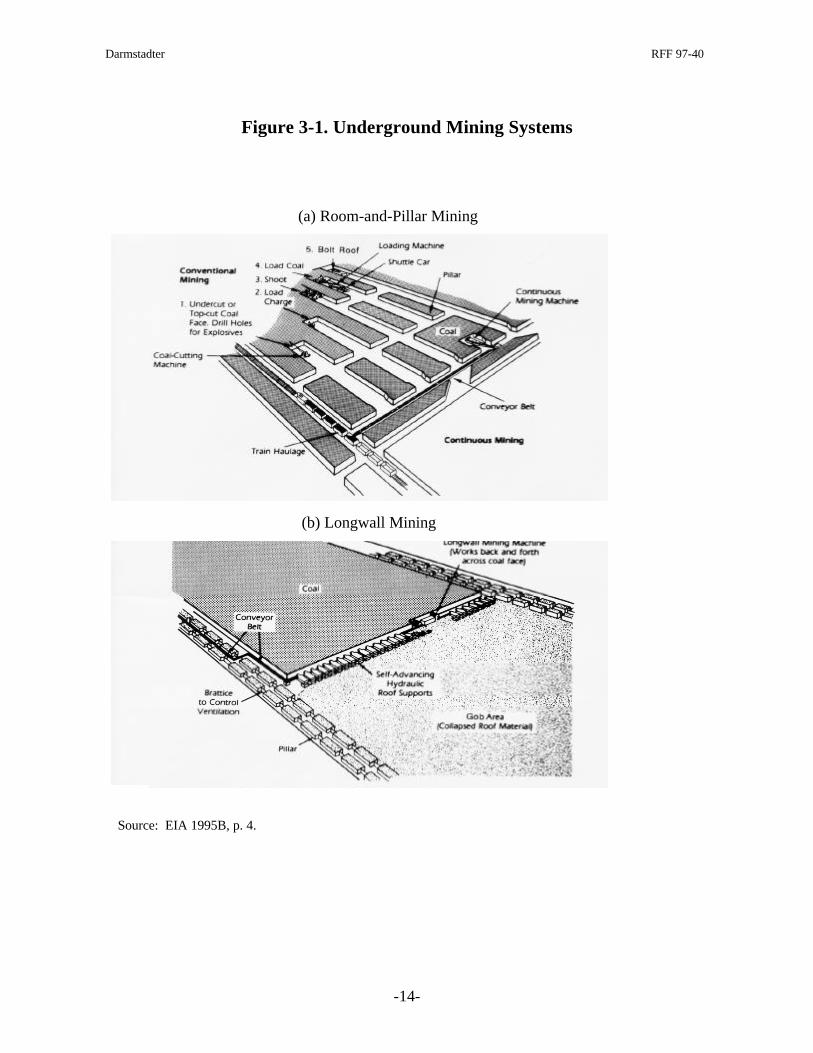
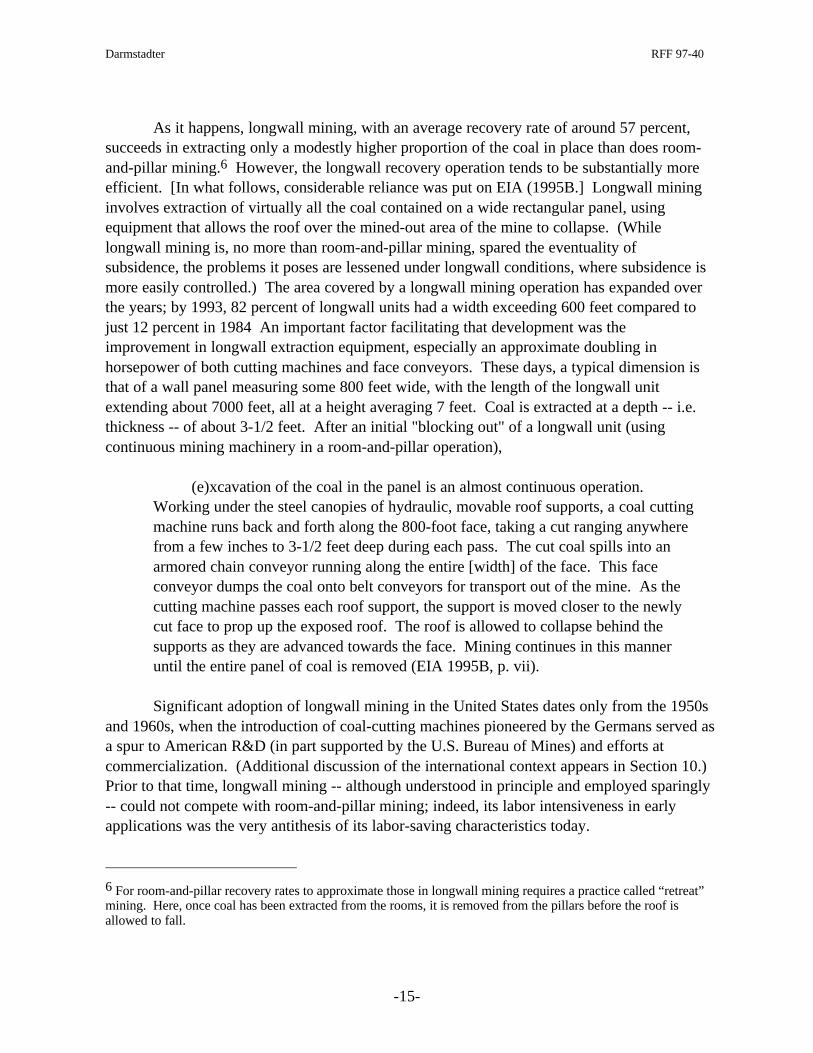
Although a variety of factors have contributed to the strong productivity recordachieved in underground mines within the last several decades, perhaps the most significantof these has been the emergence of longwall mining technologies. In 1995 longwall minesproduced 189 million short tons of coal, about 45 percent of underground coal production, incontrast to their 20 percent in 1983. (See Table 1-1.) To appreciate the significance of thisdevelopment, we need to keep in mind that the norm throughout most of the coal industry’shistory has been the “room-and-pillar” extraction method. Here, the mine roof is supportedprimarily by pillars of coal dividing the “rooms” which have been cut into the coalbed andwhere mining takes place. (Fig. 3-1 helps bring things to life.) To be sure, even room-and-pillar mining has seen notable technological progress; witness the steadily increasing use of“continuous” mining machines which -- dating from around 1950 -- extract and remove coalfrom the face in a single operation, in contrast to “conventional” methods employing a seriesof separate blasting, removal, and loading operations.
In fact, the arrival, nearly 50 years ago, of the continuous miner was in its way more ofa technological leap forward than the ensuing introduction of longwall extraction. The latter --whose significance we discuss momentarily -- represented a jumping-off from continuousmining machines, described by Schurr and Netschert (1960, p. 312) in their pioneering study as“a technological revolution comparable to the earlier introduction of ‘mechanization.’ ” It wasthe prospect of thinning coal seams which, according to Schurr and Netschert, provided furtherstimulus to finding ways ensuring greater coal recovery than seemed possible under room-and-pillar practices. Although alarm over thinning seams turned out to be premature -- thepotential of Western surface mining had barely begun to be tapped -- development of longwallmining technology was given an important spur forward.
Darmstadter RFF 97-40
-14-
Figure 3-1. Underground Mining Systems
Source: EIA 1995B, p. 4.
Longwall Mining(b) Longwall Mining
(a) Room-and-Pillar Mining
Darmstadter RFF 97-40
-15-
As it happens, longwall mining, with an average recovery rate of around 57 percent,succeeds in extracting only a modestly higher proportion of the coal in place than does room-and-pillar mining.6 However, the longwall recovery operation tends to be substantially moreefficient. [In what follows, considerable reliance was put on EIA (1995B.] Longwall mininginvolves extraction of virtually all the coal contained on a wide rectangular panel, usingequipment that allows the roof over the mined-out area of the mine to collapse. (Whilelongwall mining is, no more than room-and-pillar mining, spared the eventuality ofsubsidence, the problems it poses are lessened under longwall conditions, where subsidence ismore easily controlled.) The area covered by a longwall mining operation has expanded overthe years; by 1993, 82 percent of longwall units had a width exceeding 600 feet compared tojust 12 percent in 1984 An important factor facilitating that development was theimprovement in longwall extraction equipment, especially an approximate doubling inhorsepower of both cutting machines and face conveyors. These days, a typical dimension isthat of a wall panel measuring some 800 feet wide, with the length of the longwall unitextending about 7000 feet, all at a height averaging 7 feet. Coal is extracted at a depth -- i.e.thickness -- of about 3-1/2 feet. After an initial "blocking out" of a longwall unit (usingcontinuous mining machinery in a room-and-pillar operation),
(e)xcavation of the coal in the panel is an almost continuous operation.Working under the steel canopies of hydraulic, movable roof supports, a coal cuttingmachine runs back and forth along the 800-foot face, taking a cut ranging anywherefrom a few inches to 3-1/2 feet deep during each pass. The cut coal spills into anarmored chain conveyor running along the entire [width] of the face. This faceconveyor dumps the coal onto belt conveyors for transport out of the mine. As thecutting machine passes each roof support, the support is moved closer to the newlycut face to prop up the exposed roof. The roof is allowed to collapse behind thesupports as they are advanced towards the face. Mining continues in this manneruntil the entire panel of coal is removed (EIA 1995B, p. vii).
Significant adoption of longwall mining in the United States dates only from the 1950sand 1960s, when the introduction of coal-cutting machines pioneered by the Germans served asa spur to American R&D (in part supported by the U.S. Bureau of Mines) and efforts atcommercialization. (Additional discussion of the international context appears in Section 10.)Prior to that time, longwall mining -- although understood in principle and employed sparingly-- could not compete with room-and-pillar mining; indeed, its labor intensiveness in earlyapplications was the very antithesis of its labor-saving characteristics today.
6 For room-and-pillar recovery rates to approximate those in longwall mining requires a practice called “retreat”mining. Here, once coal has been extracted from the rooms, it is removed from the pillars before the roof isallowed to fall.
Darmstadter RFF 97-40
-16-
Table 3-1. Ratio of Longwall to Room-and-Pillar Labor ProductivityLevels, Selected States and Regions, 1983 and 1993
1983 1993
Alabama 1.06 1.33East Kentucky 0.85 1.35Pennsylvania 0.91 1.62Virginia 0.73 1.01West Virginia 1.14 0.97Illinois 1.25 1.12West Kentucky ___ 0.75Colorado 0.84 1.54
Appalachia 0.98 1.10Illinois Basin 1.19 1.00West 1.11 1.51
U.S. 0.98 1.19
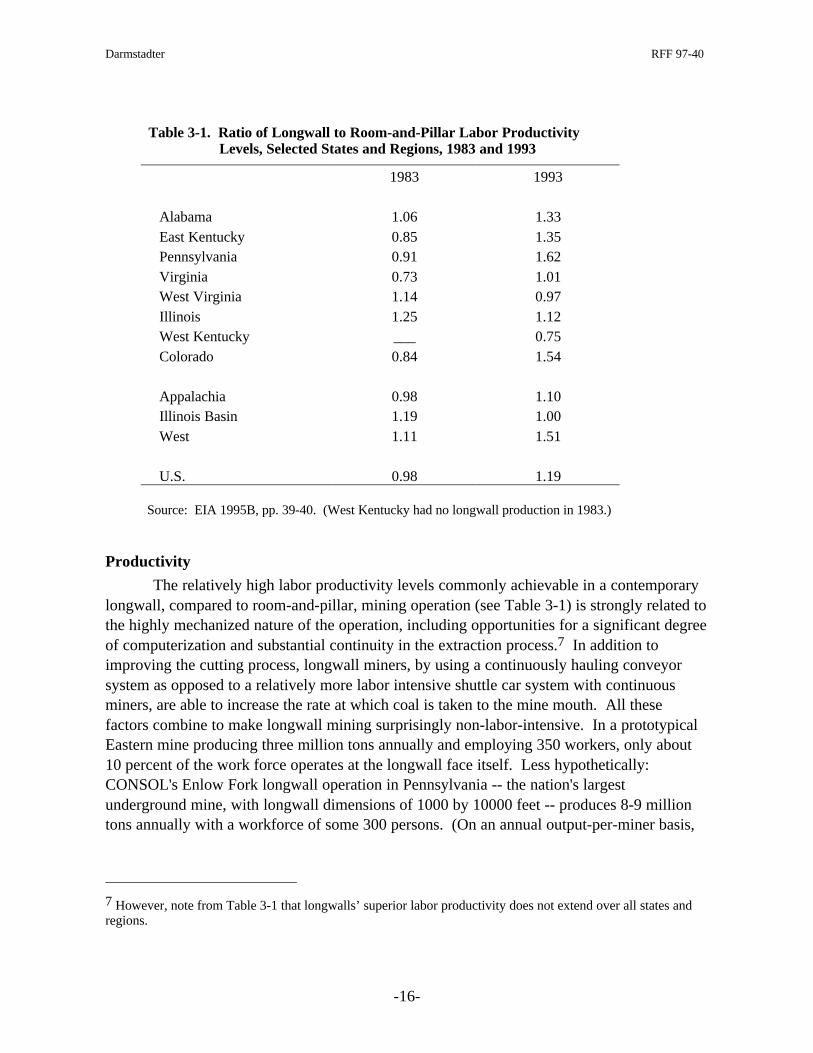
Source: EIA 1995B, pp. 39-40. (West Kentucky had no longwall production in 1983.)
Productivity
The relatively high labor productivity levels commonly achievable in a contemporarylongwall, compared to room-and-pillar, mining operation (see Table 3-1) is strongly related tothe highly mechanized nature of the operation, including opportunities for a significant degreeof computerization and substantial continuity in the extraction process.7 In addition toimproving the cutting process, longwall miners, by using a continuously hauling conveyorsystem as opposed to a relatively more labor intensive shuttle car system with continuousminers, are able to increase the rate at which coal is taken to the mine mouth. All thesefactors combine to make longwall mining surprisingly non-labor-intensive. In a prototypicalEastern mine producing three million tons annually and employing 350 workers, only about10 percent of the work force operates at the longwall face itself. Less hypothetically:CONSOL's Enlow Fork longwall operation in Pennsylvania -- the nation's largestunderground mine, with longwall dimensions of 1000 by 10000 feet -- produces 8-9 milliontons annually with a workforce of some 300 persons. (On an annual output-per-miner basis,
7 However, note from Table 3-1 that longwalls’ superior labor productivity does not extend over all states andregions.
Darmstadter RFF 97-40
-17-
this works out to over four times the national underground average; but Enlow Fork appearsto be a top performer in labor productivity.)
While the growing dimensions and horsepower of longwall mines went hand in handwith rising productivity, they were not the only factors at work. Improvements in mobile roofsupports (“shields”), which follow behind the longwall miners and allows the mined-out area(called “gob”) to collapse, have allowed the longwall miner to increase the speed at which itmoves through a coal face. Improved and computerized interaction between roof supportsand cutting machines have decreased the number of mis-cuts that occur. This is not the onlyplace where the progressive reliance on automated processes has had an effect onproductivity. Parallel advances have increased the efficiency with which coal is transportedfrom the coal face to the mine mouth.
The automated technology of the roof support system takes 10-12 shields through abatch process that is controlled by one device. As described by Thomas Barczak, this processallows for increased speed in the movement of the longwall drilling machine, and eliminationof the shield operator, in turn, increasing output and decreasing risk (Coal 1990, pp. 65-66).Additionally, improved automation of the roof support and longwall miner create an even andconsistent repetition of the longwall cycle. Some experts estimate that avoiding even a fewinches lost per longwall pass in a non-automated operation can result in savings of up to oneday a week (Sanda 1991).
To some extent, longwall mines are also able to take advantage of a somewhat greatermenu of possible mining locations relative to the room-and-pillar technique. Due to the moreimportant role of roof supports, room-and-pillar mines are only able to work at depths up to1,000 ft. At depths greater than this, the need to make the pillars larger generally causes themine to become less efficient. Longwall miners, not needing the pillar roof supports, are ableto work at mines of much greater depth, increasing effective utilization of the resource base,and hence increasing productivity through this exploitation of the intensive margin (EIA1995C). At the same time, though, a prospective longwall site must meet certain necessaryphysical requirements -- among them, a large enough area, a solid coal formation, andstructural features ensuring viable development of the roof.
In short, numerous factors distinguishing longwall, in contrast to room-and-pillaroperations, helped boost productivity. Aside from increasingly computerized processes, theenlargement of longwall panels increased the quantity of recoverable coal and reduced thedowntime associated with shifting equipment from mined-out to new panels. And as we havealready noted, the capacity of equipment increased significantly, the doubling of horsepowerduring 1984-93 effectively capitalizing on the concurrent increase in face widths and allowinglongwall extraction to tap into thicker seams in mines of increasingly large size. Between1984-93, the proportion of longwall mines producing over one million tons of coal went from47 to 70 percent. In 1993, only four percent of room-and-pillar mines exceeded the one-million mark.
These developments provided an important thrust to advances in longwall laborproductivity, which, between 1983-95, more than doubled -- from 1.59 to 3.85 short tons per
Darmstadter RFF 97-40
-18-
miner hour. Room-and-pillar productivity went up as well, but while (as seen in Table 3-1)the nationwide longwall productivity level was two percent below the room-and-pillar level atthe start of the period, it was 19 percent higher at the end.
As with other aggregates, this average U.S. longwall vs. room-and-pillar productivitypicture varies regionally, as witness the large gap for the West, contrasted with only a slightmargin of advantage for longwall in Appalachia. EIA conjectures, in this connection, that thedisproportionately large share of Appalachian coal destined for metallurgical and exportmarkets involves a sufficiently greater degree of preparation as to engender some sacrifice inproductivity and output.8
To be sure, longwall mining presents a number of problems along with its advantages.Size and capital intensity, already referred to, translate into large up-front investmentrequirements. Productivity during the start-up blocking-out phase -- a room-and-pillaroperation -- is typically low. Longwall mining generates substantial amounts of dust and gasthat need to be controlled.9 However, in general, they have better ventilation than room -and-pillar mines. They also have superior safety performance due to reduced personnel at thecutting face. Nevertheless, even in regions where longwall productivity isn't that muchsuperior to room-and-pillar operations, as in the Illinois basin and Appalachia, longwall minesare getting much of the new investment. Evidently, the potential for technologically-drivenincreases in future productivity growth is viewed as highly promising. The basis for suchoptimism is discussed in the concluding part of this section.
We commented earlier on the labor productivity performance in longwall mining. Aliterature search has failed to turn up a corresponding record based on total factor productivity(TFP). Given the enormity of the startup and deferred capital cost requirements, it would beuseful to have a sense of what the relatively capital-intensive nature of a longwall miningoperation signifies for that more comprehensive productivity measure. A very rough estimateof the ratio of annualized capital to labor costs in the prototypical Eastern longwall mine citedalready is about 4-to-3. (Calculated from data shown in EIA 1995B, pp. 43-46.) The leastthat one can say is that longwall mining has largely demonstrated its economic viability in thecontext of the low coal price regime that has prevailed in the past fifteen years or so. If onlyby crude inference, that speaks positively of TFP's role, no less than that of labor productivity,in sustaining the industry's competitive strength over that period.
From the Past to the Future
However striking the productivity-enhancing technological developments in longwallmining over the past several decades, improvements have been evolutionary and incremental,
8 Though, as Richard Gordon has pointed out to us, even if such a “measured” productivity sacrifice wereincurred, the fact that preparation yielded higher quality output would signify no necessary loss in “true”productivity.
9 An industry observer questions whether longwall mining poses unique problems in this regard.
Darmstadter RFF 97-40
-19-
and more quantitative than qualitative in character. Even computerization with its obviousimportance, has to a large extent had discrete rather than pervasive impact, as in the casewhere high-capacity shields (i.e. movable roof supports) governed by electrohydraulic controlsystems have replaced manual operations. Describing the current state of play andpossibilities for the future, the EIA analysts write:
Longwall equipment has gained significantly in power, robustness, and reliability,as measured by such quantitative parameters as horsepower and downtime; butdespite these changes, longwall mining has retained its basic nature and operatingcharacteristics. One new development looming on the horizon, however, has thepotential to change the fundamental nature of longwall mining as it is practicedtoday: automation (EIA 1995B, p. 47).
Indeed, EIA’s ensuing exposition illustrates various instances in which the use ofrobotics and substantially greater automated operations at the longwall face than at presenthave already begun to appear. As reported by EIA, the seemingly cornucopian benefits ofincreased automation claimed, for example, by a CONSOL expert for one of the company’smines
...include increased longwall availability, improved productivity, lower supplycosts, improved clean coal yields, reduced exposure of workers to respirable dust,better utilization of available workers, improved management control andcommunication, increased coal recovery, improved roof control, reducedmaintenance and ownership costs, improved trouble-shooting, and early warningof some equipment failures (EIA 1995B, p. 50).
While technological optimism can be contagious, it can also be hazardous -- if not toone’s health, then to one’s forecasting reputation. Nevertheless, the penetration of a muchmore pervasive degree of automation appears to offer the basis for significant futureproductivity improvement in longwall mining.
Of course, a number of complementary conditions and factors must come into play forlongwall mining to meet such potential. Industry representatives canvassed by EIA elicitedcertain concerns and pointed to some uncertainties. For example, there may be “...economiclimits to the continued expansion of the longwall panel. At some point, the additional capitalcosts of widening the face will exceed the benefits resulting from improved productivity.”(p. 57) While firms with large and rich-seamed holdings expect to meet perceived capacityexpansion needs via longwalls, producers with small or thin-seamed holdings are likely to optfor room-and-pillar development. In that case, the need for continuous miners with improvedcutting rates becomes important. (The lack of such improvement can also hinder the degreeof longwall expansion since, as noted earlier, continuous mining equipment is used in thedevelopment phase of a longwall project.)
Darmstadter RFF 97-40
-20-
There is, finally, the unpredictability of regulatory policy changes which could affectthe economics, and therefore productivity, of both longwall and room-and-pillar mining. Dustcontrol, methane recovery, groundwater integrity, and subsidence protection all pose greateror lesser uncertainty on the policy side. As just one example, subsidence is technicallyinherent in longwall mining (one implication of which is the risk of costly settlements withowners of surface property) but need not be inherent in room-and-pillar mining providedpillars are left standing rather than mined prior to collapsing. One can see where this could beat least one consideration in determining the economic balance of advantage between one orthe other mining strategy.
4. HEALTH, SAFETY, ENVIRONMENT
Each of the three items bracketed together for the purpose of this discussion hasdistinct features and could be individually addressed. For example, one associates the healthissue prominently with black lung disease or hearing loss, safety with roof cave-ins,subsidence or methane explosions, and environment with acid mine drainage or unreclaimedspoils from open-pit mining. What allows this across-the-board treatment are twoconsiderations -- the first, conceptual; the second, policy related. From a conceptual point ofview, the questions arises as to whether, and to what extent, some of the health-safety-environmental impacts of coal mining fit the notion of “externalities” -- at least for yearspreceding statutory requirements for dealing with such problems (see below). That is, werethe costs of dealing with, or averting, these impacts borne by society at large or the affectedindividuals rather than being financially accounted for -- “internalized” -- in the operations ofthe mining firm? If the former, output and productivity of the firm and of the industry might,to some hard-to-quantify degree, be overstated because certain costly damages from coalmining failed to be reflected as an offset to the value of production. On the other hand, it isalso likely that, if not environmental effects, then health and safety risks were known toworkers who were able to command at least some wage “premium” as compensation for suchrisks. (Unlike the “company-town” milieu of the nineteenth century, labor was not whollydevoid of bargaining power.) Also, assuming that firms were not indifferent to having ahighly skilled employee lost, they would have invested in some amount of health and safetyprotection, motivated in part by fear of litigation whose increased costs probably promptedfirms to increase health and safety expenditures to avoid law suits. Insofar as both of theseconditions were met -- and one can surmise that being the case to at least some extent --internalization was correspondingly achieved and economic performance measures notentirely distorted.
On the policy side, landmark legislation introduced in 1969 and 1977 -- and thebackdrop to these statutes clearly included the public concerns and perceptions stemmingfrom the impacts just noted -- imposed major requirements across a broad range of coal mineoperations impinging on health, safety, and the environment. The main federal initiativeswere the Coal Mine Health and Safety Act (CMHSA) of 1969 and the Surface Mining Controland Reclamation Act (SMCRA) of 1977. (Additionally, and somewhat less directly, the
Darmstadter RFF 97-40
-21-
Federal Water Pollution Control Act of 1972, subsequently incorporated into the Clean WaterAct of 1977, dealt with the impact of coal mining and preparation on water quality; whileprovisions in the Federal Clean Air Act of 1970 helped spur the shift to low-sulfur Westerncoals.) Among its numerous provisions, the CMHSA addressed such hazards to life and limbas explosive gas mixtures, the integrity of roof support systems, and respirable dustconcentrations. Additional legislation, the Federal Mine Safety and Health Act, was passed in1977. It provided for increased federal mine inspections and created the Mine Safety andHealth Administration (MSHA) in the U.S. Department of Labor. Since this time, MSHA hastaken over monitoring responsibilities of coal mine health and safety regulations. The twomajor items covered in the new legislation were coalface illumination standards and“walkaround” provisions, which obliges a worker to accompany a federal mine inspector.The accompanying box (Box 4-1) provides a brief description of some of the major events inthe legislative history of coal mining.
Box 4-1.
1910 Establishment of the Bureau of Mines (BOM).
1941 Congress empowered BOM inspectors to enter mines.
1947 Congress authorized the formulation of the first code of federal regulations for mine safety.
1952 The Federal Coal Mine Safety Act provides for annual inspections in a limited number ofunderground coal mines, and gave the BOM limited enforcement authority.
1966 Congress extended coverage of the 1952 Coal Act to all underground coal mines.
1969 The Federal Coal Mine Health and Safety Act requires two annual inspections of every surface coalmine and four at every underground coal mine. The act also required monetary penalties for allviolations, and established criminal penalties for knowing and willful violations. The safetystandards for all coal mines were strengthened, and health standards were adopted.
1973 The Secretary of the Interior creates the Mining Enforcement and Safety Administration (MESA)as a new departmental agency separate from the BOM.
1977 Congress passes the Federal Mine Safety and Health Act and the Surface Mining and ControlReclamation Act (SMCRA). The Federal Mine Safety and Health Act consolidated all federalhealth and safety regulations of the mining industry, coal as well as non-coal mining, under a singlestatutory scheme. The act also created the Mine Safety and Health Administration (MSHA). Someof new regulations from SMCRA increased surface mining performance standards and regulations,provided for the assessment and collection of reclamation fees, and required restoration of miningacreage on federal lands.
Darmstadter RFF 97-40
-22-
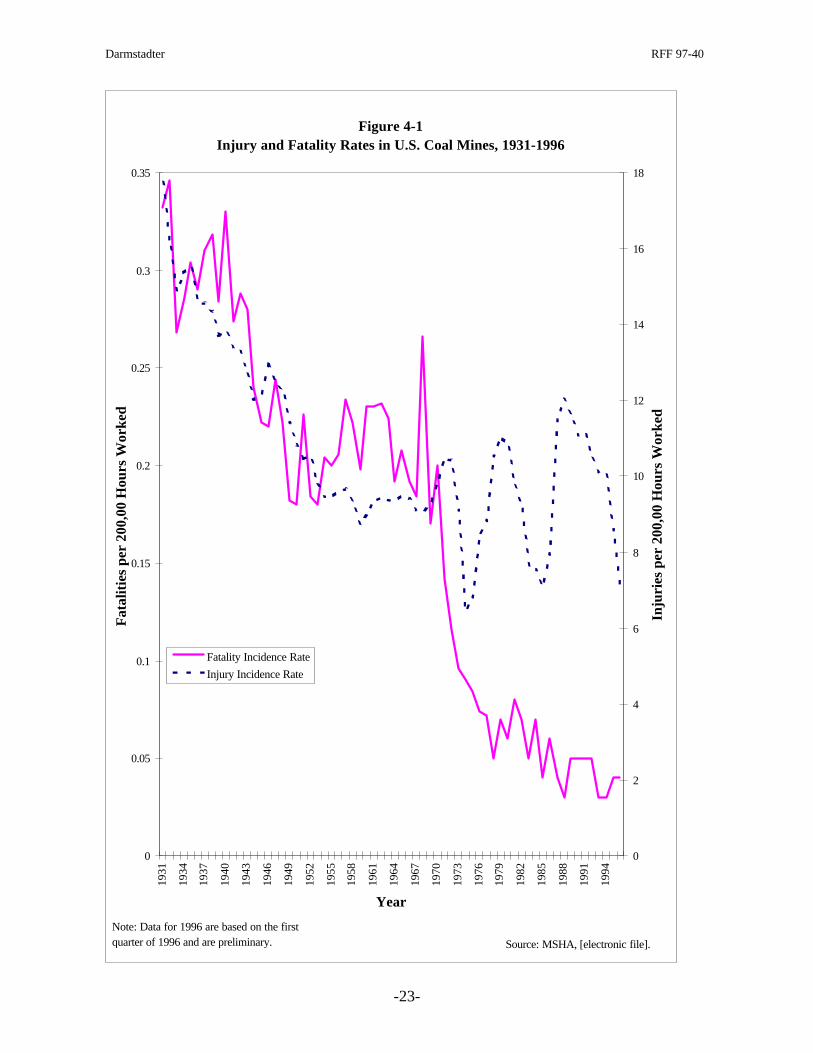
Figure 4-1 plots 60-year trends in coal mine fatality and injury rates.10 There has beena long-term decline -- though by no means an unbroken one -- in the fatality incidence rate,measured in fatalities per 200,000 work hours, for all coal mining since 1931. Following theadoption of the CMHSA in 1969, the rate of decline accelerated and continued throughout the1970’s. For example, the coal mining fatality rate declined from around 0.17 fatalities per200,000 hours worked in 1969 to less than 0.04 fatalities per 200,000 hours worked in 1995 --a drop of over 75 percent. What is not clear is how much of the drop was a continuation ofthe already declining rate or how much was due to the adoption of the Act. While the injuryincidence rate, defined as the number of injuries per 200,000 hours worked, has also declinedsubstantially since 1931, we do not see the same decline as the fatality rate. This is notsurprising. While a fatality is a fatality, it could be the case that before adoption of theCMHSA, there was chronic underreporting of the number of injuries. One could argue thatone element in the fatality- and injury-rate declines in recent decades was the shift to Westernsurface mines with their inherently safer worker conditions. However, it turns out that thetrend plotted in Fig. 4-1 applies fairly consistently across the geographic landscape.
In the case of both fatalities and injuries, the long-term decline has been accompaniedby substantial year-to-year variability. Very likely, fatality and injury variability isconditioned by the infrequent-event nature of the phenomenon, such as the 1968 FarmingtonWV disaster, which killed 78 miners. Even with this acknowledgment, it would be good tohave a persuasive explanation for the rather conspicuous cyclical ups and downs for the injuryplot since roughly the mid-seventies. But no ready answer suggests itself.
In one respect, the actual data most likely underestimate the actual effect of theCMSHA and its amendments. The legislation is not only designed to decrease immediateinjuries and fatalities, but to also decrease them in the long run. Some of the regulationsinclude limitations to noise and dust exposure and are designed to decrease the incidence ofblack lung disease and silicosis. While the cost of improving these health benefits are bornein short order by the firm, the health benefits from them are not felt for many years, and arenot reflected in the MSHA data. Even if they were, the presumption that the benefits of theCMHSA exceed its cost does not command unanimity. One expert whose research leads himto a strong contrary viewpoint is Richard Gordon of Pennsylvania State University. Hisdissenting judgment was expressed at a workshop discussion of the present report.
The SMCRA, administered by the Office of Surface Mining (OSM) in the U.S.Department of the Interior, significantly strengthened surface mining performance standardsand regulations previously governed by rules established in various coal-producing states.The legislation provided for the assessment and collection of reclamation fees, cooperative
10 Injuries are those resulting in days lost as well as disruptions in work schedules without days being lost.
Darmstadter RFF 97-40
-23-
Figure 4-1Injury and Fatality Rates in U.S. Coal Mines, 1931-1996
0
0.05
0.1
0.15
0.2
0.25
0.3
0.3519
31
1934
1937
1940
1943
1946
1949
1952
1955
1958
1961
1964
1967
1970
1973
1976
1979
1982
1985
1988
1991
1994
Year
Fat
alit
ies
per
200,
00 H
ours
Wor
ked
0
2
4
6
8
10
12
14
16
18
Inju
ries
per
200
,00
Hou
rs W
orke
dFatality Incidence Rate
Injury Incidence Rate
Source: MSHA, [electronic file].
Note: Data for 1996 are based on the first quarter of 1996 and are preliminary.
Darmstadter RFF 97-40
-24-
agreements with Indian tribes on their coal-producing property, restoration of mining acreageon federal lands, designation of lands unsuitable for coal mining (e.g. because of proximity tonational parks), and numerous other provisions, some of them highly complex. (The act alsocontained certain provisions applicable to underground mining, such as requirements to guardagainst subsidence -- a potential threat to surface structures and facilities.) Many provisionsof the law turned out to necessitate years of adjudication and resolution. In part, this arosefrom the fact that the heart of the SMCRA involves federally approved state implementationrules. From time to time, in response to federal oversight, states have been required toupgrade their enforcement activity.
Notwithstanding the seemingly comprehensive nature of the SMCRA, one shouldhave no illusion about the degree to which open-pit mines can be restored to pre-existingsurface conditions, even where, as in the Powder River Basin of northeast Wyoming,conscientious efforts are undertaken to revegetate the disturbed land cover. To the extent thatthis is true, some external spillover effects will continue to prevail in surface mining.However, it should be noted that the ease of reclamation varies greatly by region, being farmore successful in Eastern states with adequate rainfall than in the High Plains.
What might one expect to have been the productivity consequences of these newregulatory departures -- ignoring, that is, the likelihood that, at least to a limited degree,practices engendered by the new policies simply served as a counterweight to some“unrecorded” mining externalities of the past? That is, due to the possible overstatement ofpre-existing productivity performance, perhaps not all of the decline in measured productivityshould be attributed to the effect of the new regulations. For starters, it is worth appreciatingthat even costly steps to limit health, safety, and environmental damage can enhance aworker’s performance. A miner confident of working under conditions that are not a threat toeither health or safety may well be a more productive miner. That said, it isn’t hard to seehow compliance with the new policies would, at given levels of output, mean at least a one-time net increase in the level of costs and therefore a penalty in efficiency. For, even ifcompliance did not require additional workers to meet the new standards or require currentworkers to work in a less “productive” way -- thus exacting no penalty in labor productivity --the need for more non-labor inputs (equipment, materials, energy) would show up as adownward effect on total factor productivity.
What, then, is the empirical evidence on the productivity effects of the new regulatoryclimate dating from the 1960s and 1970s? What follows are findings from a sampling of studies.
(a) One of the early efforts to probe the issue was a 1981 report of the U.S. GeneralAccounting Office (GAO 1981). Acknowledging the difficulty of disentangling the effects ofpoor labor-management relations (see Section 5) from those due to the new health-safety-environmental statutes, the GAO found that regulations pursuant to the CMHSA -- e.g.compliance with roof control, ventilation and dust control, and various kinds of environmentalmonitoring -- were “a major cause of productivity decline” in underground mines between1970 and 1973. But, notwithstanding this one-time permanent productivity loss, by the latter1970s, the regulations were “no longer significant causes of productivity decline” (p. 73).
Darmstadter RFF 97-40
-25-
Nor would one think that they would be causes of further relative changes in productivity.GAO also found that even prior to the enactment of federal surface mine legislation in 1977,enough states had begun tightening their reclamation laws after 1968 to bring about a netdecline in labor productivity -- particularly in Eastern coal producing states -- “net” because,in its statistical analysis, the GAO allowed for the fact that surface mine investments, such asin bulldozers and carryall scrapers, were used both to boost the output of production workersas well as to deploy “nonproductive” workers in reclaiming the land.
(b) Another early analysis was prepared by Joe G. Baker and his associates at OakRidge Associated Universities for the U.S. Departments of Energy and Labor (DOE 1979).Consistent with GAO’s findings, this study concludes that the CMHSA is the dominant factorexplaining deep mine labor productivity decline from 1970 to 1973, “with its strongestinfluence occurring in 1973 when the mine inspection work force began to level off and mineinspections reached an all time high of more than 70,000. Evidence suggests that after 1973deep mine labor productivity decline was less related to the CMHSA” (p. iii). (Negative post-1973 productivity effects appear to have been the result of high market prices bringing lowerproductivity firms and mines into operation.)
(c) For his treatment of coal mining, Edward F. Denison (1985, pp. 66-68) consulted avariety of published sources as well as the judgments of industry and academic experts. Heconfined his analysis of coal mine productivity to the impact of the 1969 CMHSA. Heconcluded that while the act’s productivity growth impacts were pretty well over by 1976,those impacts were substantial for the period 1968-1977. For that time span, as against BLS’estimate of actual labor productivity in coal mining falling at 3-1/2 percent yearly, Denisonfinds that, absent CMHSA, it would have risen around 3.1 percent per year. Underlying thatcalculation was his estimate that, by 1977, compliance with the act necessitated an increase inthe coal mine work force of from 132 thousand to 240 thousand.
(d) Firms obliged to meet new regulatory provisions found themselves having tospend more money for labor and other inputs. If unable to recoup higher unit costs throughhigher sales prices, there would be a squeeze on profits. As it happened, some companies hadlong-term sales contracts allowing re-negotiation in the event of unanticipated changes intheir legal environment. The re-negotiation entailed the need to demonstrate the cost impactof such policy changes. In one such case -- though as part of a broader review --Consolidation Coal Co. (now CONSOL, Inc.) developed its position through a wide-ranginginternal analysis of the cost-benefit implications of the 1969 CMHSA (and certainamendments) (CONSOL, Inc. 1980). Not surprisingly, the report finds significant companyproductivity losses attributable to provisions of the CMHSA -- whether due to resourcesneeded for direct compliance with the act and/or personnel to offset production losses causedby the act. CONSOL calculates productivity losses in terms both of labor input (coalproduction per man-day) and a closely related rate corresponding more to a capitalproductivity measure -- tons per machine shift, usually an 8-hour period. Employing the latterproductivity measure, CONSOL acknowledges that compared to a 1969 pre-CMHSAproductivity level for reference, not all of the decline to the actual 1977 productivity level can
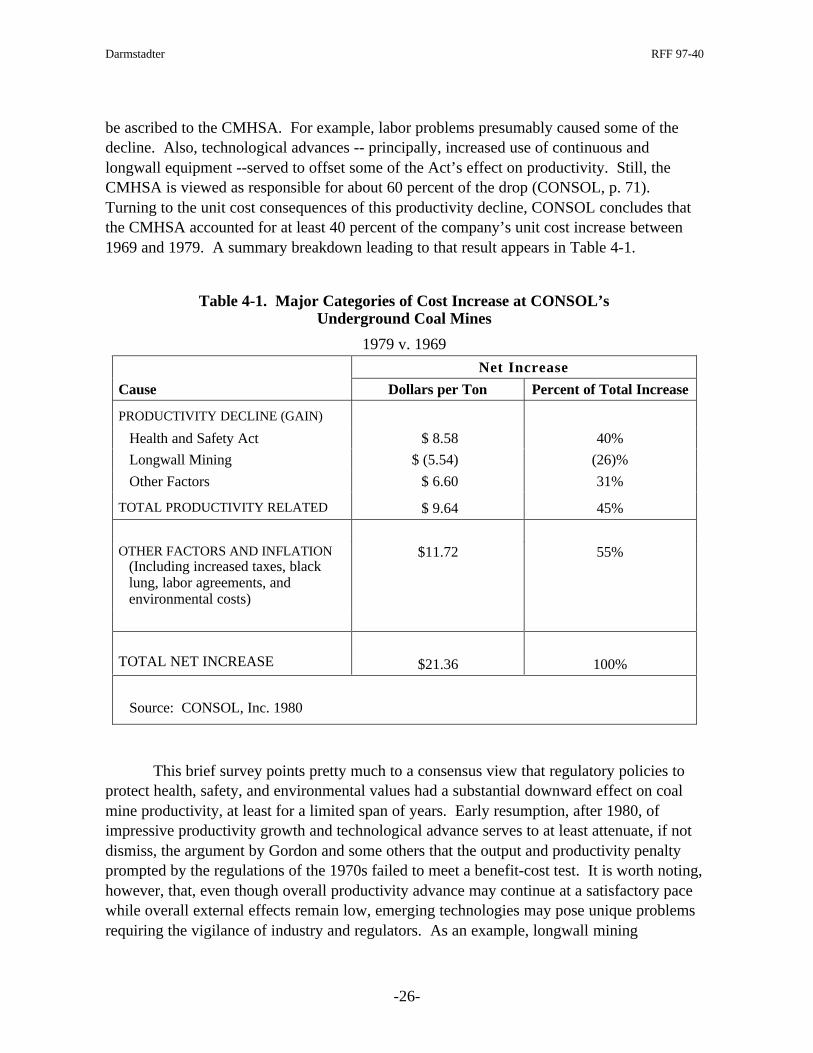
Darmstadter RFF 97-40
-26-
be ascribed to the CMHSA. For example, labor problems presumably caused some of thedecline. Also, technological advances -- principally, increased use of continuous andlongwall equipment --served to offset some of the Act’s effect on productivity. Still, theCMHSA is viewed as responsible for about 60 percent of the drop (CONSOL, p. 71).Turning to the unit cost consequences of this productivity decline, CONSOL concludes thatthe CMHSA accounted for at least 40 percent of the company’s unit cost increase between1969 and 1979. A summary breakdown leading to that result appears in Table 4-1.
Table 4-1. Major Categories of Cost Increase at CONSOL’sUnderground Coal Mines
1979 v. 1969
Net Increase
Cause Dollars per Ton Percent of Total Increase
PRODUCTIVITY DECLINE (GAIN)
Health and Safety Act $ 8.58 40%
Longwall Mining $ (5.54) (26)%
Other Factors $ 6.60 31%
TOTAL PRODUCTIVITY RELATED $ 9.64 45%
OTHER FACTORS AND INFLATION(Including increased taxes, blacklung, labor agreements, andenvironmental costs)
$11.72 55%
TOTAL NET INCREASE $21.36 100%
Source: CONSOL, Inc. 1980
This brief survey points pretty much to a consensus view that regulatory policies toprotect health, safety, and environmental values had a substantial downward effect on coalmine productivity, at least for a limited span of years. Early resumption, after 1980, ofimpressive productivity growth and technological advance serves to at least attenuate, if notdismiss, the argument by Gordon and some others that the output and productivity penaltyprompted by the regulations of the 1970s failed to meet a benefit-cost test. It is worth noting,however, that, even though overall productivity advance may continue at a satisfactory pacewhile overall external effects remain low, emerging technologies may pose unique problemsrequiring the vigilance of industry and regulators. As an example, longwall mining
Darmstadter RFF 97-40
-27-
technology has dramatically reduced the number of miners required at the mine face andcontributed to accelerated productivity growth. Yet, since those workers remaining at thelongwall face appear to be subjected to higher noise levels and dust concentrations -- with themine as a whole confronting elevated methane concentrations at the faster extraction ratesemployed -- for innovative technology not to be a mixed blessing, managing the externalitiesdilemma remains an ongoing challenge. (See Organiscak and others 1996.)
5. LABOR ISSUES
Introduction
Although labor problems have been a recurrent feature of coal mining’s history in theUnited States, their impact has generally been limited to short-term dips in output rather thanbasic disruptions having serious spillover effects on the wider economy. The decade of the1970s was a case where labor unrest in the industry came close to producing such unsettlingconsequences. The strike of 1971 translated into a production drop of 52 million short tons(or 8-1/2 percent) over 1970. Later in the decade, a strike beginning in December 1977, butextending well into 1978 caused an annual decline of nearly 30 million tons -- this at a timewhen the oil-market upheavals beginning in 1973-74 had substantially increased bothdomestic and foreign demand for American coal. While the labor productivity declinesoccurring during the 1970s had multiple causes -- as discussed in other sections -- labor unrestwas clearly a significant contributor, and probably not just for the two specific years in whichthe greatest labor strife took place. Recall (from Table 1-1) that coal mine labor productivitydropped at an average annual rate of almost two percent during the decade. In undergroundmining, where the labor unrest was principally centered, the productivity decline averaged outto 3-1/2 percent yearly.
A Brief Look at the Coal Mine Labor Scene
In probing the impact of labor market unrest on productivity, one is justified inconcentrating on the underground sector of the coal mine industry. For a variety of reasons,surface mining has not been seriously touched by the problem; indeed, that very fact --contributing to the competitiveness of Western coal -- might have exacerbated labor problemsin Eastern underground mining by increased pressure to remain competitive. Although theeffect of unionization on productivity has been a subject of some debate (see below), the factthat surface mines are largely non-unionized -- hence, less prone to work stoppages -- seemsto have forestalled the productivity penalty engendered by frequent strikes. Other factorsinclude the fact that, relatively speaking, surface mining is strongly capital-intensive; relies onskills similar to those in the construction and excavation industries with their comparativelylarge pool of experienced workers; and, in offering relatively safe working conditions andhigh wages, makes for more stable worker-management relations. So, talking about theproductivity consequences of fractious labor relations -- especially during the 1960s and1970s -- essentially means talking about the underground mines east of the Mississippi at
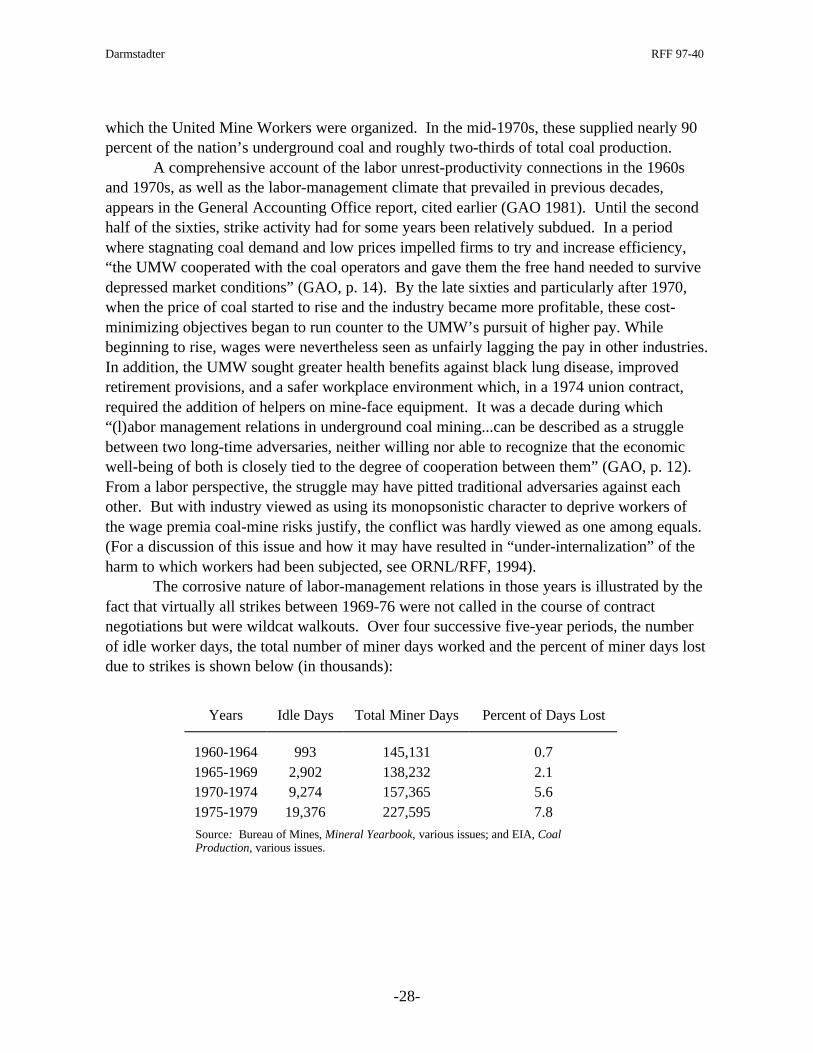
Darmstadter RFF 97-40
-28-
which the United Mine Workers were organized. In the mid-1970s, these supplied nearly 90percent of the nation’s underground coal and roughly two-thirds of total coal production.
A comprehensive account of the labor unrest-productivity connections in the 1960sand 1970s, as well as the labor-management climate that prevailed in previous decades,appears in the General Accounting Office report, cited earlier (GAO 1981). Until the secondhalf of the sixties, strike activity had for some years been relatively subdued. In a periodwhere stagnating coal demand and low prices impelled firms to try and increase efficiency,“the UMW cooperated with the coal operators and gave them the free hand needed to survivedepressed market conditions” (GAO, p. 14). By the late sixties and particularly after 1970,when the price of coal started to rise and the industry became more profitable, these cost-minimizing objectives began to run counter to the UMW’s pursuit of higher pay. Whilebeginning to rise, wages were nevertheless seen as unfairly lagging the pay in other industries.In addition, the UMW sought greater health benefits against black lung disease, improvedretirement provisions, and a safer workplace environment which, in a 1974 union contract,required the addition of helpers on mine-face equipment. It was a decade during which“(l)abor management relations in underground coal mining...can be described as a strugglebetween two long-time adversaries, neither willing nor able to recognize that the economicwell-being of both is closely tied to the degree of cooperation between them” (GAO, p. 12).From a labor perspective, the struggle may have pitted traditional adversaries against eachother. But with industry viewed as using its monopsonistic character to deprive workers ofthe wage premia coal-mine risks justify, the conflict was hardly viewed as one among equals.(For a discussion of this issue and how it may have resulted in “under-internalization” of theharm to which workers had been subjected, see ORNL/RFF, 1994).
The corrosive nature of labor-management relations in those years is illustrated by thefact that virtually all strikes between 1969-76 were not called in the course of contractnegotiations but were wildcat walkouts. Over four successive five-year periods, the numberof idle worker days, the total number of miner days worked and the percent of miner days lostdue to strikes is shown below (in thousands):
Years Idle Days Total Miner Days Percent of Days Lost
1960-1964 993 145,131 0.71965-1969 2,902 138,232 2.11970-1974 9,274 157,365 5.61975-1979 19,376 227,595 7.8
Source: Bureau of Mines, Mineral Yearbook, various issues; and EIA, CoalProduction, various issues.
Darmstadter RFF 97-40
-29-
Given the increase in the number of days worked after 1965, one would expect to seean increase in the absolute number of idle days due to strikes. However, the significantincreases in the percent of days lost over the next decade and a half makes it likely that labor-management disputes contributed to productivity stagnation during the 1970s. One must keepin mind that the 1975-79 period included the 109-day strike beginning in December 1977.Strikes did not cease with the end of the seventies, but they greatly abated. In October 1984,for the first time in 20 years, a threatened nationwide strike failed to materialize as the UMWand Bituminous Coal Operators of America agreed on terms for a long-term contract. A new,5-year contract, signed in 1988, averted a walkout as well.
Productivity Aspects
How do these upheavals bear on labor productivity? On the one hand, even withoutwork stoppages, the level of tension, discontent, and sullenness brought about by unendinggrievances with management probably can’t help but condition workplace motivation andefficiency prior to and after a strike, especially one deemed by workers to have been settledon terms inimical to their interest. Technically speaking, however, the effect of strikes per seneed not cause a loss in labor productivity. If a closed mine causes a proportionate decline inboth production and worker-hours, labor productivity will not be affected, though deploymentof overhead personnel and standby maintenance facilities and underutilization of capital thatcontinues to have to be amortized probably does translate into some productivity penalty,arguably to a greater degree in total factor than in labor productivity. (See Fig. 6-1 and theaccompanying text.)
There is some, but not copious, statistical evidence bearing on the labor productivityconsequences of labor unrest. GAO sees the labor productivity decline of the 1970s closelytied to the poor labor-management relations of the period and particularly singles out the year1974 when the union contract provision augmenting mine-face equipment operators withhelpers is said to explain some 40 percent of the 13 percent labor productivity declinebetween 1974 and 1975. That is, of course, only one year’s record. And the degree offeatherbedding implied by the statistics might well be contested by some with a greater“hands on” feel for conditions at the mine face. But in its study, surveying that period, OakRidge Associated Universities (ORAU) ascribes 25 percent of the labor productivity lostbetween 1970 and 1975 to deteriorated labor-management relations11 (DOE 1979, as cited byGAO 1981, p. 24).
Unfortunately, efforts to coax out more specific causes of this decline are ambiguous orinconclusive. Analysts have, for example, looked at the role of turnover, absenteeism, agedistribution and experience, and job bidding (i.e. seniority preference) as possible explanations.(A cross-cutting question concerns union-vs. nonunion productivity performance, discussed 11 This result was obtained through ORAU’s regression analysis utilizing state-by-state variations in shifts lostto wildcat strikes “as a measure of labor discontent” with, in turn, a “strong damaging effect on productivity....”(GAO, p. 24).
Darmstadter RFF 97-40
-30-
briefly under a separate sub-head below.) The trouble is that these and other factors operate ina complex web of multi-directional effects that defy easy unraveling. Thus, absenteeism, towhich GAO judgmentally ascribes some downward effect on productivity, might, when itoccurs rampantly and without notice, be expected to disrupt work scheduling, thereby loweringproductivity. But one can also imagine that there is a limit to a worker’s effectiveness andmorale in prolonged cramped, wet, and cold conditions, with shift assignments that encroachvisibly on family life. Age distribution, which has also been found to have minimalconsequences for productivity, illustrates these underlying cross-currents as well. Youngworkers’ lack of experience -- and this cohort entered mines in large numbers as coal demandsurged in the 1970s -- might have been expected to set back productivity; greater educationmight have served to compensate, but reliable time series data on trends in miners’ educationdo not appear to be readily available. (To compound the intricacy: might the fact that youngerworkers are more vocal, self-confident, independent-minded, safety-conscious, and more proneto strike suggest an indirect pathway toward reduced productivity? It is a hypothesis thatdoesn’t seem to have been explored.)
The Union-vs.-Nonunion Issue
The question of whether, in general, union membership means higher or lowerproductivity in underground coal mining presents a complicated sorting-out challenge. Whilesome union demands, like the "helper" provision discussed above, may have loweredmeasured productivity, various other safeguards may have provided conditions for enhancedefficiency -- an ironic outcome, if workplace standards had a meaningful effect on enhancingprofitability. And the fact that numerous presumed effects on productivity -- e.g. governmenthealth, safety, and environmental statutes -- coincided with the period during which laborunrest and union demands were at their height compounds the analytical task.
Predictably, the productivity implications of union membership has been of greatinterest to academics, government analysts, the industry, and of course, labor groups. To theauthors of the ORAU study, an analysis of the 1970s produced no evidence of a productivityeffect of unionization. The authors acknowledge their awareness of the widespread argumentthat unionized mines were less productive than other mines because of (1) union insistence onstrict enforcement of CMHSA provisions, and (2) the fact of union-management relationshipshaving changed from a cooperative one in the 1950s and 1960s to a confrontational one in the1970s. But despite "empirical problems in comparing union to nonunion mines....[t]here wasno statistically significant difference in tons per mine-shift, output, days active, oremployment for the period 1973-1976. This result contradicts a survey of mine managers'attitudes in 1977 in which the 44 managers surveyed said they believed productivity wasgreater in nonunion mines" [The ORAU study (DOE 1979) as cited by GAO (1981, p. 13)].
Looking back on that period, company officials interviewed for the present study re-affirmed this earlier mine managers’ judgment. A point made several times is that nonunionwillingness to accept lengthier shifts, quite apart from signifying more output per shift (for thearithmetic reason that more hours are being worked) also means greater output per worker-
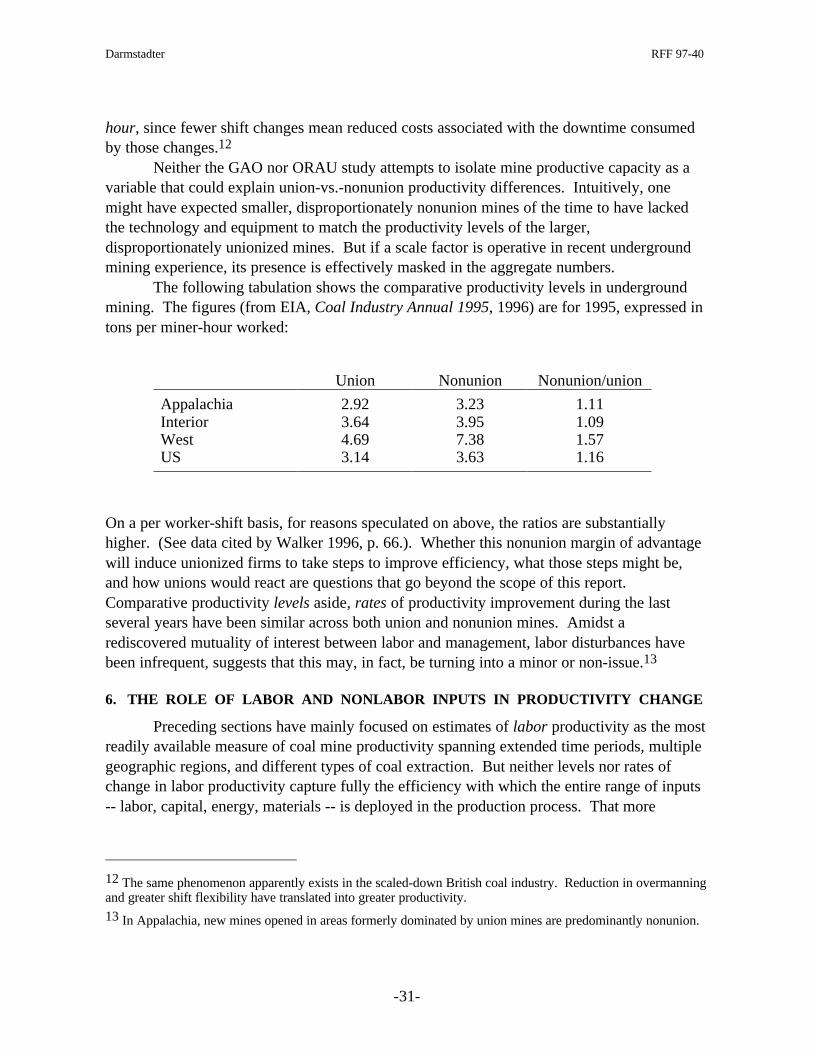
Darmstadter RFF 97-40
-31-
hour, since fewer shift changes mean reduced costs associated with the downtime consumedby those changes.12
Neither the GAO nor ORAU study attempts to isolate mine productive capacity as avariable that could explain union-vs.-nonunion productivity differences. Intuitively, onemight have expected smaller, disproportionately nonunion mines of the time to have lackedthe technology and equipment to match the productivity levels of the larger,disproportionately unionized mines. But if a scale factor is operative in recent undergroundmining experience, its presence is effectively masked in the aggregate numbers.
The following tabulation shows the comparative productivity levels in undergroundmining. The figures (from EIA, Coal Industry Annual 1995, 1996) are for 1995, expressed intons per miner-hour worked:
Union Nonunion Nonunion/union
Appalachia 2.92 3.23 1.11Interior 3.64 3.95 1.09West 4.69 7.38 1.57US 3.14 3.63 1.16
On a per worker-shift basis, for reasons speculated on above, the ratios are substantiallyhigher. (See data cited by Walker 1996, p. 66.). Whether this nonunion margin of advantagewill induce unionized firms to take steps to improve efficiency, what those steps might be,and how unions would react are questions that go beyond the scope of this report.Comparative productivity levels aside, rates of productivity improvement during the lastseveral years have been similar across both union and nonunion mines. Amidst arediscovered mutuality of interest between labor and management, labor disturbances havebeen infrequent, suggests that this may, in fact, be turning into a minor or non-issue.13
6. THE ROLE OF LABOR AND NONLABOR INPUTS IN PRODUCTIVITY CHANGE
Preceding sections have mainly focused on estimates of labor productivity as the mostreadily available measure of coal mine productivity spanning extended time periods, multiplegeographic regions, and different types of coal extraction. But neither levels nor rates ofchange in labor productivity capture fully the efficiency with which the entire range of inputs-- labor, capital, energy, materials -- is deployed in the production process. That more
12 The same phenomenon apparently exists in the scaled-down British coal industry. Reduction in overmanningand greater shift flexibility have translated into greater productivity.
13 In Appalachia, new mines opened in areas formerly dominated by union mines are predominantly nonunion.
Darmstadter RFF 97-40
-32-
comprehensive measure, total factor productivity (TFP), provides, among other things, a moremeaningful clue than labor productivity alone to the real cost and therefore competitiveposition of the industry as a whole or segments within it. TFP was introduced briefly inTable 1-1, but in what follows, is accorded a more thorough look. Most of the discussion isbased on an analysis and preliminary findings appearing in a 1996 draft report prepared byDenny Ellerman and Ernst Berndt (hereafter E-B) of MIT as part of an ongoing researchproject for EIA. (Ellerman and Berndt 1996)14
Recognizing that labor productivity data are, as noted, available on a much moredisaggregated basis than TFP, E-B set out to test the extent to which labor productivity trendstrack, or can provide inferences about, the behavior of concurrent trends in TFP. For thispurpose, they derive a TFP series based on the method developed by Dale Jorgenson andcolleagues at Harvard University and a labor productivity series built up from mine-level datacollected by the Mine Health and Safety Administration (MSHA). At an industry-wide levelof comparison, a plot from E-B (in Fig. 6-1) shows the two productivity paths to generallymove together directionally -- which is what one would expect -- though by no means inparallel fashion. (The output measure used in the figure refers to tonnage; the labor series hasbeen adjusted for quality change, though that adjustment does not significantly alter the laborinput trend.) Thus, during both periods of rising productivity shown in the graph (fromaround 1950 to the early sixties and from the late seventies to the present), labor productivityincreased at a more rapid rate; while, during the decade of falling productivity in the 1970s,labor productivity decline was less sharp. For reasons that are not clear, preliminary data forthe early nineties show a conspicuous lag in TFP relative to labor productivity growth.
During extended periods of productivity rise, a faster rate of increase in laborproductivity than in TFP is to be expected, since nonlabor inputs -- capital and other resources-- are growing faster than labor. But in years of productivity decline, as in the decade of the1970s, the steeper relative fall in TFP arises from the fact that nonlabor inputs -- particularlyfixed capital, which continues having to be serviced -- are not nearly as easy to reduce asminers, who can be laid off.
Conceptually, differences in the rate of change between the two measures ofproductivity can be ascribed to one or both of the following phenomena:
• “factor substitution”: changes in the shares among inputs -- say, more capital relativeto labor, but without technological progress• “factor bias”: technological progress associated with one or more inputs, such as theconsequences of improved equipment or enhanced labor skills
14 TFP calculations also receive major attention in Ian Parry’s comparative four-industry RFF study. (See Parry1997.) To ensure consistency and improve comparability across the four industries (petroleum, coal, copper,forestry), Parry had to employ data sources and estimating procedures that differ to some extent with thoseemployed in the individual monographs and in E-B. For example, E-B rely on mine-level data collected by theMine Health and Safety Administration (MSHA), whereas Parry’s estimates are based on Bureau of the Censusstatistics.
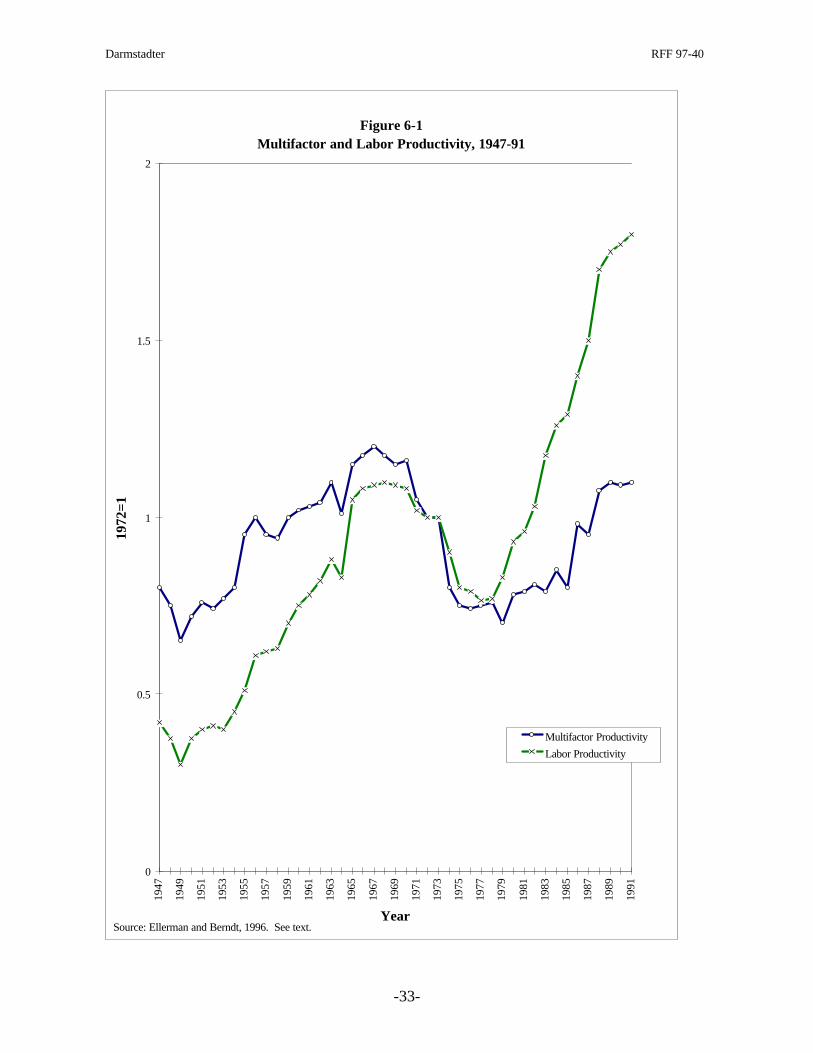
Darmstadter RFF 97-40
-33-
Figure 6-1Multifactor and Labor Productivity, 1947-91
0
0.5
1
1.5
219
47
1949
1951
1953
1955
1957
1959
1961
1963
1965
1967
1969
1971
1973
1975
1977
1979
1981
1983
1985
1987
1989
1991
Year
1972
=1
Multifactor Productivity
Labor Productivity
Source: Ellerman and Berndt, 1996. See text.
Darmstadter RFF 97-40
-34-
Econometric analysis performed by E-B (in turn based on Jorgenson’s data) suggeststo them that “factor substitution has not been a major factor in explaining labor productivityin the American coal industry. Most of the observed change of labor productivity is causedby technological change; and the differing rates of change in labor productivity and in totalfactor productivity reflect the pronounced labor-saving bias of technical change in the coalindustry.” (E-B, p. 13) E-B estimate that “technological progress continually reduces thedemand for labor and improves labor productivity at a rate ranging from 2-3% per annum”(p. 12).
Given the heterogeneous nature -- regionally and in terms of mining technique -- ofthe American coal industry, E-B proceed to dissect labor productivity trends in eight regions.They do this in order to determine how these disaggregated trends compare with nationallabor productivity trends and whether they permit conclusions on labor productivity-TFPrelationships at the regional scale. With respect to the former question, they decomposechanges in national labor productivity so as to separate the effect of changing regionalcomposition of coal production (Powder River Basin surface mining labor productivity levels,for example, being much higher than Appalachian underground levels) from the effect ofregional changes in labor productivity. Additionally, they convert tonnage output figures intoBtu’s in order to adjust for heat-content differentials among regional coals. This part of the E-B analysis concludes that, while the respective impacts on national labor productivity changeof compositional shifts, on the one hand, and regional productivity change, on the other, havevaried in different periods, for the time-span 1972-94, “the shift to regions with higher laborproductivity accounted for as much of the change as the improvement experienced at theregional level. Instead of increasing at an annual rate of 3.62 [i.e. the aggregate national ratereflecting both effects], the average improvement at the regional level was 1.85%” (p. 20).However, during the last 15 years or so, with a marked slowing of the westward shift in coalproduction, the compositional effect has subsided markedly.
What can be deduced from regional labor productivity trends about regional TFP?E-B believe that regional differences in levels and trends of labor productivity are probablygood surrogates for TFP as well. Their chain of reasoning goes as follows: Assuming thatthe coal industry operates in a competitive environment -- both in its input purchases andoutput sales -- coal prices will track production costs which, in turn, reflect what is paid to allfactor inputs. Since, as one moves from Appalachian underground mining to Western surfacemining, mine-mouth prices decline roughly proportionately to the increase in laborproductivity, an inference can be drawn that TFP regionally may bear the same relationship toregional labor productivity that is exhibited nationally (and was depicted in Fig. 6-1). Torestate it somewhat differently: with enough competition, price is (inversely) proportional toTFP; thus, if price is proportional to labor productivity, it must follow that labor productivitytends to be proportional to TFP. But the authors readily admit that their judgments pertainingto the regional scale are quite tentative and invite shoring-up with strengthened research.
At the national level, however, their findings carry more certainty. To recap in E-B’swords:
Darmstadter RFF 97-40
-35-
Although factor substitution is present, the major determinant of the secular trend inlabor productivity is change in technology. The pronounced labor-saving bias oftechnological progress in the American coal industry accounts for most of theobserved difference between the rates of change of quality-adjusted laborproductivity and total factor productivity. Furthermore, the rate of labor-saving biashas been remarkably constant, appearing equally in periods of rising and decliningtotal factor productivity....a reasonable rule of thumb is that total factor productivityis changing at an annual rate 1.5 percentage points less than the rate of change inquality-adjusted labor productivity. (p. 33)
7. THE COAL RESOURCE BASE: CONSTRAINT OR NON-ISSUE?
Introduction
In this report, our primary concern with coal mine productivity revolves aroundproductivity in extraction of the resource. In contrast, Douglas Bohi’s companion study (Bohi1997) on oil and natural gas centers exclusively on productivity in the exploration for anddevelopment of new reserves. The reason for emphasizing the exploration-development phaseof petroleum activity arises from the fact that, particularly in the case of U.S. crude oilsupplies, production has been unable at prevailing world prices to keep up with rising demandand thus unable to avoid a fairly steady decline in the magnitude of U.S. reserves over the pastseveral decades. Clearly, enhanced efficiency in finding and developing -- perhaps even morethan in producing -- oil and gas, cannot help but prove economically beneficial in this countryand worldwide: reserves are stretched out to help meet increased energy requirements withoutundue upward pressure on real prices. Rising costs from depleting hydrocarbon resources maynot be infinitely postponable but technological progress can significantly cushion the process.
Conceptual similarities aside, the situation is markedly different with coal. Anabundance of U.S. resources and reserves ensures an overall capacity to produce coal decades,if not several centuries, into the future before encountering underlying resource constraints ofmajor significance. Of course, somewhat analogous to petroleum, even with abundantreserves, improved recoverability above the roughly 50 percent factor that presently seems toconstitute the nationwide norm can strengthen coal’s competitiveness above levels otherwiseprevailing. And a more-than-adequate total magnitude of national coal reserves doesn’tpreclude limits to coal expansion in particular regions; nor does it mean that there may not beproblems in supplying coal with particular properties at today’s prices. But, as we shall see,the overall reserve picture in coal is such as to justify foremost attention to productivity trendsin its extraction.
Coal Resource and Reserve Concepts
Coal resource and reserve concepts developed by the U.S. Geological Survey andmodified over the years by the Bureau of Mines and Energy Information Administration aresimilar to those applicable to petroleum. That is, they provide a schematic framework within
Darmstadter RFF 97-40
-36-
which one can proceed from the most expansive (and thus most speculative) to the narrowest(and most certain) empirical assessment of coal resources and reserves. As with oil and gas,that movement from the broadest to the narrowest perspective is governed by thecorrespondingly greater degree of geologic assurance and/or the increasing degree ofeconomic viability.
Where coal assessments differ from those for liquid hydrocarbons is that, in the caseof the latter, what is “unproved” and “proved” tends to be sharply differentiated: looselyspeaking, and notwithstanding the development of ever-more sophisticated explorationtechniques (as detailed in Bohi’s companion study), one has either found, or failed to find, theoil field. By contrast to the marked discontinuities one observes in oil exploration, coaldoesn’t have that “now you see it, now you don’t” character; you’re quite certain the coal isthere, even though uncertainty over the extent of a deposit increases with the extent of theinferences employed in the assessment process. Thus, in proving up the extent of a potentialcoal seam, the combined effect of drilling, sampling, measuring, and observing permitquantification of the deposit to be made with a good deal of confidence, even if at someconsiderable distance from the drill hole. The greater that distance, the less certain therobustness of the assessment, but that certainty diminishes only gradually, lending estimatesderived in this fashion a widely accepted degree of authority.
Some Estimates
The foregoing points provide a brief backdrop to numbers drawn from a recentlyreleased EIA report on U.S. coal reserves (EIA 1996B). As a general proposition, the report,like numerous earlier studies, affirms the “adequacy” of the U.S. coal resource and reservesituation. Table 7-1 is arrayed so as to show the effect of successively more restrictivemeasurement concepts. From a purely aggregate perspective, the number of primary interestis probably that of “estimated recoverable reserves,”15 totaling some 274 billion short tons atthe beginning of 1995, a magnitude supporting close to a three-century “cushion” at currentoutput rates and still well over a century’s remaining supplies if production were to grow atone percent yearly over the next 100 years. In energy terms, this translates into magnitudessubstantially exceeding those estimated for oil and gas combined.
Some Caveats
While one would find a large reserve estimate more reassuring than a small one, anaggregate like the one cited in the preceding paragraph is, for a number of reasons, somethingof an abstraction. The devil being, as always, in the details, it is useful to try and identifyways in which particular policy directions or technical problems could limit the exploitation
15 The concept of estimated recoverable coal reserves can be viewed as analogous to proved recoverablereserves of oil or natural gas; in both cases, they are in principle conditioned by the assumption of recoverabilityat today’s cost and technology -- “in principle,” because there is reason to question how reliably those criteria areor can be applied in reserve estimation.
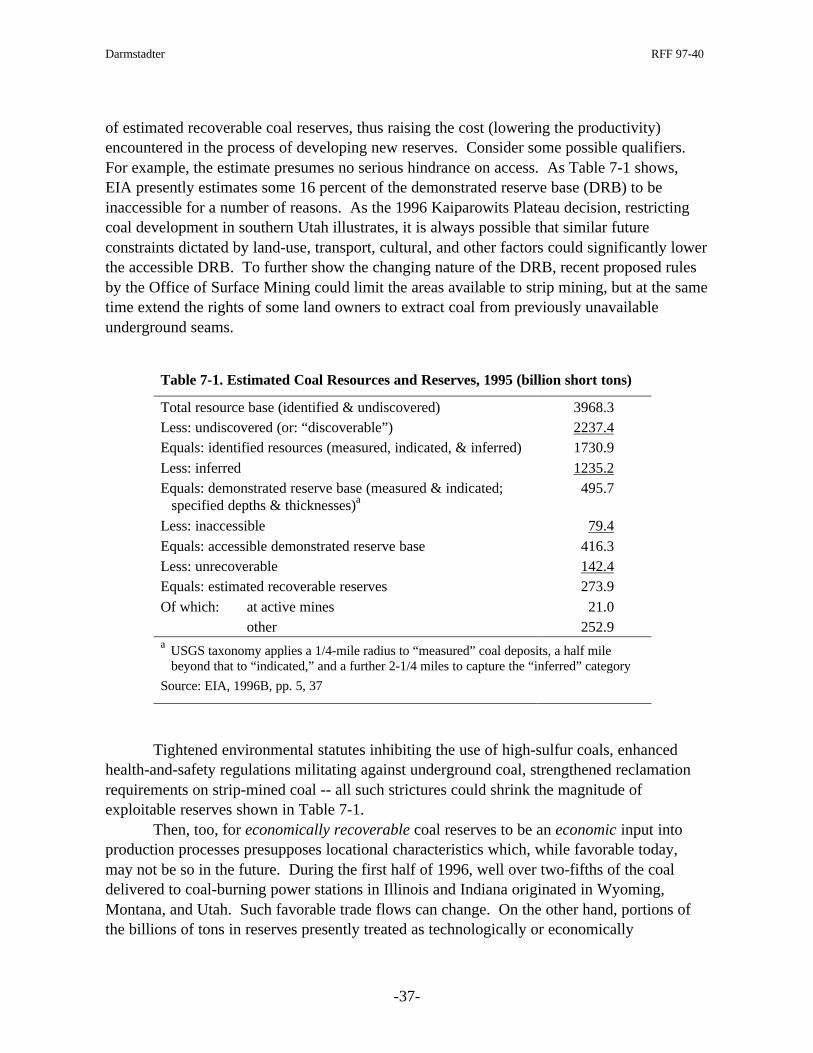
Darmstadter RFF 97-40
-37-
of estimated recoverable coal reserves, thus raising the cost (lowering the productivity)encountered in the process of developing new reserves. Consider some possible qualifiers.For example, the estimate presumes no serious hindrance on access. As Table 7-1 shows,EIA presently estimates some 16 percent of the demonstrated reserve base (DRB) to beinaccessible for a number of reasons. As the 1996 Kaiparowits Plateau decision, restrictingcoal development in southern Utah illustrates, it is always possible that similar futureconstraints dictated by land-use, transport, cultural, and other factors could significantly lowerthe accessible DRB. To further show the changing nature of the DRB, recent proposed rulesby the Office of Surface Mining could limit the areas available to strip mining, but at the sametime extend the rights of some land owners to extract coal from previously unavailableunderground seams.
Table 7-1. Estimated Coal Resources and Reserves, 1995 (billion short tons)
Total resource base (identified & undiscovered) 3968.3Less: undiscovered (or: “discoverable”) 2237.4Equals: identified resources (measured, indicated, & inferred) 1730.9Less: inferred 1235.2Equals: demonstrated reserve base (measured & indicated;
specified depths & thicknesses)a495.7
Less: inaccessible 79.4Equals: accessible demonstrated reserve base 416.3Less: unrecoverable 142.4Equals: estimated recoverable reserves 273.9Of which: at active mines 21.0
other 252.9a USGS taxonomy applies a 1/4-mile radius to “measured” coal deposits, a half mile
beyond that to “indicated,” and a further 2-1/4 miles to capture the “inferred” category
Source: EIA, 1996B, pp. 5, 37
Tightened environmental statutes inhibiting the use of high-sulfur coals, enhancedhealth-and-safety regulations militating against underground coal, strengthened reclamationrequirements on strip-mined coal -- all such strictures could shrink the magnitude ofexploitable reserves shown in Table 7-1.
Then, too, for economically recoverable coal reserves to be an economic input intoproduction processes presupposes locational characteristics which, while favorable today,may not be so in the future. During the first half of 1996, well over two-fifths of the coaldelivered to coal-burning power stations in Illinois and Indiana originated in Wyoming,Montana, and Utah. Such favorable trade flows can change. On the other hand, portions ofthe billions of tons in reserves presently treated as technologically or economically
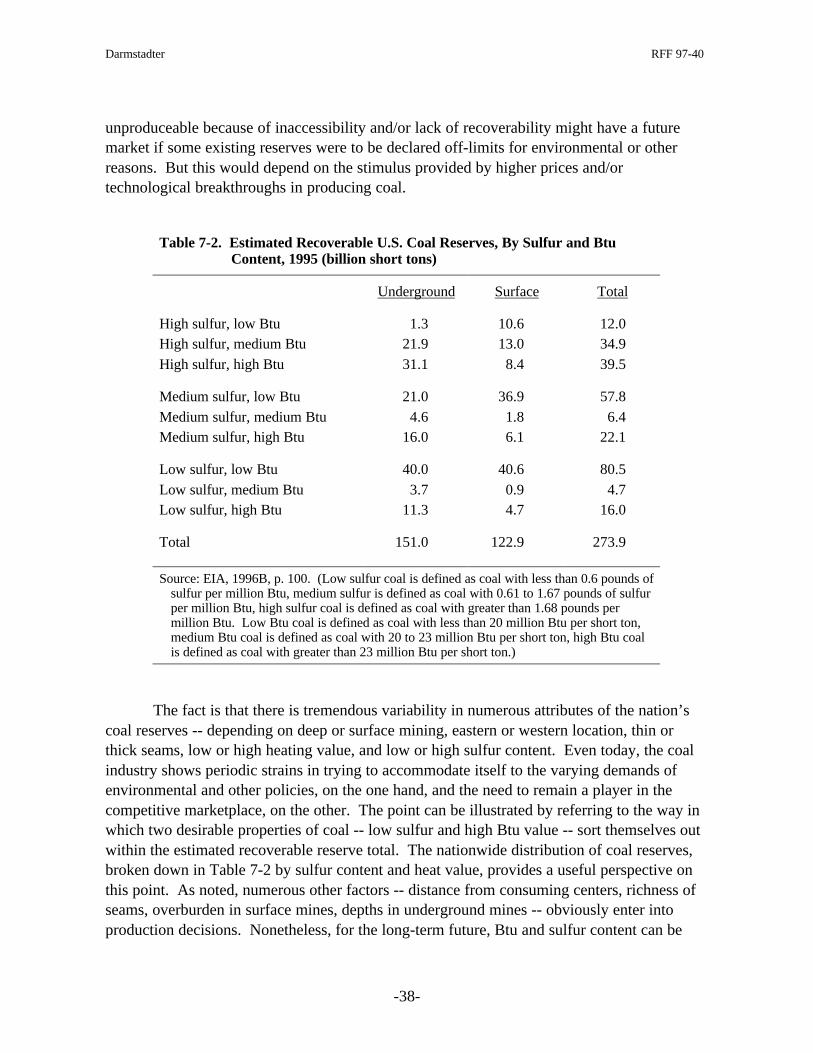
Darmstadter RFF 97-40
-38-
unproduceable because of inaccessibility and/or lack of recoverability might have a futuremarket if some existing reserves were to be declared off-limits for environmental or otherreasons. But this would depend on the stimulus provided by higher prices and/ortechnological breakthroughs in producing coal.
Table 7-2. Estimated Recoverable U.S. Coal Reserves, By Sulfur and BtuContent, 1995 (billion short tons)
Underground Surface Total
High sulfur, low Btu 1.3 10.6 12.0High sulfur, medium Btu 21.9 13.0 34.9High sulfur, high Btu 31.1 8.4 39.5
Medium sulfur, low Btu 21.0 36.9 57.8Medium sulfur, medium Btu 4.6 1.8 6.4Medium sulfur, high Btu 16.0 6.1 22.1
Low sulfur, low Btu 40.0 40.6 80.5Low sulfur, medium Btu 3.7 0.9 4.7Low sulfur, high Btu 11.3 4.7 16.0
Total 151.0 122.9 273.9
Source: EIA, 1996B, p. 100. (Low sulfur coal is defined as coal with less than 0.6 pounds ofsulfur per million Btu, medium sulfur is defined as coal with 0.61 to 1.67 pounds of sulfurper million Btu, high sulfur coal is defined as coal with greater than 1.68 pounds permillion Btu. Low Btu coal is defined as coal with less than 20 million Btu per short ton,medium Btu coal is defined as coal with 20 to 23 million Btu per short ton, high Btu coalis defined as coal with greater than 23 million Btu per short ton.)
The fact is that there is tremendous variability in numerous attributes of the nation’scoal reserves -- depending on deep or surface mining, eastern or western location, thin orthick seams, low or high heating value, and low or high sulfur content. Even today, the coalindustry shows periodic strains in trying to accommodate itself to the varying demands ofenvironmental and other policies, on the one hand, and the need to remain a player in thecompetitive marketplace, on the other. The point can be illustrated by referring to the way inwhich two desirable properties of coal -- low sulfur and high Btu value -- sort themselves outwithin the estimated recoverable reserve total. The nationwide distribution of coal reserves,broken down in Table 7-2 by sulfur content and heat value, provides a useful perspective onthis point. As noted, numerous other factors -- distance from consuming centers, richness ofseams, overburden in surface mines, depths in underground mines -- obviously enter intoproduction decisions. Nonetheless, for the long-term future, Btu and sulfur content can be
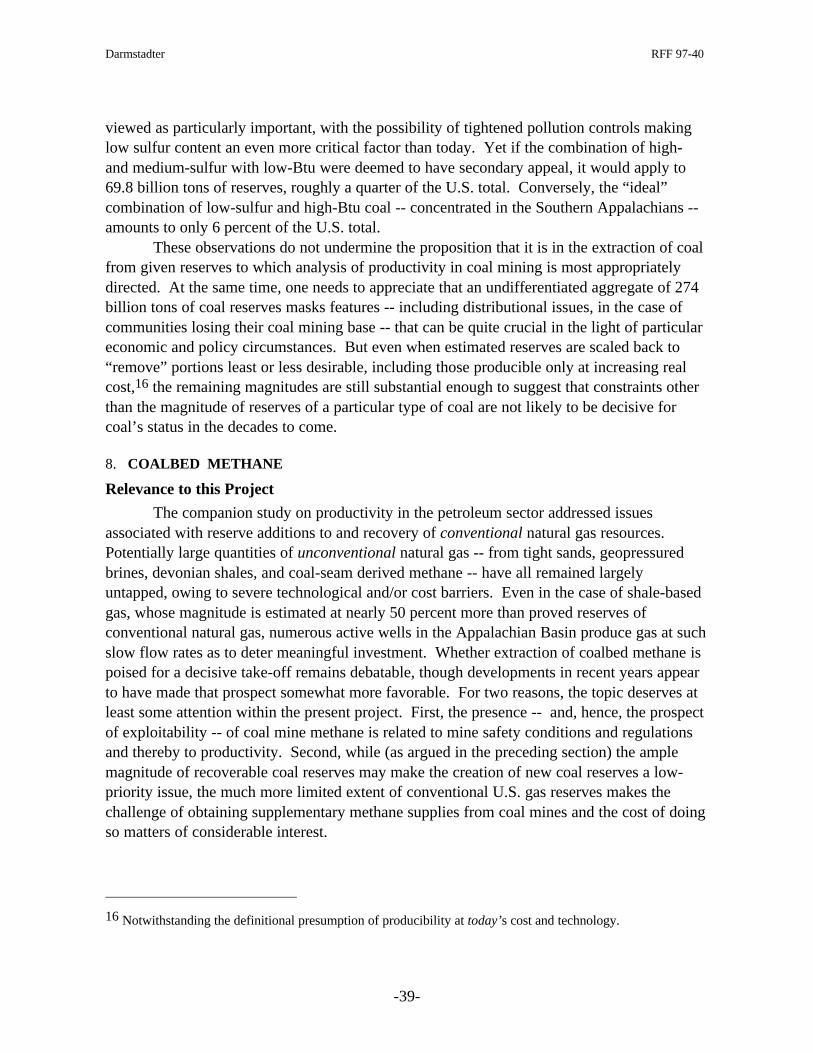
Darmstadter RFF 97-40
-39-
viewed as particularly important, with the possibility of tightened pollution controls makinglow sulfur content an even more critical factor than today. Yet if the combination of high-and medium-sulfur with low-Btu were deemed to have secondary appeal, it would apply to69.8 billion tons of reserves, roughly a quarter of the U.S. total. Conversely, the “ideal”combination of low-sulfur and high-Btu coal -- concentrated in the Southern Appalachians --amounts to only 6 percent of the U.S. total.
These observations do not undermine the proposition that it is in the extraction of coalfrom given reserves to which analysis of productivity in coal mining is most appropriatelydirected. At the same time, one needs to appreciate that an undifferentiated aggregate of 274billion tons of coal reserves masks features -- including distributional issues, in the case ofcommunities losing their coal mining base -- that can be quite crucial in the light of particulareconomic and policy circumstances. But even when estimated reserves are scaled back to“remove” portions least or less desirable, including those producible only at increasing realcost,16 the remaining magnitudes are still substantial enough to suggest that constraints otherthan the magnitude of reserves of a particular type of coal are not likely to be decisive forcoal’s status in the decades to come.
8. COALBED METHANE
Relevance to this Project
The companion study on productivity in the petroleum sector addressed issuesassociated with reserve additions to and recovery of conventional natural gas resources.Potentially large quantities of unconventional natural gas -- from tight sands, geopressuredbrines, devonian shales, and coal-seam derived methane -- have all remained largelyuntapped, owing to severe technological and/or cost barriers. Even in the case of shale-basedgas, whose magnitude is estimated at nearly 50 percent more than proved reserves ofconventional natural gas, numerous active wells in the Appalachian Basin produce gas at suchslow flow rates as to deter meaningful investment. Whether extraction of coalbed methane ispoised for a decisive take-off remains debatable, though developments in recent years appearto have made that prospect somewhat more favorable. For two reasons, the topic deserves atleast some attention within the present project. First, the presence -- and, hence, the prospectof exploitability -- of coal mine methane is related to mine safety conditions and regulationsand thereby to productivity. Second, while (as argued in the preceding section) the amplemagnitude of recoverable coal reserves may make the creation of new coal reserves a low-priority issue, the much more limited extent of conventional U.S. gas reserves makes thechallenge of obtaining supplementary methane supplies from coal mines and the cost of doingso matters of considerable interest.
16 Notwithstanding the definitional presumption of producibility at today’s cost and technology.
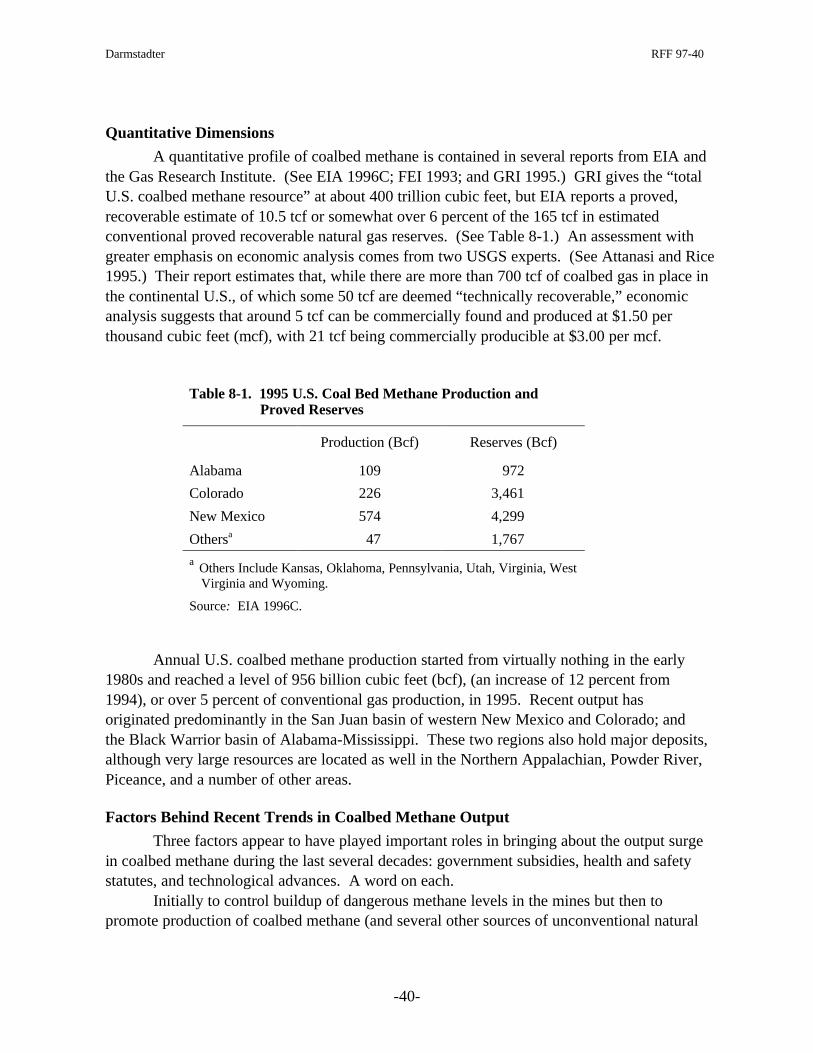
Darmstadter RFF 97-40
-40-
Quantitative Dimensions
A quantitative profile of coalbed methane is contained in several reports from EIA andthe Gas Research Institute. (See EIA 1996C; FEI 1993; and GRI 1995.) GRI gives the “totalU.S. coalbed methane resource” at about 400 trillion cubic feet, but EIA reports a proved,recoverable estimate of 10.5 tcf or somewhat over 6 percent of the 165 tcf in estimatedconventional proved recoverable natural gas reserves. (See Table 8-1.) An assessment withgreater emphasis on economic analysis comes from two USGS experts. (See Attanasi and Rice1995.) Their report estimates that, while there are more than 700 tcf of coalbed gas in place inthe continental U.S., of which some 50 tcf are deemed “technically recoverable,” economicanalysis suggests that around 5 tcf can be commercially found and produced at $1.50 perthousand cubic feet (mcf), with 21 tcf being commercially producible at $3.00 per mcf.
Table 8-1. 1995 U.S. Coal Bed Methane Production andProved Reserves
Production (Bcf) Reserves (Bcf)
Alabama 109 972
Colorado 226 3,461
New Mexico 574 4,299
Othersa 47 1,767
a Others Include Kansas, Oklahoma, Pennsylvania, Utah, Virginia, WestVirginia and Wyoming.
Source: EIA 1996C.
Annual U.S. coalbed methane production started from virtually nothing in the early1980s and reached a level of 956 billion cubic feet (bcf), (an increase of 12 percent from1994), or over 5 percent of conventional gas production, in 1995. Recent output hasoriginated predominantly in the San Juan basin of western New Mexico and Colorado; andthe Black Warrior basin of Alabama-Mississippi. These two regions also hold major deposits,although very large resources are located as well in the Northern Appalachian, Powder River,Piceance, and a number of other areas.
Factors Behind Recent Trends in Coalbed Methane Output
Three factors appear to have played important roles in bringing about the output surgein coalbed methane during the last several decades: government subsidies, health and safetystatutes, and technological advances. A word on each.
Initially to control buildup of dangerous methane levels in the mines but then topromote production of coalbed methane (and several other sources of unconventional natural
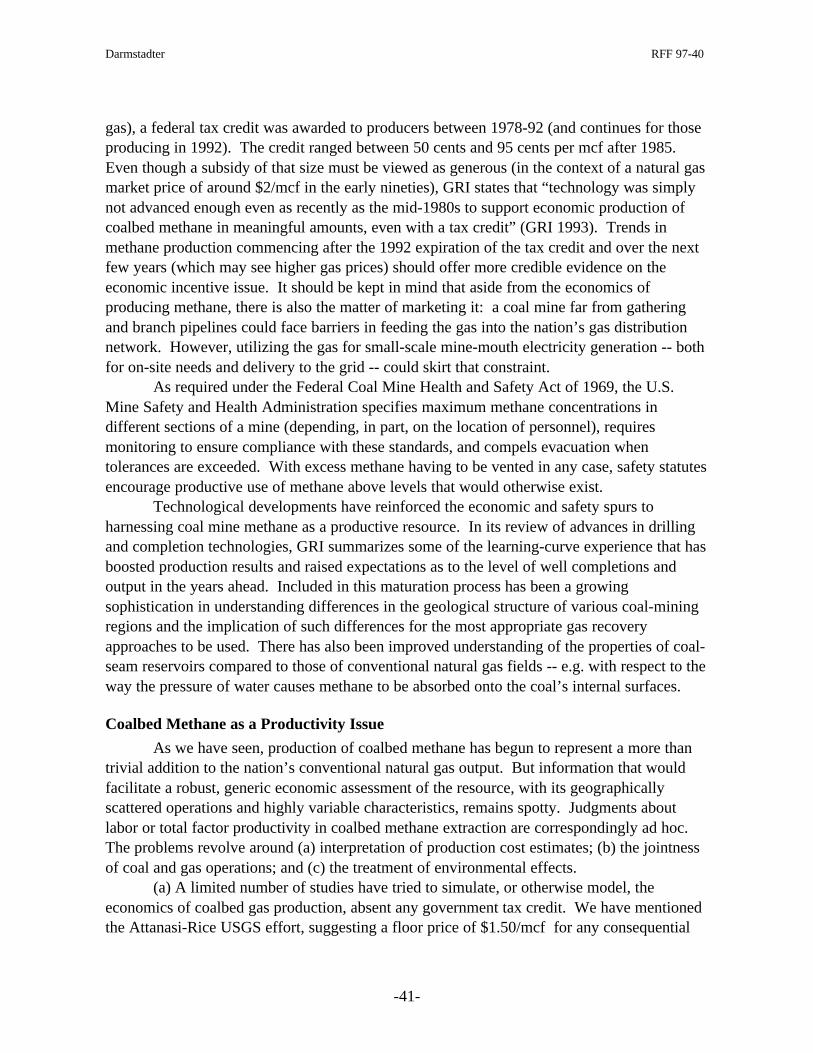
Darmstadter RFF 97-40
-41-
gas), a federal tax credit was awarded to producers between 1978-92 (and continues for thoseproducing in 1992). The credit ranged between 50 cents and 95 cents per mcf after 1985.Even though a subsidy of that size must be viewed as generous (in the context of a natural gasmarket price of around $2/mcf in the early nineties), GRI states that “technology was simplynot advanced enough even as recently as the mid-1980s to support economic production ofcoalbed methane in meaningful amounts, even with a tax credit” (GRI 1993). Trends inmethane production commencing after the 1992 expiration of the tax credit and over the nextfew years (which may see higher gas prices) should offer more credible evidence on theeconomic incentive issue. It should be kept in mind that aside from the economics ofproducing methane, there is also the matter of marketing it: a coal mine far from gatheringand branch pipelines could face barriers in feeding the gas into the nation’s gas distributionnetwork. However, utilizing the gas for small-scale mine-mouth electricity generation -- bothfor on-site needs and delivery to the grid -- could skirt that constraint.
As required under the Federal Coal Mine Health and Safety Act of 1969, the U.S.Mine Safety and Health Administration specifies maximum methane concentrations indifferent sections of a mine (depending, in part, on the location of personnel), requiresmonitoring to ensure compliance with these standards, and compels evacuation whentolerances are exceeded. With excess methane having to be vented in any case, safety statutesencourage productive use of methane above levels that would otherwise exist.
Technological developments have reinforced the economic and safety spurs toharnessing coal mine methane as a productive resource. In its review of advances in drillingand completion technologies, GRI summarizes some of the learning-curve experience that hasboosted production results and raised expectations as to the level of well completions andoutput in the years ahead. Included in this maturation process has been a growingsophistication in understanding differences in the geological structure of various coal-miningregions and the implication of such differences for the most appropriate gas recoveryapproaches to be used. There has also been improved understanding of the properties of coal-seam reservoirs compared to those of conventional natural gas fields -- e.g. with respect to theway the pressure of water causes methane to be absorbed onto the coal’s internal surfaces.
Coalbed Methane as a Productivity Issue
As we have seen, production of coalbed methane has begun to represent a more thantrivial addition to the nation’s conventional natural gas output. But information that wouldfacilitate a robust, generic economic assessment of the resource, with its geographicallyscattered operations and highly variable characteristics, remains spotty. Judgments aboutlabor or total factor productivity in coalbed methane extraction are correspondingly ad hoc.The problems revolve around (a) interpretation of production cost estimates; (b) the jointnessof coal and gas operations; and (c) the treatment of environmental effects.
(a) A limited number of studies have tried to simulate, or otherwise model, theeconomics of coalbed gas production, absent any government tax credit. We have mentionedthe Attanasi-Rice USGS effort, suggesting a floor price of $1.50/mcf for any consequential
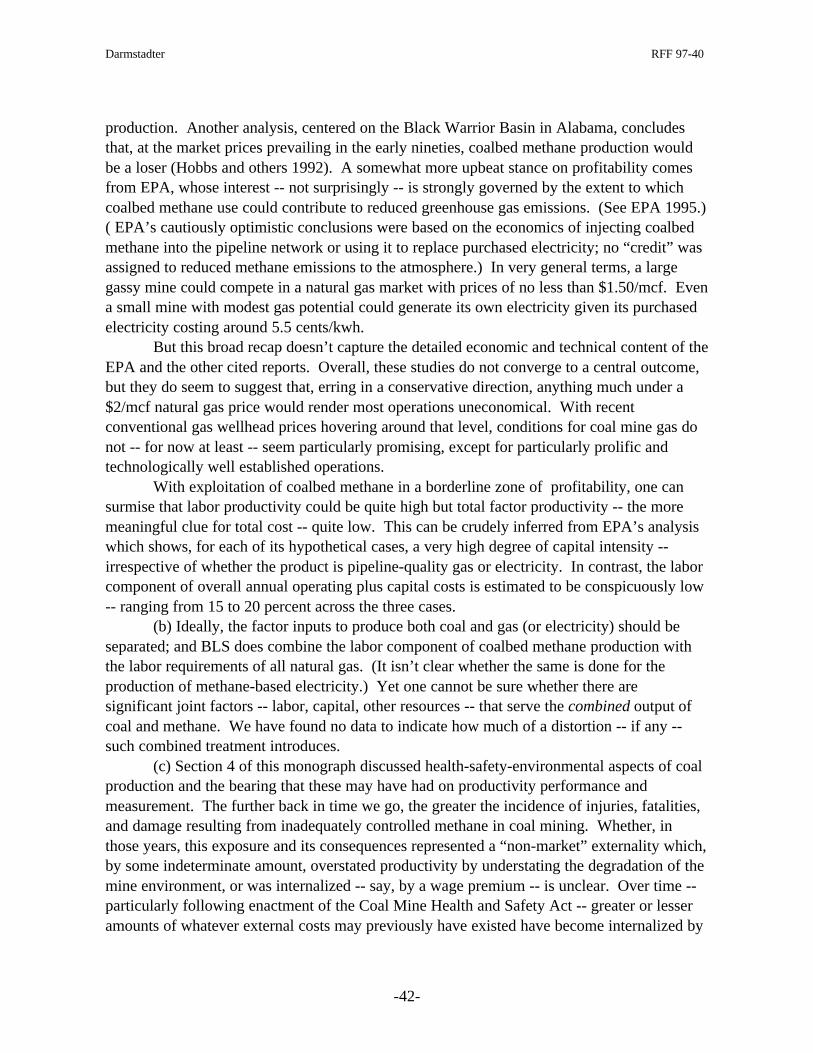
Darmstadter RFF 97-40
-42-
production. Another analysis, centered on the Black Warrior Basin in Alabama, concludesthat, at the market prices prevailing in the early nineties, coalbed methane production wouldbe a loser (Hobbs and others 1992). A somewhat more upbeat stance on profitability comesfrom EPA, whose interest -- not surprisingly -- is strongly governed by the extent to whichcoalbed methane use could contribute to reduced greenhouse gas emissions. (See EPA 1995.)( EPA’s cautiously optimistic conclusions were based on the economics of injecting coalbedmethane into the pipeline network or using it to replace purchased electricity; no “credit” wasassigned to reduced methane emissions to the atmosphere.) In very general terms, a largegassy mine could compete in a natural gas market with prices of no less than $1.50/mcf. Evena small mine with modest gas potential could generate its own electricity given its purchasedelectricity costing around 5.5 cents/kwh.
But this broad recap doesn’t capture the detailed economic and technical content of theEPA and the other cited reports. Overall, these studies do not converge to a central outcome,but they do seem to suggest that, erring in a conservative direction, anything much under a$2/mcf natural gas price would render most operations uneconomical. With recentconventional gas wellhead prices hovering around that level, conditions for coal mine gas donot -- for now at least -- seem particularly promising, except for particularly prolific andtechnologically well established operations.
With exploitation of coalbed methane in a borderline zone of profitability, one cansurmise that labor productivity could be quite high but total factor productivity -- the moremeaningful clue for total cost -- quite low. This can be crudely inferred from EPA’s analysiswhich shows, for each of its hypothetical cases, a very high degree of capital intensity --irrespective of whether the product is pipeline-quality gas or electricity. In contrast, the laborcomponent of overall annual operating plus capital costs is estimated to be conspicuously low-- ranging from 15 to 20 percent across the three cases.
(b) Ideally, the factor inputs to produce both coal and gas (or electricity) should beseparated; and BLS does combine the labor component of coalbed methane production withthe labor requirements of all natural gas. (It isn’t clear whether the same is done for theproduction of methane-based electricity.) Yet one cannot be sure whether there aresignificant joint factors -- labor, capital, other resources -- that serve the combined output ofcoal and methane. We have found no data to indicate how much of a distortion -- if any --such combined treatment introduces.
(c) Section 4 of this monograph discussed health-safety-environmental aspects of coalproduction and the bearing that these may have had on productivity performance andmeasurement. The further back in time we go, the greater the incidence of injuries, fatalities,and damage resulting from inadequately controlled methane in coal mining. Whether, inthose years, this exposure and its consequences represented a “non-market” externality which,by some indeterminate amount, overstated productivity by understating the degradation of themine environment, or was internalized -- say, by a wage premium -- is unclear. Over time --particularly following enactment of the Coal Mine Health and Safety Act -- greater or lesseramounts of whatever external costs may previously have existed have become internalized by
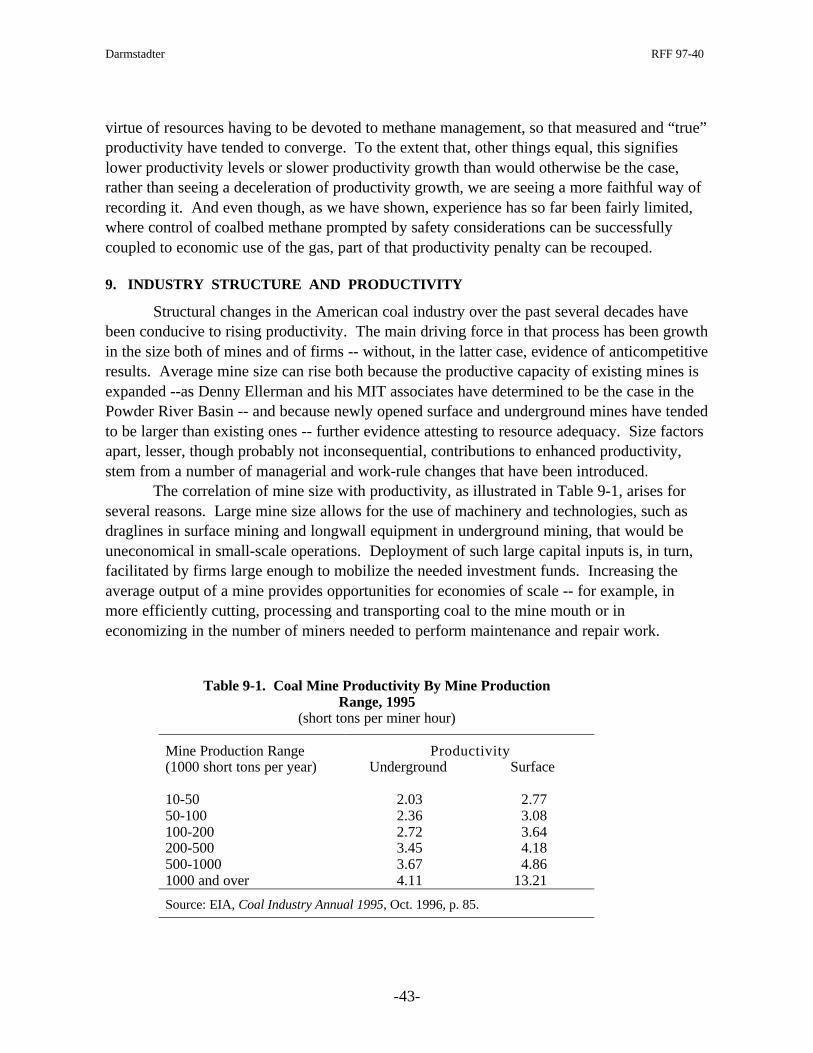
Darmstadter RFF 97-40
-43-
virtue of resources having to be devoted to methane management, so that measured and “true”productivity have tended to converge. To the extent that, other things equal, this signifieslower productivity levels or slower productivity growth than would otherwise be the case,rather than seeing a deceleration of productivity growth, we are seeing a more faithful way ofrecording it. And even though, as we have shown, experience has so far been fairly limited,where control of coalbed methane prompted by safety considerations can be successfullycoupled to economic use of the gas, part of that productivity penalty can be recouped.
9. INDUSTRY STRUCTURE AND PRODUCTIVITY
Structural changes in the American coal industry over the past several decades havebeen conducive to rising productivity. The main driving force in that process has been growthin the size both of mines and of firms -- without, in the latter case, evidence of anticompetitiveresults. Average mine size can rise both because the productive capacity of existing mines isexpanded --as Denny Ellerman and his MIT associates have determined to be the case in thePowder River Basin -- and because newly opened surface and underground mines have tendedto be larger than existing ones -- further evidence attesting to resource adequacy. Size factorsapart, lesser, though probably not inconsequential, contributions to enhanced productivity,stem from a number of managerial and work-rule changes that have been introduced.
The correlation of mine size with productivity, as illustrated in Table 9-1, arises forseveral reasons. Large mine size allows for the use of machinery and technologies, such asdraglines in surface mining and longwall equipment in underground mining, that would beuneconomical in small-scale operations. Deployment of such large capital inputs is, in turn,facilitated by firms large enough to mobilize the needed investment funds. Increasing theaverage output of a mine provides opportunities for economies of scale -- for example, inmore efficiently cutting, processing and transporting coal to the mine mouth or ineconomizing in the number of miners needed to perform maintenance and repair work.
Table 9-1. Coal Mine Productivity By Mine ProductionRange, 1995
(short tons per miner hour)
Mine Production Range Productivity(1000 short tons per year) Underground Surface
10-50 2.03 2.7750-100 2.36 3.08100-200 2.72 3.64200-500 3.45 4.18500-1000 3.67 4.861000 and over 4.11 13.21
Source: EIA, Coal Industry Annual 1995, Oct. 1996, p. 85.
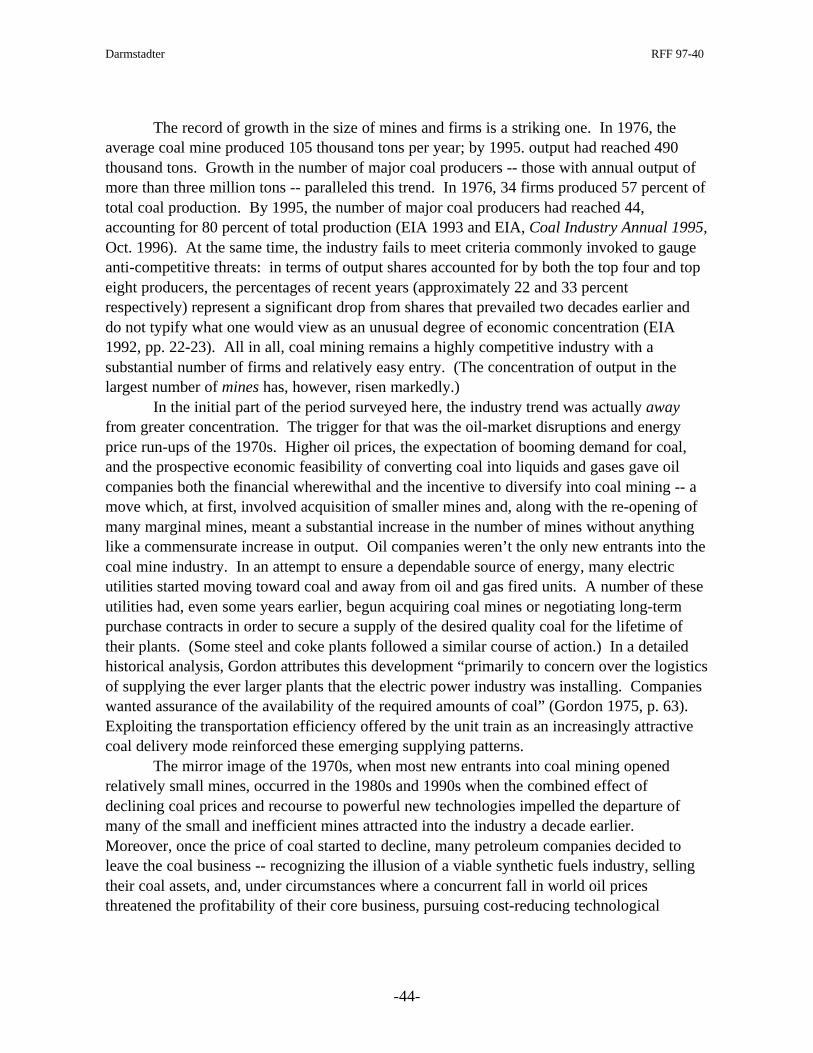
Darmstadter RFF 97-40
-44-
The record of growth in the size of mines and firms is a striking one. In 1976, theaverage coal mine produced 105 thousand tons per year; by 1995. output had reached 490thousand tons. Growth in the number of major coal producers -- those with annual output ofmore than three million tons -- paralleled this trend. In 1976, 34 firms produced 57 percent oftotal coal production. By 1995, the number of major coal producers had reached 44,accounting for 80 percent of total production (EIA 1993 and EIA, Coal Industry Annual 1995,Oct. 1996). At the same time, the industry fails to meet criteria commonly invoked to gaugeanti-competitive threats: in terms of output shares accounted for by both the top four and topeight producers, the percentages of recent years (approximately 22 and 33 percentrespectively) represent a significant drop from shares that prevailed two decades earlier anddo not typify what one would view as an unusual degree of economic concentration (EIA1992, pp. 22-23). All in all, coal mining remains a highly competitive industry with asubstantial number of firms and relatively easy entry. (The concentration of output in thelargest number of mines has, however, risen markedly.)
In the initial part of the period surveyed here, the industry trend was actually awayfrom greater concentration. The trigger for that was the oil-market disruptions and energyprice run-ups of the 1970s. Higher oil prices, the expectation of booming demand for coal,and the prospective economic feasibility of converting coal into liquids and gases gave oilcompanies both the financial wherewithal and the incentive to diversify into coal mining -- amove which, at first, involved acquisition of smaller mines and, along with the re-opening ofmany marginal mines, meant a substantial increase in the number of mines without anythinglike a commensurate increase in output. Oil companies weren’t the only new entrants into thecoal mine industry. In an attempt to ensure a dependable source of energy, many electricutilities started moving toward coal and away from oil and gas fired units. A number of theseutilities had, even some years earlier, begun acquiring coal mines or negotiating long-termpurchase contracts in order to secure a supply of the desired quality coal for the lifetime oftheir plants. (Some steel and coke plants followed a similar course of action.) In a detailedhistorical analysis, Gordon attributes this development “primarily to concern over the logisticsof supplying the ever larger plants that the electric power industry was installing. Companieswanted assurance of the availability of the required amounts of coal” (Gordon 1975, p. 63).Exploiting the transportation efficiency offered by the unit train as an increasingly attractivecoal delivery mode reinforced these emerging supplying patterns.
The mirror image of the 1970s, when most new entrants into coal mining openedrelatively small mines, occurred in the 1980s and 1990s when the combined effect ofdeclining coal prices and recourse to powerful new technologies impelled the departure ofmany of the small and inefficient mines attracted into the industry a decade earlier.Moreover, once the price of coal started to decline, many petroleum companies decided toleave the coal business -- recognizing the illusion of a viable synthetic fuels industry, sellingtheir coal assets, and, under circumstances where a concurrent fall in world oil pricesthreatened the profitability of their core business, pursuing cost-reducing technological
Darmstadter RFF 97-40
-45-
advances in petroleum exploration and development. (Key developments are summarized inEIA 1993; the petroleum story is told in Bohi’s 1997 companion monograph.)
The financial impetus for that relinquishment becomes clearer when one comparesprofit rates for major energy companies on a consolidated basis with their coal propertiesonly. During the period 1977-95, while the gap between the two narrowed, returns to the coalcomponent pretty consistently fell below the petroleum components’ performance. For theentire period, the Federal Reporting System, a database of 36 major energy companiesmonitored by the Energy Information Administration, shows the latter to have achieved anaverage return 10.0 percent (based on net income relative to net investment in place), theformer, one of 4.8 percent (EIA, Performance Profiles of Major Energy Producers, AppendixB6, various years). However, some care needs to be taken when analyzing these figures;firms that report to the Financial Reporting System account for over 50 percent of domesticpetroleum production, but only account for 10 to 15 percent of domestic coal production.
Propelled, in part, by growing constraints on combustion of much higher sulfurAppalachian coal and facilitated by the use of ever larger truck shovels and draglines, thedevelopment of large and thick-seamed open-pit Western coal reserves played a major role inincreasing average mine size. And similarly to the financial requirements of opening a largesurface mine, in both the East and the West, the adoption and increased use of longwall andcontinuous mining equipment in underground mining required the assurance of large amountsof output in order to cover the capital costs associated with those technologies.
From the mergers and acquisitions that took place during the 1970s and the subsequentshake-out of the 1980s, we might expect to see some change in the competitive structure ofthe coal industry -- conceivably with negative consequences for productivity, as a moreoligopolistic industry relaxed its zeal for optimal efficiency. However, as we observed earlierin citing declining and only modest coal industry concentration ratios, there is no evidencesupporting such a scenario. It appears that the new entrants of the 1970s were unable to gainsignificant market strength, while the selling of assets in the 1980s was generally from smallfirms, electric utilities and petroleum companies to medium-sized independent coal firms.
Somewhat separate from factors relating to scale, technology, and capital requirements,there have been a number of managerial developments and changes in work practices witharguably positive effects on worker productivity. An example is provided by the large surfacelignite Freedom Mine in North Dakota. In order to try and overcome lags in labor productivityadvance, the facility in 1992 changed shifts from three 8-hour shifts, five days per week, to two12-hour shifts, six days per week. This led to a decrease in the amount of down time associatedwith shift changes. By working fewer but longer shifts the amount of time spent moving crewsto and from the coal face was decreased, resulting in improved productivity. (Additionaldiscussion of labor conditions and issues appears in Section 5.) A mobile equipment shiftchange also proved productive. This eliminated shift change times and allowed for a period ofrefueling and preventive maintenance to be scheduled without decreasing the time spentextracting coal. The estimated one-time increase in productivity brought about by shift changesalone ranges from four to twelve percent (Pippenger 1995, p. 336).
Darmstadter RFF 97-40
-46-
To the extent that this example can be generalized to the national level, it suggests thatat least some portion of productivity growth in recent years can be attributed to changingworker schedules, which show a 1986-95 increase in shift length of from 8.2 to 8.6 hours forunderground mines and one of from 8.6 to 9.1 hours in surface mining. (Data for 1993 to 1995from EIA, Coal Industry Annual; earlier data from Coal Production.) From the graphaccompanying the Box in Section 1, we saw that from 1960 to 1979, changing themeasurement of input variables had little effect on the measured estimates of productivitychange. However, from 1979 to 1995, the average annual growth rate in tons per miner hourwas 7.1 percent, while, on a per employee basis, it was 7.8 percent. This seems to be roughlyconsistent with the proposition that lengthened shifts have contributed to productivity advance.
In addition to changing worker shift lengths, management at some firms has decidedto switch from a flat rate of payment to a performance and bonus payment system. Mineforemen and some individual miners are paid performance bonuses based on output, improvedattendance and improved safety records. (Whatever one’s judgment about whether the safetyburden was or was not historically an externality, the last of these three factors impliesinternalization, as the company is willing to pay to promote it; see additional remarks inSection 5.) But there is no evidence that such changes have perceptibly boosted productivity.
Certain other management decisions probably had a more simulative impact onproductivity. In order to improve the quality of their drilling equipment, some companieshave begun signing contracts with equipment suppliers based on a guaranteed number ofworking hours, enabling mines to effectively shift risk away from themselves and onto theequipment supplier. The effective result of this sort of contract has been to decreaseequipment downtime and to increase the amount of available time of equipment at the coalface (Wiebmer 1994). For A.T. Massey, a major Appalachian coal producer, about 50 percentof all repairs are contracted out in this sort of fashion, the rest (routine maintenance andsimple repairs) being performed in house.17 The earlier practice, at most mines, of retainingtheir own repair capacity evidently proved economically inefficient and, it seems, createdunnecessary losses in available equipment time. The potential for realizing economies ofscale and scope by contracting with specialized firms for major equipment repair andmaintenance is part of an out-sourcing trend that appears to be growing across a variety ofindustries. Perhaps, as in coal mining, the increased sophistication and complexity ofequipment, instrumentation, and information-system technology are common elementsfueling that momentum.
10. INTERNATIONAL COMPETITIVENESS
With its volume of production exceeded only by China, the United States, along withAustralia, ranks as a major world exporter of both steam and metallurgical coal. As seen in
17 Outsourcing of tasks formerly performed by mine personnel could mean some overstatement of laborproductivity increases, though not of multifactor productivity increases.
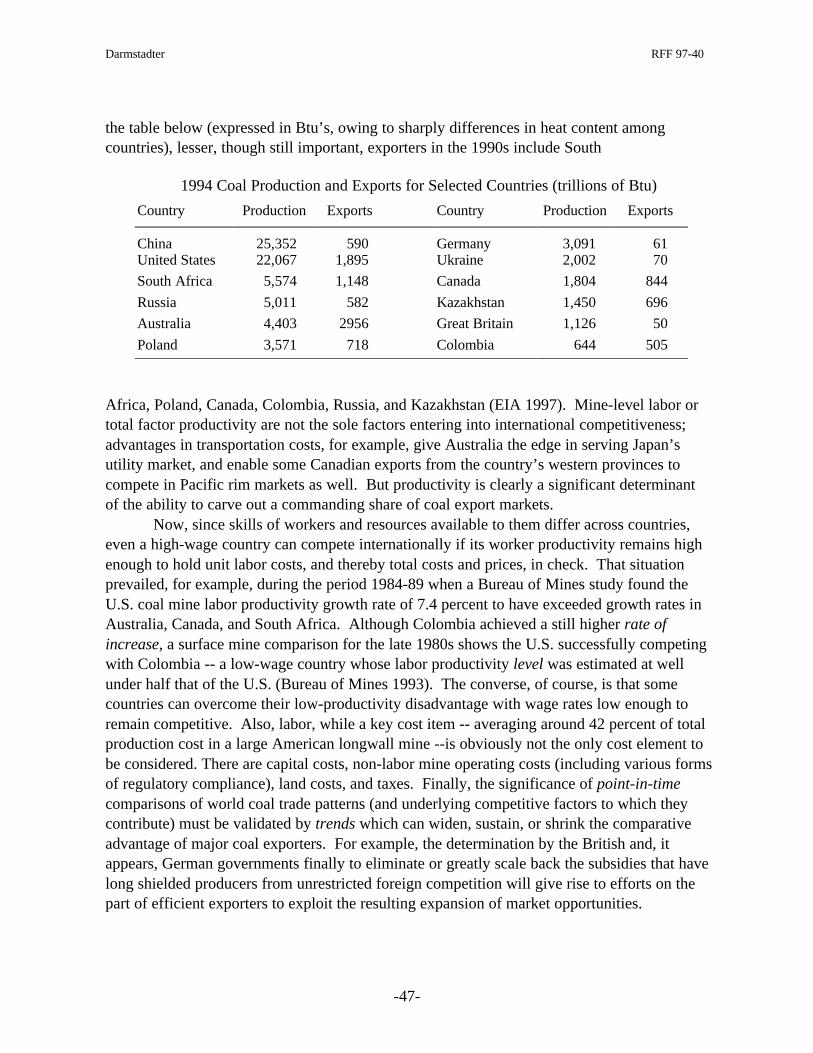
Darmstadter RFF 97-40
-47-
the table below (expressed in Btu’s, owing to sharply differences in heat content amongcountries), lesser, though still important, exporters in the 1990s include South
1994 Coal Production and Exports for Selected Countries (trillions of Btu)
Country Production Exports Country Production Exports
China 25,352 590 Germany 3,091 61United States 22,067 1,895 Ukraine 2,002 70
South Africa 5,574 1,148 Canada 1,804 844
Russia 5,011 582 Kazakhstan 1,450 696
Australia 4,403 2956 Great Britain 1,126 50
Poland 3,571 718 Colombia 644 505
Africa, Poland, Canada, Colombia, Russia, and Kazakhstan (EIA 1997). Mine-level labor ortotal factor productivity are not the sole factors entering into international competitiveness;advantages in transportation costs, for example, give Australia the edge in serving Japan’sutility market, and enable some Canadian exports from the country’s western provinces tocompete in Pacific rim markets as well. But productivity is clearly a significant determinantof the ability to carve out a commanding share of coal export markets.
Now, since skills of workers and resources available to them differ across countries,even a high-wage country can compete internationally if its worker productivity remains highenough to hold unit labor costs, and thereby total costs and prices, in check. That situationprevailed, for example, during the period 1984-89 when a Bureau of Mines study found theU.S. coal mine labor productivity growth rate of 7.4 percent to have exceeded growth rates inAustralia, Canada, and South Africa. Although Colombia achieved a still higher rate ofincrease, a surface mine comparison for the late 1980s shows the U.S. successfully competingwith Colombia -- a low-wage country whose labor productivity level was estimated at wellunder half that of the U.S. (Bureau of Mines 1993). The converse, of course, is that somecountries can overcome their low-productivity disadvantage with wage rates low enough toremain competitive. Also, labor, while a key cost item -- averaging around 42 percent of totalproduction cost in a large American longwall mine --is obviously not the only cost element tobe considered. There are capital costs, non-labor mine operating costs (including various formsof regulatory compliance), land costs, and taxes. Finally, the significance of point-in-timecomparisons of world coal trade patterns (and underlying competitive factors to which theycontribute) must be validated by trends which can widen, sustain, or shrink the comparativeadvantage of major coal exporters. For example, the determination by the British and, itappears, German governments finally to eliminate or greatly scale back the subsidies that havelong shielded producers from unrestricted foreign competition will give rise to efforts on thepart of efficient exporters to exploit the resulting expansion of market opportunities.
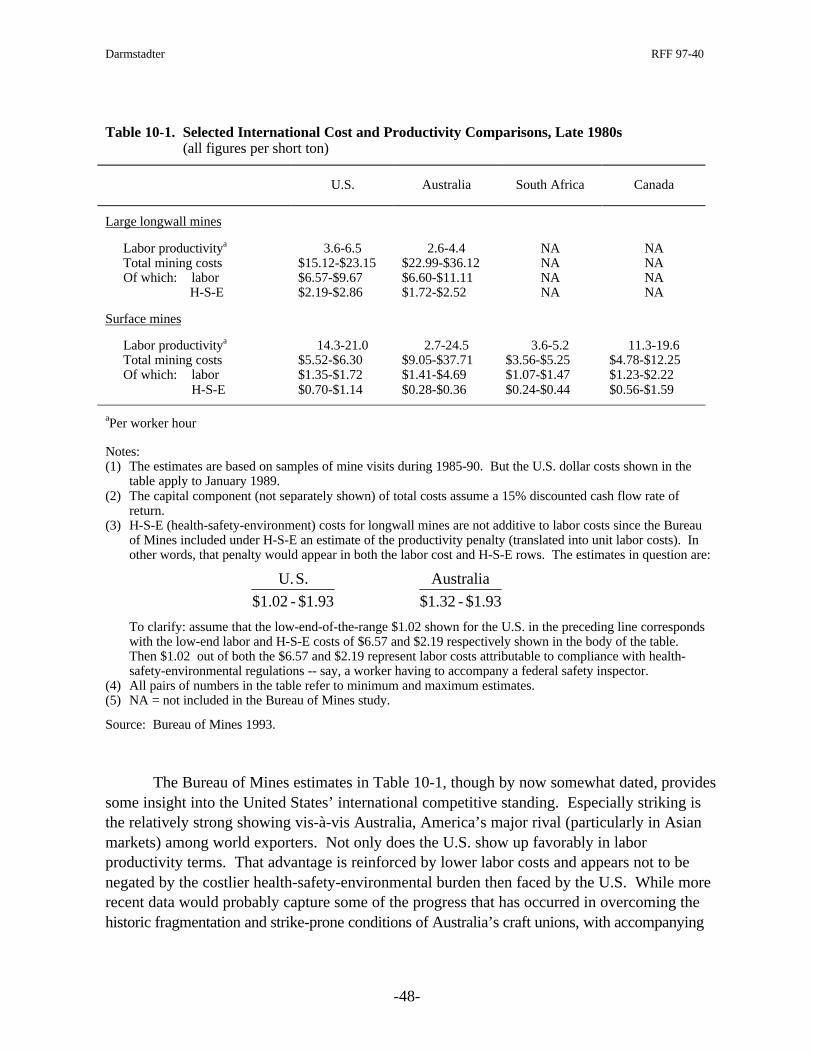
Darmstadter RFF 97-40
-48-
Table 10-1. Selected International Cost and Productivity Comparisons, Late 1980s(all figures per short ton)
U.S. Australia South Africa Canada
Large longwall mines
Labor productivitya 3.6-6.5 2.6-4.4 NA NATotal mining costs $15.12-$23.15 $22.99-$36.12 NA NAOf which: labor $6.57-$9.67 $6.60-$11.11 NA NA H-S-E $2.19-$2.86 $1.72-$2.52 NA NA
Surface mines
Labor productivitya 14.3-21.0 2.7-24.5 3.6-5.2 11.3-19.6Total mining costs $5.52-$6.30 $9.05-$37.71 $3.56-$5.25 $4.78-$12.25Of which: labor $1.35-$1.72 $1.41-$4.69 $1.07-$1.47 $1.23-$2.22
H-S-E $0.70-$1.14 $0.28-$0.36 $0.24-$0.44 $0.56-$1.59
aPer worker hour
Notes:(1) The estimates are based on samples of mine visits during 1985-90. But the U.S. dollar costs shown in the
table apply to January 1989.(2) The capital component (not separately shown) of total costs assume a 15% discounted cash flow rate of
return.(3) H-S-E (health-safety-environment) costs for longwall mines are not additive to labor costs since the Bureau
of Mines included under H-S-E an estimate of the productivity penalty (translated into unit labor costs). Inother words, that penalty would appear in both the labor cost and H-S-E rows. The estimates in question are:
U.S.
$1.02 - $1.93
Australia
$1.32 - $1.93
To clarify: assume that the low-end-of-the-range $1.02 shown for the U.S. in the preceding line correspondswith the low-end labor and H-S-E costs of $6.57 and $2.19 respectively shown in the body of the table.Then $1.02 out of both the $6.57 and $2.19 represent labor costs attributable to compliance with health-safety-environmental regulations -- say, a worker having to accompany a federal safety inspector.
(4) All pairs of numbers in the table refer to minimum and maximum estimates.(5) NA = not included in the Bureau of Mines study.
Source: Bureau of Mines 1993.
The Bureau of Mines estimates in Table 10-1, though by now somewhat dated, providessome insight into the United States’ international competitive standing. Especially striking isthe relatively strong showing vis-à-vis Australia, America’s major rival (particularly in Asianmarkets) among world exporters. Not only does the U.S. show up favorably in laborproductivity terms. That advantage is reinforced by lower labor costs and appears not to benegated by the costlier health-safety-environmental burden then faced by the U.S. While morerecent data would probably capture some of the progress that has occurred in overcoming thehistoric fragmentation and strike-prone conditions of Australia’s craft unions, with accompanying
Darmstadter RFF 97-40
-49-
improvements in productivity, Australia’s labor practices appear still to undermine workerefficiency with a variety of benefits that raise unit labor costs. For example, Australian coalminers earn an average of 200 hours in annual leave and a maximum of 120 hours in sick leave,compared to 76 and 40 hours, respectively, in the U.S. Overall, “lost time” -- through suchleaves and other absences -- constitute a third of “potential annual work hours” in Australiacompared to a fifth in the U.S. (Walker 1996, p. 66).
Still, while the U.S. has spearheaded labor productivity advances in recent years,Australia has maintained a sufficiently close pace to remain very much within the front rankof world exporters. Though possessing little more than one-fifth the volume of U.S. reserves,that magnitude and technological sophistication for exploiting its coal resources (involving, inpart, direct investment by American firms) suggests that Australia is well positioned to sustainits important coal trading status.
While South Africa, Colombia, Canada, and several other countries are likely toremain important players in the coal trade, we have already alluded to the prospect of once-prominent coal producers -- notably Germany and Britain -- receding from major competitivecontention. But it is also a fact -- and Britain is a case in point -- that mines which survivefollowing closure of uneconomic and inefficient pits sheltered by subsidies compare favorablywith technologically advanced operations elsewhere. The volume of production from suchmodern facilities doesn’t add up to dramatic national totals, however.
A thorough analysis would evaluate the situation in and prospects of importantproducers like Russia and China. But those countries have yet to shed the legacy of theirdistorted pricing and incentive structure under Communism and therefore cannot easily beanalyzed as to their viability under free-market circumstances. Even Poland, relatively faralong towards economic reform among the former centrally-planned countries, is still in theprocess of closing uneconomic mines and transitioning to free markets.
Notwithstanding the retreat of Britain and Germany from major internationalsignificance -- the inexorable result of unfavorable geological conditions -- it is something of aparadox that numerous developments ensuring technologically advanced and safer miningpractices among today’s leading producers were, and, indeed, continue to be, innovated bythese dominant coal powers of an earlier period. Longwall mining, for example, wasbeginning to replace room-and-pillar extraction methods in Britain during the early decades ofthe twentieth century -- a period during which it was practiced on only a small scale in the U.S.The emergence of longwall mining in Britain and elsewhere in Europe was dictated by gradualincreases in working depths to levels where the large pillar requirements of room-and-pillartechniques became increasingly costly (Walker 1996, Chapter 3). Advances in face conveyorequipment developed by Germans after World War II was another important milestone forspurring longwall adoption in the U.S. Bucket wheel excavator technology developed forGerman lignite extraction is now employed in the Texas lignite industry. It has also beenargued that Europe’s concern with mine safety -- e.g. methane drainage -- preceded, and helpedintensify, such concern in the U.S. Additionally, according to the GAO, as of the latter 1970s,“European miners are given considerably more safety and skill training in more facets of
Darmstadter RFF 97-40
-50-
mining. This increases safety and reduces the disruptive effects of absenteeism. Similar levelsof training for U.S. miners may be warranted on safety and productivity grounds” (GAO 1981,pp. vii-viii). Strides over the past several decades in health and safety practices in U.S. coalmining have, of course, been significant, as discussed earlier in Section 4. But in assigningcredit for such improvements in health and safety as well as in technological progress, theforeign influence deserves to be kept in mind.
That said, the 1996 IEA Coal Research study concludes that, with respect to longwallextraction, all “the evidence clearly indicates that ... mines in the United States have gained asignificant advantage over comparable operations elsewhere” (Walker 1996, p. 71). To besure, U.S. coal achieves some of its comparative advantage from favorable geologicconditions. (In contrast, the progressive deterioration in the quality of U.S. copper ores putsall the more burden on advances in extractive technologies in that industry, as the RFFcompanion study clearly shows; see Tilton and Landsberg 1997.) But there is more to it thanthe good fortune of the U.S. possessing vast and prolific coal seams. Walker credits the U.S.with a twofold set of technological achievements: at a general level, impressive techniques ofquality control and sophisticated management information systems; at a more specific level,efficient coal handling and conveyor systems capable of maintaining “sustained peak faceoutput without [being] a bottleneck in the process, as has often occurred elsewhere in the past.As a result, longwall mines typically can achieve utilization factors [i.e. the proportion ofavailable time that cutting and other machinery is actually operating] of over 60% comparedto the maximum of 50-55% attained in Australia, and around 40% in the United Kingdom”(p. 72).
11. PRODUCTIVITY PROSPECTS AND ISSUES
Compared to the record over the period 1980-95, the projection of labor productivityto the year 2015 is, as EIA sees it in its recent energy forecasting exercise (EIA 1996D,pp. 67-71), in for a fairly sharp deceleration in the rate of growth -- particularly toward the endof the period and particularly in the case of eastern, low-sulfur mines facing the need to exploitprogressively thinner and deeper coal seams.18 Over the two decades as a whole, EIA projectsnational labor productivity to improve at an annual rate of 3.3 percent. While this is about halfthe rate achieved during 1980-95, it is not far off the productivity pace achieved in bothEastern and Western coal over the period 1950-95. Keep in mind, in this connection, that thelatter period was one that included a decisive shift of coal production from East to West which-- given the West’s much higher productivity levels -- yielded a national rate of productivityimprovement exceeding that achieved by either of the two major producing regions. Althoughsome shift from Eastern to Western production is expected to endure, it is projected to be much
18 The implication that resource constraints (i.e. rising real costs) may start being felt in these regions illustrateshow aggregate recoverable reserve estimates, such as those introduced in Section 7, have to be taken with a grain ofsalt, notwithstanding their definitional characterization as producible at today’s prices and technological conditions.
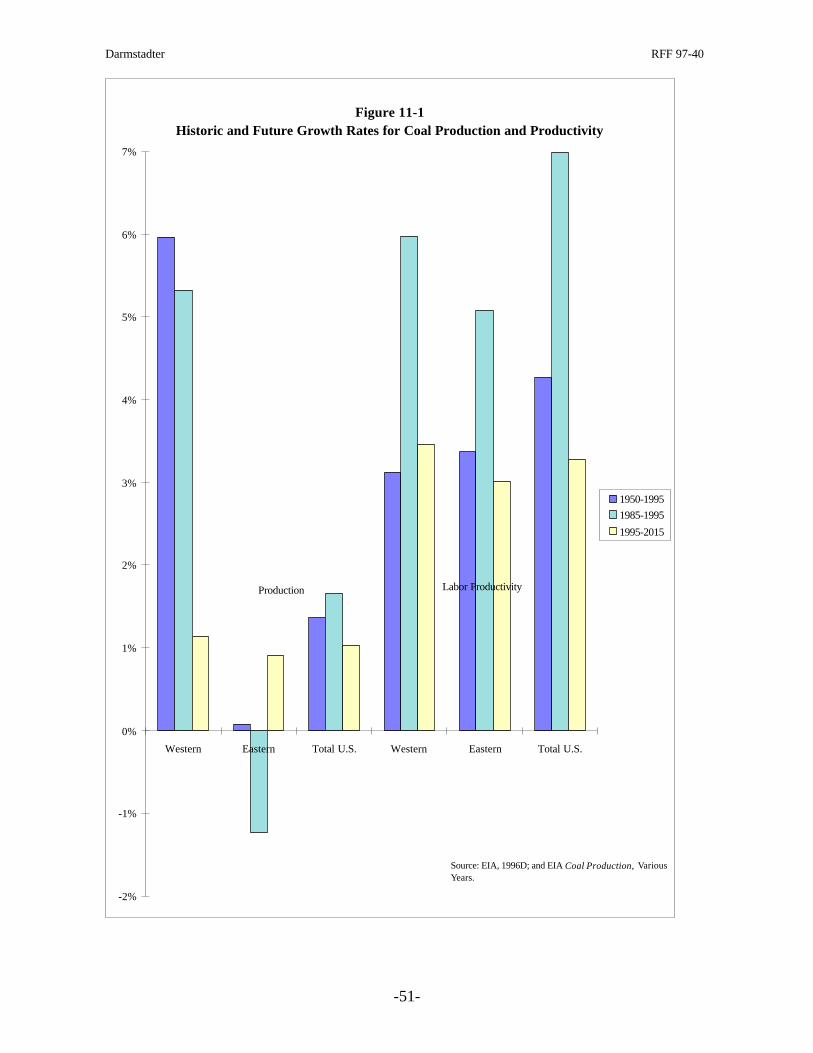
Darmstadter RFF 97-40
-51-
Figure 11-1 Historic and Future Growth Rates for Coal Production and Productivity
-2%
-1%
0%
1%
2%
3%
4%
5%
6%
7%
Western Eastern Total U.S. Western Eastern Total U.S.
1950-1995
1985-1995
1995-2015
Production Labor Productivity
Source: EIA, 1996D; and EIA Coal Production, Various Years.
Darmstadter RFF 97-40
-52-
less pronounced than in the past. In short, judged in a long-term context, rather than theexperience since emergence from the dismal 1970s, a 3.3 percent rate of productivityimprovement is not only respectable but healthy enough, in EIA’s judgment, to sustain level,and even some decline in, real coal prices. (See Figure 11-1.)
EIA’s “Reference Case” shows real coal prices not only retaining their competitiveadvantage relative to oil and gas, but for that advantage to increase with time. On a Btu basis,the U.S. minemouth coal price stood at 30% of the world oil price in 1995. By 2015, it isprojected to fall to 20% percent (and still no higher than 30% in the event of a drastic fall inthe price of oil). Of course, a decisive price edge is necessary, but far from a sufficientcondition, for coal to enjoy significantly expanded markets. In that respect, EIA foresees aslightly declining share (though a modest absolute increase) in electricity generation andfairly robust growth in exports.
Given the prospective rate of improvement in coal mine labor productivity,accompanied by stable or declining coal prices, one can surmise that, implicitly, total factorproductivity will continue to rise as well, though, as in the historical case, below rates of laborproductivity improvement. Reinforced by a continued decline in labor demand, inflation-adjusted wage rates remain basically flat.
Little is said by EIA on the extent to which technological and other factors that havesupported productivity advance in the past, will remain equally significant driving forces inthe future. For example, might diseconomies of scale emerge, dampening the contribution oflongwalls and draglines to productivity growth? It is also worth asking whether the long-termmarket outlook for coal is certain enough to generate the requisite capital investments even ifthe outlook for such technologies remains promising. In this respect, environmentaluncertainties may be the biggest factor clouding the investment picture. Although minemouthcoal prices are, as noted, likely to compete favorably with petroleum, pollution controlrequirements may justify, on the basis of capital and nonfuel operating cost considerations,utility decisions to opt for gas- rather than coal-fired generation. Judgments about thelikelihood of CO2 emission limitations will presumably enter into the industry’s strategicplanning, as will considerations about access to coal-bearing public lands. But there are nodoubt targets of opportunity as well. For example, the need to begin replacingdecommissioned nuclear capacity early in the twenty-first century, and the potential increasein coal-fired electric utility plants in a competitive electricity market, may strengthen coal’slong-term market prospects.
Although health and safety statutes and practices have reduced coal mine injury andfatality rates in recent decades, health and safety conditions will undoubtedly be a source ofenduring concern. In the past, even industry representatives credited the U.S. Bureau ofMines for research that contributed importantly to that improved record. It isn’t clear whatthe Bureau’s 1996 demise signifies for future health and safety research. While the finallocation of the remnants of the Bureau of Mines has not been determined, the expectation isthat three of the pre-1996 research centers will be incorporated into the USGS or MSHA. Thelargest coal companies have the resources, and possibly the motivation, to pick up some of the

Darmstadter RFF 97-40
-53-
slack. But, as an “information externality,” whose benefits are not easily appropriable, and anindustry where there is very little inter-firm interaction to diversify risk, the presumption thatsuch research will become a willing responsibility of the private sector may or may not beborne out.
Darmstadter RFF 97-40
-54-
12. BIBLIOGRAPHY
Attanasi, Emil D. and Dudley D. Rice. 1995. “Economics and Coalbed Gas in the 1995Assessment of U.S. Oil and Gas Resources,” USGS Open File Report 95-75A.
Bohi, Douglas R. 1997. Changing Productivity in U.S. Petroleum Exploration andDevelopment, forthcoming, Resources for the Future, Washington, D.C.
Bureau of Mines (U.S. Department of the Interior). Various years. Minerals Yearbook.
Bureau of Mines. 1993. A Cost Comparison of Selected Mines from Australia, Colombia,South Africa, and the United States, Special Publication, August.
Coal magazine. Various issues.
CONSOL, Inc. 1980. “Cost/Benefit Analysis of Deep Mine Federal Safety Legislation andEnforcement,” December.
Denison, Edward F. 1985. Trends in American Economic Growth, 1929-1982, Washington,Brookings Institution.
DOE (U.S. Department of Energy). 1979. Determinants of Coal Mine Productivity Change,DOE/IR/0056, Study Prepared by Oak Ridge Associated Universities, for U.S.Departments of Energy and Labor, November.
EIA (Energy Information Administration, U.S. Department of Energy). 1997. InternationalEnergy Annual 1995, January.
EIA. 1996A. Annual Energy Review 1995, DOE/EIA-0384 (95).
EIA. 1996B. U.S. Coal Reserves: A Review Update, DOE/EIA-0529 (95), August.
EIA. 1996C. U.S. Crude Oil, Natural Gas, and Natural Gas Liquids Reserves 1994.
EIA. 1996D. Annual Energy Outlook 1997, December.
EIA. 1995A. Energy Policy Act. Transportation Rate Study: Interim Report on CoalTransportation.
EIA. 1995B. Longwall Mining, DOE/EIA-TR-0588, March.
EIA. 1995C. Coal Data: A Reference, DOE/EIA-0064 (93), February.
EIA. 1993. The Changing Structure of the U.S. Coal Industry: An Update.
EIA. 1992. The U.S. Coal Industry, 1970-1990: Two Decades of Change.
EIA. Various years. Performance Profiles of Major Energy Producers.
EIA. Various years. Coal Industry Annual.
EIA. Various years. Coal Production.
Ellerman, A. Denny and Ernst Berndt. 1996. “An Initial Analysis of Productivity Trends inthe American Coal Industry,” Preliminary draft manuscript, MIT.
Energy Modeling Forum. 1978. Coal in Transition: 1980-2000, Vols. 1-2, StanfordUniversity, pp. E-17, E-21.
Darmstadter RFF 97-40
-55-
EPA. 1995. “Economic Assessment of the Potential for Profitable Use of Coal MineMethane: Case Studies of Three Hypothetical U.S. Mines,” EPA/430-R-95-006, May.
GAO (U.S. General Accounting Office). 1981. Low Productivity in American Coal Mining:Causes and Cures, EMD-81-17, March 3.
Gordon, Richard L. 1975. U.S. Coal and the Electric Power Industry, The Johns HopkinsUniversity Press, for Resources for the Future.
GRI (Gas Research Institute). 1995. “Drilling and Production Statistics for Major U.S.Coalbed Methane and Gas Shale Reservoirs, prepared for GRI by Advanced ResourcesInternational, December.
GRI. 1993. “Coalbed Methane: A Large and Growing Resource,” Executive Research Letter,February.
Hobbs, G.W., J.R. Holland, and R.O. Winkler. 1992. “Economic Model Predicts Coal-BedMethane Development,” Petroleum Engineer International, July, pp. 34-39.
Mining Engineering magazine. Various issues.
MSHA (Mine Safety and Health Administration, U.S. Department of Labor). Electronic file.“Mine Accident, Injury, Illness, Employment, and Coal Production Statistics.”
Mutmansky, J.M. and others. 1992. “Cost Comparisons,” in SME Mining EngineeringHandbook, 2nd Edition, Vol. 2, Littleton CO, p. 2080.
Organiscak, J.A. and others. 1996. “Health and Safety Implications of U.S. SemiautonomousLongwall Operations,” Paper presented atg SME Annual Meeting, Phoenix AZ, PreprintNo. 96-51, March 11-14.
ORNL/RFF. 1994. Fuel Cycle Externalities: Analytical Methods and Issues, Oak RidgeNational Laboratory, Chapter 14.
Parry, Ian W.H. 1997. Productivity Trends in the Natural Resource Industries, RFFDiscussion Paper.
Pippenger, Jack. 1995. “Competing With the Big Boys: Productivity and Innovation At theFreedom Lignite Mine,” Mining Engineering, April, pp. 333-45.
Sanda, Arthur P. 1991. “Longwall Automation Progresses Slowly,” Coal, May, pp. 47-49.
Schurr, Sam H. and Bruce C. Netschert. 1960. Energy in the American Economy, 1850-1975:Its History and Prospects, Johns Hopkins, for RFF.
Tilton, John E. and Hans H. Landsberg. 1997. “Productivity Growth and the Survival of theU.S. Copper Industry,” RFF, preliminary draft, March.
Walker, S. 1996. Comparative Underground Coal Mining Methods, London, IEA CoalResearch, March.
Wall Street Journal. 1997. “Regional Railroad Plans Big Expansion,” June 9, pp. A2, A8.
White, Lane. 1995. “Advanced Technologies and Loading Shovel Design,” MiningEngineering, April, p. 341.
Wiebmer, John. 1994. “Mining Equipment Into the 21st Century,” Mining Engineering, June.