Embed Size (px)
DESCRIPTION
Â
Citation preview
Journal of Economics and Sustainable Development www.iiste.org
ISSN 2222-1700 (Paper) ISSN 2222-2855 (Online)
Vol.4, No.4, 2013
106
Productivity and Technical Efficiency of Cocoa
Production in Eastern Ghana
Justina Adwoa Onumah1*
, Ramatu Mahama Al-Hassan2, Edward Ebo Onumah
2
1. CSIR-Science and Technology Policy Research Institute, P.O. Box CT 519, Cantonments, Accra-Ghana
2. Department of Agricultural Economics and Agribusiness, University of Ghana, P.O. Box LG 68, Legon –
Ghana
* E-mail of corresponding author: [email protected]
Abstract
This paper analyzes the productivity, technical efficiency and its determinants among cocoa producers in the
Eastern region of Ghana. A multi-stage random sampling technique is used to obtain a cross sectional data on
190 respondents. The stochastic frontier model is adopted to analyze the research objectives. The results reveal
that productivity level of cocoa responds positively to land size, the level of agrochemical, labour and
intermediate input used. However, productivity responds negatively to the increasing age of the cocoa trees.
Cocoa producers in the region exhibit decreasing returns to scale. The mean technical efficiency among the
cocoa producers is estimated to be 85%, indicating that the possibility of enhancing production given the present
state of technology and input level can be achieved in the short run by increasing technical efficiency by 15%
through adoption of practices of the best cocoa farm. Exogenous factors such as access to extension services,
technical support and credit are found to reduce the level of technical inefficiency among the producers. Also
older farmers and male farmers are efficient than younger and female farmers. Farmers with more experience
in cocoa production also produce with technical efficiency.
Key words: Cocoa, productivity, technical efficiency, stochastic frontier, Ghana
1.0 Introduction
1.1 Background and Problem Statement
Cocoa is one of the major foreign exchange earners for some African countries, such as Ghana, Cote d’Ivoire,
Nigeria, and Cameroon. About 70% of the world supply of cocoa originates from Africa, and Ghana is the
second largest world producer and supplier of cocoa after Cote d’Ivoire (Nkamleu et al., 2010). The cocoa sector
in Ghana employs over 800,000 smallholder farm families, providing employment, income and a major source
of foreign exchange for the country. Out of the 38% contributed by the agricultural sector to foreign exchange
earnings in 2008, the cocoa sector constituted 28.5% compared to 5.9% and 3.6% contributed by timber and the
non-traditional export sectors, respectively (ISSER, 2008). The farm size is relatively small, ranging from 0.4 to
4.0 hectare with an estimated total cultivation area of about 1.45 million hectares (Anim-Kwapong and
Frimpong, 2005).
Productivity in the agricultural sector has been considered important to the development process. Productivity
and efficiency improvements allow agrarian countries to produce more food at lower cost, and permit the release
Journal of Economics and Sustainable Development www.iiste.org
ISSN 2222-1700 (Paper) ISSN 2222-2855 (Online)
Vol.4, No.4, 2013
107
of resources to other sectors of the economy. Efficient resource utilization is sometimes hindered by the problem
of limited access to resources together with the difficulty in the appropriate use of resources for production. The
level of managerial and technical skills, level of capital utilization, commitment of labour force and the
technology in use are some of the factors influencing resource use efficiency (Okezie and Okoye, 2006).
Efficient use of resource is needed for cocoa producers to achieve their full productivity potential in order to
bridge the imbalances of global demand and supply.
Cocoa yield in Ghana is about 400kg of cocoa per hectare whereas the potential has been estimated to be a
1000kg per hectare (Barrietos et al., 2008). The average yield of 400kg/ha compared to countries like Cote
d’Ivoire, Cameroon and Nigeria puts Ghana as performing below its potential (Binam et al., 2008). This
suggests that there is a need to develop interventions that will aim at boosting the productivity levels in cocoa
production in the country. In a bid to enhance cocoa yield and productivity, the government of Ghana in
consultation with other stakeholders, designed the Cocoa Sector Development Strategy (CSDS) in 1991. Under
the strategy, cocoa production was projected to increase from 335,000 tonnes in 1991 to about 500,000 tonnes by
2004/2005 and then to 700,000 tonnes by 2009/2010. In 2010/2011 cocoa production in Ghana increased to
1,000,000 tonnes. However, this level has not been sustainable as it has been fluctuating. It is believed that this
increase in the level of cocoa output has been attributed to a number of interventions including, the Cocoa
Hi-tech initiative programme and increase in land size for cocoa production. This therefore raises the question of
whether higher productivity and technical efficiency levels can be achieved in the cocoa sector with the
introduction of these interventions. This paper generally analyzes the efficiency levels of cocoa producers in the
Eastern region of Ghana. Specifically the levels of productivity and technical efficiency are estimated and the
determinants of technical inefficiency are also identified and discussed.
2.0 Materials and Methods
2.1 Study Area, Data and Sampling Procedure
The underlying study of this paper was carried out in the Eastern region of Ghana which is one of the highest
cocoa producing regions in the country. The region covers a total land area of 19,323 square kilometers
representing 8.1% of the total land area in Ghana. The major economic activities are agriculture and related work
(54.8%), sales/trade (14.3%), production, transport and equipment (14.0%), professional and technical work
(6.9%) and service (5.0%). The soil type is that of savannah and supports the cultivation of crops such as cocoa,
cola-nuts, citrus and oil palm, pineapple, and cassava In the 2009/2010 cocoa production season, the region
produced about 60,000 metric tonnes of cocoa (www.ghanadistricts.org).
The study used cross sectional data from three cocoa producing districts in the Eastern region of Ghana. The
districts were the Fanteakwa District, Suhum-Kraboa-Coaltar District and the East Akim Municipality.
Consideration of the districts was based on the concentration of cocoa farms in these districts. Four communities
were then selected randomly from each district. The number of respondents selected from the communities was
based on the number of farms in each community. A list of farmers was obtained from the local offices of the
Ghana Cocoa Board (COCOBOD) to aid this process. A total of 190 farmers were randomly selected from the
list provided. A well structured questionnaire was administered to capture data on socio-economic characteristics
of the cocoa farmers, and the levels of their production inputs and output.
Journal of Economics and Sustainable Development www.iiste.org
ISSN 2222-1700 (Paper) ISSN 2222-2855 (Online)
Vol.4, No.4, 2013
108
2.2 Method of Analysis
2.2.1 Analytical Technique
The stochastic frontier Analysis (SFA) model adopted for this study allows for the decomposition of the error
term into random error and inefficiency error rather than attributing all errors as random effects. In stochastic
frontier analysis the firm or farm is constrained to produce at or below the deterministic production frontier. The
approach is preferred for efficiency studies in agriculture because of the inherent stochastic nature of the
agricultural systems (Ezeh, 2004; Coelli, 1995). The SFA was first proposed simultaneously by Aigner et al.
(1977) and Meeuseen and Van Den Broeck (1977) and it is specified for a cross section as:
( ; ).exp( ), 0i i i i iQ f X v u uβ= − ≥ (1)
Where: Qi is the production of the ith
firm, Xi, vector of input quantities of the ith
firm, β, vector of unknown
parameters to be estimated; vi is assumed to account for random effects on production that is not within the
control of the producer and ui is a non-negative error term measuring the technical inefficiency effects that fall
within the control of the decision unit.
The SFA has been used currently by authors like Onumah and Acquah (2010), Onumah et al. (2010), Nyagaka
et al. (2010), Park and Lohr (2010) Dzene (2010), Nchare (2007) and Ogundari and Ojo (2007) and the approach
specifies technical efficiency as the ratio of the observed output to the frontier output as shown in model (2):
( ; ) exp( )
exp( )( ; ).exp( )
i i ii
i i
f X v uTE u
f X v
ββ⋅ −
= = −−
(2)
Where ( ; ) exp( )i i if X v uβ ⋅ − is the observed output and ( ; ).exp( )i if X vβ − . Following Battesse and
Coelli (1995), the error term, vi is assumed to be identically, independently and normally distributed with mean
zero (0) and a constant variance σv2;
2{ (0, )}i vv N σ� . The error term, ui is also assumed to be distributed as a
truncation of the normal distribution with mean µi and variance, 2
uσ ; 2{ ( , )}i i uu N µ σ�
such that the
inefficient error term is explained by some exogenous variables specified as
i iZµ δ= (3)
Where Zi is a vector of exogenous variables δ is a set of unknown parameters to be estimated.
In this research, the single-stage maximum likelihood estimation method is used in estimating the technical
efficiency levels of the producers and the effects of the determinants of inefficiency simultaneously. This
simultaneous estimation procedure ensures that the assumption of identical distribution of the ui is not violated.
The maximum likelihood estimation of the frontier model yields the estimates of β and the gamma (γ), where the
γ measures the total variation of observed output from the frontier (deterministic) output. It is given as the ratio
Journal of Economics and Sustainable Development www.iiste.org
ISSN 2222-1700 (Paper) ISSN 2222-2855 (Online)
Vol.4, No.4, 2013
109
of the variance of the error associated with inefficiency (σu2) to the overall variation in the model (σ
2). The
overall variation of the model is the sum of the variance of the error associated with inefficiency (σu2) and that
associated with random noise factors (σv2). The gamma estimate is expressed given as:
2
2
uσγσ
= where the γ
lies between zero and one (0 ≤ γ ≤ 1). The closer the value is to 1, the more the deviation of observed output
from the frontier is as a result of inefficient factors; if the value is close to 0 then deviations are as a result of
random factors. If the value lies in-between 1 and 0, then the deviation may be attributed to both random and
inefficient factors.
2.2.2 Model Specification
The translog production function stated in model (4) is assumed for the study. It is a flexible functional form
which places no restriction on the elasticity of production unlike the Cobb-Douglas model. The translog function
has been proven by other studies to be efficient for technical efficiency (Onumah and Acquah, 2010; Baten et al.,
2009).
5 5 5
1 1 1
1( )
2i o i i ij i j i i
i i j
LnQ Ln LnX LnX LnX v uβ β β= = =
= + + + −∑ ∑∑ (4)
Where: Qi = the level of output (Kilograms), X1=Land size (hectares), X2=Labour (man-days), X3=Age of trees
(average age of farm in years), X4=Intermediate inputs (in GH¢), X5=Agrochemicals (liters).
To measure the productivity levels of each of the technologies, the partial elasticity of production with respect to
the individual inputs was computed from the translog production frontier model. The first order coefficients
in model (5) are interpreted as direct elasticities since the variables were rescaled to have unit means.
1
ln ( )ln ln
ln
ni
q j jj ji jk ki j
iji
E QX X
Xε β β β β
=
∂ = = + + =
∂ ∑ (5)
Returns to Scale (RTS) is also computed from the production function. The RTS is the sum of the elasticities of
output for the various inputs, given as: qiRTS ε= ∑
Decision rule: RTS>1 implies increasing returns to scale, RTS<1 implies decreasing returns to scale and RTS=1
implies constant returns to scale.
The model to explain inefficiency is specified as follows:
0 1 1 2 2 3 3 4 4 5 5 6 6 7 7i Z Z Z Z Z Z Zµ δ δ δ δ δ δ δ δ= + + + + + + + (6)
The mean of the error term ui, is explained by socio economic characteristics of the producer and exogenous
factors. The variables are defined in the Table 1.
Journal of Economics and Sustainable Development www.iiste.org
ISSN 2222-1700 (Paper) ISSN 2222-2855 (Online)
Vol.4, No.4, 2013
110
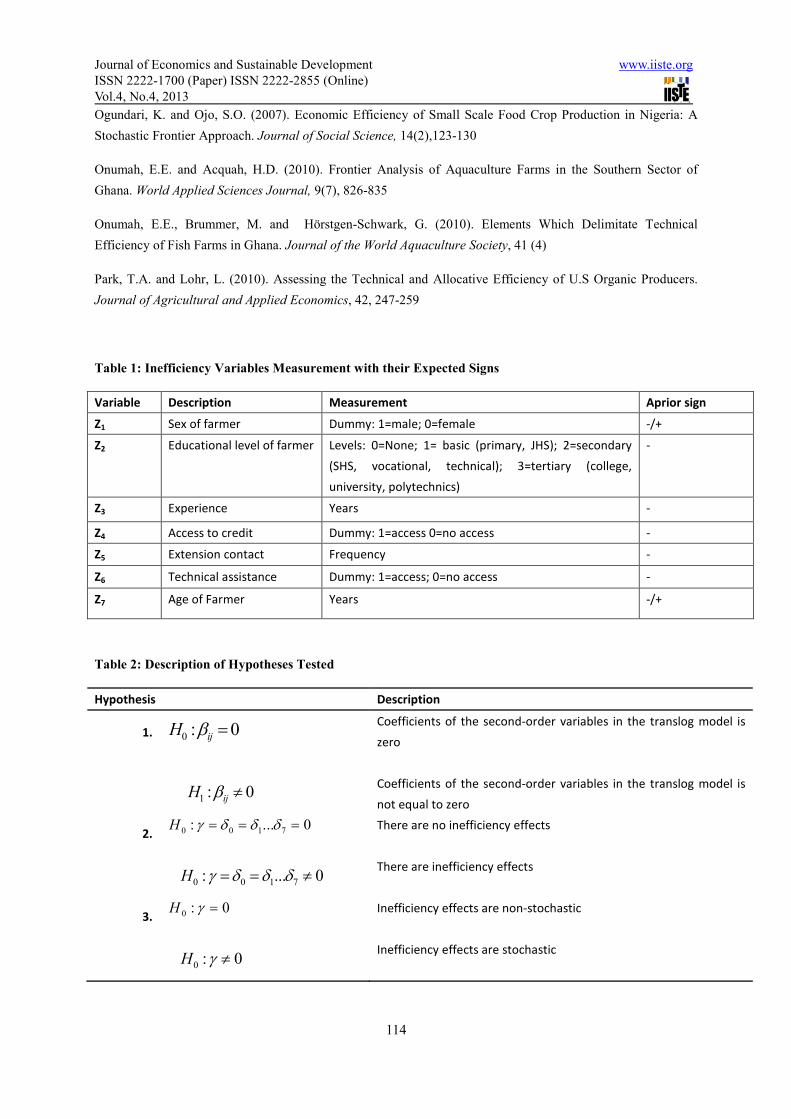
2.3 Hypotheses Tested
A number of hypotheses were tested to examine the adequacy of the specified model used, the presence of
inefficiency and relevance of exogenous variables to explain inefficiency among the producers. Table 2 lists the
hypotheses tested. The Generalized Likelihood ratio statistic was used to test the hypotheses. It is given as
[ ]0 1( ) 2 {ln ( )} {ln ( )}LR L H L Hλ = − − (7)
0( )L H
and 1ln ( )L H
are the values of the likelihood functions derived from the restricted and un-restricted
model (Null and Alternate hypothesis respectively). This has a chi-square distribution with degrees of freedom
equal to the difference between the number of estimated parameters under the H1 (unrestricted model) and H0
(restricted model). However, where the test involves a γ, then the mixed chi-square distribution is used. The H0 is
rejected when the estimated chi-square was greater than the critical.
3.0 Results and Discussion
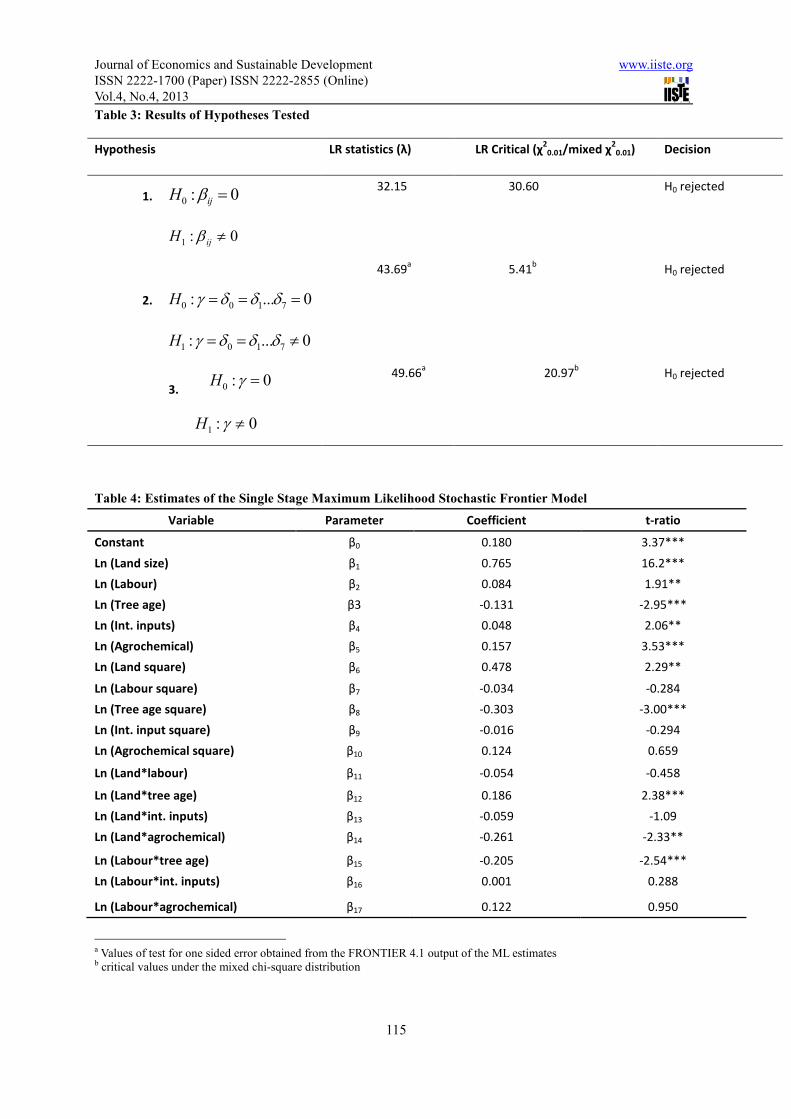
3.1 Hypotheses tested
Table 3 demonstrate that the decision to use the Cobb-Douglas model was rejected in favour of the translog since
the LR statistics for all models were greater than the critical. This indicates that the results from the translog
model are more accurate and consistent compared to that from the Cobb-Douglas model. The result of the
second hypothesis reveal that the stochastic production function had a better fit to the data than the average
production response function. The findings of the third hypothesis suggest that inefficiency effects are present in
the model and so the decision to preclude them was rejected. Similar results have been obtained by Onumah et
al. (2010).
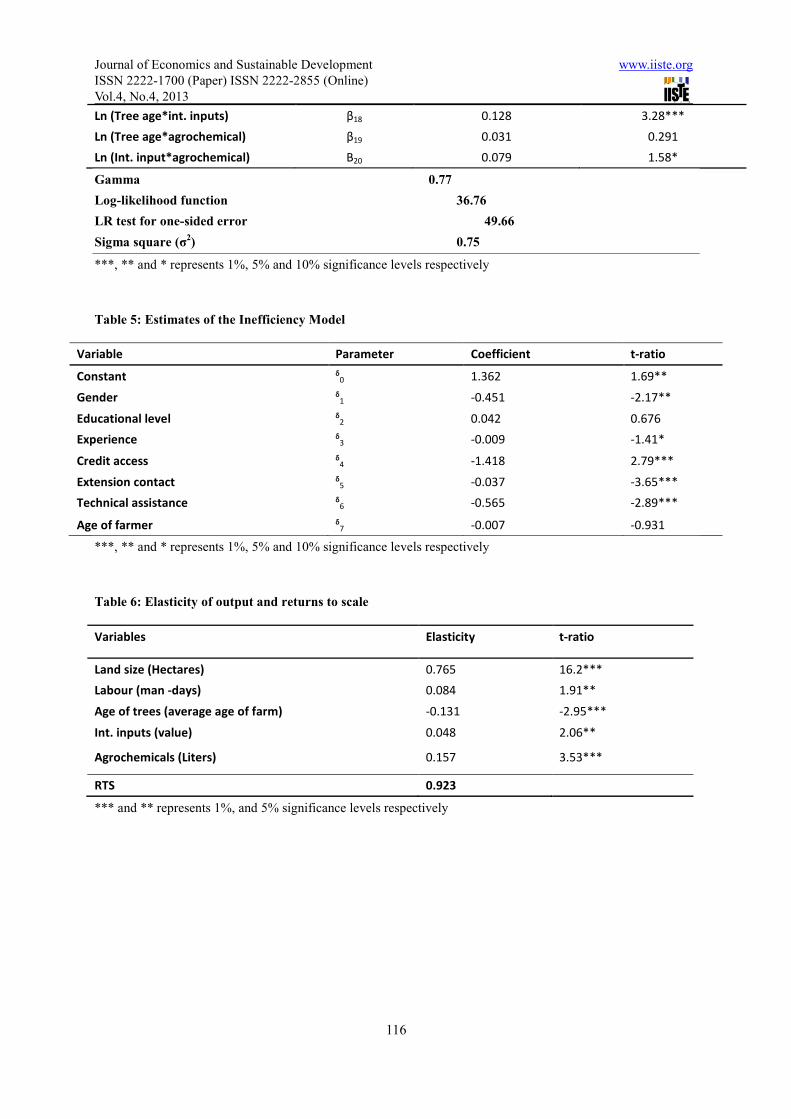
3.2 Results of the Frontier Model
The gamma was estimated to be 0.77. This implies that most of the deviations in total output are largely as a
result of inefficiency in input use and other farm practices, whereas random factors contribute 23% to deviations
of actual output from the frontier output. Some of the random shocks could be unfavorable weather conditions,
pest and disease infestation and statistical errors in data measurement and model specification. The parameter
estimates of the frontier model are presented in Table 4.
3.2.1 Productivity Estimates
The productivity estimates are explained in terms of output elasticities. Output responded positively to all inputs
(land size, labour, agrochemical, intermediate inputs) used except average age of the cocoa trees. Table 6
demonstrates that a percentage increase in land size, labour, intermediate inputs and agrochemical results in a
0.77%, 0.08%, 0.05% and 0.15% increase in cocoa output, respectively. However, a percentage increase in the
age of the trees results in a 0.13% decrease in output. Similar results have been obtained by Danso-Abeam et al.
(2012) and Aneani et al. (2011). The computed return to scale is revealed to be 0.93 (Table 6) which implies that
the cocoa producers in the study area exhibit decreasing returns to scale. This means that with a percentage
increase in all inputs used, output or productivity increased by 0.93% which is less than the proportionate
increase in the factor inputs. This can be attributed to poor management of the farms as farmers may not be
Journal of Economics and Sustainable Development www.iiste.org
ISSN 2222-1700 (Paper) ISSN 2222-2855 (Online)
Vol.4, No.4, 2013
111
improving upon management the same way they are increasing the level of inputs used in production or probably
the scale of operation may be too large for them to manage.
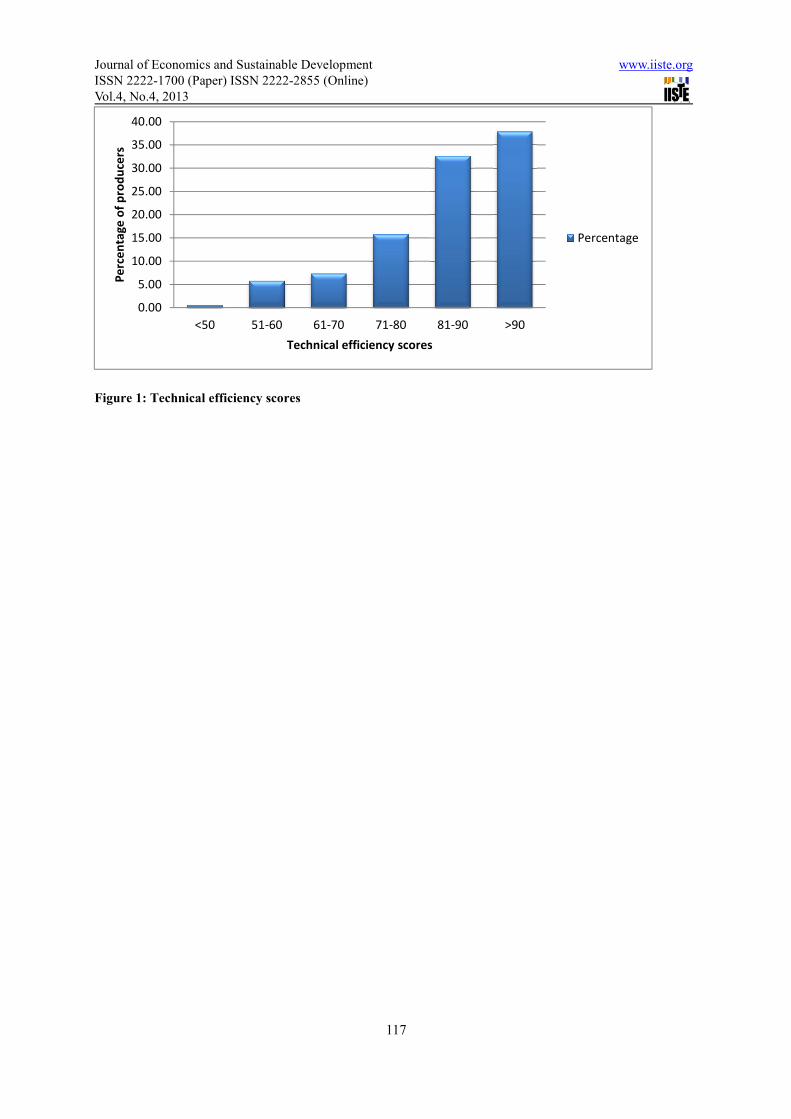
3.2.2 Level of Technical Efficiency
Findings show that majority (37.89%) of the producers operated with technical efficiency levels of 81-90%
whilst 32.63% operated with technical efficiency index of 90% and above (Figure 1). However, few (6.32%) of
them had technical efficiency scores below 60%. The analysis further illustrates that the mean technical
efficiency of the cocoa producers in the study area is 85% as compared to 49% obtained in a study by
Danso-Abeam et al. (2012) in parts of Western Ghana. This implies that on the average, cocoa producers in
Eastern Ghana are 15% below the best practice frontier output given the existing technology and the available
input in the region. This further implies that if the producers have to achieve a 100% technical efficiency level,
then they will have to bridge the gap between their current performance level and the maximum potential
performance of the cocoa industry, by addressing some inefficiency factors discussed in the next sub heading.
3.3 Determinants of Technical Inefficiency
The estimated level of technical efficiency among producers is not enough to derive recommendations for policy
intervention. It is also necessary to identify the sources of variation in the technical efficiency estimates among
the producers and quantify their effect. This was made possible by specifying an inefficiency model whose
regressors are exogenous factors related to the production unit. The results are presented in Table 5.
Male farmers across the sample are less inefficient compared to their female counterparts. Similar results were
obtained by Binam et al. (2008), Onumah and Acquah (2010), and Kibarra (2005). This result can be explained
by the fact that female farmers are most unlikely to attend agricultural extension meetings because of household
chores. Even when they are able to attend such meetings, they may be sidelined where their views and concerns
may not be taken into consideration. Moreover, male farmers may have easy access to credit considering the fact
that they own most assets in the household which could be used as collateral for accessing credit.
The number of years of experience in cocoa farming methods among the producers has negative influence on
technical inefficiency. Thus, with more years of experience, farmers are able to apply good practices to minimize
losses.
Consistent with studies of Binam et al. (2008) and Nyagaka et al. (2010), results of this study show that cocoa
producers who have access to credit are less technically inefficient than those who did not have access to
credit. This shows that credit accessibility is vital in improving the performance of cocoa producers. Interaction
with the farmers revealed that due to the costly nature of agrochemicals they usually take cash credit from the
cocoa purchasing clerk to purchase such inputs. Al-hassan (2012) obtained similar results in his studies on
smallholder paddy farmers in Ghana.
An increase in the number of extension contacts with cocoa specific messages is expected to improve farmers’
productivity and technical efficiency. The results show that farmers who had increased frequency of extension
visits produced with less inefficiency compared to farmers who had few contacts with extension agents. This
result is consistent with the study carried out by Nyagaka et al. (2010), Binam et al. (2008) and Al-hassan
(2012). This implies that effective extension visits and supervision will go a long way to improve farmers’
production efficiency. The Ghana Cocoa Board should be commended here in that the board recruited extension
Journal of Economics and Sustainable Development www.iiste.org
ISSN 2222-1700 (Paper) ISSN 2222-2855 (Online)
Vol.4, No.4, 2013
112
personnel specifically to meet the needs of cocoa producers in the country. Farmers interviewed were very
pleased with their services when compared with previous extension service delivery. This informs us that it is
not only the number of visits that matters but the content of the message carried to producers.
All producers interviewed belonged to one farmer group or the other. As a result, data was taken on producers
who had group support in terms of labour supply, information transfer and financial aid. Producers who had such
support were less technically inefficient compared to their counterparts who did not have any support at all. This
implies that it is not all about belonging to a farmer group but as to whether there is mutual benefit in terms of
providing support to each other in times of need or not. The results suggest that it is necessary for farmers in a
group to give themselves mutual support since it reduces technical inefficiency. Producers who are not in any
group are encouraged to form/join one.
4.0 Conclusion
With the general objective of estimating the levels of productivity and technical efficiency of cocoa producers in
the Eastern region of Ghana, the study has shown that cocoa productivity increases by less than proportionate
increase in all inputs except the average age of the tree. With Returns to Scale value of 0.93, cocoa producers in
the region can be described as exhibiting decreasing returns to scale and producing inefficiently since the mean
technical efficiency score is 85%. However they can be perceived as making efforts to produce with optimum
(100%) technical efficiency level since they are only 15% away from their maximum potential. In addition,
majority (70.52%) of the producers produced with technical efficiency scores above 80%, whilst only a few
(29.48%) produced below 80%. Access to credit, years of cocoa production experience, extension contacts and
group support were the factors found to reduce inefficiency among producers. Male farmers in the region were
also found to produce with less inefficiency than female farmers. It is recommended that the cocoa producers
adopt measures to improve upon their management skills on their farms. Some of the management issues may
include applying the right quantity of fertilizers and agrochemicals as recommended by the CSSVD (Cocoa
Swollen Shoot Virus Disease) control department and replacing aged cocoa trees with younger ones. Also cocoa
producers are encouraged to form help groups so they can provide assistance among themselves. Access to credit
should also be improved to ease some production constraints. Reaching famers with cocoa specific information
on how to improve their production practices through extension services is also imperative in reducing technical
inefficiency.
References
Aigner, D. J., C. A. K. Lovell, and Schmidt, P. (1977). Formulation and Estimation of Stochastic Frontier
Production Function Models. Journal of Econometrics Vol. 6:21–37.
Al-hassan S. (2012). Technical Efficiency in Smallholder Paddy Farms in Ghana: An Analysis Based on
Different Farming Systems and Gender. Journal of Economics and Sustainable Development Vol., 3, No.5, 2012
Aneani, F., Anchirinah, V.M., Asamoah, M. and Owusu-Ansah, F. (2011). Analysis of Economic Efficiency in
Cocoa Production in Ghana. African Journal of Food, Agriculture, Nutrition and Development, Vol. 11 No. 1
Anim-Kwapong, G.J. and Frimpong, E.B. (2005). Vulnerability of Agriculture to Climate Change: Impact of
Climate Change on Cocoa Production. Cocoa Research Institute, Ghana Cocoa Draft. Final Report.pdf
Journal of Economics and Sustainable Development www.iiste.org
ISSN 2222-1700 (Paper) ISSN 2222-2855 (Online)
Vol.4, No.4, 2013
113
Barrietos, S.W., Asenso-Okyere, K., Asuming-Brempong, S., Sarpong, D., Anyidoho, N.A., Kaplinsky, R. and
Leavy, J. (2008). Mapping Sustainable Production in Ghanaian Cocoa. A report to Cadbury by the Institute of
Development Studies and the University of Ghana
Baten, M.A., Kamil, A.A. and Haque, M.A. (2009). Modeling Technical Inefficiencies Effects in a Stochastic
Frontier Production Function for Panel Data. Africa Journal of Agricultural Research, 4(12), 1374-1382
Battese, G.E. and Coelli, T.J. (1995). A Model for Technical Inefficiency Effects in a Stochastic Frontier
Production Function for Panel data. Empirical Economics, 20(2), 325-32
Binam, J.N., Gockowski, J. and Nkamleu, G.B. (2008). Technical Efficiency and Productivity Potential of Cocoa
Farmers in West Africa Countries. The Developing Economics, XLVI-3, 242-63
Coelli, T.J. (1995). Recent Development in Frontier Modelling and Efficiency measurement. Australian Journal
of Agricultural Economics. 39, 219–45
Danso-Abbeam G., Aidoo R., Agyemang K. O. and Ohene-Yankyera K. (2012). Technical Efficiency in
Ghana’s Cocoa Industry: Evidence from Bibiani -Anhwiaso-Bekwai District. Journal of Development and
Agricultural Economics, Vol. 4(10), pp. 287-294
Dzene, R. (2010). What Drives Efficiency on the Ghanaian Cocoa Farm? Ghana Institute of Management and
Public Administration (GIMPA)
Ezeh C.I (2004). A Comparative Study of Fadama and Non-Fadama Crop Farmers in Osisioma-Ngwa L.G.A,
Abia State, Nigeria. Tropical Agricultural Research, pp11
GhanaDistricts (2011). Profile of Eastern Region. Accessed from http://www.ghanadistricts.org/region/?r=4 on
January 10th
2011
Institute of Statistical, Economic and Social Research (ISSER) (2008). The State of the Ghanaian Economy in
2008. University of Ghana, Legon
Kibarra, W.B. (2005). Technical Efficiency in Kenyan’s Maize Production: An Application of the Stochastic
Frontier Approach. MSc Dissertation, Colorado State University, Fort Collins, Colorado
Meeusen, W., and Van den Broeck, J. (1977). Efficiency Estimation from Cobb-Douglas Production Functions
with Composed Errors. International Economic Review, 18 (2), 435–444
Nchare, A. (2007). Analysis of Factors Affecting Technical Efficiency of Arabica Coffee Producers in
Cameroon. African Economic Research Consortium (AERC), Research Paper 163.
Nkamleu, G.B., Nyameck, J. and Gockowski, J. (2010). Technology Gap and Efficiency in Cocoa Production in
West and Central Africa: Implication for Cocoa sector Development. Working papers series No. 104, Africa
Development Bank, Tunis, Tunisia.
Nyagaka, D.O., Obare, G.A., Omiti, J.M. and Ngoyo, W. (2010). Technical Efficiency in Resource Use:
Evidence from Smallholder Irish Potato Farmers in Nyandaura North District, Kenya. Africa Journal of
Agricultural Research, 5(11),1179-1186
Journal of Economics and Sustainable Development www.iiste.org
ISSN 2222-1700 (Paper) ISSN 2222-2855 (Online)
Vol.4, No.4, 2013
114
Ogundari, K. and Ojo, S.O. (2007). Economic Efficiency of Small Scale Food Crop Production in Nigeria: A
Stochastic Frontier Approach. Journal of Social Science, 14(2),123-130
Onumah, E.E. and Acquah, H.D. (2010). Frontier Analysis of Aquaculture Farms in the Southern Sector of
Ghana. World Applied Sciences Journal, 9(7), 826-835
Onumah, E.E., Brummer, M. and Hörstgen-Schwark, G. (2010). Elements Which Delimitate Technical
Efficiency of Fish Farms in Ghana. Journal of the World Aquaculture Society, 41 (4)
Park, T.A. and Lohr, L. (2010). Assessing the Technical and Allocative Efficiency of U.S Organic Producers.
Journal of Agricultural and Applied Economics, 42, 247-259
Table 1: Inefficiency Variables Measurement with their Expected Signs
Variable Description Measurement Aprior sign
Z1 Sex of farmer Dummy: 1=male; 0=female -/+
Z2 Educational level of farmer Levels: 0=None; 1= basic (primary, JHS); 2=secondary
(SHS, vocational, technical); 3=tertiary (college,
university, polytechnics)
-
Z3 Experience Years -
Z4 Access to credit Dummy: 1=access 0=no access -
Z5 Extension contact Frequency -
Z6 Technical assistance Dummy: 1=access; 0=no access -
Z7 Age of Farmer Years -/+
Table 2: Description of Hypotheses Tested
Hypothesis Description
1. 0 : 0ijH β =
1 : 0ijH β ≠
Coefficients of the second-order variables in the translog model is
zero
Coefficients of the second-order variables in the translog model is
not equal to zero
2. 0 0 1 7: ... 0H γ δ δ δ= = =
0 0 1 7: ... 0H γ δ δ δ= = ≠
There are no inefficiency effects
There are inefficiency effects
3. 0 : 0H γ =
0 : 0H γ ≠
Inefficiency effects are non-stochastic
Inefficiency effects are stochastic
Journal of Economics and Sustainable Development www.iiste.org
ISSN 2222-1700 (Paper) ISSN 2222-2855 (Online)
Vol.4, No.4, 2013
115
Table 3: Results of Hypotheses Tested
Hypothesis LR statistics (λ) LR Critical (χ2
0.01/mixed χ2
0.01) Decision
1. 0 : 0ijH β =
1 : 0ijH β ≠
2. 0 0 1 7: ... 0H γ δ δ δ= = =
1 0 1 7: ... 0H γ δ δ δ= = ≠
32.15
43.69a
30.60
5.41b
H0 rejected
H0 rejected
3. 0 : 0H γ =
1 : 0H γ ≠
49.66a 20.97
b H0 rejected
Table 4: Estimates of the Single Stage Maximum Likelihood Stochastic Frontier Model
Variable Parameter Coefficient t-ratio
Constant β0 0.180 3.37***
Ln (Land size) β1 0.765 16.2***
Ln (Labour) β2 0.084 1.91**
Ln (Tree age) β3 -0.131 -2.95***
Ln (Int. inputs) β4 0.048 2.06**
Ln (Agrochemical) β5 0.157 3.53***
Ln (Land square) β6 0.478 2.29**
Ln (Labour square) β7 -0.034 -0.284
Ln (Tree age square) β8 -0.303 -3.00***
Ln (Int. input square) β9 -0.016 -0.294
Ln (Agrochemical square) β10 0.124 0.659
Ln (Land*labour) β11 -0.054 -0.458
Ln (Land*tree age) β12 0.186 2.38***
Ln (Land*int. inputs) β13 -0.059 -1.09
Ln (Land*agrochemical) β14 -0.261 -2.33**
Ln (Labour*tree age) β15 -0.205 -2.54***
Ln (Labour*int. inputs) β16 0.001 0.288
Ln (Labour*agrochemical) β17 0.122 0.950
a Values of test for one sided error obtained from the FRONTIER 4.1 output of the ML estimates b critical values under the mixed chi-square distribution
Journal of Economics and Sustainable Development www.iiste.org
ISSN 2222-1700 (Paper) ISSN 2222-2855 (Online)
Vol.4, No.4, 2013
116
Ln (Tree age*int. inputs) β18 0.128 3.28***
Ln (Tree age*agrochemical) β19 0.031 0.291
Ln (Int. input*agrochemical) Β20 0.079 1.58*
Gamma 0.77
Log-likelihood function 36.76
LR test for one-sided error 49.66
Sigma square (σ2) 0.75
***, ** and * represents 1%, 5% and 10% significance levels respectively
Table 5: Estimates of the Inefficiency Model
Variable Parameter Coefficient t-ratio
Constant ᵟ0 1.362 1.69**
Gender ᵟ1 -0.451 -2.17**
Educational level ᵟ2 0.042 0.676
Experience ᵟ3 -0.009 -1.41*
Credit access ᵟ4 -1.418 2.79***
Extension contact ᵟ5 -0.037 -3.65***
Technical assistance ᵟ6 -0.565 -2.89***
Age of farmer ᵟ7 -0.007 -0.931
***, ** and * represents 1%, 5% and 10% significance levels respectively
Table 6: Elasticity of output and returns to scale
Variables Elasticity t-ratio
Land size (Hectares) 0.765 16.2***
Labour (man -days) 0.084 1.91**
Age of trees (average age of farm) -0.131 -2.95***
Int. inputs (value) 0.048 2.06**
Agrochemicals (Liters) 0.157 3.53***
RTS 0.923
*** and ** represents 1%, and 5% significance levels respectively
Journal of Economics and Sustainable Development www.iiste.org
ISSN 2222-1700 (Paper) ISSN 2222-2855 (Online)
Vol.4, No.4, 2013
117
Figure 1: Technical efficiency scores
0.00
5.00
10.00
15.00
20.00
25.00
30.00
35.00
40.00
<50 51-60 61-70 71-80 81-90 >90
Pe
rce
nta
ge
of
pro
du
cers
Technical efficiency scores
Percentage
This academic article was published by The International Institute for Science,
Technology and Education (IISTE). The IISTE is a pioneer in the Open Access
Publishing service based in the U.S. and Europe. The aim of the institute is
Accelerating Global Knowledge Sharing.
More information about the publisher can be found in the IISTE’s homepage:
http://www.iiste.org
CALL FOR PAPERS
The IISTE is currently hosting more than 30 peer-reviewed academic journals and
collaborating with academic institutions around the world. There’s no deadline for
submission. Prospective authors of IISTE journals can find the submission
instruction on the following page: http://www.iiste.org/Journals/
The IISTE editorial team promises to the review and publish all the qualified
submissions in a fast manner. All the journals articles are available online to the
readers all over the world without financial, legal, or technical barriers other than
those inseparable from gaining access to the internet itself. Printed version of the
journals is also available upon request of readers and authors.
IISTE Knowledge Sharing Partners
EBSCO, Index Copernicus, Ulrich's Periodicals Directory, JournalTOCS, PKP Open
Archives Harvester, Bielefeld Academic Search Engine, Elektronische
Zeitschriftenbibliothek EZB, Open J-Gate, OCLC WorldCat, Universe Digtial
Library , NewJour, Google Scholar