Embed Size (px)
Citation preview
California Energy Commission
STAFF REPORT
Productivity and Status of Wind Generation in California 2014 Through 2016
California Energy Commission Gavin Newsom, Governor
February 2019 | CEC-200-2019-002

California Energy Commission
John Hingtgen
Diana Le
Brandon Davis
Brian Huang
Primary Authors
John Hingtgen
Project Manager
Michael Nyberg
Supervisor
SUPPLY DATA AND ANALYSIS UNIT
Rachel MacDonald
Office Manager
SUPPLY ANALYSIS OFFICE
Siva Gunda
Deputy Director
ENERGY ASSESSMENTS DIVISION
Drew Bohan
Executive Director
DISCLAIMER
Staff members of the California Energy Commission prepared this report. As such, it
does not necessarily represent the views of the Energy Commission, its employees,
or the State of California. The Energy Commission, the State of California, its
employees, contractors and subcontractors make no warrant, express or implied, and
assume no legal liability for the information in this report; nor does any party
represent that the uses of this information will not infringe upon privately owned
rights. This report has not been approved or disapproved by the Energy Commission
nor has the Commission passed upon the accuracy or adequacy of the information
in this report.

i
ACKNOWLEDGEMENTS
Jamie Schreader, John Vergara, and Mathew Prindle for data analysis and technical
support.
Paul Deaver, Mike Kane, and Mike Jaske for technical input.
Chris Wymer for research assistance.
David Werner, WindSim Americas Inc. for technical input.
Philippe Beaucage and Lisa Andrews, AWS Truepower, LLC for technical input and maps.
Richard Simon, Simon Wind Company, for technical input.
William Brown, William Denig, and Scott Stephens, National Oceanic and Atmospheric
Administration, for information.
John Roadcap and Gordon Wilson, United States Air Force, for information.

ii
ABSTRACT
This document was prepared to analyze and describe data collected through the Wind
Performance Reporting System of the California Energy Commission. The report
provides information to support the development of state energy policy, including
growth in the renewable energy portfolio, greenhouse gas reduction, planning for
natural gas generators, and reduction of water use.
The data cover wind generation and energy purchases from in-state wind projects with a
nameplate capacity of at least 1 megawatt (MW) from 2014 through 2016. Analyses on
capacities, energy produced, capacity factors, turbine numbers, generation operators,
specific power, and specific energy are provided within the report. The report also
examines differences among the Wind Resource Areas of California.
During this three-year period, the net energy produced averaged 13,000 gigawatt-hours
per year with a final capacity of 5,644 MW and a combined capacity factor of 26 percent.
Wind generation peaked in the second quarter of each year. The Tehachapi Wind
Resource Area was the largest of the six established wind resource areas in the state.
Statewide, the number of turbines decreased, especially in the Altamont area, while the
average capacity per turbine increased. Most wind energy was purchased by investor-
owned utilities.
Keywords: California wind generation, capacity, capacity factor, turbine numbers,
specific power, specific energy, wind resource areas, energy purchases, electricity
consumption, generation trends, regional variations, wind generation status
Please use the following citation for this report:
Hingtgen, John, Diana Le, Brandon Davis, and Brian Huang. 2019. Productivity and Status
of Wind Generation in California, 2014 Through 2016. California Energy
Commission. Publication Number: CEC-200-2019-002.

iii
iv
TABLE OF CONTENTS
Page
Acknowledgements .............................................................................................................................. i
Abstract ................................................................................................................................................. ii
Table of Contents ............................................................................................................................... iv
List of Figures ...................................................................................................................................... v
List of Tables ...................................................................................................................................... vii
Executive Summary ............................................................................................................................. 1 Background .......................................................................................................................................................... 1 Purpose .................................................................................................................................................................. 1 Take-Away Messages ......................................................................................................................................... 1
CHAPTER 1: Introduction .................................................................................................................. 3 Data Sources ................................................................................................................................. 3 Data Quality .................................................................................................................................. 4 Related Energy Policies............................................................................................................... 4 Offshore Wind Power ........................................................................................................................................ 5
CHAPTER 2: Statewide Capacity, Capacity Factors, and Generation ....................................... 7 Statewide Capacity ...................................................................................................................... 9 Statewide Capacity Factors ..................................................................................................... 10 Seasonal and Interannual Variability in Capacity Factors ................................................................... 14 Cyclical Nature of Capacity Factors ........................................................................................................... 15 Individual Project Capacity Factors............................................................................................................ 16 Turbine Capacities ................................................................................................................... 17 Further Turbine Fleet Changes .................................................................................................................... 20 Capacity Factor Compared to Capacity ............................................................................... 20 Energy Generation .................................................................................................................... 21 Station Use Energy .......................................................................................................................................... 22
CHAPTER 3: Other Parameters of Generation Projects............................................................ 23 Rotor Swept Area ...................................................................................................................... 23 Specific Power ........................................................................................................................... 24 Specific Energy .......................................................................................................................... 25 Wind Speeds and Variations from 2014 Through 2016 .................................................. 27
CHAPTER 4: Regional Generation ................................................................................................. 31 Wind Resource Areas ............................................................................................................... 31 Projects Outside Wind Resource Areas ..................................................................................................... 32

v
Capacity and Generation by Region ..................................................................................... 33 Regional Capacity Factors ...................................................................................................... 34 County Variations ............................................................................................................................................ 35 Changes in Wind Resource Areas Over the Period ............................................................ 35
CHAPTER 5: Comparison of Consumption to Generation ...................................................... 41 Generation and Consumption Profiles by Wind Resource Areas ................................... 42
CHAPTER 6: Energy Purchases ...................................................................................................... 45
CHAPTER 7: Conclusions ................................................................................................................ 48 Statewide Generation and Characteristics .......................................................................... 48 Wind Speed Resources From 2014 Through 2016 ............................................................ 49 Regional Generation ................................................................................................................. 49 Consumption Compared to Generation .............................................................................. 50 Wind Energy Purchases ........................................................................................................... 50 Final Observations .................................................................................................................... 50
Acronyms and Abbreviations ........................................................................................................ 52
References ......................................................................................................................................... 54
APPENDIX A: Wind Turbine Groups ............................................................................................ A-1
APPENDIX B: Annual Wind Speed Variations ............................................................................ B-1
LIST OF FIGURES
Page
Figure ES-1: Net Capacity Factors by Quarter Over 2014 Through 2016 ................................ 2
Figure 1: A Portion of the Ocotillo Express Project ..................................................................... 3
Figure 2: Operating Companies With Highest Capacity (MW) in 2016 .................................... 7
Figure 3: Capacity by Quarter ........................................................................................................... 9
Figure 4: Recent Onsite User Project in Salinas Valley ............................................................ 10
Figure 5: 2016 Capacity Factors of In-State Electric Generation ........................................... 11
Figure 6: Full Period Capacity Factors by Like Quarter and Project Size ............................. 12
Figure 7: Capacity Factors by Quarter and Year for All Projects ........................................... 13
Figure 8: Capacity Factors by Month and Year for Large Projects (≥10 MW) ...................... 13
Figure 9: Capacity Factors by Quarter and Year for Small Projects (1 to <10 MW) ........... 14

vi
Figure 10: Capacity Factor Cycles ................................................................................................. 16
Figure 11: Distribution of Project Capacity Factors ................................................................. 17
Figure 12: Maximum and Median Capacity Factors .................................................................. 18
Figure 13: Percentage of Total Turbines by Turbine Size ....................................................... 18
Figure 14: Percentage of Total Capacity by Turbine Size ........................................................ 19
Figure 15: Capacity Factors vs. Capacities of All Projects in 2016 ....................................... 21
Figure 16: Capacity and Net Generation by Quarter ................................................................ 22
Figure 17: 2016 Distribution of Turbines by Rotor Area ........................................................ 24
Figure 18: Distribution of 2016 Specific Power by Turbine Group ....................................... 25
Figure 19: Distribution of 2016 Gross Specific Energies by Turbine Group ....................... 26
Figure 20: Average Wind Speeds ................................................................................................... 28
Figure 21: California Wind Resource Areas ................................................................................ 32
Figure 22: 2016 Capacity by Area (MW) ...................................................................................... 33
Figure 23: 2016 Net Energy by Area ............................................................................................ 34
Figure 24: Capacity Factor Variation Among Wind Resource Areas in 2016 ...................... 35
Figure 25: Capacity Changes by Wind Resource Areas ............................................................ 36
Figure 26: Net Energy Changes by Wind Resource Areas ........................................................ 36
Figure 27: Number of Project Changes by Wind Resource Areas .......................................... 37
Figure 28: Change in Number of Turbines by Wind Resource Areas.................................... 38
Figure 29: Change in Capacity per Project by Wind Resource Areas .................................... 38
Figure 30: Change in Capacity per Turbine by Wind Resource Area .................................... 39
Figure 31: Changes in Specific Power by Wind Resource Areas ............................................ 40
Figure 32: Changes in Specific Energy by Wind Resource Areas ........................................... 40
Figure 33: Statewide Profiles of Electricity Consumption and Wind Generation ............... 41
Figure 34: Average Altamont and Solano Profiles with PG&E Consumption ...................... 43
Figure 35: Average San Gorgonio and Tehachapi Profiles with SCE Consumption ........... 43
Figure 36: East San Diego WRA Profile With SDG&E and IID Consumption ........................ 44
Figure 37: Changing Mix of Wind Energy Purchasers .............................................................. 46
Figure 38: Breakout of the Smaller Purchaser Types ............................................................... 47
Figure 39: Wind Energy Purchased by Quarter, 2014–2016 ................................................... 47
vii
Figure B-1: Wind Speed Deviations From Average in 2014 .................................................... B-1
Figure B-2: Wind Speed Deviations From Average in 2015 .................................................... B-2
Figure B-3: Wind Speed Deviations From Average in 2016 .................................................... B-3
LIST OF TABLES
Page
Table 1: 2014-2016 Generation, Capacity, and Capacity Factors by Year .............................. 8
Table 2: Net Generation Capacity Factors by Quarter and Year for All Projects ............... 15
Table 3: Wind Repowering Candidates ........................................................................................ 20
Table 4: Composition of the Turbine Fleet by Rotor Area ...................................................... 23
Table 5: Specific Energy Ranges (kWh/sq. m) ............................................................................ 26
Table 6: Comparison of Turbine Groups .................................................................................... 27
Table 7: Wind Resource Areas, Counties, and Areas ................................................................ 31
1
EXECUTIVE SUMMARY
Background
Wind generation in California makes up about one-quarter of renewable electric
generation in the state by energy and by capacity in 2016. Wind projects extend from
Imperial County in the south to Shasta County in the north. Detailed knowledge of wind
projects, energy produced, and energy purchases provides part of the foundation for
growth toward higher levels of clean energy for the state. Wind generation relates to
several policy areas identified in the 2016 Integrated Energy Policy Report Update and
the final 2017 Integrated Energy Policy Report. Among those stated policy goals are
greenhouse gas reductions, transmission planning, imports of renewable energy, grid
reliability, characteristics of natural gas generators, water use, potential offshore wind
generation, and repowering. Information to support these policy goals and better
understand wind generation is available from data obtained through the California
Energy Commission’s Wind Performance Reporting System. This data set includes
projects available to generate and sell electricity but not projects in earlier stages of
development.
Purpose
This report summarizes and analyzes the data and information obtained by the Energy
Commission through the Wind Performance Reporting System. These are data primarily
on generators and generation, with some energy purchase data. They describe the three-
year period of 2014 through 2016, which is the first three years of comprehensive and
detailed data collection since the Wind Performance Reporting System was modernized.
Wind data are collected from California project operators and wind energy purchasers
from in-state projects of at least 1 megawatt (MW) in nameplate capacity.
Take-Away Messages
• Wind generation projects in California produced an average of almost 13,000
gigawatt-hours per year from 2014 through 2016.
• Wind projects provided the energy used in about 1.9 million California
households, with the average household consuming about 7 megawatt-hours per
year.
• Statewide capacity decreased over the period, ending at 5,644 MW available to
generate at the end of 2016.
• The number of turbines available decreased while the average capacity per
turbine increased.
• Wind generators had a net capacity factor of 26 percent over the three-year
period.
• Annual capacity factors for quarter two for the whole fleet ranged from 36
percent to 40 percent, varying by year.

2
• Wind capacity factors over the three-year period were highest in the second
calendar quarter at 37 percent and lowest in the fourth quarter at 17 percent, as
shown in Figure ES-1.
Figure ES-1: Net Capacity Factors by Quarter Over 2014 Through 2016
Source: WPRS data set of the California Energy Commission
• Among areas of the state, generation was highest in the Tehachapi Wind
Resource Area in Kern County, followed by the Solano Wind Resource Area in
Solano County, the San Gorgonio area in Riverside County, and the Altamont
area in Alameda County.
• Average statewide electricity consumption peaks in August and reaches a low in
February. Wind generation peaks in June, with a minimum in January.
• Most wind energy was purchased by investor-owned utilities, followed by
publicly owned utilities, energy service providers, and community choice
aggregators. Community choice aggregators and onsite users purchased a small
but growing share of wind energy.
0%
5%
10%
15%
20%
25%
30%
35%
40%
1st Qtr. 2nd Qtr. 3rd Qtr. 4th Qtr.
2014
-201
6 Ca
paci
ty F
acto
r
3
CHAPTER 1: Introduction
Higher renewable energy portfolio goals in the law for the coming years suggest that
wind generation will provide increasing support to meet state demands for clean energy.
California in-state wind generation makes up 24 percent of the renewable energy and
27 percent of the renewable capacity in the state as of the end of 2016 (California
Energy Commission, 2018). The state houses a diverse array of wind projects across
nearly its entire length, with a wide range in project size, characteristics, and output.
Wind projects extend from the forested northern end of the state to the desert areas in
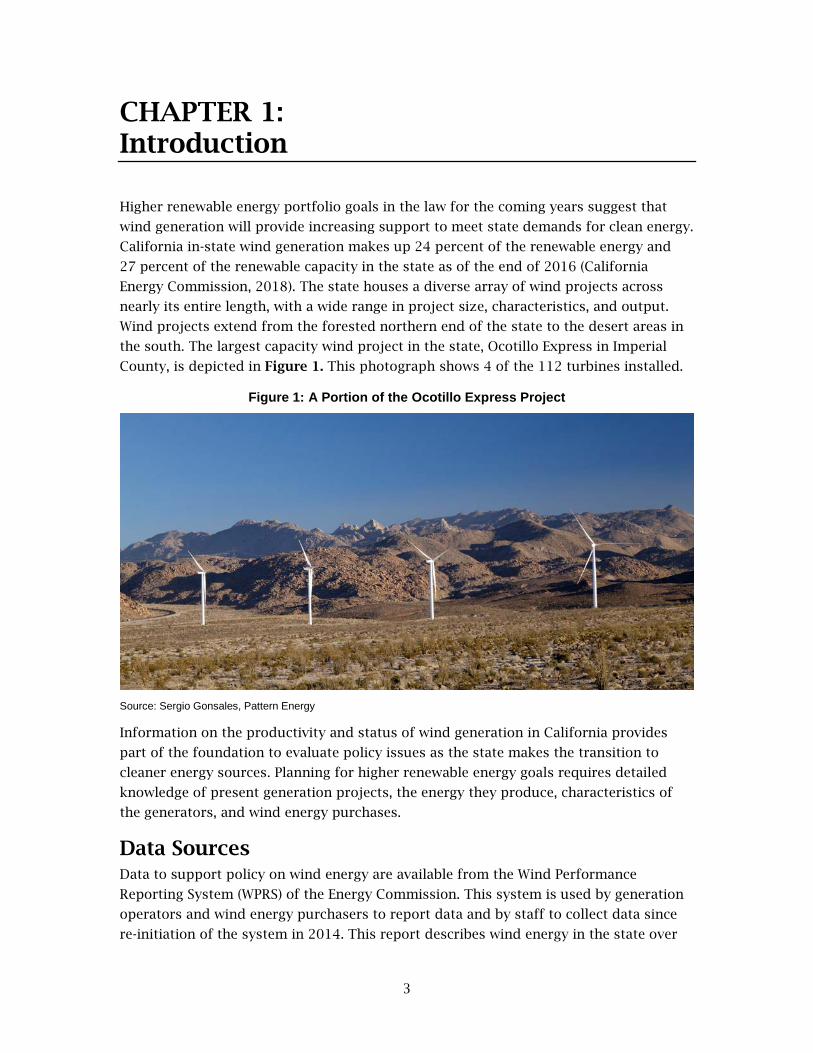
the south. The largest capacity wind project in the state, Ocotillo Express in Imperial
County, is depicted in Figure 1. This photograph shows 4 of the 112 turbines installed.
Figure 1: A Portion of the Ocotillo Express Project
Source: Sergio Gonsales, Pattern Energy
Information on the productivity and status of wind generation in California provides
part of the foundation to evaluate policy issues as the state makes the transition to
cleaner energy sources. Planning for higher renewable energy goals requires detailed
knowledge of present generation projects, the energy they produce, characteristics of
the generators, and wind energy purchases.
Data Sources Data to support policy on wind energy are available from the Wind Performance
Reporting System (WPRS) of the Energy Commission. This system is used by generation
operators and wind energy purchasers to report data and by staff to collect data since
re-initiation of the system in 2014. This report describes wind energy in the state over

4
the first three years of the WPRS, 2014 through 2016, focused primarily on energy
generation. The WPRS collects data required by the California Code of Regulations. Most
operators and purchasers use online reporting, which includes data quality controls in
the software. The online WPRS data reporting system promotes collaboration by staff of
operators and energy purchasers in different offices.
Analysis in this report uses reported, public data, supplemented by related data
concerning wind power in California. Analysis focuses on production at the turbine
group level and larger perspectives, such as the project, region, utility territory, and
state levels. A turbine group comprises turbines within one project of the same make,
model, and capacity. Wind projects within the state contained 179 turbine groups in 110
projects at the end of 2016. The groups had a median of 24 turbines per group, and the
largest group comprised 460 turbines.
Data Quality Staff reviewed the reported data to identify inconsistencies and worked with reporters
on revisions where needed. Supplemental data were used when reported data did not
give a complete picture. As a quality check, staff analyzed the WPRS data set for 2016,
the most recent year of complete data, to check whether variables that were expected to
influence energy production were significant. This analysis was done using a linear
regression procedure to identify which variables significantly affected energy
production for turbine groups. Energy production values were reported data. The values
of potentially significant variables were from data collected by the Energy Commission
and parameters determined in earlier studies sponsored by the Energy Commission
(Bailey, 2006; California Energy Commission, 1980; and TrueWind Solutions, LLC, 2002).
The result of this analysis confirmed the overall high quality of the data set.
Related Energy Policies The Energy Commission identifies several policy areas affected by wind generation in its
2017 Integrated Energy Policy Report (2017 IEPR). These begin with increasing the
resiliency of the electricity sector. Reducing greenhouse gases depends on increasing
additions of new renewable resources, and the 2017 IEPR states that most of these
sources will come from wind and solar generation. The report notes the opportunity to
develop renewable generation in regions with operating profiles to complement the
operational needs of the grid. Evaluation of the tradeoffs between external and in-state
resources depends on a complete understanding of in-state generation. A variety of
transmission projects are being considered to make use of out-of-state generation. The
2017 IEPR includes references to wind generation projects in New Mexico and Wyoming,
with possible connection points in Utah, Nevada, and Arizona.
Other policy issues that knowledge of wind generation can inform are stated in the
2016 IEPR Update. The growth in wind and solar generation can bring new
responsibilities for grid operators as they maintain reliability while adjusting to
variations in renewable output. Wind and solar generators are sometimes in remote
5
areas throughout the western grid, and the need for stronger interconnections across
the grid is leading California to pursue more regional interconnection with other
western states. Growth in renewables is also affecting the natural gas fleet due to the
need for more responsive gas generation. Water use has decreased with the addition of
renewable resources. Wind plants do not use water or a steam cycle, as conventional
generators do. Another consideration regarding the wind fleet is the related effect on
wildlife, particularly birds. Repowering wind facilities can reduce impacts to birds. The
state is decreasing its reliance on coal generation, and renewable sources are increasing
to make up some of the electricity required by consumers. Each of these policy
considerations in the 2017 IEPR and 2016 IEPR Update benefits from a better
understanding of the productivity and status of existing wind projects in the state.
Implementing Senate Bill 100 (De León, Chapter 312, Statutes of 2018) also supports the
need for an understanding of wind energy in California. This bill increases the
Renewables Portfolio Standard targets for future years. The bill accelerates renewables
targets and establishes higher targets, including 60 percent by 2030 and 100 percent
renewable and zero-carbon resources by 2045. In addition, a set of benefits to California
is intended by the bill. These benefits include displacing fossil fuel consumption, adding
new generating plants, reducing air pollution, reducing greenhouse gas emissions,
promoting stable rates for electricity, meeting the need for a diversified and balanced
portfolio, and providing voltage support. Achieving these benefits can be informed
through an understanding of wind energy in the state.
Repowering, that is, replacing older equipment with newer, more efficient wind turbines,
is another policy area that can be informed by detailed knowledge of existing wind
generation. By comparing historical generation to an estimate of repowered production,
the value of repowering could be understood. Repowering ultimately depends on project
economics. Owners of projects need to see a financial benefit to repowering before they
replace existing turbines (Christenson, 2014). Repowering goals may need further policy
support or programs before they can be realized with current economics.
Offshore Wind Power
Offshore wind power, an opportunity identified in the IEPR, is an active planning area, and the Energy Commission has opened Docket #17-MISC-01.1 The Energy Commission
is working with the federal Bureau of Ocean Energy Management to identify potential
lease areas for offshore wind development. These areas include one near Eureka and
two near Morro Bay. The bureau has published a call for information and nominations
for companies interested in commercial energy leases within the proposed areas. The
bureau has received a request for a commercial lease near Morro Bay from Trident
Winds. The Redwood Coast Energy Authority is also pursuing an offshore wind project.
The authority has formed a partnership to develop a project offshore of Humboldt
County, and it submitted an application for a commercial lease to the bureau.
1 Docket accessible at http://www.energy.ca.gov/renewables/offshore_energy/.
6
As the technology to capture the offshore wind resource continues to develop
worldwide, large wind resources off the California coast are becoming available at
decreasing prices. Equipment, practices, and installation methods are developed
internationally, and the knowledge is transferred to each country that begins to invest.
Development of this energy source in California would benefit from the knowledge
accumulated in Europe and Asia over the last two decades. Offshore contract prices in
Europe have fallen much faster in recent years than industry observers expected
(Financial Times, 2017). Offshore resources will be compared to existing onshore
resources and operating onshore wind projects.
Current discussions of offshore wind in California often focus on deep-water foundation
systems. Although there are wind resources within shallow water depths of the coast,
use of much of the resource will require adapting to deeper water. Deep-water mooring
systems can be used to site projects beyond the visible distance from beaches, thus
minimizing the visual impact. Public acceptance of renewable energy projects is
complex, multi-factored, and difficult to predict. It is influenced by at least these types
of factors: economic stakes in project costs and benefits; environmental values (such as
opinions about greenhouse gas emissions, wildlife, and visual factors); community
experience with energy projects; and perceptions about participation in planning and
decision-making of government and project developers.
7
CHAPTER 2: Statewide Capacity, Capacity Factors, and Generation
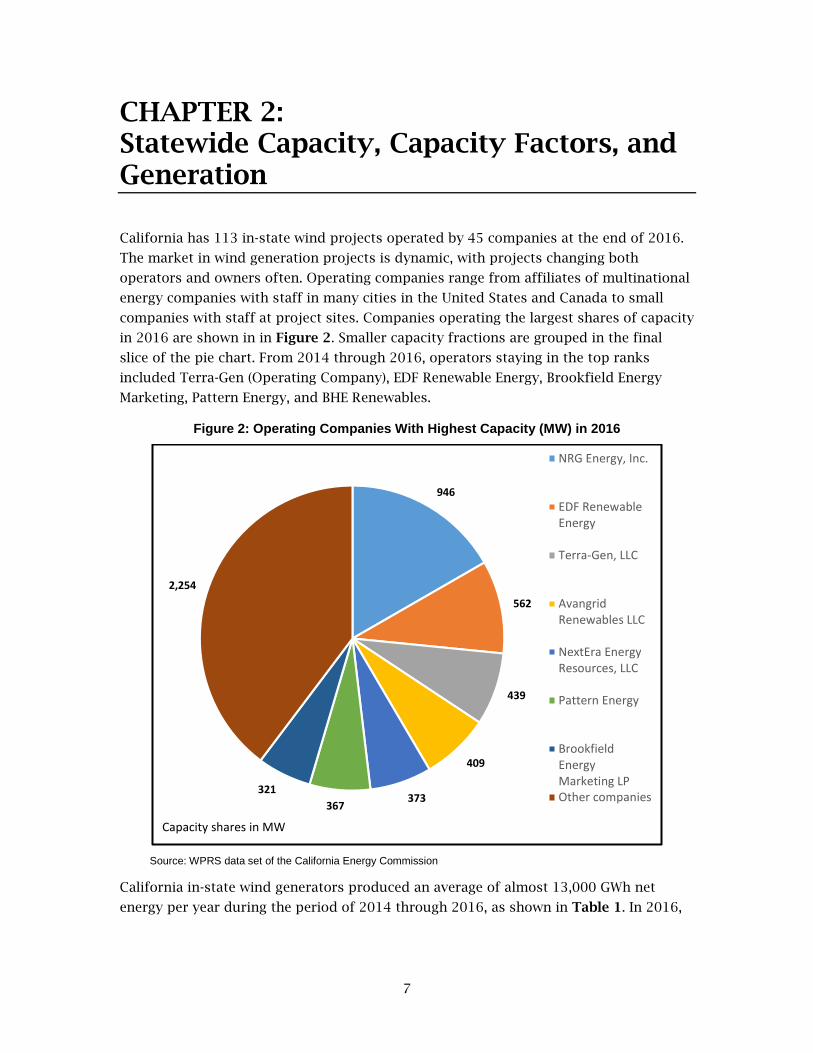
California has 113 in-state wind projects operated by 45 companies at the end of 2016.
The market in wind generation projects is dynamic, with projects changing both
operators and owners often. Operating companies range from affiliates of multinational
energy companies with staff in many cities in the United States and Canada to small
companies with staff at project sites. Companies operating the largest shares of capacity
in 2016 are shown in in Figure 2. Smaller capacity fractions are grouped in the final
slice of the pie chart. From 2014 through 2016, operators staying in the top ranks
included Terra-Gen (Operating Company), EDF Renewable Energy, Brookfield Energy
Marketing, Pattern Energy, and BHE Renewables.
Figure 2: Operating Companies With Highest Capacity (MW) in 2016
Source: WPRS data set of the California Energy Commission
California in-state wind generators produced an average of almost 13,000 GWh net
energy per year during the period of 2014 through 2016, as shown in Table 1. In 2016,
946
562
439
409
373367
321
2,254
NRG Energy, Inc.
EDF RenewableEnergy
Terra-Gen, LLC
AvangridRenewables LLC
NextEra EnergyResources, LLC
Pattern Energy
BrookfieldEnergyMarketing LPOther companies
Capacity shares in MW

8
the average household in the state consumed 7.02 MWh.2 The in-state wind projects
produced as much net energy as 1.9 million households consumed.
Table 1: 2014-2016 Generation, Capacity, and Capacity Factors by Year
Year Net GWh
End-of-Year Capacity (MW)
Annual Net Capacity Factor (Percent)
Number of Turbines at End of Year
2014 13,074 5,865 26 11,500
2015 12,191 5,998 24 10,927
2016 13,499 5,644 27 7,400
2014-16 period
38,763 26
3- year average
12,921
Source: WPRS data set of the California Energy Commission
Statewide wind production was highest in 2016 and lowest in 2015, with the highest
capacity factor (CF) in 2016. The CF measures how closely a project comes to reaching
the maximum production possible based on the electrical capacity of the generator. It is
the ratio of the energy produced to what could have been produced if the project had
run at nameplate capacity for the entire period. A small number of lower capacity
projects are rerated by the operator, and the revised values are used in the calculations.
The CF over the full, three-year period was 26 percent. The statewide average CF varied
over 3 percentage points during the three years due to natural fluctuations in wind
speed from year to year.
Lower production occurred in 2015 as California and other states experienced low wind
speeds in the first half of that year. In-state wind generation made up 7 percent of
electric energy and 7 percent of capacity in California in 2016.
Net annual CF listed in Table 1 take into account the changes in capacity with each
calendar quarter, with the fourth quarter capacities shown in the table. CFs are
influenced by the mix of turbines with older technology and recent projects with newer
technology. Annual factors include the variations among seasons, with higher
production in the second and third quarters and lower in the first and fourth. Individual
plants in the high season can reach a CF during a month that is three times higher than
a statewide annual value.
2 Chris Kavalec, California Energy Commission, Demand Analysis Office, in discussion with the author, April 9, 2018.
9
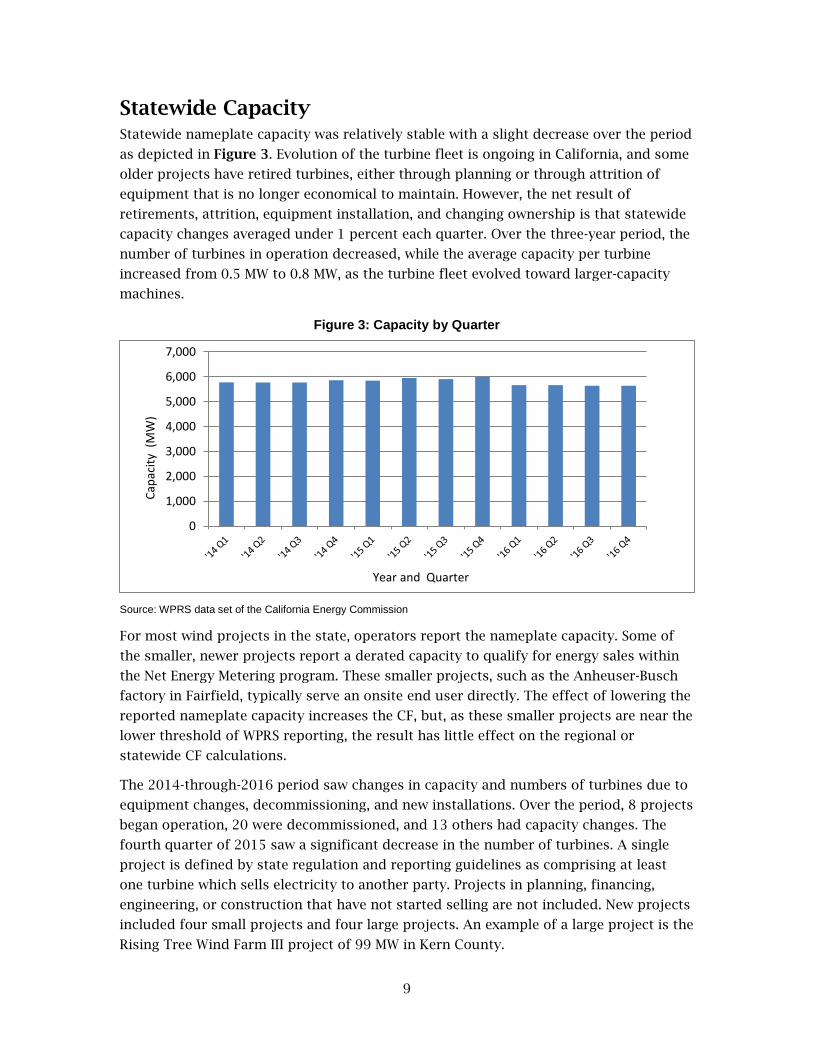
Statewide Capacity Statewide nameplate capacity was relatively stable with a slight decrease over the period
as depicted in Figure 3. Evolution of the turbine fleet is ongoing in California, and some
older projects have retired turbines, either through planning or through attrition of
equipment that is no longer economical to maintain. However, the net result of
retirements, attrition, equipment installation, and changing ownership is that statewide
capacity changes averaged under 1 percent each quarter. Over the three-year period, the
number of turbines in operation decreased, while the average capacity per turbine
increased from 0.5 MW to 0.8 MW, as the turbine fleet evolved toward larger-capacity
machines.
Figure 3: Capacity by Quarter
Source: WPRS data set of the California Energy Commission
For most wind projects in the state, operators report the nameplate capacity. Some of
the smaller, newer projects report a derated capacity to qualify for energy sales within
the Net Energy Metering program. These smaller projects, such as the Anheuser-Busch
factory in Fairfield, typically serve an onsite end user directly. The effect of lowering the
reported nameplate capacity increases the CF, but, as these smaller projects are near the
lower threshold of WPRS reporting, the result has little effect on the regional or
statewide CF calculations.
The 2014-through-2016 period saw changes in capacity and numbers of turbines due to
equipment changes, decommissioning, and new installations. Over the period, 8 projects
began operation, 20 were decommissioned, and 13 others had capacity changes. The
fourth quarter of 2015 saw a significant decrease in the number of turbines. A single
project is defined by state regulation and reporting guidelines as comprising at least
one turbine which sells electricity to another party. Projects in planning, financing,
engineering, or construction that have not started selling are not included. New projects
included four small projects and four large projects. An example of a large project is the
Rising Tree Wind Farm III project of 99 MW in Kern County.
0
1,000
2,000
3,000
4,000
5,000
6,000
7,000
Capa
city
(M
W)
Year and Quarter
10
WPRS classifies large projects as those rated at 10 MW or more in nameplate capacity;
large projects report monthly data. Small projects are at least 1 MW but under 10 MW,
and these report quarterly data. Some small projects serve adjacent end users who
contract to buy the energy produced. These projects represent a newer type of one-to-
two turbine operation, which produces and uses the energy; the end users are industrial,
commercial, or agricultural operations.
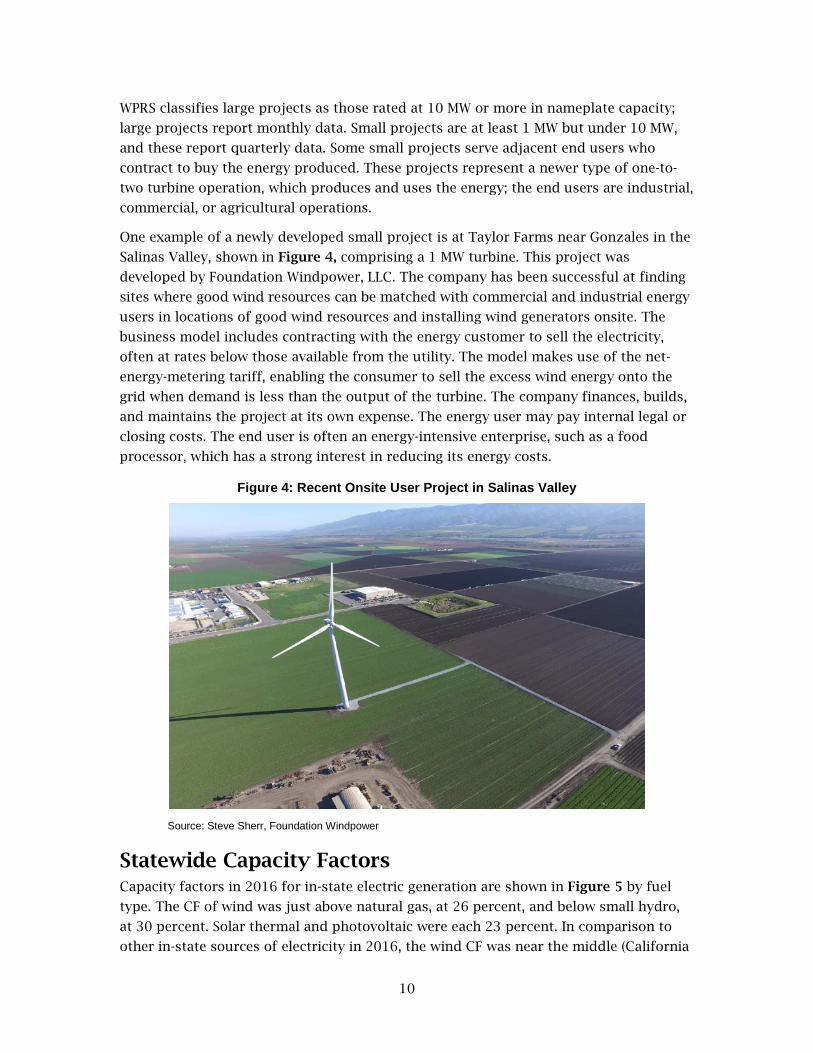
One example of a newly developed small project is at Taylor Farms near Gonzales in the
Salinas Valley, shown in Figure 4, comprising a 1 MW turbine. This project was
developed by Foundation Windpower, LLC. The company has been successful at finding
sites where good wind resources can be matched with commercial and industrial energy
users in locations of good wind resources and installing wind generators onsite. The
business model includes contracting with the energy customer to sell the electricity,
often at rates below those available from the utility. The model makes use of the net-
energy-metering tariff, enabling the consumer to sell the excess wind energy onto the
grid when demand is less than the output of the turbine. The company finances, builds,
and maintains the project at its own expense. The energy user may pay internal legal or
closing costs. The end user is often an energy-intensive enterprise, such as a food
processor, which has a strong interest in reducing its energy costs.
Figure 4: Recent Onsite User Project in Salinas Valley
Source: Steve Sherr, Foundation Windpower
Statewide Capacity Factors Capacity factors in 2016 for in-state electric generation are shown in Figure 5 by fuel
type. The CF of wind was just above natural gas, at 26 percent, and below small hydro,
at 30 percent. Solar thermal and photovoltaic were each 23 percent. In comparison to
other in-state sources of electricity in 2016, the wind CF was near the middle (California
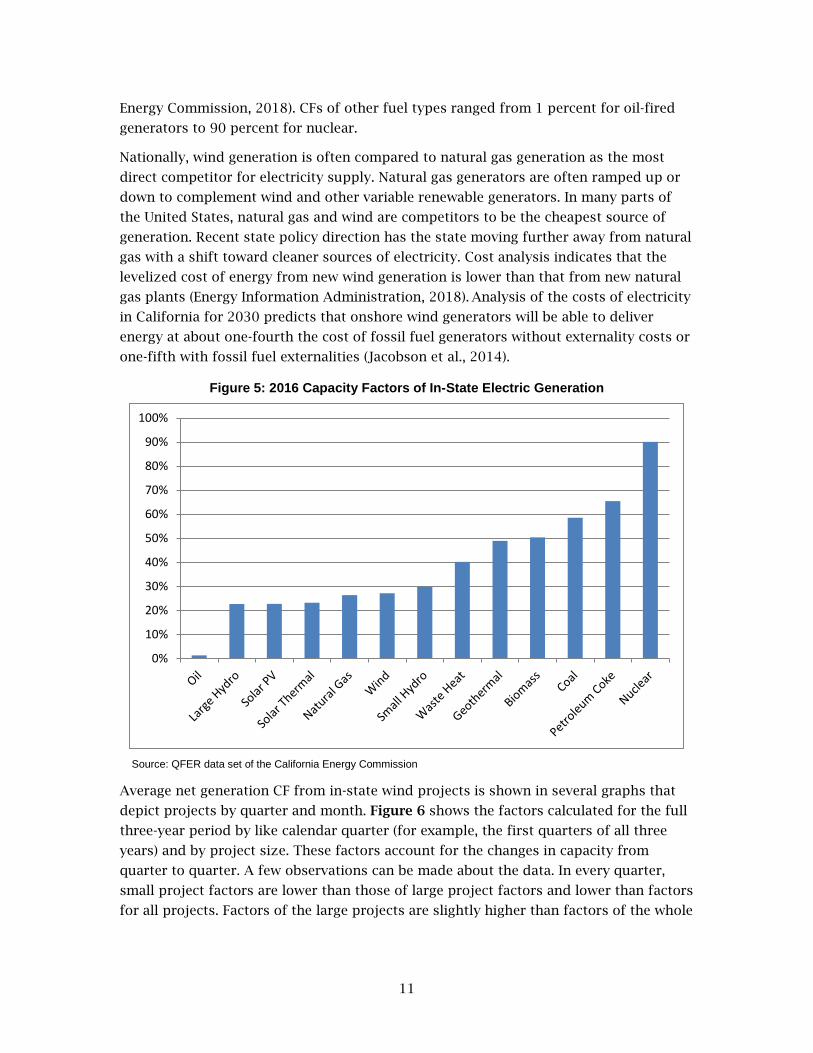
11
Energy Commission, 2018). CFs of other fuel types ranged from 1 percent for oil-fired
generators to 90 percent for nuclear.
Nationally, wind generation is often compared to natural gas generation as the most
direct competitor for electricity supply. Natural gas generators are often ramped up or
down to complement wind and other variable renewable generators. In many parts of
the United States, natural gas and wind are competitors to be the cheapest source of
generation. Recent state policy direction has the state moving further away from natural
gas with a shift toward cleaner sources of electricity. Cost analysis indicates that the
levelized cost of energy from new wind generation is lower than that from new natural
gas plants (Energy Information Administration, 2018). Analysis of the costs of electricity
in California for 2030 predicts that onshore wind generators will be able to deliver
energy at about one-fourth the cost of fossil fuel generators without externality costs or
one-fifth with fossil fuel externalities (Jacobson et al., 2014).
Figure 5: 2016 Capacity Factors of In-State Electric Generation
Source: QFER data set of the California Energy Commission
Average net generation CF from in-state wind projects is shown in several graphs that
depict projects by quarter and month. Figure 6 shows the factors calculated for the full
three-year period by like calendar quarter (for example, the first quarters of all three
years) and by project size. These factors account for the changes in capacity from
quarter to quarter. A few observations can be made about the data. In every quarter,
small project factors are lower than those of large project factors and lower than factors
for all projects. Factors of the large projects are slightly higher than factors of the whole
0%
10%
20%
30%
40%
50%
60%
70%
80%
90%
100%

12
fleet. Quarter 2 is higher than other quarters for every size range, and Quarter 3 is
second highest. Quarters 1 and 4 are much lower.
Figure 6: Full Period Capacity Factors by Like Quarter and Project Size
Source: WPRS data set of the California Energy Commission
CFs include the capacity of all turbines that are available to operate during a period.
Available turbines may not operate for reasons including county restrictions for
environmental mitigation, the operator’s economic reasons, and curtailment by a utility
for maintenance of its equipment.
The data can also be examined year by year to show the variability between years.
Figure 7 depicts CF for all projects by quarter over the three years. The factors peak in
Quarter 2 each year at 35 to 40 percent and are lowest in Quarter 1 or 4, varying by
year. Low CF values in the first part of 2015 are evident. These values reflect unusual
low wind resource conditions that are explained further by the low wind speeds
described below under Wind Speeds and Variations.
0%
5%
10%
15%
20%
25%
30%
35%
40%
1 2 3 4
3-Ye
ar A
ll Pr
ojec
t Cap
acity
Fac
tor
Like Quarter of All Years
Large Projects Small Projects All Projects

13
Figure 7: Capacity Factors by Quarter and Year for All Projects
Source: WPRS data set of the California Energy Commission
Projects of at least 10 MW capacity report monthly data, with the CF profiles shown in
Figure 8. The monthly variations in energy production from year to year are evident, as
is the overall pattern of peaking in the summer months. Factors are highest in June of
each year. Lowest factors occur between November and January, also depending on the
year. The wide range of the group is visible, from less than 5 percent in January 2015 to
more than 45 percent in June 2014.
Figure 8: Capacity Factors by Month and Year for Large Projects (≥10 MW)
Source: WPRS data set of the California Energy Commission
0%
5%
10%
15%
20%
25%
30%
35%
40%
45%
1 2 3 43-Ye
ar A
ll Pr
ojec
ts C
apac
ity F
acto
r
Quarter
2014 2015 2016
0%5%
10%15%20%25%30%35%40%45%50%
Jan Feb Mar Apr May Jun Jul Aug Sep Oct Nov Dec
3-Ye
ar L
arge
Pro
ject
Cap
acity
Fac
tor
Month
2014 2015 2016
14
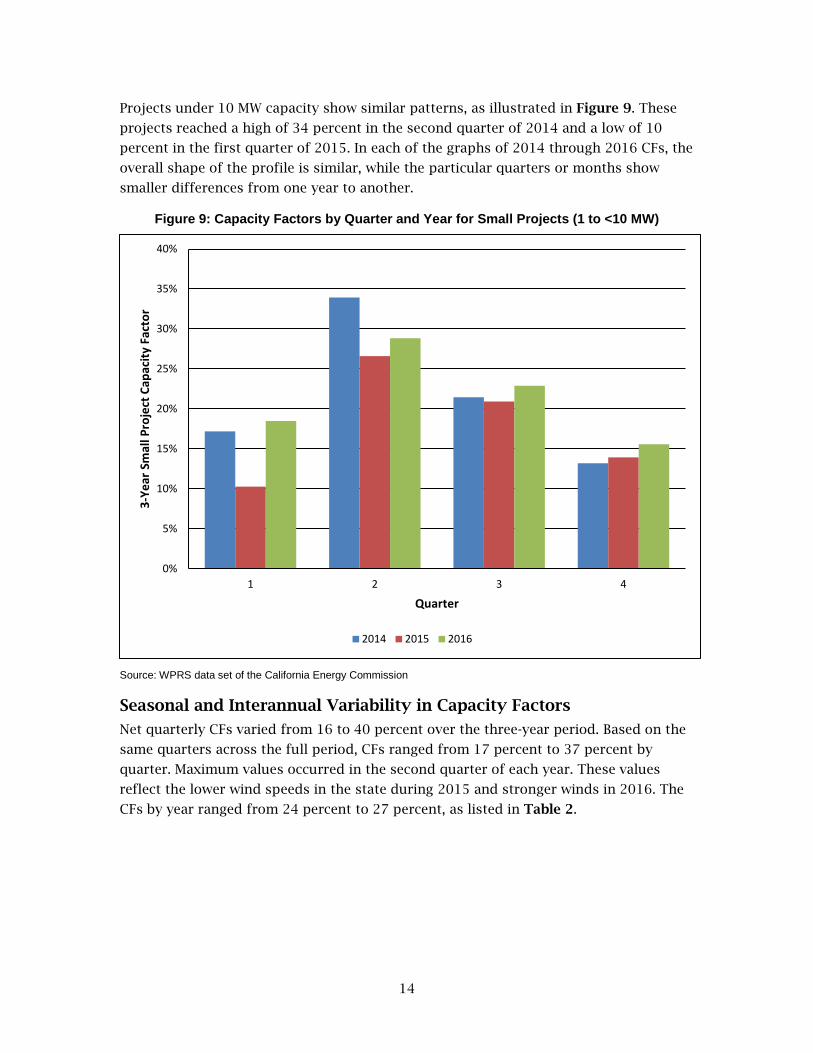
Projects under 10 MW capacity show similar patterns, as illustrated in Figure 9. These
projects reached a high of 34 percent in the second quarter of 2014 and a low of 10
percent in the first quarter of 2015. In each of the graphs of 2014 through 2016 CFs, the
overall shape of the profile is similar, while the particular quarters or months show
smaller differences from one year to another.
Figure 9: Capacity Factors by Quarter and Year for Small Projects (1 to <10 MW)
Source: WPRS data set of the California Energy Commission
Seasonal and Interannual Variability in Capacity Factors
Net quarterly CFs varied from 16 to 40 percent over the three-year period. Based on the
same quarters across the full period, CFs ranged from 17 percent to 37 percent by
quarter. Maximum values occurred in the second quarter of each year. These values
reflect the lower wind speeds in the state during 2015 and stronger winds in 2016. The
CFs by year ranged from 24 percent to 27 percent, as listed in Table 2.
0%
5%
10%
15%
20%
25%
30%
35%
40%
1 2 3 4
3-Ye
ar S
mal
l Pro
ject
Cap
acity
Fac
tor
Quarter
2014 2015 2016
15
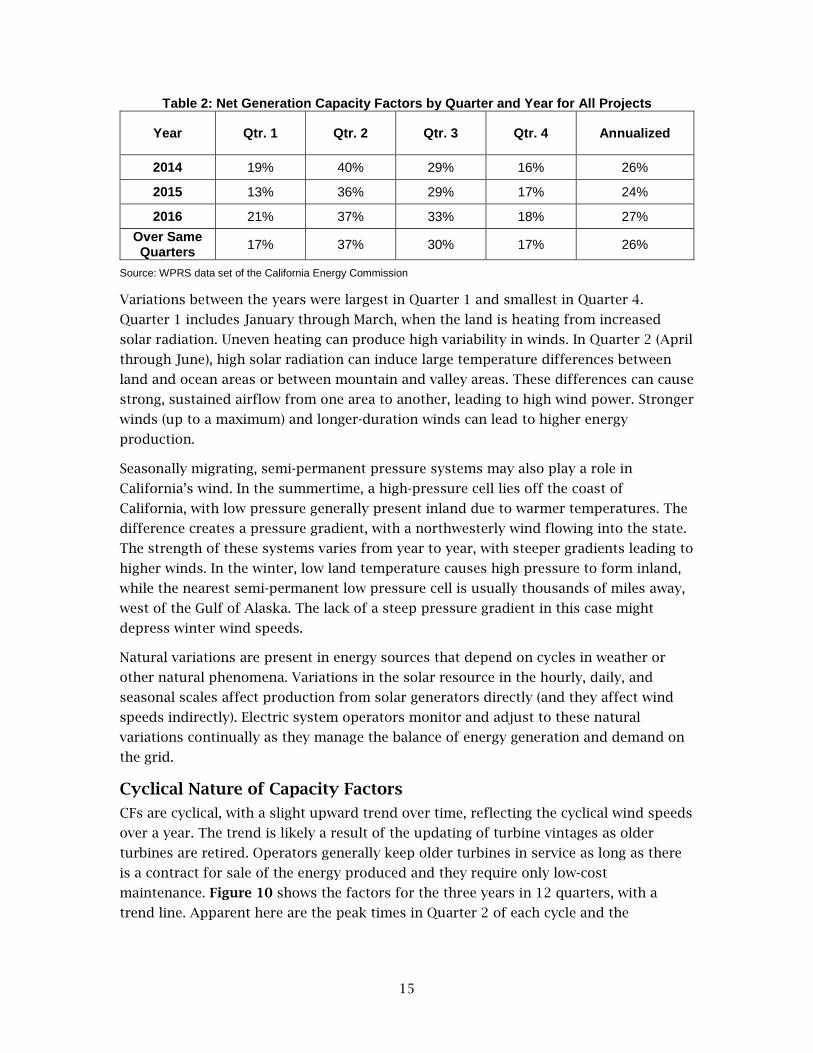
Table 2: Net Generation Capacity Factors by Quarter and Year for All Projects
Year Qtr. 1 Qtr. 2 Qtr. 3 Qtr. 4 Annualized
2014 19% 40% 29% 16% 26%
2015 13% 36% 29% 17% 24%
2016 21% 37% 33% 18% 27% Over Same Quarters 17% 37% 30% 17% 26%
Source: WPRS data set of the California Energy Commission
Variations between the years were largest in Quarter 1 and smallest in Quarter 4.
Quarter 1 includes January through March, when the land is heating from increased
solar radiation. Uneven heating can produce high variability in winds. In Quarter 2 (April
through June), high solar radiation can induce large temperature differences between
land and ocean areas or between mountain and valley areas. These differences can cause
strong, sustained airflow from one area to another, leading to high wind power. Stronger
winds (up to a maximum) and longer-duration winds can lead to higher energy
production.
Seasonally migrating, semi-permanent pressure systems may also play a role in
California’s wind. In the summertime, a high-pressure cell lies off the coast of
California, with low pressure generally present inland due to warmer temperatures. The
difference creates a pressure gradient, with a northwesterly wind flowing into the state.
The strength of these systems varies from year to year, with steeper gradients leading to
higher winds. In the winter, low land temperature causes high pressure to form inland,
while the nearest semi-permanent low pressure cell is usually thousands of miles away,
west of the Gulf of Alaska. The lack of a steep pressure gradient in this case might
depress winter wind speeds.
Natural variations are present in energy sources that depend on cycles in weather or
other natural phenomena. Variations in the solar resource in the hourly, daily, and
seasonal scales affect production from solar generators directly (and they affect wind
speeds indirectly). Electric system operators monitor and adjust to these natural
variations continually as they manage the balance of energy generation and demand on
the grid.
Cyclical Nature of Capacity Factors
CFs are cyclical, with a slight upward trend over time, reflecting the cyclical wind speeds
over a year. The trend is likely a result of the updating of turbine vintages as older
turbines are retired. Operators generally keep older turbines in service as long as there
is a contract for sale of the energy produced and they require only low-cost
maintenance. Figure 10 shows the factors for the three years in 12 quarters, with a
trend line. Apparent here are the peak times in Quarter 2 of each cycle and the

16
minimum times in Quarter 1 or 4. The high generation in Quarter 2 of 2014 and the low
generation in Quarter 1 of 2015 are also visible.
Figure 10: Capacity Factor Cycles
Source: WPRS data set of the California Energy Commission
Individual Project Capacity Factors
The graphs and data presented above describe patterns and trends in CF over groups of
projects. However, individual projects show a wider range of CFs than large groups. A
“project” is a defined in regulation as group of wind turbines totaling at least 1 MW
nameplate capacity, the electricity from which is sold to another party. The turbines in a
project are normally located close together, often in a row or parallel rows. A common
arrangement is to site the rows perpendicular to the dominant wind direction. This
arrangement minimizes the effect of one turbine on another during productive times.
Projects exhibit annual net CFs ranging from 0 percent to 56 percent annually.
Factors at single projects for shorter periods can be much higher during the summer,
ranging up to almost 80 percent for particular months. The wide range in these figures
encapsulates the great variation in productivity among operating wind projects in
California. The CF is the result of many factors that affect realized production, including
siting, project design and engineering, management and operation, contractual terms,
market opportunities, and external limits on generation like those by a county or the
electric system operator.
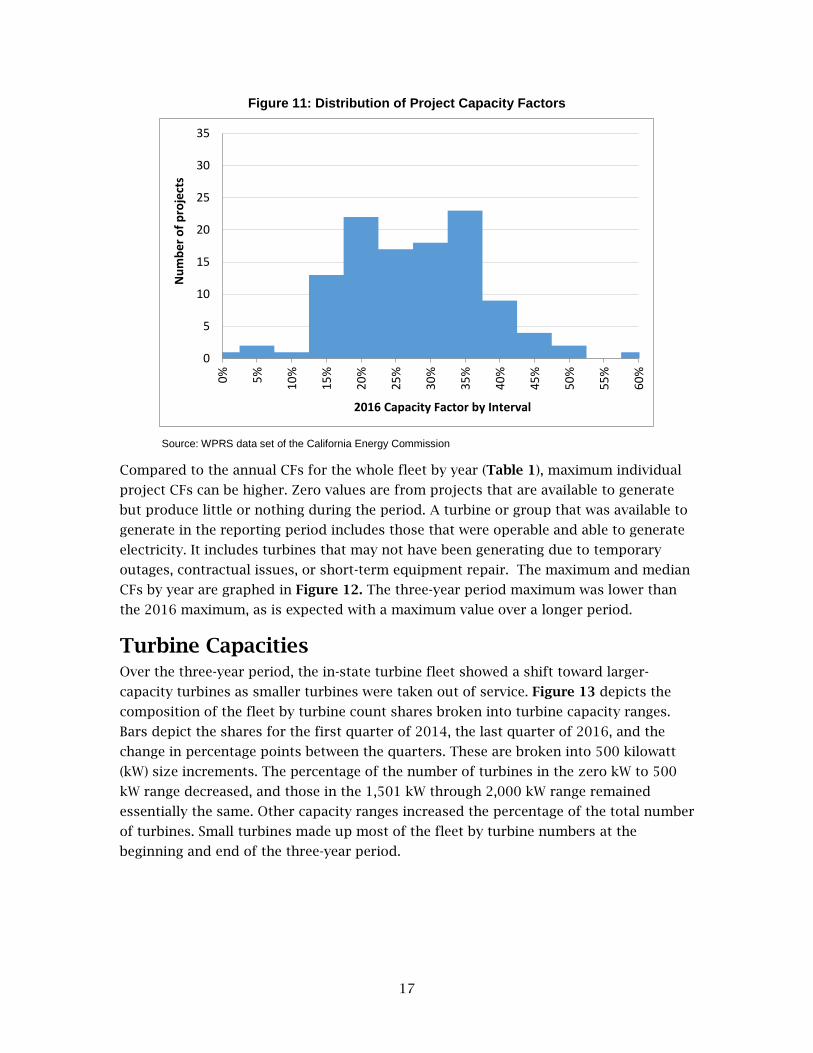
The distribution of individual project capacity factors for 2016 is graphed in Figure 11,
in intervals of five percentage points each. The bulk of the projects fall within the range
of 15 to 40 percent. Individual projects fall in a wider range of 0 to more than 55
percent for the year. The median CF value for 2016 was 25 percent, and the Robertsons
Ready-Mix in Riverside County plant achieved the highest factor at 56 percent. From
2014 to 2016, the maximum annual project CF increased as more small commercial
projects were brought on-line, and these projects typically had high factors.
'14 Q1
'14 Q2
'14 Q3
'14 Q4 '15 Q1
'15 Q2
'15 Q3
'15 Q4
'16 Q1
'16 Q2'16 Q3
'16 Q4
0%5%
10%15%20%25%30%35%40%45%
1 2 3 4 5 6 7 8 9 10 11 12 13Sequential Quarters from 2014 through 2016
Net CF
Linear(NetCF)
17
Figure 11: Distribution of Project Capacity Factors
Source: WPRS data set of the California Energy Commission
Compared to the annual CFs for the whole fleet by year (Table 1), maximum individual
project CFs can be higher. Zero values are from projects that are available to generate
but produce little or nothing during the period. A turbine or group that was available to
generate in the reporting period includes those that were operable and able to generate
electricity. It includes turbines that may not have been generating due to temporary
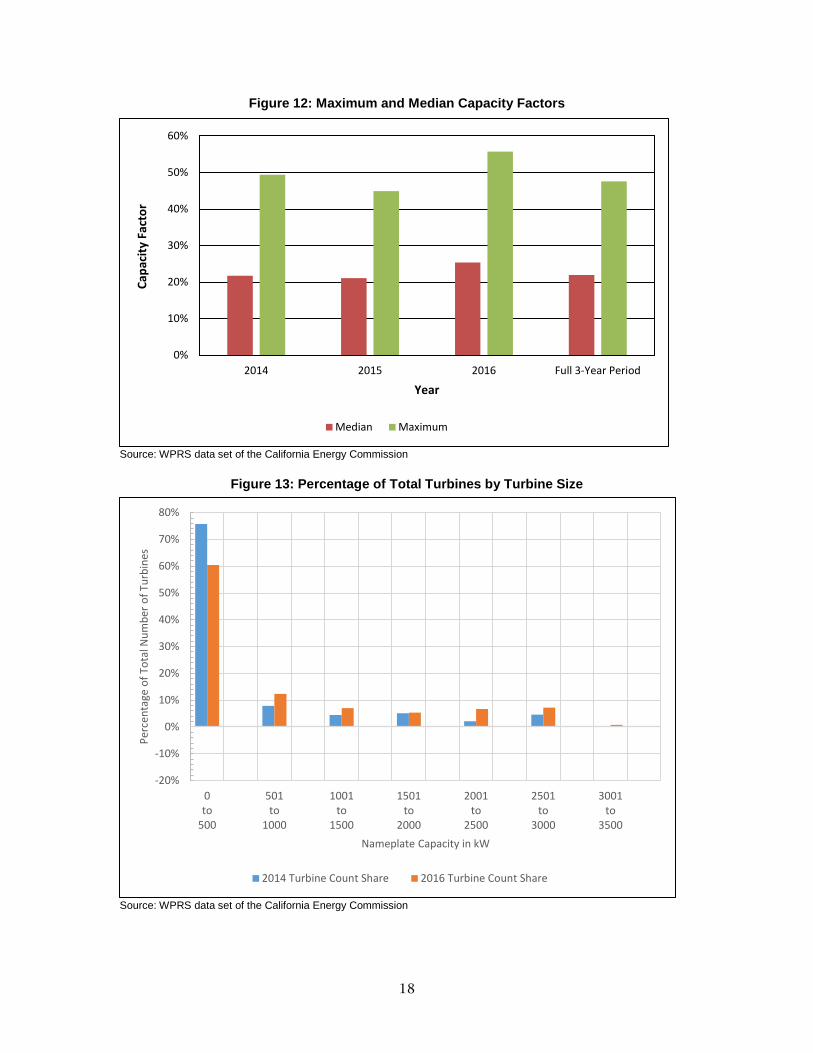
outages, contractual issues, or short-term equipment repair. The maximum and median
CFs by year are graphed in Figure 12. The three-year period maximum was lower than
the 2016 maximum, as is expected with a maximum value over a longer period.
Turbine Capacities Over the three-year period, the in-state turbine fleet showed a shift toward larger-
capacity turbines as smaller turbines were taken out of service. Figure 13 depicts the
composition of the fleet by turbine count shares broken into turbine capacity ranges.
Bars depict the shares for the first quarter of 2014, the last quarter of 2016, and the
change in percentage points between the quarters. These are broken into 500 kilowatt
(kW) size increments. The percentage of the number of turbines in the zero kW to 500
kW range decreased, and those in the 1,501 kW through 2,000 kW range remained
essentially the same. Other capacity ranges increased the percentage of the total number
of turbines. Small turbines made up most of the fleet by turbine numbers at the
beginning and end of the three-year period.
0
5
10
15
20
25
30
35
0% 5% 10%
15%
20%
25%
30%
35%
40%
45%
50%
55%
60%
Num
ber o
f pro
ject
s
2016 Capacity Factor by Interval
18
Figure 12: Maximum and Median Capacity Factors
Source: WPRS data set of the California Energy Commission
Figure 13: Percentage of Total Turbines by Turbine Size
Source: WPRS data set of the California Energy Commission
0%
10%
20%
30%
40%
50%
60%
2014 2015 2016 Full 3-Year Period
Capa
city
Fac
tor
Year
Median Maximum
-20%
-10%
0%
10%
20%
30%
40%
50%
60%
70%
80%
0to
500
501to
1000
1001to
1500
1501to
2000
2001to
2500
2501to
3000
3001to
3500
Perc
enta
ge o
f Tot
al N
umbe
r of T
urbi
nes
Nameplate Capacity in kW
2014 Turbine Count Share 2016 Turbine Count Share
19
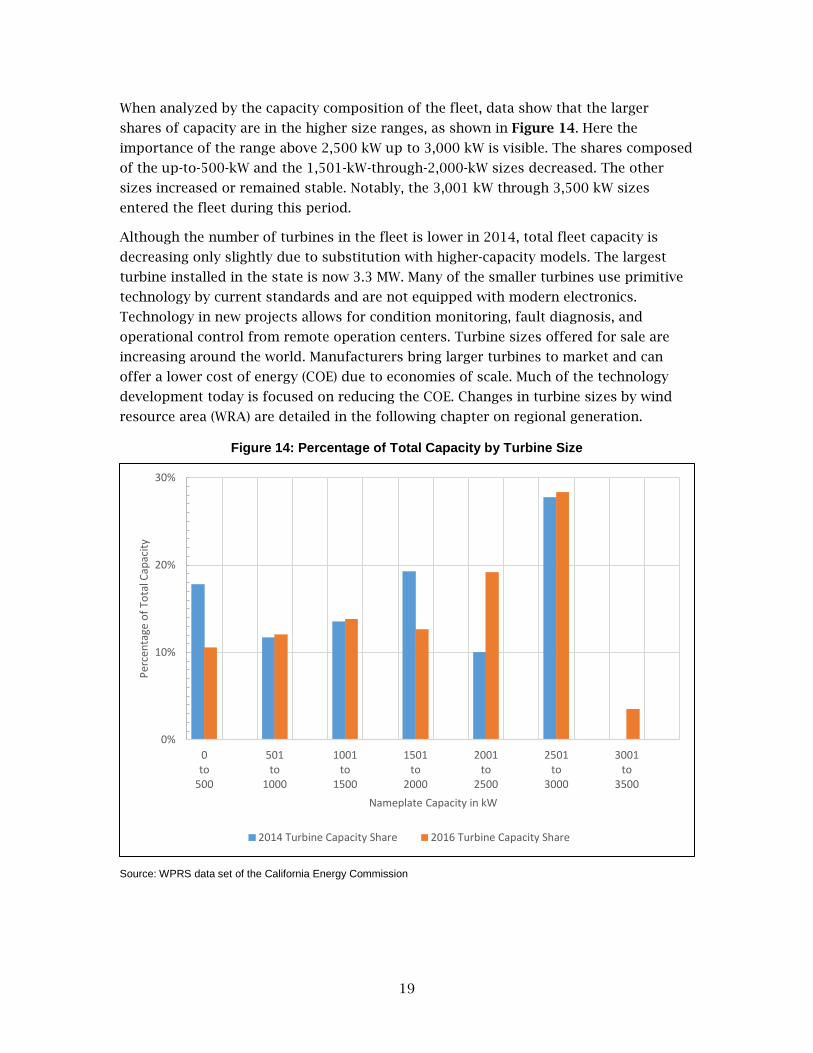
When analyzed by the capacity composition of the fleet, data show that the larger
shares of capacity are in the higher size ranges, as shown in Figure 14. Here the
importance of the range above 2,500 kW up to 3,000 kW is visible. The shares composed
of the up-to-500-kW and the 1,501-kW-through-2,000-kW sizes decreased. The other
sizes increased or remained stable. Notably, the 3,001 kW through 3,500 kW sizes
entered the fleet during this period.
Although the number of turbines in the fleet is lower in 2014, total fleet capacity is
decreasing only slightly due to substitution with higher-capacity models. The largest
turbine installed in the state is now 3.3 MW. Many of the smaller turbines use primitive
technology by current standards and are not equipped with modern electronics.
Technology in new projects allows for condition monitoring, fault diagnosis, and
operational control from remote operation centers. Turbine sizes offered for sale are
increasing around the world. Manufacturers bring larger turbines to market and can
offer a lower cost of energy (COE) due to economies of scale. Much of the technology
development today is focused on reducing the COE. Changes in turbine sizes by wind
resource area (WRA) are detailed in the following chapter on regional generation.
Figure 14: Percentage of Total Capacity by Turbine Size
Source: WPRS data set of the California Energy Commission
0%
10%
20%
30%
0to
500
501to
1000
1001to
1500
1501to
2000
2001to
2500
2501to
3000
3001to
3500
Perc
enta
ge o
f Tot
al C
apac
ity
Nameplate Capacity in kW
2014 Turbine Capacity Share 2016 Turbine Capacity Share
20
Further Turbine Fleet Changes
In comments filed with the California Public Utilities Commission (CPUC), the California
Wind Energy Association (CWEA) identified a number of existing projects likely to be in
need of repowering (CWEA, 2017). These are broken down as shown in Table 3. This
estimate is based on expiring contracts in 2014 compliance filings of the investor-owned
utilities (IOUs) with the CPUC.
Table 3: Wind Repowering Candidates
Area Nameplate Capacity (MW)
Altamont 98
San Gorgonio Pass 324
Tehachapi 709
Total 1,130
Source: California Public Utilities Commission
As of October 2017, CWEA estimates that 627 MW are already recontracted, repowered,
or new. The status of the older projects and the financial pressures they face is clarified
by a statement of CWEA:
While some of these projects have already been repowered with modern
technologies and are under new, long-term contracts, as much as 1,130
MW are still comprised of 1980s-vintage technologies that would be over
40 years old by 2030. Most of these projects are either in the last few
years of their 1980s-era “QF” [qualifying facility] contracts, are operating
under short-term contracts, or are selling directly into the California-ISO market.3
Capacity Factor Compared to Capacity The CF of each project in 2016 is compared to nameplate capacity in Figure 15. At the
small project sizes, there is a wide range of CFs, from zero to 56 percent. Factors
converge to a narrower range at the large sizes, and among the 10 largest projects, they
range from 20 to 33 percent. Examples of different sizes and capacity factors include
Mogul Energy (4 MW and 3 percent CF), Wagner Wind (6 MW and 36 percent), and Alta II
Wind Energy Center (150 MW and 27 percent). The high CFs of many small projects
demonstrate that it is possible to attain high factors at smaller project sizes through a
combination of project technology and operation. Current turbine technology and
project engineering practices allow turbines and towers to be selected for particular site
conditions, taking into account the particular wind regime at each site. Many of the
small projects could show increased CFs through modernizing equipment, repowering,
3 California Wind Energy Association (CWEA). 2017. “Comments of the California Wind Energy Association on Proposed Reference System Plan and Related Commission Policy Actions.” California Public Utilities Commission, Rulemaking 16-02-007, October 26, 2017.

21
or making other improvements to boost productivity. Such improvements would need to
be economical for project owners, and many owners of older projects are currently not
finding it beneficial to upgrade project equipment. However, tax credits and financial
incentives can improve the economics of projects.
Figure 15: Capacity Factors vs. Capacities of All Projects in 2016
Source: WPRS data set of the California Energy Commission
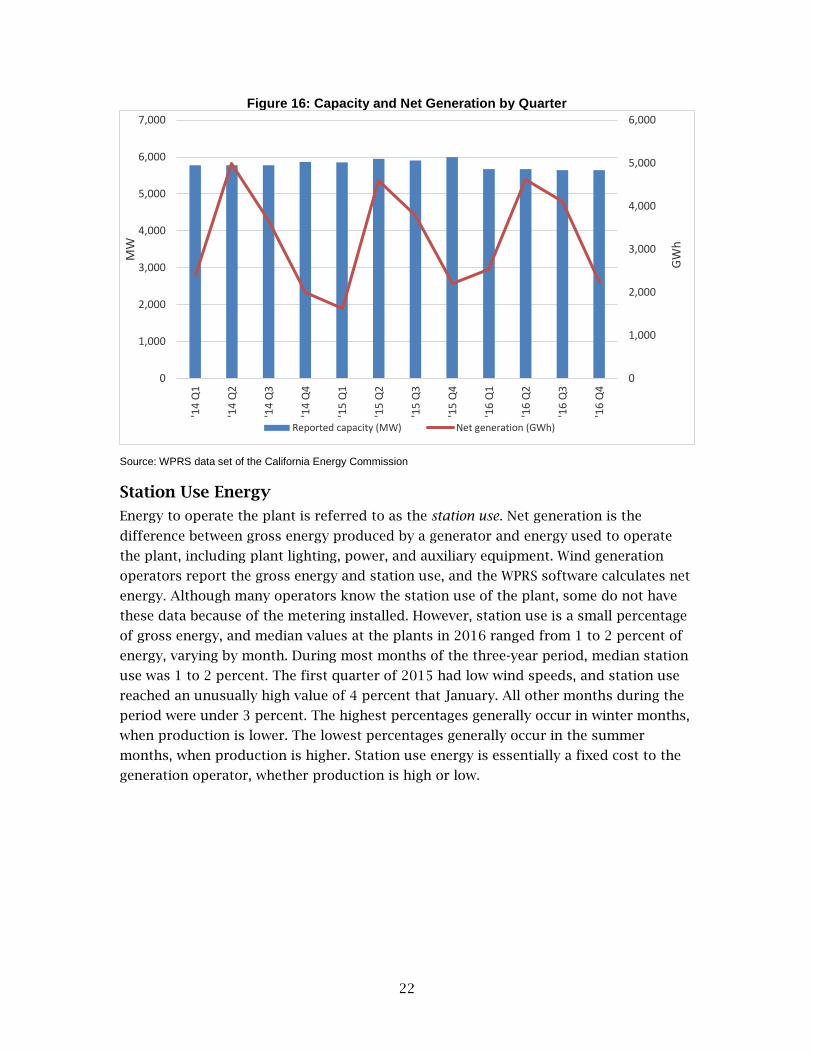
Energy Generation Over the three-year period, net reported generation was 38.8 terawatt-hours (TWh), with
an average of 12.9 TWh per year. This amount represents 24 percent of the in-state
renewable energy generation and 7 percent of all in-state generation. The pattern of
wind energy generation over the three years was similar to the pattern of CFs, with the
difference being that generation is the result of several factors, including changing
capacities over the period. Figure 16 displays capacity and net generation. Capacity
increased modestly through 2015 and then decreased. Net energy traced a cyclical
pattern, similar to the CF cycles. Breakdowns of the energy generation by part of the
state are presented in the discussion on “Wind Resource Areas” in the chapter on
“Regional Generation."
0%
10%
20%
30%
40%
50%
60%
- 50.0 100.0 150.0 200.0 250.0 300.0
2016
Pro
ject
Cap
acity
Fac
tor
Capacity (MW)
22
Figure 16: Capacity and Net Generation by Quarter
Source: WPRS data set of the California Energy Commission
Station Use Energy
Energy to operate the plant is referred to as the station use. Net generation is the
difference between gross energy produced by a generator and energy used to operate
the plant, including plant lighting, power, and auxiliary equipment. Wind generation
operators report the gross energy and station use, and the WPRS software calculates net
energy. Although many operators know the station use of the plant, some do not have
these data because of the metering installed. However, station use is a small percentage
of gross energy, and median values at the plants in 2016 ranged from 1 to 2 percent of
energy, varying by month. During most months of the three-year period, median station
use was 1 to 2 percent. The first quarter of 2015 had low wind speeds, and station use
reached an unusually high value of 4 percent that January. All other months during the
period were under 3 percent. The highest percentages generally occur in winter months,
when production is lower. The lowest percentages generally occur in the summer
months, when production is higher. Station use energy is essentially a fixed cost to the
generation operator, whether production is high or low.
0
1,000
2,000
3,000
4,000
5,000
6,000
0
1,000
2,000
3,000
4,000
5,000
6,000
7,000
'14
Q1
'14
Q2
'14
Q3
'14
Q4
'15
Q1
'15
Q2
'15
Q3
'15
Q4
'16
Q1
'16
Q2
'16
Q3
'16
Q4
GWh
MW
Reported capacity (MW) Net generation (GWh)

23
CHAPTER 3: Other Parameters of Generation Projects
In addition to capacity, energy, and capacity factor, wind generation projects can be
characterized by other parameters. These include rotor swept area, specific power, and
specific energy. Along with reported values of swept area, quantities reported by
operators can be used to calculate additional measures of power and performance.
These include specific power and specific energy, both of which are widely used in the
industry and in research and development. Examining the projects in these ways
advances understanding of the productivity of wind plants within the state.
Rotor Swept Area The swept area of a turbine rotor is the circular area defined by the rotation of the
blades. Modern turbines have a nearly horizontal axis, so the swept area is an area
within a nearly vertical plane. The offset from vertical is designed so that the flexible
blades will not hit the tower. Although energy production often increases as swept area
does, several factors affect this relationship, as discussed under the section “Specific
Power” below.
Between 2014 and 2016, the most common rotor areas in service changed with the
composition of the fleet. Table 4 lists the ranges and the most common sizes in the
fleet. To get a sense of these areas, a basketball court is 436 square meters (sq. m); an
American football field with both end zones is 5,354 sq. m; and a standard soccer field
is 7,140 sq. m. The largest rotors in service in California are nearly 10,000 sq. m, making
them larger in area than a soccer field.
Table 4: Composition of the Turbine Fleet by Rotor Area
Close of 4th Qtr.
Smallest Area (sq.
m)
Radius of Smallest
(m)
Most Common
Area (sq. m)
Radius of Most
Common (m)
Largest Area
(sq. m) Radius of
Largest (m)
2014 141 6.7 254 9.0 9,852 56
2015 141 6.7 254 9.0 9,852 56
2016 154 7.0 177 7.5 9,852 56
Source: WPRS data set of the California Energy Commission
From one-year end to the next, the largest rotor area remained the same. The smallest
area increased slightly, while the most common size decreased. Many smaller turbines
were removed from service at the end of 2015. Turbine rotor areas made and offered for
sale have been increasing nationally and worldwide. The largest turbines for sale are

24
larger than the largest ones currently installed in the state. Worldwide, turbines up to
90 m radius are in or nearing production.
Figure 17 depicts the distribution of the fleet by rotor area classes. The chart illustrates
that the fleet is heavy in the smaller rotor sizes (such as 0 to 500 sq. m). More than half
of those available to generate have rotor areas under 600 sq. m. Much of the in-service
fleet comprises older models, smaller than those installed in new projects.
Figure 17: 2016 Distribution of Turbines by Rotor Area
Source: WPRS data set of the California Energy Commission
Specific Power Specific power measures the amount of generator power per unit of rotor area,
measured in watts per square meter (W/sq. m). It depends on the capacity of the
electrical generator and the size of the turbine rotor. It is a parameter of the turbine
model and can be changed by modifications of the turbine blades or rerating the
generator. Specific power for a subset of the smallest reporting projects in the state is
also affected by the derated capacities mentioned above. With the capacity derated, the
rotor area is unchanged, and the specific power value decreases. This affects only a
small fraction of all projects. The median specific power of turbine groups ranged from
187 to 750 W/sq. m, with the median at about 380 W/sq. m.
Manufacturers have offered designs of lower specific power to the market in recent
years for use at lower wind-speed sites. This trend was not visible in the California data,
which may reflect the lack of a significant movement so far toward lower-speed sites.
Future growth may see expansion into new parts of the state with lower average wind
speeds.
At the end of 2016, there was a close relationship between turbine capacity and rotor
area. Figure 18 depicts the capacity versus area for each turbine group. The number of
0
500
1,000
1,500
2,000
2,500
3,000
3,500
4,000
Rotor Area Size Classes in m2
Num
ber o
f Tur
bine
s in
Size
Cla
ss

25
turbines in each group varies, as listed in Appendix A. The larger-rotor turbines were
present in a range of capacities.
Figure 18: Distribution of 2016 Specific Power by Turbine Group
Source: WPRS data set of the California Energy Commission
Specific Energy Specific energy is a measure of the energy produced per unit of rotor area, measured in
kWh per sq. m, and it can change with rotor modifications. It is calculated using turbine
group gross energy generation and rotor area. Operators report gross energy production
of turbine groups; that is before station use energy. Gross specific energy values are
indicated in Table 5. The values include all turbine groups that operated during the
year, including part of the year. The median shifted from year to year as operators
changed the turbines in service. A turbine group reporting low energy production
results in a low specific energy. This low production can occur if a group is undergoing
short-term maintenance but is not retired. The effect of the low wind speeds in 2015 is
visible in the lower median and maximum specific energies that year.
-
500
1,000
1,500
2,000
2,500
3,000
3,500
- 2,000 4,000 6,000 8,000 10,000
Turb
ine
Capa
city
(kW
)
Rotor Area (sq. m)
TurbineSize (kW)
26
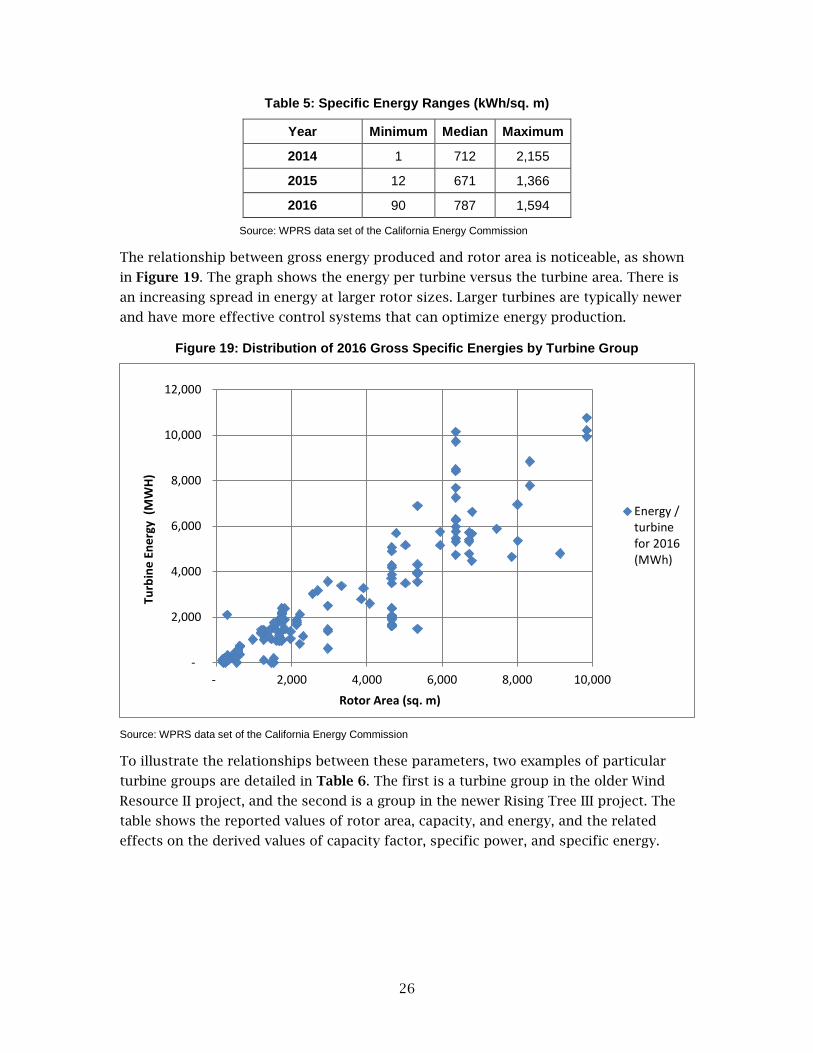
Table 5: Specific Energy Ranges (kWh/sq. m)
Year Minimum Median Maximum
2014 1 712 2,155
2015 12 671 1,366
2016 90 787 1,594
Source: WPRS data set of the California Energy Commission
The relationship between gross energy produced and rotor area is noticeable, as shown
in Figure 19. The graph shows the energy per turbine versus the turbine area. There is
an increasing spread in energy at larger rotor sizes. Larger turbines are typically newer
and have more effective control systems that can optimize energy production.
Figure 19: Distribution of 2016 Gross Specific Energies by Turbine Group
Source: WPRS data set of the California Energy Commission
To illustrate the relationships between these parameters, two examples of particular
turbine groups are detailed in Table 6. The first is a turbine group in the older Wind
Resource II project, and the second is a group in the newer Rising Tree III project. The
table shows the reported values of rotor area, capacity, and energy, and the related
effects on the derived values of capacity factor, specific power, and specific energy.
-
2,000
4,000
6,000
8,000
10,000
12,000
- 2,000 4,000 6,000 8,000 10,000
Turb
ine
Ener
gy (
MW
H)
Rotor Area (sq. m)
Energy /turbinefor 2016(MWh)

27
Table 6: Comparison of Turbine Groups Project, Group, & Start Yr.
Turbine Rotor Area (sq. m)
Turbine Capacity (kW)
Capacity Factor
Specific Power (W/sq. m)
Annual Energy /Turbine (MWh)
Specific Energy (kWh/sq. m)
Wind Resource II, Bonus, 1984
201 65 19 323 107 533
Rising Tree III, RT III, 2015
9,852 3,300 37 335 10,767 1,093
Ratios 49 51 2 1 100 2
Source: WPRS data set of the California Energy Commission
In comparing the newer Rising Tree III project to the older Wind Resource II project, the
newer project turbines are 49 times larger in area, are 51 times larger in capacity, and
produced 100 times as much energy per turbine as the older project. The newer
turbines had about the same power per unit of rotor area. The newer project achieved a
capacity factor twice as high and produced two times as much energy per unit of area.
The higher productivity of the newer project benefits from more advanced technology
and more sophisticated project engineering and design.
California’s wind projects exhibit a wind range of capacity factors. In addition to
characteristics of the turbine, natural factors also affect the CF. Projects in the state are
installed in a range of climates. Each climate has many wind speed distributions within
it. These wind speed distributions vary across topography, elevation, and slope aspect,
as well as more indirect factors such as distance from the coast. The climate affects the
distribution of wind speeds at a site, which affects the ability of a turbine to produce
electricity over time. These factors are in addition to parameters of the turbine itself.
The resulting energy production affects the capacity factor the turbine attains.
Wind Speeds and Variations from 2014 Through 2016 The power available to wind generation projects is strongly affected by the set of wind
speeds occurring at the turbines. Wind power is proportional to the cube of the wind
speed. Variations in wind speeds (averages, maxima, and speed distributions over time)
affect the energy of the wind that is available for conversion into electricity. Speed
variations occur over different time scales and across geographic areas, and available
power varies over time and space, both horizontally and vertically. In addition to
varying by location and time, speeds and speed distributions vary by direction of the
compass. These variations can be summarized by stating that wind speeds are both

28
heterogeneous and anisotropic, in addition to varying over time.4 Long-term average
wind speeds across the state are shown in Figure 20
Figure 20: Average Wind Speeds
Source: California Energy Commission, Supply Analysis Office
4 Heterogeneous refers to a property that varies from point to point across space. An example is air temperature. Anisotropic refers to a property that varies according to direction. An example is the strength of sunlight.
29
The distribution of speeds over a period at a point in space is also probabilistic
(stochastic). This means that although one can estimate the speed and direction (and the
power and output) at a point, the natural and artificial variables affecting a turbine
combine to produce an output that cannot be known precisely in advance using current
science. Better methods to estimate expected speeds are an area of active research.
WRAs are in some of the better onshore wind resource areas, although other areas of
high winds are undeveloped. The established WRAs are fairly close to electric load
centers or to transmission lines that enable energy to be delivered to markets, generally
toward the coastal side of the state.
In addition to the onshore areas, offshore wind resources exist off the coast of
California. Some California companies and universities are developing technology to
capture the offshore wind power. High average wind speeds offshore of many parts of
the coast are evident in Figure 20. These include areas from the Oregon border to
seaward of the Channel Islands of Southern California. These parts of the state are
potentially regions for future offshore wind development, subject to planning
constraints, economic conditions, and public acceptance.
Variations in wind speed from the average have been determined and mapped (AWS
Truepower, 2107), and the variations from the base 1988 to 2014 average are shown in
Appendix B. These maps capture the variations by time and location but not those by
direction. In practice, project designers now also make use of wind direction data to
estimate power output. In 2014, wind speeds were below average for most of the state
but above average for the middle of the Central Valley and the northern portion of the
state. In 2015, speeds were below average for all but a few pockets of the state. In 2016,
speeds were below average over about half the state and above average over the
northeast and south central portions of the state. Speeds on these yearly maps and on
the average speed map are depicted at 100 m high. This is in the range of likely future
wind projects as technology improves and towers become taller.
Wind speeds across North America were below average in 2015, especially in the first half, as strong winds were diverted north of California. As explained by Brower (2015).5
The most direct reason for the low winds across much of North America
in early 2015 was a large high-pressure system, known as a ridge, that
formed over the eastern North Pacific… this system caused winter and
spring storms to take a big detour into Canada before dipping back into
the United States.
Although wind speeds varied significantly from year to year, CFs varied only modestly,
and this is an interesting finding. This finding testifies to the adaptability of generators.
Newer turbines and projects are self-controlled by software at the turbine or control
5 Brower, M. December 9, 2015. “The North American ‘Wind Drought’: Is It the New Normal?” Web page,
https://www.awstruepower.com/the-north-american-wind-drought/

30
station, and the software adjusts to changing wind conditions. Some projects also have
software to optimize production for the whole project, considering the effect of all the
turbines within the project and the associated interactions, such as wake effects. Older
turbines may be controlled by mechanical devices that adjust only to varying wind
speeds.

31
CHAPTER 4: Regional Generation
Wind Resource Areas California wind generation occurs is established in six regions, known as WRAs: three in
the north and three in the south. Tehachapi is the largest of these in area, and Pacheco
is the smallest. Table 7 lists the WRAs, the counties in which they occur, and the
included areal extents (in square km).
Table 7: Wind Resource Areas, Counties, and Areas Area (north to south) Counties Area (km2)
Solano Solano 285
Altamont Alameda, Contra Costa, San Joaquin 345
Pacheco Merced 30
Tehachapi Kern 1,425
San Gorgonio Riverside 645
East San Diego Imperial, San Diego 705
Other Resource Area Monterey, San Bernardino, Shasta, Tehama, Yolo N/A
Outside Existing San Joaquin, Solano N/A
Source: Supply Analysis Office, California Energy Commission
In addition to the named WRAs, two more areas are used to localize projects. The
category of “Other Resource Area” denotes projects in other parts of the state besides
the traditional WRAs. The “Outside Existing” category indicates projects outside but
near traditional WRAs. The WRAs are depicted in Figure 21. Only the portion of the
state with WRAs and separated project locations is depicted, but projects extend from
Northern California to near the southern border.

32
Figure 21: California Wind Resource Areas
Source: California Energy Commission, Supply Analysis Office and Cartography Unit
Projects Outside Wind Resource Areas
In addition to projects within WRAs, several projects are installed in other parts of the
state. The smaller of these serve site users, which purchase their output for an adjacent
user, typically a commercial facility. A few of those outside WRAs do not serve adjacent
33
consumers, such as the Hatchet Ridge project. Projects outside WRAs are also depicted
in the figure.
The lack of precisely defined WRA boundaries in the past led staff to define the
boundaries in collaboration with the Energy Commission’s Cartography Unit during
analysis for this report. Using turbine and land-use parcel data to find the extent of
existing wind infrastructure in each WRA, boundaries were drawn around these areas.
Then, a smoothing algorithm was run to ensure each WRA was shaped simply and was
suitable for application at the statewide scale. The boundaries are inclusive, with all
turbines in each area included. There can be large distances from the boundary edge of
a WRA to the nearest turbines; distances range from 1.3 km to 14 km, and the median
distance is 6.3 km.
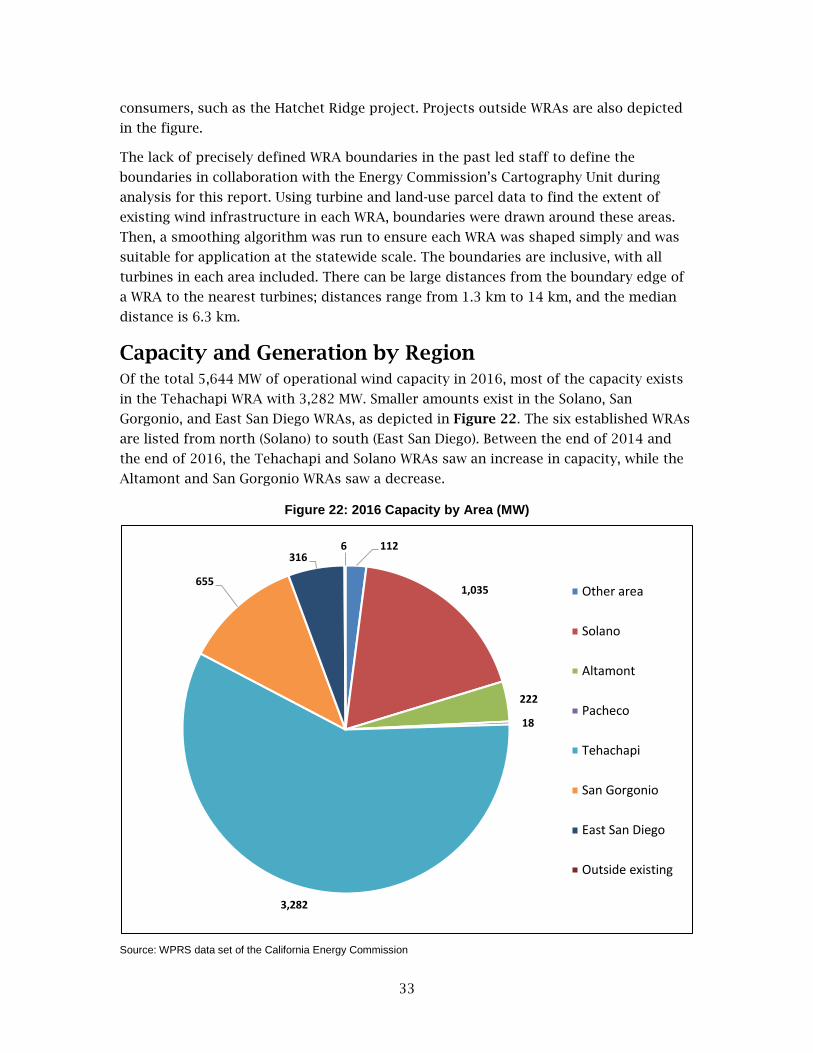
Capacity and Generation by Region Of the total 5,644 MW of operational wind capacity in 2016, most of the capacity exists
in the Tehachapi WRA with 3,282 MW. Smaller amounts exist in the Solano, San
Gorgonio, and East San Diego WRAs, as depicted in Figure 22. The six established WRAs
are listed from north (Solano) to south (East San Diego). Between the end of 2014 and
the end of 2016, the Tehachapi and Solano WRAs saw an increase in capacity, while the
Altamont and San Gorgonio WRAs saw a decrease.
Figure 22: 2016 Capacity by Area (MW)
Source: WPRS data set of the California Energy Commission
112
1,035
222
18
3,282
655
3166
Other area
Solano
Altamont
Pacheco
Tehachapi
San Gorgonio
East San Diego
Outside existing

34
Among the established WRAs, the Tehachapi area contributed by far the largest share of
generation at 57 percent of the total, and Solano was second at 18 percent in 2016.
Other WRAs had smaller shares of total generation. The category of Other Resource
Area, with projects in nonestablished areas of the state, had 2 percent of generation,
and this contributed to geographic diversification. Figure 23 shows the breakdown in
net energy by area for 2016.
Figure 23: 2016 Net Energy by Area
Source: WPRS data set of the California Energy Commission
Regional Capacity Factors Each WRA in California exhibits a slightly different profile of generation over the year.
The established WRAs show similarity in profile, peaking in the summer and being lower
in the winter. Projects at the ends of the state show a complementary profile with a
winter peak and minimum in the summer. Figure 24 displays the CFs by quarter in
2016. Here, the summer peaking is apparent in five WRAs. Altamont and Solano peak in
Quarter 3, while East San Diego County, San Gorgonio, and Tehachapi peak in Quarter 2.
The Pacheco WRA is not included here, as it has much smaller capacity than the other
five WRAs. The Other resource area comprises mostly the Hatchet Ridge project in
Shasta County and peaks in the winter. This area has a roughly opposite profile than the
other areas, and this is important to note. This complementary peaking increases
generation diversity. Existing transmission constraints can limit the ability of system
2.3%
18.3%
5.1%
0.2%
57.1%
12.0%
5.0% 0.1%
Other area
Solano
Altamont
Pacheco
Tehachapi
San Gorgonio
East San Diego
Outsideexisting
Total = 13,499 GWh
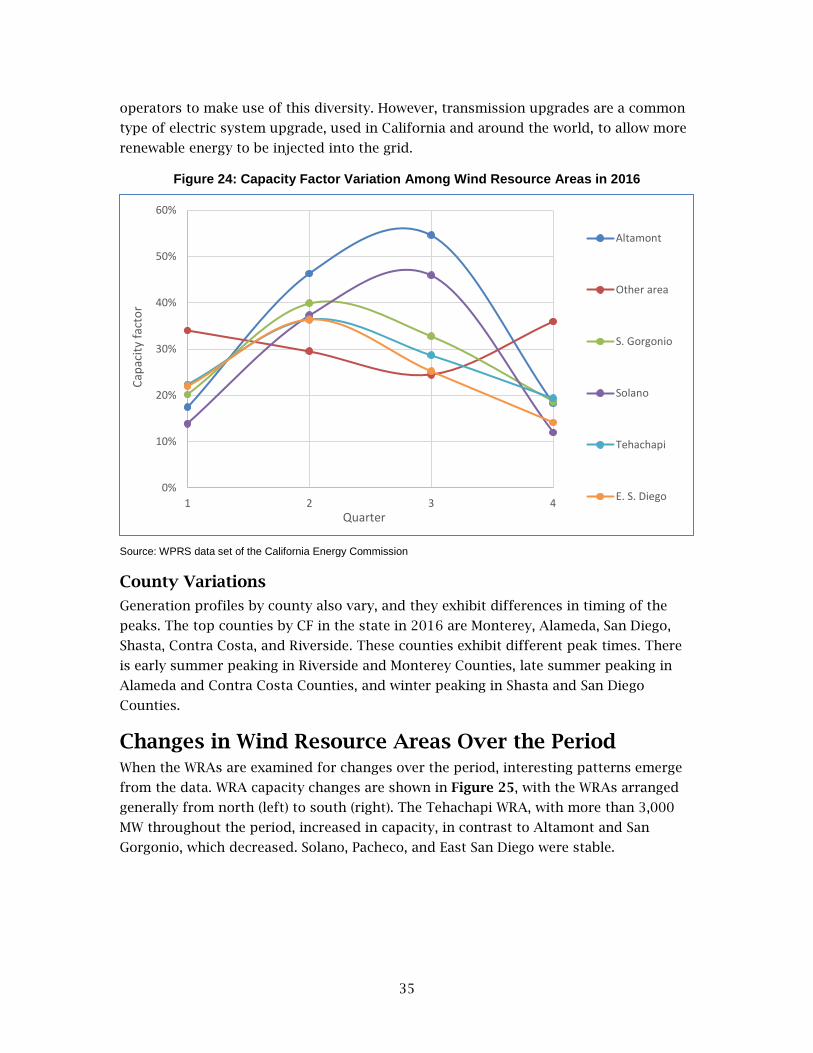
35
operators to make use of this diversity. However, transmission upgrades are a common
type of electric system upgrade, used in California and around the world, to allow more
renewable energy to be injected into the grid.
Figure 24: Capacity Factor Variation Among Wind Resource Areas in 2016
Source: WPRS data set of the California Energy Commission
County Variations
Generation profiles by county also vary, and they exhibit differences in timing of the
peaks. The top counties by CF in the state in 2016 are Monterey, Alameda, San Diego,
Shasta, Contra Costa, and Riverside. These counties exhibit different peak times. There
is early summer peaking in Riverside and Monterey Counties, late summer peaking in
Alameda and Contra Costa Counties, and winter peaking in Shasta and San Diego
Counties.
Changes in Wind Resource Areas Over the Period When the WRAs are examined for changes over the period, interesting patterns emerge
from the data. WRA capacity changes are shown in Figure 25, with the WRAs arranged
generally from north (left) to south (right). The Tehachapi WRA, with more than 3,000
MW throughout the period, increased in capacity, in contrast to Altamont and San
Gorgonio, which decreased. Solano, Pacheco, and East San Diego were stable.
0%
10%
20%
30%
40%
50%
60%
1 2 3 4
Capa
city
fact
or
Quarter
Altamont
Other area
S. Gorgonio
Solano
Tehachapi
E. S. Diego

36
Figure 25: Capacity Changes by Wind Resource Areas
Source: WPRS data set of the California Energy Commission
Changes in the net energy produced by WRA show similar patterns in the relative
magnitudes of the WRAs, as Figure 26 depicts, but the trends are different. Tehachapi
showed the effects of lower wind speeds in 2015. Solano, however, had higher
production in 2015 and lower in 2016.
Figure 26: Net Energy Changes by Wind Resource Areas
Source: WPRS data set of the California Energy Commission
-
500
1,000
1,500
2,000
2,500
3,000
3,500
Other area Solano Altamont Pacheco Tehachapi S. Gorgonio E. S. Diego Outsideexisting
Capa
city
(MW
)
2014 Capacity (MW) 2015 Capacity (MW) 2016 Capacity (MW)
-
1,000
2,000
3,000
4,000
5,000
6,000
7,000
8,000
9,000
Other area Solano Altamont Pacheco Tehachapi SanGorgonio
East SanDiego
Outsideexisting
Ener
gy (G
Wh)
2014 Energy (GWh) 2015 Energy (GWh) 2016 Energy (GWh)

37
Trends in the number of projects are shown in Figure 27. Altamont, Tehachapi, and San
Gorgonio had decreasing numbers of projects, while the other areas group had an
increase. The numbers include total projects by area. The change in number was
especially pronounced at Altamont.
There is ongoing discussion in the wind energy industry and academia about the
opportunities for replacing outdated equipment with modern equipment at existing
project sites. Data specifically about repowering are not collected in the WPRS. However,
supplemental information from operators indicates that California wind generation
projects are in transition, as retirement of older turbines eases installation of newer
technology.
Figure 27: Number of Project Changes by Wind Resource Areas
Source: WPRS data set of the California Energy Commission
The numbers of turbines by WRA changed from 2014 through 2016, as in Figure 28.
Altamont had the largest decrease. San Gorgonio also saw a modest decrease and
Tehachapi a minor decrease. Other WRAs remained stable. The mean capacity per
project increased at Altamont and Tehachapi, as Figure 29 shows. Most other WRAs
were stable in this measure.
-
10
20
30
40
50
60
Other area Solano Altamont Pacheco Tehachapi S. Gorgonio E. S. Diego Outsideexisting
Num
ber o
f Pro
ject
s
No. of 2014 Projects No. of 2015 Projects No. of 2016 Projects
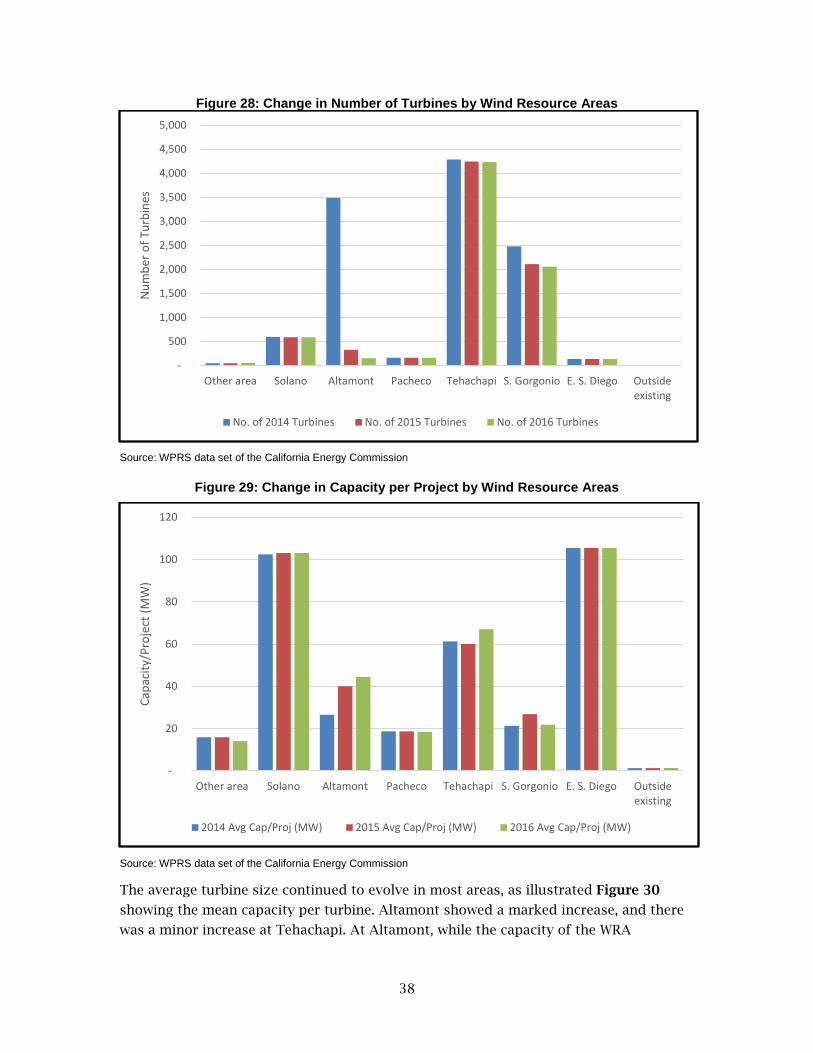
38
Figure 28: Change in Number of Turbines by Wind Resource Areas
Source: WPRS data set of the California Energy Commission
Figure 29: Change in Capacity per Project by Wind Resource Areas
Source: WPRS data set of the California Energy Commission
The average turbine size continued to evolve in most areas, as illustrated Figure 30
showing the mean capacity per turbine. Altamont showed a marked increase, and there
was a minor increase at Tehachapi. At Altamont, while the capacity of the WRA
-
500
1,000
1,500
2,000
2,500
3,000
3,500
4,000
4,500
5,000
Other area Solano Altamont Pacheco Tehachapi S. Gorgonio E. S. Diego Outsideexisting
Num
ber o
f Tur
bine
s
No. of 2014 Turbines No. of 2015 Turbines No. of 2016 Turbines
-
20
40
60
80
100
120
Other area Solano Altamont Pacheco Tehachapi S. Gorgonio E. S. Diego Outsideexisting
Capa
city
/Pro
ject
(MW
)
2014 Avg Cap/Proj (MW) 2015 Avg Cap/Proj (MW) 2016 Avg Cap/Proj (MW)
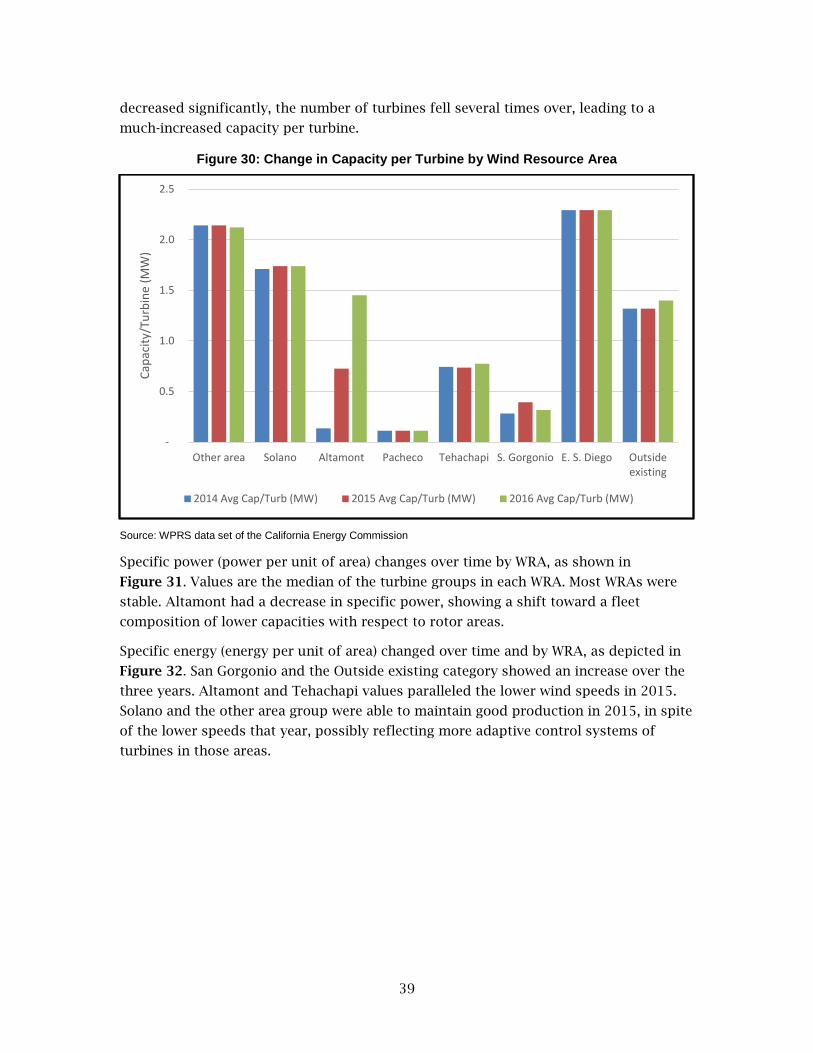
39
decreased significantly, the number of turbines fell several times over, leading to a
much-increased capacity per turbine.
Figure 30: Change in Capacity per Turbine by Wind Resource Area
Source: WPRS data set of the California Energy Commission
Specific power (power per unit of area) changes over time by WRA, as shown in
Figure 31. Values are the median of the turbine groups in each WRA. Most WRAs were
stable. Altamont had a decrease in specific power, showing a shift toward a fleet
composition of lower capacities with respect to rotor areas.
Specific energy (energy per unit of area) changed over time and by WRA, as depicted in
Figure 32. San Gorgonio and the Outside existing category showed an increase over the
three years. Altamont and Tehachapi values paralleled the lower wind speeds in 2015.
Solano and the other area group were able to maintain good production in 2015, in spite
of the lower speeds that year, possibly reflecting more adaptive control systems of
turbines in those areas.
-
0.5
1.0
1.5
2.0
2.5
Other area Solano Altamont Pacheco Tehachapi S. Gorgonio E. S. Diego Outsideexisting
Capa
city
/Tur
bine
(MW
)
2014 Avg Cap/Turb (MW) 2015 Avg Cap/Turb (MW) 2016 Avg Cap/Turb (MW)

40
Figure 31: Changes in Specific Power by Wind Resource Areas
Source: WPRS data set of the California Energy Commission
Figure 32: Changes in Specific Energy by Wind Resource Areas
Source: WPRS data set of the California Energy Commission
-
50
100
150
200
250
300
350
400
450
Other area Solano Altamont Pacheco Tehachapi SanGorgonio
East SanDiego
Outsideexisting
Spec
ific
Pow
er (W
/m2 )
2014 Median SP (W/m2) 2015 Median SP (W/m2) 2016 Median SP (W/m2)
-
100.00
200.00
300.00
400.00
500.00
600.00
700.00
800.00
900.00
1,000.00
Other area Solano Altamont Pacheco Tehachapi SanGorgonio
East SanDiego
Outsideexisting
Spec
ific
Ener
gy (k
Wh/
m2 )
2014 Median SE (kWh/m2) 2015 Median SE (kWh/m2) 2016 Median SE (kWh/m2)
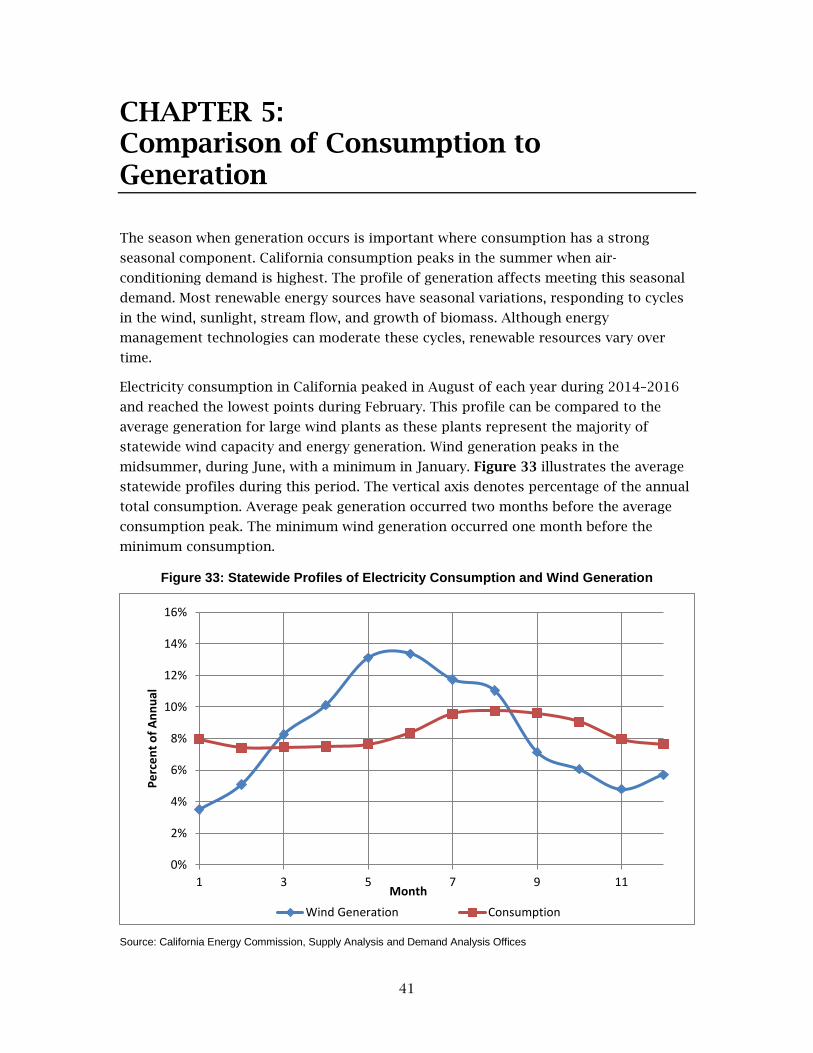
41
CHAPTER 5: Comparison of Consumption to Generation
The season when generation occurs is important where consumption has a strong
seasonal component. California consumption peaks in the summer when air-
conditioning demand is highest. The profile of generation affects meeting this seasonal
demand. Most renewable energy sources have seasonal variations, responding to cycles
in the wind, sunlight, stream flow, and growth of biomass. Although energy
management technologies can moderate these cycles, renewable resources vary over
time.
Electricity consumption in California peaked in August of each year during 2014–2016
and reached the lowest points during February. This profile can be compared to the
average generation for large wind plants as these plants represent the majority of
statewide wind capacity and energy generation. Wind generation peaks in the
midsummer, during June, with a minimum in January. Figure 33 illustrates the average
statewide profiles during this period. The vertical axis denotes percentage of the annual
total consumption. Average peak generation occurred two months before the average
consumption peak. The minimum wind generation occurred one month before the
minimum consumption.
Figure 33: Statewide Profiles of Electricity Consumption and Wind Generation
Source: California Energy Commission, Supply Analysis and Demand Analysis Offices
0%
2%
4%
6%
8%
10%
12%
14%
16%
1 3 5 7 9 11
Perc
ent o
f Ann
ual
MonthWind Generation Consumption
42
The graphs compare the monthly differences in energy over a year between electricity
consumption and wind generation. Other actions like increased efficiency, storage, and
demand management can help bridge the differences between peaks of consumption
and wind generation. Demand management and conservation price signals can motivate
consumers to shift consumption to times of more abundant energy. As these
technologies improve, bridging the differences becomes more feasible. Other renewable
resources (solar, hydropower, geothermal, and bioenergy) each have distinct profiles.
This is in contrast to conventional electric generation that can be dispatched
independent of weather variations. Grid management considers all generation sources,
renewable and conventional.
Generation and Consumption Profiles by Wind Resource Areas The difference in peak timing is not uniform for all load-serving entities (LSE) or all
WRAs. Each LSE has its own consumption profile, and the peaks of these occur earlier or
later than the generation within WRAs. WRAs lie in the service territories of four LSEs:
Pacific Gas and Electric (PG&E), Southern California Edison (SCE), San Diego Gas &
Electric, (SDG&E), and Imperial Irrigation District (IID). The generation profiles of the five
largest WRAs are compared here to the consumption profile of these LSEs. Comparison
shows how closely each WRA profile and the corresponding LSE profile match. These are
scaled to the same vertical scale, so the curves identify shape and timing differences,
and the magnitudes of consumption and generation are normalized.
When the Altamont and Solano WRAs are compared to PG&E, generation and
consumption profiles show the pattern as in Figure 34. PG&E consumption is somewhat
steady over the year with a maximum in July. Generation at Altamont peaks in May and
Solano peaks in July, so Solano more closely corresponds to the PG&E profile than
Altamont does.
The SCE consumption profile can be compared to the two WRAs within its territory, San
Gorgonio and Tehachapi, as in Figure 35. Generation at San Gorgonio peaks in May,
while Tehachapi peaks in June, which are both earlier in the summer. Of the two WRAs,
the Tehachapi peak corresponds more closely with SCE, which peaks in August.

43
Figure 34: Average Altamont and Solano Profiles with PG&E Consumption
Source: California Energy Commission, Supply Analysis and Demand Analysis Offices
Figure 35: Average San Gorgonio and Tehachapi Profiles with SCE Consumption
Source: California Energy Commission, Supply Analysis and Demand Analysis Offices
0%
2%
4%
6%
8%
10%
12%
14%
16%
18%
1 3 5 7 9 11
Perc
ent o
f Ann
ual
Month PG&E Altamont WRA Solano WRA
0%
2%
4%
6%
8%
10%
12%
14%
16%
1 3 5 7 9 11
Perc
ent o
f Ann
ual
Month SCE S. Gorgonio WRA Tehachapi WRA

44
The East San Diego County WRA lies in the IID and SDG&E territories. The consumption
profiles of these territories are compared to this WRA in Figure 36. Generation in the
East San Diego County WRA peaks in May. SDG&E consumption peaks in September, and
that in IID peaks in July, both later in the summer. This WRA matches the profile of IID
more closely than that of SDG&E.
Figure 36: East San Diego WRA Profile With SDG&E and IID Consumption
Source: California Energy Commission, Supply Analysis and Demand Analysis Offices
0%
2%
4%
6%
8%
10%
12%
14%
16%
1 3 5 7 9 11
Perc
ent o
f Ann
ual
Month SDG&E IID E. S. Diego WRA
45
CHAPTER 6: Energy Purchases
In addition to wind generation data, the California Energy Commission collects data on
wind energy purchases from in-state projects. Energy purchasers are required to report
data to meet a regulation distinct from that applied to generation operators. Parties who
report purchases of energy include public and private organizations, including utilities,
energy service providers (ESP), and site users. However, staff makes basic information
on generation projects available to purchasers to assist them in reporting accurately.
Most purchasers do not generate energy, although there are a few who participate in the
market in both roles.
Electricity totaling 36.9 TWh was reported purchased from in-state projects from 2014
through 2016. This electricity consisted of 12.7 TWh in 2014, 11.2 TWh in 2015, and
13.0 TWh in 2016. Over the three-year period, nearly 80 percent of the energy was
purchased by IOUs, with smaller fractions by publicly owned utilities (POU), ESPs, and
community choice aggregators (CCA). On-site users and CCAs each purchased less than
2 percent of the energy. CCAs started purchasing wind energy in 2015.
From 2014 through 2016, reported wind energy purchases were less than reported net
generation by 1.9 TWh or 5 percent, perhaps due to a couple reasons. In some cases, the
purchasing party contracted to purchase a mixture of renewable energy, with the
percentages determined by the seller. The purchaser did not always know the specific
type of green energy it received. Human error could also affect the reports. Generation
operators and energy purchasers are not required by law to coordinate their data
reports.
The shares purchased by IOUs and POUs decreased over time. In contrast, the shares by
ESPs, CCAs, and site users increased. These trends are shown in Figure 37. Site users
and CCAs were relatively small parts of the total energy purchases, but those parts grew
over the period.

46
Figure 37: Changing Mix of Wind Energy Purchasers
Source: WPRS data set of the California Energy Commission
Figure 38 depicts a breakout of the smaller energy purchases. The graph shows the
smallest shares by the CCAs and site users, along with the predominant share by the
IOUs.
Energy purchases by quarter parallel the generation over a year, with the largest amount
in the second quarter. Purchases in the first and fourth quarters are lower, and the
variability is highest in the first quarter. Figure 39 shows the amount purchased by
quarter over the period. The values are influenced by the low wind conditions in 2015.
0%
10%
20%
30%
40%
50%
60%
70%
80%
90%
100%
2014 2015 2016 3-year period
Site user
CCA
ESP
POU
IOU

47
Figure 38: Breakout of the Smaller Purchaser Types
Source: WPRS data set of the California Energy Commission
Figure 39: Wind Energy Purchased by Quarter, 2014–2016
Source: WPRS data set of the California Energy Commission
9.26%
79.12%
9.82%1.45%
0.36%
1.81%
ESP IOU POU CCA Site user
-
1,000
2,000
3,000
4,000
5,000
6,000
Qtr 1 Qtr 2 Qtr 3 Qtr 4
GWh/
Qua
rter
Minimum
Mean
Maximum
48
CHAPTER 7: Conclusions
Statewide Generation and Characteristics Wind generators in California produced almost 13,000 GWh annually during 2014
through 2016. This amount was enough energy to supply almost two million households
in the state. At the end of 2016, there was more than 5,600 MW capacity available to
generate. Total capacity was essentially stable over the period. In-state wind generation
comprised 7 percent of electric energy generated and 7 percent of capacity in the state
in 2016. Production peaked in the second or third calendar quarter of each year.
Statewide CFs for all projects ranged from 24 to 27 percent annually, which included the
full range of project vintages and sizes. The CF in 2016 fell in the middle of other in-
state electricity sources, being higher than the CF of natural gas and lower than that of
small hydropower. The combined capacity factors are lower than would be expected for
individual new wind projects, which are larger, benefit from economy of scale, and use
modern technology. Larger turbines typically have more effective control systems that
can optimize energy production.
The number of turbines decreased to 7,400 and the average capacity per turbine
increased from 0.5 MW to 0.8 MW. There was a decrease in the number of turbines in
the 0-to-500-kW class and an increase in the 3,000-to-3,500-kW class. By the number of
turbines, the smallest size class still made up the largest group of all the size classes.
Capacity factors by quarter for the full period peaked in Quarter 2 at 37 percent and
were lowest in Quarter 4 at 17 percent. For the total of the large projects, CF reached 42
percent in June and was at 11 percent in January. These factors include turbines that
were available but had restricted operating hours as required by counties or the grid
operator.
Capacity factors are cyclical through a year. Variation in CF from year to year was from
36 to 40 percent annually in Quarter 2 and from 29 to 33 percent in Quarter 3.
Individual project CFs range more widely, up to a maximum 56 percent annually. Over
the full three-year period, the highest individual project CF was 48 percent. During
specific months, some projects attain almost 80 percent. These variations exemplify the
great variety in operating projects across the state. Both man-made and natural factors
contribute to net CF. Small projects exhibit a wide spread in CF, with the spread
narrowing in larger projects.
Median project station use energy ranged from 1 to 2 percent of gross production in
2016. It was higher in winter months, when gross production was lower.
At the end of 2016, the smallest rotors were 154 square meters, and the largest rotors
were 9,852 sq. m. These areas corresponded to rotor radii of 7 m and 56 m. Specific

49
power ranged from 187 to 750 W/sq. m. Specific energy ranged from 90 to
1,594 kWh/sq. m in 2016.
Staff also statistically compared CF to turbine capacity and rotor area and found that
neither association had a very high correlation. This finding is not surprising given the
great range in project ages and equipment vintages. Operational projects range from
those on the margin of becoming unprofitable to those with current technology and
many years of life remaining.
The composition of wind projects and the turbine fleet, and the operators and owners,
change continually in an active market of project ownership. Among the top operating
companies at the end of 2016 by share of total capacity, NRG Energy, Inc. was the
leader, followed by EDF Renewable Energy; Terra-Gen, LLC; and Avangrid Renewables,
LLC.
A recent trend is the installation of a single or pairs of commercial turbines at sites of
business energy consumers, such as commercial or industrial firms. These projects are
structured to supply part of the energy consumed at the site. Four projects like this
began during the period.
Wind Speed Resources From 2014 Through 2016 Wind speed is a primary factor in turbine energy production. It may be considered the
fuel that drives the wind generator. Higher wind speeds usually lead to higher electrical
generation. Wind speeds in 2015 were below average in much of the state, but they were
above average over most of the state in 2016. The lower CF in 2015 compared to 2014
or 2016 can be explained largely by the variation in wind speeds in those years.
Similarly, the higher CF in 2016 is explained largely by the higher-than-average wind
speeds that year. Although other factors contribute to the electricity yield, the fact that
the actual generation and speeds confirm one another indicates the high quality of the
generation data set.
Regional Generation California’s climates have differing wind regimes and wind speed distributions. Wind
generators in different parts of the state show different productivity and profiles. In
order of capacity, the wind resource areas are Tehachapi, Solano, San Gorgonio, East San
Diego, Altamont, and Pacheco. Tehachapi had the largest capacity at 3,282 MW and
produced the largest share of energy at 57 percent of the total. Altamont and Solano
generation peaked in Quarter 3, and San Gorgonio, Tehachapi, and San Diego peaked in
Quarter 2. Altamont had the highest CFs over most of the year.
Notable changes over the period were:
• A decrease in capacity at Altamont.
• A decrease in number of projects at Altamont and San Gorgonio.
50
• A decrease in number of turbines at Altamont and San Gorgonio.
• An increase in capacity per project at Altamont.
• An increase in capacity per turbine at Altamont.
• An increase in specific energy at San Gorgonio.
California wind plants are in transition, as the retirement of older turbines lays the
groundwork for repowering. As well as in WRAs, projects exist in newer areas, such as a
large project in Shasta County and small projects from Tehama to San Bernardino
Counties. Future growth may see expansion into lower-wind regions of the state.
Successful project design is based on site-specific analysis of wind power available.
Consumption Compared to Generation Electricity demand in California depends on seasonal temperature cycles, which make
the profile of generation important. California statewide wind generation peaks in June
and is lowest in January. Electricity consumption peaks in August and reaches the low
point in February. The wind generation peak thus occurs two months before the
consumption peak, and wind generation is lowest one month before the consumption
low.
The timing of consumption and generation varies by WRA and utility. In PG&E,
consumption peaks in July. Generation at Altamont peaks in May and at Solano in July,
making Solano a closer match. In SCE, consumption peaks in August. Generation at San
Gorgonio peaks in May and at Tehachapi in June, making Tehachapi fit closer. In SDG&E,
consumption peaks in September, and in the Imperial Irrigation District, it peaks in July.
The East San Diego WRA peaks in May, closer to the IID peak.
Wind Energy Purchases The Energy Commission also collects wind energy purchases data from in-state plants.
Purchasing parties can be POUs, IOUs, ESPs, CCAs, or on-site users. The largest share of
purchases in 2016 was by IOUs, with almost 80 percent. POUs purchased 10 percent and
ESPs 9 percent. The mix of energy purchases changed over time. Site users and CCAs
purchased larger amounts, and IOUs purchased smaller amounts. The second quarter
saw the largest amounts purchased, with the first or fourth quarter the lowest amounts,
depending on the year.
Final Observations Wind energy generation during 2014 through 2016 contributed significantly to state
energy goals. Electricity generated supported the Renewables Portfolio Standard, helped
reduce greenhouse gas emissions, and provided economic activity and employment in
locations across nearly the length of the state from Shasta to Imperial Counties and
from coastal to inland sites. As state energy goals call for increasing shares of total

51
generation to come from renewable sources, policy makers and others will continue to
need complete, reliable information on the status of wind energy generation and energy
purchases.
This report is a primary source of information and is based on data from the generator
operators and parties who purchase energy. It provides an understanding of the wind
energy situation in the state for the three-year period of 2014 through 2016. It follows a
previous report of the Energy Commission that provided a more comprehensive look for
2014. Wind energy data used in preparing this report has been made public by the
Energy Commission.
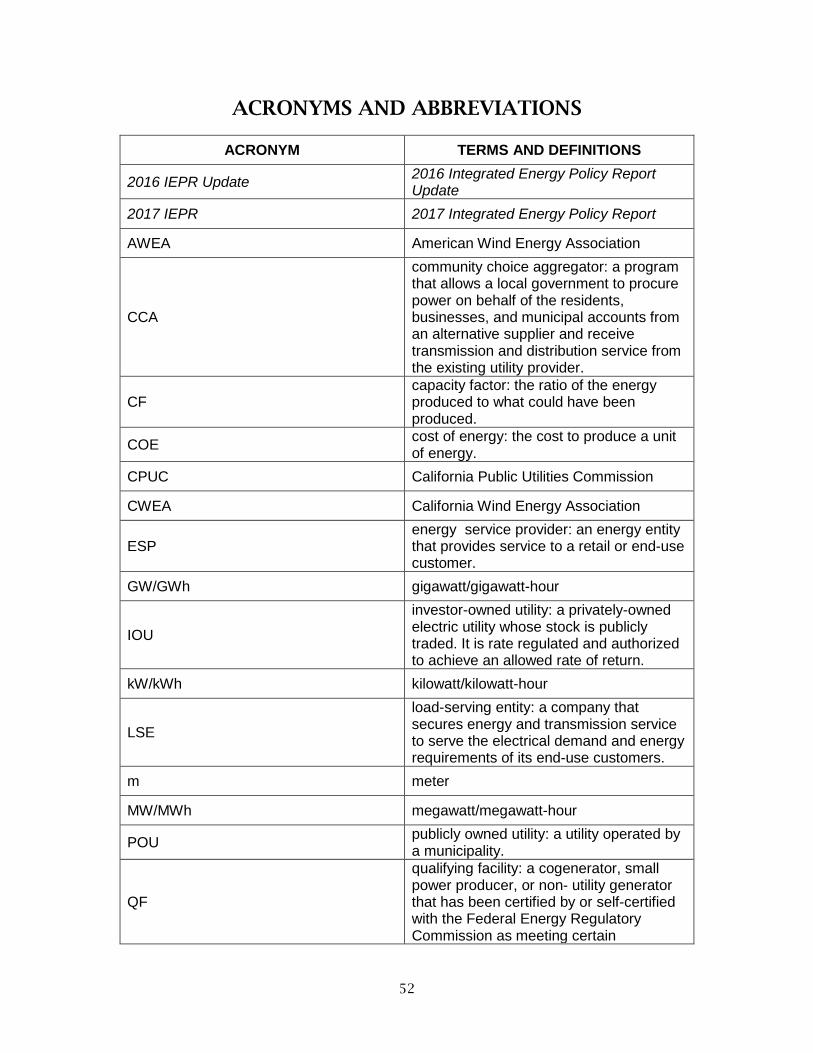
52
ACRONYMS AND ABBREVIATIONS
ACRONYM TERMS AND DEFINITIONS
2016 IEPR Update 2016 Integrated Energy Policy Report Update
2017 IEPR 2017 Integrated Energy Policy Report
AWEA American Wind Energy Association
CCA
community choice aggregator: a program that allows a local government to procure power on behalf of the residents, businesses, and municipal accounts from an alternative supplier and receive transmission and distribution service from the existing utility provider.
CF capacity factor: the ratio of the energy produced to what could have been produced.
COE cost of energy: the cost to produce a unit of energy.
CPUC California Public Utilities Commission
CWEA California Wind Energy Association
ESP energy service provider: an energy entity that provides service to a retail or end-use customer.
GW/GWh gigawatt/gigawatt-hour
IOU
investor-owned utility: a privately-owned electric utility whose stock is publicly traded. It is rate regulated and authorized to achieve an allowed rate of return.
kW/kWh kilowatt/kilowatt-hour
LSE
load-serving entity: a company that secures energy and transmission service to serve the electrical demand and energy requirements of its end-use customers.
m meter
MW/MWh megawatt/megawatt-hour
POU publicly owned utility: a utility operated by a municipality.
QF
qualifying facility: a cogenerator, small power producer, or non- utility generator that has been certified by or self-certified with the Federal Energy Regulatory Commission as meeting certain

53
ownership, operating and efficiency criteria.
Sq. m or m2 square meter
TWh terawatt-hour: 1,000 gigawatt-hours
W watt: a unit of electric power.
WPRS
Wind Performance Reporting System: the system of collecting wind energy data mandated by the California Code of Regulations.
WRA wind resource area: one of the particular areas in California containing a concentration of wind generation projects.

54
References
American Wind Energy Association (AWEA), 2016a. Market Database Pro database,
accessed multiple dates.
AWS Truepower, 2017. 2014, 2015, and 2016, Annual Wind Anomaly Map for
California, unpublished maps prepared for California Energy Commission, Supply
Analysis Office, November 2017.
Bailey, B. 2006. California Energy Commission. California Wind Energy Resource
Modeling and Measurement: Measurement Program Final Report. Publication Number
CEC-500-2006-066.
Brower, M. December 9, 2015. “The North American ‘Wind Drought’: Is It the New
Normal?” Web page, https://www.awstruepower.com/the-north-american-wind-drought/
California Energy Commission. 2018. "Electric Generation Capacity & Energy." Accessed
January 24, 2018.
http://www.energy.ca.gov/almanac/electricity_data/electric_generation_capacity.html.
Energy Information Administration. 2018. Annual Energy Outlook 2018. U.S. Energy
Information Administration. Publication Number: AEO2018.
California Wind Energy Association (CWEA). 2017. “Comments of the California Wind
Energy Association on Proposed Reference System Plan and Related Commission Policy
Actions.” California Public Utilities Commission, Rulemaking 16-02-007, October 26,
2017.
Christenson, C., 2014. Personal communication, February 20, 2014.
Financial Times. January 23, 2017. “UK Wind Farm Costs Fall Almost a Third in 4 Years.”
London.
Gasch, R. and J. Twele, 2002. Wind Power Plants: Fundamentals, Design, Construction and
Operation. Solarpraxis AG, Berlin.
Hingtgen, J., et al. 2017. Wind Energy in California: 2014 Description, Analysis, and
Context. California Energy Commission, Publication Number: CEC-200-2017-001.
International Electrotechnical Commission (IEC), 2005a. Wind Turbines – Part 2-1: Power
Performance Measurements of Electricity Producing Wind Turbines, 2005-12, first
edition.
Jacobson et al., 2014. “A Roadmap for Repowering California for All Purposes With
Wind, Water, and Sunlight.” Energy 73 (875-889).
Manwell, J. F., J. G. McGowan, and Anthony L. Rogers. 2009. Wind Energy Explained:
Theory, Design and Application, second edition. Wiley.

55
Nelson, Vaughn. 2009. Wind Energy: Renewable Energy and the Environment. Boca
Raton: CRC Press.
Patel, Mukund R. 2006. Wind and Solar Power Systems: Design, Analysis, and Operation.
Boca Raton, FL: Taylor & Francis.
Sayigh, Ali. 2012. Comprehensive Renewable Energy. Amsterdam: Elsevier.
Simon, Rich, 2016. Personal communication, August 8, 2016.
TrueWind Solutions, LLC, Michael Brower. 2002. “New Wind Energy Resource Maps. Wind
Data Set and Revisions Prepared for the Energy Commission in Studies Dated November
2002. Contract Number 500- 01-009. Publication Number 500-02-055F.
Wind-turbine-models, 2016. http://en.wind-turbine-models.com/accessed on multiple
dates.
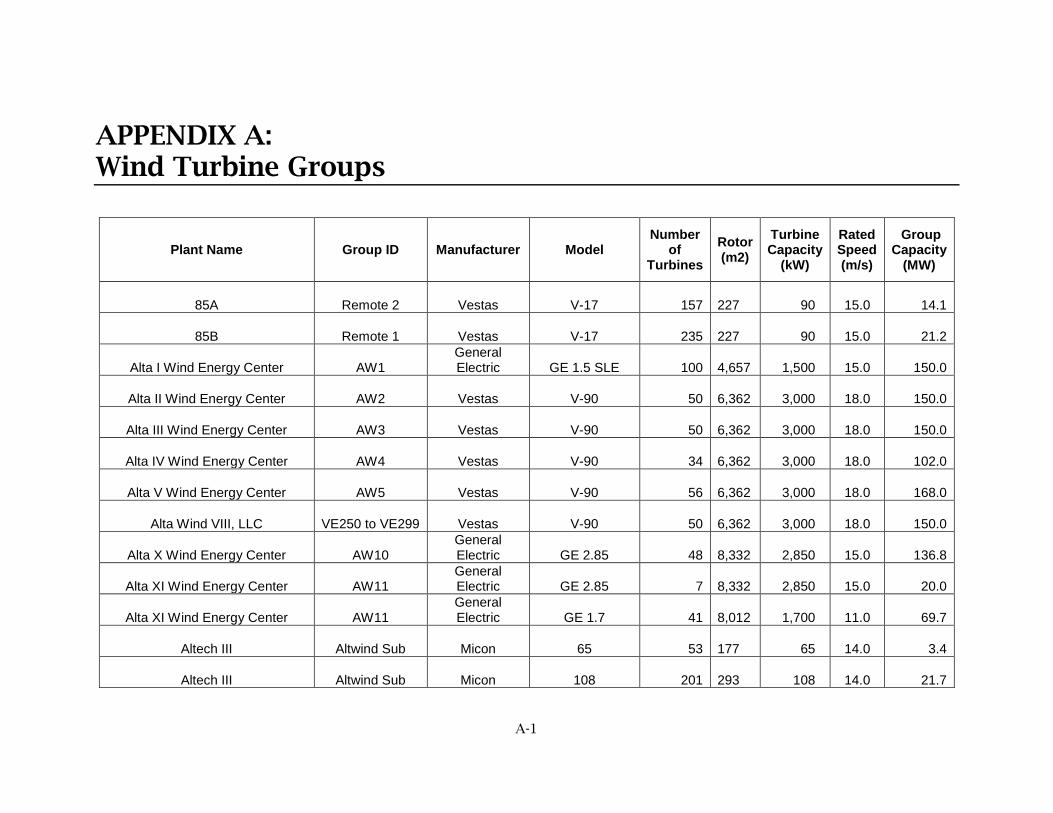
A-1
APPENDIX A: Wind Turbine Groups
Plant Name Group ID Manufacturer Model Number
of Turbines
Rotor (m2)
Turbine Capacity
(kW)
Rated Speed (m/s)
Group Capacity
(MW)
85A Remote 2 Vestas V-17 157 227 90 15.0 14.1
85B Remote 1 Vestas V-17 235 227 90 15.0 21.2
Alta I Wind Energy Center AW1 General Electric GE 1.5 SLE 100
4,657 1,500 15.0 150.0
Alta II Wind Energy Center AW2 Vestas V-90 50 6,362 3,000 18.0 150.0
Alta III Wind Energy Center AW3 Vestas V-90 50 6,362 3,000 18.0 150.0
Alta IV Wind Energy Center AW4 Vestas V-90 34 6,362 3,000 18.0 102.0
Alta V Wind Energy Center AW5 Vestas V-90 56 6,362 3,000 18.0 168.0
Alta Wind VIII, LLC VE250 to VE299 Vestas V-90 50 6,362 3,000 18.0 150.0
Alta X Wind Energy Center AW10 General Electric GE 2.85 48
8,332 2,850 15.0 136.8
Alta XI Wind Energy Center AW11 General Electric GE 2.85 7
8,332 2,850 15.0 20.0
Alta XI Wind Energy Center AW11 General Electric GE 1.7 41
8,012 1,700 11.0 69.7
Altech III Altwind Sub Micon 65 53 177 65 14.0 3.4
Altech III Altwind Sub Micon 108 201 293 108 14.0 21.7

A-2
Plant Name Group ID Manufacturer Model Number
of Turbines
Rotor (m2)
Turbine Capacity
(kW)
Rated Speed (m/s)
Group Capacity
(MW)
Anheuser-Busch 1 General Electric GE 1.5 SLE 1
4,657 1,500 14.0 1.5
Anheuser-Busch #2 1 General Electric GE 1.85 1
5,345 1,600 10.0 1.6
Buena Vista Energy LLC Buena Vista Mitsubishi MWT-1000 38 2,960 1,000 13.0 38.0
Cabazon Wind WT RRB 600 1 2,209 600 4.0 0.6
Cabazon Wind WT ZOND Z-750 51 2,304 750 5.0 38.3
Cabazon Wind Partners, LLC All Vestas V-47 62 1,735 660 15.0 40.9
Cameron Ridge Micon 108 Micon 108 34 281 108 16.0 3.7
Cameron Ridge Micon 700 Micon 700 80 660 700 19.0 56.0
Cemex BMQ GE 1.5 SLE General Electric GE 1.5 SLE 2
4,657 1,500 14.0 3.0
Cemex Madison 1 General Electric GE 1.5 SLE 1
4,657 1,000 10.0 1.0
Cemex River Plant 1 General Electric GE 1.62 SLE 2
5,346 1,620 12.0 3.2
City of Soledad 1 General Electric GE 1.85 SLE 1
5,345 1,000 10.0 1.0
Coram California Development, L.P.
WTG01 to WTG34 Vestas V-90 34
6,362 3,000 18.0 102.0
Coram Energy LLC BT 3 General Electric GE 1.5 SLE 10
4,657 1,500 14.0 15.0
Coram Tehachapi LP BT 4 Vestas V-27 29 573 225 16.0 6.5
Diablo Wind LLC Vesta V-47 Vestas V-47 31 1,735 580 17.0 18.0
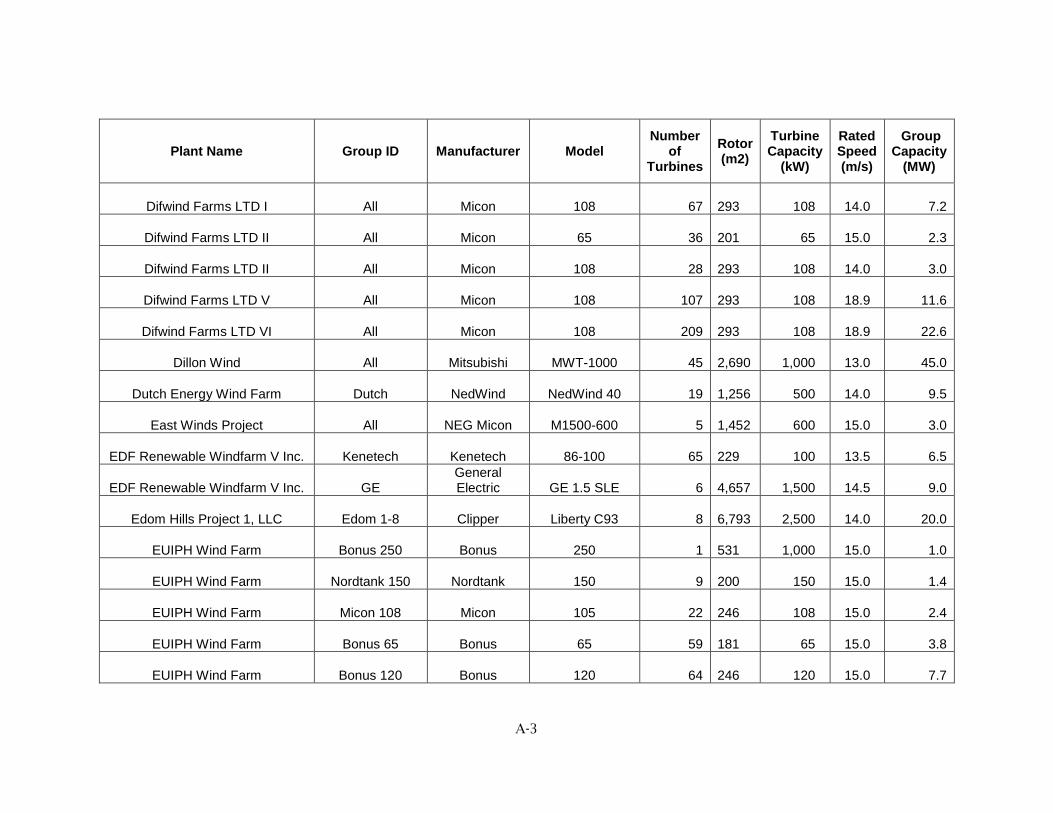
A-3
Plant Name Group ID Manufacturer Model Number
of Turbines
Rotor (m2)
Turbine Capacity
(kW)
Rated Speed (m/s)
Group Capacity
(MW)
Difwind Farms LTD I All Micon 108 67 293 108 14.0 7.2
Difwind Farms LTD II All Micon 65 36 201 65 15.0 2.3
Difwind Farms LTD II All Micon 108 28 293 108 14.0 3.0
Difwind Farms LTD V All Micon 108 107 293 108 18.9 11.6
Difwind Farms LTD VI All Micon 108 209 293 108 18.9 22.6
Dillon Wind All Mitsubishi MWT-1000 45 2,690 1,000 13.0 45.0
Dutch Energy Wind Farm Dutch NedWind NedWind 40 19 1,256 500 14.0 9.5
East Winds Project All NEG Micon M1500-600 5 1,452 600 15.0 3.0
EDF Renewable Windfarm V Inc. Kenetech Kenetech 86-100 65 229 100 13.5 6.5
EDF Renewable Windfarm V Inc. GE General Electric GE 1.5 SLE 6
4,657 1,500 14.5 9.0
Edom Hills Project 1, LLC Edom 1-8 Clipper Liberty C93 8 6,793 2,500 14.0 20.0
EUIPH Wind Farm Bonus 250 Bonus 250 1 531 1,000 15.0 1.0
EUIPH Wind Farm Nordtank 150 Nordtank 150 9 200 150 15.0 1.4
EUIPH Wind Farm Micon 108 Micon 105 22 246 108 15.0 2.4
EUIPH Wind Farm Bonus 65 Bonus 65 59 181 65 15.0 3.8
EUIPH Wind Farm Bonus 120 Bonus 120 64 246 120 15.0 7.7
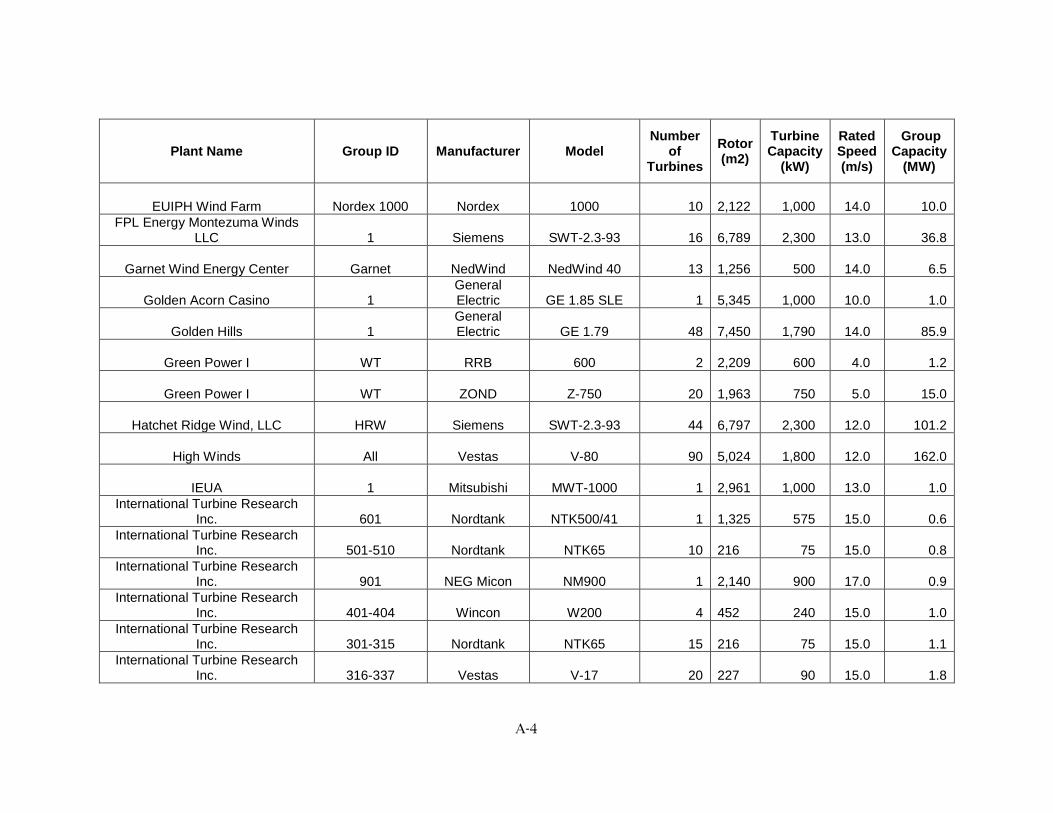
A-4
Plant Name Group ID Manufacturer Model Number
of Turbines
Rotor (m2)
Turbine Capacity
(kW)
Rated Speed (m/s)
Group Capacity
(MW)
EUIPH Wind Farm Nordex 1000 Nordex 1000 10 2,122 1,000 14.0 10.0
FPL Energy Montezuma Winds LLC 1 Siemens SWT-2.3-93 16
6,789 2,300 13.0 36.8
Garnet Wind Energy Center Garnet NedWind NedWind 40 13 1,256 500 14.0 6.5
Golden Acorn Casino 1 General Electric GE 1.85 SLE 1
5,345 1,000 10.0 1.0
Golden Hills 1 General Electric GE 1.79 48
7,450 1,790 14.0 85.9
Green Power I WT RRB 600 2 2,209 600 4.0 1.2
Green Power I WT ZOND Z-750 20 1,963 750 5.0 15.0
Hatchet Ridge Wind, LLC HRW Siemens SWT-2.3-93 44 6,797 2,300 12.0 101.2
High Winds All Vestas V-80 90 5,024 1,800 12.0 162.0
IEUA 1 Mitsubishi MWT-1000 1 2,961 1,000 13.0 1.0
International Turbine Research Inc. 601 Nordtank NTK500/41 1
1,325 575 15.0 0.6
International Turbine Research Inc. 501-510 Nordtank NTK65 10
216 75 15.0 0.8
International Turbine Research Inc. 901 NEG Micon NM900 1
2,140 900 17.0 0.9
International Turbine Research Inc. 401-404 Wincon W200 4
452 240 15.0 1.0
International Turbine Research Inc. 301-315 Nordtank NTK65 15
216 75 15.0 1.1
International Turbine Research Inc. 316-337 Vestas V-17 20
227 90 15.0 1.8
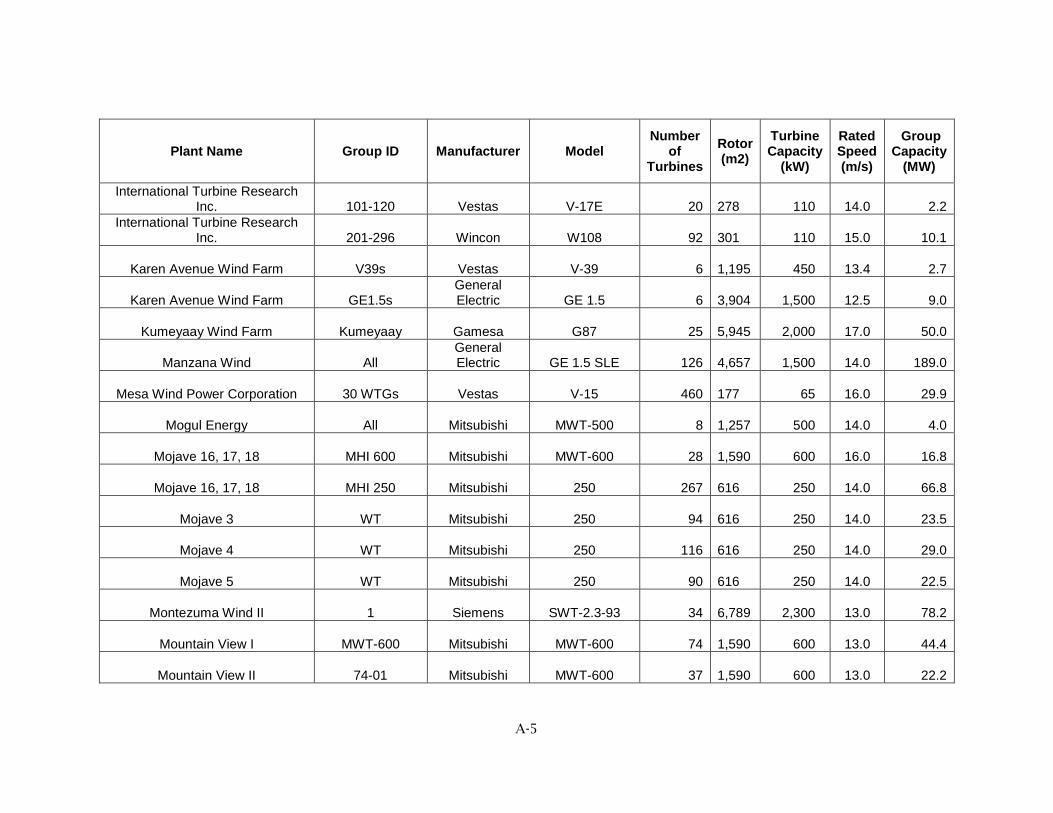
A-5
Plant Name Group ID Manufacturer Model Number
of Turbines
Rotor (m2)
Turbine Capacity
(kW)
Rated Speed (m/s)
Group Capacity
(MW)
International Turbine Research Inc. 101-120 Vestas V-17E 20
278 110 14.0 2.2
International Turbine Research Inc. 201-296 Wincon W108 92
301 110 15.0 10.1
Karen Avenue Wind Farm V39s Vestas V-39 6 1,195 450 13.4 2.7
Karen Avenue Wind Farm GE1.5s General Electric GE 1.5 6
3,904 1,500 12.5 9.0
Kumeyaay Wind Farm Kumeyaay Gamesa G87 25 5,945 2,000 17.0 50.0
Manzana Wind All General Electric GE 1.5 SLE 126
4,657 1,500 14.0 189.0
Mesa Wind Power Corporation 30 WTGs Vestas V-15 460 177 65 16.0 29.9
Mogul Energy All Mitsubishi MWT-500 8 1,257 500 14.0 4.0
Mojave 16, 17, 18 MHI 600 Mitsubishi MWT-600 28 1,590 600 16.0 16.8
Mojave 16, 17, 18 MHI 250 Mitsubishi 250 267 616 250 14.0 66.8
Mojave 3 WT Mitsubishi 250 94 616 250 14.0 23.5
Mojave 4 WT Mitsubishi 250 116 616 250 14.0 29.0
Mojave 5 WT Mitsubishi 250 90 616 250 14.0 22.5
Montezuma Wind II 1 Siemens SWT-2.3-93 34 6,789 2,300 13.0 78.2
Mountain View I MWT-600 Mitsubishi MWT-600 74 1,590 600 13.0 44.4
Mountain View II 74-01 Mitsubishi MWT-600 37 1,590 600 13.0 22.2
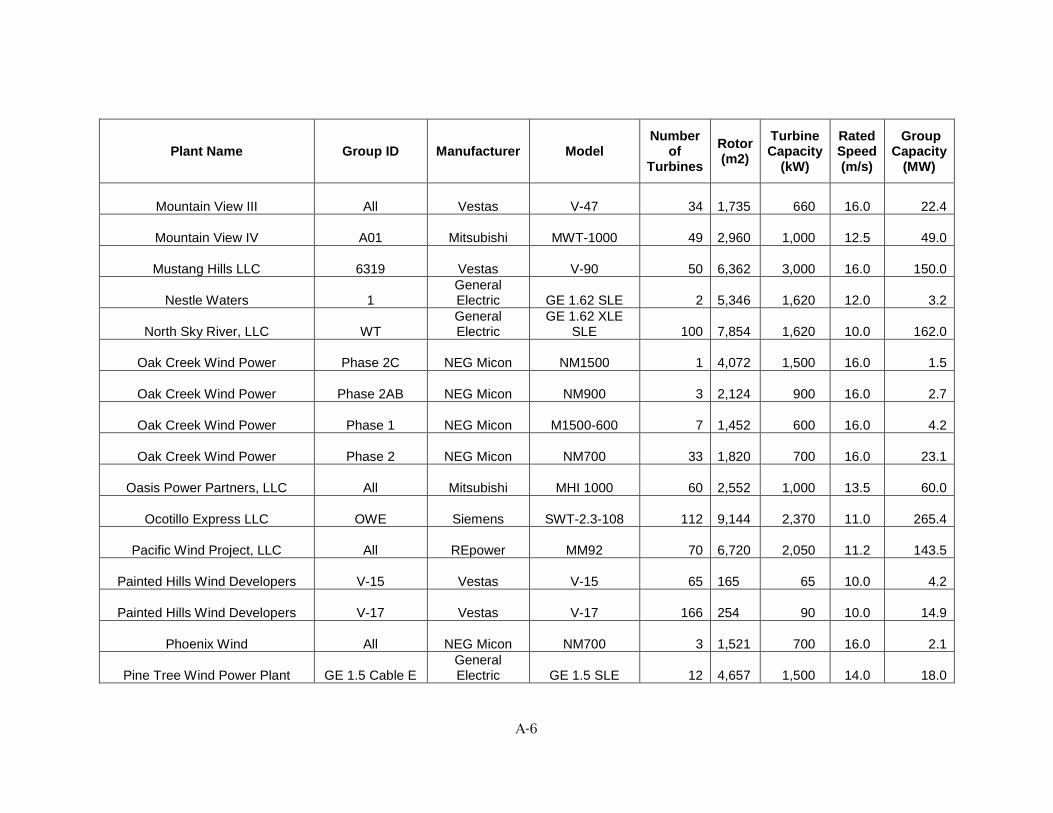
A-6
Plant Name Group ID Manufacturer Model Number
of Turbines
Rotor (m2)
Turbine Capacity
(kW)
Rated Speed (m/s)
Group Capacity
(MW)
Mountain View III All Vestas V-47 34 1,735 660 16.0 22.4
Mountain View IV A01 Mitsubishi MWT-1000 49 2,960 1,000 12.5 49.0
Mustang Hills LLC 6319 Vestas V-90 50 6,362 3,000 16.0 150.0
Nestle Waters 1 General Electric GE 1.62 SLE 2
5,346 1,620 12.0 3.2
North Sky River, LLC WT General Electric
GE 1.62 XLE SLE 100
7,854 1,620 10.0 162.0
Oak Creek Wind Power Phase 2C NEG Micon NM1500 1 4,072 1,500 16.0 1.5
Oak Creek Wind Power Phase 2AB NEG Micon NM900 3 2,124 900 16.0 2.7
Oak Creek Wind Power Phase 1 NEG Micon M1500-600 7 1,452 600 16.0 4.2
Oak Creek Wind Power Phase 2 NEG Micon NM700 33 1,820 700 16.0 23.1
Oasis Power Partners, LLC All Mitsubishi MHI 1000 60 2,552 1,000 13.5 60.0
Ocotillo Express LLC OWE Siemens SWT-2.3-108 112 9,144 2,370 11.0 265.4
Pacific Wind Project, LLC All REpower MM92 70 6,720 2,050 11.2 143.5
Painted Hills Wind Developers V-15 Vestas V-15 65 165 65 10.0 4.2
Painted Hills Wind Developers V-17 Vestas V-17 166 254 90 10.0 14.9
Phoenix Wind All NEG Micon NM700 3 1,521 700 16.0 2.1
Pine Tree Wind Power Plant GE 1.5 Cable E General Electric GE 1.5 SLE 12
4,657 1,500 14.0 18.0

A-7
Plant Name Group ID Manufacturer Model Number
of Turbines
Rotor (m2)
Turbine Capacity
(kW)
Rated Speed (m/s)
Group Capacity
(MW)
Pine Tree Wind Power Plant GE 1.5 Cable C General Electric GE 1.5 SLE 14
4,657 1,500 14.0 21.0
Pine Tree Wind Power Plant GE 1.5 Cable A General Electric GE 1.5 SLE 16
4,657 1,500 14.0 24.0
Pine Tree Wind Power Plant GE 1.5 Cable B General Electric GE 1.5 SLE 16
4,657 1,500 14.0 24.0
Pine Tree Wind Power Plant GE 1.5 Cable D General Electric GE 1.5 SLE 16
4,657 1,500 14.0 24.0
Pine Tree Wind Power Plant GE 1.5 Cable F General Electric GE 1.5 SLE 16
4,657 1,500 14.0 24.0
Pinyon Pines Winds I PPI Vestas V-90 56 6,362 3,000 18.0 168.0
Pinyon Pines Winds II PPII Vestas V-90 44 6,362 3,000 18.0 132.0
Ridgetop Energy Micon 108 Micon 108 12 281 108 16.0 1.3
Ridgetop Energy Vestas V-47 Vestas V-47 3 1,735 660 17.0 2.0
Ridgetop Energy Nordtank 75 Nordtank 75 163 154 75 18.0 12.2
Ridgetop Energy Vestas V-39 Vestas V-39 26 1,195 500 16.0 13.0
Ridgetop Energy II Vestas V-47 Vestas V-47 71 1,735 660 17.0 46.9
Rising Tree Wind Farm I Rising Tree I Vestas V-112 24 9,852 3,300 15.0 79.2
Rising Tree Wind Farms II Rising Tree II Vestas V-112 6 9,852 3,300 15.0 19.8
Rising Tree Wind Farms III RT III Vestas V-112 30 9,852 3,300 15.0 99.0
Robertsons Ready-Mix GE 1.5 SLE General Electric GE 1.5 SLE 2
4,657 1,000 10.0 2.0
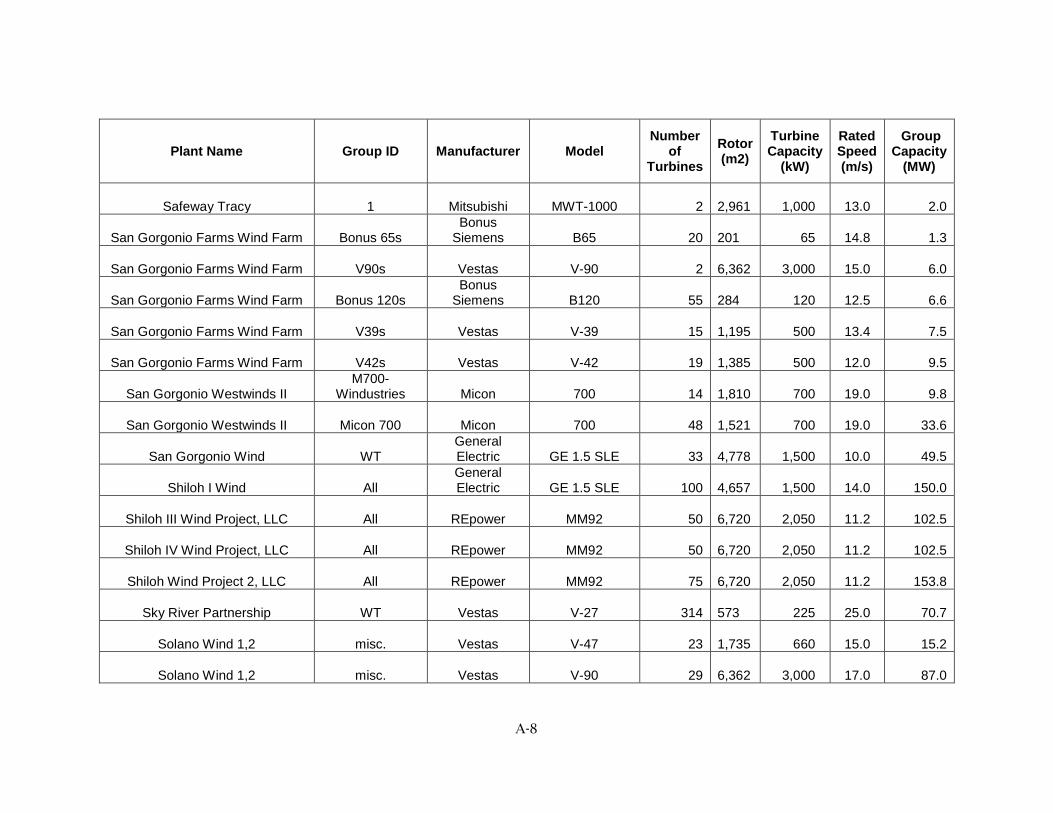
A-8
Plant Name Group ID Manufacturer Model Number
of Turbines
Rotor (m2)
Turbine Capacity
(kW)
Rated Speed (m/s)
Group Capacity
(MW)
Safeway Tracy 1 Mitsubishi MWT-1000 2 2,961 1,000 13.0 2.0
San Gorgonio Farms Wind Farm Bonus 65s Bonus
Siemens B65 20 201 65 14.8 1.3
San Gorgonio Farms Wind Farm V90s Vestas V-90 2 6,362 3,000 15.0 6.0
San Gorgonio Farms Wind Farm Bonus 120s Bonus
Siemens B120 55 284 120 12.5 6.6
San Gorgonio Farms Wind Farm V39s Vestas V-39 15 1,195 500 13.4 7.5
San Gorgonio Farms Wind Farm V42s Vestas V-42 19 1,385 500 12.0 9.5
San Gorgonio Westwinds II M700-
Windustries Micon 700 14 1,810 700 19.0 9.8
San Gorgonio Westwinds II Micon 700 Micon 700 48 1,521 700 19.0 33.6
San Gorgonio Wind WT General Electric GE 1.5 SLE 33
4,778 1,500 10.0 49.5
Shiloh I Wind All General Electric GE 1.5 SLE 100
4,657 1,500 14.0 150.0
Shiloh III Wind Project, LLC All REpower MM92 50 6,720 2,050 11.2 102.5
Shiloh IV Wind Project, LLC All REpower MM92 50 6,720 2,050 11.2 102.5
Shiloh Wind Project 2, LLC All REpower MM92 75 6,720 2,050 11.2 153.8
Sky River Partnership WT Vestas V-27 314 573 225 25.0 70.7
Solano Wind 1,2 misc. Vestas V-47 23 1,735 660 15.0 15.2
Solano Wind 1,2 misc. Vestas V-90 29 6,362 3,000 17.0 87.0

A-9
Plant Name Group ID Manufacturer Model Number
of Turbines
Rotor (m2)
Turbine Capacity
(kW)
Rated Speed (m/s)
Group Capacity
(MW)
Solano Wind 3 misc. Vestas V-90 31 6,362 1,800 12.0 55.8
Solano Wind 3 misc. Vestas V-90 24 6,362 3,000 17.0 72.0
Superior Farms 1 Mitsubishi MWT-1000 1 2,961 1,000 13.0 1.0
Taylor Farms 1 General Electric GE 1.85 SLE 1
5,345 1,000 10.0 1.0
Teichert Vernalis 1 General Electric GE 1.5 SLE 1
4,657 1,500 14.0 1.5
Terra-Gen 251 Wind Vestas V-15 Vestas V-15 4 177 65 18.0 0.3
Terra-Gen 251 Wind Vestas V-17 Vestas V-17 185 227 90 18.0 16.7
Terra-Gen Mojave Windfarms DW 160 Danwind 23A 68 415 160 13.0 10.9
Terra-Gen Mojave Windfarms MHI 600 Mitsubishi MWT-600 29 1,590 600 16.0 17.4
Terra-Gen VG Wind V47 Vestas V-47 1 1,735 660 18.0 0.7
Terra-Gen VG Wind Z750 ZOND Z-750 9 1,963 750 12.0 6.8
Vasco Wind Energy Center 1 Siemens SWT-2.3-101 34 8,007 2,300 13.0 78.2
Victory Gardens IV Vestas V-47 Vestas V-47 1 1,735 660 17.0 0.7
Victory Gardens IV Vestas V-27 Vestas V-27 89 573 225 14.0 20.0
WAGNER WIND, LLC Wagner Vestas V-90 2 6,362 3,000 16.0 6.0
Wal-Mart Red Bluff 1 General Electric GE 1.5 SLE 1
4,657 1,000 10.0 1.0
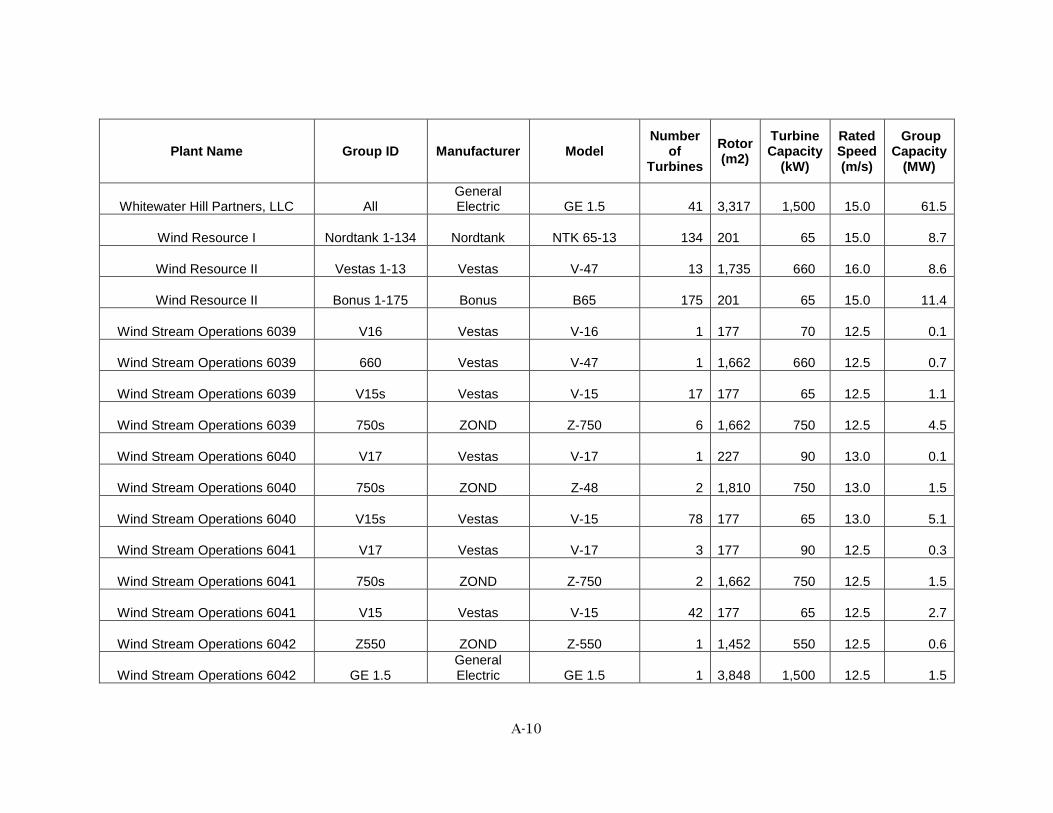
A-10
Plant Name Group ID Manufacturer Model Number
of Turbines
Rotor (m2)
Turbine Capacity
(kW)
Rated Speed (m/s)
Group Capacity
(MW)
Whitewater Hill Partners, LLC All General Electric GE 1.5 41
3,317 1,500 15.0 61.5
Wind Resource I Nordtank 1-134 Nordtank NTK 65-13 134 201 65 15.0 8.7
Wind Resource II Vestas 1-13 Vestas V-47 13 1,735 660 16.0 8.6
Wind Resource II Bonus 1-175 Bonus B65 175 201 65 15.0 11.4
Wind Stream Operations 6039 V16 Vestas V-16 1 177 70 12.5 0.1
Wind Stream Operations 6039 660 Vestas V-47 1 1,662 660 12.5 0.7
Wind Stream Operations 6039 V15s Vestas V-15 17 177 65 12.5 1.1
Wind Stream Operations 6039 750s ZOND Z-750 6 1,662 750 12.5 4.5
Wind Stream Operations 6040 V17 Vestas V-17 1 227 90 13.0 0.1
Wind Stream Operations 6040 750s ZOND Z-48 2 1,810 750 13.0 1.5
Wind Stream Operations 6040 V15s Vestas V-15 78 177 65 13.0 5.1
Wind Stream Operations 6041 V17 Vestas V-17 3 177 90 12.5 0.3
Wind Stream Operations 6041 750s ZOND Z-750 2 1,662 750 12.5 1.5
Wind Stream Operations 6041 V15 Vestas V-15 42 177 65 12.5 2.7
Wind Stream Operations 6042 Z550 ZOND Z-550 1 1,452 550 12.5 0.6
Wind Stream Operations 6042 GE 1.5 General Electric GE 1.5 1
3,848 1,500 12.5 1.5
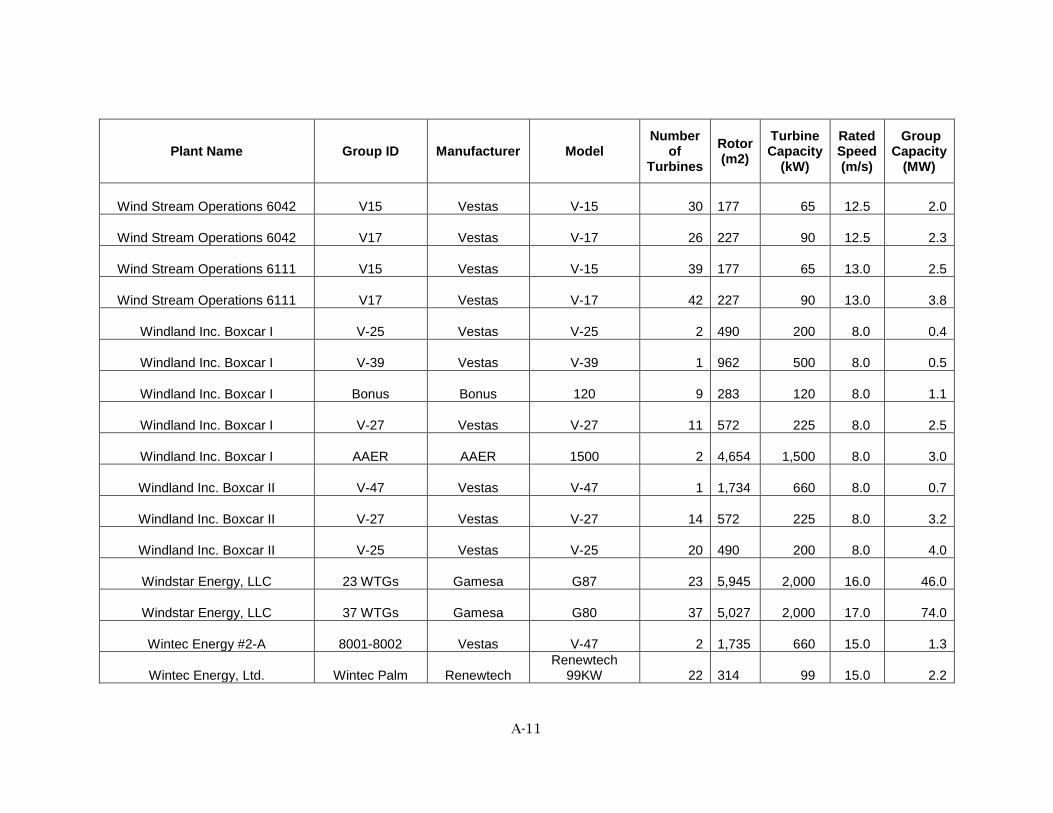
A-11
Plant Name Group ID Manufacturer Model Number
of Turbines
Rotor (m2)
Turbine Capacity
(kW)
Rated Speed (m/s)
Group Capacity
(MW)
Wind Stream Operations 6042 V15 Vestas V-15 30 177 65 12.5 2.0
Wind Stream Operations 6042 V17 Vestas V-17 26 227 90 12.5 2.3
Wind Stream Operations 6111 V15 Vestas V-15 39 177 65 13.0 2.5
Wind Stream Operations 6111 V17 Vestas V-17 42 227 90 13.0 3.8
Windland Inc. Boxcar I V-25 Vestas V-25 2 490 200 8.0 0.4
Windland Inc. Boxcar I V-39 Vestas V-39 1 962 500 8.0 0.5
Windland Inc. Boxcar I Bonus Bonus 120 9 283 120 8.0 1.1
Windland Inc. Boxcar I V-27 Vestas V-27 11 572 225 8.0 2.5
Windland Inc. Boxcar I AAER AAER 1500 2 4,654 1,500 8.0 3.0
Windland Inc. Boxcar II V-47 Vestas V-47 1 1,734 660 8.0 0.7
Windland Inc. Boxcar II V-27 Vestas V-27 14 572 225 8.0 3.2
Windland Inc. Boxcar II V-25 Vestas V-25 20 490 200 8.0 4.0
Windstar Energy, LLC 23 WTGs Gamesa G87 23 5,945 2,000 16.0 46.0
Windstar Energy, LLC 37 WTGs Gamesa G80 37 5,027 2,000 17.0 74.0
Wintec Energy #2-A 8001-8002 Vestas V-47 2 1,735 660 15.0 1.3
Wintec Energy, Ltd. Wintec Palm Renewtech Renewtech
99KW 22 314 99 15.0 2.2

A-12
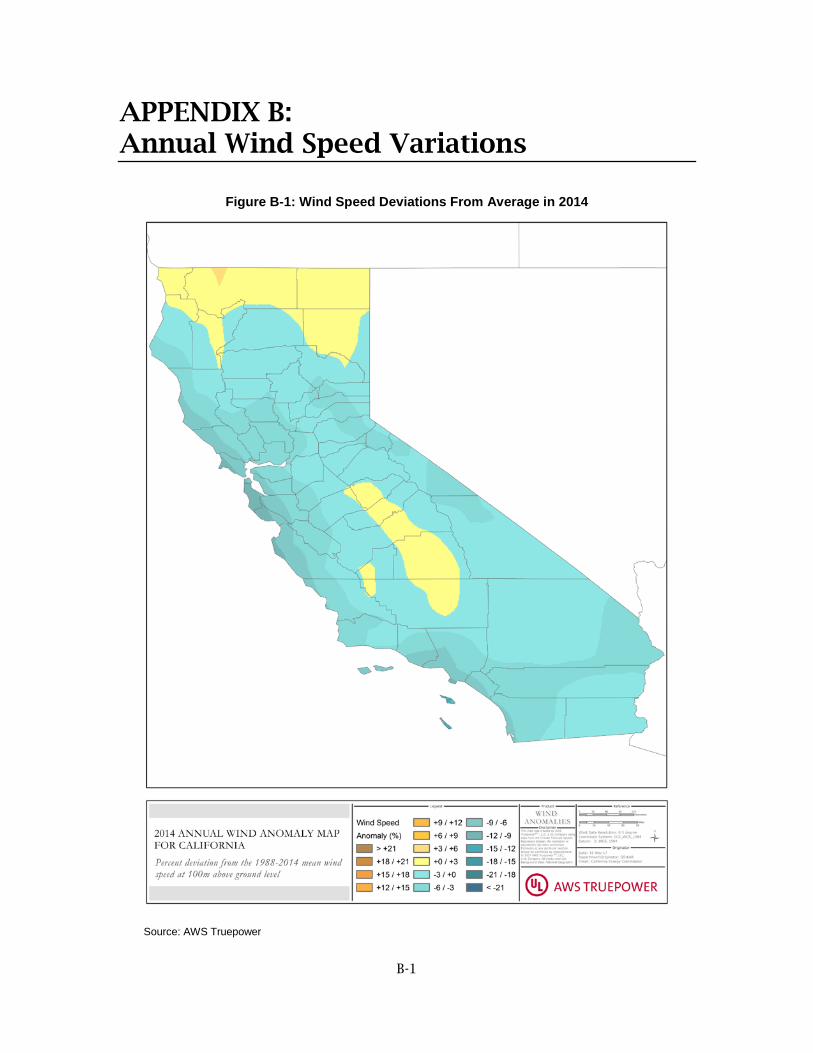
B-1
APPENDIX B: Annual Wind Speed Variations
Figure B-1: Wind Speed Deviations From Average in 2014
Source: AWS Truepower

B-2
Figure B-2: Wind Speed Deviations From Average in 2015
Source: AWS Truepower

B-3
Figure B-3: Wind Speed Deviations From Average in 2016
Source: AWS Truepower