Embed Size (px)
Citation preview

Athens Journal of Sports - Volume 3, Issue 1– Pages 57-86
https://doi.org/10.30958/ajspo.3-1-3 doi=10.30958/ajspo.3-1-3
Productivity and Competitiveness:
The Case of Football Teams Playing in the UEFA
Champions League
By Manuel Espitia-Escuer
Lucia Isabel Garcia-Cebrian†
The purpose of this study is to evaluate the competitive situation of the UEFA
Champions League in relation to other entertainment alternatives. As tools of
analysis, Malmquist indices for the football teams that have participated in the UEFA
Champions League among the years 2003-2011 will be calculated. The Malmquist
index measures the change in productivity whereas the efficiency ratios used for the
calculation of the former were found by applying a Data Envelopment Analysis
(DEA). The relationship between productivity and competitiveness in an economic
sector is as follows: an increase in productivity allows the remuneration of the factors
to be increased without having to raise the price of the product offered. The UEFA
Champions League may see its competitiveness threatened in relation to other
entertainment alternatives, because participating teams do not show a clear increase
in productivity.
Keywords: Data envelopment analysis, Football, Malmquist, Productivity.
Introduction
In this study we calculate and analyze the changes in productivity
experienced by football teams participating in the UEFA Champions League
from 2003-2011. The theoretical framework that has been adopted and which
justifies this study is the management theory. According to this theory, the
significance of an organization’s productivity ratio transcends the mere
productive function and has strategic implications. It indicates the percentage
by which the remuneration of the factors of production can be increased,
without the need of increasing the price of the goods or services to the
consumers and therefore, without altering the profitability of the organization
or its competitiveness within its sector.
In previous studies, Blass (1992) and Mazur (1994) have studied the
productivity of the team members of sports clubs to relate it to their salaries;
however, the approach of this study differs in two aspects.
First, the productivity ratio used is the Malmquist index, which
incorporates information on all of the firm’s productive resources in its
calculation and therefore, may be considered an index of total factor
Professor, University of Zaragoza, Spain.
† Lecturer, University of Zaragoza, Spain.

Vol. 3, No. 1 Espitia-Escuer et al.: Productivity and Competitiveness...
58
productivity which overcomes the difficulties of the interpretation of partial
indexes.
Second, this study evaluates the productivity of the football teams that
have participated in the UEFA Champions League during the period defined by
the study for the purpose of evaluating how competitive they are in relation to
their competitors, which in broad terms would be other entertainment options.
This last statement requires further development, since football clubs have to
deal with sports rivalry and sport competition which should not be confused
with competition in the economic sense.
Both the competitors and the objectives of the football clubs are different
depending on whether the teams are considered individually or in the context
of the tournament in which they are involved. From an individual point of
view, a team faces a rival in each game it plays with the objective of defeating
the opponent and by accumulating victories, winning the tournament in
question.
On the other hand, each competition (such as the UEFA Champions
League, World Cup and the National Leagues) has a governing board whose
involvement goes beyond merely establishing the rules of the game, since it
can intervene in negotiations regarding, for instance, the scheduling of the
matches or gambling.
Therefore, strictly from a sports perspective, each individual team employs
its resources and uses the tactics it has developed to compete against its rivals
in the leagues and tournaments in which the team participates. At the same
time, each sport championship can be considered an organization whose
governing boards act and represent all participating teams as a whole, as they
are in charge of negotiating aspects that are of common interest to all of the
clubs. These negotiations will have repercussions on the revenues that each
club receives, given that they include aspects such as television broadcast
rights.
However, these revenues will also depend on the product/service that the
teams offer, which in this case is the sports event itself. Demand will be
generated if the potential consumers receive sufficient utility to merit the price
they must pay to attend the game. Football, as a spectacle for spectators, must
compete with all those sectors related with entertainment, which may include
other sporting events or alternatives further removed from a product/service
point of view, such as the cinema or the theater. This is where the consideration
of productivity can contribute to improving the competitiveness, in the
economic sense, of the football teams. Only increases in the productivity of the
factors employed by the teams can justify an increase in the retribution of those
factors; otherwise, an increase in the remuneration of the factors of production
would translate to an increase in the price of the sports event and its
competitiveness would suffer. The idea of the relationship between the use of
productive resources and competitiveness in football teams is also present in
Pestana Barros et al. (2014).
In short, each team has a sports objective, which is to defeat its rivals.
However, all of those rivals then group together in a governing body for each

Athens Journal of Sports March 2016
59
one of the tournaments and from an economic point of view, the profitability of
the individual teams is both influenced and protected by the negotiations
undertaken by the governing body of the tournament or league in which it
participates.
This study takes as a premise that the UEFA, as the organizer of the
Champions League, should ensure that the product/service being offered is
competitive, in other words that it is sufficiently attractive to generate demand.
Therefore, it should be concerned with increasing the productivity of the
participating teams by, for example, establishing rules that reward the most
productive teams.
The Malmquist index is the measure of the change in productivity used in
this study. The basis for its calculation is the efficiency indices resulting from
the application of Data Envelopment Analysis (DEA) for the teams that make
up the sample. The Malmquist index takes into account all of the production
factors used by the organization, therefore the conclusions that can be drawn
overcome the limitations of single factor productivity indices. On the other
hand, calculating the Malmquist index using the DEA method allows
considering the change in productivity as the result of two different effects:
efficiency change and technical change (Grosskopf 1993).
The efficiency ratios must refer to the productive process being evaluated.
In a simplified form and following the postulates of Schofield (1988),
Carmichael and Thomas (1995) and Carmichael et al. (2000) for sports teams,
the productive process to create the product/service offered by the football
clubs is composed by two phases. The first is the training responsible for the
physical conditioning of the players, where the tactics that the team will use
during the games is decided. The second phase involves the games themselves,
where the teams face their rivals and where the final product of these types of
organizations, related to sports entertainment, is produced. At the same time
these two phases are linked, since the product of the first phase (the plays made
during the game), would be the input to the second.
The present study is structured in the following manner. Next, the paper
reviews the theoretical relationship among productivity, competitiveness and
its application to the case of football teams. Subsequently, it shows the
methodology used to calculate the changes in productivity using the Malmquist
index and the representative variables used for the football team’s productive
process. In the last two sections the authors present the results and the
conclusions.
Application of the Theory of the Firm to Football Clubs
Classical economic theory uses isoquant to represent organizations’
production systems. Assuming perfect information, freedom to enter/exit the
industry and the absence of influence in setting market prices, organizations
that constitute a sector will launch the amount of product demanded by
consumers on the market at a price set through the interaction of supply and

Vol. 3, No. 1 Espitia-Escuer et al.: Productivity and Competitiveness...
60
demand. On an individual level, each firm, in its quest to maximize profit,
launches the amount of product that equals price and marginal cost, uses a
combination of factors situated on the isoquant and earns no extraordinary
profits.
However, empirical evidence shows that the model used in the classical
economic theory depicting firms as profit maximizing agents with the
restriction of the initial endowment of resources is too simplistic. Besides, the
non-compliance with the underlying hypothesis of the classical economic
theory’s model has opened up new lines of research.
Imperfect information and the bounded rationality may result in the choice
of a combination of factors that produce the output that is above the isoquant.
The firm’s technical system is represented by its possibilities of production,
which show all the amounts of final products that could be produced by a given
combination of the factors; the isoquant only represents the maximum amount
of these possibilities of production. In reality all of them could actually occur
although, from a conceptual point of view, they imply a departure from the
isoquant, which Farrell (1957) defines as inefficiency and supposes a
utilization of resources in greater quantities than what is strictly necessary.
Leibenstein (1962) attributes the same meaning to the term when raising the
importance of the loss of efficiency due not to imperfections of the market, but
rather to a wrong allocation of resources within the firm.
The view of both authors varies greatly from the consideration of firms as
"black boxes" that is characteristic of the economic theory and gives more
relevance to the role of managers in the internal administration of the firms.
Firms are considered complex organizations where members are specialized in
their tasks. Managers, through their knowledge, the instructions they give and
the incentives they establish are the ones that have the responsibility of
situating the firm on the isoquant as far as production is concerned. A tool
available to help managers achieve this are the classical management
approaches since, as Chiavenato (1999) emphasizes, both Taylor and Fayol
were concerned with increasing the efficiency of the firms through the
rationalization of the workers’ tasks and the organization and application of
scientific management principles, respectively.
However, the efficient use of resources in production, that is, the absence
of waste, which conceptually would be represented by the choice of a
combination of inputs on the isoquant, is not an end in itself. Given that
organizations develop products and services with the idea of launching them in
the market and competing with the other organizations of the sector, producing
a product efficiently results in cost savings that contribute to the firm’s
competitiveness and long-term survival. If empirical evidence shows that
organizations choose combinations of factors that are above the isoquant then
the productivity ratio, which is the ratio of the amount of product obtained to
the amount of resources employed, will not be the same for all firms. The
productivity ratio is, once again, another concept that relates production with
competitiveness and therefore could serve as guidance for managerial decision-
making.
Athens Journal of Sports March 2016
61
Productivity is a measure for the evaluation of the productive activity of
the organizations that relates the amount of product obtained to the resources
employed; it is a concept that is limited to the productive area of the
organization and therefore based on the ideas of inputs, outputs and the
production function. Besides, only increases in productivity can justify an
increase in the retribution of the factors of production, without a corresponding
increase in the price of the product. In other words, an increase in the
retribution of the factors that is not accompanied by an increase in productivity
would mean an increase in the price of the product that would negatively affect
the competitiveness of the firm.
It is of interest to analyze the productivity changes of football teams due to
the relationship between this concept and the competitiveness of the
organizations. Competitiveness is relevant to football clubs, because they
operate in a competitive environment composed by, not only the teams that
dispute the tournament, but also other entertainment options that the fans could
choose to attend if the competition does not meet their expectations or if they
consider the price to be excessive.
There is no consensus in the literature as to whether the objective pursued
by sports teams is the maximization of economic performance or the
maximization of sports results, as can be seen in the studies of Fort and Quirk
(1995), Szymanski (2003), Sandy et al. (2004), Fort (2006), Késenne (2007),
Garcia del Barrio and Szymanski (2009). The perspective adopted in this paper
is the following: regardless of the lack of consensus in the literature regarding
the football clubs objectives, economic profit must certainly be taken into
account and can provide information about the management of the clubs1.
Therefore, even in the event that football clubs are not considered for-profit
organizations whose objective is profit maximization, they should be aware of
the opportunities they have to increase it, the repercussions that their decisions
have on it and the risks they are exposed to that could decrease it. In short, all
of the stated above regarding efficiency, productivity and competitiveness
applies to them. Therefore, it is necessary to reflect about the nature of the
product of a football team and what activities are needed to produce it. That
would allow the representative variables of the production function to be
established, the isoquant to be used as a theoretical reference tool and the
productivity to be calculated as an approximation to the competitive situation
within the sector.
The football team’s product is the show they offer during each game or
throughout a tournament and the sports results they achieve. For this, they need
an opponent with which to dispute the victory in accordance with the rules and
scoring system established for each competition. Therefore, the teams do not
compete among themselves for what would be the equivalent of a market, but
rather for the sports result; the victory in the game or the overall tournament
(composed of the sum of the victories in the individual games that make up that
tournament). Consequently, the true competitor for the market is not the sports
1 For example, Szymanski (1998) evaluates, among other variables, the economic profit of the
European football club Manchester United, linking revenues and costs to sports results.

Vol. 3, No. 1 Espitia-Escuer et al.: Productivity and Competitiveness...
62
opponent. Therefore, if the games are the productive activity of the football
teams and the sports results are the product, then the analysis of their
productivity must focus exclusively on the plays made.
As in all organizations, the profit of football teams is the difference
between revenues and expenses. The first depend on the demand for the
"product" of the teams, which are the games and tournaments played and come
from the sales of tickets and passes, broadcasting rights, advertising,
sponsorship, the sale of merchandise such as t-shirts, etc. Revenues are
influenced by the sports results of the team, the existence of other
entertainment alternatives and the price at which the product is offered.
Expenses are made up of things such as personnel, facilities, travel,
transportation, etc. A reduction in the expenses increases the profits. Given that
a portion of the costs are generated in the production function, efficiency,
understood as the choice of a combination of resources situated on the isoquant
and therefore as the absence of waste, contributes to reducing them.
Furthermore, theoretically, the change in productivity is a reference for
determining the increase in the remuneration of the factors of production that
the club can absorb without altering its selling price thereby maintaining its
competitiveness2.
Methodology and Variables
This study follows the proposals of Grosskopf (1993) to calculate the
changes in productivity of the football teams that participated in the UEFA
Champions League. This author argues that her approach differs from that of
other authors, since it allows for inefficiency in the organizations, meaning that
the combination of the factors used to produce the product may not be on the
isoquant. In consequence, the increase in productivity is not the equivalent of
technical progress. The approach of Grosskopf (1993) belongs to the frontier
models of efficiency calculation initiated by Farrell (1957) who considers
deviations from the isoquant to be inefficiency. Farrell (1957) also proposes to
measure efficiency as the distance existing between the combinations of factors
actually used by the organization under study and that are situated on the
isoquant3. Furthermore, the proposal of Farrell (1957) to calculate the efficiency
of an organization consists of starting from the observations of the inputs
actually consumed and the outputs obtained from a homogeneous sample and
2 This idea should be completed with the price elasticity of the demand function for the
entertainment that the football teams offer in comparison to other entertainment options. That
is, only in the case that the demand for football was inelastic the increase in price, due either to
an increase in the price of the inputs or for any other reason, would have little effect on the
quantity demanded by consumers. 3 The normal two-dimensional representation of the isoquant corresponds to production
processes that use two inputs and obtain the same output. However, the concept can be
generalized for multi-output and multi-input production processes and the Formulae presented
and used in this paper also allow for it.
Athens Journal of Sports March 2016
63
take the envelopment of actual data as the isoquant - thus the denomination
"frontier" by which the methodology proposed by this author is known.
In this context, Grosskopf (1993) defines the increase in productivity as
the net change in the amount of output produced due to changes in the
efficiency and to technical change. She also states that changes in efficiency
are modifications over time in the distance between the observations of an
organization’s inputs/outputs and the representative isoquant of its production
technology. On the other hand, technical change could be interpreted as
changes over time in the position of the isoquant with respect to the origin of
the coordinate system. The definition of these two concepts can also be found
in Thiry and Tulkens (1989).
In order to measure the changes in the productivity of an organization,
Grosskopf (1993) proposes the Malmquist productivity index as a starting
point, as Caves et al. (1982). Under the assumption that the organizations can
be inefficient and this inefficiency will be calculated by frontier methods,
observations of the amounts of inputs consumed and the products produced are
needed for each of the organizations in the sample for two consecutive periods.
This information will be used in the following Formula (1) to calculate the
Malmquist productivity index for each organization:
)y,(xλ
)y,(xλ m
iii
1
i
1
iii ttt
tttt
(1)
where, the subscript i refers to the organization being studied and the
superscript t or t+1 refers to the period from which the information was taken.
In greater detail:
m i
t
: is the Malmquist productivity index of organization i based on
the isoquant corresponding to period t. t
ix : is the vector of the quantities of inputs consumed by
organization I in period t. t
iy:
is the vector of the outputs obtained by organization i in period
t.
)y,(xλ iii
ttt
: is the efficiency value of organization i in period t taking the
technology of period t as a reference, that is the distance that
separates the combination of factors that organization i used in
period t from the isoquant or frontier, calculated using the
information of the entire sample for period t.
)y,(xλ1
i
1
ii
ttt
: is the efficiency that organization i would have achieved if its
consumption of factors and its production for period t+1 were
valued with respect to the isoquant corresponding to period t.

Vol. 3, No. 1 Espitia-Escuer et al.: Productivity and Competitiveness...
64
Measuring the increase in the productivity of an organization Grosskopf
(1993) proposes using the geometric average of the two Malmquist indexes for
the consecutive period’s t and t+1 by calculating the following expression:
1/2
ii
1
i
1
i
1
i
1
i
iii
1
i
1
iiii
1
i
1
ii)yt,(xλ
)y,(xλ*
)y,(xλ
)y,(xλ )y,x,y,(xM
ttt
ttt
ttt
ttttttt
(2).
This can be re-written in the following manner:
1/2
ii
1
i
iii
1
i
1
i
1
i
1
i
1
ii
iii
1
i
1
i
1
iii
1
i
1
ii)y,(xλ
)y,(xλ*
)y,(xλ
)y,(xλ *
)y,(xλ
)y,(xλ )y,x,y,(xM
ttt
ttt
ttt
ttt
ttt
ttttttt
(3).
According to Grosskopf (1993), the Malmquist index is made up of two
components. Breaking it down as shown in (3) allows them both to be
calculated: the term outside of the brackets measures the efficiency change,
while the bracketed term measures the technical change.
The way to calculate the efficiency values that form part of the Malmquist
index proposed by Grosskopf (1993) remain to be determined.
Among the possible frontier approaches, this study has opted for DEA. It
is not necessary to specify the form of the production function to apply DEA;
however, it is based on the concept of process as the transformation of
productive resources into final products for the determination of the variables
that intervene in the calculation. The efficiency value of the units that compose
the study sample is the ratio found by solving the following linear
programming problem4:
Minimize I (4)
s.t. i* x u* X
y u * Y
u R+
where,
i: is the efficiency ratio found by solving the problem.
xi: is the vector of the amounts of input used by unit i.
yi: is the vector of the amounts of output obtained by unit i.
X: is the matrix of the amounts of input used by the units of the sample.
Y: is the matrix of the amounts of output obtained by the units of the sample.
u: is the vector of the coefficients from solving the problem.
4 In the notation of this problem superscripts denoting the period of reference are not used,
because in its original Formulation DEA uses the sample data referring to only one period.
Therefore, the efficiency ratio for each organization is calculated by taking the data of the
consumption of the factors, the production and the isoquant with respect to which it is
calculated for the same period.
Athens Journal of Sports March 2016
65
The formulation of the problem that has been presented assumes constant
returns to scale5. An input orientation has been adopted whereby i is
interpreted as the proportion by which the amounts of all productive resources
employed by the unit under analysis must be reduced to situate it on the
isoquant or frontier. Therefore, those units in the sample whose i is equal to
unity will be classified as efficient, while those which have a i ratio value
below one will be classified as inefficient.
Going back to the Malmquist index, this can show values lower than,
higher than or equal to one. If an organization’s Malmquist index is below one,
the interpretation is that the organization has lowered its productivity between
the two periods taken in consideration. If the productivity has increased the
index will be higher than one and if the productivity has not changed the index
will be equal to one. Each of these three possibilities can be the result of the
combination of different values of the change in efficiency and technical
change, which can take on values lower than, higher than or equal to one.
A value for the change in efficiency less than one means that the efficiency
of the organization under study has diminished over time because it shows a
lower value in period t+1 with respect to period t; the interpretation is the
opposite where the value is greater than one and a ratio equal to one means that
there has been no change in efficiency.
If a technical change shows a value lower than one it means that the
isoquant that represents technology for period t+1 is farther from the origin of
the coordinate system than in the preceding period, thus indicating that there
has been a technical regression. It is also possible to show a value greater than
unity, which would have the opposite interpretation and a value equal to one
would indicate that there has been no technical change.
This paper focuses on the calculation and implications of the changes in
the productivity of the football teams that have participated in the UEFA
5 DEA also allows the calculation of the organization’s efficiency ratio under the assumption of
variable returns to scale. Given that, one of the advantages of DEA is that it does not require
the specification of the production function, it seems coherent not to make assumptions
concerning the returns to scale that the production process of the sample under study could
show. This affirmation is not in contradiction with the possibilities of calculation that DEA
offers: if the efficiency ratio is calculated under the assumption of constant returns to scale,
what is known as a global technical efficiency is obtained, which measures inefficiency caused
by both the waste of resources in production and the wrong choice of the size of the
organization. The calculation of the efficiency ratio under the hypothesis of variable returns to
scale eliminates the influence of this second factor and reveals the value of the so-called pure
technical efficiency, which evaluates exclusively the waste of resources; the ratio of global
technical efficiency to pure technical efficiency is the efficiency of scale, which measures the
loss of efficiency due to the wrong choice of the size of the organization. Consequently, in this
paper, calculating DEA under the assumption of constant returns to scale does not mean that
the technology used by football clubs does not show variable returns, rather that the efficiency
ratios that will be calculated to be used in the calculation of the Malmquist index include both
the effects of the proper use of productive resources and the choice of the size of the
organization.

Vol. 3, No. 1 Espitia-Escuer et al.: Productivity and Competitiveness...
66
Champions League from 2003 to 20116. This is not the only competition in
which they participate, so their entire "production" which would include
consumed resources and obtained sport results in national championships, is
not taken into account in the input and output vectors. This could be seen as a
limitation of the study however it also has the advantage that all of the teams
that play in the UEFA Champions League have had to be placed among the top
positions of their domestic competition in the previous season. This makes the
sample more homogenous and the homogeneity of the sample units is one of
the requirements for the correct application of DEA in the calculation of the
efficiency ratios.
As for the output variable, that is, the variable that represents the success
of the teams in the tournament in which they participate, it is important to
emphasize that the UEFA Champions League is a knockout tournament;
therefore, what is important is qualifying for the successive phases and in case
of qualifying for the final, winning it. It is common for studies of the efficiency
of football teams to use the points earned during the tournament7 or the number
of goals scored8 as variables. However, neither of these two variables
guarantees that the teams that obtain the highest values achieve a better
classification in the UEFA Champions League. The UEFA Champions
League’s group system makes it possible for teams to advance to the following
stage having earned fewer points than others that fail to advance only, because
these played in a group where the combination of victories was less favorable
to them.
On the other hand, a higher number of goals scored does not mean better
sports results, as the number of goals does not guarantee victory. Scoring more
goals than the opponent does provide the victory in one game. But a big
difference between goals scored and goals conceded for the whole tournament
can be the result of only one or a few won games with a big difference between
these two variables, showing loses in the remainder games. So a big difference
between scored and conceded goals through the whole tournament not always
correspond with good sports results.
Taking into account the previous considerations, this study proposes the
number of games played as the variable that best represents the success of the
teams in UEFA Champions League. This output variable has the inconvenience
that it takes the same value for the winner as for the runner-up, even though the
winner is obviously more successful.
Concerning inputs to be considered in the production function for football
teams, literature shows no agreement. One group of authors takes expenses as a
6 Productivity of football teams has been calculated for national championships by Guzman
and Morrow (2007), Espitia-Escuer and Garcia-Cebrian (2008), Douvis and Pestana-Barros
(2008), Jardin (2010) for instance. 7 Dawson et al. (2000), Haas (2003a, 2003b), Gonzalez-Gomez and Picazo-Tadeo (2010) use
this output variable, although transformed or in combination with other complementary
variables. 8 Carmichael et al. (2000) use the difference between goals scored and goals conceded as
output when specifying their production function and Bosca et al. (2009) state that the number
of goals is a simple variable to measure the production of the football teams.

Athens Journal of Sports March 2016
67
variable representative of the consumed resources. Examples of this line are
Haas (2003a, 2003b), Haas et al. (2004) and Guzman (2006). Nevertheless,
Sexton et al. (1986) warn about the risk of confusing technical and price
efficiency and recommend using variables measured in physical units. Also
from a more general point of view, Border (2004) analyzes the Cobb-Douglas
function and shows that prices should not be included in a production function.
Authors that follow this suggestion in the case of football teams are Espitia-
Escuer and Garcia-Cebrian (2008) and Bosca et al. (2009). In both papers input
variables are plays made during games in line with the work of Carmichael et
al. (2000).
The present article can be framed in this second group as the players that
participate, as representatives of labor force and the plays made during the
games are taken as the factors of production. The number of players that each
team uses during the tournament is taken as the representative variable of the
first. It can be argued that not all of the players are of the same quality and this
will have an influence on the efficiency. However, quality is a concept that
refers to the product offered on the market by an organization and not to the
factors used in its production. The characteristics of the resources used in a
production process will have an influence on the quality of the product, but
those differences are precisely the ones that could explain the differences in the
levels of efficiency achieved by the organizations included in the study9.
With regards to the plays made, the players make both offensive and
defensive plays during the game, however only the offensive plays contribute
to the victory. There are several justifications for making this affirmation.
First, in the extreme case in which a team only defends, it would not score
any goals and therefore the best result it could achieve would be a scoreless tie,
never a victory. On the other hand, the team executes defensive plays to offset
the actions of the opposing team and in the representation of productive
processes by isoquants, which is what DEA estimates, actions taken to adapt to
the environment are never to be considered inputs10
.
Finally, the defensive plays made by the opposing team could be
considered, as they impede an offensive play from becoming a positive sports
result. However, defensive plays from the rival cannot be considered factors of
production for the team whose efficiency is being calculated. To do so would
violate a condition considered as such: the quantity and use of the productive
resources must be under the control of the firm. The team under study has no
control over the defensive plays made by its opponent. Furthermore, continuing
with the application of the characteristics of manufacturing to football teams,
9 Golany and Roll (1989) recommend distinguishing between the factors of production and the
variables that explain the differences detected in the efficiency values achieved by the
organizations in the study. 10
For example, the chemical industry obtains products following the chemical Formulae,
which would be the equivalent of the isoquant. However, the companies must also make efforts
to comply with environmental laws or face restrictions to exploiting deposits which means
additional effort, but is not reflected in their production function. Similarly, in manufacturing
and in services, advertising could also be considered an activity to counter or anticipate, the
actions of competitors and again it is not considered a productive resource.

Vol. 3, No. 1 Espitia-Escuer et al.: Productivity and Competitiveness...
68
the manufacturer should take the amount of product actually sold by the firm as
the output value, since sales are what generate profits and sales may differ from
production due to poor forecasting by the company or the activity of
competitors and these circumstances are not reflected in the isoquant. In the
case of a football team, the difference between the sports results that it could
achieve through its offensive plays and the results actually achieved, are due to
the defensive plays of the opponent and therefore should not appear as inputs
in the representation of the isoquant.
In conclusion, for this study, in addition to the team’s offensive plays, the
minutes of possession and shots taken have been chosen as representative
variables of the resources employed in the game. The defensive plays made,
either by the team or by its opponent, would be taken as explicative variables
of efficiency, as proposed by Golany and Roll (1989)11
. Given that for this
study the production function only contemplates one output and that output is
the number of games played during the UEFA Champions League competition,
an input orientation was seen to be more appropriate for the calculation of the
efficiency ratios. It makes more sense to recommend reductions in the
consumption of inputs than to increase the output, since the latter would imply
that inefficient teams should increase the number of games they play, when in
fact the values that this variable can take on are set by the competition rules
themselves.
All the variables representing the football team’s production process used
in this study have been obtained from the OptaSports database12
. The
calculations have been made using the total of each team’s values for each of
the seasons analyzed. The descriptive statistics of the variables used are shown
in Table 1.
Results
The samples for which the changes in productivity have been calculated in
this study are the football teams that played the UEFA Champions League for
the seasons among 2003-2011. As shown in Formula (3), to calculate the
Malmquist index, the efficiency ratios of each team are needed for two
consecutive seasons. They are calculated from the input and output data, both
for the team and for the total sample. Since the teams that compete in the
UEFA Champions League change from year to year, the calculations were
done as follows: the sample used for the year in question is composed by all
the teams that participated in the competition, regardless of whether or not they
11
Guzman (2006) also calculates and analyzes the productivity of football teams using the
Malmquist index, however the inputs used are personnel costs and general expenses and the
output, revenues. Sexton et al. (1986) recommend the use of variables measured in physical
units, therefore excluding the remuneration of the factors, so as not to confuse the values of
technical efficiency with price efficiency. 12
OptaSports is a private international company who provides information about teams
participating in national and international football championships. Its web site is
www.optasports.com.

Athens Journal of Sports March 2016
69
continued in the following season. However, the Malmquist index was only
calculated for those teams that played at least two consecutive seasons and
therefore it was possible to obtain all of the terms that are used in the Formula
(3). Table 2 shows the results obtained.
Table 1. Descriptive Statistics of the Variables Used Analyzed seasons Input variables Output variable
Offensive
plays
Number of
players
Minutes of
possession
Number of
shots
Games played
2003/2004 Maximum 1,444 25 364 181 13
Minimum 587 17 143 53 6
Average 842.25 21.00 217.69 100.28 7.81
Std. Dev. 263.89 1.94 66.81 37.93 2.24
2004/2005 Maximum 1,504 27 375 162 13
Minimum 572 18 118 46 6
Average 848.56 21.38 206.88 99.72 7.81
Std. Dev. 262.16 2.27 67.54 37.86 2.24
2005/2006 Maximum 1,630 28 388 217 13
Minimum 612 16 131 51 6
Average 894.41 21.47 199.09 103.28 7.81
Std. Dev. 276.99 2.75 66.33 41.42 2.24
2006/2007 Maximum 1,465 30 328 203 13
Minimum 632 17 128 50 6
Average 910.59 22.31 194.84 104.91 7.81
Std. Dev. 251.46 2.55 59.80 40.50 2.24
2007/2008 Maximum 1,559 27 400 216 13
Minimum 658 16 126 44 6
Average 920.97 22.06 203.13 107.34 7.81
Std. Dev. 271.86 2.30 71.41 45.59 2.24
2008/2009 Maximum 1,531 25 428 227 13
Minimum 608 17 117 49 6
Average 918.44 21.22 197.16 104.47 7.81
Std. Dev. 262.36 2.13 76.47 45.19 2.24
2009/2010 Maximum 1,470 30 446 204 13
Minimum 612 17 116 34 6
Average 875.22 21.47 195.34 102.84 7.81
Std. Dev. 262.43 2.83 80.41 44.63 2.24
2010/2011 Maximum 1,639 29 501 221 13
Minimum 673 17 119 46 6
Average 966.41 22.28 204.94 105.78 7.81
Std. Dev. 279.30 3.10 84.45 46.38 2.24
Source: Authors’ estimations.
It should be stressed that for each one of the seasons in the study, Table 2
shows the value of the change in the productivity of the football teams, with
respect to the previous season, as measured by the Malmquist index.
Furthermore, for each one of the values of the Malmquist index the values of
its two components, efficiency change and technical change, are also shown.
On the other hand, the blank cells in Table 2 represent situations in which it is
impossible to calculate the Malmquist index corresponding to a given team;
either because that team did not participate in the UEFA Champions League in

Vol. 3, No. 1 Espitia-Escuer et al.: Productivity and Competitiveness...
70
that or the previous season. Finally, the last row of Table 2 shows the average
values for each column, that is, the average of the Malmquist index and its two
components for each season.
Focusing on the average productivity change in each of the seasons
analyzed, it should be emphasized that there are increases in only three of them
and by very small amounts (2004/2005, 2008/2009 and 2009/2010). Season
2006/2007 showed no change over the previous year and in the rest decreased,
with the decline in season 2010/2011 being especially noteworthy.
In the three seasons in which there was an increase in productivity on
average, all of the teams experienced technical progress. With regards to the
average changes in efficiency, in the seasons 2004/2005 and 2009/2010 there
was a decrease in efficiency that was offset by technological progress and in
2008/2009 there was no change. Also, in these three seasons different cases
regarding the evolution of efficiency can be observed if the teams are taken
individually: there are some that increased, while others decreased and among
the latter, some compensated the decrease with technical progress to the extent
that they showed an overall increase in productivity.
In season 2006/2007 the average productivity did not change with regard
to the previous season and also, on average, it can be seen that the decrease in
efficiency is compensated by technological progress. With regard to the
situation of the individual teams participating in the UEFA Champions League
during that season, the majority experienced technical progress; however, this
was not accompanied by an increase in efficiency in all cases. Among those
that decreased efficiency predominated those that did not offset their decrease
in efficiency with technical progress and therefore showed an overall decline in
productivity. On the contrary, for the teams that suffered a technical regression
in season 2006/2007, the evolution of their productivity coincides with that of
their efficiency, i.e. those that increased their efficiency, also increased their
productivity and vice versa.
In the rest of the seasons analyzed, on average the teams participating in
the UEFA Champions League decreased their productivity and although they
increased their average efficiency, it was not enough to compensate their
technical regression. In season 2010/2011, all of the participating teams
experienced a technical regression and of those that increased their efficiency,
only two increased their productivity (Milan AC and Real Madrid). In the
2005/2006 season only one team (PSV Eindhoven) showed neither technical
progress nor regression nor did its efficiency change, consequently its
productivity remained unchanged. The rest experienced technical regression,
however the majority of them showed an increase in efficiency, this
compensated the technical regression and their productivity increased. Finally,
in the season 2007/2008, only five teams did not experience technical
regression. Two of them (Celtic and Liverpool) showed no change, nor did
they vary their efficiency, therefore their productivity remained unchanged.

Athens Journal of Sports March 2016
71
Table 2. Malmquist Index Values by Season for the Teams Participating in the UEFA Champions League 2004/2005 over
2003/2004
2005/2006 over
2004/2005
2006/2007 over
2005/2006
2007/2008 over
2006/2007
2008/2009 over
2007/2008
2009/2010 over
2008/2009
2010/2011 over
2009/2010
1 2 3 1 2 3 1 2 3 1 2 3 1 2 3 1 2 3 1 2 3
AC Roma 1.0828 0.9108 0.9862 1.0000 1.0098 1.0098
Ajax 0.9978 1.0266 1.0243 1.0103 0.9584 0.9682
Arsenal 0.9985 1.0240 1.0225 1.0565 0.9816 1.0371 0.9056 0.9920 0.8984 1.0479 0.9434 0.9886 1.0537 1.0201 1.0749 0.8994 1.0048 0.9037 1.0106 0.9309 0.9407
Atl. de Madrid 0.8840 1.0391 0.9186
Bayern München 0.9568 1.0161 0.9722 0.9960 0.9653 0.9614 0.9594 1.0333 0.9914 1.0449 1.0187 1.0645 0.9639 0.9564 0.9218
Benfica 1.0000 1.0181 1.0181 0.9155 0.9698 0.8878
Celtic 0.9735 1.0460 1.0183 1.0000 1.0000 1.0000 1.0000 1.0000 1.0000
Chelsea 1.0419 1.0075 1.0497 0.9352 0.9895 0.9254 1.0680 0.9919 1.0593 0.9870 0.9815 0.9687 1.0144 1.0100 1.0245 0.9348 1.0266 0.9597 1.0035 0.9288 0.9321
CSKA Moscu 0.9133 1.0115 0.9238
Dep. A Coruña 0.9279 1.0498 0.9741
F.C. Barcelona 1.1721 0.9862 1.1558 0.9035 0.9880 0.8926 1.1068 0.9763 1.0805 1.0000 1.0000 1.0000 1.0000 1.0261 1.0261 1.0000 0.9569 0.9569
FC Dynamo Kyiv 1.0592 1.0298 1.0908 1.0529 0.9841 1.0361 0.9946 1.0389 1.0333 1.0221 1.0148 1.0372
FC Porto 0.8682 1.0237 0.8887 1.0488 0.9583 1.0051 0.9988 1.0253 1.0241 1.0103 0.9186 0.9281 1.0883 1.0110 1.1002 0.9347 1.0628 0.9934
FC Shakhtar 1.0226 0.9438 0.9651 0.9703 1.0341 1.0034
Fenerbache 1.0216 0.9613 0.9820 0.9061 1.0286 0.9320
Fiorentina 1.0134 1.0274 1.0412
Girondins 1.0539 1.0137 1.0683
Inter 1.0901 1.0336 1.1268 0.9350 0.9810 0.9172 1.0518 1.0184 1.0712 1.0045 0.9946 0.9991 0.9415 1.0215 0.9618 1.0853 1.0048 1.0905 0.9797 0.9593 0.9398
Juventus FC 0.9842 1.0339 1.0176 1.0586 0.9483 1.0039 0.9865 1.0472 1.0330
Lille 0.9929 1.0393 1.0319
Liverpool 0.9352 0.9991 0.9344 1.0693 1.0380 1.1100 1.0000 1.0000 1.0000 0.9758 1.0136 0.9891 0.9678 1.0086 0.9762
Lyon 0.9429 1.0261 0.9675 1.0664 0.9545 1.0179 0.8782 1.0664 0.9366 1.1473 0.9344 1.0721 1.0242 1.0108 1.0353 1.0007 1.0308 1.0316 0.8811 0.9537 0.8403
Manchester U 0.9185 1.0257 0.9421 0.9619 0.9565 0.9200 1.1319 0.9867 1.1169 0.9867 0.9832 0.9702 1.0001 1.0169 1.0170 1.0060 1.0277 1.0338 1.0074 0.9640 0.9711
Milan AC 1.0989 1.0038 1.1031 1.0000 0.9687 0.9687 1.0000 1.0000 1.0000 0.9241 0.9716 0.8978 1.0883 0.9248 1.0065
Monaco 0.9744 1.0131 0.9871

Vol. 3, No. 1 Espitia-Escuer et al.: Productivity and Competitiveness...
72
O. Marseille 0.9710 1.0228 0.9931 1.0357 1.0263 1.0629 1.0027 0.9237 0.9262
Olympiakos P 1.0058 1.0629 1.0691 0.9873 0.9558 0.9436 0.9773 1.0149 0.9919 1.1153 0.9773 1.0900
Panathinaikos 0.8924 1.0652 0.9506 1.0689 0.9470 1.0123
PSV Eindhoven
1.0637 1.0063 1.0704 1.0000 1.0000 1.0000 0.9853 0.9826 0.9682 0.9608 0.9885 0.9497 0.9586 1.0346 0.9917
Rangers FC 1.0064 0.9919 0.9983
Real Madrid 0.9682 1.0183 0.9858 1.0020 0.9459 0.9478 0.9490 1.0079 0.9565 1.0102 0.9373 0.9468 0.9738 1.0194 0.9926 1.0125 1.0118 1.0244 1.1729 0.9026 1.0587
Rosenborg 1.0739 0.9725 1.0443
RSC Anderlecht
0.8268 1.0385 0.8586 1.2095 0.9312 1.1263 0.9152 1.0166 0.9304
Rubin Kazan 0.9687 0.9863 0.9555
Sparta Praha 0.9223 1.0653 0.9825 1.0665 0.9737 1.0384
Sporting de
Lisboa
1.0504 1.0309 1.0829
Steaua
Bucarest
0.9115 1.0255 0.9348 1.0387 1.0096 1.0487
Valencia 0.9665 1.0051 0.9714
Werder Bremen
1.0767 0.9794 1.0545 0.9245 1.0667 0.9862 0.9589 0.9684 0.9286 0.9690 1.0276 0.9957
Average 0.98 1.03 1.01 1.0325 0.9673 0.9983 0.98 1.02 1.00 1.01 0.97 0.98 1.00 1.02 1.02 0.99 1.02 1.02 1.01 0.95 0.95
Note: 1: Efficiency change, 2: Technical change, 3: Malmquist.
Source: Authors’ estimations.
Athens Journal of Sports March 2016
73
The other three that showed technical progress (CSKA Moscu, Steaua
Bucarest and Valencia) could not, however, offset their decrease in efficiency,
therefore their productivity dropped. Of those showing technical regression and
increased efficiency, four of them increased their productivity (FC Barcelona,
FC Dynamo Kyiv, Lyon and Olympiakos P), while the productivity decreased
for six (AC Roma, Arsenal, FC Porto, FC Shakhtar, Inter and Real Madrid).
In summary, in view of the results, it could be said that on average, for the
seasons that show increases in productivity, those increases are due to technical
progress. When the performance of the teams is analyzed individually, the
evolution of efficiency only appears to have a greater influence on the change
in productivity during the seasons 2005/2006 and 2006/2007, since in the
majority of the cases in which the change in efficiency shows the opposite sign
of that for technical progress, efficiency prevails. In the rest of the seasons,
with the exception of 2007/2008 for which the influence is inconclusive, it is
the technical progress or regression that dominates the sign of the change in
productivity when it does not coincide with the sign of the change in
efficiency.
If the results are analyzed team by team, it should be noted that the teams
that play the UEFA Champions League in all of the seasons analyzed in this
study show erratic changes in productivity, alternating increases with decreases
and showing a drop at the end of the period. The only exception is Real
Madrid, which has a Malmquist index below unity for every season analyzed
except for the last two, when its productivity increases. Among the teams that
do not play the UEFA Champions League in all of the seasons analyzed, but
for which there are values of their changes in productivity for at least two of
the seasons, it can be seen that AC Roma, FC Dynamo Kyiv and Juventus FC
always increase their productivity, Celtic increases or maintains it and it
decreases for Fenerbache in all of the cases. The evolution of the productivity
of the rest does not follow any defined pattern. Finally, among the teams for
which a Malmquist index value could only be calculated once during the span
of this study, the productivity of some teams decreased, while for others it
increased.
The change in productivity and its two components were also calculated
for the teams that participated in the UEFA Champions League in the seasons
2003/2004 and 2010/2011, as if they had been consecutive years, with the
objective of approximating the evolution of their productivity over the entire
period analyzed in this paper. The results are shown in Table 3.
On average the results show a decrease in productivity, a decrease in
efficiency and technical regression. If the results are interpreted individually
for each team, only AC Milan increases its productivity, due to an increase in
efficiency that compensates for its technical regression. On the other hand,
Panathinaikos and Rangers FC experience no change in productivity or
efficiency and show neither technical progress nor regression.

Vol. 3, No. 1 Espitia-Escuer et al.: Productivity and Competitiveness...
74
Table 3. Malmquist Index Values for the Teams Participating in the UEFA
Champions League in the First and Last Seasons of the Period Analyzed 2010/2011 over 2003/2004 Efficiency change Technical change Malmquist
Ajax 0.9951 0.9492 0.9446
Arsenal 0.9589 0.9857 0.9451
Bayern Munchen 0.9759 0.9294 0.9070
Chelsea 0.9774 0.9696 0.9477
FK Partizan 0.8972 1.0340 0.9277
Inter 1.0781 0.9098 0.9809
Lyon 0.9150 0.9694 0.8869
Manchester United 1.0000 0.9818 0.9818
Milan AC 1.0833 0.9497 1.0288
Panathinaikos 1.0000 1.0000 1.0000
Rangers FC 1.0000 1.0000 1.0000
Real Madrid 1.0754 0.9241 0.9937
Average 0.9964 0.9669 0.9620
Source: Authors’ estimations.
The rest of the teams show a decline in productivity, most of them due to a
drop in both efficiency and technical progress, however, both Inter and Real
Madrid increase their efficiency, for Manchester United remains unchanged,
and FK Partizan shows technical progress. Analyzing the information in Table
3, one could conclude that over the period studied there is a widespread decline
in productivity, which is also evident in its two components, but primarily in a
technical regression.
Conclusions
The product of the football teams is the entertainment they offer, while
their productive activity is the games played; the resources consumed are the
plays made during the games. Since it is a process that could be considered
labor intensive, studies such as the present, which evaluate the utilization of the
resources consumed, can be interpreted from the point of view close to that of
the coach who is in charge of designing the tactics implemented on the field
and the utilization of the resources available. However, the fundamentals of the
study are underpinned by tools supplied by the economic science and
especially, adopting an organizational management perspective. With regards
to this it should be stressed that the plays executed by each individual player
during the game and their contribution to the final result, could be considered
an application to football teams of the ideas set forth by the administration
theory. Recently, there have been reports in the sports press about football
coaches making use of very detailed statistics of the plays made on the field13
.
The use of this information can serve to improve the performance of the
players, both in training and during the games. This type of information and the
purpose, for which it is used, could be linked to the pioneering studies of the
classical approach to management, which focused on work methods, the
13
An example would be found in the web page: http://goo.gl/7y3WX5.

Athens Journal of Sports March 2016
75
movements necessary to execute a task and the time required for its execution
(Chiavenato 1999).
Teams that participate in a football championship compete among
themselves for the sports result, but are not considered competitors in the
market from which they obtain the revenues that are a component of their
economic profit. Consequently, the index of productivity can be related to the
economic competitiveness of the organizations within their economic sector.
In this article, changes in productivity in football teams playing in UEFA
Champions League from 2003-2011 have been calculated by means of the
Malmquist index. Also, efficiency ratios needed to calculate the Malmquist
index have been obtained using DEA. As a non-parametric and deterministic
tool, DEA does not need the specification of a functional form for a productive
process. But this lack of constraints makes results sensitive to the sample
analyzed. In the present article this difficulty have be overcome: the sample
under analysis is well defined, as every single team participating in the UEFA
Champions League during time horizon has been included in the sample, even
if its participation has been reduced to a unique season and it has not been
possible to calculate its Malmquist index. Of course, the choice of variables
representing inputs and outputs have a big influence in numerical results. In
order to present more robust indexes, we have focused on games as the
productive area in football teams and only variables measured in physical units
have been considered here.
The results obtained in this article show no clear increase in productivity
during the period studied, both on the average and individually. In conclusion,
it does not appear that the organizer of this tournament has been able to
increase the productivity of the teams that has participated in it during the
period analyzed.
In this respect it could be said that the UEFA Champions League is an
entertainment alternative whose competitiveness relative to other options could
be threatened. If the football teams that participate in the tournament showed a
consistent and prolonged increase in productivity, they would be able to afford
an increase in the cost of their factors of production in the same proportion
without having to transfer these increases to the prices. Consequently, the
overall recommendation for the football clubs analyzed in this study would be
to improve their productivity. Breaking down the Malmquist index into
efficiency change and technical change and seeing that neither of the two show
a clear increase, the general recommendation can be made more specific: if the
UEFA Champions League pretends to stay competitive with other competitors
in the entertainment sector (that means, to afford increases in the retribution of
its factors of production without increasing the price at which it offers its
entertainment or to make the participating teams more profitable), first the
teams should eliminate all use of factors of production that could be considered
excessive and choose a combination of them that is on the isoquant and second
they should introduce improvements in the use of their resources that would
suppose technical progress, in other words that would make the isoquant
approach the origin of the coordinate system.
Vol. 3, No. 1 Espitia-Escuer et al.: Productivity and Competitiveness...
76
Therefore, the recommendation would be to design rules for the
tournament that would improve the productivity of the participating teams by
linking sports success to the increase in productivity. The lack of a relationship
between the sports results and the evolution of the productivity of the teams
that participate in the UEFA Champions League is also revealed by the fact
that obtaining a Malmquist index above one does not guarantee their continuity
in the competition since for AC Roma, Celtic, FC Dynamo Kyiv, FC Shakhtar,
Juventus FC, Olympiakos P, Panathinaikos, Sparta Praha and Steaua Bucarest
their series end in seasons in which they increased their productivity and the
cases in which only one Malmquist index could be calculated during the period
studied corroborate these findings, since increased productivity did not
guarantee permanence in the competition. Therefore, the value of the
Malmquist index for the teams that participate in the tournament is not related
to their permanency in the competition.
Future lines of research could involve relating the productivity values to
the evolution of the economic profits or other variables that are representative
of the team’s economic survival and the search for rules that reward and value
the sports results achieved as a result of increases in productivity.
Acknowledgements
We would like to thank GECA Sport for its cooperation in providing the
data for this study. This work was done within compete research group and was
funded by project ECO2012-36290-C03-01 from Micinn and Feder.
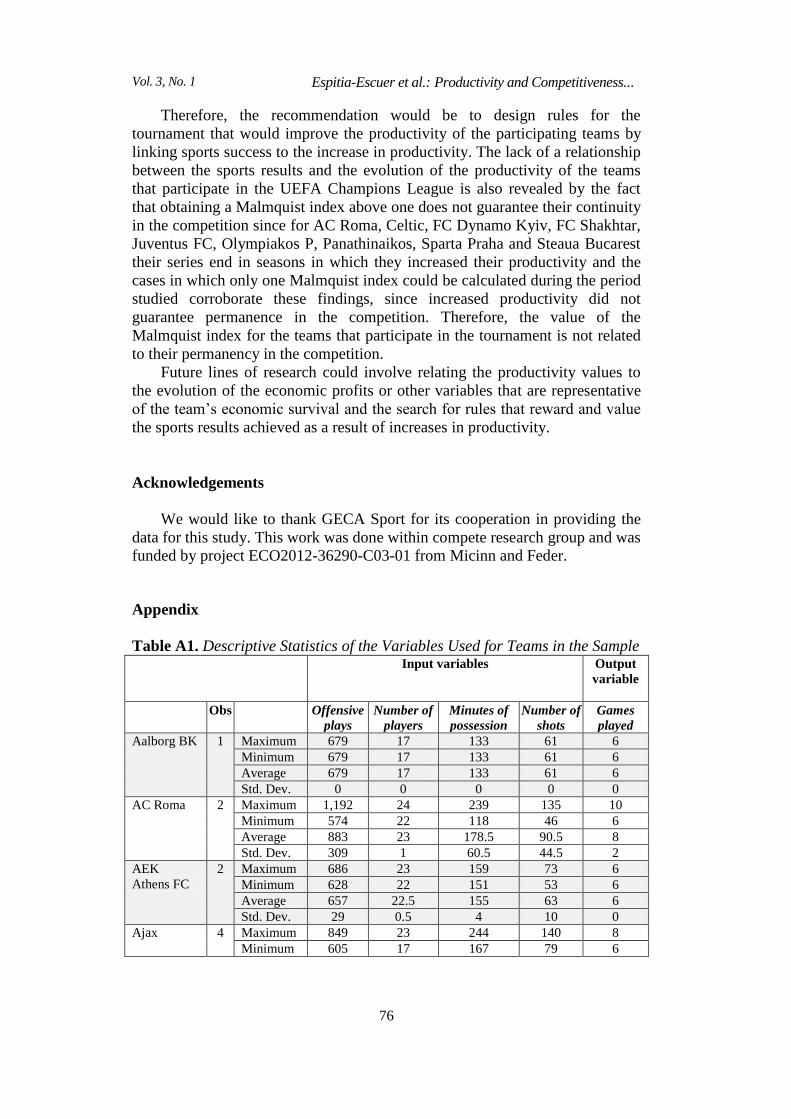
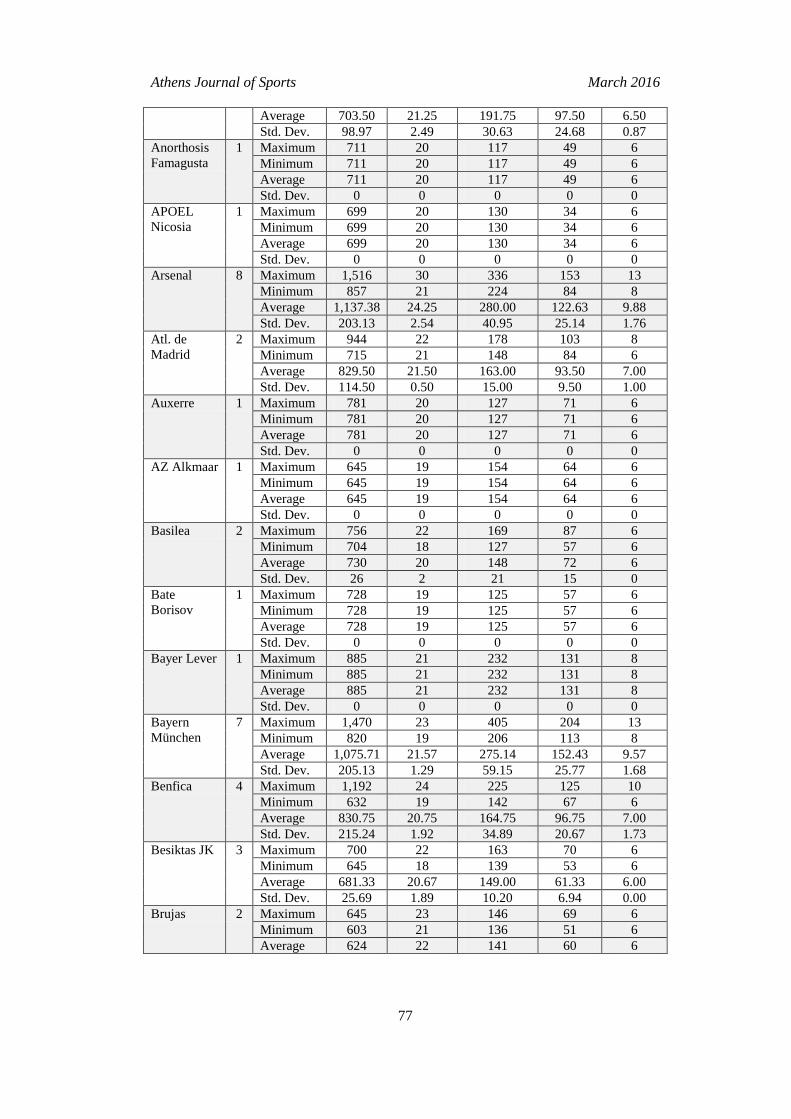
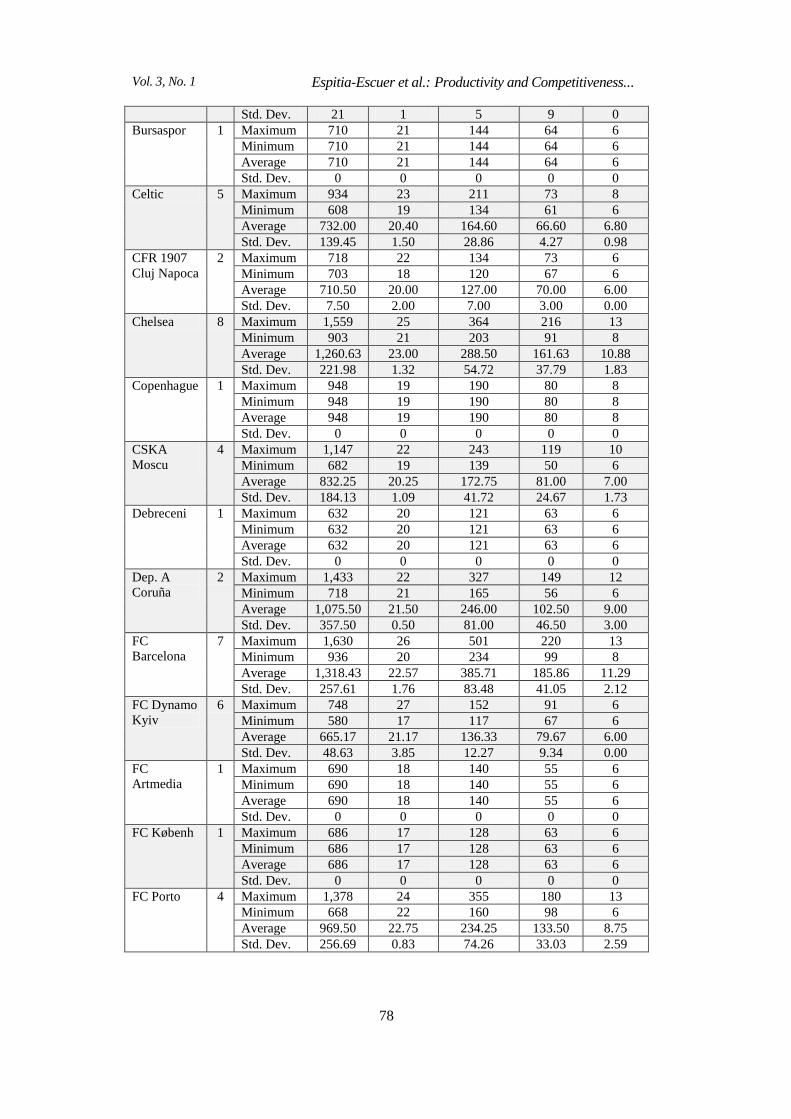
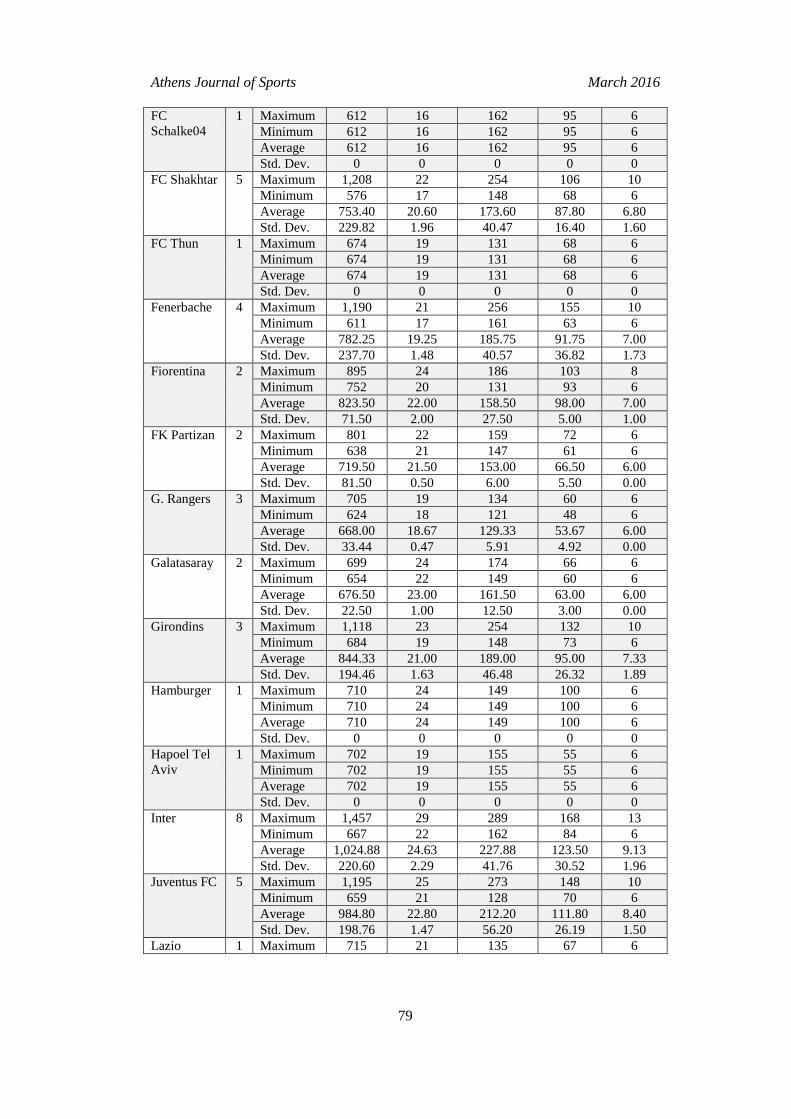
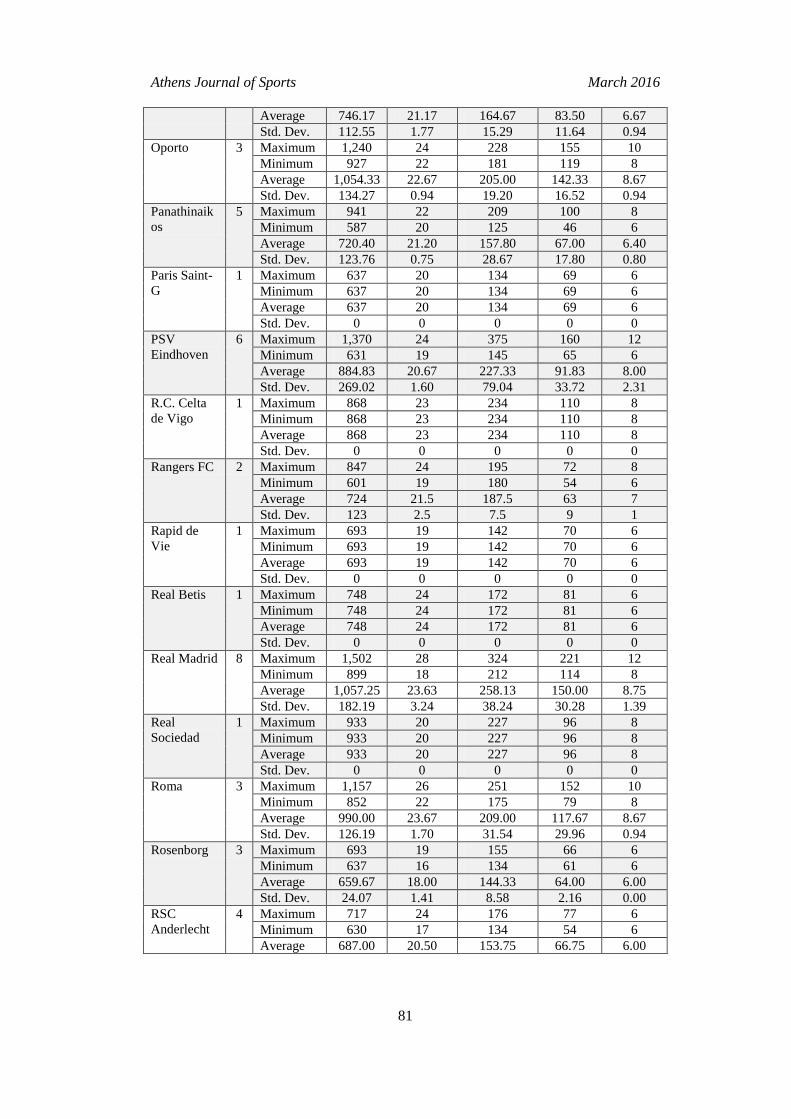
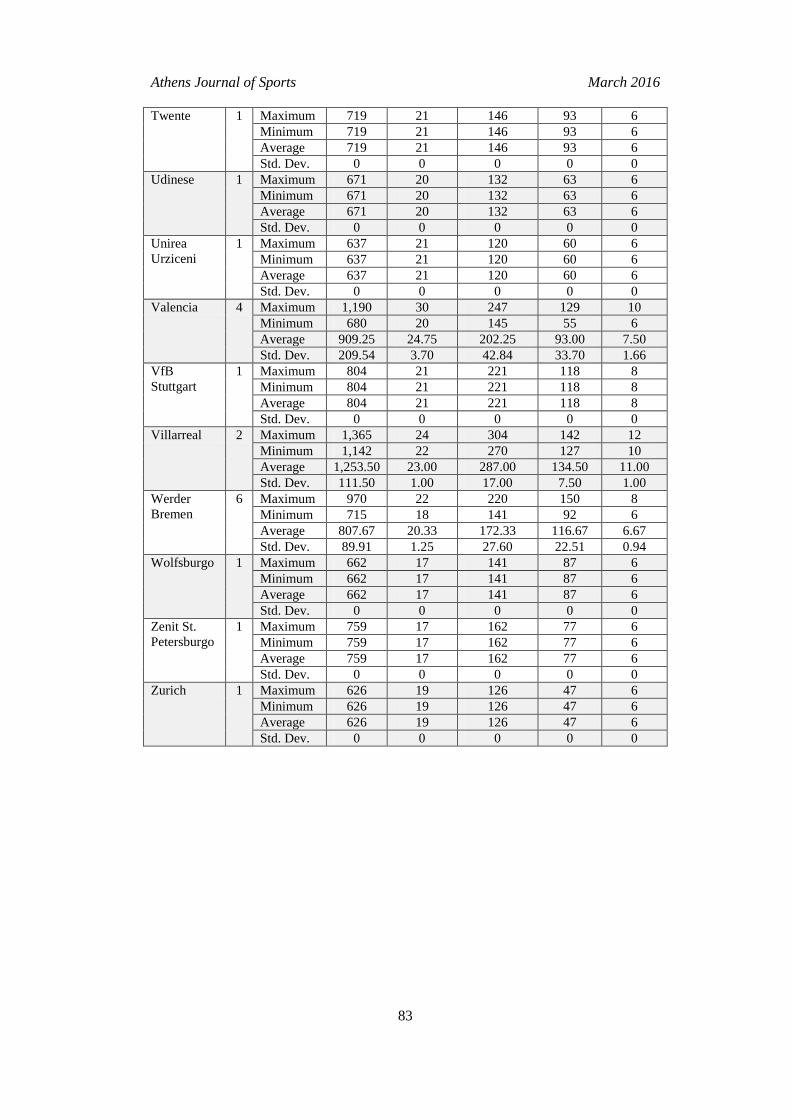
Appendix
Table A1. Descriptive Statistics of the Variables Used for Teams in the Sample
Input variables Output
variable
Obs Offensive
plays
Number of
players
Minutes of
possession
Number of
shots
Games
played
Aalborg BK 1 Maximum 679 17 133 61 6
Minimum 679 17 133 61 6
Average 679 17 133 61 6
Std. Dev. 0 0 0 0 0
AC Roma 2 Maximum 1,192 24 239 135 10
Minimum 574 22 118 46 6
Average 883 23 178.5 90.5 8
Std. Dev. 309 1 60.5 44.5 2
AEK
Athens FC
2 Maximum 686 23 159 73 6
Minimum 628 22 151 53 6
Average 657 22.5 155 63 6
Std. Dev. 29 0.5 4 10 0
Ajax 4 Maximum 849 23 244 140 8
Minimum 605 17 167 79 6
Athens Journal of Sports March 2016
77
Average 703.50 21.25 191.75 97.50 6.50
Std. Dev. 98.97 2.49 30.63 24.68 0.87
Anorthosis
Famagusta
1 Maximum 711 20 117 49 6
Minimum 711 20 117 49 6
Average 711 20 117 49 6
Std. Dev. 0 0 0 0 0
APOEL
Nicosia
1 Maximum 699 20 130 34 6
Minimum 699 20 130 34 6
Average 699 20 130 34 6
Std. Dev. 0 0 0 0 0
Arsenal 8 Maximum 1,516 30 336 153 13
Minimum 857 21 224 84 8
Average 1,137.38 24.25 280.00 122.63 9.88
Std. Dev. 203.13 2.54 40.95 25.14 1.76
Atl. de
Madrid
2 Maximum 944 22 178 103 8
Minimum 715 21 148 84 6
Average 829.50 21.50 163.00 93.50 7.00
Std. Dev. 114.50 0.50 15.00 9.50 1.00
Auxerre 1 Maximum 781 20 127 71 6
Minimum 781 20 127 71 6
Average 781 20 127 71 6
Std. Dev. 0 0 0 0 0
AZ Alkmaar 1 Maximum 645 19 154 64 6
Minimum 645 19 154 64 6
Average 645 19 154 64 6
Std. Dev. 0 0 0 0 0
Basilea 2 Maximum 756 22 169 87 6
Minimum 704 18 127 57 6
Average 730 20 148 72 6
Std. Dev. 26 2 21 15 0
Bate
Borisov
1 Maximum 728 19 125 57 6
Minimum 728 19 125 57 6
Average 728 19 125 57 6
Std. Dev. 0 0 0 0 0
Bayer Lever 1 Maximum 885 21 232 131 8
Minimum 885 21 232 131 8
Average 885 21 232 131 8
Std. Dev. 0 0 0 0 0
Bayern
München
7 Maximum 1,470 23 405 204 13
Minimum 820 19 206 113 8
Average 1,075.71 21.57 275.14 152.43 9.57
Std. Dev. 205.13 1.29 59.15 25.77 1.68
Benfica 4 Maximum 1,192 24 225 125 10
Minimum 632 19 142 67 6
Average 830.75 20.75 164.75 96.75 7.00
Std. Dev. 215.24 1.92 34.89 20.67 1.73
Besiktas JK 3 Maximum 700 22 163 70 6
Minimum 645 18 139 53 6
Average 681.33 20.67 149.00 61.33 6.00
Std. Dev. 25.69 1.89 10.20 6.94 0.00
Brujas 2 Maximum 645 23 146 69 6
Minimum 603 21 136 51 6
Average 624 22 141 60 6
Vol. 3, No. 1 Espitia-Escuer et al.: Productivity and Competitiveness...
78
Std. Dev. 21 1 5 9 0
Bursaspor 1 Maximum 710 21 144 64 6
Minimum 710 21 144 64 6
Average 710 21 144 64 6
Std. Dev. 0 0 0 0 0
Celtic 5 Maximum 934 23 211 73 8
Minimum 608 19 134 61 6
Average 732.00 20.40 164.60 66.60 6.80
Std. Dev. 139.45 1.50 28.86 4.27 0.98
CFR 1907
Cluj Napoca
2 Maximum 718 22 134 73 6
Minimum 703 18 120 67 6
Average 710.50 20.00 127.00 70.00 6.00
Std. Dev. 7.50 2.00 7.00 3.00 0.00
Chelsea 8 Maximum 1,559 25 364 216 13
Minimum 903 21 203 91 8
Average 1,260.63 23.00 288.50 161.63 10.88
Std. Dev. 221.98 1.32 54.72 37.79 1.83
Copenhague 1 Maximum 948 19 190 80 8
Minimum 948 19 190 80 8
Average 948 19 190 80 8
Std. Dev. 0 0 0 0 0
CSKA
Moscu
4 Maximum 1,147 22 243 119 10
Minimum 682 19 139 50 6
Average 832.25 20.25 172.75 81.00 7.00
Std. Dev. 184.13 1.09 41.72 24.67 1.73
Debreceni 1 Maximum 632 20 121 63 6
Minimum 632 20 121 63 6
Average 632 20 121 63 6
Std. Dev. 0 0 0 0 0
Dep. A
Coruña
2 Maximum 1,433 22 327 149 12
Minimum 718 21 165 56 6
Average 1,075.50 21.50 246.00 102.50 9.00
Std. Dev. 357.50 0.50 81.00 46.50 3.00
FC
Barcelona
7 Maximum 1,630 26 501 220 13
Minimum 936 20 234 99 8
Average 1,318.43 22.57 385.71 185.86 11.29
Std. Dev. 257.61 1.76 83.48 41.05 2.12
FC Dynamo
Kyiv
6 Maximum 748 27 152 91 6
Minimum 580 17 117 67 6
Average 665.17 21.17 136.33 79.67 6.00
Std. Dev. 48.63 3.85 12.27 9.34 0.00
FC
Artmedia
1 Maximum 690 18 140 55 6
Minimum 690 18 140 55 6
Average 690 18 140 55 6
Std. Dev. 0 0 0 0 0
FC Københ 1 Maximum 686 17 128 63 6
Minimum 686 17 128 63 6
Average 686 17 128 63 6
Std. Dev. 0 0 0 0 0
FC Porto 4 Maximum 1,378 24 355 180 13
Minimum 668 22 160 98 6
Average 969.50 22.75 234.25 133.50 8.75
Std. Dev. 256.69 0.83 74.26 33.03 2.59
Athens Journal of Sports March 2016
79
FC
Schalke04
1 Maximum 612 16 162 95 6
Minimum 612 16 162 95 6
Average 612 16 162 95 6
Std. Dev. 0 0 0 0 0
FC Shakhtar 5 Maximum 1,208 22 254 106 10
Minimum 576 17 148 68 6
Average 753.40 20.60 173.60 87.80 6.80
Std. Dev. 229.82 1.96 40.47 16.40 1.60
FC Thun 1 Maximum 674 19 131 68 6
Minimum 674 19 131 68 6
Average 674 19 131 68 6
Std. Dev. 0 0 0 0 0
Fenerbache 4 Maximum 1,190 21 256 155 10
Minimum 611 17 161 63 6
Average 782.25 19.25 185.75 91.75 7.00
Std. Dev. 237.70 1.48 40.57 36.82 1.73
Fiorentina 2 Maximum 895 24 186 103 8
Minimum 752 20 131 93 6
Average 823.50 22.00 158.50 98.00 7.00
Std. Dev. 71.50 2.00 27.50 5.00 1.00
FK Partizan 2 Maximum 801 22 159 72 6
Minimum 638 21 147 61 6
Average 719.50 21.50 153.00 66.50 6.00
Std. Dev. 81.50 0.50 6.00 5.50 0.00
G. Rangers 3 Maximum 705 19 134 60 6
Minimum 624 18 121 48 6
Average 668.00 18.67 129.33 53.67 6.00
Std. Dev. 33.44 0.47 5.91 4.92 0.00
Galatasaray 2 Maximum 699 24 174 66 6
Minimum 654 22 149 60 6
Average 676.50 23.00 161.50 63.00 6.00
Std. Dev. 22.50 1.00 12.50 3.00 0.00
Girondins 3 Maximum 1,118 23 254 132 10
Minimum 684 19 148 73 6
Average 844.33 21.00 189.00 95.00 7.33
Std. Dev. 194.46 1.63 46.48 26.32 1.89
Hamburger 1 Maximum 710 24 149 100 6
Minimum 710 24 149 100 6
Average 710 24 149 100 6
Std. Dev. 0 0 0 0 0
Hapoel Tel
Aviv
1 Maximum 702 19 155 55 6
Minimum 702 19 155 55 6
Average 702 19 155 55 6
Std. Dev. 0 0 0 0 0
Inter 8 Maximum 1,457 29 289 168 13
Minimum 667 22 162 84 6
Average 1,024.88 24.63 227.88 123.50 9.13
Std. Dev. 220.60 2.29 41.76 30.52 1.96
Juventus FC 5 Maximum 1,195 25 273 148 10
Minimum 659 21 128 70 6
Average 984.80 22.80 212.20 111.80 8.40
Std. Dev. 198.76 1.47 56.20 26.19 1.50
Lazio 1 Maximum 715 21 135 67 6

Vol. 3, No. 1 Espitia-Escuer et al.: Productivity and Competitiveness...
80
Minimum 715 21 135 67 6
Average 715 21 135 67 6
Std. Dev. 0 0 0 0 0
Levski S 1 Maximum 697 22 158 56 6
Minimum 697 22 158 56 6
Average 697 22 158 56 6
Std. Dev. 0 0 0 0 0
Lille 2 Maximum 936 24 181 139 8
Minimum 683 22 141 92 6
Average 809.50 23.00 161.00 115.50 7.00
Std. Dev. 126.50 1.00 20.00 23.50 1.00
Liverpool 6 Maximum 1,504 26 319 178 13
Minimum 648 21 172 88 6
Average 1,171.83 23.50 256.50 137.00 10.33
Std. Dev. 293.73 1.98 55.00 28.94 2.62
Lokomotiv 1 Maximum 808 19 220 98 8
Minimum 808 19 220 98 8
Average 808 19 220 98 8
Std. Dev. 0 0 0 0 0
Lyon 8 Maximum 1,404 24 281 177 12
Minimum 900 20 171 118 8
Average 1,096.38 21.75 234.50 139.63 9.25
Std. Dev. 138.85 1.56 38.20 19.28 1.39
Maccabi
Haifa
1 Maximum 612 20 134 58 6
Minimum 612 20 134 58 6
Average 612 20 134 58 6
Std. Dev. 0 0 0 0 0
Maccabi Tel 1 Maximum 572 19 131 56 6
Minimum 572 19 131 56 6
Average 572 19 131 56 6
Std. Dev. 0 0 0 0 0
Manchester
United
8 Maximum 1,639 28 386 227 13
Minimum 755 19 158 66 6
Average 1,199.50 24.25 287.50 146.00 10.38
Std. Dev. 353.84 3.07 75.15 54.39 2.60
Milan AC 7 Maximum 1,465 25 328 203 13
Minimum 928 22 212 88 8
Average 1,163.29 23.43 272.86 138.43 10.29
Std. Dev. 219.66 1.18 50.89 39.50 2.19
Monaco 2 Maximum 1,444 20 329 178 13
Minimum 880 20 190 83 8
Average 1,162.00 20.00 259.50 130.50 10.50
Std. Dev. 282.00 0.00 69.50 47.50 2.50
MSK Zilina 1 Maximum 746 19 119 72 6
Minimum 746 19 119 72 6
Average 746 19 119 72 6
Std. Dev. 0 0 0 0 0
O. Marseille 5 Maximum 1,079 20 211 137 8
Minimum 663 18 135 75 6
Average 784.80 19.40 161.40 90.80 6.40
Std. Dev. 149.66 0.80 26.49 23.48 0.80
Olympiakos
P
6 Maximum 914 24 186 100 8
Minimum 641 19 143 61 6
Athens Journal of Sports March 2016
81
Average 746.17 21.17 164.67 83.50 6.67
Std. Dev. 112.55 1.77 15.29 11.64 0.94
Oporto 3 Maximum 1,240 24 228 155 10
Minimum 927 22 181 119 8
Average 1,054.33 22.67 205.00 142.33 8.67
Std. Dev. 134.27 0.94 19.20 16.52 0.94
Panathinaik
os
5 Maximum 941 22 209 100 8
Minimum 587 20 125 46 6
Average 720.40 21.20 157.80 67.00 6.40
Std. Dev. 123.76 0.75 28.67 17.80 0.80
Paris Saint-
G
1 Maximum 637 20 134 69 6
Minimum 637 20 134 69 6
Average 637 20 134 69 6
Std. Dev. 0 0 0 0 0
PSV
Eindhoven
6 Maximum 1,370 24 375 160 12
Minimum 631 19 145 65 6
Average 884.83 20.67 227.33 91.83 8.00
Std. Dev. 269.02 1.60 79.04 33.72 2.31
R.C. Celta
de Vigo
1 Maximum 868 23 234 110 8
Minimum 868 23 234 110 8
Average 868 23 234 110 8
Std. Dev. 0 0 0 0 0
Rangers FC 2 Maximum 847 24 195 72 8
Minimum 601 19 180 54 6
Average 724 21.5 187.5 63 7
Std. Dev. 123 2.5 7.5 9 1
Rapid de
Vie
1 Maximum 693 19 142 70 6
Minimum 693 19 142 70 6
Average 693 19 142 70 6
Std. Dev. 0 0 0 0 0
Real Betis 1 Maximum 748 24 172 81 6
Minimum 748 24 172 81 6
Average 748 24 172 81 6
Std. Dev. 0 0 0 0 0
Real Madrid 8 Maximum 1,502 28 324 221 12
Minimum 899 18 212 114 8
Average 1,057.25 23.63 258.13 150.00 8.75
Std. Dev. 182.19 3.24 38.24 30.28 1.39
Real
Sociedad
1 Maximum 933 20 227 96 8
Minimum 933 20 227 96 8
Average 933 20 227 96 8
Std. Dev. 0 0 0 0 0
Roma 3 Maximum 1,157 26 251 152 10
Minimum 852 22 175 79 8
Average 990.00 23.67 209.00 117.67 8.67
Std. Dev. 126.19 1.70 31.54 29.96 0.94
Rosenborg 3 Maximum 693 19 155 66 6
Minimum 637 16 134 61 6
Average 659.67 18.00 144.33 64.00 6.00
Std. Dev. 24.07 1.41 8.58 2.16 0.00
RSC
Anderlecht
4 Maximum 717 24 176 77 6
Minimum 630 17 134 54 6
Average 687.00 20.50 153.75 66.75 6.00

Vol. 3, No. 1 Espitia-Escuer et al.: Productivity and Competitiveness...
82
Std. Dev. 33.64 2.69 17.33 10.40 0.00
Rubin
Kazan
2 Maximum 726 20 125 61 6
Minimum 662 17 122 47 6
Average 694.00 18.50 123.50 54.00 6.00
Std. Dev. 32.00 1.50 1.50 7.00 0.00
Schalke 04 2 Maximum 1,501 27 270 156 12
Minimum 1,256 23 237 141 10
Average 1,378.50 25.00 253.50 148.50 11.00
Std. Dev. 122.50 2.00 16.50 7.50 1.00
Sevilla F.C. 2 Maximum 1,025 25 235 142 8
Minimum 893 25 208 107 8
Average 959.00 25.00 221.50 124.50 8.00
Std. Dev. 66.00 0.00 13.50 17.50 0.00
Slavia de
Praga
1 Maximum 684 23 126 44 6
Minimum 684 23 126 44 6
Average 684 23 126 44 6
Std. Dev. 0 0 0 0 0
Sparta Praha 3 Maximum 830 25 188 91 8
Minimum 665 19 134 72 6
Average 726.00 21.00 155.00 82.33 6.67
Std. Dev. 73.91 2.83 23.62 7.85 0.94
Spartak
Moscú
2 Maximum 751 23 162 79 6
Minimum 682 21 159 77 6
Average 716.50 22.00 160.50 78.00 6.00
Std. Dev. 34.50 1.00 1.50 1.00 0.00
Sporting
Braga
1 Maximum 786 21 124 66 6
Minimum 786 21 124 66 6
Average 786 21 124 66 6
Std. Dev. 0 0 0 0 0
Sporting de
Lisboa
3 Maximum 934 23 174 92 8
Minimum 683 21 150 89 6
Average 784.67 21.67 161.33 90.33 6.67
Std. Dev. 107.87 0.94 9.84 1.25 0.94
SS Lazio 1 Maximum 669 21 169 85 6
Minimum 669 21 169 85 6
Average 669 21 169 85 6
Std. Dev. 0 0 0 0 0
Standard de
Lieja
1 Maximum 644 19 116 62 6
Minimum 644 19 116 62 6
Average 644 19 116 62 6
Std. Dev. 0 0 0 0 0
Steaua
Bucarest
3 Maximum 721 21 152 63 6
Minimum 701 20 128 56 6
Average 712.00 20.33 138.00 60.33 6.00
Std. Dev. 8.29 0.47 10.20 3.09 0.00
Stuttgart 2 Maximum 873 22 206 122 8
Minimum 658 21 163 88 6
Average 765.50 21.50 184.50 105.00 7.00
Std. Dev. 107.50 0.50 21.50 17.00 1.00
Tottenham
Hotspur
1 Maximum 1,234 25 243 108 10
Minimum 1,234 25 243 108 10
Average 1,234 25 243 108 10
Std. Dev. 0 0 0 0 0
Athens Journal of Sports March 2016
83
Twente 1 Maximum 719 21 146 93 6
Minimum 719 21 146 93 6
Average 719 21 146 93 6
Std. Dev. 0 0 0 0 0
Udinese 1 Maximum 671 20 132 63 6
Minimum 671 20 132 63 6
Average 671 20 132 63 6
Std. Dev. 0 0 0 0 0
Unirea
Urziceni
1 Maximum 637 21 120 60 6
Minimum 637 21 120 60 6
Average 637 21 120 60 6
Std. Dev. 0 0 0 0 0
Valencia 4 Maximum 1,190 30 247 129 10
Minimum 680 20 145 55 6
Average 909.25 24.75 202.25 93.00 7.50
Std. Dev. 209.54 3.70 42.84 33.70 1.66
VfB
Stuttgart
1 Maximum 804 21 221 118 8
Minimum 804 21 221 118 8
Average 804 21 221 118 8
Std. Dev. 0 0 0 0 0
Villarreal 2 Maximum 1,365 24 304 142 12
Minimum 1,142 22 270 127 10
Average 1,253.50 23.00 287.00 134.50 11.00
Std. Dev. 111.50 1.00 17.00 7.50 1.00
Werder
Bremen
6 Maximum 970 22 220 150 8
Minimum 715 18 141 92 6
Average 807.67 20.33 172.33 116.67 6.67
Std. Dev. 89.91 1.25 27.60 22.51 0.94
Wolfsburgo 1 Maximum 662 17 141 87 6
Minimum 662 17 141 87 6
Average 662 17 141 87 6
Std. Dev. 0 0 0 0 0
Zenit St.
Petersburgo
1 Maximum 759 17 162 77 6
Minimum 759 17 162 77 6
Average 759 17 162 77 6
Std. Dev. 0 0 0 0 0
Zurich 1 Maximum 626 19 126 47 6
Minimum 626 19 126 47 6
Average 626 19 126 47 6
Std. Dev. 0 0 0 0 0
Vol. 3, No. 1 Espitia-Escuer et al.: Productivity and Competitiveness...
84
References
Blass AA (1992) Does the baseball labor market contradict the human capital model
of investment? The Review of Economics and Statistics 74(2): 261-268.
Border KC (2004) On the Cobb-Douglas production function: 1-2. Retrieved from
http://goo.gl/9wwG8H.
Bosca JE, Liern V, Martinez A, Sala R (2009) Increasing offensive or defensive
efficiency? An analysis of Italian and Spanish football. Omega 37(1): 63-78.
Carmichael F, Thomas D (1995) Production and efficiency in team sports: an
investigation of rugby league football. Applied Economics 27(9): 859-869.
Carmichael F, Thomas D, Ward R (2000) Team performance: the case of English
premiership football. Managerial and Decision Economics 21(1): 31-45.
Caves D, Christensen L, Diewert WR (1982) The economic theory of index numbers
and the measurement of input, output and productivity. Econometrica 50(6):
1393-1414.
Chiavenato I (1999) Introducción a la Teoría General de la Administración
[Introduction to General Management Theory] (5th ed). New York: McGraw Hill.
Dawson P, Dobson S, Gerrard B (2000) Estimating coaching efficiency in
professional team sports: evidence from English association football. Scottish
Journal of Political Economy 47(4): 399-421.
Douvis I, Pestana-Barros C (2008) Comparative analysis of football efficiency among
two small European countries: Portugal and Greece. Sport Management
International Journal 4(1): 5-29.
Espitia-Escuer M, Garcia-Cebrian LI (2008) Measuring the productivity of Spanish
first division soccer teams. European Sport Management Quarterly 8(2): 229-
240.
Farrell MJ (1957) The Measurement of Productive Efficiency. Journal of the Royal
Statistical Society 120(Part III): 253-281.
Fort R (2006) Sports Economics. Upper Saddle River: Prentice Hall.
Fort R, Quirk J (1995) Cross-subsidisation, incentives, and outcomes in professional
sports leagues. Journal of Economic Literature 33(3): 1265-1299.
Garcia del Barrio P, Szymanski S (2009) Goal! Profit maximization versus win
maximization in football. Review of Industrial Organization 34(1): 45-68.
Golany B, Roll Y (1989) An application procedure for DEA. Omega 17(3): 237-250.
Gonzalez-Gomez F, Picazo-Tadeo AJ (2010) Can we be satisfied with our football
team? Evidence from Spanish professional football. Journal of Sports Economics
11(4): 418-442.
Grosskopf S (1993) Efficiency and productivity. In HO Fried, CAK Lovell, SS
Schmidt (Eds.), The Measurement of Productive Efficiency: 160-194. New York:
Oxford University Press.
Guzman I (2006) Measuring efficiency and sustainable growth in Spanish football
teams. European Sport Management Quarterly 6(3): 267-287.
Guzman I, Morrow S (2007) Measuring efficiency and productivity in professional
football teams: evidence from the English premier league. Central European
Journal of Operations Research 15(4): 309-328.
Haas DJ (2003a) Productive efficiency of English football teams - a data envelopment
analysis approach. Managerial and Decision Economics 24(5): 403-410.
Haas DJ (2003b) Technical efficiency in the major league soccer. Journal of Sports
Economics 4(3): 203-215.
Athens Journal of Sports March 2016
85
Haas DJ, Kocher MG, Sutter M (2004) Measuring efficiency of German football
teams by data envelopment analysis. Central European Journal of Operations
Research 12(3): 251-268.
Jardin M (2010) Efficiency of French football clubs and its dynamics. MPRA Paper
19828.
Késenne, S (2007): The Economic Theory of Professional Sport: An Analytical
Treatment. Cheltenham, UK and Northampton, USA: Edward Elgar Publishing.
Leibenstein H (1962) Allocative efficiency vs. X-efficiency. American Economic
Review LVI(3): 392-415.
Mazur MJ (1994) Evaluating the relative efficiency of baseball players. In A Charnes,
WW Cooper, AY Lewin, LM Seiford (Eds.), Data Envelopment Analysis:
Theory, Methodology and Application. Norwell, MA, USA: Kluwer Academic
Publishers.
Pestana Barros C, Couto E, Samagaio A (2014) Management ability, strategy, tactics
and team performance. In J Goddard, P Sloane (Eds.), Handbook on the
Economics of Professional Football. Cheltenham, UK and Northampton, USA:
Edward Elgar Publishing.
Sandy R, Sloane P, Rosentraub MS (2004) The Economics of Sport: An International
Perspective. New York: Palgrave MacMillan.
Schofield JA (1988) Production functions in the sports industry: an empirical analysis
of professional cricket. Applied Economics 20(2): 177-193.
Sexton TR, Silkman RH, Hogan AJ (1986) Data envelopment analysis: critique and
extensions. In RH Silkman (Eds.), Measuring Efficiency: An Assessment of Data
Envelopment Analysis: 73-105. San Francisco: Jossey-Bass.
Szymanski S (1998) Why is Manchester United so successful? Business Strategy
Review 9(4): 47-54.
Szymanski S (2003) The economic design of sporting contests. Journal of Economic
Literature 41(4): 1137-1187.
Thiry B, Tulkens H (1989) Productivity, efficiency and technical progress, concepts
and measurement. Annals of Public and Cooperative Economics 60(1): 9-41.

Vol. 3, No. 1 Espitia-Escuer et al.: Productivity and Competitiveness...
86