Embed Size (px)
Citation preview
processes
Article
Design, Cost Estimation and Sensitivity Analysis for aProduction Process of Activated Carbon from WasteNutshells by Physical Activation
Marcelo León 1,*, Javier Silva 1 , Samuel Carrasco 1 and Nelson Barrientos 2
1 Escuela de Ingeniería Química, Pontificia Universidad Católica de Valparaíso, Av. Brasil 2162,Valparaíso 2362854, Chile; [email protected] (J.S.); [email protected] (S.C.)
2 Trazado Nuclear e Ingeniería Ltda., Francisco de Villagra 385, Santiago 7760016, Chile;[email protected]
* Correspondence: [email protected]; Tel.: +56-32-237-2630
Received: 2 July 2020; Accepted: 3 August 2020; Published: 6 August 2020�����������������
Abstract: A conceptual design of an industrial production plant for activated carbon was developedto process 31.25 tons/day of industrial waste nutshells as the raw material and produce 6.6 ton/dayof activated carbon using steam as an activation agent. The design considered the cost of themain equipment, the purchase price of the nutshells, basic services, and operation. A sensitivityanalysis was developed, considering the price of the finished product and the volume of raw materialprocessing varied up to ±25%. Furthermore, the total annual cost of the product was determinedbased on the production of 2100 tons/year of activated carbon. Two cash flows were developed andprojected to periods of 10 years and 15 years of production, using a tax rate of 27%, a low discountrate (LDR) of 10% per year, and without external financing. For a 10-year production project, the netpresent value (NPV) was USD 2,785,624, the internal return rate (IRR) 21%, the return on investment(ROI) 25%, and the discounted payback period (DPP) after the fifth year. Considering a project with15 years of production, the NPV was USD 4,519,482, the IRR at 23%, the ROI 24%, and the DPP afterthe fifth year of production.
Keywords: economic evaluation; production cost; nutshell waste; activated carbon
1. Introduction
Currently, there is a great interest in adopting more efficient and low-cost processes for the treatmentof wastewater. The rapid growth of the world population is resulting in increased contaminationof freshwater sources, generating conditions of water stress in the short term [1]. The adsorptiontechnique using activated carbon is one of the most-used methods for the removal of organic pollutantsand metal ions in wastewaters, with previous studies reporting effective removal of impurities [2,3].
Activated carbons are highly porous carbon materials with a high specific internal surface area andcommonly serve as adsorbent material in various industrial separation and purification applications [4].Activated carbons can be obtained from chemical activation processes or physical activation of organicprecursors. Chemical activation consists of the impregnation of the raw material with chemical agents,such as KOH, ZnCl2, and H3PO4, among others, and simultaneous carbonization (pyrolysis) of theimpregnated biomass in an inert gaseous atmosphere, where the main role of the activating compoundis the degradation of the cellulosic material [5,6]. On the other hand, two relevant processes areinvolved in physical activation. The first process involves the pyrolysis of the raw material in an inertatmosphere that usually uses a gaseous stream of nitrogen. The second stage of activation involvesgases, such as water vapor, carbon dioxide, or a mixture of these gasses with nitrogen or air in differentproportions at high temperatures for the final activation [5,6].
Processes 2020, 8, 945; doi:10.3390/pr8080945 www.mdpi.com/journal/processes
Processes 2020, 8, 945 2 of 14
Generally, the raw material’s pyrolysis process takes place at temperatures between 400 and 600 ◦C,while the activation stage takes place between 800 and 1100 ◦C [5,6]. In comparison with chemicalactivation, physical activation can be considered clean and environmentally friendly, which would avoidthe incorporation of impurities from chemical activation agents. There are various organic materialsthat serve as raw materials for obtaining activated coals, such as coconut shells [7], rice shells [8],palm shells [9], peanut shells [10], and nutshells [11], among others [5,6]. Recent studies have shownthat physically activating carbon with steam using nutshells as a precursor has presented interestingcharacteristics for applications in the removal of heavy metals from effluents of polluted waters [12,13].In this sense, it could be interesting to develop a complete economic evaluation of a nutshell activatedcarbon production plant, using the parameters and conditions used in the laboratory.
There are few reports on the analysis of production costs of activated carbon production plants.Noticeably, the study of Ng et al. [14] in 2003 considers the production-cost analysis for an activatedcarbon plant from pecan shells. The study compares the physical activation with steam and thechemical activation with phosphoric acid and reaches a production cost of 2.72 USD/kg and 2.89 USD/kg,respectively. Choy et al. [15] in 2005 reported on the production of activated carbon from bamboowaste and the evaluation of two production plants: one independent and one integrated. The studypresents a thorough economic investigation and sensitivity analysis, estimating values for the internalreturn rate of 13.0% and 20.1%, respectively, among other economic indicators of interest. Subsequently,Lima et al. [16] in 2008 reported the capital and operating costs for an activated carbon plant frompoultry waste, obtaining a global production cost of 1.44 USD/kg. Next, Stavropoulos et al. [17] in2009 reported different production costs and other economic indicators for physically and chemicallyactivated carbon production processes based on precursors, such as used tires, wood, petroleum coke,carbon black, coal, and lignite. The authors obtained production costs of 2.23 USD/kg, 2.49 USD/kg,1.08 USD/kg, 1.22 USD/kg, 1.25 USD/kg and 2.18 USD/kg, respectively. Moreover, Vanreppelen et al. [18]in 2011 reported results on the feasibility of a process to produce nitrogenous activated carbon byco-pyrolysis of a mixture of particle board (chipboard) and melamine formaldehyde resin, estimatingdifferent economic indicators and developing sensitivity analyses. Furthermore, Santadkha andSkolpap [19] in 2017 reported the results of the economic evaluation for three types of productionprocesses: first, a process of generating activated carbon from coconut shells; second, a process ofregenerating coal obtained from the petrochemical industry, and, third, an integrated process thatcombines the production and regeneration of activated carbon. Nandiyanto [20] in 2018 reported theeconomic feasibility of the production of activated carbon and silica particles from rice straw residues,obtaining various economic indicators, such as an internal return rate of 44.06% for a case study.
The present work updates, complements, and discusses new economic approaches on theimplementation of an industrial plant that produces physically activated carbon from nutshells. Resultscan be extrapolated to various types of raw material, as long as the selected raw materials and processconditions are similar. Although the assumptions made for the selected production process providean adequate initial technical basis for the economic evaluation of a production plant at the industrialscale, there are limitations related to the conditions provided in this particular work. In this sense,the precision of this study is highly dependent on the variation in the cost of the main equipment,the cost of the raw material, the sale price of the product, and the estimated operating conditions of theproduction process. Another weakness may be related to the use of the factorial method to estimate thetotal capital investment used to calculate the economic indicators of profitability. Future work shouldbe directed towards the optimization of the selected production process, through the use of a suitablechemical process simulation software. This information would greatly improve the economic study.
Processes 2020, 8, 945 3 of 14
2. Materials and Methods
2.1. Production Process
The production process and operational parameters were proposed based on recent bibliographicaldata, which reported the obtaining of activated carbons from nutshells, using an inert nitrogen-basedatmosphere for the pyrolysis stage and a flow of steam as an activating agent for the activationstage [13]. The parameters and conditions reported by Nazem et al. [13] were considered for theconceptual plant design considering a specific area of 1248 m2/g for the activated carbon. This reportindicates the pyrolysis stage temperature of 600 ◦C and a residence time of 1 h. For the activation stage,the operational conditions considered were 950 ◦C for temperature and 1 h for residence time. In thepresent work, a conversion rate of 30% was considered for the pyrolysis stage, in which nutshellsare transformed into natural carbon, and a conversion rate of 70% for the activation stage, in whichpreviously obtained natural carbon is converted into activated carbon. An overall conversion rateof 21% was established; consequently, this percentage of the available raw material of nutshells isfinally transformed into activated carbon. On the other hand, material and energy balances weredeveloped to obtain all the input and output flows of the production process, adjusted to the operatingconditions considering production for the base case of 6.6 ton/day of activated carbon with ±25%variation. A sufficiently wide range of variation was considered to adequately establish the effect of theparameters on the net present value. Finally, the requirements for basic water, nitrogen, steam, and fuelservices necessary for the operation of the process were estimated, as well as the size parameters forthe sizing of the main process equipment.
2.2. Economic Analysis
For the economic evaluation, the installation of the production process plant in Chile wasconsidered, because it has an appropriate availability of the raw material, access to ports of shipment,stability, and economic integration at a global level. On the other hand, considering that the mass ratiobetween the internal fruit and the shell is close to one, it was possible to establish that the quantity ofavailable nutshells in Chile is similar to the exports of shelled nuts considered under the InternationalTrade Center (ITC) code 080232. In this way, it was estimated that the availability of raw material wasclose to 34 kton/year, sufficient to supply the 10 kton/year (±25%) needed for the proper developmentof the investment project.
A working year of 360 days was considered, with a typical working period of 320 days/yearfor production and 40 days/year for plant maintenance tasks, and with a density of 600 kg/m3 in thecase of nutshells and 500 kg/m3 in the case of the activated carbon obtained to size the main processequipment. The cost of the main equipment was estimated from actual local commercial quotationsand costs present in the available literature [14–16]. The costs were updated to present value using thechemical engineering plant cost index (CEPCI), applying Equation (1). The costs of the main equipmentwere adjusted for required production capacity through Equation (2), using a typical exponent of 0.6(six-tenths-factor rule) [21,22]. The operational labor costs were estimated graphically for an averagecondition plant, yielding 27 employee-hours/day/processing step.
Cost Item (2019) = Cost Item (20XX) ×[ Cost Index 2019Cost Index 20XX
](1)
Cost New Capacity = Cost Old Capacity×[
New CapacityOld Capacity
]0.6
(2)
The total capital investment established from the total cost of the main process equipment installedat the plant—including the auxiliary equipment, the total product cost including the operational labor,the projected cash flows using the selling price of the product and the sensitivity analysis—weredetermined taking as a guide the standard procedures described in Plant Design and Economics for
Processes 2020, 8, 945 4 of 14
Chemical Engineers by Peter & Timmerhaus [21,22]. In particular, the total capital investment was basedon the percentage of the delivered equipment cost method for a solids and liquids processing plant,described in the previous reference. The depreciation of process equipment was calculated using thelinear method, and the income tax rate used was 27% (case of Chile) [23]. The expected error in theestimation of factored costs is around ±25%. The sales price of the finished product (activated carbon)for the base case was estimated at 2.75 USD/kg. Finally, economic indicators, such as net present value(NPV), internal return rate (IRR), return on investment (ROI), and discounted payback period (DPP),were determined. The equations for calculating NPV (Equation (3)), IRR (Equation (4)), and ROI(Equation (5)) are shown below [15,17]. In the case of the DPP, it was estimated graphically using thediscounted cumulative cash flow.
NPV [USD] =N∑
t=1
Ft
(1 + d)t − I0 (3)
NPV =N∑
t=1
Ft
(1 + d∗)t − I0 = 0→ d∗ = IRR (4)
ROI [%] =Ft
I0× 100 (5)
where N = project duration [years], Ft = annual profit [USD], d = low discount rate (LDR = 10% averagemarket value), I0 = total capital investment [USD], and d* = internal return rate (it is the discount ratewhen NPV = 0).
3. Results
3.1. Production Process Description (Base Case)
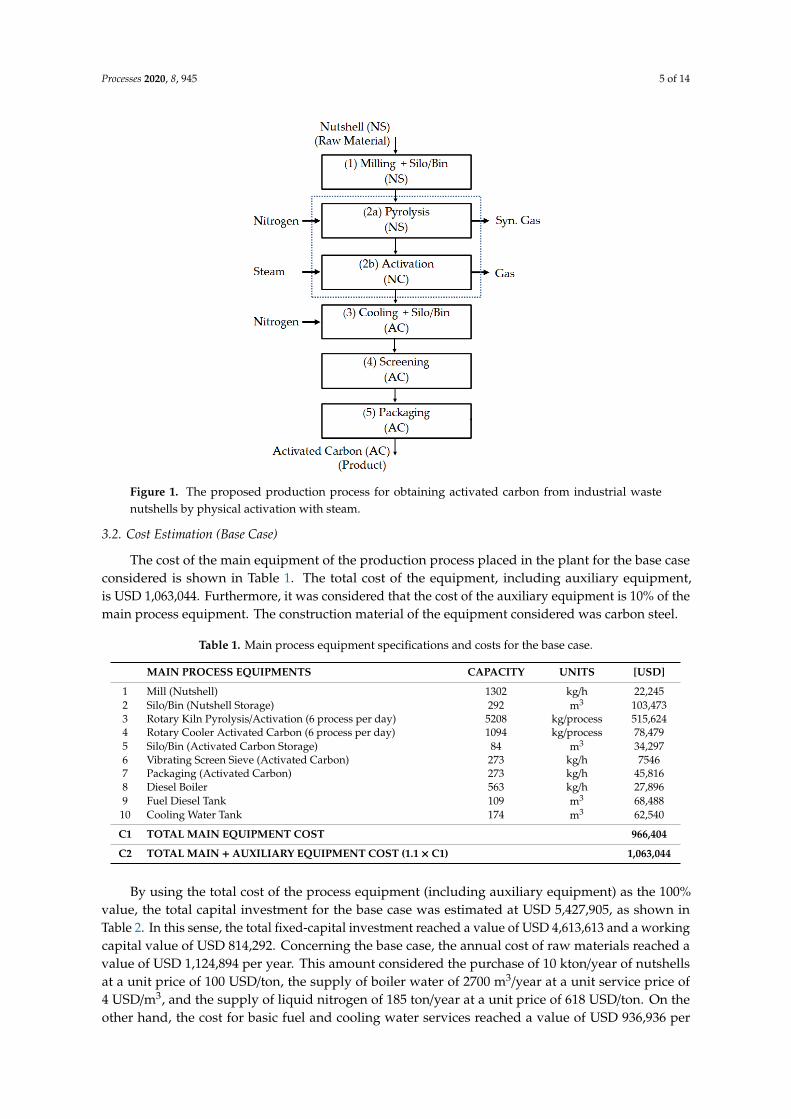
A processing capacity of 31,250 kg/day of nutshells was considered for the production of6563 kg/day of activated carbon from nutshells for 320 effective working days of operation. Figure 1shows the proposed production process for obtaining activated carbon from nutshells. The first stageis to grind 31,250 kg/day of nutshells to reach a maximum granular particle size of 18 mesh (1.0 mm)in a mill capable of processing 1302 kg/h and then to collect the ground raw material in two storagesilos with a capacity of 182 m3 each, allowing the raw material stock to be maintained for one weekof production.
Subsequently, in the second stage, the 31,250 kg/day of ground nutshells must be processed in sixindependent loading processes per day of 5208 kg/load. The nutshells are fed to a rotary kiln wherethe raw material’s carbonization process is carried out at a temperature of 600 ◦C with a residencetime of 1 h. To avoid the combustion of organic matter inside the furnace chamber, a nitrogen flow isincorporated to displace the air. In this way, 1563 kg/load of natural coal is obtained from nutshellsas an intermediate product, with an estimated yield for this stage of 30%. The process of activationis carried out at a temperature of 900 ◦C in the presence of a steam current as an activating agentfor a residence time of 1 h. 1094 kg/load of activated carbon from nutshells is obtained as the finalproduct of this stage, with a yield of 70%. The rotary reactor was designed with a volumetric loadratio of 15% and an internal volume of approximately 58 m3. In the third stage, the activated carbonproduced passes to cooling equipment where the temperature decreases to 50 ◦C using a nitrogenatmosphere and is stored in a silo of 92 m3 of capacity that means the stock can be kept for a weekof production. The fourth stage consists of passing the activated carbon through sieving equipmentcapable of processing 273 kg/h of product. Finally, in the fifth stage, the packaging process of theactivated carbon produced is developed.
Processes 2020, 8, 945 5 of 14
Processes 2020, 8, x FOR PEER REVIEW 4 of 14
was calculated using the linear method, and the income tax rate used was 27% (case of Chile) [23]. The expected error in the estimation of factored costs is around ±25%. The sales price of the finished product (activated carbon) for the base case was estimated at 2.75 USD/kg. Finally, economic indicators, such as net present value (NPV), internal return rate (IRR), return on investment (ROI), and discounted payback period (DPP), were determined. The equations for calculating NPV (Equation (3)), IRR (Equation (4)), and ROI (Equation (5)) are shown below [15,17]. In the case of the DPP, it was estimated graphically using the discounted cumulative cash flow.
NPV [USD] = F1 + d − I (3)
NPV = F1 + d∗ − I = 0 → d∗ = IRR (4)
ROI [%] = FI × 100 (5)
where N = project duration [years], Ft = annual profit [USD], d = low discount rate (LDR = 10% average market value), I0 = total capital investment [USD], and d* = internal return rate (it is the discount rate when NPV = 0).
3. Results
3.1. Production Process Description (Base Case)
A processing capacity of 31,250 kg/day of nutshells was considered for the production of 6563 kg/day of activated carbon from nutshells for 320 effective working days of operation. Figure 1 shows the proposed production process for obtaining activated carbon from nutshells. The first stage is to grind 31,250 kg/day of nutshells to reach a maximum granular particle size of 18 mesh (1.0 mm) in a mill capable of processing 1302 kg/h and then to collect the ground raw material in two storage silos with a capacity of 182 m3 each, allowing the raw material stock to be maintained for one week of production.
Figure 1. The proposed production process for obtaining activated carbon from industrial waste nutshells by physical activation with steam. Figure 1. The proposed production process for obtaining activated carbon from industrial wastenutshells by physical activation with steam.
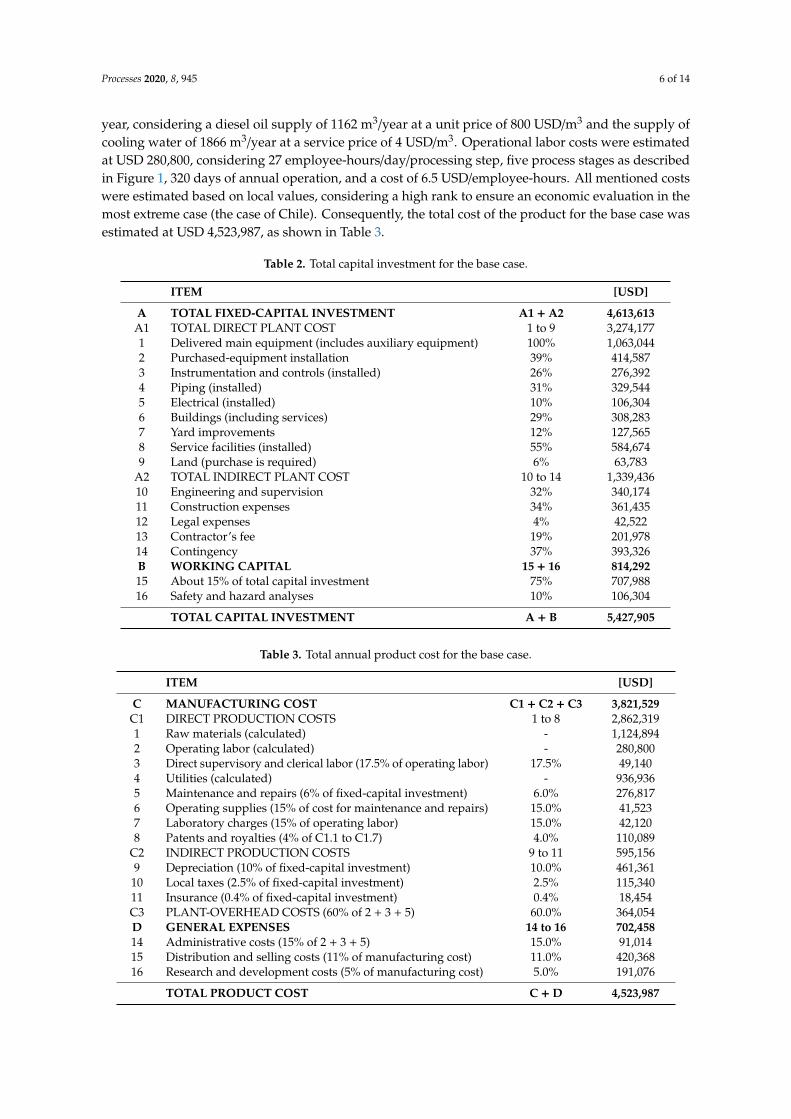
3.2. Cost Estimation (Base Case)
The cost of the main equipment of the production process placed in the plant for the base caseconsidered is shown in Table 1. The total cost of the equipment, including auxiliary equipment,is USD 1,063,044. Furthermore, it was considered that the cost of the auxiliary equipment is 10% of themain process equipment. The construction material of the equipment considered was carbon steel.
Table 1. Main process equipment specifications and costs for the base case.
MAIN PROCESS EQUIPMENTS CAPACITY UNITS [USD]
1 Mill (Nutshell) 1302 kg/h 22,2452 Silo/Bin (Nutshell Storage) 292 m3 103,4733 Rotary Kiln Pyrolysis/Activation (6 process per day) 5208 kg/process 515,6244 Rotary Cooler Activated Carbon (6 process per day) 1094 kg/process 78,4795 Silo/Bin (Activated Carbon Storage) 84 m3 34,2976 Vibrating Screen Sieve (Activated Carbon) 273 kg/h 75467 Packaging (Activated Carbon) 273 kg/h 45,8168 Diesel Boiler 563 kg/h 27,8969 Fuel Diesel Tank 109 m3 68,488
10 Cooling Water Tank 174 m3 62,540
C1 TOTAL MAIN EQUIPMENT COST 966,404
C2 TOTAL MAIN + AUXILIARY EQUIPMENT COST (1.1 × C1) 1,063,044
By using the total cost of the process equipment (including auxiliary equipment) as the 100%value, the total capital investment for the base case was estimated at USD 5,427,905, as shown inTable 2. In this sense, the total fixed-capital investment reached a value of USD 4,613,613 and a workingcapital value of USD 814,292. Concerning the base case, the annual cost of raw materials reached avalue of USD 1,124,894 per year. This amount considered the purchase of 10 kton/year of nutshellsat a unit price of 100 USD/ton, the supply of boiler water of 2700 m3/year at a unit service price of4 USD/m3, and the supply of liquid nitrogen of 185 ton/year at a unit price of 618 USD/ton. On theother hand, the cost for basic fuel and cooling water services reached a value of USD 936,936 per
Processes 2020, 8, 945 6 of 14
year, considering a diesel oil supply of 1162 m3/year at a unit price of 800 USD/m3 and the supply ofcooling water of 1866 m3/year at a service price of 4 USD/m3. Operational labor costs were estimatedat USD 280,800, considering 27 employee-hours/day/processing step, five process stages as describedin Figure 1, 320 days of annual operation, and a cost of 6.5 USD/employee-hours. All mentioned costswere estimated based on local values, considering a high rank to ensure an economic evaluation in themost extreme case (the case of Chile). Consequently, the total cost of the product for the base case wasestimated at USD 4,523,987, as shown in Table 3.
Table 2. Total capital investment for the base case.
ITEM [USD]
A TOTAL FIXED-CAPITAL INVESTMENT A1 + A2 4,613,613A1 TOTAL DIRECT PLANT COST 1 to 9 3,274,1771 Delivered main equipment (includes auxiliary equipment) 100% 1,063,0442 Purchased-equipment installation 39% 414,5873 Instrumentation and controls (installed) 26% 276,3924 Piping (installed) 31% 329,5445 Electrical (installed) 10% 106,3046 Buildings (including services) 29% 308,2837 Yard improvements 12% 127,5658 Service facilities (installed) 55% 584,6749 Land (purchase is required) 6% 63,783
A2 TOTAL INDIRECT PLANT COST 10 to 14 1,339,43610 Engineering and supervision 32% 340,17411 Construction expenses 34% 361,43512 Legal expenses 4% 42,52213 Contractor’s fee 19% 201,97814 Contingency 37% 393,326B WORKING CAPITAL 15 + 16 814,29215 About 15% of total capital investment 75% 707,98816 Safety and hazard analyses 10% 106,304
TOTAL CAPITAL INVESTMENT A + B 5,427,905
Table 3. Total annual product cost for the base case.
ITEM [USD]
C MANUFACTURING COST C1 + C2 + C3 3,821,529C1 DIRECT PRODUCTION COSTS 1 to 8 2,862,3191 Raw materials (calculated) - 1,124,8942 Operating labor (calculated) - 280,8003 Direct supervisory and clerical labor (17.5% of operating labor) 17.5% 49,1404 Utilities (calculated) - 936,9365 Maintenance and repairs (6% of fixed-capital investment) 6.0% 276,8176 Operating supplies (15% of cost for maintenance and repairs) 15.0% 41,5237 Laboratory charges (15% of operating labor) 15.0% 42,1208 Patents and royalties (4% of C1.1 to C1.7) 4.0% 110,089
C2 INDIRECT PRODUCTION COSTS 9 to 11 595,1569 Depreciation (10% of fixed-capital investment) 10.0% 461,36110 Local taxes (2.5% of fixed-capital investment) 2.5% 115,34011 Insurance (0.4% of fixed-capital investment) 0.4% 18,454C3 PLANT-OVERHEAD COSTS (60% of 2 + 3 + 5) 60.0% 364,054D GENERAL EXPENSES 14 to 16 702,45814 Administrative costs (15% of 2 + 3 + 5) 15.0% 91,01415 Distribution and selling costs (11% of manufacturing cost) 11.0% 420,36816 Research and development costs (5% of manufacturing cost) 5.0% 191,076
TOTAL PRODUCT COST C + D 4,523,987
Processes 2020, 8, 945 7 of 14
4. Discussion
It is important to mention that the costs reported in the bibliography are linked to differenttime periods, which may affect the comparisons with respect to the values estimated in this work.In this sense, the cost comparison described below considers this as a limitation of the present work.As established in Table 1, the cost estimate of the main equipment and auxiliary equipment reached anupdated value of USD 1,063,064, which is, in some cases, similar to the costs found in the literaturefor activated carbon production processes, using the physical route with steam as an activating agent.This value was estimated considering a plant size to process 6.6 ton/day of waste nutshells as rawmaterials. On the other hand, some of the most current costs are related to the estimate made byLima et al. [16] in 2008, which reported a total cost of main equipment of USD 1,776,000, to process20 tons/day of poultry litter. Subsequently, Stavropoulos et al. [17] in 2009 reported a total cost forprocess equipment of USD 1,154,416, for a production size of 4.5 ton/day considering various rawmaterials. More recently, Santadkha and Skolpap [19] in 2017 reported a total cost of main machineryand equipment of USD 1,301,429 for the generation of activated carbon from coconut shells and theregeneration of spent activated carbon obtained from the petrochemical industries, considering a plantcapacity of 12 ton/day and 10 ton/day, respectively.
As previously mentioned, Table 3 shows that the total manufacturing cost for the base case reacheda value of USD 3,821,529, and the total cost of the product reached a value of USD 4,523,987. If wedivide these values by the total annual activated carbon production quantity of 2,100,000 kg/year,we obtain a manufacturing cost of USD 1.82 per kg of product and USD 2.15 per kg of product,respectively. For the calculation of these values, a non-zero cost for the raw material of USD 1,124,894per year was considered. This makes a difference with other published studies that consider a marginalcost or do not consider costs in this important item, which can decrease the total cost of the productand lead to unrealistic conclusions about production costs, since any waste material used in industrialprocesses acquires economic value [17].
The values mentioned above can be compared with some costs reported in similar studies,being lower, for example, than the cost of the product obtained by Ng et al. [14] in 2003 who reached aproduction cost of activated carbon from pecan shells of USD 2.72 per kg and USD 2.89 per kg whenthe process was carried out by physical activation with steam and chemical activation with phosphoricacid, respectively, considering a minimum cost of USD 35,000 for raw materials. The costs obtained inthe present work compare favorably with the costs reported by Stavropoulos et al. [17] in 2009 whoreported production costs of USD 2.23 per kg, USD 2.49 per kg, and USD 2.18 per kg for the productionof physically activated carbon with steam, using worn tires, wood, and lignite as raw materials,respectively. It is important to highlight that these last values were obtained considering a zero costfor raw materials. On the other hand, in the same study, lower production costs of USD 1.92 per kg,USD 1.84 per kg, and USD 1.72 per kg were reported for the production of chemically activated carbonwith KOH, using worn tires, wood, and lignite as raw materials, respectively, considering a zero costfor raw materials. However, when a non-zero value was considered for raw materials, higher costswere calculated as USD 11.4 per kg, USD 6.39 per kg, and USD 5.38 per kg for the same precursors,respectively. In another study developed by Lima et al. [16] a lower production cost of USD 1.44 per kgwas reported for an activated carbon plant from poultry waste, using physical activation with steamand a subsequent washing step with hydrochloric acid, followed by a step rinse with water. However,the cost was obtained considering a cost for raw materials of USD 269,537 per year, including thetransportation of poultry waste, which is below the value considered here.
4.1. Economic Evaluation (10-Year Production Project)
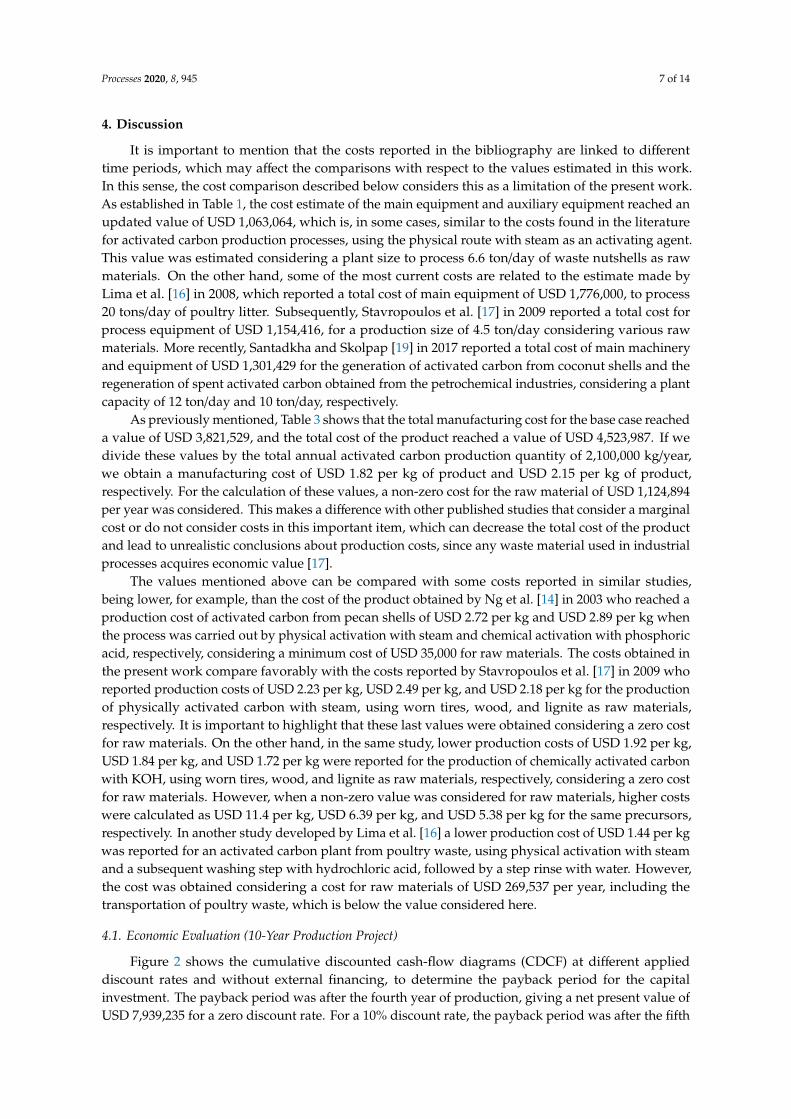
Figure 2 shows the cumulative discounted cash-flow diagrams (CDCF) at different applieddiscount rates and without external financing, to determine the payback period for the capitalinvestment. The payback period was after the fourth year of production, giving a net present value ofUSD 7,939,235 for a zero discount rate. For a 10% discount rate, the payback period was after the fifth
Processes 2020, 8, 945 8 of 14
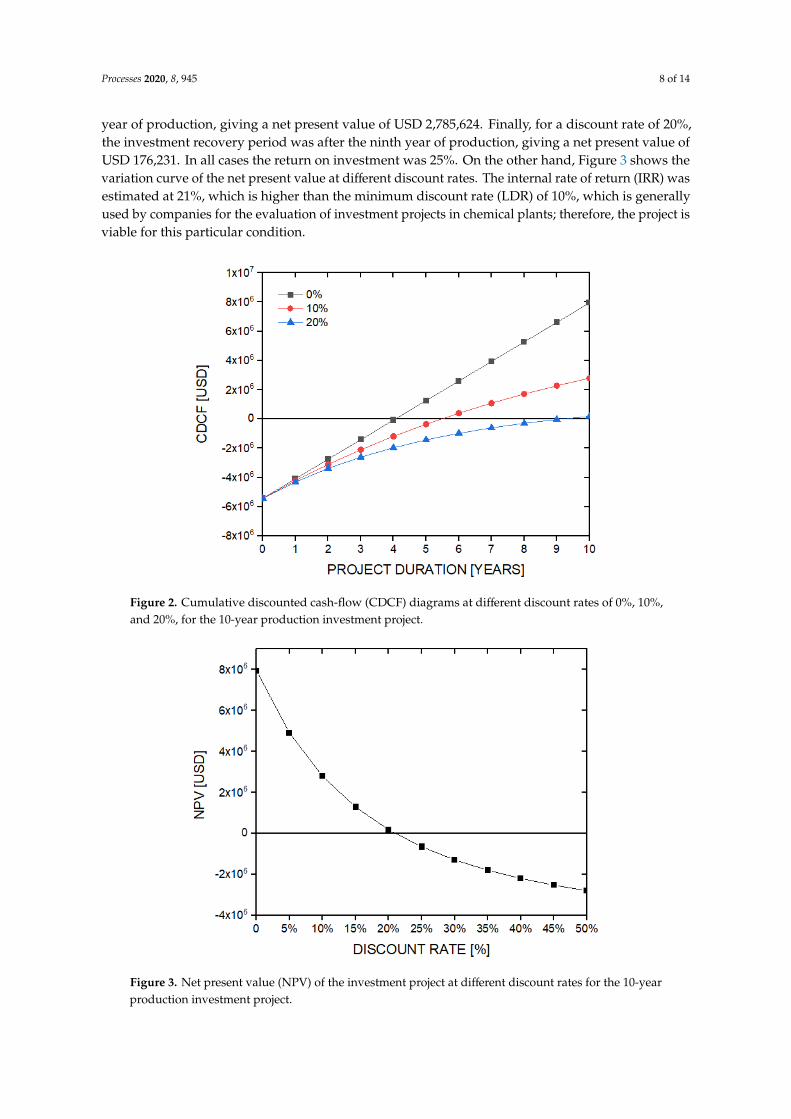
year of production, giving a net present value of USD 2,785,624. Finally, for a discount rate of 20%,the investment recovery period was after the ninth year of production, giving a net present value ofUSD 176,231. In all cases the return on investment was 25%. On the other hand, Figure 3 shows thevariation curve of the net present value at different discount rates. The internal rate of return (IRR) wasestimated at 21%, which is higher than the minimum discount rate (LDR) of 10%, which is generallyused by companies for the evaluation of investment projects in chemical plants; therefore, the project isviable for this particular condition.
Processes 2020, 8, x FOR PEER REVIEW 8 of 14
which is generally used by companies for the evaluation of investment projects in chemical plants; therefore, the project is viable for this particular condition.
Figure 2. Cumulative discounted cash-flow (CDCF) diagrams at different discount rates of 0%, 10%, and 20%, for the 10-year production investment project.
Figure 3. Net present value (NPV) of the investment project at different discount rates for the 10-year production investment project.
Figure 2. Cumulative discounted cash-flow (CDCF) diagrams at different discount rates of 0%, 10%,and 20%, for the 10-year production investment project.
Processes 2020, 8, x FOR PEER REVIEW 8 of 14
which is generally used by companies for the evaluation of investment projects in chemical plants; therefore, the project is viable for this particular condition.
Figure 2. Cumulative discounted cash-flow (CDCF) diagrams at different discount rates of 0%, 10%, and 20%, for the 10-year production investment project.
Figure 3. Net present value (NPV) of the investment project at different discount rates for the 10-year production investment project.
Figure 3. Net present value (NPV) of the investment project at different discount rates for the 10-yearproduction investment project.
Processes 2020, 8, 945 9 of 14
4.2. Sensitivity Analysis (Base Case of 10 Years of Production)
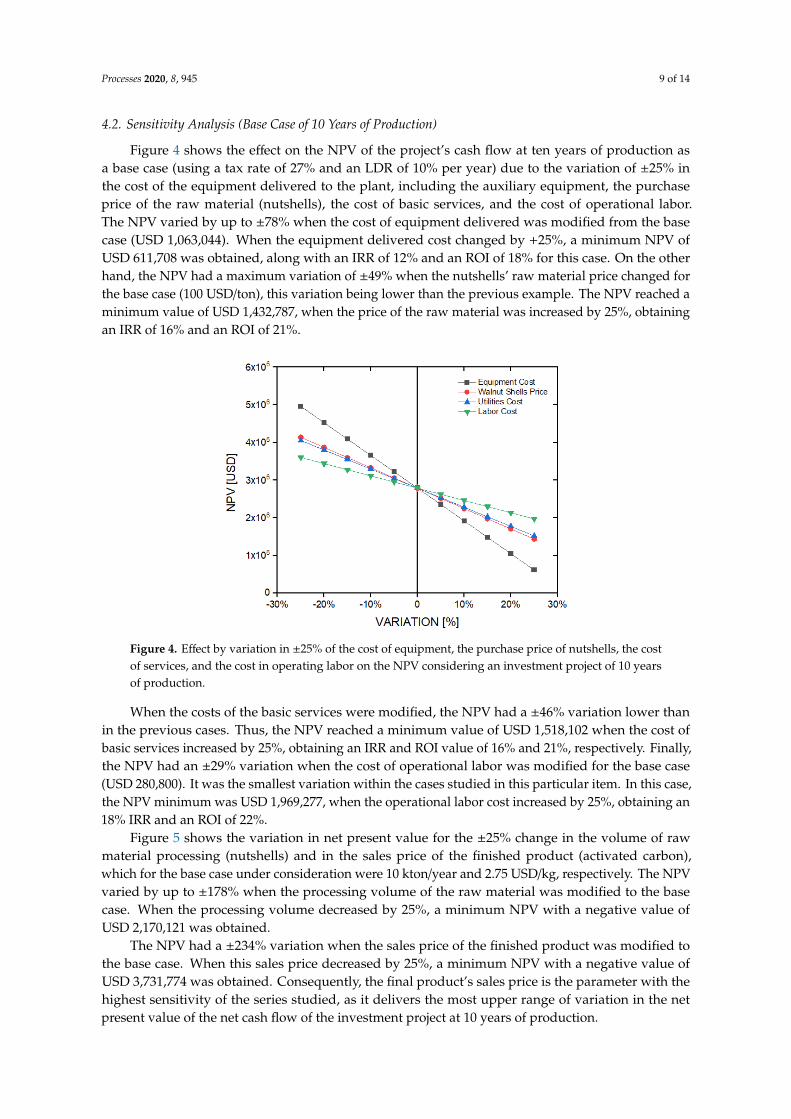
Figure 4 shows the effect on the NPV of the project’s cash flow at ten years of production asa base case (using a tax rate of 27% and an LDR of 10% per year) due to the variation of ±25% inthe cost of the equipment delivered to the plant, including the auxiliary equipment, the purchaseprice of the raw material (nutshells), the cost of basic services, and the cost of operational labor.The NPV varied by up to ±78% when the cost of equipment delivered was modified from the basecase (USD 1,063,044). When the equipment delivered cost changed by +25%, a minimum NPV ofUSD 611,708 was obtained, along with an IRR of 12% and an ROI of 18% for this case. On the otherhand, the NPV had a maximum variation of ±49% when the nutshells’ raw material price changed forthe base case (100 USD/ton), this variation being lower than the previous example. The NPV reached aminimum value of USD 1,432,787, when the price of the raw material was increased by 25%, obtainingan IRR of 16% and an ROI of 21%.
Processes 2020, 8, x FOR PEER REVIEW 9 of 14
4.2. Sensitivity Analysis (Base Case of 10 Years of Production)
Figure 4 shows the effect on the NPV of the project’s cash flow at ten years of production as a base case (using a tax rate of 27% and an LDR of 10% per year) due to the variation of ±25% in the cost of the equipment delivered to the plant, including the auxiliary equipment, the purchase price of the raw material (nutshells), the cost of basic services, and the cost of operational labor. The NPV varied by up to ±78% when the cost of equipment delivered was modified from the base case (USD 1,063,044). When the equipment delivered cost changed by +25%, a minimum NPV of USD 611,708 was obtained, along with an IRR of 12% and an ROI of 18% for this case. On the other hand, the NPV had a maximum variation of ±49% when the nutshells’ raw material price changed for the base case (100 USD/ton), this variation being lower than the previous example. The NPV reached a minimum value of USD 1,432,787, when the price of the raw material was increased by 25%, obtaining an IRR of 16% and an ROI of 21%.
When the costs of the basic services were modified, the NPV had a ±46% variation lower than in the previous cases. Thus, the NPV reached a minimum value of USD 1,518,102 when the cost of basic services increased by 25%, obtaining an IRR and ROI value of 16% and 21%, respectively. Finally, the NPV had an ±29% variation when the cost of operational labor was modified for the base case (USD 280,800). It was the smallest variation within the cases studied in this particular item. In this case, the NPV minimum was USD 1,969,277, when the operational labor cost increased by 25%, obtaining an 18% IRR and an ROI of 22%.
igure 4. Effect by variation in ±25% of the cost of equipment, the purchase price of nutshells, the cost of services, and the cost in operating labor on the NPV considering an investment project of 10 years of production.
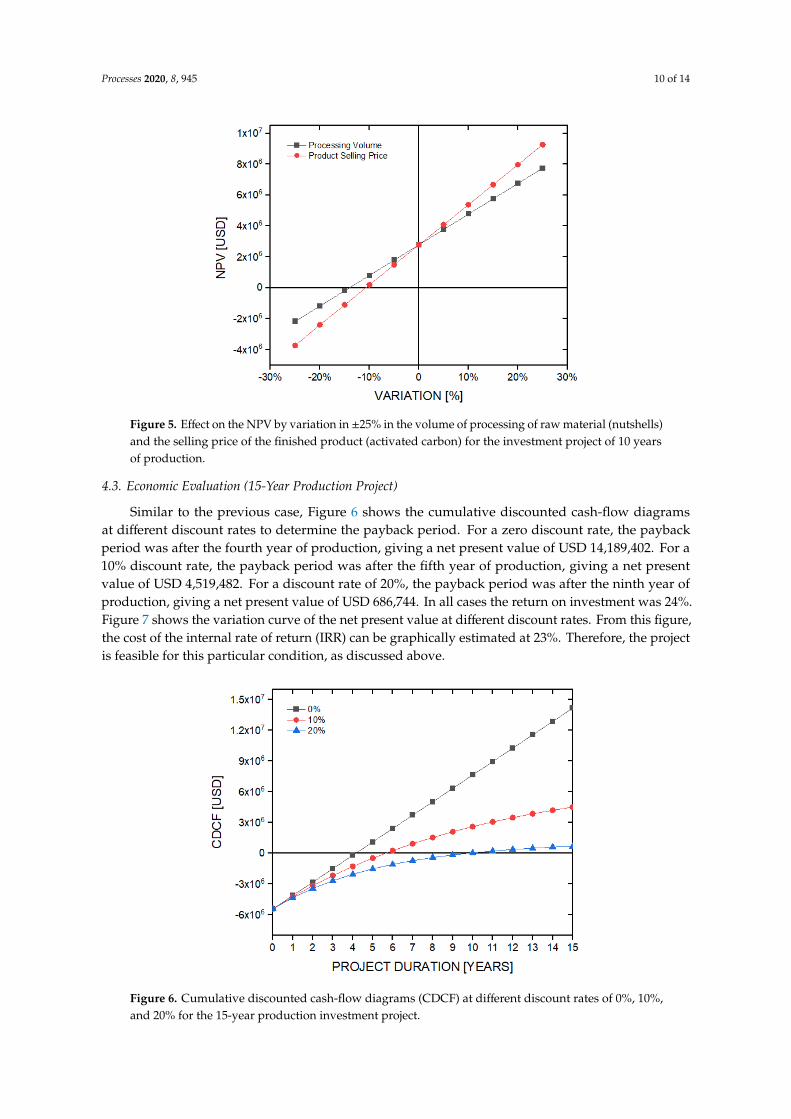
Figure 5 shows the variation in net present value for the ±25% change in the volume of raw material processing (nutshells) and in the sales price of the finished product (activated carbon), which for the base case under consideration were 10 kton/year and 2.75 USD/kg, respectively. The NPV varied by up to ±178% when the processing volume of the raw material was modified to the base case. When the processing volume decreased by 25%, a minimum NPV with a negative value of USD 2,170,121 was obtained.
The NPV had a ±234% variation when the sales price of the finished product was modified to the base case. When this sales price decreased by 25%, a minimum NPV with a negative value of USD 3,731,774 was obtained. Consequently, the final product’s sales price is the parameter with the highest
Figure 4. Effect by variation in ±25% of the cost of equipment, the purchase price of nutshells, the costof services, and the cost in operating labor on the NPV considering an investment project of 10 yearsof production.
When the costs of the basic services were modified, the NPV had a ±46% variation lower thanin the previous cases. Thus, the NPV reached a minimum value of USD 1,518,102 when the cost ofbasic services increased by 25%, obtaining an IRR and ROI value of 16% and 21%, respectively. Finally,the NPV had an ±29% variation when the cost of operational labor was modified for the base case(USD 280,800). It was the smallest variation within the cases studied in this particular item. In this case,the NPV minimum was USD 1,969,277, when the operational labor cost increased by 25%, obtaining an18% IRR and an ROI of 22%.
Figure 5 shows the variation in net present value for the ±25% change in the volume of rawmaterial processing (nutshells) and in the sales price of the finished product (activated carbon),which for the base case under consideration were 10 kton/year and 2.75 USD/kg, respectively. The NPVvaried by up to ±178% when the processing volume of the raw material was modified to the basecase. When the processing volume decreased by 25%, a minimum NPV with a negative value ofUSD 2,170,121 was obtained.
The NPV had a ±234% variation when the sales price of the finished product was modified tothe base case. When this sales price decreased by 25%, a minimum NPV with a negative value ofUSD 3,731,774 was obtained. Consequently, the final product’s sales price is the parameter with thehighest sensitivity of the series studied, as it delivers the most upper range of variation in the netpresent value of the net cash flow of the investment project at 10 years of production.
Processes 2020, 8, 945 10 of 14
Processes 2020, 8, x FOR PEER REVIEW 10 of 14
sensitivity of the series studied, as it delivers the most upper range of variation in the net present value of the net cash flow of the investment project at 10 years of production.
Figure 5. Effect on the NPV by variation in ±25% in the volume of processing of raw material (nutshells) and the selling price of the finished product (activated carbon) for the investment project of 10 years of production.
4.3. Economic Evaluation (15-Year Production Project)
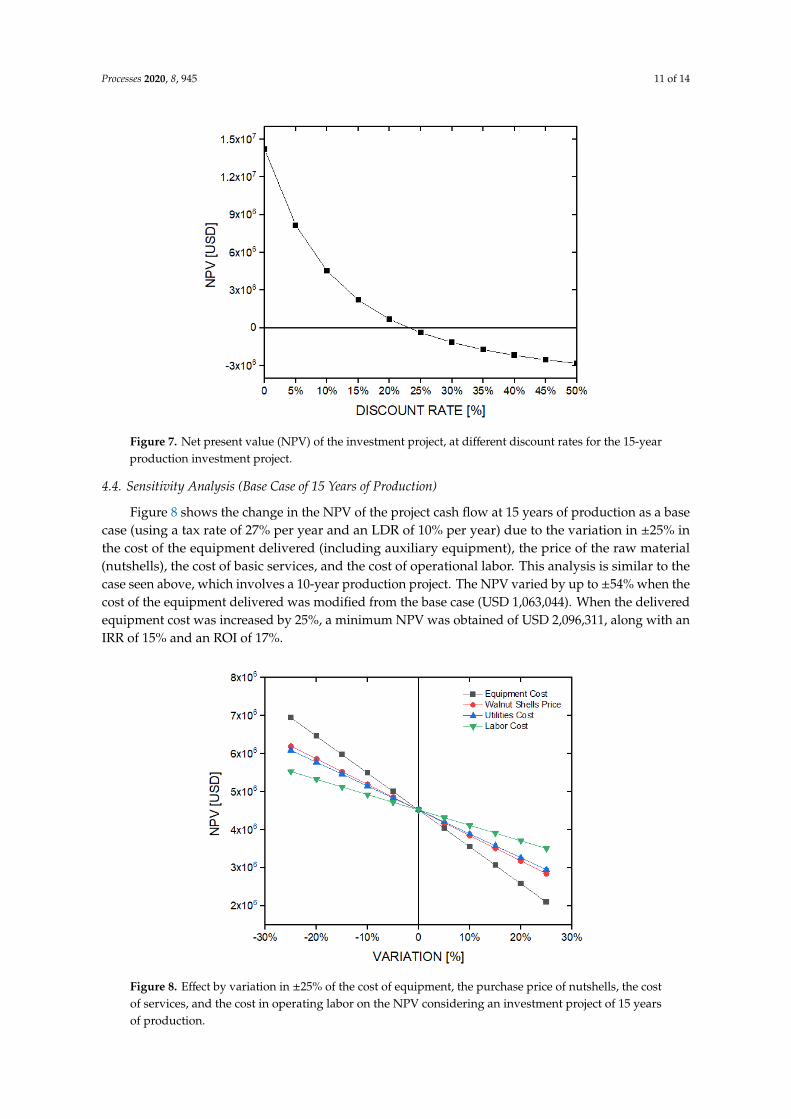
Similar to the previous case, Figure 6 shows the cumulative discounted cash-flow diagrams at different discount rates to determine the payback period. For a zero discount rate, the payback period was after the fourth year of production, giving a net present value of USD 14,189,402. For a 10% discount rate, the payback period was after the fifth year of production, giving a net present value of USD 4,519,482. For a discount rate of 20%, the payback period was after the ninth year of production, giving a net present value of USD 686,744. In all cases the return on investment was 24%. Figure 7 shows the variation curve of the net present value at different discount rates. From this figure, the cost of the internal rate of return (IRR) can be graphically estimated at 23%. Therefore, the project is feasible for this particular condition, as discussed above.
Figure 6. Cumulative discounted cash-flow diagrams (CDCF) at different discount rates of 0%, 10%, and 20% for the 15-year production investment project.
Figure 5. Effect on the NPV by variation in ±25% in the volume of processing of raw material (nutshells)and the selling price of the finished product (activated carbon) for the investment project of 10 yearsof production.
4.3. Economic Evaluation (15-Year Production Project)
Similar to the previous case, Figure 6 shows the cumulative discounted cash-flow diagramsat different discount rates to determine the payback period. For a zero discount rate, the paybackperiod was after the fourth year of production, giving a net present value of USD 14,189,402. For a10% discount rate, the payback period was after the fifth year of production, giving a net presentvalue of USD 4,519,482. For a discount rate of 20%, the payback period was after the ninth year ofproduction, giving a net present value of USD 686,744. In all cases the return on investment was 24%.Figure 7 shows the variation curve of the net present value at different discount rates. From this figure,the cost of the internal rate of return (IRR) can be graphically estimated at 23%. Therefore, the projectis feasible for this particular condition, as discussed above.
Processes 2020, 8, x FOR PEER REVIEW 10 of 14
sensitivity of the series studied, as it delivers the most upper range of variation in the net present value of the net cash flow of the investment project at 10 years of production.
Figure 5. Effect on the NPV by variation in ±25% in the volume of processing of raw material (nutshells) and the selling price of the finished product (activated carbon) for the investment project of 10 years of production.
4.3. Economic Evaluation (15-Year Production Project)
Similar to the previous case, Figure 6 shows the cumulative discounted cash-flow diagrams at different discount rates to determine the payback period. For a zero discount rate, the payback period was after the fourth year of production, giving a net present value of USD 14,189,402. For a 10% discount rate, the payback period was after the fifth year of production, giving a net present value of USD 4,519,482. For a discount rate of 20%, the payback period was after the ninth year of production, giving a net present value of USD 686,744. In all cases the return on investment was 24%. Figure 7 shows the variation curve of the net present value at different discount rates. From this figure, the cost of the internal rate of return (IRR) can be graphically estimated at 23%. Therefore, the project is feasible for this particular condition, as discussed above.
Figure 6. Cumulative discounted cash-flow diagrams (CDCF) at different discount rates of 0%, 10%, and 20% for the 15-year production investment project. Figure 6. Cumulative discounted cash-flow diagrams (CDCF) at different discount rates of 0%, 10%,and 20% for the 15-year production investment project.
Processes 2020, 8, 945 11 of 14
Processes 2020, 8, x FOR PEER REVIEW 11 of 14
Figure 7. Net present value (NPV) of the investment project, at different discount rates for the 15-year production investment project.
4.4. Sensitivity Analysis (Base Case of 15 Years of Production)
Figure 8 shows the change in the NPV of the project cash flow at 15 years of production as a base case (using a tax rate of 27% per year and an LDR of 10% per year) due to the variation in ±25% in the cost of the equipment delivered (including auxiliary equipment), the price of the raw material (nutshells), the cost of basic services, and the cost of operational labor. This analysis is similar to the case seen above, which involves a 10-year production project. The NPV varied by up to ±54% when the cost of the equipment delivered was modified from the base case (USD 1,063,044). When the delivered equipment cost was increased by 25%, a minimum NPV was obtained of USD 2,096,311, along with an IRR of 15% and an ROI of 17%.
Figure 8. Effect by variation in ±25% of the cost of equipment, the purchase price of nutshells, the cost of services, and the cost in operating labor on the NPV considering an investment project of 15 years of production.
Figure 7. Net present value (NPV) of the investment project, at different discount rates for the 15-yearproduction investment project.
4.4. Sensitivity Analysis (Base Case of 15 Years of Production)
Figure 8 shows the change in the NPV of the project cash flow at 15 years of production as a basecase (using a tax rate of 27% per year and an LDR of 10% per year) due to the variation in ±25% inthe cost of the equipment delivered (including auxiliary equipment), the price of the raw material(nutshells), the cost of basic services, and the cost of operational labor. This analysis is similar to thecase seen above, which involves a 10-year production project. The NPV varied by up to ±54% when thecost of the equipment delivered was modified from the base case (USD 1,063,044). When the deliveredequipment cost was increased by 25%, a minimum NPV was obtained of USD 2,096,311, along with anIRR of 15% and an ROI of 17%.
Processes 2020, 8, x FOR PEER REVIEW 11 of 14
Figure 7. Net present value (NPV) of the investment project, at different discount rates for the 15-year production investment project.
4.4. Sensitivity Analysis (Base Case of 15 Years of Production)
Figure 8 shows the change in the NPV of the project cash flow at 15 years of production as a base case (using a tax rate of 27% per year and an LDR of 10% per year) due to the variation in ±25% in the cost of the equipment delivered (including auxiliary equipment), the price of the raw material (nutshells), the cost of basic services, and the cost of operational labor. This analysis is similar to the case seen above, which involves a 10-year production project. The NPV varied by up to ±54% when the cost of the equipment delivered was modified from the base case (USD 1,063,044). When the delivered equipment cost was increased by 25%, a minimum NPV was obtained of USD 2,096,311, along with an IRR of 15% and an ROI of 17%.
Figure 8. Effect by variation in ±25% of the cost of equipment, the purchase price of nutshells, the cost of services, and the cost in operating labor on the NPV considering an investment project of 15 years of production.
Figure 8. Effect by variation in ±25% of the cost of equipment, the purchase price of nutshells, the costof services, and the cost in operating labor on the NPV considering an investment project of 15 yearsof production.
Processes 2020, 8, 945 12 of 14
The NPV had a maximum variation of ±37% when the price of the nutshells’ raw material wasmodified for the base case (100 USD/ton), this variation being lower than the previous case. When theprice of the raw material increased by 25%, a minimum NPV for this case of UDS 2,844,866 wasobtained, along with an IRR of 18% and an ROI of 20%. When the costs of the basic services weremodified, the NPV had a ±35% variation lower than in the previous cases. Thus, NPV reached aminimum value of USD 2,950,474 for a +25% variation in the cost of basic services, obtaining a 19%IRR and a 20% ROI. Finally, the NPV had a maximum difference of ±22% when the cost of operationallabor was modified to the base case (USD 280,800), the lowest variation being within the cases studiedin this particular item. In this case, a minimum NPV of USD 3,508,962, an IRR of 20%, and an ROI of22% were obtained if the operational labor cost is increased by 25%.
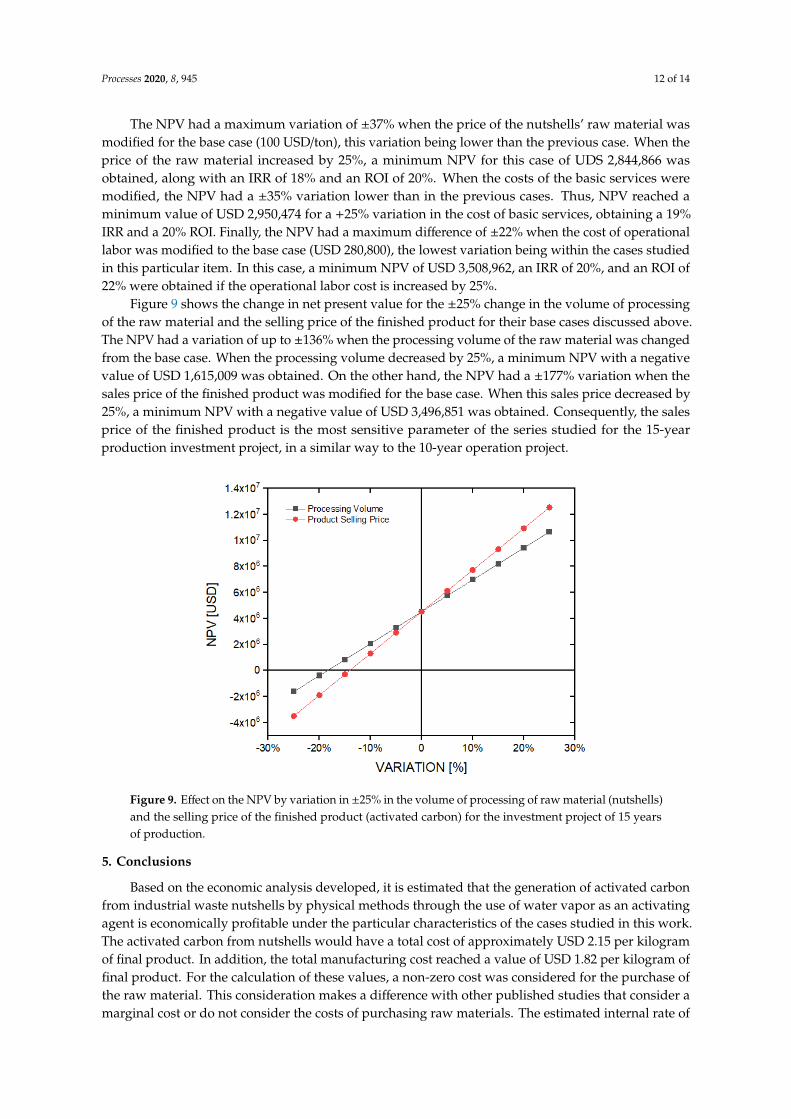
Figure 9 shows the change in net present value for the ±25% change in the volume of processingof the raw material and the selling price of the finished product for their base cases discussed above.The NPV had a variation of up to ±136% when the processing volume of the raw material was changedfrom the base case. When the processing volume decreased by 25%, a minimum NPV with a negativevalue of USD 1,615,009 was obtained. On the other hand, the NPV had a ±177% variation when thesales price of the finished product was modified for the base case. When this sales price decreased by25%, a minimum NPV with a negative value of USD 3,496,851 was obtained. Consequently, the salesprice of the finished product is the most sensitive parameter of the series studied for the 15-yearproduction investment project, in a similar way to the 10-year operation project.
Processes 2020, 8, x FOR PEER REVIEW 12 of 14
The NPV had a maximum variation of ±37% when the price of the nutshells’ raw material was modified for the base case (100 USD/ton), this variation being lower than the previous case. When the price of the raw material increased by 25%, a minimum NPV for this case of UDS 2,844,866 was obtained, along with an IRR of 18% and an ROI of 20%. When the costs of the basic services were modified, the NPV had a ±35% variation lower than in the previous cases. Thus, NPV reached a minimum value of USD 2,950,474 for a +25% variation in the cost of basic services, obtaining a 19% IRR and a 20% ROI. Finally, the NPV had a maximum difference of ±22% when the cost of operational labor was modified to the base case (USD 280,800), the lowest variation being within the cases studied in this particular item. In this case, a minimum NPV of USD 3,508,962, an IRR of 20%, and an ROI of 22% were obtained if the operational labor cost is increased by 25%.
Figure 9 shows the change in net present value for the ±25% change in the volume of processing of the raw material and the selling price of the finished product for their base cases discussed above. The NPV had a variation of up to ±136% when the processing volume of the raw material was changed from the base case. When the processing volume decreased by 25%, a minimum NPV with a negative value of USD 1,615,009 was obtained. On the other hand, the NPV had a ±177% variation when the sales price of the finished product was modified for the base case. When this sales price decreased by 25%, a minimum NPV with a negative value of USD 3,496,851 was obtained. Consequently, the sales price of the finished product is the most sensitive parameter of the series studied for the 15-year production investment project, in a similar way to the 10-year operation project.
Figure 9. Effect on the NPV by variation in ±25% in the volume of processing of raw material (nutshells) and the selling price of the finished product (activated carbon) for the investment project of 15 years of production.
5. Conclusions
Based on the economic analysis developed, it is estimated that the generation of activated carbon from industrial waste nutshells by physical methods through the use of water vapor as an activating agent is economically profitable under the particular characteristics of the cases studied in this work. The activated carbon from nutshells would have a total cost of approximately USD 2.15 per kilogram of final product. In addition, the total manufacturing cost reached a value of USD 1.82 per kilogram of final product. For the calculation of these values, a non-zero cost was considered for the purchase of the raw material. This consideration makes a difference with other published studies that consider a marginal cost or do not consider the costs of purchasing raw materials. The estimated internal rate of return was 21% and 23% for 10 and 15 years of operating time, respectively. Such results are higher
Figure 9. Effect on the NPV by variation in ±25% in the volume of processing of raw material (nutshells)and the selling price of the finished product (activated carbon) for the investment project of 15 yearsof production.
5. Conclusions
Based on the economic analysis developed, it is estimated that the generation of activated carbonfrom industrial waste nutshells by physical methods through the use of water vapor as an activatingagent is economically profitable under the particular characteristics of the cases studied in this work.The activated carbon from nutshells would have a total cost of approximately USD 2.15 per kilogramof final product. In addition, the total manufacturing cost reached a value of USD 1.82 per kilogram offinal product. For the calculation of these values, a non-zero cost was considered for the purchase ofthe raw material. This consideration makes a difference with other published studies that consider amarginal cost or do not consider the costs of purchasing raw materials. The estimated internal rate of
Processes 2020, 8, 945 13 of 14
return was 21% and 23% for 10 and 15 years of operating time, respectively. Such results are higherthan the typical minimum discount rate of 10%, which is generally used by companies to evaluateinvestment projects in chemical plants, thus making the investment project viable. It was estimatedthat for the projected case of 10 years of operation (tax rate of 27% and LDR of 10% per year), the returnon investment reaches 25%, and that for the planned case of 15 years of service (tax rate of 27% andLDR of 10% per year) the return on investment reaches 24%. In both cases, the payment period wasmade after the fifth year of production. The analysis of various sensitivity factors showed the limits toensure the profitability of the project. Among these factors, the selling price of the finished product isthe most sensitive parameter. On the other hand, one of the most important contributions of this workis to try to reduce the degree of uncertainty in the estimation of production costs and in the analysis ofprofitability indicators to provide a better approximation of the real costs involved in the economicanalysis of an activated carbon production plant and provide a greater amount of information forpotential industrial investors. In summary, this study can support the academic, research and financialanalysis of investment projects and provide valuable information to industrial investors who couldidentify a good return on their investment capital.
Author Contributions: Conceptualization, M.L. and J.S.; Methodology, M.L. and J.S.; Validation, All Authors;Formal Analysis, M.L. and J.S.; Investigation, M.L. and J.S.; Resources, M.L. and J.S.; Data Curation, All Authors;Writing—Original Draft Preparation, M.L., J.S. and S.C.; Writing—Review & Editing, All Authors; Visualization,All Authors; Supervision, M.L. and J.S.; Project Administration, M.L. and J.S. All authors have read and agreed tothe published version of the manuscript.
Funding: This research received no external funding.
Conflicts of Interest: The authors declare no conflict of interest.
References
1. Wong, S.; Ngadi, N.; Inuwa, I.; Hassan, O. Recent advances in applications of activated carbon from biowastefor wastewater treatment: A short review. J. Clean. Prod. 2018, 175, 361–375. [CrossRef]
2. Guillossou, R.; Le Roux, J.; Mailler, R.; Vulliet, E.; Morlay, C.; Nauleau, F.; Gasperi, J.; Rocher, V. Organicmicropollutants in a large wastewater treatment plant: What are the benefits of an advanced treatment byactivated carbon adsorption in comparison to conventional treatment? Chemosphere 2019, 218, 1050–1060.[CrossRef] [PubMed]
3. Azimi, A.; Azari, A.; Rezakazemi, M.; Ansarpour, M. Removal of Heavy Metals from Industrial Wastewaters:A Review. ChemBioEng Rev. 2017, 4, 37–59. [CrossRef]
4. Danish, M.; Tanweer, A. A review on utilization of wood biomass as a sustainable precursor for activatedcarbon production and application. Renew. Sust. Energ. Rev. 2018, 87, 1–21. [CrossRef]
5. Yahya, M.; Al-Qodah, Z.; Ngah, C. Agricultural bio-waste materials as potential sustainable precursors usedfor activated carbon production: A review. Renew. Sustain. Energy Rev. 2015, 46, 218–235. [CrossRef]
6. Cha, J.; Park, S.; Jung, S.-C.; Ryu, C.; Jeon, J.-K.; Shin, M.-C.; Park, Y.-K. Production and utilization of biochar:A review. J. Indust. Eng. Chem. 2016, 40, 1–15. [CrossRef]
7. Njoku, V.; Islam, M.; Asif, M.; Hameed, B. Preparation of mesoporous activated carbon from coconut frondfor the adsorption of carbofuran insecticide. J. Anal. Appl. Pyrol. 2014, 110, 172–180. [CrossRef]
8. Alvarez, J.; Lopez, G.; Amutio, M.; Bilbao, J.; Olazar, M. Upgrading the rice husk char obtained by flashpyrolysis for the production of amorphous silica and high quality activated carbon. Bioresour. Technol. 2014,170, 132–137. [CrossRef] [PubMed]
9. Adinata, D.; Wandaud, W.; Aroua, M. Preparation and characterization of activated carbon from palm shellby chemical activation with K2CO3. Bioresour. Technol. 2007, 98, 145–149. [CrossRef] [PubMed]
10. Wu, M.; Guo, Q.; Fu, G. Preparation and characteristics of medicinal activated carbon powders by CO2
activation of peanut shells. Powder Technol. 2013, 247, 188–196. [CrossRef]11. Kambarova, G.; Sarymsakov, S. Preparation of activated charcoal from walnut shells. Solid Fuel Chem. 2008,
42, 183–186. [CrossRef]
Processes 2020, 8, 945 14 of 14
12. Bae, W.; Kim, J.; Chung, J. Production of granular activated carbon from food-processing wastes (walnutshells and jujube seeds) and its adsorptive properties. J. Air Waste Manag. Assoc. 2014, 64, 879–886. [CrossRef][PubMed]
13. Nazem, M.; Zare, M.; Shirazian, S. Preparation and optimization of activated nano-carbon production usingphysical activation by water steam from agricultural wastes. RSC Adv. 2020, 10, 1463–1475. [CrossRef]
14. Ng, C.; Marshall, W.; Rao, R.; Bansode, R.; Losso, J. Activated carbon from pecan shell: Process descriptionand economic analysis. Ind. Crop. Prod. 2003, 17, 209–217. [CrossRef]
15. Choy, K.; Barford, J.; McKay, G. Production of activated carbon from bamboo scaffolding waste-processdesign, evaluation and sensitivity analysis. Chem. Eng. J. 2005, 109, 147–165. [CrossRef]
16. Lima, I.; McAloon, A.; Boateng, A. Activated carbon from broiler litter: Process description and cost ofproduction. Biomass Bioenergy 2008, 32, 568–572. [CrossRef]
17. Stavropoulos, G.; Zabaniotou, A. Minimizing activated carbons production cost. Fuel Process. Technol. 2009,90, 952–957. [CrossRef]
18. Vanreppelen, K.; Kuppens, T.; Thewys, T.; Carleer, R.; Yperman, J.; Schreurs, S. Activated carbon fromco-pyrolysis of particle board and melamine (urea) formaldehyde resin: A techno-economic evaluation.Chem. Eng. J. 2011, 172, 2–3. [CrossRef]
19. Santadkha, T.; Skolpap, W. Economic comparative evaluation of combination of activated carbon generationand spent activated carbon regeneration plants. JESTEC 2017, 12, 3329–3343.
20. Nandiyanto, A. Cost analysis and economic evaluation for the fabrication of activated carbon and silicaparticles from rice straw waste. JESTEC 2018, 13, 1523–1539.
21. Peter, M.; Timmerhaus, K. Plant Design and Economics for Chemical Engineers, 4th ed.; McGraw-Hill: New York,NY, USA, 1991.
22. Peter, M.; Timmerhaus, K. Plant Design and Economics for Chemical Engineers, 5th ed.; McGraw-Hill: New York,NY, USA, 2003.
23. Internal Revenue Service. Available online: http://homer.sii.cl. (accessed on 7 June 2020).
© 2020 by the authors. Licensee MDPI, Basel, Switzerland. This article is an open accessarticle distributed under the terms and conditions of the Creative Commons Attribution(CC BY) license (http://creativecommons.org/licenses/by/4.0/).