Embed Size (px)
Citation preview
Production of Physician Services
Central actors on the S side of the medical market
-Only 20% of health care expenditures are for physician services, but 70-80% are influenced by physicians' decisions
Physicians’ roles in producing medical care:
-Physician labor as an input in the production of physician services (one of the inputs in the production of health)
-Physicians as entrepreneurs operating the "physician-firm", producing the final output of physician services
The "Physician-Firm" How does theory of the firm apply to medical practice?
- Firms hire and control the use of resources
- Firms emerge when coordinating a production process is more efficient by "command and control" than by contractual relationships
-Physicians could use contractual relationships for everything except the direct patient encounter
(billing, scheduling, transcribing, lab tests, etc.)
-Horizontal integration (group practice) and/or vertical integration (multispecialty group practice, physician-owned laboratories, and PHOs)
Firms face 2 constraints:
- Available production technology
- D for their final product
(Note: Do not confuse the aggregate D curve for physician services with the D curve faced by an individual physician-firm)
-Physician-firm must pursue its objectives subject to these constraints
What does the physician-firm attempt to maximize?
- Standard theory of the firm profits
- Physician-firm’s objective function expanded to include leisure (physician's labor input determines leisure) and sometimes patients’ health ("altruistic" or "ethical" motivations)
-Including health helps model trade-offs between conflicting objectives (e.g., profits vs. health under capitation; willingness to take advantage of
superior information to increase profits)
-Controversial: Why should health be in the physicians' objective function? How can we measure the extent to which physicians value health?
Physician-firm’s final outputs are an
array of diagnosis and treatment services - Physician-firm decides which inputs to use in conjunction
with physician labor
- Considerable latitude in substituting one input for another (isoquants are not L-shaped):
-Less specialized inputs vs. more specialized inputs (e.g., NA vs. RN)
-Sterilize and re-use supplies vs. disposables
-Routine H & Ps or self-care counseling can be performed using lower-cost nurse labor rather
than the physician's own time
Some input substitutions are technically or legally constrained
-Only physicians have certain skills
-State practice acts forbid anyone other than a licensed physician to perform certain tasks even if the non-licensed individual has the necessary skills
-Importance of legal restrictions demonstrated by the greater use of NPPs in the military health care system, which is not subject to state practice acts, and in states with less restrictive practice acts
How much are physicians willing to
substitute other inputs for their own time? Physicians don’t delegate enough tasks (use too much of their own high-cost labor in tasks that could be performed by lower cost workers) (Reinhardt, 1972; Brown, 1988). Why?
1) If physicians' derive utility from patients' well-being and believe their own time is more
important than the time of less trained personnel, they might delegate fewer tasks than would appear optimal on purely economic grounds
How much are physicians willing to substitute
other inputs for their own time? (cont.) 2) Physicians have monopoly power, creating a "transfer
pricing" problem (what implicit price should the physician-firm assign to physician labor?). The monopoly price at which it could sell physician labor to the outside world or the hypothetical competitive price?
Optimal decision is choose the competitive price as the transfer price and build the monopoly power into the price charged for services. This results in choosing the resource cost-minimizing input mix (which will involve more physician labor than if the higher monopoly price were used) and the returns to owning a monopoly input can still be captured in the output price.
Optimal practice size depends on scale and scope economies
Sources of scale economies:
-Sharing overhead
-Ability to fully utilize specialized inputs
-Cross-coverage
Brown (1988) finds that group practices are 22% more productive than solo practices, primarily because of the ability to efficiently employ physician assistants
Sources of scope economies
-Ability to communicate with and obtain consultations from different specialties
-Ability to share equipment or facilities common to different services/specialties
-However, integration (w/other physicians and w/hospitals) may be motivated more by
increased bargaining power than cost efficiencies
How should performance be monitored and rewarded?
- Issue faced by any organization
- “Shirking" or excessive demands on shared resources (e.g., nursing, labs) are difficult to detect
- Particularly important when physicians within a group receive a flat salary (regardless how their group is paid)
-Salaried HMO physicians worked 93% of the hours of IPA physicians paid FFS, but only saw 80% of the patients
-Tying compensation to group's profits provides incentive to be cost conscious, but incentive weakens with group size. Detecting shirking is more difficult in larger organizations, so MCOs and physician-run group practices use financial and non-financial techniques to monitor and influence physician behavior.
Effect of financial incentives on resource use in HMOs
Hillman et al. (NEJM, 1989):
-HMOs w/salaried or capitated physicians achieved lower hospitalization rates than HMOs paying FFS
-For-profit and group-model HMOs had lower hospitalization rates
-Placing physician at financial risk (e.g., withholds) for “excess” utilization led to lower rates of OP visits and higher likelihood that the HMO broke
even or earned a profit
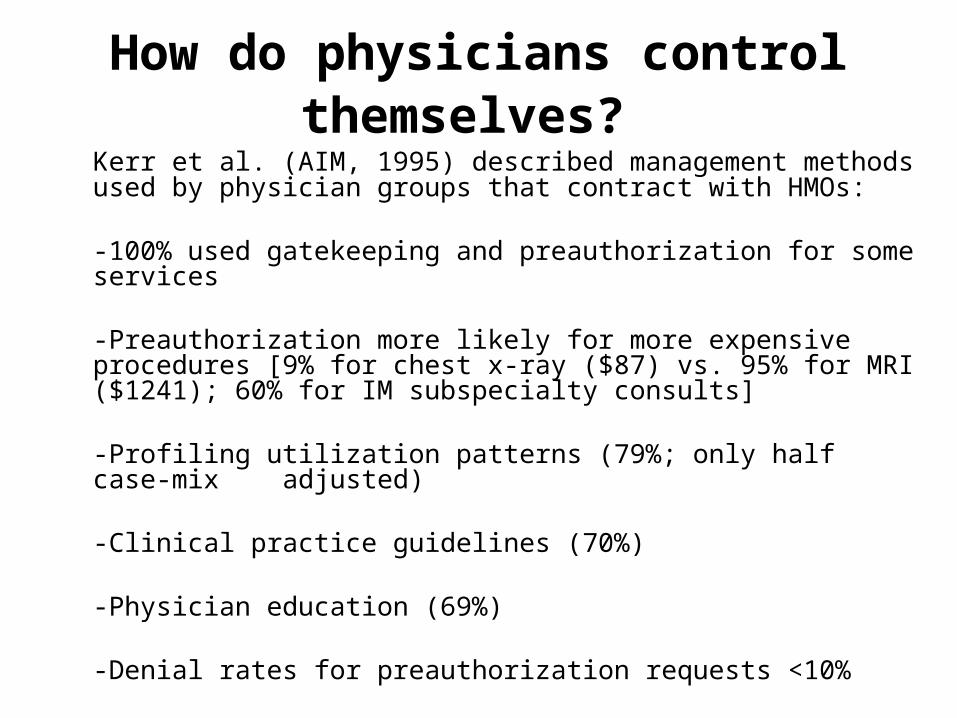
How do physicians control themselves?
Kerr et al. (AIM, 1995) described management methods used by physician groups that contract with HMOs:
-100% used gatekeeping and preauthorization for some services
-Preauthorization more likely for more expensive procedures [9% for chest x-ray ($87) vs. 95% for MRI ($1241); 60% for IM subspecialty consults]
-Profiling utilization patterns (79%; only half case-mix adjusted)
-Clinical practice guidelines (70%)
-Physician education (69%)
-Denial rates for preauthorization requests <10%
Fee-splitting and Self-referral
Another manifestation of poor consumer information is inappropriate referrals or tests
-PCP helps patient "shop" for a specialist, determining when referral is appropriate and to whom. If PCP
receives a "kickback" from the specialist, referral decisions are distorted. This is not all bad: fee-splitting can discourage PCPs from performing procedures that would be better performed by a specialist.
-Medical ethics has long opposed fee-splitting. Kickbacks are illegal in Medicare and Medicaid.
Physician’s information advantage creates a
conflict of interest in self-referral - Some physicians have a financial interest in lab,
surgery or diagnostic facilities
- Reports of shoddy lab work led to the Clinical Laboratory Improvement Act of 1988 (CLIA)
- Compliance costs caused some physicians to close their labs, creating a trade-off between convenience and centralization in larger, better-regulated facilities

Self-referral to physician-owned joint ventures
- GAO (1989): physician lab owners ordered more and more costly tests; led to restrictions on referrals of Medicare patients to labs in which they have an interest
- In 1992, AMA reaffirmed its stand against self-referral
- GAO (1993): similar results for diagnostic imaging; 38 of 39 free-standing MRI centers in Florida were physician joint ventures; led some states to restrict self-referral
- Scott and Mitchell (MC, 1994): labs owned by their referring physicians performed 50% more tests per patient and had higher markups and greater profitability
Physician Labor in the Long Run: The Returns
to Medical Education and Specialty Training Financial rewards are one important determinant of career choices:
-Decision to enter medical school and subsequent decisions about specialty training can be analyzed
as investments
-In exchange for tuition, lost earnings, and long hours, physicians earn more than they would have had they gone straight to work after their bachelor’s degree
-Time preferences: those with strong preferences for current consumption are unlikely to forego current
income for extra years of training
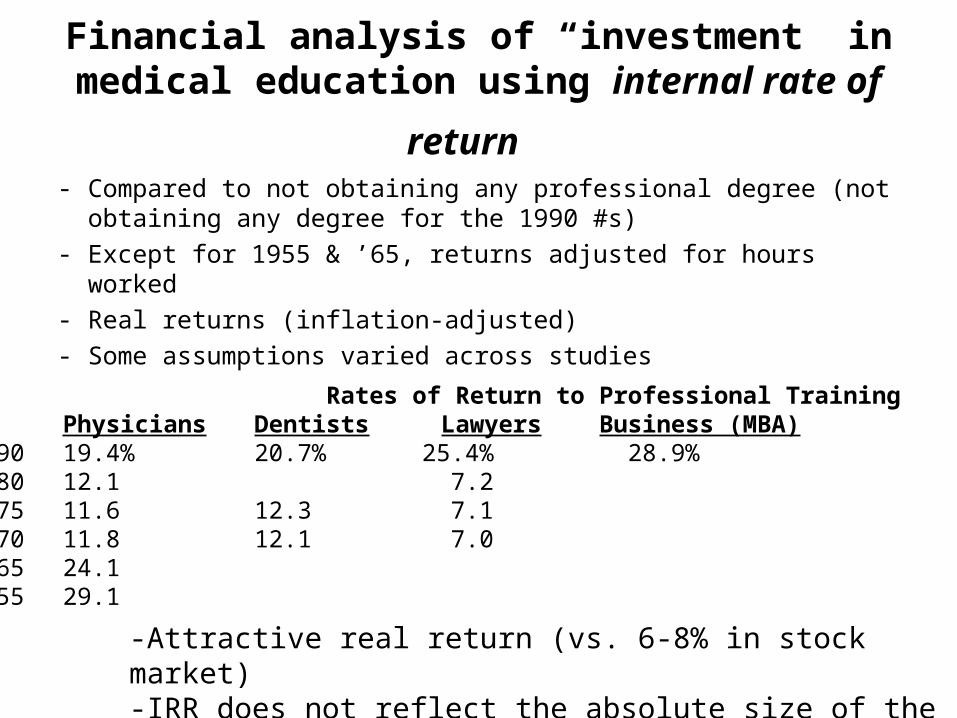
Financial analysis of “investment” in medical
education using internal rate of return - Compared to not obtaining any professional degree (not
obtaining any degree for the 1990 #s)
- Except for 1955 & ’65, returns adjusted for hours worked
- Real returns (inflation-adjusted)
- Some assumptions varied across studies Rates of Return to Professional Training
Physicians Dentists Lawyers Business (MBA)1990 19.4% 20.7% 25.4% 28.9%1980 12.1 7.21975 11.6 12.3 7.11970 11.8 12.1 7.01965 24.11955 29.1
-Attractive real return (vs. 6-8% in stock market) -IRR does not reflect the absolute size of the return
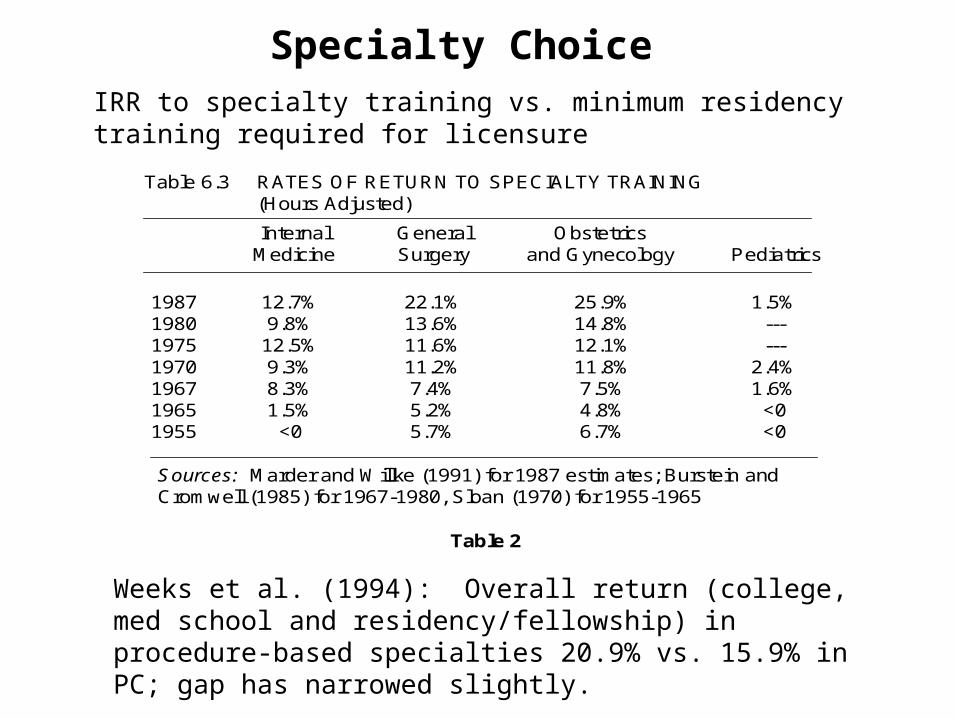
Specialty Choice IRR to specialty training vs. minimum residency training required for licensure
Table 6.3 RATES OF RETURN TO SPECIALTY TRAINING(Hours Adjusted)
InternalMedicine
GeneralSurgery
Obstetricsand Gynecology Pediatrics
1987198019751970196719651955
12.7%9.8%
12.5%9.3%8.3%1.5%
<0
22.1%13.6%11.6%11.2%7.4%5.2%5.7%
25.9%14.8%12.1%11.8%7.5%4.8%6.7%
1.5%------
2.4%1.6%
<0<0
Sources: Marder and Willke (1991) for 1987 estimates; Burstein andCromwell (1985) for 1967-1980, Sloan (1970) for 1955-1965
Table 2
Weeks et al. (1994): Overall return (college, med school and residency/fellowship) in procedure-based specialties 20.9% vs. 15.9% in PC; gap has narrowed slightly.
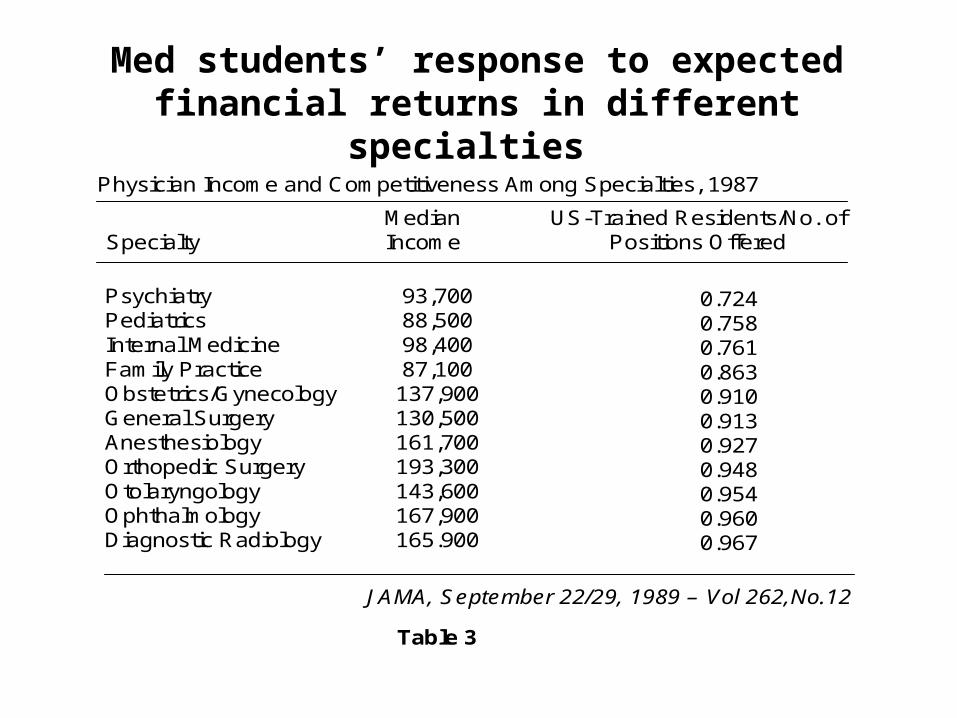
Med students’ response to expected financial returns in different specialties
Physician Income and Competitiveness Among Specialties, 1987
SpecialtyMedianIncome
US-Trained Residents/No. ofPositions Offered
PsychiatryPediatricsInternal MedicineFamily PracticeObstetrics/GynecologyGeneral SurgeryAnesthesiologyOrthopedic SurgeryOtolaryngologyOphthalmologyDiagnostic Radiology
93,70088,50098,40087,100
137,900130,500161,700193,300143,600167,900165.900
0.7240.7580.7610.8630.9100.9130.9270.9480.9540.9600.967
JAMA, September 22/29, 1989 – Vol 262,No.12
Table 3
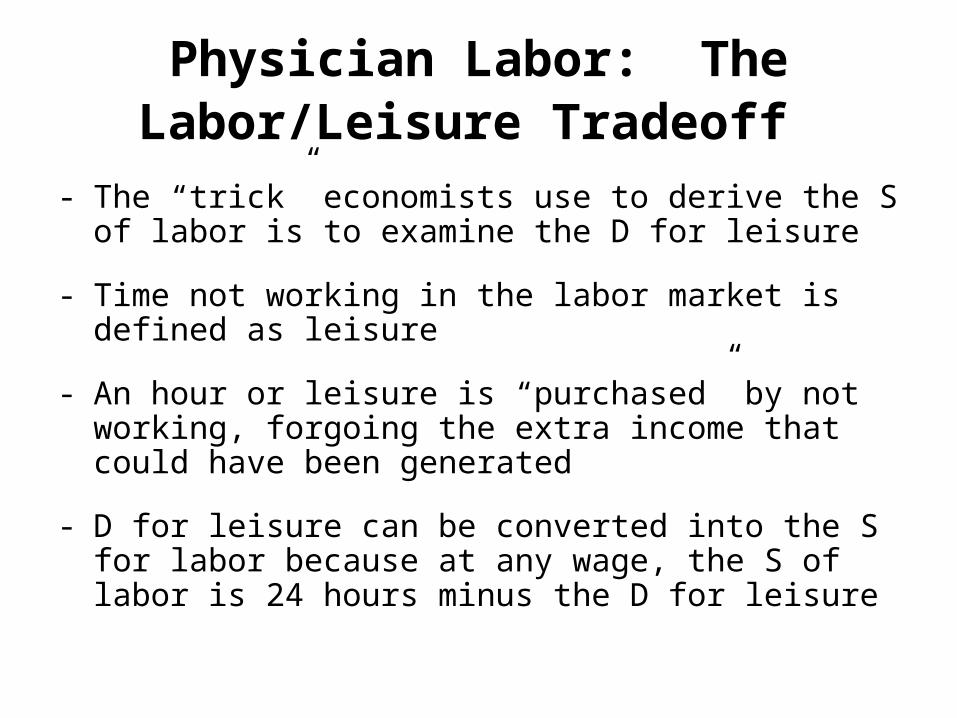
Physician Labor: The Labor/Leisure Tradeoff
- The “trick” economists use to derive the S of labor is to examine the D for leisure
- Time not working in the labor market is defined as leisure
- An hour or leisure is “purchased” by not working, forgoing the extra income that could have been generated
- D for leisure can be converted into the S for labor because at any wage, the S of labor is 24 hours minus the D for leisure
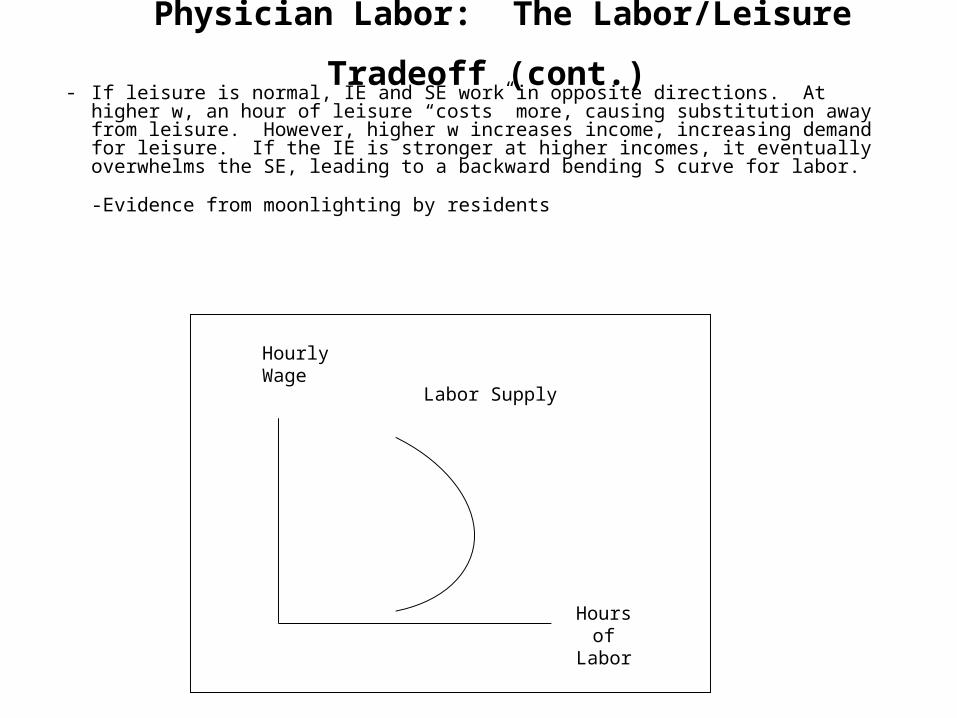
Physician Labor: The Labor/Leisure Tradeoff (cont.) - If leisure is normal, IE and SE work in opposite directions. At higher w, an hour of
leisure “costs” more, causing substitution away from leisure. However, higher w increases income, increasing demand for leisure. If the IE is stronger at higher incomes, it eventually overwhelms the SE, leading to a backward bending S curve for labor.
-Evidence from moonlighting by residents
Labor Supply
Hourly Wage
Hours of Labor