Embed Size (px)
Citation preview
New York State Oil, Gas and Mineral Resources, 2003
NYS DEC - Division of Mineral Resources 15 Twentieth Annual Report
Table 4
Top Ten Gas and Oil Producing Companies, 2003
Company
Gas (mcf)
Company
Oil (bbl)
Fortuna Energy, Inc. 22,126,992 Richardson Petroleum Corp. 23,991
Columbia Natural Resources 3,218,738 McCracken, Carl A. III 11,122
Great Lakes Energy Partners 2,783,259 English, Lawrence E. Jr. 10,841
Nornew, Inc. 918,877 East Resources, Inc. 10,592
Seneca Resources Corp. 659,128 R & C Oil Co. 9,614
Kastle Resources Enterprises 566,032 Synergy Oil and Gas, Inc. 6,905
United States Gypsum Co. 545,986 REI-NY, Inc. 6,136
Stedman Energy, Inc. 519,570 Woods Oil Company, Inc. 5,955
National Fuel Gas Supply 419,152 Otis Eastern Services, Inc. 4,965
Lenape Resources, Inc. 405,207 Plants and Goodwin, Inc. 3,882
PRODUCTION OF OIL & GAS
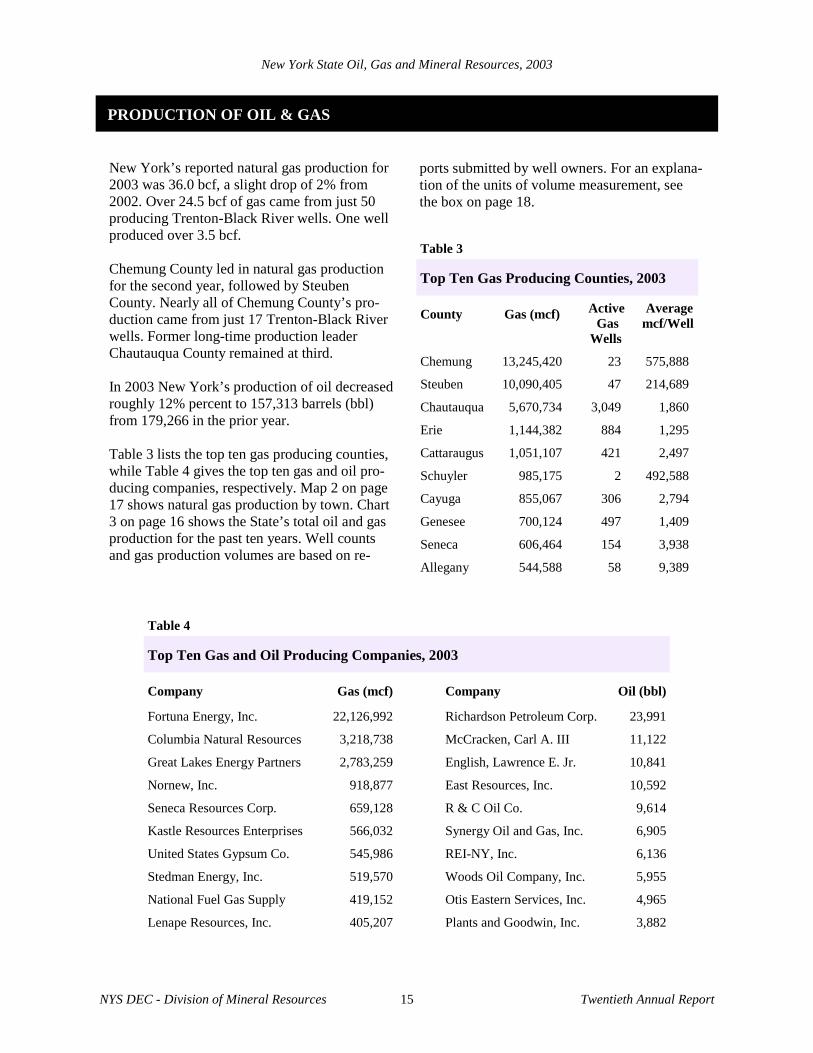
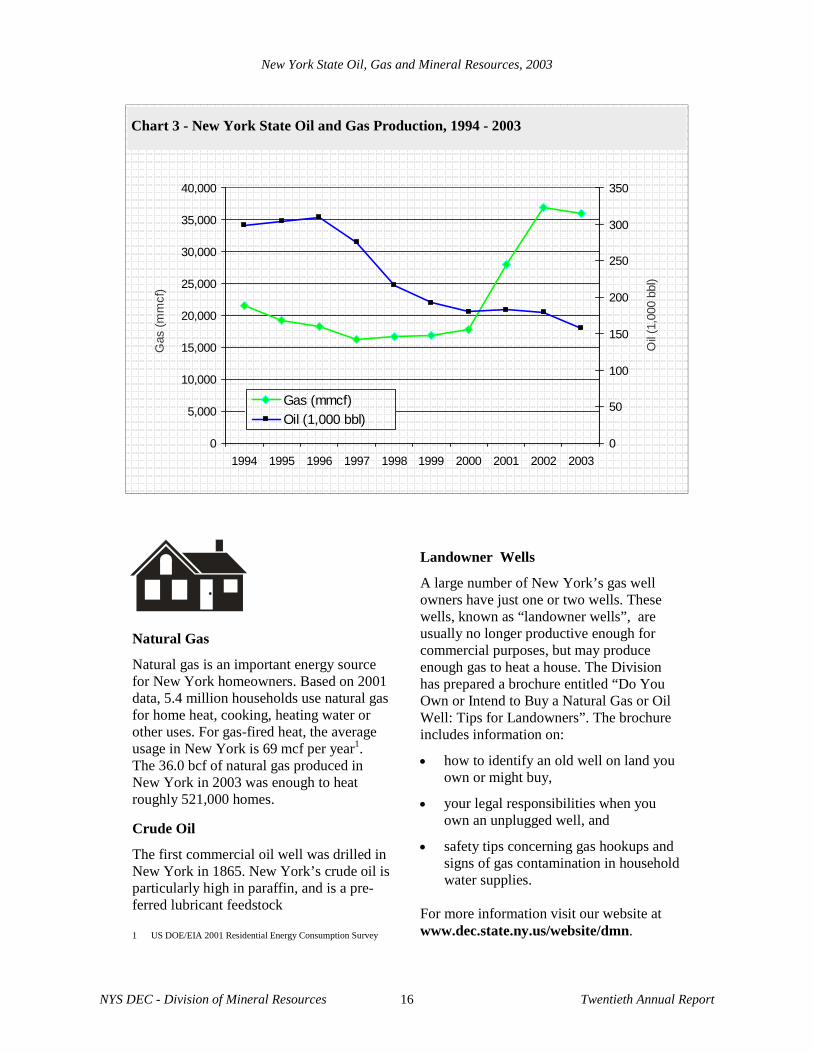
New York’s reported natural gas production for 2003 was 36.0 bcf, a slight drop of 2% from 2002. Over 24.5 bcf of gas came from just 50 producing Trenton-Black River wells. One well produced over 3.5 bcf. Chemung County led in natural gas production for the second year, followed by Steuben County. Nearly all of Chemung County’s pro-duction came from just 17 Trenton-Black River wells. Former long-time production leader Chautauqua County remained at third. In 2003 New York’s production of oil decreased roughly 12% percent to 157,313 barrels (bbl) from 179,266 in the prior year. Table 3 lists the top ten gas producing counties, while Table 4 gives the top ten gas and oil pro-ducing companies, respectively. Map 2 on page 17 shows natural gas production by town. Chart 3 on page 16 shows the State’s total oil and gas production for the past ten years. Well counts and gas production volumes are based on re-
ports submitted by well owners. For an explana-tion of the units of volume measurement, see the box on page 18.
Table 3
Top Ten Gas Producing Counties, 2003
County
Gas (mcf) Active Gas Wells
Average mcf/Well
Chemung 13,245,420 23 575,888
Steuben 10,090,405 47 214,689
Chautauqua 5,670,734 3,049 1,860
Erie 1,144,382 884 1,295
Cattaraugus 1,051,107 421 2,497
Schuyler 985,175 2 492,588
Cayuga 855,067 306 2,794
Genesee 700,124 497 1,409
Seneca 606,464 154 3,938
Allegany 544,588 58 9,389
Landowner Wells
A large number of New York’s gas well owners have just one or two wells. These wells, known as “landowner wells”, are usually no longer productive enough for commercial purposes, but may produce enough gas to heat a house. The Division has prepared a brochure entitled “Do You Own or Intend to Buy a Natural Gas or Oil Well: Tips for Landowners”. The brochure includes information on:
• how to identify an old well on land you own or might buy,
• your legal responsibilities when you own an unplugged well, and
• safety tips concerning gas hookups and signs of gas contamination in household water supplies.
For more information visit our website at www.dec.state.ny.us/website/dmn.
Natural Gas
Natural gas is an important energy source for New York homeowners. Based on 2001 data, 5.4 million households use natural gas for home heat, cooking, heating water or other uses. For gas-fired heat, the average usage in New York is 69 mcf per year1. The 36.0 bcf of natural gas produced in New York in 2003 was enough to heat roughly 521,000 homes. Crude Oil
The first commercial oil well was drilled in New York in 1865. New York’s crude oil is particularly high in paraffin, and is a pre-ferred lubricant feedstock 1 US DOE/EIA 2001 Residential Energy Consumption Survey
0
5,000
10,000
15,000
20,000
25,000
30,000
35,000
40,000
1994 1995 1996 1997 1998 1999 2000 2001 2002 2003
Gas
(mm
cf)
0
50
100
150
200
250
300
350
Oil (
1,00
0 bb
l)
Gas (mmcf) Oil (1,000 bbl)
Chart 3 - New York State Oil and Gas Production, 1994 - 2003
New York State Oil, Gas and Mineral Resources, 2003
NYS DEC - Division of Mineral Resources 16 Twentieth Annual Report
Map 2 - New York State Gas Production by Town, 2003
NYS D
EC D
ivision of Mineral Resources
Twentieth Annual Report
17
LegendGas
1 - 100,000
100,001 - 300,000
300,001 - 500,000
500,001 - 6,720,675
New
York State Oil, G
as and Mineral Resources, 2003
New York State Oil, Gas and Mineral Resources, 2003
NYS DEC - Division of Mineral Resources 18 Twentieth Annual Report
Royalties to Landowners The majority of landowners with producing oil and gas leases receive a royalty. Based on an average royalty of one-eighth of the production value, landowners in New York received roughly $26.6 million in royalties from 2003 oil and gas production. Tax Revenues to Local Governments Communities in oil and gas producing areas also benefit from the industry’s activity. DEC estimates that real property taxes on 2003 natural gas and oil production were roughly $6.4 million (gas $6.25 million and oil $139,000). To dampen the impact of fluctuating oil and gas prices, local governments assess their taxes each year based on a unit of production value deter-mined by the NY State Division of Equalization and Assessment using a five-year average.
Market Value The total market value of New York’s oil and gas production increased from $116 million in 2002 to over $212 million in 2003. Much of this increase was due to the near doubling of the market value of the State’s gas in spite of a slight decrease in the gas production level to 36.0 bcf. The market value of the reported 157,313 barrels of oil produced was roughly $4.6 million, up 2% from 2002. State Lease Oil and Gas Prices The average wellhead natural gas price of $5.78 per mcf in 2003 was up over 90% from the $3.03 price of 2002. The average price of oil in 2003 of $29.47 per bbl was up over 18% from $24.95 in 2002. These average prices were obtained from royalty payments made to the State for leases on State lands.
MARKET VALUE AND ECONONMIC BENEFITS
Throughout this report, you’ll find the following units of volume measurement used for production. Natural Gas
mcf thousand cubic feet
mmcf million cubic feet
bcf billion cubic feet Crude Oil
bbl barrel of oil (42 gallons)
Volume Measurements Used in Report
New York State Oil, Gas and Mineral Resources, 2003
NYS DEC - Division of Mineral Resources 19 Twentieth Annual Report
PERMIT FEES AND FINES
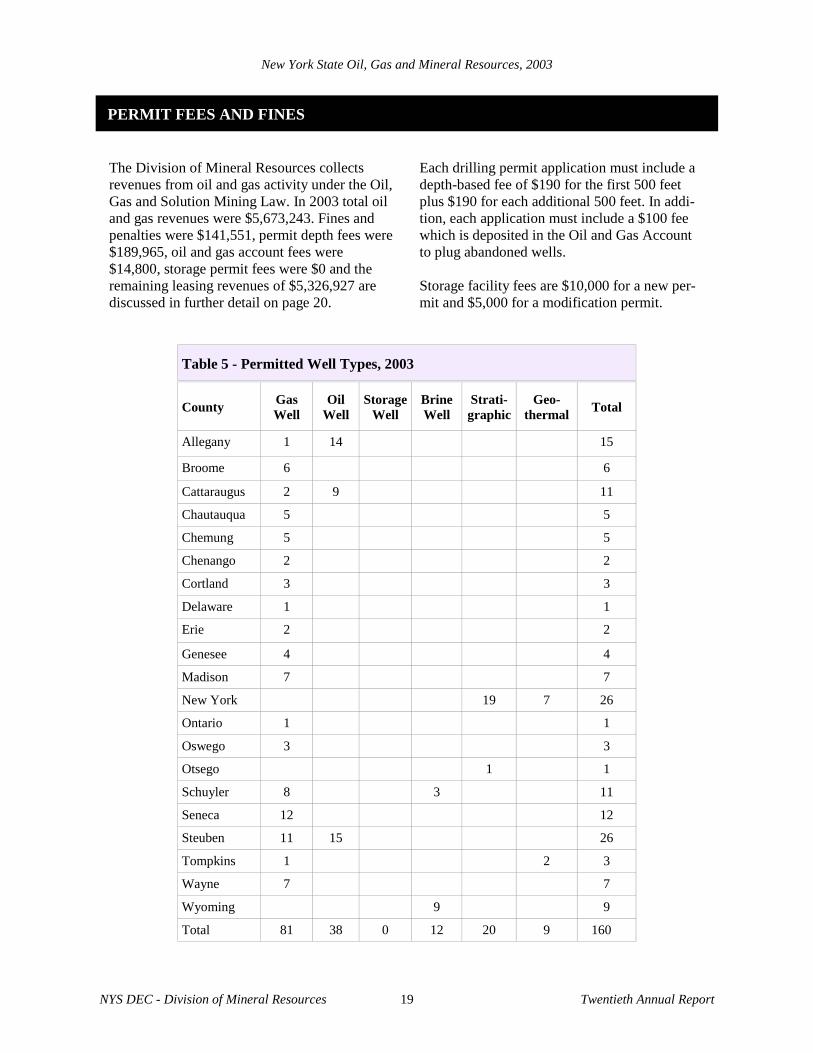
The Division of Mineral Resources collects revenues from oil and gas activity under the Oil, Gas and Solution Mining Law. In 2003 total oil and gas revenues were $5,673,243. Fines and penalties were $141,551, permit depth fees were $189,965, oil and gas account fees were $14,800, storage permit fees were $0 and the remaining leasing revenues of $5,326,927 are discussed in further detail on page 20.
Each drilling permit application must include a depth-based fee of $190 for the first 500 feet plus $190 for each additional 500 feet. In addi-tion, each application must include a $100 fee which is deposited in the Oil and Gas Account to plug abandoned wells. Storage facility fees are $10,000 for a new per-mit and $5,000 for a modification permit.
County Gas Well
Oil Well
Storage Well
Brine Well
Strati-graphic
Geo- thermal
Total
Allegany 1 14 15
Broome 6 6
Cattaraugus 2 9 11
Chautauqua 5 5
Chemung 5 5
Chenango 2 2
Cortland 3 3
Delaware 1 1
Erie 2 2
Genesee 4 4
Madison 7 7
New York 19 7 26
Ontario 1 1
Oswego 3 3
Otsego 1 1
Schuyler 8 3 11
Seneca 12 12
Steuben 11 15 26
Tompkins 1 2 3
Wayne 7 7
Wyoming 9 9
Total 81 38 0 12 20 9 160
Table 5 - Permitted Well Types, 2003
New York State Oil, Gas and Mineral Resources, 2003
NYS DEC - Division of Mineral Resources 20 Twentieth Annual Report
STATE LAND LEASING
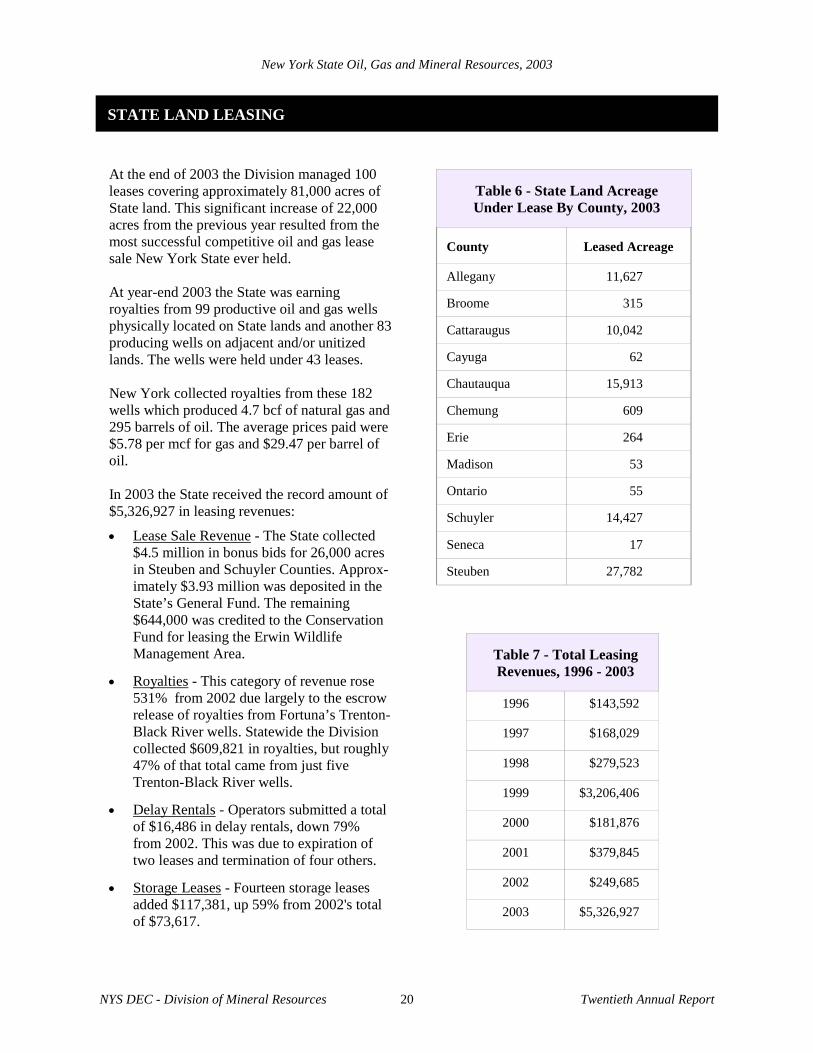
At the end of 2003 the Division managed 100 leases covering approximately 81,000 acres of State land. This significant increase of 22,000 acres from the previous year resulted from the most successful competitive oil and gas lease sale New York State ever held. At year-end 2003 the State was earning royalties from 99 productive oil and gas wells physically located on State lands and another 83 producing wells on adjacent and/or unitized lands. The wells were held under 43 leases. New York collected royalties from these 182 wells which produced 4.7 bcf of natural gas and 295 barrels of oil. The average prices paid were $5.78 per mcf for gas and $29.47 per barrel of oil. In 2003 the State received the record amount of $5,326,927 in leasing revenues:
• Lease Sale Revenue - The State collected $4.5 million in bonus bids for 26,000 acres in Steuben and Schuyler Counties. Approx-imately $3.93 million was deposited in the State’s General Fund. The remaining $644,000 was credited to the Conservation Fund for leasing the Erwin Wildlife Management Area.
• Royalties - This category of revenue rose 531% from 2002 due largely to the escrow release of royalties from Fortuna’s Trenton-Black River wells. Statewide the Division collected $609,821 in royalties, but roughly 47% of that total came from just five Trenton-Black River wells.
• Delay Rentals - Operators submitted a total of $16,486 in delay rentals, down 79% from 2002. This was due to expiration of two leases and termination of four others.
• Storage Leases - Fourteen storage leases added $117,381, up 59% from 2002's total of $73,617.
Table 6 - State Land Acreage Under Lease By County, 2003
County
Leased Acreage
Allegany 11,627
Broome 315
Cattaraugus 10,042
Cayuga 62
Chautauqua 15,913
Chemung 609
Erie 264
Madison 53
Ontario 55
Schuyler 14,427
Seneca 17
Steuben 27,782
Table 7 - Total Leasing Revenues, 1996 - 2003
1996 $143,592
1997 $168,029
1998 $279,523
1999 $3,206,406
2000 $181,876
2001 $379,845
2002 $249,685
2003 $5,326,927
New York State Oil, Gas and Mineral Resources, 2003
NYS DEC - Division of Mineral Resources 21 Twentieth Annual Report
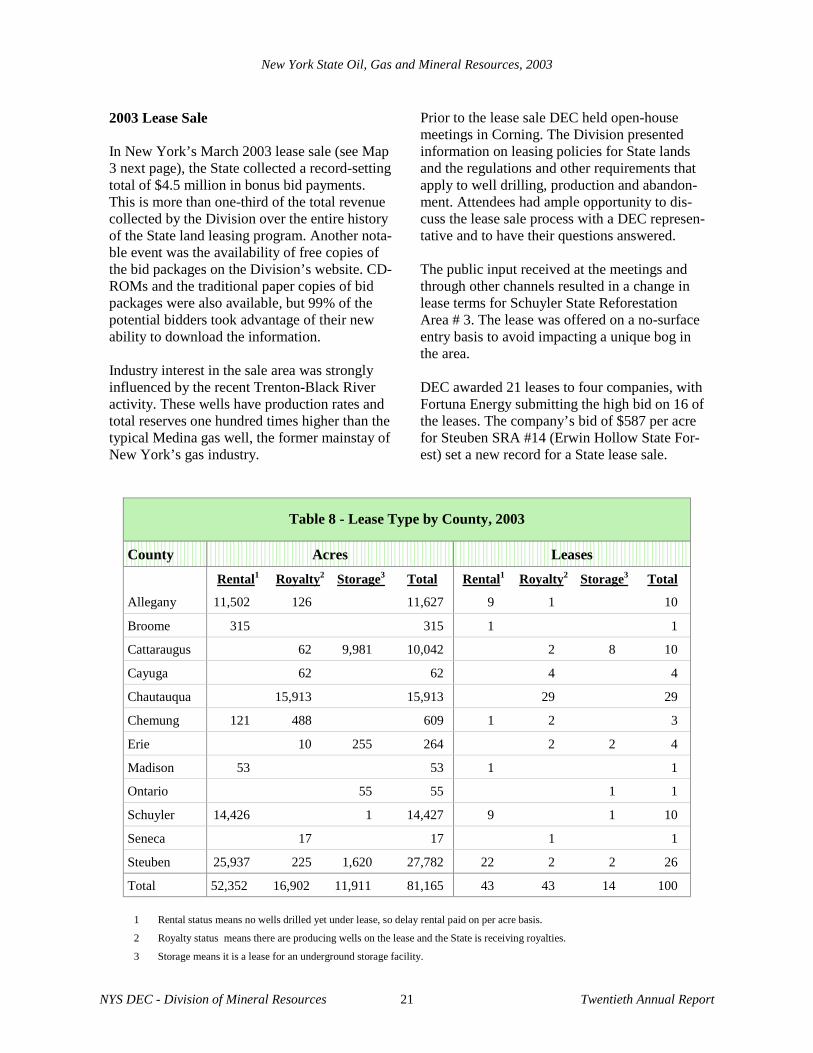
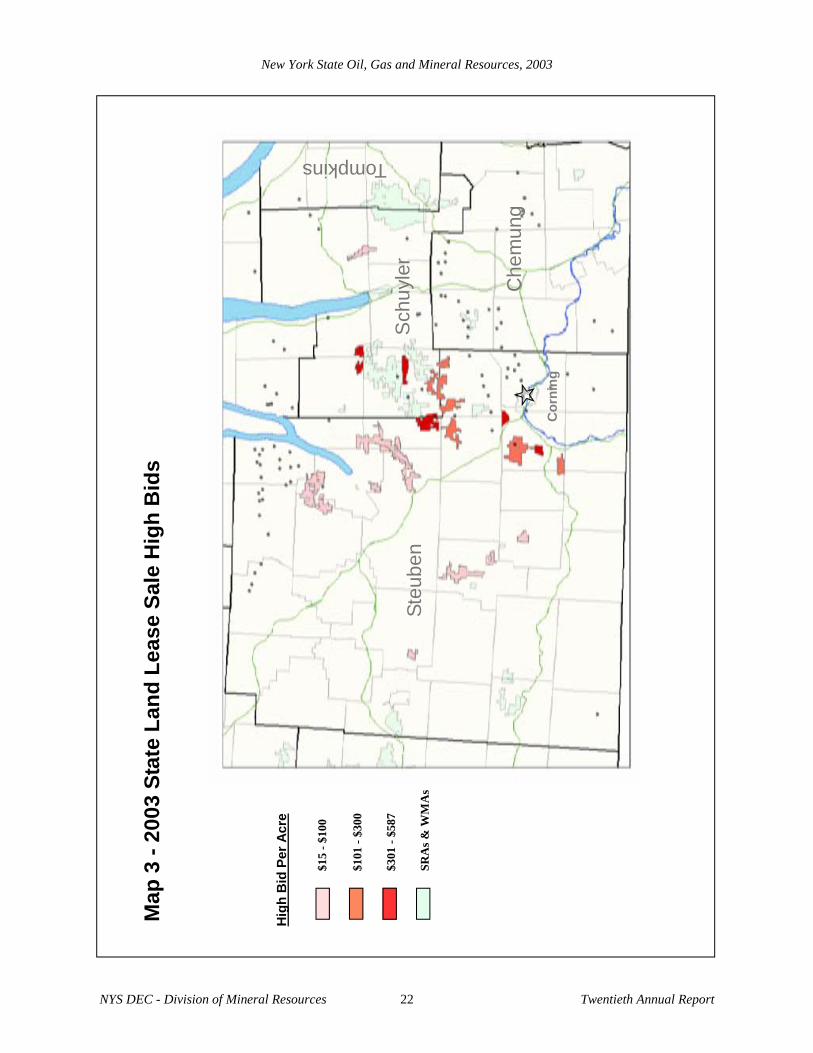
2003 Lease Sale In New York’s March 2003 lease sale (see Map 3 next page), the State collected a record-setting total of $4.5 million in bonus bid payments. This is more than one-third of the total revenue collected by the Division over the entire history of the State land leasing program. Another nota-ble event was the availability of free copies of the bid packages on the Division’s website. CD-ROMs and the traditional paper copies of bid packages were also available, but 99% of the potential bidders took advantage of their new ability to download the information. Industry interest in the sale area was strongly influenced by the recent Trenton-Black River activity. These wells have production rates and total reserves one hundred times higher than the typical Medina gas well, the former mainstay of New York’s gas industry.
Prior to the lease sale DEC held open-house meetings in Corning. The Division presented information on leasing policies for State lands and the regulations and other requirements that apply to well drilling, production and abandon-ment. Attendees had ample opportunity to dis-cuss the lease sale process with a DEC represen-tative and to have their questions answered. The public input received at the meetings and through other channels resulted in a change in lease terms for Schuyler State Reforestation Area # 3. The lease was offered on a no-surface entry basis to avoid impacting a unique bog in the area. DEC awarded 21 leases to four companies, with Fortuna Energy submitting the high bid on 16 of the leases. The company’s bid of $587 per acre for Steuben SRA #14 (Erwin Hollow State For-est) set a new record for a State lease sale.
Table 8 - Lease Type by County, 2003
County Acres Leases
Rental1 Royalty2 Storage3 Total Rental1 Royalty2 Storage3 Total
Allegany 11,502 126 11,627 9 1 10
Broome 315 315 1 1
Cattaraugus 62 9,981 10,042 2 8 10
Cayuga 62 62 4 4
Chautauqua 15,913 15,913 29 29
Chemung 121 488 609 1 2 3
Erie 10 255 264 2 2 4
Madison 53 53 1 1
Ontario 55 55 1 1
Schuyler 14,426 1 14,427 9 1 10
Seneca 17 17 1 1
Steuben 25,937 225 1,620 27,782 22 2 2 26
Total 52,352 16,902 11,911 81,165 43 43 14 100
1 Rental status means no wells drilled yet under lease, so delay rental paid on per acre basis.
2 Royalty status means there are producing wells on the lease and the State is receiving royalties.
3 Storage means it is a lease for an underground storage facility.
New York State Oil, Gas and Mineral Resources, 2003
NYS DEC - Division of Mineral Resources 22 Twentieth Annual Report
Hig
h B
id P
er A
cre
$15
- $1
00
$10
1 - $
300
$30
1 - $
587
SR
As &
WM
As
Steu
ben
Tompkins
Che
mun
g
Sch
uyle
r
Cor
ning
Map
3 -
2003
Sta
te L
and
Leas
e Sa
le H
igh
Bid
s
New York State Oil, Gas and Mineral Resources, 2003
NYS DEC - Division of Mineral Resources 23 Twentieth Annual Report
COMPUTERIZED SERVICES
Web Site Statistics As one of the Division’s primary tools for dis-tributing information, the website includes ex-tensive information on both the Oil and Gas and the Mined Land Reclamation Programs. Public use of the Division’s website increased dramati-cally from the previous year. The number of page views in 2003 rose by over 100% and the number of unique visitors rose by 50% com-pared to 2002. In addition. the average number of user sessions rose 30% to 362 sessions per day in 2003. The length of the average user session in-creased 41% from 16 min-utes in 2002 to 22.5 min-utes in 2003. The Division has further improvements planned for the website to increase its usefulness to the public, industry and local governments. Electronic Reporting and Annual Reports Approximately 14,500 wells need to be reported annually and the reports are due on March 31 for the preceding calendar year. The steadily increasing menu of electronic reporting options continues to make the process easier. In January the Division mailed 971 well owners a pre-printed form showing all of their registered wells. For the past four years, well owners have also been able to file their reports using elec-tronic options such as database and spreadsheet files. In 2003 well owners submitted electronic reports covering 4,881 wells or 31% of the State’s reported wells. However, those filings represented 91% of the State’s total gas produc-tion. Reports on an additional 1,284 storage and solution salt mining wells were filed electroni-cally. Electronic filing is easier for many well
owners and also reduces the chance of data en-try errors. The Division intends to expand the electronic reporting system to make this option more attractive to owners with a small number of wells. 2003 Highlights In addition to steady improvements in the Divi-sion’s website and electronic reporting efforts, the Division’s computer staff made significant improvements to the leasing process. As men-tioned on page 21, costly and cumbersome pa-per bid packages were replaced by electronic copies that could be downloaded for free. In 2003 the Division completed another impor-tant computerization project that had long been stymied by security requirements imposed on interagency data sharing. In late 2003 the Divi-sion started providing oil and gas data to both the New York State Geological Survey (NYSGS) and the Office of Real Property Ser-vices (ORPS) in formats tailored to their needs. Previously only selected staff at the two agen-cies had access to the Division’s database. ORPS’s use of the new improved electronic data package has eliminated the need to transfer paper records between agencies. It has also given OPRS staff more timely access to the data they need to manage local government taxation of oil and gas production. NYSGS’s Reservoir Characterization Group used the new tailored data packages to develop an on-line mapping program that combines our data on mines and oil and gas wells with other pertinent geologic information (http://www.nysm.nysed.gov/esogis/). The new data sharing arrangement has already proven its value to the oil and gas exploration community.
http://www.dec.state.ny.us/website/dmn
New York State Oil, Gas and Mineral Resources, 2003
NYS DEC - Division of Mineral Resources 24 Twentieth Annual Report
WELL PLUGGING, SITE RECLAMATION AND SITE INSPECTIONS
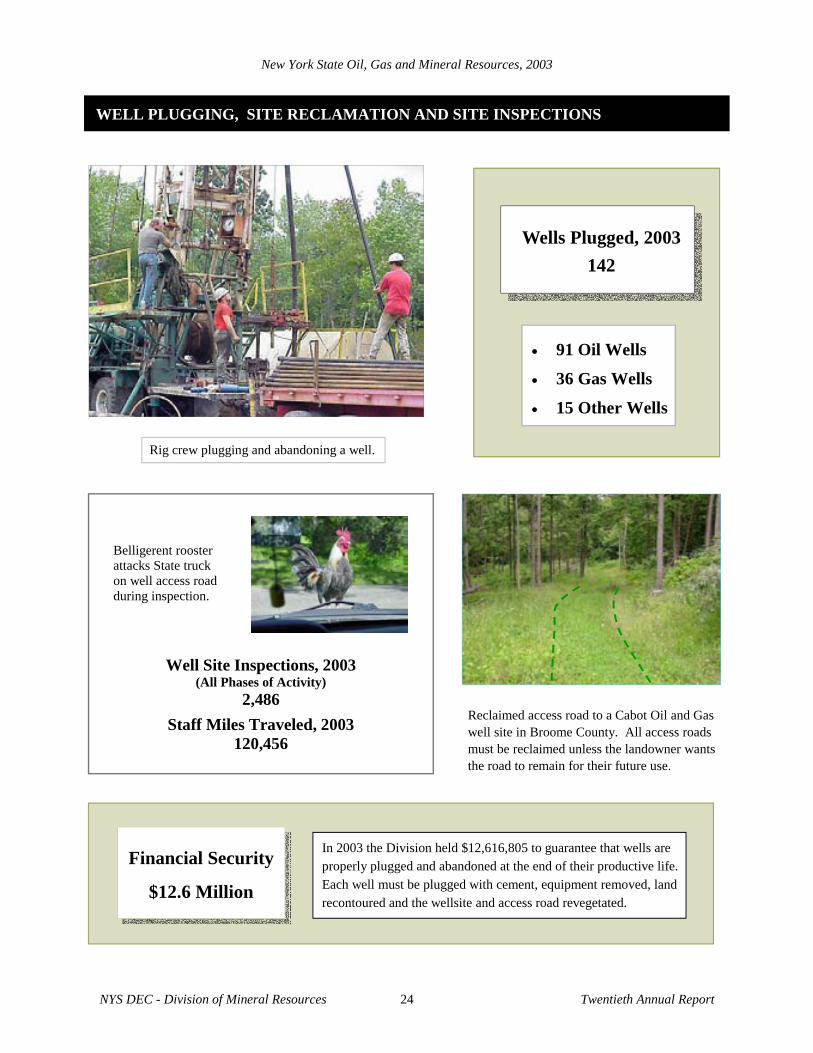
Financial Security
$12.6 Million
In 2003 the Division held $12,616,805 to guarantee that wells are properly plugged and abandoned at the end of their productive life. Each well must be plugged with cement, equipment removed, land recontoured and the wellsite and access road revegetated.
Reclaimed access road to a Cabot Oil and Gas well site in Broome County. All access roads must be reclaimed unless the landowner wants the road to remain for their future use.
Well Site Inspections, 2003 (All Phases of Activity)
2,486
Staff Miles Traveled, 2003 120,456
Belligerent rooster attacks State truck on well access road during inspection.
Rig crew plugging and abandoning a well.
Wells Plugged, 2003 142
• 91 Oil Wells
• 36 Gas Wells
• 15 Other Wells
New York State Oil, Gas and Mineral Resources, 2003
NYS DEC - Division of Mineral Resources 25 Twentieth Annual Report
ABANDONED WELLS
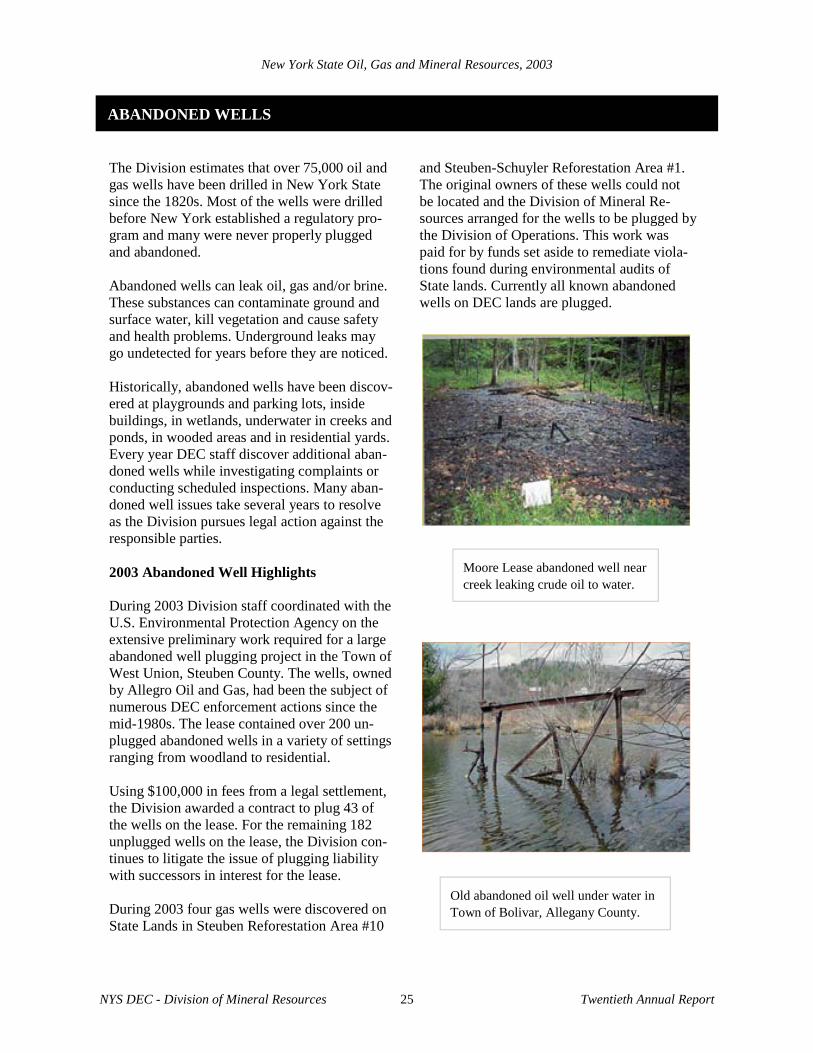
The Division estimates that over 75,000 oil and gas wells have been drilled in New York State since the 1820s. Most of the wells were drilled before New York established a regulatory pro-gram and many were never properly plugged and abandoned. Abandoned wells can leak oil, gas and/or brine. These substances can contaminate ground and surface water, kill vegetation and cause safety and health problems. Underground leaks may go undetected for years before they are noticed. Historically, abandoned wells have been discov-ered at playgrounds and parking lots, inside buildings, in wetlands, underwater in creeks and ponds, in wooded areas and in residential yards. Every year DEC staff discover additional aban-doned wells while investigating complaints or conducting scheduled inspections. Many aban-doned well issues take several years to resolve as the Division pursues legal action against the responsible parties. 2003 Abandoned Well Highlights During 2003 Division staff coordinated with the U.S. Environmental Protection Agency on the extensive preliminary work required for a large abandoned well plugging project in the Town of West Union, Steuben County. The wells, owned by Allegro Oil and Gas, had been the subject of numerous DEC enforcement actions since the mid-1980s. The lease contained over 200 un-plugged abandoned wells in a variety of settings ranging from woodland to residential. Using $100,000 in fees from a legal settlement, the Division awarded a contract to plug 43 of the wells on the lease. For the remaining 182 unplugged wells on the lease, the Division con-tinues to litigate the issue of plugging liability with successors in interest for the lease. During 2003 four gas wells were discovered on State Lands in Steuben Reforestation Area #10
and Steuben-Schuyler Reforestation Area #1. The original owners of these wells could not be located and the Division of Mineral Re-sources arranged for the wells to be plugged by the Division of Operations. This work was paid for by funds set aside to remediate viola-tions found during environmental audits of State lands. Currently all known abandoned wells on DEC lands are plugged.
Moore Lease abandoned well near creek leaking crude oil to water.
Old abandoned oil well under water in Town of Bolivar, Allegany County.
New York State Oil, Gas and Mineral Resources, 2003
NYS DEC - Division of Mineral Resources 26 Twentieth Annual Report
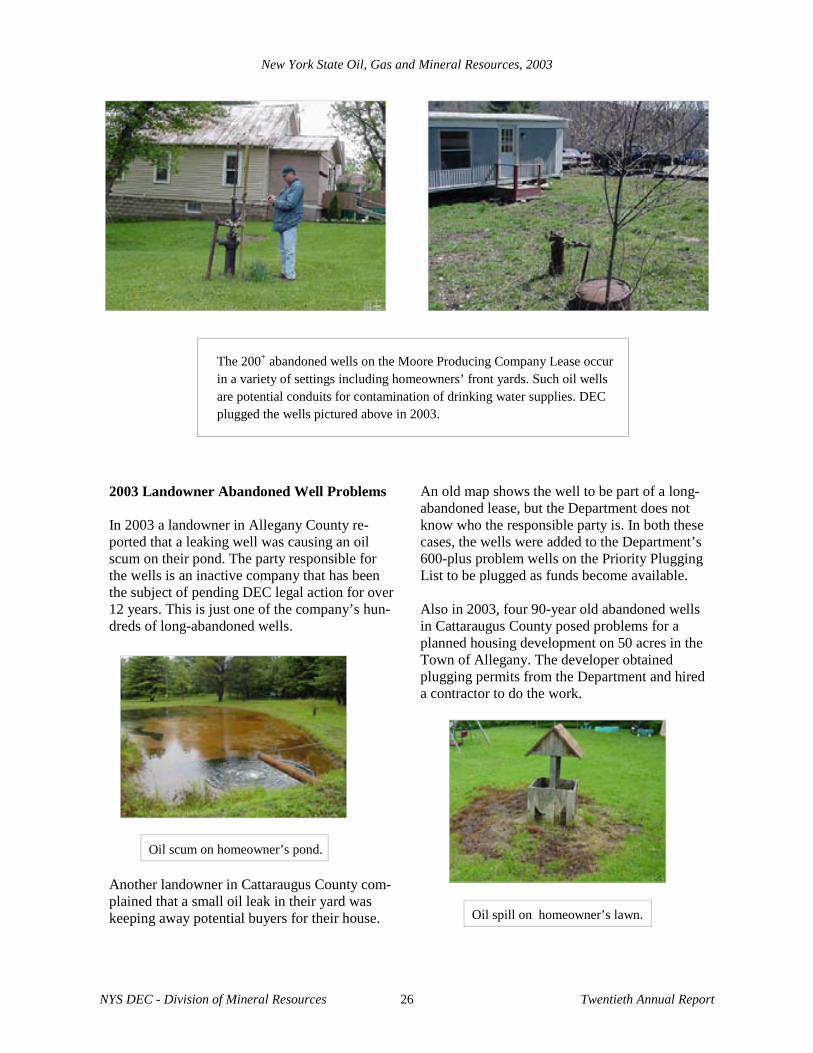
The 200+ abandoned wells on the Moore Producing Company Lease occur in a variety of settings including homeowners’ front yards. Such oil wells are potential conduits for contamination of drinking water supplies. DEC plugged the wells pictured above in 2003.
An old map shows the well to be part of a long-abandoned lease, but the Department does not know who the responsible party is. In both these cases, the wells were added to the Department’s 600-plus problem wells on the Priority Plugging List to be plugged as funds become available. Also in 2003, four 90-year old abandoned wells in Cattaraugus County posed problems for a planned housing development on 50 acres in the Town of Allegany. The developer obtained plugging permits from the Department and hired a contractor to do the work.
2003 Landowner Abandoned Well Problems In 2003 a landowner in Allegany County re-ported that a leaking well was causing an oil scum on their pond. The party responsible for the wells is an inactive company that has been the subject of pending DEC legal action for over 12 years. This is just one of the company’s hun-dreds of long-abandoned wells.
Another landowner in Cattaraugus County com-plained that a small oil leak in their yard was keeping away potential buyers for their house.
Oil scum on homeowner’s pond.
Oil spill on homeowner’s lawn.