Embed Size (px)
Citation preview

Production of milk foams by steam injection: the effects of steam pressure and nozzle design
Article
Accepted Version
Creative Commons: Attribution-Noncommercial-No Derivative Works 4.0
Jimenez-Junca, C., Sher, A., Gumy, J.-C. and Niranjan, K. (2015) Production of milk foams by steam injection: the effects of steam pressure and nozzle design. Journal of Food Engineering, 166. pp. 247-254. ISSN 0260-8774 doi: https://doi.org/10.1016/j.jfoodeng.2015.05.035 Available at http://centaur.reading.ac.uk/43510/
It is advisable to refer to the publisher’s version if you intend to cite from the work. See Guidance on citing .
To link to this article DOI: http://dx.doi.org/10.1016/j.jfoodeng.2015.05.035
Publisher: Elsevier
All outputs in CentAUR are protected by Intellectual Property Rights law, including copyright law. Copyright and IPR is retained by the creators or other copyright holders. Terms and conditions for use of this material are defined in

the End User Agreement .
www.reading.ac.uk/centaur
CentAUR
Central Archive at the University of Reading
Reading’s research outputs online

Production of milk foams by steam injection: the effects of steam pressure 1
and nozzle design 2
3
Carlos Jimenez-Junca1*, Alexander Sher2, Jean-Claude Gumy3 and K. Niranjan4 4
*Corresponding author: Carlos Jimenez-Junca, e-mail: [email protected] , tel: 5
+57 320 845 45 27, Fax: +571 861 55 55 6
1Faculty of Engineering, Universidad de la Sabana, Campus Puente el Común, Km.7 7
Autopista Norte de Bogotá, Chía 25001, Colombia 8
2Nestlé R&D Marysville, 809 Collins Ave, Marysville, OH 43040, USA 9
3Nestlé PTC Orbe, Rte de Chavornay 3, Orbe, CH-1350, Switzerland 10
4Department of Food and Nutritional Sciences, University of Reading, Whiteknights PO 11
Box 226, Reading RG6 6AP (UK) 12
13
Abstract 14
Foam properties depend on the physico-chemical characteristics of the continuous phase, 15
the method of production and process conditions employed; however the preparation of 16
barista-style milk foams in coffee shops by injection of steam uses milk as its main 17
ingredient which limits the control of foam properties by changing the biochemical 18
characteristics of the continuous phase. Therefore, the control of process conditions and 19
nozzle design are the only ways available to produce foams with diverse properties. Milk 20
foams were produced employing different steam pressures (100-280 kPa gauge) and 21
nozzle designs (ejector, plunging-jet and confined-jet nozzles). The foamability of milk, and 22
the stability, bubble size and texture of the foams were investigated. Variations in steam 23

pressure and nozzle design changed the hydrodynamic conditions during foam production, 24
resulting in foams having a range of properties. Steam pressure influenced foam 25
characteristics, although the net effect depended on the nozzle design used. These results 26
suggest that, in addition to the physicochemical determinants of milk, the foam properties 27
can also be controlled by changing the steam pressure and nozzle design. 28
Keywords: cappuccino, milk foams, steam injection, nozzle design, foam properties 29
1. Introduction 30
Foams are gas-liquid systems, which have applications in different fields: cosmetics, 31
drugs, oil extraction, chemical industry and food (Herzhaft, 1999). The incorporation of 32
bubbles into foods helps to improve the texture, appearance and taste whilst decreasing 33
the caloric content (Campbell and Mougeot, 1999). There are several methods employed 34
to incorporate bubbles within food structures: mechanical whipping, air injection, chemical 35
decomposition, fermentation and so on (Campbell and Mougeot, 1999). A less understood 36
method to generate foams is steam injection, may be because of its exclusive applicability 37
to froth the milk used in the preparation of coffee based hot beverage such as cappuccino, 38
latte and mochaccino (Huppertz, 2010). 39
Steam injection frothing is a non-isothermal method, which employs steam flow to draw air 40
and simultaneously heat up the milk (Silva et al., 2008). Like any foam, the milk foams 41
produced by steam injection begin to destabilize soon after the steam flow is switched off, 42
causing their characteristics to change continuously with time. This process is also 43
accompanied by a drop in temperature which further influences foam properties (Silva et 44
al., 2008). 45
Foam properties depend on the physico-chemical characteristics of the continuous phase, 46
the method of production and process conditions (Borcherding et al., 2008; Malysa, 1992). 47
A great volume of the available information on foaming of food is focused on studying the 48

effect of the surface active agents (surfactants and proteins) on foams properties (Carrera-49
Sanchez and Rodrıguez-Patino, 2005; Dickinson, 1999; Marinova et al., 2009; Rodríguez 50
Patino et al., 2008; Wilde et al., 2004). Moreover the published studies on the link between 51
processing conditions and foam properties are restricted to mechanical agitation based 52
methods employed for the production of foams (Balerin et al., 2007; Bals and Kulozik, 53
2003; Indrawati et al., 2008; Thakur et al., 2003). 54
Many designs of coffee machines are commercially available to prepare milk foams, which 55
employ a variety of steam injector designs (Borgmann, 1990; Giuliano, 1993; Hsu, 2004; 56
Mahlich and Borgmann, 1989; Stieger and Yoakim, 2006; Stubaus, 1993). Inevitably, each 57
design produces foam by a different mechanism. The oldest method to produce foam by 58
steam injection is to use a nozzle that is placed just below the milk surface. The flow of 59
steam through the nozzle induces air entry. The operator (or barista) moves the milk 60
container vertically and horizontally at an appropriate frequency to introduce the air and 61
produce the foam (Giuliano, 1993). 62
Other sparger designs take advantage of a steam ejector principle to restrict the passage 63
of steam and generate the necessary pressure drop to suck air, or a mix of air and milk, to 64
generate the foam. The simplest ejector based system consists of a nozzle where the 65
steam is allowed to expand, thereby generating a very low pressure and drawing the air 66
through a tube that is connected at the nozzle. The two fluid phases enter a mixing 67
chamber before being introduced into the milk for generating the foam (Borgmann, 1990). 68
Despite the availability of a large number of patented devices and machines to produce 69
milk foams by steam injection, there are relatively few studies focusing on the effect of 70
process conditions on the properties of foams generated (Deeth and Smith, 1983; Goh et 71
al., 2009; Huppertz, 2010; Kamath et al., 2008; Levy, 2003; Silva et al, 2008). Moreover, 72
the preparation of barista-style milk foams in coffee shops use homogenized pasteurized 73

semi-skimmed milk, which does not permit the control of foam properties formed by merely 74
controlling the biochemical characteristics of the milk. The only way to produce foams with 75
diverse properties, with a given type of milk, is to employ different machine and steam 76
sparger designs. The aim of this study is to evaluate the relationship between the main 77
process parameters (steam pressure and nozzle design) and the principal properties of 78
foams formed. 79
2. Materials 80
2.1 Milk supply 81
Homogenized pasteurized semi-skimmed milk (brand Freshways) was bought from a local 82
shop; this was stored in a fridge (5 ± 1ºC) and processed within 3 days of the purchase. 83
Each batch of milk was characterized by measuring fat, protein, lactose and SNF (solid not 84
fat) contents using a DairyLab (FOSS, Warrington, UK) and the pH was measured using a 85
normal potentiometer. 86
Commercial red food colouring (Supercook, Leeds, England) was added to the milk in the 87
proportion 10 drops/L, in order to enhance the visualization of the liquid/foam interface in 88
experiments observing the foam generation and stability. The addition of dye at this 89
concentration does not have effect on milk surface tension or foaming properties (Silva et 90
al., 2008). 91
2.2 Foam generation equipment 92
A steam injection device constructed previously (Silva et al., 2008) which allowed the 93
formation of foams under controlled and reproducible conditions was used for the 94
experimental study. A control valve connected to a supply of steam regulated the 95
pressures between 0 and 280 kPa gauge, and steam was injected at the following specific 96

pressures (100, 180 and 280 kPa) whilst employing three different sparging units 97
described in the following paragraphs. 98
2.2.1 Confined-jet 99
This sparger (Figure 1A) is based on a commercial design (Francis X1 espresso machine). 100
It consists of a plunging-jet nozzle which introduces steam through a 2 mm hole into a 101
confined cylindrical chamber, 10 mm diameter and 30 mm height, placed 5 mm above the 102
milk surface. The negative pressure generated in the chamber draws ambient air through 103
3 holes, 1 mm diameter, located on the cylinder wall, which is dispersed along with the 104
steam into the milk. 105
2.2.2 Ejector-type nozzle 106
It was adapted from a commercial espresso machine (Krupps Vivo): Two stainless steel 107
tubes were connected to a rubber sparger as shown in the Figure 1B, steam was 108
introduced through one of the tubes, and air was drawn in through the other (7 cm length) 109
like an ejector system. A mixture of steam and air left the nozzle through a 1mm orifice at 110
the tip of the rubber unit. The sparging unit was placed in such a way that the orifice on the 111
rubber unit was located 10 mm below the surface of the milk. 112
2.2.3 Plunging-jet nozzle 113
A 5 mm commercial nozzle (Figure 1C) with 3 holes of 1 mm each was used. The nozzle 114
tip was fixed 5 mm above the milk surface, which gave repeatable foam properties. 115
2.3 Foam generation methodology 116
A fixed volume of milk, 200 mL, was taken in a 1 L graduated cylinder (reading error of ±10 117
mL), and the sparging unit was placed above or below the milk surface depending on the 118
nozzle studied. The steam was injected at a constant flow rate over a period of time which 119
gave a maximum temperature of about 70 C in the milk. The injection time depended of 120

the steam pressure and nozzle type (Table 1). Temperatures were measured continuously 121
with K type thermocouples connected to a data acquisition system (Grant Systems 10003 122
Squirrel). One of the thermocouples was placed approximately 2 cm above the anticipated 123
interface level and the other 2 cm below the interface, in order to to measure the foam and 124
liquid temperatures, respectively. 125
2.4 Foam properties 126
2.4.1 Foamability and stability 127
The foam was allowed to destabilize in the same graduated cylinder where it was formed. 128
The volume of the dispersion was read continuously from the graduations on the cylinder, 129
and the cylinder and contents were weighed before and after steam injection, in order to 130
determine the mass of the steam condensed in the milk. Total (liquid plus foam) and clear 131
liquid (only liquid) volumes (VT and VL, respectively) in the cylinder, and the liquid and 132
foam temperatures were monitored over time as the foam was left to stand in a controlled 133
temperature room (18 ºC). 134
Foamability was evaluated by obtaining the air volume fraction (0) (Table 2). Although 135
there are different parameters used to measure the transient stability of foams (Britten and 136
Lavoie, 1992; Buchanan, 1965; Carrera-Sanchez and Rodrıguez-Patino, 2005; Waniska 137
and Kinsella, 1979), most of the earlier workers have characterized the stability on the 138
basis of liquid drainage from the foam and the collapse of the foam column. Following the 139
same vein, the stability of foams was studied by measuring over time: i) the volume 140
fraction of the liquid drained (LDF) and ii) air release fraction (ARF). 141
The foamability and foam destabilization parameters were determined by undertaking a 142
mass balance on the basis of the volume measurements made before and after switching 143
off the steam supply using the equations defined by Silva et al., (2008), (Table 2). When 144

the top of the foam was found to be uneven, an average reading of three points around the 145
cylinder circumference was taken to represent the mean position of the foam top. The 146
maximum variation in the readings was 10 mL. 147
2.4.2 Foam texture 148
Foam texture was assessed by performing a compression test using a texture analyzer 149
(TA XT2i, Stable Microsystems, Surrey, UK) at fixed time of 3 minutes of destabilization. A 150
51 mm diameter cylindrical probe was used in all experiments. The probe compressed the 151
sample by 5 mm at the test speed of 0.5 mm/s. 152
The equipment was fitted with a 5 kg load cell (sensitivity 0.1 g) for better texture detection 153
in weaker samples. The maximum force was then selected as the parameter to compare 154
the texture of different foams. 155
2.4.3 Bubble size distribution 156
An optical system with a CCD camera was adapted to measure the bubble size 157
distribution. The system consisted of a set of TV lenses which allowed visualizing a 158
minimum size of approximately 10 microns; these lenses were coupled to a CCD camera 159
which captured the digital images and sent them to a computer to be stored for a further 160
analysis. 161
The foam was sampled 2 minutes after the steam injection ceased, by using a 162
polycarbonate spoon designed specially to take the foam directly from the cylinder without 163
the need to transfer it to another container. The foam was left in the spoon for a minute to 164
stabilize, prior to taking pictures of 4 different areas in the spoon. 165
The images were edited and processed using the software ImageJ 1.42 and Bubbles Edit 166
1.1 (a copy licence of BubbleSEdit was given kindly by its author Dr. Xenophon Zabulis 167

from Institute of Computer Science, Foundation for Research and Technology, Crete, 168
Greece). 169
3. Results and discussion 170
3.1 Nozzles characterization 171
3.1.1 Steam flow 172
There were significant effects of the steam pressure (p = 0.001) and the type of nozzle 173
used (p = 0.001) on the flow rate of injected steam (Figure 2). 174
Plunging-jet and confined-jet nozzles introduced steam between 1.8 (at 100kPa) and 2.3 175
(at 280 kPa) times quicker than ejector-type. The flow rate of steam increased linearly with 176
the pressure, but the rates of increase were different, with the lowest rate being noted for 177
the ejector-type nozzle. The plunging-jet and the confined-jet nozzles can inject steam 178
almost freely without any flow restriction produced by the air. On the other hand, the 179
ejector-type nozzle has a mixing chamber where the steam is mixed with the air drawn 180
(Varga et al., 2009), thus the presence of air in this chamber impedes the steam flow more 181
than in other nozzles. 182
All foams produced were assessed after the milk was warmed between 65 and 70 C in 183
order to reproduce the conditions used in the preparation of the traditional barista-style 184
milk foams in coffee shops. 185
3.1.2 Performance of nozzles 186
When milk foams are produced by steam injection, the steam is used to warm the milk as 187
well as induce the air entry. The final temperature of milk is controlled by the injection time 188
(at a fixed pressure), and the volume of air introduced depends on the injection time as 189
well as the mechanism of air entry. The efficiency of any steam-air injecting nozzle can be 190

expressed by the mean value of the ratio of the air and the steam flow rates during 191
injection. 192
As the air flow depends on the flow of steam, Figure 3 shows a direct variation of the 193
entrainment ratio with the steam pressure for all nozzles. The rate of change was different 194
for each nozzle: increasing the pressure, produced slight increase in the entrainment ratio 195
for ejector-type and confined-jet nozzles which eventually tend towards constant values at 196
higher pressures. On the other hand, the results for plunging-jet nozzle showed a 197
significant effect of pressure on entrainment ratio with higher rates of changes at higher 198
pressures. 199
This is a consequence of the mechanism of air entrance: confined-jet and ejector-type 200
nozzles introduce air by the vacuum caused by steam expansion. As the air and steam are 201
mixed in a closed space before their injection into milk, an increase in steam pressure 202
generates greater pressure drop and steam hold-up inside the nozzle, which effectively 203
reduces the entrainment ratio (Varga et al., 2009). However, the mechanism of air 204
inclusion is different in the plunging-jet nozzle: the air is introduced as a thin layer 205
entrained by the steam jet at its surface. As the steam pressure rises, the impact velocity 206
of the steam jet also increases dragging more air and consequently getting higher 207
entrainment ratios, as shown by Brattberg and Chanson (1998) and Bagatur et al. (2002). 208
3.2 Bubble size 209
Two variables were measured to study the bubble populations in foams obtained under the 210
different conditions of pressure and nozzle type: the Sauter mean diameter (D32) which is 211
related to the bubbles size distribution and the inter-percentile range 10-90 (IPR10-90) 212
which is a measure of the dispersion in the bubbles size (polydispersity). 213
The effect of pressure on D32 in foams produced with the three nozzles is showed in Figure 214
4. There was a linear increase in bubble size with steam pressure for each nozzle, but this 215
effect was less marked for plunging-jet nozzle, since the D32 increased by only 3 m for a 216
20 kPa increase in pressure. In contrast, the foams produced with confined-jet and ejector-217
type nozzles changed bubble size by 11 and 10 m respectively for 20 kPa increase in 218
pressure. These inferences can be drawn from the gradient of the best fit lines drawn 219
through the points shown in Figure 4, for each nozzle. Further, the ejector-type nozzle 220
produced the biggest bubbles at each steam pressure, while the plunging-jet generated 221
the smallest bubbles. 222
It is interesting to note that bubble size was affected by pressure more significantly in 223
foams produced with the confined-jet and ejector-type nozzles than with the plunging jet 224
nozzle. 225
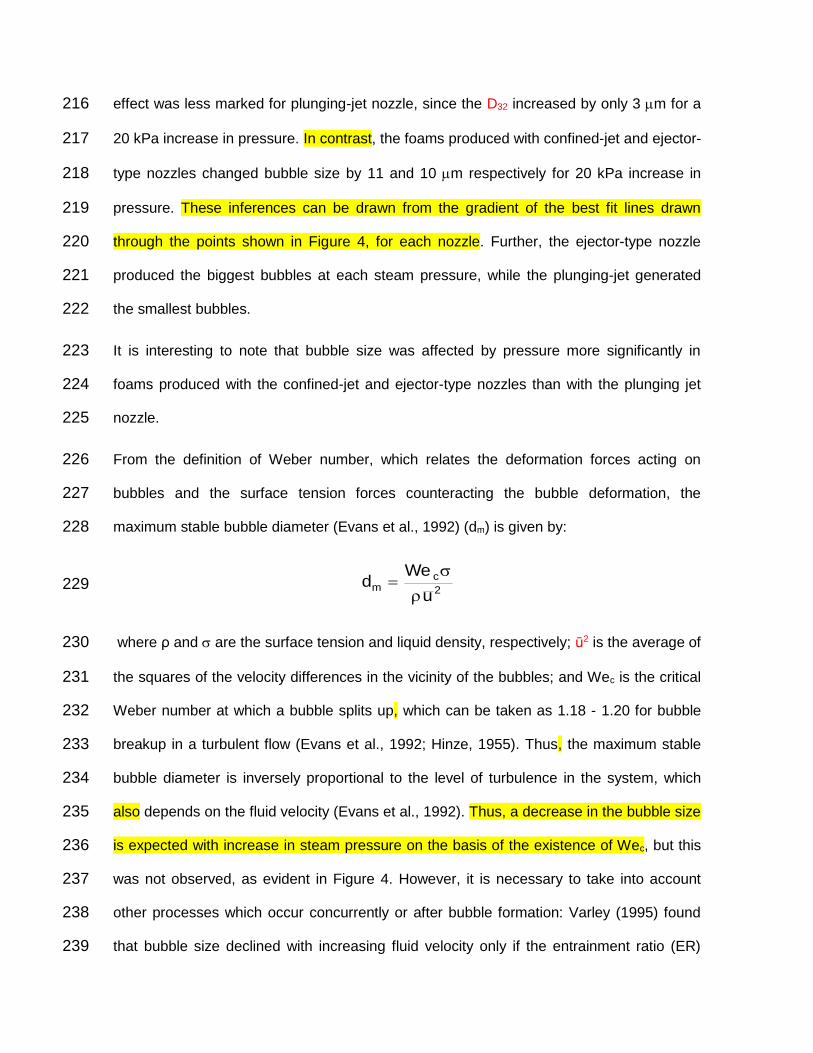
From the definition of Weber number, which relates the deformation forces acting on 226
bubbles and the surface tension forces counteracting the bubble deformation, the 227
maximum stable bubble diameter (Evans et al., 1992) (dm) is given by: 228
2
cm
u
Wed
229
where ρ and are the surface tension and liquid density, respectively; ū2 is the average of 230
the squares of the velocity differences in the vicinity of the bubbles; and Wec is the critical 231
Weber number at which a bubble splits up, which can be taken as 1.18 - 1.20 for bubble 232
breakup in a turbulent flow (Evans et al., 1992; Hinze, 1955). Thus, the maximum stable 233
bubble diameter is inversely proportional to the level of turbulence in the system, which 234
also depends on the fluid velocity (Evans et al., 1992). Thus, a decrease in the bubble size 235
is expected with increase in steam pressure on the basis of the existence of Wec, but this 236
was not observed, as evident in Figure 4. However, it is necessary to take into account 237
other processes which occur concurrently or after bubble formation: Varley (1995) found 238
that bubble size declined with increasing fluid velocity only if the entrainment ratio (ER) 239

remained constant. This was not the case in the present study (Figure 3). Varley (1995) 240
also suggests that if ER increased with the steam flow, the local gas phase hold up is high 241
and the probability of bubble collision and coalescence is greater leading to the formation 242
of larger bubbles. This effect is more pronounced in confined-jet and ejector-type nozzles 243
compared to plunging-jet, where the mixture of steam and air are confined in smaller 244
spaces, and the coalescence probability is higher. 245
The other consequence of higher bubble coalescence with increasing ER is a higher 246
spread in bubbles size (Varley, 1995) as shown in Figure 5. This was more relevant in the 247
case of confined-jet and ejector-type nozzles than for the plunging jet nozzle. These 248
results show that the foams became more polydispersed with increasing steam pressure, 249
and it was more marked in the case of the confined-jet and ejector-type nozzles. 250
Figure 6 presents representative images of the bubbles in foams produced at 280 kPa. 251
The image of bubbles obtained with the plunging-jet nozzle shows smaller bubbles and 252
more homogeneous bubble size distribution, which allows a better packing of bubbles in 253
the foam. Further, neither deformation nor compression is observed in the bubbles. The 254
ejector-type nozzle gave the largest bubbles which appeared deformed and slightly 255
compressed, whereas the bubbles produced with the confined-jet nozzle were slightly 256
smaller in size but less packed than those obtained using the ejector-type nozzle. 257
3.3. Foamability 258
Foamability is related directly to the quantity of air injected and the capacity of the proteins 259
to retain this air once the foam is created (Marinova et al., 2009). Since the same type of 260
milk was used in all experiments, the amount of air incorporation in the foam (Figure 7), 261
which is also equal to the volume of air injected, depends only on the steam pressure and 262
nozzle type used to generate the foams. 263

There was a significant effect (p < 0.001) of the pressure and nozzle type on (Figure 7). 264
The direct relationship of with the increasing pressure was more evident in the case of 265
the plunging jet nozzle. No significant changes were observed in foams generated with 266
ejector-type nozzle. It is important to highlight that was also controlled by the design and 267
placement of the nozzles: the quantity of air introduced in the case of the confined-jet and 268
plunging jet nozzles depends on the air entry tube length in the injector-type nozzle (7 cm 269
in this experiment) and the initial position of the nozzle tip above the milk surface (in this 270
case, 5 mm). This is because air entrainment ceases when the foam height increases to a 271
level where it covers the air entry point. This consideration allows explaining the different 272
effects of pressure change on for each nozzle: as the foam height reaches the position 273
of the air entrance tube in the ejector-type nozzle, the air flow decreases drastically 274
regardless of the pressure, resulting in a minimum effect of pressure increase on . On 275
the other hand, a high speed jet of steam hits the milk surface in the case of the confined-276
jet and plunging jet nozzles, creating a cavity in the liquid as consequence of the 277
stagnation pressure (Ohl et al., 2000). As the speed of the jet increases with the steam 278
pressure, the cavity size becomes bigger which entraps more air and results in a 279
significant increasing of with pressure. 280
3.4 Foam stability 281
3.4.1 Liquid drainage 282
Liquid drainage was studied by calculating the liquid drained fraction (LDF) during 283
destabilization process. Figure 8 shows that foams produced at 100 kPa drained quickly 284
within the first 2 minutes, whereas those generated at 280 kPa drained more slowly in the 285
same interval of time. Profiles were more homogeneous after 4 minutes with the exception 286
of foams produced with the ejector-type nozzle which drained slowly, shedding liquid in 287
smaller quantities (less than 93%). 288

The influence of pressure was more significant in foams produced with plunging-jet nozzle 289
in the early stages of destabilization. Thus foams made at 100 kPa drained 92% of liquid 290
at 2 minutes, whereas foams produced at 280 kPa only drained nearly 80% during the 291
same time. On the other hand, the steam pressure did not affect the profiles of liquid 292
drainage in foams generated with ejector-type nozzle, since all foams drained about ~ 78% 293
after 2 minutes of destabilization for different steam injection pressures. 294
Data on the volumes of liquid drained were fitted to the model developed by Elizalde and 295
others (1991) to make a quantitative comparison of destabilization and drainage in the 296
foams (Figure 9). There was a significant effect of the interaction (p < 0.019) of the steam 297
pressure and the nozzle type used on the kinetic parameters. As the initial rate of liquid 298
drainage (R0L) relates to the ability to retain excess liquid in foams with low gas volume 299
fraction (Britten and Lavoie, 1992), this parameter was used instead of half-life time of 300
drainage (BL) to compare the rates of drainage. There was a significant effect of the 301
pressure and nozzle type on rates of liquid drainage (p < 0.001): it decreased with 302
pressure for confined-jet and plunging-jet nozzles, and remained practically constant for 303
foams produced with the ejector-type nozzle. It is interesting to note the marked effect of 304
steam pressure on R0L for foams made with plunging-jet nozzle since it decreased from 305
2410 to 670 mL/min when the pressure increased from 100 to 280 kPa. On the other hand, 306
the lowest initial drainage rates were observed in foams produced using ejector-type 307
nozzle, this is due to the low initial content of liquid in these foams. 308
A variety of factors are associated with the speed and the extent of liquid drainage in 309
foams: gas flow rate during the foam production, bubble size, initial height of foam column 310
and liquid properties (Narsimhan, 1991). As these parameters were different and not 311
controlled in present experiments it is not possible to attribute the observed performance 312
to any one factor, and a combined effect of these variables is expected. However, a partial 313

explanation can be given by relating the initial rate of liquid drainage with the product of 314
D32 and 0. Figure 10 shows an inverse relationship: R0L is higher for smaller products 315
D32*0 as observed in present study, for example the greatest R0L was 2488 mL/min which 316
was observed in foams produced with the plunging jet nozzle at 100 kPa, these had the 317
smallest bubble size and the highest initial liquid content. 318
If bubbles are greater than the optimum size as stated by Germick and others (1994), the 319
extent and rate of liquid drainage increases as the bubbles become smaller. This is 320
because the gradient of plateau border suction (which opposes gravity) is smaller in bigger 321
bubbles. On the other hand, a high initial content of liquid in the foam generates more 322
homogeneous foams; the gradient of plateau border suction is smaller and the gravity 323
accelerates drainage. 324
3.4.2 Air release 325
As a consequence of liquid drainage, the liquid film between bubbles becomes thinner and 326
eventually ruptures. This phenomenon plus the disproportionation process result in foam 327
collapse (Carrier and Colin, 2003), which is accompanied by air release. Figure 11 shows 328
how the air release fraction (ARF) for the different foams changes with destabilization time. 329
The value of this fraction after 10 min depended on the steam pressure employed and the 330
nozzle used to create the foam. When the ejector-type nozzle was used, ARF only 331
increased for steam pressures between 100 kPa and 180 kPa, remaining unaltered at 280 332
kPa. In the case of the plunging-jet nozzle, the ARF increased for the same three pressure 333
values. When the confined-jet nozzle was used, the ARF remained unaltered for all three 334
steam pressure values. Figure 11 also shows the rate of air release was higher in the case 335
of confined-jet and ejector-type nozzles during the first 5 minutes, when the steam 336
pressure employed was 100 kPa; thereafter, the profiles were similar for these two 337
nozzles, with the ejector-type nozzle giving slightly higher values. 338
Even though Britten and Lavoie (1992) found three distinct zones of rates for gas release 339
from milk protein foams, Figure 11 only shows a roughly constant rate of foam collapse 340
which corresponds to the second stage of the rate profiles observed by Halling (1981). 341
These differences may be attributed to the different foaming temperatures: Britten and 342
Lavoie (1992) worked at 20 C, so the collapse of the foam column was slower, and all 343
three stages were observed. On the other hand, the temperature of the present foams was 344
65 C at the beginning of destabilization, so the foam collapse was rapid and the time 345
necessary to achieve the critical lamella thickness was likely to be so short that the first 346
stage is not noticeable. Moreover, the final stage was also not observed in this study 347
because it generally occurred after very long times, for instance, Britten and Lavoie (1992) 348
observed this stage after 40 min of destabilization. 349
3.5 Foam texture 350
Figure 12 presents the compression force at a strain of 5% for foams produced with the 351
different combinations of steam pressure and nozzle design. 352
There was a significant effect of steam pressure (p < 0.001) on compression force, which 353
increased with the pressure in all foams, but the change was greater in foams made with 354
plunging-jet nozzle, which also produced the strongest foams at each pressure. Although 355
there is no information available which can explain the differences between compression 356
force values, the differences can be related to the bubble size, extent of polydispersity and 357
gas volume fraction. Figure 13 shows the changes in compression force with specific 358
interfacial area in the different foams. There is a decrease in the force with the interfacial 359
area, which means that the foams are easier to compress when the bubble size is small 360
and/or the holdup is high. The fact that there is a curve for each nozzle suggests there are 361
other factors intrinsic to each steam nozzle influencing the compression forces. 362
4. Conclusions 363

The use of different type of nozzles and steam injection pressures produce foams with 364
significantly different properties. The increase in steam pressure reduced the steam 365
injection time required to produce the foams and improved foamability, stability and texture 366
in the foams. 367
The mechanism of air entry determined the extent of changes in foams properties when 368
steam pressure increased. Thus, in nozzles where the mixture of steam and air was 369
confined (confined-jet and ejector-type nozzles), increasing steam pressure strongly 370
influenced foam bubble size and texture, whereas the change in these properties was less 371
marked when the air was introduced unconfined as in the case of the plunging-jet. 372
In general, foams produced between steam pressures of 180 and 280 kPa with the 373
plunging-jet nozzle had desired combination of low bubble size, high foam stability and 374
stiffness (measured as a compression force). 375
Finally, it was found that gas volume fraction and bubble size are related to liquid drainage 376
and compression force, since the initial rate of liquid drainage changed inversely with the 377
product of 0 and D32, and the compression force decreased with the specific interfacial 378
area which is proportional to 0/D32. 379
5. Acknowledgements 380
Dr. Xenophon Zabulis from the Inst. of Computer Science, Foundation for Research and 381
Technology (Greece), is acknowledged for providing a copy of the software Bubbles Edit 382
1.1 to analyze the bubble size. The financial support of Nestle and the Engineering and 383
Physical Sciences Research Council (EPSRC), U.K., is also gratefully acknowledged. 384
6. References 385
Bagatur, T., Baylar, A., Sekerdag, N., 2002. The Effect of Nozzle Type on Air Entrainment 386
by Plunging Water Jets. Water Qual. Res. J. Canada 37, 599–612. 387

Balerin, C., Aymard, P., Ducept, F., Vaslin, S., Cuvelier, G., 2007. Effect of formulation and 388
processing factors on the properties of liquid food foams. J. Food Eng. 78, 802–809. 389
Bals, A., Kulozik, U., 2003. Effect of pre-heating on the foaming properties of whey protein 390
isolate using a membrane foaming apparatus. Int. Dairy J. 13, 903–908. 391
Borcherding, K., Hoffmann, W., Lorenzen, P.C., Schrader, K., 2008. Effect of milk 392
homogenisation and foaming temperature on properties and microstructure of foams from 393
pasteurised whole milk. LWT - Food Sci. Technol. 41, 2036–2043. 394
Borgmann, M., 1990. Cappuccino making adapter for use with coffee makers. US Patent 395
4945824. 396
Brattberg, T., Chanson, H., 1998. Air entrapment and air bubble dispersion at two-397
dimensional plunging water jets. Chem. Eng. Sci. 53, 4113–4127. 398
Britten, M., Lavoie, L., 1992. Foaming Properties of Proteins as Affected by Concentration. 399
J. Food Sci. 57, 1219–1241. 400
Buchanan, R.A., 1965. Lipolysis and the frothing of milk. Aust. J. Dairy Technol. 62–66. 401
Campbell, G.M., Mougeot, E., 1999. Creation and characterisation of aerated food 402
products. Trends Food Sci. Technol. 10, 283–296. 403
Carrera-Sanchez, C., Rodrıguez-Patino, J.M., 2005. Interfacial, foaming and emulsifying 404
characteristics of sodium caseinate as influenced by protein concentration in solution. 405
Food Hydrocoll. 19, 407–416. 406
Carrier, V., Colin, A., 2003. Coalescence in Draining Foams. Langmuir 19, 4535–4538. 407
Deeth, H.C., Smith, R.A.D., 1983. Lipolysis and Other Factors Affecting the Steam 408
Frothing Capacity of Milk. Aust. J. Dairy Technol. 38, 14–19. 409

Dickinson, E., 1999. Adsorbed protein layers at fluid interfaces: interactions, structure and 410
surface rheology. Colloids Surfaces B Biointerfaces 15, 161–176. 411
Elizalde, B.E., Giaccaglia, D., Pilosof, A.M.R., Bartholomai, G.B., 1991. Kinetics of Liquid 412
Drainage from Protein-Stabilized Foams. J. Food Sci. 56, 24–30. 413
Evans, G.M., Jameson, G.J., Atkinson, B.W., 1992. Prediction of the bubble size 414
generated by a plunging liquid jet bubble column. Chem. Eng. Sci. 47, 3265–3272. 415
Germick, R.J., Rehill, A.S., Narsimhan, G., 1994. Experimental investigation of static 416
drainage of protein stabilized foams - Comparison with model. J. Food Eng. 23, 555–578. 417
Giuliano, M., 1996. Automatic espresso and cappuccino machine. US Patent 5490447. 418
Goh, J., Kravchuk, O., Deeth, H.C., 2009. Comparison of mechanical agitation, steam 419
injection and air bubbling for foaming milk of different types. Milchwissenschaft 64, 121–420
124. 421
Halling, P.J., 1981. Protein-Stabilized Foams and Emulsions. Crit. Rev. Food Sci. Nutr. 15, 422
155–203. 423
Herzhaft, B., 1999. Rheology of Aqueous Foams: a Literature Review of some 424
Experimental Works. Oil Gas Sci. Technol. 54, 587–596. 425
Hinze, J.O., 1955. Fundamentals of the hydrodynamic mechanism of splitting in dispersion 426
processes. AICHE J. 1, 289–295. 427
Hsu, T., 2004. Milk foam delivery pipe for an espresso coffee maker. US Patent 6810795. 428
Huppertz, T., 2010. Foaming properties of milk: A review of the influence of composition 429
and processing. Int. J. Dairy Technol. 63, 477–488. 430

Indrawati, L., Wang, Z., Narsimhan, G., Gonzalez, J., 2008. Effect of processing 431
parameters on foam formation using a continuous system with a mechanical whipper. J. 432
Food Eng. 88, 65–74. 433
Kamath, S., Wulandewi, A., Deeth, H., 2008. Relationship between surface tension, free 434
fatty acid concentration and foaming properties of milk. Food Res. Int. 41, 623–629. 435
Levy, M.C.N., 2003. The effects of composition and processing of milk on foam 436
characteristics as measured by steam frothing. Interdep. Progr. Anim. Dairy Sci. Louisiana 437
State University, Baton Rouge, USA. 438
Mahlich, G.C., Borgmann, M., 1989. Espresso machine with cappuccino making 439
attachment. US Patent 4800805. 440
Malysa, K., 1992. Wet foams: Formation, properties and mechanism of stability. Adv. 441
Colloid Interface Sci. 40, 37–83. 442
Marinova, K.G., Basheva, E.S., Nenova, B., Temelska, M., Mirarefi, A.Y., Campbell, B., 443
Ivanov, I.B., 2009. Physico-chemical factors controlling the foamability and foam stability of 444
milk proteins: Sodium caseinate and whey protein concentrates. Food Hydrocoll. 23, 445
1864–1876. 446
Narsimhan, G., 1991. A model for unsteady state drainage of a static foam. J. Food Eng. 447
14, 139–165. 448
Ohl, C.D., OgËœuz, H.N., Prosperetti, A., 2000. Mechanism of air entrainment by a 449
disturbed liquid jet. Phys. Fluids 12. 450
Rodríguez Patino, J.M., Carrera Sánchez, C., Rodríguez Niño, M.R., 2008. Implications of 451
interfacial characteristics of food foaming agents in foam formulations. Adv. Colloid 452
Interface Sci. 140, 95–113. 453

Silva, S., Espiga, A., Niranjan, K., Livings, S., Gumy, J.C., Sher, A., 2008. Formation and 454
stability of milk foams, in: Campbell, G.M., Scanlon, M.G., Pyle, D.L. (Eds.), Bubbles in 455
Food 2: Novelty, Health and Luxury. AACC International, St. Paul, Minnesota, pp. 153–456
161. 457
Stieger, M., Yoakim, A., 2006. Replaceable nozzle for producing a frothed liquid. US 458
Patent 20060230943. 459
Stubaus, L.H., 1994. Cappuccino attachment for an espresso machine. US Patent 460
5330266. 461
Thakur, R.K., Vial, C., Djelveh, G., 2003. Influence of operating conditions and impeller 462
design on the continuous manufacturing of food foams. J. Food Eng. 60, 9–20. 463
Varga, S., Oliveira, A.C., Diaconu, B., 2009. Influence of geometrical factors on steam 464
ejector performance - A numerical assessment. Int. J. Refrig. 32, 1694–1701. 465
Varley, J., 1995. Submerged gas-liquid jets: bubble size prediction. Chem. Eng. Sci. 50, 466
901–905. 467
Waniska, R.D., Kinsella, J.E., 1979. Foaming properties of proteins: evaluation of a 468
column aeration apparatus using ovalbumin. J. Food Sci. 44, 1398–1402. 469
Wilde, P., Mackie, A., Husband, F., Gunning, P., Morris, V., 2004. Proteins and emulsifiers 470
at liquid interfaces. Adv. Colloid Interface Sci. 108-09, 63–71. 471