Embed Size (px)
Citation preview

PRODUCTION OF FUELS AND CHEMICALS FROM BIOMASS-DERIVED OIL AND LARD
A Thesis Submitted to the College of Graduate Studies and Research in partial fulfilment of the requirements for the degree of
Master of Science in the Department of Chemical Engineering
University of Saskatchewan Saskatoon, Saskatchewan
By
Adenike Adebanjo
Copyright Adenike Adebanjo January 2005
All Rights Reserved

ii
COPYRIGHT
The author has agreed that the Libraries of the University of Saskatchewan may
make this thesis freely available for inspection. Moreover, the author has agreed that
permission for extensive copying of this thesis work for scholarly purposes may be
granted by the professor(s) who supervised this thesis work recorded herein or, in their
absence, by the Head of the Department of Chemical Engineering or the Dean of
College of Graduate Studies. Copying or publication or any other use of thesis or parts
thereof for financial gain without written approval by the University of Saskatchewan is
prohibited. It is also understood that due recognition will be given to the author of this
thesis and to the University of Saskatchewan in any use of the material of the thesis.
Request for permission to copy or to make other use of material in this thesis in
whole or parts should be addressed to:
Head
Department of Chemical Engineering
University of Saskatchewan
105 Maintenance Road
Saskatoon, Saskatchewan
S7N 5C5
Canada.

iii
ABSTRACT
Biomass derived oil (BDO) reforming with CO2 was carried out at 800oC under
atmospheric pressure in a tubular fixed bed vertical reactor packed with quartz particles.
The feed gas was a mixture of CO2 and N2 at various compositions with a flow rate of
30 to 60 cm3/min. The BDO flow rate was 5 g/h. The product gas consisted mostly of
H2, CO, CO2, CH4 and C2H4.
The maximum production of synthesis gas (~76 mol%) was observed at a total
carrier gas flow rate of 60 cm3/min and a mole fraction of CO2 in carrier gas of 0.1.
Maximum hydrogen (42 mol%) and H2 to CO molar ratio (1.44) were obtained while
using only N2 as the carrier gas at a flow rate of 50 cm3/min. In the range of residence
time considered, CO2 was not consumed in BDO gasification at 800oC but helped to
increase gas production at the expense of the char.
Pyrolysis of lard was performed to produce a diesel-like liquid and a high heating
value gaseous fuel. Lard was fed into the reactor at 5 g/h using N2 (10-70 cm3/min) as
carrier gas. Two particle size ranges of quartz particles (0.7-1.4 and 1.7-2.4 mm) were
used as reactor packing material. The liquid product essentially consisted of linear and
cyclic alkanes and alkenes, aromatics, ketones, aldehydes and carboxylic acids. The
maximum yield for diesel-like liquid product (37g/100g lard) was obtained at 600oC,
residence time of 1.5 s and packing particle size of 1.7- 2.4 mm. The liquid product
obtained at 600oC, carrier gas flow rate of 50 cm3/min and quartz packing particle size
of 0.7-1.4 mm has a cetane index of 46, specific gravity of 0.86, a heating value of 40
MJ/kg and cloud and pour points of 10 and -18 respectively. The heating value of the

iv
product gas ranged between 68 and 165 MJ/m3. This study shows that there is a potential
for producing diesel-like liquid from pyrolysis of lard. It also identifies the pyrolysis of
animal fats as a source of high heating value gaseous fuel.
Steam reforming of lard was performed at 500, 550, 600 and 800oC and at steam
to lard mass ratios of 0.5 to 2.0. The maximum diesel-like liquid yield from the steam
reforming process (39 g/100g of lard) was obtained at a steam to lard ratio of 1.5 and a
temperature of 600oC. Higher cetane index (52) and lower viscosity (4.0 mPa.s at 40oC)
were obtained by addition of steam. The net energy recovered from pyrolysis and steam
reforming processes were 21.7and 21.9 kJ/g of lard respectively. Thus, the processes are
energy efficient.
In comparison, lard is a better feedstock for the production of hydrogen, char,
high heating value gas and high H2/CO ratio than BDO. On the other hand, BDO is the
preferred feedstock for the production of synthesis gas with H2/CO in the vicinity of 1.

v
ACKNOWLEDGEMENT
I would like to express my sincere appreciation to Prof. A. K. Dalai whose
guidance throughout my graduate program has contributed immensely to the success of
this work. I am also indebted to my co-supervisor Prof. N.N Bakhshi for his guidance,
understanding and the fatherly role he played in the course of this program. My special
thanks go to the remaining members of my advisory committee, Profs. D.Y. Peng and
Hui Wang for their helpful discussions and suggestions.
I am also grateful to Messrs. T. Wallentiny, R. Blondin and D. Cekic of the
Chemical Engineering Department for their technical assistance at various stages of this
work and K. Thoms of Saskatchewan Structural Science Center for his help with the
GC-MS studies. I appreciate the cooperation and useful discussions of Drs. H. K.
Mishra, D. D. Das and M. Kulkani. Many thanks go to my friends (Janny Bos, Bimpe
Akinlade and others) for their understanding, cooperation and support through out the
period of my graduate program. I am especially grateful to my mother, sisters, and
brothers for their enthusiastic support which encouraged me throughout my academic
pursuits. I am also grateful to Dr I. Oguocha, Mr T. Ajala and E. Gikunoo, all of
Mechanical Engineering department and to Crystal Stadnyk of the Information
Technology Services for their useful information and suggestions on the use of MS
Word. The research was made possible by the financial assistance from the Canada
Research Chair program to Prof. A. K. Dalai. Above all, I am grateful to the Almighty
God for His preservation of life, grace and good health towards the completion of this
program.

vi
DEDICATION
This work is dedicated to
My mother, Mrs G.A. Adebanjo

vii
TABLE OF CONTENTS
COPYRIGHT ii
ABSTRACT iii
ACKNOWLEDGEMENT v
DEDICATION vi
TABLE OF CONTENTS vii
LIST OF TABLES x
LIST OF FIGURES xiii
NOMENCLATURE xvii
1. INTRODUCTION 1
1.1 Problem Identification 2 1.1.1 CO2 reforming of biomass derived oil 2 1.1.2 Diesel fuel production from animal fats 3
1.2 Research Objectives 4 1.2.1 CO2 reforming of biomass derived oil 4 1.2.2 Pyrolysis of lard 4 1.2.3 Steam reforming of lard 5
2. LITERATURE REVIEW 6
2.1 Biomass-Derived Oil 6 2.1.1 Production of BDO via pyrolysis of biomass 6 2.1.2 Characterization of BDO 7 2.1.3 Pyrolysis of BDO 7
2.2 Triglycerides Based Fuels 10 2.2.1 Alternative fuels via thermal treatment of triglycerides 12 2.2.2 Mechanism of triglycerides pyrolysis 13
3. EXPERIMENTAL 16
3.1 Pyrolysis and CO2 Reforming of BDO 16 3.1.1 The experimental set-up 16 3.1.2 A typical run 18 3.1.3 Analysis of products 18 3.1.4 Determination of spray pattern into the reactor 19
3.2 Pyrolysis and Steam Reforming of Lard 20 3.2.1 Feed analysis 20 3.2.2 Pyrolysis of lard 21 3.2.3 Steam reforming of lard 21
3.3 Gas Product Analysis 22 3.4 Liquid Product Analysis 22
3.4.1 Gas chromatographic analysis 22

viii
3.4.2 Cetane index 23 3.4.3 Density 23 3.4.4 Distillation range 24 3.4.5 Viscosity 25 3.4.6 Heat of combustion 25 3.4.7 Cloud and pour points 26 3.4.8 Water content 26
4. RESULTS AND DISCUSSION ON CO2 REFORMING OF BDO 27
4.1 Determination of Spray Pattern into the Reactor 27 4.2 Characterization of BDO 29 4.3 Pyrolysis and CO2 Reforming of BDO in a Fixed Bed Reactor 29
4.3.1 Effects of residence time on CO2 reforming of BDO 31 4.3.2 Effects of CO2 concentration in the feed gas on products distribution 35
5. RESULTS AND DISCUSSION ON PYROLYSIS AND STEAM REFORMING OF LARD 42
5.1 Physical and Chemical Properties of Lard 42 5.2 Pyrolysis of Lard 45
5.2.1 GC/MS study 47 5.2.2 Effects of residence time on pyrolysis of lard 47 5.2.3 Effects of quartz packing particle size 53 5.2.4 Effects of temperature on pyrolysis of lard 57 5.2.5 Effects of duration of experiment on product distribution 61
5.3 Steam Reforming of Lard 61 5.3.1 Effects of temperature on steam reforming of lard 63 5.3.2 Effects of steam to lard ratio on steam reforming of lard 65
5.4 Fuel Properties of the Pyrolysis and Steam Reforming Liquid Products 71 5.5 Energy Balance 73 5.6 Comparison of Products from Pyrolysis of BDO and Lard 75
6. CONCLUSIONS AND RECOMMENDATIONS 77
6.1 Conclusions 77 6.1.1 CO2 reforming of biomass derived oil 77 6.1.2 Pyrolysis and steam reforming of lard 78
6.2 Recommendations 80 6.2.1 CO2 reforming of biomass-derived oil 80 6.2.2 Pyrolysis and steam reforming of lard 80
6. REFERENCES 82
APPENDICES 88
Appendix A: Calibration Curves 88 Appendix B: Sample Calculations of Mass Balance 101 Appendix C: Experimental Data 104 Appendix D: Residence Time Calculation 115 Appendix E: Determination of the Heating Value of the Product Gas 115 Appendix F: Compounds Identified and Quantified by GC/MS 117

ix
Appendix G: Simulated Distillation Data 125 Appendix H: Energy Balance Calculation 127

x
LIST OF TABLES
Table 2.1 Physical and chemical properties of biomass-derived oil 8 Table 2.2 Comparison of results obtained for pyrolysis of bio-oil in a fixed bed
reactor at 800oC 11 Table 3.1 Temperature program for the GCs and GC/MS 20 Table 4.1 Viscosity of BDO 30 Table 4.2 CHN analysis of the BDO 30 Table 4.3 Effects of CO2 in the feed gas on products distribution and gas composition (N2 + CO2: 30 cm3/min, BDO: 4.5-5.5g/h, temperature: 800oC, reaction time: 30 min) 37 Table 4.4 Effects of CO2 in the feed gas on products distribution and gas composition (N2 + CO2: 50 cm3/min; BDO: 4.5-5.5g/h; temperature 800oC, reaction time: 30 min) 38 Table 4.5 Effects of CO2 in the feed gas on products distribution and gas composition (N2 + CO2: 60 cm3/min, BDO: 4.5-5.5g/h, temperature: 800oC, reaction time: 30 min) 39
Table 5.1 Physical and chemical properties of the feed (lard) 44
Table 5.2 Reproducibility of results during pyrolysis of lard (N2: 50 cm3/min, quartz particle size: 0.7-1.4 mm, lard: 5g/h, temperature: 550oC) 46 Table 5.3 Distribution of groups (wt%) in the liquid product obtained during lard (~5g/h) pyrolysis 48 Table 5.4 Effects of quartz packing particle size on pyrolysis of lard (N2 flow rate 50 cm3/min (STP), packing particle height 70 mm, lard 5g/h, and temperature 600oC) 56 Table 5.5 Effects of duration of experiment on pyrolysis of lard (N2 flow rate 50 cm3/min (STP), packing particle height 70 mm and size 0.7-1.4 mm, Lard 5g/h, and temperature 600oC) 62 Table 5.6 Comparison of the properties of the optimum liquid obtained to automotive diesel fuel specifications for #2 diesel according to ASTM D975 72

xi
Table 5.7 Summary of the energy balance during pyrolysis and steam reforming of lard 74 Table 5.8 Comparison of products obtained from BDO and lard pyrolysis (temperature: 800oC, quartz packing height: 70mm, size: 1.7-2.4 mm, reaction time: 30 min) 76 Table B-1 Calculation of gas composition and mass during pyrolysis of lard at 600oC and carrier gas flow rate of 50 cm3/min 102 Table B-2 Calculation of gas composition and mass during steam reforming at 600oC and S/L ratio of 1 103 Table D-1 Residence time of reactant during pyrolysis at 600 and 800oC 115 Table E-1 Sample calculation of the product gas heating value for steam reforming experiment at 800oC and S/L of 2 116 Table F-1 Compounds identified in GC/MS for the liquid product obtained during pyrolysis of lard at 500oC, carrier gas flow rate of 30 cm3/min, quartz particles packing height of 70 mm and size 1.7-2.4 mm 117 Table F-2 Compounds identified in GC/MS for the liquid product obtained during pyrolysis of lard at 600oC, carrier gas flow rate of 30 cm3/min, quartz chips packing height of 70 mm and size 1.7-2.4 mm 119 Table F-3 Compounds Identified in GC/MS for the liquid product obtained during pyrolysis of lard at 650oC, carrier gas flow rate of 10 cm3/min, quartz chips packing height of 70 mm and size 1.7-2.4 mm 122 Table F-4 Compounds identified in GC/MS for the liquid product obtained during pyrolysis of lard at 550oC, carrier gas flow rate of 10 cm3/min, quartz particles packing height of 70 mm and size 1.7-2.4 mm 124 Table G-1 Simulated distillation data for the liquid product of lard pyrolysis and steam reforming at quartz chips packing height of 70 mm and size 0.7-1.4 mm 125 Table G-2 Simulated distillation data for the liquid product of lard pyrolysis at quartz chips packing height of 70 mm and size 1.7-2.4 mm 126 Table G-3 Simulated distillation data for the liquid product during steam reforming of lard at quartz chips packing height of 70 mm and size 0.7-1.4 mm 126

xii
Table H-1 Properties of Tristearin 128

xiii
LIST OF FIGURES
Figure 2.1 Structure of a typical triglyceride molecule 11 Figure 2.2 Transesterification of triglycerides with alcohol to alkyl esters 11 Figure 2.3 The proposed mechanisms for thermal decomposition of triglycerides
(Schwab et al., 1988). 15 Figure 3.1 The experimental set-up CO2 reforming of BDO, pyrolysis and steam
reforming of lard 17 Figure 4.1 Spray pattern of BDO (5 g/h) generated by carrier gas 28 Figure 4.2 Effects of residence time on product yield and heating value of product gas (carrier gas N2 only: BDO: 4.5-5.5g/h; temperature 800oC, reaction time: 30 min) 32 Figure 4.3 Effects of residence time on product gas composition (carrier gas N2 only: BDO: 4.5-5.5g/h; temperature 800oC, reaction time: 30 min) 32 Figure 4.4 Effects of residence time on products yield and heating value of product gas (carrier gas CO2 only: BDO: 4.5-5.5g/h; temperature 800oC, reaction time: 30 min) 34 Figure 4.5 Effects of residence time on product gas composition (carrier gas CO2 only: BDO: 4.5-5.5g/h; temperature 800oC, reaction time: 30 min) 36 Figure 5.1 Thermo-Gravimetric/Differential Thermo-Gravimetric plots for lard 44 Figure 5.2 GC/MS Chromatogram for the pyrolysis liquid obtained at a temperature of 550oC, carrier gas flow rate of 10 cm3/min and quartz height of 70 mm and particle size of 1.7-2.4 mm 49 Figure 5.3 Effects of residence time on volume and heating value of product gas (process: pyrolysis, temperature: 600oC, quartz packing height: 70 mm, size: 1.7-2.4 mm, reaction time: 30 min) 51 Figure 5.4 Effects of residence time on total and diesel-like yields (process: pyrolysis, temperature 600oC, quartz packing height 70mm, size 1.7-2.4 mm, reaction time 30 min) 51

xiv
Figure 5.5 Effects of residence time on cetane index and viscosity of the total liquid product (process: pyrolysis, temperature 600oC, quartz packing height 70mm, size 1.7-2.4 mm, reaction time 30 min) 52 Figure 5.6 Effects of residence time on products gas composition (process: pyrolysis, temperature 600oC, quartz packing height 70mm, Size 1.7-2.4 mm, reaction time 30 min) 52 Figure 5.7 Effects of residence time on products gas composition (process: pyrolysis, temperature 800oC, quartz packing height 70mm, size 1.7-2.4 mm, reaction time 30 min) 54 Figure 5.8 Effects of temperature on volume and heating value of products gas (process: pyrolysis, carrier gas N2: 50 cm3/min, quartz packing height 70mm, Size 0.7-1.4 mm, reaction time 30 min) 58 Figure 5.9 Effects of temperature on total and diesel-like liquid yields (process: pyrolysis, carrier gas N2: 50 cm3/min, quartz packing height: 70mm, size: 0.7-1.4 mm, reaction time: 30 min) 58 Figure 5.10 Effects of temperature on products gas composition (process: pyrolysis, carrier gas N2: 50 cm3/min, quartz packing height 70mm, size 0.7-1.4 mm, reaction time 30 min) 60 Figure 5.11 Effects of temperature on cetane index and viscosity of the total liquid
product (process: pyrolysis, carrier gas N2: 50 cm3/min, quartz packing height 70mm, size 0.7-1.4 mm, reaction time 30 min) 60
Figure 5.12 Comparison of the effects of temperature on gas and liquid yields of pyrolysis (carrier gas N2: 50 cm3/min) and steam reforming (S/L :1, quartz packing height 70mm, size 0.7-1.4 mm, reaction time 30 min) 64 Figure 5.13 Effects of temperature on total and diesel-like liquid yields (process: steam reforming, S/L: 1, quartz packing height: 70mm, size: 0.7-1.4 mm, reaction time: 30 min) 66 Figure 5.14 Effects of temperature on cetane index and viscosity of the total liquid product (process: steam reforming, S/L: 1, quartz packing height: 70mm, size: 0.7-1.4 mm, reaction time: 30 min) 66 Figure 5.15 Effects of steam to lard mass ratio (S/L) on products yield (process: steam reforming, temperature 600oC, quartz packing height 70mm, size: 0.7-1.4 mm, reaction time: 30 min) 67 Figure 5.16 Effects of steam to lard mass ratio (S/L) on product gas composition (process: steam reforming, temperature 600oC, quartz

xv
packing height: 70 mm, size: 0.7-1.4 mm, reaction time: 30 min) 67 Figure 5.17 Effects of steam to lard mass ratio (S/L) on total and diesel-like liquid
yields (process: steam reforming, temperature 600oC, quartz packing height: 70mm, size: 0.7-1.4 mm, reaction time: 30 min) 69
Figure 5.18 Effects of steam to lard mass ratio (S/L) on cetane index and viscosity of
the total liquid product (process: steam reforming, temperature 600oC, quartz packing height: 70mm, size: 0.7-1.4 mm, reaction time: 30 min) 69
Figure 5.19 Effects of steam to lard mass ratio (S/L) on products yield (process: steam reforming, temperature 800oC, quartz packing height: 70 mm, size: 0.7-1.4 mm, reaction time: 30 min) 70 Figure 5.20 Effects of steam to lard mass ratio (S/L) on product gas composition (process: steam reforming, temperature 800oC, quartz packing height: 70 mm, size: 0.7-1.4 mm, reaction time: 30 min) 70 Figure 5.21 Comparison of the simulated distillation curves of the optimum liquid
products obtained to that of #2 diesel 72 Figure A-1 Temperature profile in the reactor 88 Figure A-2 Temperature Controller Calibration 88 Figure A-3 Calibration of Eldex A-10-S pump for BDO 89 Figure A-4 Calibration of mass flow meter (SN 70327) for nitrogen at STP 89 Figure A-5 Calibration of mass flow meter (SN 70328) for CO2 at STP 90 Figure A-6 Calibration of GC 5890 for Hydrogen 90 Figure A-7 Calibration of GC 5890 for Carbon dioxide 91 Figure A-8 Calibration of GC 5890 for Carbon monoxide 91 Figure A-9 Calibration of Carle GC for methane 92 Figure A-10 Calibration of Carle GC for propylene 92 Figure A-11 Calibration of Carle GC for ethylene 93 Figure A-12 Calibration of Carle GC for ethane 93 Figure A-13 Calibration of Carle GC for propane 94

xvi
Figure A-14 Calibration of Carle GC for isobutene 94 Figure A-15 Calibration of Carle GC for 1-butene 95 Figure A-16 Calibration of Carle GC for n-butane 95 Figure A-17 Calibration of Carle GC for cis/trans-butene 96 Figure A-18 Calibration of GC 5880 for methane 96 Figure A-19 Calibration of GC 5880 for ethylene 97 Figure A-20 Calibration of GC 5880 for ethane 97 Figure A-21 Calibration of GC 5880 for propylene 98 Figure A-22 Calibration of GC 5880 for propane 98 Figure A-23 Calibration of GC 5880 for 1-butene 99 Figure A-24 Calibration of GC 5880 for isobutene 99 Figure A-25 Calibration of GC 5880 for n-butane 100 Figure A-26 Calibration of GC 5880 for cis/trans butene 100

xvii
NOMENCLATURE
amu atomic mass unit
CI Cetane index
i.d. Internal diameter (mm)
G specific gravity at room temperature
MSDS Material Safety Data Sheet
NIST National Institute of Standard and Technology
T50 mid boiling temperature (oC)

1
1. INTRODUCTION
The massive energy crunch triggered by the 1973 oil price hike led to the revival
of interest in non-conventional and renewable energy sources worldwide. Thus, along
with the solar and the wind energy, the long neglected but potentially rich biomass
became the focus of intensive utilisation for energy generation (Robertson, 1981). The
increase in greenhouse gas emissions and the resulting climatic changes have
understandably caused worldwide concern. According to an assessment by the
Intergovernmental Panel on climate change (Watson, 2001); the rise in the average
temperature by the end of the next century, i.e., 2100 will be between 1 - 3.5oC. This has
serious implications on the entire ecosystem. This fact has led to a series of initiatives at
the international level to develop eco-friendly alternatives that would meet the needs of
the present generation without compromising the abilities of future generations. This
calls for urgent measures for minimizing, if not replacing, the reliance on fossil fuels to
meet the increasing energy requirements. Therefore, the non-conventional renewable
sources of energy have become the focus of research.
Wood and other forms of biomass are one of the main renewable energy sources
available and provide liquid, solid and gaseous fuels. The global potential of primary
biomass (in about 50 years) is very broad, quantified at 33-1135*1015Jy-1 (Hoogwijk et
al, 2003). But for biomass to effectively compete with fossil fuel there is need to explore
more economic sources of biomass. Biomass waste is really cheap; in fact millions of
dollars are used for its disposal annually. It is therefore of great interest to present one of

2
the possibilities of converting these problematic wastes into ecologically friendly fuels.
The use of biomass as fuels help to reduce the greenhouse gas emission because the CO2
released during combustion or conversion of biomass to chemicals is that removed from
the environment by photosynthesis during the production of the biomass (i.e. plant
growth).
1.1 Problem Identification
The initial objective of this research was to maximize the consumption of CO2 in
biomass-derived oil (BDO) reforming to syn-gas and other value added chemicals. This
objective was coined from an earlier study on BDO gasification in CO2/N2 environment
(Panigrahi, 2003). In that study, it was observed that there was a significant decrease in
the mole fraction of CO2 in the product gas due to increase in the mole fraction of CO2
in the feed gas. However, in this present research, it was observed that increasing CO2 in
the feed rather increased its mole fraction in the product gas.
From this observation, the focus of the research was changed. Another feed stock
was considered for the second phase. The justifications for considering these two phases
are explained below.
1.1.1 CO2 reforming of biomass derived oil
At present, technologies exist to pyrolyse biomass to produce a liquid product,
namely, biomass-derived oil (BDO). But this BDO is quite unstable. Its physical
properties have been shown to change over time (Adjaye et al, 1992; Meier et al., 1997).
Therefore there is need to convert it to more stable fuels and chemicals such as syn-gas.
Syn-gas plays an important role as intermediate in the production of several industrial

3
products such as Fischer-Tropsch liquids, methanol, and ammonia (Bharadwaj and
Schmidt, 1995).
Greenhouse gases such as CO2 in the atmosphere decrease the escape of
terrestrial thermal infrared radiation. With the industrial growth, the burning of coal, oil
and natural gas keeps increasing, and thus results in increased quantities of CO2 released
into the atmosphere (Rathi, 1994). Increasing CO2 release into the atmosphere definitely
caused an increase in radiative energy retained within the atmosphere. CO2 reforming
(Snoeck and Froment, 2002), has been proposed as a promising technology because of
the use of the greenhouse gas CO2. By using CO2 in BDO reforming to value added
products, an increased sink is found for the greenhouse gas.
1.1.2 Diesel fuel production from animal fats
Saskatchewan’s livestock industries continue to grow and expand at a
competitive rate with the rest of the nation. According to a release from Statistics
Canada in July 2004, Saskatchewan now contributes 28.1 % of the Canadian beef cow
head (Russell and Cannon, 2004). Also, pork production continues to increase as more
hog production facilities are built throughout the province. Because meats cannot be
produced without the simultaneous production of fat, a large amount of animal fat is
unavoidably produced in the process of supplying meat.
Formerly, about 80% of the global animal fats production was consumed by
humans (Gunstone, year unknown) but because of the health problems associated with
the overuse of saturated fat in the diet, this percentage has fallen (Sanford and
Allshouse, 1998). Also due to the recent bovine spongiform encephalopathy (BSE)
crisis, the use of animal derived products to feed cattle is now severely restricted (Chaala

4
and Roy, 2003). This implies that a huge amount of animal fat is unavoidably available
as waste.
Using animal fat as fuel could help to solve the problem of waste disposal
(Wiltsee, 1998). The transesterification process for the production of biodiesel from
vegetable oils is not very efficient with animal fats (GOE, 1999) due to high water
content and free fatty acids. Pyrolysis is more efficient in converting animal fats into
diesel fuel (Zhenyi et al, 2004).
In this present investigation, lard was used as a representative feed material for
animal fats. The choice of lard was based on the fact that it is readily available in a pure
form. Lard is a waste product of pork production. It is produced from the fatty or
otherwise unusable parts of pig carcasses.
1.2 Research Objectives
1.2.1 CO2 reforming of biomass derived oil
The intent here was to investigate the role of CO2 in BDO reforming to syn-gas
and gaseous fuels and to maximize the consumption of CO2. The experiments were
conducted at 800oC in a fixed bed reactor based on earlier studies (Panigrahi, 2003). The
mole fraction of CO2 in N2 was varied from 0 to 1 and the total gas flow rate was varied
from 30 to 60 cm3/min (STP).
1.2.2 Pyrolysis of lard
The aim here was to optimise the production of diesel-like liquid from lard
pyrolysis. The possibility of producing syn gas from lard at higher temperature was also
investigated. The reaction temperature was varied from 500 to 800oC while the carrier

5
gas (N2) flow rate was varied from 10 to 70 cm3/min. These experiments were conducted
in the same fixed bed reactor used for CO2 reforming of BDO.
1.2.3 Steam reforming of lard
In this stage, the role of steam in pyrolysis of lard was investigated. The
experiments were conducted in the temperature range of 500 to 800oC. The aim was to
further optimize the diesel-like liquid production and to improve on syn gas production.
The properties of the total liquid products obtained for lard pyrolysis and steam
reforming such as density, viscosity, cetane index and heating value were determined
using standard methods used for characterizing diesel fuel. These properties were
compared to that of the conventional diesel fuel.

6
2. LITERATURE REVIEW
This section reviews studies on thermal treatment of biomass-derived oil (BDO)
and animal fat. Emphasis is placed on BDO preparation, characterization, pyrolysis and
CO2 reforming and fats and oils pyrolysis, and reaction pathway.
2.1 Biomass-Derived Oil
2.1.1 Production of BDO via pyrolysis of biomass
The pyrolysis of biomass is a thermal treatment which results in the production
of char, liquid and gaseous products. Pyrolysis is the general term to describe the
process whereby organic material is heated essentially in the absence of oxidizing agents
(Diebold and Bridgwater, 1997). Biomass conversion into oil and gas has been achieved
by thermo-chemical technologies such as vacuum pyrolysis, fast pyrolysis, flash
pyrolysis and gasification.
Fast pyrolysis has made significant advances in the past 20 years (Scott et al.,
1985; Graham et al., 1988; Diebold and Scahill, 1988; Janse et al., 1997). It requires
rapid heating of biomass to temperatures between 450 and 550°C and short residence
times of 0.5 to 1 second of the volatile vapors in the reaction zone in order to prevent
secondary cracking. In such conditions the yield of the liquid product (BDO) can reach
up to 80 wt% (Piskorz et al. 1988).

7
2.1.2 Characterization of BDO
Analysis and characterisation of liquids from fast pyrolysis processes is an
important area of research. Data on the physical and chemical properties of the liquids
provide important indications about process parameter, quality, toxicity and stability of
the BDO (Meier et al., 1997). BDO is a mixture of simple aldehydes, alcohols, and acids
as well as more complex carbohydrate and lignin-derived oligomeric materials
emulsified with water (Bighelli et al., 1994; Milne et al., 1997; Sipila et al., 1998). Its
physical properties have been shown to change over time and also depend on the nature
of biomass used (Adjaye et al., 1992; Meier et al., 1997). Table 2.1 gives a list of the
physical and chemical properties of the BDO used in this research as obtained from
DynaMotive Energy Systems Corporation, Vancouver.
2.1.3 Pyrolysis of BDO
Due to instability of BDO, it is necessary to recover valuable chemicals from it.
One of the methods of converting BDO to value added chemicals is pyrolysis. Only a
few studies have been carried out on pyrolysis of BDO. In their work, Panigrahi et al.
(2002) used a fixed bed micro reactor for thermo-chemical conversion of BDO to syn-
gas and medium heating value gaseous fuels. They found that the conversion of BDO
was increased from 57 to 83 wt% as the reactor temperature increased from 650 to
800oC at a nitrogen (carrier gas) flow rate of 30 cm3/min. The heating value of the
product gases ranged between 49-64 MJ/Std.m3. The volume of the product gas also
increased from 73 to 104 L/100g of BDO with increase in reaction temperature from 650
to 800oC. They concluded that by adjusting the parameters such as inert gas flow rate

8
Table 2.1 Physical and chemical properties of biomass-derived oil (DynaMotiveTM, 1999)
Physical properties pH 2.4 Solids content, wt% <0.10 Ash content, wt% <0.02 Density, g/cm3 1.2 Heating value, MJ/kg 16.4 Kinematic Viscosity @20ºC, cSt 40 Kinematic Viscosity @80ºC, cSt 6
Chemical composition (wt%) Water 23.4 Methanol insolvable solids 24.9 Cellubiosan 1.9 Glyoxal 1.9 Hydroxyacetaldehyde 10.2 Levoglucosan 6.3 Formaldehyde 3.0 Formic acid 3.7 Acetic acid 4.2 Acetol 4.8

9
and the reactor temperature, the composition of the product gas can be tuned in the
desired direction.
In another work by Panigrahi et al. (2003), syn-gas was produced by steam
gasification of BDO while still using N2 as the carrier gas. A similar experiment was
carried out using mixture of CO2 and N2, and H2 and N2. They found that the conversion
of BDO was decreased from 75 to 68 wt% at 800oC with addition of CO2 by 40 % in
nitrogen as a carrier gas. The gas product consisted of H2, CO, CO2, CH4, C2, C3 and C4+
hydrocarbons. The total volume of gas increased with increase in CO2 percentage in
carrier gas. They concluded that syn-gas production can be improved by increasing the
percentage of CO2 in the carrier gas. The conversion of BDO increased from 67 to 81
wt% with steam whereas it was unaffected with H2.
In the report prepared for a bio-energy development program, Chaudhari and
Bakhshi (2002) also studied pyrolysis of BDO with and without steam using N2 and He
as the carrier gas in a fixed bed reactor. Conversion of 89.4 % was obtained at 800oC for
pyrolysis in the presence of steam and the gas product had a heating value of 37 - 48 MJ/
m3. Also the gas product contained a large amount of light hydrocarbons. With pyrolysis
in the absence of steam, they carried out the experiments in the temperature range of
650-800oC, BDO flow rate of 4 g/h and N2 flow rate of 50 cm3/min. They observed that
the conversion increased from 70 to 77 wt% as the reaction temperature increased from
650 to 700oC and then gradually decreased to 71 wt% with an increase in temperature
from 700oC to 800oC. This slightly differs from the report by Panigrahi et al. (2002)
where conversion was found to increase with temperature from 650 to 800oC. The
volume of the product gas increased from 29.7 mL to 46.5 mL/100g of BDO. This
agrees well with the work of Panigrahi et al. (2002). The heating value of the product

10
gases ranged between 35 and 60 MJ/Std.m3, slightly lower than those by Panigrahi et al.
(2002). This might be due to different residence times used for the two studies. A
comparison of the results obtained for a run at 800oC by Chaudhari and Bakhshi (2002)
and Panigrahi et al. (2002) is given in Table 2.2. The ratio of H2 to CO for Chaudhari
and Bakhshi (2002) was about 1:2 whereas that of Panigrahi et al. (2002) was 2:1. The
mole percent of H2, CO, C2H4 and C2H6 produced by Chaudhari and Bakhshi (2002)
were significantly different from that of Panigrahi et al. (2002). For the other gases such
as CO2, CH4, C4+, C3H6 and C3H8, the quantities produced were comparable.
2.2 Triglycerides Based Fuels
Fats and oils are composed of molecules called triglycerides. Each triglyceride is
composed of three long-chain fatty acids of 8 to 22 carbons attached to a glycerol
backbone. The structure of a typical triglyceride is shown in Figure 2.1 Although
triglycerides can fuel diesel engines, their high viscosities, low volatilities and poor cold
flow properties have led to the investigation of various derivatives (Srivastava and
Prasad, 2000). Dilution, micro emulsification, pyrolysis and transesterification are the
four techniques applied to solve the problems encountered with the high fuel viscosity
(Karaosmonoglu, 1999). Dilution with solvents and micro emulsification lowers the
viscosity, but some engine performance problems still exist (Demirbas, 2003). The
transesterification process converts triglycerides to fatty acids alkyl esters called
biodiesel (Figure 2.2). The oils or fats used in transesterification should be substantially
anhydrous (≤ 0.06% w/w) and free of fatty acids (>0.5% w/w) (Ma and Hanna, 1999).
This implies high cost of raw material.

11
Table 2.2 Comparison of results obtained for pyrolysis of bio-oil in a fixed bed reactor at 800oC (Chaudhari and Bakhshi, 2002 and Panigrahi et al., 2002)
Component mol% (Panigrahi et al., 2002)* mol% (Chaudhari and Bakhshi,
2002)** H2 43.8 14.5 CO 18.7 27.6 CO2 5.1 5.8 CH4 20.4 20.4 C2H4 6.9 22.2 C2H6 0.3 2.9 C3H6 0.3 1.3 C3H8 0.2 0.0 C4+ 4.4 5.3
Total 99.9 100 * Nitrogen flow (54mL/min) ** Nitrogen flow (50mL/min)
3422722
37272
31622
)()(
)()(
)(
CHCHCHCHCHCHCHCOOCH
CHCHCHCHCHCOOCH
CHCHCOOCH
l
l
==−−−
=−−−
−−−
Figure 2.1 Structure of a typical triglyceride molecule
RCOOROHCHRCOOCH
RCOOROHCHOHRRCOOCH
RCOOROHCHRCOOCH
l
Catalyst
l
ll
′−−−−−
′−+−⎯⎯⎯ →←′+−−−
′−−−−−
3232
22
1212
3
Figure 2.2 Transesterification of triglycerides with alcohol to alkyl esters
Triglyceride Ester Alcohol Glycerol

12
The cost of raw materials accounts for 60 to 75% of the total cost of biodiesel
fuel (Krawczyk, 1996). Pyrolysis is an efficient way of producing less expensive
alternative diesel fuel from lower quality raw materials such as waste fryer grease
(Zhenyi et al., 2004) and especially animal fats in which high levels of free fatty acids
and water negatively affect the yield of biodiesel from its transesterification (Ma et al.,
1998).
2.2.1 Alternative fuels via thermal treatment of triglycerides
Considerable research has been done on pyrolysis of vegetable oils to produce
chemicals and diesel-like fuel (Alencer et al.,1983; Schwab et al., 1987; Idem et al.,
1996; Lima et al., 2004). These studies were carried out using oils extracted from
soybean, castor, palm tree, babassu, pequi and canola. The studies included the effects of
temperature on the type of products obtained, effects of co-feeding steam and the
characterization of the gas and liquid products. Some of these studies were conducted in
batch and fixed-bed flow reactors whereas others were conducted in a standard ASTM
distillation apparatus in which case, cracking and distillation occur simultaneously in the
same unit. Different types of vegetable oils produce large differences in the composition
of the thermally decomposed oil. Chemicals such as alkanes, alkenes, alkadienes,
aldehydes, ketones, aromatics and carboxylic acids were found in the products.
The properties of the liquid fractions of the thermally decomposed vegetable oil are
similar to those of diesel fuels. For example, pyrolysed soybean oil contains 79% carbon
and 11.88% hydrogen, has low viscosity and a high cetane number compared to pure
vegetable oils. The cetane number of pyrolysed soybean oil is enhanced to 43 from 37.9.
Its viscosity is reduced to 10.2 from 32.6 mm2/s at 38°C (Schwab et al., 1987). But it

13
exceeds the specified value of 7.5 mm2/s for diesel fuel. The pyrolysed vegetable oils
possess acceptable amounts of sulphur, water and sediment and give acceptable copper
corrosion values but unacceptable ash, carbon residue amounts and pour point.
Pyrolysis, assisted by solid catalysts, has also been reported (Dandik and Aksoy,
1998, Prasad et al., 1986, Katikaneni et al., 1998) and it was noted that the product
selectivity is strongly affected by the presence and nature of heterogeneous catalysts.
The liquid product however is similar to gasoline. Marquevich et al. (2000) studied the
production of hydrogen by catalytic steam reforming of sunflower oil. The study was
performed in a fixed bed reactor with a commercial nickel based catalyst for steam
reforming naphtha. Sunflower oil was completely converted to hydrogen, methane and
carbon oxides, except for the runs performed at the lowest temperatures and a steam to
carbon ratio (S/C) of 3. The hydrogen yield ranged from 72% to 87% of the
stoichiometric potential, depending on the S/C and the catalyst temperature.
Pyrolysis of animal fats however, has not been studied to the same extent as
vegetable oils. Green Oasis EnviroEconomics Inc. (1999) employed a one-step process
of thermal cracking and distillation to convert animal tallow into a diesel-like product
having a flash point of 60oC, perfect distillation curve, and a pour point of -28oC.
2.2.2 Mechanism of triglycerides pyrolysis
The variety of reaction path and intermediates makes it difficult to describe the
reaction mechanism of triglycerides. Besides, the multiplicity of possible reactions of
mixed triglycerides make pyrolysis reaction more complicated (Schwab et al., 1988).
According to Alencer et al. (1983), formation of homologous series of alkanes and
alkenes is accountable from the generation of the RCOO radical from the triglyceride

14
cleavage and subsequent loss of carbon dioxide. The R radical, upon disproportionation
and ethylene elimination, gives the odd-numbered carbon alkanes and alkenes. The
presence of double bond in the triglyceride molecule enhances cleavage at a position β
to the unsaturation (see Figure 2.3). The formation of aromatics is supported by a Diels–
Alder addition of ethylene to a conjugated diene formed in the pyrolysis reaction. Their
mechanism was based on that originally proposed by Chang and Wan (1947). In
addition to the possible reaction pathways explained above, Chang and Wan (1947) also
proposed that alkynes are formed from alkene decomposition. The reaction mechanism
in Figure 2.3 was proposed by Schwab et al. (1988). This mechanism is actually a
simplified form of that proposed by Chang and Wan (1947).
Idem et al. (1996) also proposed further mechanisms that account for the
formation of other observed compounds. According to them, elimination of heavy
oxygenated hydrocarbons as esters, carboxylic acids, ketones and aldehydes are
dominant step in the cracking reactions of triglycerides and begins at 240 – 300°C for
vegetable oils. CO2 is formed from the decarboxylation of saturated and unsaturated
carboxylic acids while CO is produced by the decarbonylation of oxygenated
hydrocarbons. Hydrogen is produced by formation of cycloolefins and aromatics,
polymerisation of olefins and aromatics, polycondensation of triglyceride, splitting of
hydrocarbons and dehydrogenation of olefins. Char is formed by decomposition of long-
chain hydrocarbon radicals, polymerisation of olefins and aromatics, polycondensation
of triglyceride and heavy oxygenated hydrocarbons and dehydrogenation of aromatics.
Heavy hydrocarbons are produced by polymerisation and polycondensation reactions.

15
CH3(CH)5CH2-CH2CH=CHCH2-CH2(CH2)5CO-O-CH2R
CH3(CH2)5CH2-CH2CH=CHCH2-CH2(CH2)5CO-OH
CH2=CHCH=CH2
CH3(CH2)3CH2. + CH2=CH2Diels-Alder
-H2
CH3(CH2)5CO-OH
CH3(CH2)5CH2.
-CO2
CH3(CH2)4CH3CH3(CH2)3CH3
H
.CH2(CH2)5CO-OH
beta position beta position
H
Figure 2.3 The proposed mechanisms for thermal decomposition of triglycerides (Schwab et al., 1988).
Zhenyi et al. (2004) showed by thermodynamics calculation that the initial
decomposition of vegetable oils occurs with the breaking of C-O bond at lower
temperature (< 400oC). At this temperature, fatty acids are the main products. They
further advised that in order to get maximum yield of diesel fraction, the pyrolysis
temperature should be higher than 400oC.
From the literature review, no study has been done on pyrolysis of lard. The
proposed mechanisms as shown in Figure 2.3 were based on pyrolysis products of
vegetable oils such as soybean, canola and safflower. No such mechanism has been
proposed for studies on animal fats. Also, Panigrahi (2003) did not consider the use of
pure CO2 in BDO reforming.

16
3. EXPERIMENTAL
This chapter describes the experimental design and procedures for CO2
reforming of biomass derived oil (BDO), pyrolysis of lard, steam reforming of lard and
the analysis and characterization of the reaction products.
3.1 Pyrolysis and CO2 Reforming of BDO
The BDO used for this study was obtained from DynaMotive Energy Systems
Corporation, Vancouver, Canada where it was produced by fast pyrolysis technology of
wood. The BDO was mixed thoroughly before any sample was taken for analysis or for
the experiment. This was done to ensure uniformity of sample.
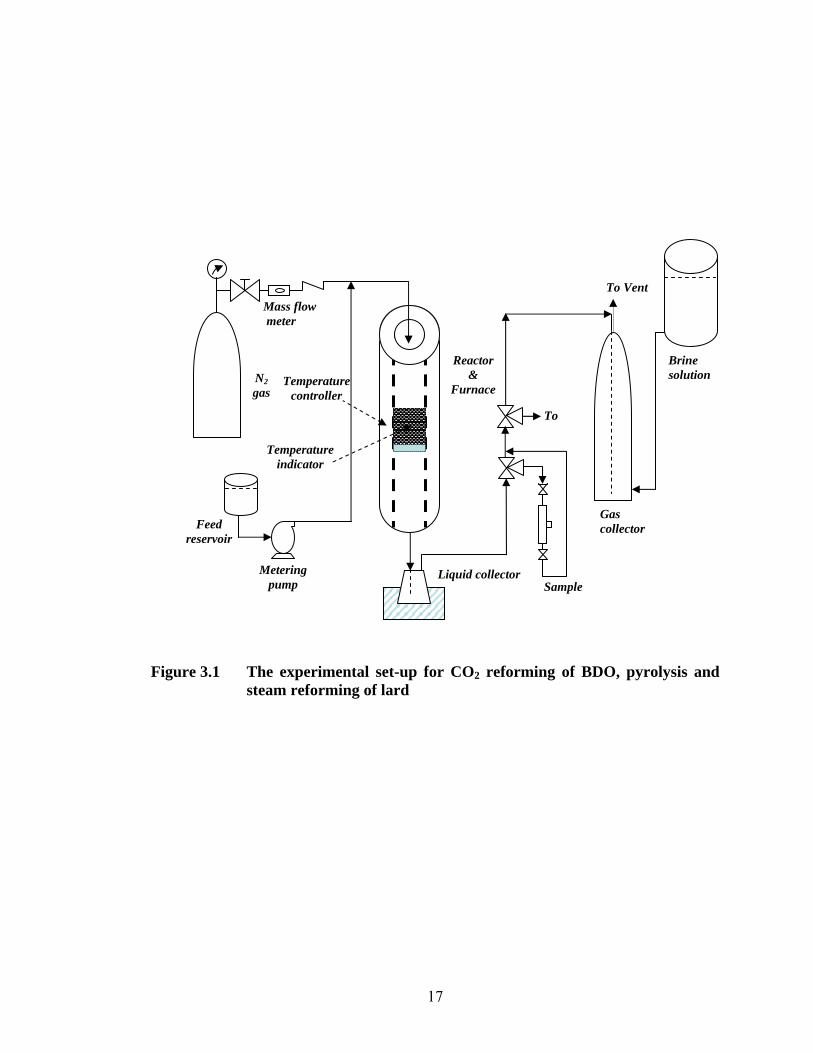
3.1.1 The experimental set-up
The experiments were conducted at atmospheric pressure in a continuous down
flow fixed-bed micro reactor operated at 800oC. The experimental set up is shown in
Figure 3.1. The reactor was a 310 mm long, 10 mm i.d. Inconel® alloy tube placed co-
axially in a furnace. Quartz particles (5g, 1.7-2.4 mm size), with a height of 70 mm in
the reactor, were held on a plug of quartz wool placed on a supporting mesh inside the
micro reactor. The reactor was heated by a furnace with temperature controlled by a
series SR22 microprocessor-based autotuning PID temperature controller (Shimaden Co.
Ltd., Tokyo, Japan) using a K-type ( ~2.5 mm diameter) thermocouple placed on the
furnace side of the annulus between the furnace and the reactor. A calibration of the
17
Figure 3.1 The experimental set-up for CO2 reforming of BDO, pyrolysis and
steam reforming of lard
Feed reservoir
Brine solution
Metering pump
Reactor &
Furnace
To Vent
Temperature controller
Temperature indicator
To
Gas collector
SampleLiquid collector
N2 gas
Mass flow meter

18
temperature profile in the reactor at different furnace temperatures was done (Figures A-
1 and A-2, Appendix A). BDO was introduced into the reactor using an Eldex (Model
A-10-S) metering pump (see calibration curve in Figure A-3, Appendix A) at the rate of
5g/h. The desired flow rate of the gases (CO2 and/or N2) was maintained by using mass
flow meters (Top-trak model 822, Sierra Instrument Inc. California, USA). The
calibrations of these mass flow meters for N2 and CO2 are given in Figures A-4 and A-5,
respectively (Appendix A). The liquid products were collected with the help of a
condenser attached at the bottom of the reactor outlet. The gaseous products were
collected in a gas collector by the downward displacement of brine solution of NaCl.
3.1.2 A typical run
In a typical experiment, the reactor was cleaned, dried, packed with quartz
particles, weighed and mounted inside the furnace. Nitrogen was allowed to flow
through the set up at ~ 10 cm3/min while the reactor was been heated up. After attaining
the desired operating temperature (a period of about 60 minutes), the flows of BDO and
CO2 were started while that of N2 was increased to the desired rate. BDO was fed at a
fixed rate of 5 g/h and each experiment was run for 0.5 h. After the completion of a run,
the flow of N2 was allowed to run for an additional 10 minute to clear the line. The
reactor was then cooled and weighed to determine the amount of retained products
(char). The condensate was also weighed.
3.1.3 Analysis of products
The product gas was analyzed for its composition using two GCs (Hewlett
Packard 5890 series II and Carle GC-500 series). The Hewlett Packard 5890 II was

19
equipped with a thermal conductivity detector (TCD) and CarboSieve S II column (3000
mm, 3.18 mm i.d.) and it analysed H2, CO, CO2 and CH4, whereas the Carle GC
equipped with a flame ionization detector and a capillary column was used to analyse for
hydrocarbons. The programs used in the GCs are given in Table 3.1. The calibrations of
the GCs for the gases are given in Figures A-6 to A-17, Appendix A). Standard gas
mixtures were used for the calibration. After normalization of the components, the
weight of the gas product was calculated from the moles of the components and the total
volume of gas evolved during the run (see Appendix B). The condensate was not
analysed.
3.1.4 Determination of spray pattern into the reactor
For effective cracking of the feed, it is necessary to have the feed introduced into
the reactor as fine droplets. This is one of the functions of the carrier gas. In order to
have an approximate idea of what the spray pattern will be into the reactor, a study was
done on the feed line to the reactor at two carrier gas temperatures (25 and 50oC) and
flow rates (30 and 60 cm3/min). The BDO flow rate was kept constant at 5g/h. The BDO
was not heated directly because of its tendency to polymerize at high temperature when
exposed to air. The carrier gas was used to spray the feed (BDO). The spray patterns at
different carrier gas temperatures and flow rates were obtained (in 30 seconds) on white
papers placed at a distance of approximately 2 cm below the discharge point. The papers
were allowed to dry in a fume hood overnight as BDO has a pungent smell. The droplet
sizes of the sprays were then measured approximately with a scale.

20
Table 3.1 Temperature program for the GCs and GC/MS GC HP 5890 Carle GC-500 GC/MS SDGC Initial temperature oC 40 40 40 40 Initial hold time, min 0 3 5 5 Heating rate, oC/min 12 10 10 10 Final temperature, oC 200 200 250 300 Final hold time, min 1 2 15 5 Detector temperature, oC 250 250 280 400
3.2 Pyrolysis and Steam Reforming of Lard
3.2.1 Feed analysis
The lard used in this study was produced by Sobeys in Toronto, and was
obtained from a retail outlet. The elemental analysis of the lard was performed on a
CHN analyser (Perkin Elmer 2400). Traces of nitrogen known to be present in animal
fats could not be detected by the CHN analyzer. Therefore, the ANTEK 9000
Combustion analyzer coupled to an ANTEK 738 Robotic Auto-sampler was used to
analyze for sulphur and nitrogen. The wt% of O2 in the lard was obtained by difference.
The lard’s fatty acid composition was determined by POS Pilot Plant Corporation,
Saskatoon, using gas chromatography. This was done by converting the fatty acids in the
lard to their corresponding methyl esters and analyzing the resultant liquid with GC
equipped with DB-FFAP column and flame ionization detector. The determination was
according to AOCS standard method Ca 5a-40 (1997).
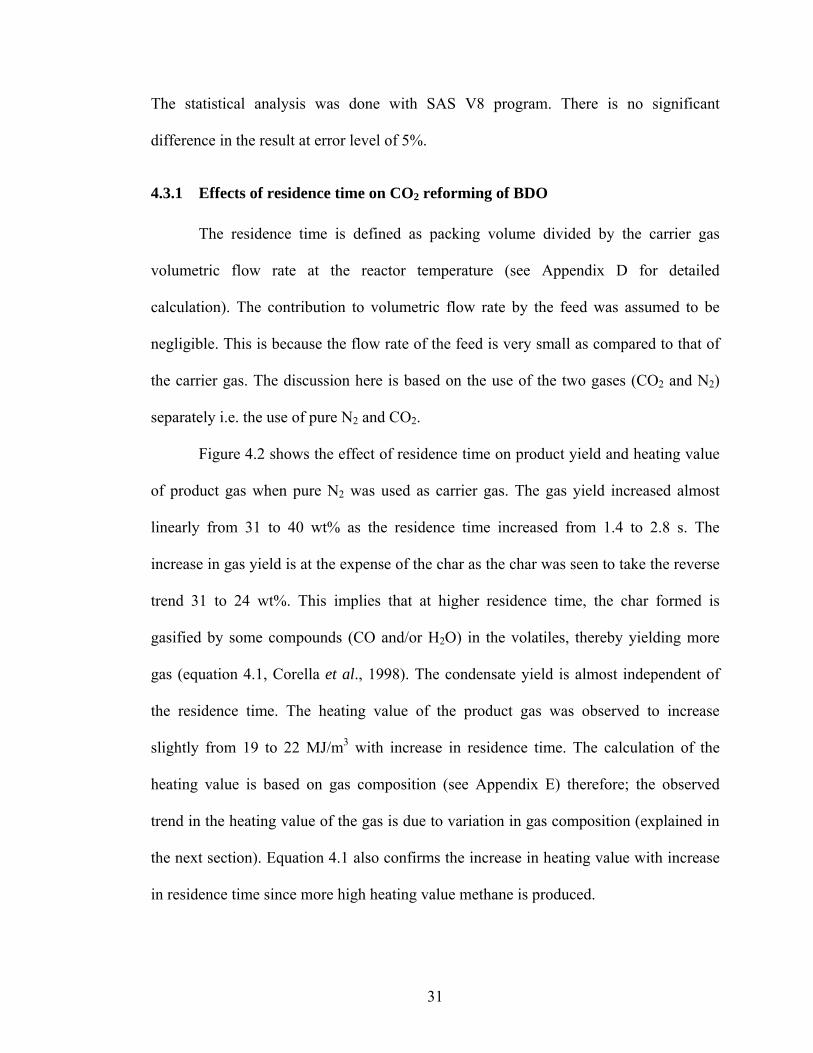
In order to determine a reasonable temperature at which significant pyrolysis can
occur, a TG/DTA analysis of the lard was done to estimate its boiling point. The analysis
was done by Perkin Elmer Pyris Diamond TG/DTA by Seiko Instrument Inc. About 10
mg of lard was placed in the sample pan inside the analyzer. The analyzer read the

21
weight of the sample automatically. The sample was heated in flowing nitrogen (10
cm3/min) from 40 to 800oC with a heating rate of 10oC/min.
3.2.2 Pyrolysis of lard
The reactor set-up used for the BDO experiments was also used for the lard
pyrolysis experiments. Lard is a solid at room temperature however it melts at about
37oC. It was therefore preheated to 40oC before pumping. The Eldex A-10-S pump was
used for a few of the experimental runs. Due to difficulties in pumping, the pump was
changed to a programmable syringe pump (Genie model YA-12, Kent Scientific
Corporation, USA). All the results presented in the next chapter are those from the
syringe pump runs except otherwise stated. The lard flow rate was maintained at ~ 5 g/h
for all runs. N2 was used as carrier gas for all pyrolysis experiments. The purpose of the
carrier gas was to bring about a uniform distribution of the feed in the reactor. The
carrier gas also helps to limit the residence time of the volatiles (products) in the reactor
and thereby prevents secondary reactions. The lard feed line was maintained at 40oC
using heating tape. Apart from the thermocouple placed in the furnace, another K-type
(~ 1.0 mm diameter) thermocouple (in a thermowell) was used to monitor the
temperature at the centre of the reactor. All experiments were conducted for 30 min
except for a particular experiment which was conducted for 225 min in order to collect
enough liquid products for the determination of pour and cloud points.
3.2.3 Steam reforming of lard
The reactor set-up used for the pyrolysis experiment was also used for the steam
reforming process. But since lard is not miscible with water a second syringe pump

22
(Genie model YA-12, Kent Scientific Corporation, USA) was used to introduce the
water. In addition, during the steam reforming process no carrier gas was used. The N2
flow was stopped after the desired reactor temperature was attained.
3.3 Gas Product Analysis
GC Hewlett Packard 5890 II (described in section 3.1.3) was used to analyze for
H2, CO and CO2 while Hewlett Packard 5880A equipped with a flame ionization
detector and a Chromosorb102 column (1800 mm, 3.18 mm i.d.) was used to analyse for
hydrocarbons. The same programming used for Carle GC 500 was used for Hewlett
Packard 5880A. The calibrations of the GC HP 5880 A for the hydrocarbons are given
in Figures A-18 to A-26, Appendix A)
3.4 Liquid Product Analysis
3.4.1 Gas chromatographic analysis
The liquid product was first injected into an FID Varian 3400 GC equipped with
a capillary column (DB-1, 100% dimethylpolysiloxane, 26 m x 0.32 mm) to obtain
analytical chromatograms. Over 240 peaks were observed. The compounds present in
the liquid product were then identified using a VG70-250-VSE mass-spectrometer (VG
Analytical, Manchester, England) coupled to a Fisons GC 8000 series, Model 8060
(Fisons Instrument, Italy) which was equipped with a DB 5/MS ( 5% diphenyl, 95%
dimethyl polysiloxane) capillary column (30 mm long and 0.25 mm i.d.). The GC/MS
program is also given in Table 3.1. The MS detector was operated in the scan mode (2
scans/s) and its mass range was 25 to 450 amu. The identification was done with NIST
library containing 60,000 compounds. The composition of the liquid product was

23
estimated from the observed total ion chromatogram. All quantifications were relative to
the total sample and based upon the mass spectral peak areas with an assumed relative
response factor of unity.
3.4.2 Cetane index
Cetane number (CN) is a measure of ignition quality or ignition delay, and is
related to the time required for a liquid fuel to ignite after injection into a compression
ignition engine. CN is determined from real engine test. Cetane index (CI) is a
calculated value derived from the density (see below) and volatility obtained from
boiling characteristics of the fuel. CI usually gives a reasonably close approximation to
real cetane number (Song, 2000). ASTM D976-91 was used to calculate CI as a function
of mid-boiling point and density of the liquid according to the formula below.
CI = 454.74 - 1641.416(G) + 774.74(G)2 - 0.554(T50) + 97.803(logT50)2 (3.1)
3.4.3 Density
Density is the mass per unit volume of any liquid at a given temperature. Density
has importance in diesel engine performance, since fuel injection operates on a volume
metering system (Song, 2000). Also, the density of the liquid product is required for the
estimation of the Cetane index (Srivastava and Prasad, 2000). The densities were
determined using a density meter (DMA 35, PARR Instruments Company Inc., USA,) at
25oC according to ASTM D5002-94. The density meter was calibrated using reverse
osmosis water at room temperature.

24
3.4.4 Distillation range
The distillation range of a fuel affects its performance and safety. It is an
important criterion for engine’s start and warm up. It is also needed in the estimation of
cetane index. The distillation range of the liquid product was determined by Simulated
Distillation Gas Chromatography (SDGC). SDGC is a test method (ASTM D2887-97)
that covers the determination of the boiling range distribution of liquid fuels. Using a
calibration curve obtained by chromatographic analysis of a mixture of hydrocarbons
with known boiling points (calibration standard), boiling temperature were assigned as a
function of residence time. The temperature at which specified percentages of the total
sample have eluted from the column were calculated and reported. Additional
information may be extracted from the results to provide more information about the
sample’s properties. This method can be used to compliment or replace conventional
distillation methods.
The initial boiling point (IBP) is the temperature (corresponding to the retention
time) at which a cumulative corrected area count equals to 0.5% of the total sample area
under the chromatogram is obtained. The final boiling point (FBP) is the temperature
(corresponding to the retention time) at which a cumulative corrected area count equals
to 99.5% of the total sample area under the chromatogram is obtained. A Varian model
CP 3800 GC (specially configured for simulated distillation) coupled to a Varian CP
8400 Auto-sampler was used. The SDGC was equipped with a capillary column (HP-1
100% Dimethylpolysiloxane, 5000 mm x 0.53 mm i.d.).

25
3.4.5 Viscosity
Viscosity is a measure of the internal fluid friction, which tends to oppose any
dynamic change in the fluid motion (Song, 2000). Proper viscosity of fuel is required for
proper operation of the engine. It is also important for flow of oil through pipelines,
injector nozzles and orifices (Radovanovic et al, 2000). The lower the viscosity of the
oil, the easier it is to pump and atomize and achieve finer droplets (Islam et al, 2004).
The viscosities of the total liquid products were determined using a digital cone and
plate viscometer (Brookfield, Model LVDV-1+, Brookfield Engineering Laboratories,
Stoughton, MA) at 40oC. The temperature of the sample was maintained within ±0.5oC
with a constant temperature bath. Brookfield standard fluid 100 was used to calibrate the
viscometer.
3.4.6 Heat of combustion
Heat of combustion measures the energy content in a fuel. This property is also
referred to as calorific value or heating value. Although cetane number determines the
combustion performance, it is the heating value along with thermodynamic criteria that
sets the maximum possible output of power (Song, 2000). Combustion with oxygen in a
sealed bomb is a very effective and reliable method for releasing all heat energy
obtainable from a fuel (Parr, 1997). The heats of combustion of the liquid products were
measured using an oxygen bomb calorimeter (Parr 1341, PARR Instruments Company
Inc. Moline, IL) according to ASTM D240-92 using benzoic acid as the primary
standard.

26
3.4.7 Cloud and pour points
The cloud point is the temperature at which a cloud of crystals first appears in a
liquid when cooled under conditions as described in ASTM D2500-91. The pour point is
the lowest temperature at which the oil specimen can still be moved. It is determined
according to ASTM D97-96. These two properties are used to specify cold temperature
usability of a fuel. Two cooling baths with different cooling temperatures were used.
The first bath was maintained at about -2oC by mixing crushed ice with NaCl. The
second one was maintained around -20oC by using ice and CaCl2. For the case of pour
point determination, the thermometer was positioned so that just its bulb was immersed
in the fuel.
3.4.8 Water content
The water content of the fuel is required to accurately measure the net volume of
actual fuel in sales, taxation, exchanges and custody transfer (Srivastava and Prasad,
2000). The analysis was done with 950 Ross® FASTQCTM Titrator (Orion Research
Inc., Beverly, MA, USA). Three steps were followed in the water content analysis, blank
preparation, standardization with distilled water and analysis of sample. The reagent
used for titration was Aquastar® Comp 5 containing 2-methoxyethanol. The solvent
used was Aquastar® methanol which is a special anhydrous reagent for moisture
determination.
27
4. RESULTS AND DISCUSSION ON CO2 REFORMING OF BIOMASS DERIVED OIL
The results obtained from the spray test on the reactor inlet and the study on CO2
reforming of biomass derived oil (BDO) are presented and discussed in this chapter. The
discussion was based on the effects of residence time and mole fraction of CO2 in the
carrier gas on products distribution.
4.1 Determination of Spray Pattern into the Reactor
The feed inlet was designed to allow the feed to spray on the quartz bed as
described in Chapter 3. Figure 4.1 shows the spray pattern obtained at two carrier gas
temperatures and flow rates. It is observed from Figure 4.1 that the flow rate of carrier
gas has a significant effect on spray pattern and droplet size of the reactant. The droplet
size was obtained by taking the average of the sizes of any five spots taken at random
from the pattern created. As the carrier gas flow rate was increased from 30 to 60
cm3/min at 25oC (Figures 4.1a and b), the droplet size of the reactant reduced from
approximately 2.5 to 1.5 mm. At 50oC and 30 cm3/min (Figure 4.1c), the droplet size
was decreased further to 0.5 mm. At 50oC and 60 cm3/min (Figure 4.1d), the central
broad spot completely disappeared and the droplet size was reduced to approximately
0.2 mm. Since the temperature at the reactor entrance during each run was higher than
50oC (approximately 200oC), the droplet size would definitely be finer than the observed
size in this spray test. The broad area covered by the spray might suggest that the

28
Figure 4.1 Spray pattern of BDO (5 g/h) generated by carrier gas
10 mm
Figure 4.1a. Spray obtained at 25oC and carrier gas flow rate of 30 cm3/min
Figure 4.1b. Spray obtained at 25oC and carrier gas flow rate of 60 cm3/min
Figure 4.1c. Spray obtained at 50oC and carrier gas flow rate of 30 cm3/min
10 mm
Figure 4.1d. Spray obtained at 50oC and carrier gas flow rate of 60 cm3/min
10 mm
10 mm

29
droplets could also fall on the wall of the reactor. However, due to the high temperature
in the reactor, the droplets are more likely to be gasified before reaching the quartz bed
or the wall of the reactor.
4.2 Characterization of BDO
As obtained from the supplier’s MSDS, the BDO contains 25 wt% water, 25
wt% lignin and a balance of 50 wt% of other oxygenated compounds. Its specific gravity
and pH are 2.2-3.5 and 1.1-1.25, respectively. The viscosity was not given and thus was
obtained using Brookfield Digital Viscometer model DV-1+. The result is given in Table
4.1. It is observed that the viscosity of the BDO ranged from 5.2 to 16.2 cSt over a
temperature range of 25 to 80oC. A viscosity of 6 cSt at 80oC was given on DynaMotive
website. The carbon (C), hydrogen (H) and nitrogen (N) analysis of the BDO was
performed on a CHN analyser (Perkin Elmer 2400) and the results are given in Table
4.2. The wt% of O2 in the BDO was obtained by difference.
4.3 Pyrolysis and CO2 Reforming of BDO in a Fixed Bed Reactor
This section describes the effects of residence time and CO2 mole fraction in the
carrier gas on product yields, gas composition and heating value. In the study by
Panigrahi et al. (2003), they observed highest conversion at 800oC for pyrolysis of BDO.
Therefore, all the runs here were done at a temperature of 800oC. The observed material
balance was in the range of 90 – 96 wt%. The complete data of the experimental runs are
presented in Appendix C.
In order to check the reproducibility of the experiment, one of the runs was
chosen at random and repeated twice. The reproducibility was observed to within ± 2%.

30
Table 4.1 Viscosity of BDO
Temperature (oC) Viscosity (cP) Viscosity (cSt)*
25 18.6 16.2
40 16.9 14.7
80 6.0 5.2
* obtained at a specific gravity of 1.15
Table 4.2 CHN analysis of the BDO
Component wt%
C 35.3
H 8.3
N 0.4
O* 56.0
*obtained by difference
31
The statistical analysis was done with SAS V8 program. There is no significant
difference in the result at error level of 5%.
4.3.1 Effects of residence time on CO2 reforming of BDO
The residence time is defined as packing volume divided by the carrier gas
volumetric flow rate at the reactor temperature (see Appendix D for detailed
calculation). The contribution to volumetric flow rate by the feed was assumed to be
negligible. This is because the flow rate of the feed is very small as compared to that of
the carrier gas. The discussion here is based on the use of the two gases (CO2 and N2)
separately i.e. the use of pure N2 and CO2.
Figure 4.2 shows the effect of residence time on product yield and heating value
of product gas when pure N2 was used as carrier gas. The gas yield increased almost
linearly from 31 to 40 wt% as the residence time increased from 1.4 to 2.8 s. The
increase in gas yield is at the expense of the char as the char was seen to take the reverse
trend 31 to 24 wt%. This implies that at higher residence time, the char formed is
gasified by some compounds (CO and/or H2O) in the volatiles, thereby yielding more
gas (equation 4.1, Corella et al., 1998). The condensate yield is almost independent of
the residence time. The heating value of the product gas was observed to increase
slightly from 19 to 22 MJ/m3 with increase in residence time. The calculation of the
heating value is based on gas composition (see Appendix E) therefore; the observed
trend in the heating value of the gas is due to variation in gas composition (explained in
the next section). Equation 4.1 also confirms the increase in heating value with increase
in residence time since more high heating value methane is produced.

32
20
25
30
35
40
1 2 3Residence time, s
Yie
ld o
f pro
duct
s, w
t% o
f tot
al
prod
uct
18
19
20
21
22
23
Gas
hea
ting
valu
e, M
J/m
3
GasCharCondensateGas heating value
Figure 4.2 Effects of residence time on product yield and heating value of
product gas (carrier gas N2 only: BDO: 4.5-5.5g/h; temperature 800oC, reaction time: 30 min)
0.0
20.0
40.0
60.0
80.0
1 2 3Residence time,s
Prod
uct g
as c
ompo
sitio
n, m
ol% Hydrogen
COCO2C1+ C2 alkaneC1+C2 alkeneC3+H2 + CO
Figure 4.3 Effects of residence time on product gas composition (carrier gas: N2
only, BDO: 4.5-5.5g/h, temperature 800oC, reaction time: 30 min)

33
422
2 CHCOHCO
OHChar +•••++=
⎭⎬⎫
⎩⎨⎧
+ (4.1)
The effects of residence time on product gas composition are shown in Figure
4.3. It is observed that the production of hydrogen increased from 24 to 42 mol% as the
residence time increased from 1.4 to 1.7 s. A further increase in residence time to 2.8 s
caused a decline in hydrogen production to 33 mol%. This indicates that H2 is a primary
product during pyrolysis (Panigrahi et al., 2002) and that it (H2) is being consumed to
other products at high residence time. Ferdous et al. (2001) have reported that hydrogen
produced during pyrolysis reacts with carbonaceous material to form methane. This also
explains why methane production (combined in C1 + C2 alkanes) increased slightly with
the decrease observed with H2 and char (see Figure 4.2). The opposite trends observed
between CO and CO2 might be due to CO2 reforming of hydrocarbons and/or char to CO
(Caballero et al., 1997). This can also explain why hydrocarbon compositions are low in
all cases. The synthesis gas (CO + H2) production was high (~73 mol%) and observed to
be almost independent of residence time.
The effects of residence time on products yield and the heating value of product
gas during CO2 reforming of BDO are shown in Figure 4.4. The gas yield was observed
to decrease from 34 to 31 wt% as the residence time increased from 1.4 to 1.7 s but
remained constant with increase in residence time further to 2.8 s. This might be due to
attainment of equilibrium in gas composition (Chaudhari et al., 2001). The char yield
was observed to decrease slightly from 31 to 29 wt% as the residence time increase from
1.4 to 1.7 s but increased rapidly to 36 wt% when the residence time was increased to
2.8 s. The trend observed with the char was almost opposite to that of the condensate.

34
25
30
35
40
45
1 2 3Residence time,s
prod
ucts
yie
lds,
wt %
of t
otal
pr
oduc
ts
18.0
18.6
19.2
19.8
20.4
Hea
ting
valu
e of
pro
duct
gas
M
J/m
3
GasCharCondensateGas heating value
Figure 4.4 Effects of residence time on products yield and heating value of product gas (carrier gas CO2 only: BDO: 4.5-5.5g/h; temperature 800oC, reaction time: 30 min)

35
This implies that the components of the liquid were converted into char rather than gas
at high residence time when the reacting atmosphere is dominated by CO2. The heating
value of the product gas decreased slightly from 20 to 18 MJ/m3.
The effects of residence time on product gas composition during CO2 reforming
of BDO are given in Figure 4.5. It is observed that an initial increase in residence time
increased the mol% of H2, CO and consequently that of synthesis gas slightly and
decreased that of CO2. A further increase in residence time did not affect the
concentration of CO and H2. This is due to equilibrium achieved in the gas phase as
stated above. The concentrations of the hydrocarbons were not affected at all.
4.3.2 Effects of CO2 concentration in the feed gas on products distribution
The effects of CO2 in carrier gas on gas and char yields and product gas
composition for reforming of BDO were studied by changing the mole fraction of CO2
in total gas from 0 to 1 and total gas flow rate from 30 to 60 cm3/min. The reaction
temperature was kept constant at 800oC. It should be noted that the analysis of the
product gas was on carrier gas free basis, which implies that the amounts of CO2 and N2
fed to the experiment were deducted from the total gas collected over the run period.
The effects of mole fraction of CO2 in feed gas on product distribution into gas
char and condensate and also on gas composition are given in Tables 4.3 to 4.5. As can
be observed in these tables, the gas compositions seem not to follow a defined pattern.
The same observation was made by Panigrahi et al. (2003). The hydrogen production
was observed to decrease while those of the hydrocarbons increased with increase in
mole fraction of CO2 in the carrier gas from 0 to 0.4 when the total carrier gas flow rate
was 30 cm3/min (Table 4.3). However when the carrier gas flow rate was increased,

36
0.0
20.0
40.0
60.0
80.0
1 2 3Residence time, s
Prod
uct g
as c
ompo
sitio
n, m
ol %
Hydrogen
CO
CO2
C1+ C2 alkane
C1+ C2 alkene
C3+
H2 + CO
Figure 4.5 Effects of residence time on product gas composition (carrier gas CO2 only: BDO: 4.5-5.5g/h; temperature 800oC, reaction time: 30 min)

37
Table 4.3 Effects of CO2 in the feed gas on products distribution and gas
composition (N2 + CO2: 30 cm3/min, BDO: 4.5-5.5g/h, temperature: 800oC, reaction time: 30 min)
Mole fraction of CO2 in N2 Gas composition (mol%)*
0 0.2 0.4 1.0 H2 33.1 28.4 27.0 24.7 CO 39.9 33.4 38.0 47.7 CO2 5.9 15.0 9.9 16.4 C1 + C2 alkanes 15.0 16.3 17.7 8.3 C2 + C3 alkenes 5.8 6.5 7.0 2.8 C3+
** 0.3 0.4 0.5 0.1 Total 100 100 100 100 Calorific value MJ/Std. m3 22.1 24.5 24.9 18.5 Synthesis gas (H2 + CO) 73.0 61.8 65.0 72.4 H2/CO molar ratio 0.83 0.85 0.71 0.52
Product distribution wt% of total product Gas 34.8 51.3 48.7 31.2 Condensate 41.6 23.1 28.3 33.1 Char 23.6 25.6 23.0 35.7 *Carrier gas (CO2 + N2) free basis ** excluding propylene

38
Table 4.4 Effects of CO2 in the feed gas on products distribution and gas
composition (N2 + CO2: 50 cm3/min; BDO: 4.5-5.5g/h; temperature 800oC, reaction time: 30 min)
Mole fraction of CO2 in N2 Gas composition (mol%)*
0 0.2 0.5 1.0 H2 41.8 22.8 33.2 24.7 CO 29.0 45.9 38.2 48.8 CO2 14.5 19.2 5.6 12.6 C1 + C2 alkanes 11.0 8.7 16.1 10.1 C2 + C3 alkenes 3.7 3.2 6.5 3.5 C3+
** 0.03 0.3 0.4 0.4 Total 100 100 100 100 Calorific value MJ/Std. m3 19.2 19.4 22.0 19.8 Synthesis gas (H2 +CO) 70.8 68.6 71.4 73.5 H2/CO molar ratio 1.44 0.50 0.87 0.51
Product distribution wt% of total product Gas 33.8 39.8 41.7 31.3 Condensate 35.7 38.2 40.0 39.7 Char 30.5 22.0 18.2 29.0 *Carrier gas (CO2 + N2) free basis ** excluding propylene

39
Table 4.5 Effects of CO2 in the feed gas on products distribution and gas
composition (N2 + CO2: 60 cm3/min, BDO: 4.5-5.5g/h, temperature: 800oC, reaction time: 30 min)
Mole fraction of CO2 in N2 Gas composition (mol%)*
0 0.1 0.2 1.0 H2 23.7 28.4 25.9 22.7 CO 45.2 47.2 45.8 43.5 CO2 13.7 8.4 12.5 20.2 C1 + C2 alkanes 12.3 11.7 11.4 10.0 C2 + C3 alkenes 4.7 4.0 4.3 3.3 C3+
** 0.5 0.2 0.3 0.3 Total 100 100 100 100 Calorific value MJ/Std. m3 19.2 18.7 20.6 20.1 Synthesis gas (H2 +CO) 68.9 75.6 71.6 66.2 H2/CO molar ratio 0.52 0.60 0.56 0.52
Product distribution wt% of total product Gas 31.0 28.8 30.3 34.2 Condensate 37.6 34.4 36.5 34.5 Char 31.4 36.8 33.2 31.2 *carrier gas (CO2 + N2) free basis ** excluding propylene

40
corresponding to reducing the residence time (Tables 4.4 and 4.5), the trend was not
retained. Probably, the secondary thermo-chemical reactions were affected by the
addition of CO2 and due to the higher residence time at 30 cm3/min (2.8 s). For example
methanation (Mleczco et al., 1997) and other reactions might occur consuming H2 (see
equations 4.2 and 4.3, Panigrahi, 2003).
OHCHHCO 2423 +=+ (4.2)
422 CHHC =+ (4.3)
The synthesis gas production was high (> 60 mol%) in all cases, with or without
addition of CO2. The maximum production of synthesis gas (~76 mol%) was observed at
a total carrier gas flow rate of 60 cm3/min and a mole fraction of CO2 in carrier gas of
0.1. The char formation decreased with increase in mole fraction of CO2 in the carrier
gas (50 cm3/min) from 0 to 0.5 but increased as the mole fraction of CO2 increased to
one (Table 4.4). Snoeck and Froment (2002) observed a reduction in char formation
during CO2 reforming of methane. The minimum char formation (18 wt%) for all the
experiments conducted was observed at a total carrier gas (N2 + CO2) flow rate of 50
cm3/min containing 50 mol% CO2. The maximum olefin (C2+ C3) production (6.5
mol%) was also observed at these conditions.
Other observations from Tables 4.3 to 4.5 and from all the runs conducted on
CO2 reforming of BDO are given below. The maximum gas production (51 wt%) was
observed at a total carrier gas flow rate of 30 cm3/min containing 20 mol% of CO2. The
maximum product gas heating value (25 MJ/m3) and alkanes production (18 mol%)

41
were obtained at a total carrier gas flow rate of 30 cm3/min containing 40 mol% CO2.
Maximum hydrogen (42 mol%) and H2 to CO molar ratio (1.44) were obtained while
using only N2 as the carrier gas at a flow rate of 50 cm3/min. This molar ratio is a good
one for Fischer-Tropsch synthesis (Chaudhari et al., 2001). From the results presented in
this chapter, it is glaring that CO2 was not consumed in BDO reforming. Therefore, the
term CO2 reforming is not appropriate for the process.

42
5. RESULTS AND DISCUSSION ON PYROLYSIS AND STEAM REFORMING OF LARD
The results obtained from lard analysis and its pyrolysis and steam reforming
experiments are presented in this chapter. A discussion on the comparison of the
products obtained from BDO and lard pyrolysis is also presented.
5.1 Physical and Chemical Properties of Lard
The physical properties of the lard as well as its fatty acid composition are given
in Table 5.1. The techniques used to obtain these properties were discussed in section
3.5.2. The data in Table 5.1 indicate that the feed has a high heating value (39.6 MJ/kg)
and viscosity (36.4 mPa.s). Also, the lard contained large quantities of palmitic, stearic,
oleic and linoleic acid moieties. The elemental analysis of the lard gave 77.3 wt% C,
12.2 wt% H, 10.5 wt% O. Traces of sulphur ( ~ 32 wppm) and nitrogen ( ~ 8 wppm)
were also found. These trace amounts of sulphur and nitrogen in the feed is important
criteria for its application for fuel. It means that the produced fuel will not be responsible
for SOx and NOx emission both of which are undesirable in combustion processes.
In order to determine a reasonable temperature at which significant pyrolysis can
occur, a TG/DTA analysis of the lard was done to estimate its boiling point. The profile
observed is shown in Figure 5.1. The endothermic peak was observed at about 450oC.
Significant weight loss also occurred at about this temperature. This shows that the

43
Table 5.1 Physical and chemical properties of the feed (lard)
Physical properties Density @40ºC (kg/m3) 940 Heat of combustion (MJ/kg) 39.6 Viscosity @40ºC (mPa.s) 36.4
CHNS/O analysis, wt% (wppm) C 77.3 H 12.2 N 0.0008 (8) S 0.0032 (32)
O* 10.5 Composition, wt% of total fatty acids**
C10:0 (Capric) 0.1 C12:0 (Lauric) 0.1 C14:0 (Myristic) 1.4 C15:0 (Pentadecanoic) 0.1 C16:0 (Palmitic) 24.1 C16:1 (Palmitoleic) 2.4 C17:0 (Magaric) 0.4 C18:0 (Stearic) 14.0 C18:1 (Oleic) 39.4 C18:2 (Linoleic) 14.2 C18:3 (alpha-Linolenic) 0.8 C18:4 (Octadecatetraenoic) 0.1 C20:0 (Arachidic) 0.2 C20:1 (Eicosenoic) 0.7 C20:2 (Eicosadienoic) 0.5 Others 1.4
*obtained by difference **xx:y: xx number of carbon atoms; y number of double bonds
44
0
1000
2000
3000
4000
40 240 440 640
Temperature oC
DTG
, mic
rogr
am/m
in
0
4000
8000
12000
16000
TG, m
icro
gram
Figure 5.1 Thermo-Gravimetric/Differential Thermo-Gravimetric plots for lard

45
boiling point of the lard lies somewhere between 400 and 500oC. It is therefore
reasonable to start varying the pyrolysis temperature from 500oC.
In this study, pyrolysis and steam reforming of lard were conducted in a fixed
bed reactor. Generally, three products were recovered after each run. They were liquid
condensate, char and gas. The liquids appeared brownish with a strong acrid smell. The
effects of temperature, carrier gas flow rate and quartz packing particle size on gas and
liquid yields, composition and calorific value of the product gas on steam reforming of
lard were studied. The physical and chemical characteristics of the liquid product such
as density, viscosity, cetane index and calorific value and how they compare to that of a
conventional #2 diesel fuel were also discussed.
The material balances together with the gas composition and liquid product
characterizations for all the experimental runs are given in Appendix C. The overall
material balance was in the range of 90 to 98 wt%. The results for some of the runs at
one set of conditions are given in Table 5.2. The results presented in the table include
the mean value and the standard errors of the mean (SEM). The t-statistics of the data
shows that there is no variation in the data at 95% confidence level. The statistical
analysis was done by SAS V8 program.
5.2 Pyrolysis of Lard
Pyrolysis refers to a chemical change caused by the application of thermal
energy in the absence of oxygen (Scott and Piskorz, 1982). The pyrolysis products of
lard were gas, liquid and char. It was possible to determine CO, CO2, and most of the
C1-C4 hydrocarbon components (such as methane, ethylene, propane, propylene,
isobutane, isobutylene, and 1-butene) in the gas product from GC analysis alone.

46
Table 5.2 Reproducibility of results during pyrolysis of lard
(N2: 50 cm3/min, quartz particle size: 0.7-1.4 mm, lard: 5g/h, temperature: 550oC)
1 2 4 Mean ± SEM
Product gas composition, mol% H2 0 0 0 0.00±0.0 CO 9.4 9.8 10.6 9.9±0.3 CO2 4.6 4.5 5.1 4.7±0.2 CH4 8.4 9.5 9.5 9.1±0.2 C2H4 21.6 24.6 24.6 23.6±0.6 C2H6 7.3 7.8 8 7.7±0.1 C3H6 10 15.6 15.6 13.7±1.1 C3H8 1.1 1 1.1 1.1±0.0 Gas heating value MJ/m3 147.6 135.8 131.6 138.3±2.7
Liquid product characterization Diesel-like liquid product g/100g lard 28.1 30.7 31.4 30.1±2.0 Cetane Index 50.3 52.3 49.3 50.6±1.0 Density kg/m3 @25oC 880 875 880 878.3±4.0 Viscosity mPa.s @40oC 10.6 9.5 11.1 10.4±0.5 Liquid heating value MJ/kg 40 39.5 39.9 39.8±0.1

47
GC/MS analysis was, however, required for identification of the compounds in the
liquid product.
5.2.1 GC/MS study
The distribution of components in the liquid product as obtained by GC/MS is
given in Table 5.3. The main components were alkanes and alkenes, which accounted
for approximately 60% of the total weight. Carboxylic acids accounted for another 13–
25%. Figure 5.2 shows, as an example, the GC/MS chromatogram for the liquid product
obtained at a pyrolysis temperature of 550oC with a carrier gas flow rate of 10 cm3/min.
Peaks identification was made by NIST search of the spectra. Those identification
results of match quality higher than 90% were considered valid, once confirmed that the
assignments were in agreement with published GC/MS data of similar products (Idem et
al., 1996, Chan and Wan, 1947, Alencer et al., 1983). A detailed list of the compositions
is presented in Appendix F. The liquid product contained a wide range of products (polar
and non-polar) which made its analysis by gas chromatography difficult. Over 240 peaks
were obtained when the liquid product was injected into a GC. Therefore detailed
quantification of the components was not done.
5.2.2 Effects of residence time on pyrolysis of lard
The effects of residence time (RT) were studied at 600 and 800oC, with packing
particle size of 1.7-2.4 mm by varying the carrier gas (N2) flow rate from 30 to 70
cm3/min (RT, 1.5 to 3.4 s) for the runs at 600oC and from 10 to 70 cm3/min (RT, 1.2 to
8.4 s) for the runs at 800oC. The packing particle size was chosen from the studies on
BDO. The effects of residence time on the volume of product gas and its calorific value

48
Table 5.3 Distribution of groups (wt%) in the liquid product obtained during
lard (~5g/h) pyrolysis
Conditions
Carrier gas cm3/min
30 30 10 10
Temperature oC 500 600 550 650 Pump type Eldex Eldex Syringe Eldex
Components wt%
Packing particle size, mm
1.7-2.4 1.7-2.4 1.7-2.4 1.7-2.4
Alkane 4.4 2.7 7.1 1.9 Cycloalkanes 2.8 10.9 7.3 2.4 Alkenes 21.2 27.3 35.0 23.6 Cycloalkenes 6.8 6.3 7.8 7.8 Alkynes 0.4 1.5 0 1.1 Dienes 4.7 7.5 6.2 3.9 Furan 0 0.9 0 0 Aromatics 1.6 10.4 4.0 32.3 Aldehyde 3.5 2.5 4.2 1.4 Ketones 4.1 2.8 2.4 1.4 Alcohol 6.7 5.9 3.7 7.0 Acids 25.8 17.5 13.1 13.2 Esters 18.2 3.9 9.1 4.1 Total 100 100 100 100 Hydrocarbons, HC
41.5 67.4 67.5 71.8
Oxygenated Hydrocarbons, OHC
58.2 32.6 32.5 27.1
HC/OHC 0.71 2.07 2.08 2.65

49
Relative Intensity
Figure 5.2 GC/MS Chromatogram for the pyrolysis liquid obtained at a
temperature of 550oC, carrier gas flow rate of 10 cm3/min and quartz height of 70 mm and particle size of 1.7-2.4 mm
Scan number/ Retentoin time

50
for the runs at 600oC are shown in Figure 5.3. The volume of the product gas was
observed to increase with an increase in residence time. This implies that reactions that
are responsible for the bulk of the gas product are further down the reaction sequence
and are thus favoured at high residence time. The calorific values of the product gas
were high for all residence times. A maximum value of 133 MJ/m3 was obtained at
residence time of 2.1 s.
The effects of residence time on the total and diesel-like liquid yield are shown
in Figure 5.4. The yields of both the total and the diesel-like liquid products decreased
with increase in residence time. This implies that the reactions that are responsible for
the formation of the liquid product such as C-C bond cleavage, decarboxylation, and
decarbonylation (Idem et al., 1996) are earlier in the sequence of reaction steps.
Therefore, within the range of residence time used, an increase in residence time is
detrimental to liquid production. However, Figure 5.5 shows that the CI of the liquid
product is maximized at a residence time of 2.1 s. This implies that too low residence
time can also be detrimental to the quality of the liquid product. Based on this
observation, the residence time of 2.1 s was chosen as the optimum for high quality
diesel yield. The viscosity of the liquid product increased from 1.8 to 3.8 mPa.s as the
residence time increased from 1.5 to 3.4 s (Figure 5.5). The viscosity of a typical diesel
fuel falls within this range. Figure 5.6 shows the effect of residence time on product gas
composition. It is evident that there were no significant changes in the composition of
most of the gases with residence time. For example, the concentration of C1 + C2 alkanes
increased from 17 to 19 mol% with increase in residence time from 1.5 to 2.1 s but drops
to 16 mol% at a residence time of 3.4 s. The concentrations of C2 + C3 olefins were high
and varied between 41 and 46 mol percent.

51
40
45
50
55
60
1 2 3 4
Residence time , s
Vol
ume
of p
rodu
ct g
as, L
/100
g of
la
rd
120
124
128
132
136
Hea
ting
valu
e of
pro
duct
gas
, MJ/
m3
Figure 5.3 Effects of residence time on volume and heating value of product gas
(process: pyrolysis, temperature: 600oC, quartz packing height: 70 mm, size: 1.7-2.4 mm, reaction time: 30 min)
0
20
40
60
80
1.5 2.1 3.4Residence time, s
Liqu
id p
rodu
ct, g
/100
g of
lard
Total liquid productDiesel-like liquid
Figure 5.4 Effects of residence time on total and diesel-like yields (process:
pyrolysis, temperature: 600oC, quartz packing height: 70mm, size: 1.7-2.4 mm, reaction time: 30 min)

52
20
30
40
50
0 1 2 3 4Residence time, s
Cet
ane
Inde
x (C
I)
1
2
3
4
Vis
cosi
ty@
40o C
, mPa
s
Figure 5.5 Effects of residence time on cetane index and viscosity of the total
liquid product (process: pyrolysis, temperature 600oC, quartz packing height 70 mm, size 1.7-2.4 mm, duration 30 min)
0
10
20
30
40
50
1 2 3 4Residence time, s
Prod
uct g
as c
ompo
sitio
n, m
ol % H2
COCO2C1+C2C2+C3 olefinsC3+
Figure 5.6 Effects of residence time on products gas composition
(Process: pyrolysis, temperature 600oC, quartz packing height 70mm, Size 1.7-2.4 mm, duration 30 min)

53
At 800oC, the liquid production was quite small and could not be characterized.
The effects of residence time on the gas composition are given in Figure 5.7. Similar to
the observation at 600oC, there were no significant changes in the composition of most
of the gases with residence time. However, contrary to what was observed at 600oC,
there seems to be a reverse trend between the concentration of C1 + C2 alkanes and that
of C2 + C3 olefins between the residence time of 1.2 to 2.8 s. The concentration of the
alkanes increased from 25.9 to 31 mol% with increase in residence time from 1.2 to 2.8 s
but drops to 29.6 mol% at a residence time of 8.4 s. On the other hand, the concentration
of the olefins decreased from 45.3 to 42 mol% with increase in residence time from 1.2
to 1.4 s and remained almost constant as the residence time increased to 8.4 s.
Both at 600 and 800oC, olefin (ethylene and propylene) production were high. A
maximum of 46 mol% was obtained at 600oC and a residence time of 2.1 s. Ethylene
and propylene are important starting materials for the production of various chemicals in
the petrochemical industry such as MTBE, polyethylene, and maleic anhydride. The C3+
concentration was low (~ 5 mol%).
5.2.3 Effects of quartz packing particle size
Idem et al. (1996) found out that the conversion of triglycerides was completely
independent of the morphology of the cracking surface. Therefore no study was done on
the effects of packing material. However, in order to know the effect, if any, of size of
the packing material on pyrolysis, a study at 600oC was done on two different packing
particle size ranges (0.7-1.4 mm and 1.7-2.4 mm) at a carrier gas flow rate of 50
cm3/min, corresponding to a residence time of 2.1 s. The residence time of 2.1 s was
chosen for further optimization based on the study on residence time in section 5.2.2.

54
0
10
20
30
40
50
0 2 4 6 8 10
Residence time, s
Prod
uct g
as c
ompo
sitio
n, m
ol %
H2COCO2C1+C2C2+C3 olefinsC3+
Figure 5.7 Effects of residence time on products gas composition (process:
pyrolysis, temperature 800oC, quartz packing height 70mm, size 1.7-2.4 mm, reaction time 30 min)

55
Table 5.4 shows the effects of packing particle size on gas composition and
heating value, total and diesel-like liquid yields as well as on the CI and viscosity of the
liquid product during pyrolysis of lard at 600oC and carrier gas flow rate of 50 cm3/min.
The total liquid product increased from 45 to 53 g/100g lard with decrease in particle
size. The residence time calculation in Appendix D was based on an empty reactor. The
effect of the packing material was not considered in its calculation. The increase in total
liquid product may be due to the fact that a higher residence time was achieved in the
reactor with smaller particles. The smaller particles can also enhance better heat transfer.
This probably reduced the residue retained in the reactor and increased the liquid
product. Comparing the diesel-like liquid yield results with the error level observed in
the reproducibility test (Table 5.2), it can be stated that there is no significant difference
in the diesel like liquid yields from the two particle size ranges. It is interesting to
observe a drastic drop (~ 50%) in viscosity with increase in packing particle size.
However, the CI was also observed to decrease (~ 10%) with increase in packing
particle size. This is because more lower molecular weight compounds are formed with
the higher particle size packing. Mleczko et al. (1997) have stated that reactions in
which H2/CO are low (< 0.5) are mostly gas phase rather than surface reactions.
Therefore, a large void volume (achieved by large particles) is necessary to enhance the
reaction.
Based on the reproducibility of the experiment, there is a significant difference
in the gas composition. The carbon oxides production increased while that of the
hydrocarbons dropped. As explained above, the reactions are gas phase reactions, so a
large void volume is required for effective cracking. This indirectly implies that the

56
Table 5.4 Effects of quartz packing particle size on pyrolysis of lard
(N2 flow rate 50 cm3/min (STP), packing particle height 70 mm, lard 5g/h, and temperature 600oC)
Quartz packing particle size, mm 0.7-1.4 1.7-2.4
Product gas composition mol% H2 0 0 CO 9 10.4 CO2 3.6 5.9 CH4 11 9.7 C2H4 27 25.2 C2H6 7.6 6.3 C3H6 17.1 15.8 C3H8 0.8 0.6 C4+ 24 26.1 Gas heating value MJ/m3 130.0 133.2
Liquid product characterization Total liquid product, g/100glard 53 45 Diesel-like liquid, g/100g lard 24.40 25.04 Cetane Index 45.81 40.72 Density kg/m3 860 860 Viscosity, mPa.s 4.53 2.32

57
liquid product at the higher particle size range is more deoxygenated and also explains
why the cetane index is lower (Zhenyi et al., 2004).
5.2.4 Effects of temperature on pyrolysis of lard
The effects of temperature on the pyrolysis of lard to gas and liquid were studied
by keeping the carrier gas flow rate (N2-50 cm3/min), packing bed height (70 mm of
quartz, 0.7-1.4 mm particle size) and lard flow rate (≈ 5.0 g/h) constant and varying the
temperature from 500 to 700oC. The smaller particle size range was used for this study
because of the higher liquid yield and higher cetane index obtained from the studies in
section 5.2.3.
Figure 5.8 shows that the volume of the gas produced increased from 4.7 L/100g
of lard at 500oC to 102.3 L/ 100g of lard at 700oC. The reactions such as
decarboxylation, decarbonylation, C-C bond cleavage, and ethylene elimination that
resulted in the formation of the bulk of the gas phase products are strongly endothermic
(Idem et al., 1996). Thus the rate of reaction increased with temperature. The effects of
temperature on the calorific value of the gas produced are also shown in Figure 5.8. The
results indicated that the calorific value of the product gas was high (about three times
that of natural gas). The calorific value of the gas decreased from 165 to 109 MJ/m3 with
an increase in temperature from 500 to 700 oC. This is due to an increase in hydrogen
and carbon-dioxide concentration at higher temperature.
The amount of total liquid product decreased from 74 to 11g/100g of lard as the
temperature increased from 500 to 700oC (Figure 5.9). Low-temperature cracking results
in the formation of relatively long-chain compounds. This led to increase in the yield of
the total liquid product at the expense of gas phase product with decrease in temperature.

58
0
40
80
120
500 550 600 650 700Temperature, oC
Vol
ume
of p
rodu
ct g
as, L
/ 100
g of
la
rd
100
125
150
175
Hea
ting
valu
e of
pro
duct
gas
, MJ/
m3
Figure 5.8 Effects of temperature on volume and heating value of products gas (process: pyrolysis, carrier gas N2: 50 cm3/min, quartz packing height 70mm, size 0.7-1.4 mm, reaction time 30 min)
0
20
40
60
80
500 550 600 650 700
Temperature, oC
Liqu
id p
rodu
ct, g
/100
g of
lard
Total liquid productDiesel-like liquid
Figure 5.9 Effects of temperature on total and diesel-like liquid yields (process:
pyrolysis, carrier gas N2: 50 cm3/min, quartz packing height: 70mm, size: 0.7-1.4 mm, reaction time: 30 min)

59
The diesel-like fraction of the liquid product is defined as the amount of liquid product
boiling off in the #2 diesel range (171-350oC). This is however seen to be maximized at
reaction temperature of 550oC and remained constant also at 600oC (Figure 5.9). This
can be explained thus: cracking at a low temperature implies that the lard undergoes
only limited decomposition and consequently yields a small amount of low boiling
components in the diesel range. Thus, there is a minimum temperature below which
thermal cracking becomes unfavourable for diesel-like liquid production. Also, at the
higher cracking temperatures, lower molecular weight products are formed. At higher
temperature more of very low boiling components are formed which also reduces the
quantity in the diesel boiling range.
The change in gas product composition as a function of temperature during
pyrolysis of lard is shown in Figure 5.10. It is seen that with increase in temperature, the
concentrations of H2, paraffins and olefins increased whereas CO and CO2 seems not to
be affected by temperature. Also, the concentration of C3+ dropped significantly with
temperature. As explained earlier, the higher the cracking temperature, the lower the
molecular weights of the products formed. Therefore at high temperature more of the
smaller molecular weight compounds such as methane, ethane, ethylene and ethane are
formed at the expense of the C3+ hydrocarbons. In addition, dehydrogenation reaction
for ethylene formation from ethyl radical is favoured at high temperatures, which
explains why hydrogen formation at 700oC, caused a further decrease in C3+ and an
increase in olefin production. A similar trend was observed by Idem et al. (1996) from
their study on canola oil pyrolysis. The effects of temperature (500-650 oC) on cetane
index (CI) and viscosity of the liquid product are given in Figure 5.11. The CI decreased
from 54 at 500oC to 9.6 at 650oC. The viscosity (at 40oC) also decreased from 22.1 to
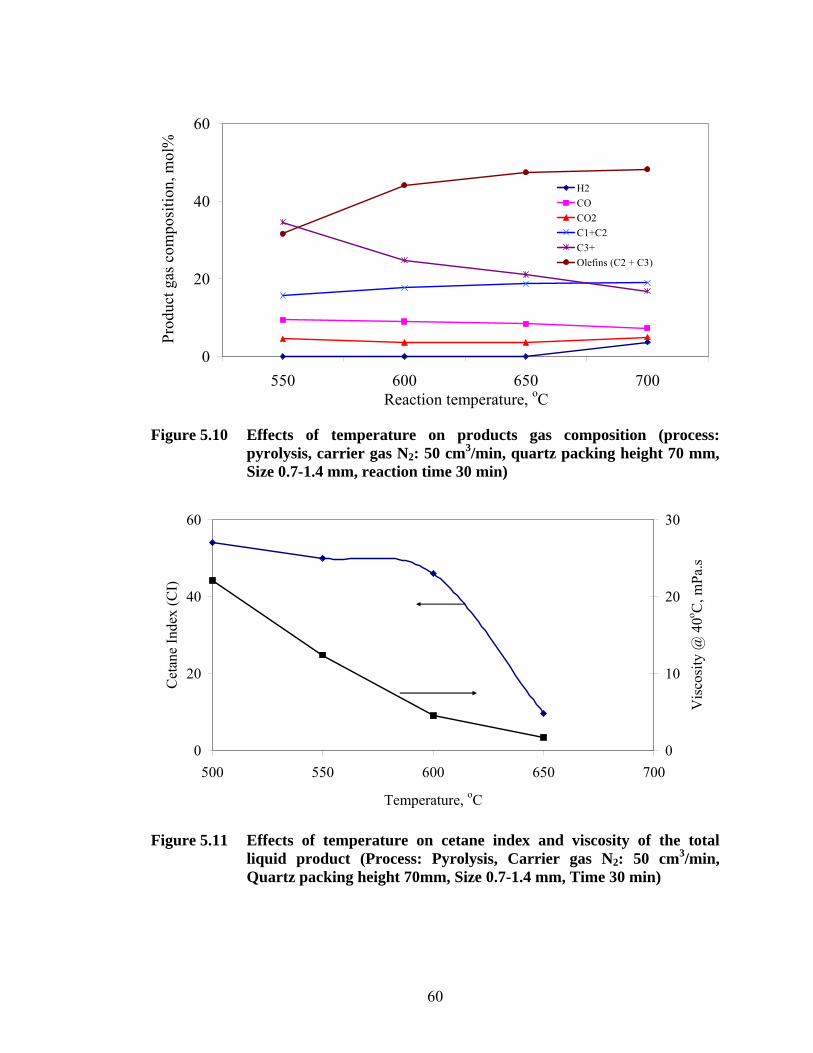
60
0
20
40
60
550 600 650 700Reaction temperature, oC
Prod
uct g
as c
ompo
sitio
n, m
ol%
H2COCO2C1+C2C3+Olefins (C2 + C3)
Figure 5.10 Effects of temperature on products gas composition (process:
pyrolysis, carrier gas N2: 50 cm3/min, quartz packing height 70 mm, Size 0.7-1.4 mm, reaction time 30 min)
0
20
40
60
500 550 600 650 700
Temperature, oC
Cet
ane
Inde
x (C
I)
0
10
20
30
Vis
cosi
ty @
40o C
, mPa
.s
Figure 5.11 Effects of temperature on cetane index and viscosity of the total
liquid product (Process: Pyrolysis, Carrier gas N2: 50 cm3/min, Quartz packing height 70mm, Size 0.7-1.4 mm, Time 30 min)

61
1.7 mPa.s. The decrease in the CI with temperature is due to the fact that more aromatics
(having lower CI) are produced at higher temperature (Schwab et al., 1987, Dandik and
Aksoy, 1998). Also, the observed trend in viscosity is expected as the percent of the high
molecular weight compounds in the liquid product decreased with temperature.
5.2.5 Effects of duration of experiment on product distribution
In order to collect enough samples for pour and cloud points determination, a run
was conducted for a period of 225 minute. Table 5.5 shows a comparison among the
products obtained for a run time of 30 minutes and 225 minutes. It was interesting to
observe that the duration of the experiment has no significant effect on the gas phase
composition, diesel-like liquid yield and the cetane index. However, the density and
viscosity of the liquid product were significantly improved by the longer time
experiment. This is probably due to the fact that the char formed over the longer time
experiment had some catalytic effect on the reaction. It is worth noting also that the gas
yield was increased and the char yield decreased significantly. A longer experiment time
implies a longer period for the formed char to be gasified to gas.
5.3 Steam Reforming of Lard
All the steam reforming experiments were conducted with the smaller particle
size quartz (0.7-1.4 mm). The liquid product in the steam reforming experiment refers to
the organic portion of the total condensate. The aqueous layer was removed by
decantation and analyzed for its water content. The organic layer was also analyzed for
its water content. The mass of the aqueous portion was between 93.8 and 99.2 wt% of

62
Table 5.5 Effects of duration of experiment on pyrolysis of lard (N2 flow rate 50 cm3/min (STP), packing particle height 70 mm and size 0.7-1.4 mm, Lard 5g/h, and Temperature 600oC)
Duration of experiment, minutes 30 225
Product gas composition mol% H2 0 0 CO 9 10.9 CO2 3.6 4.7 CH4 11 12.0 C2H4 27 27.2 C2H6 7.6 8.0 C3H6 17.1 17.2 C3H8 0.8 0.9 C4+ 24 19.1
Products yield (wt% of total product) Gas 39.8 51.7 Liquid 55.6 47.8 Char 4.5 0.45
Liquid product characterization Diesel-like liquid, g/100g lard 24.4 25.0 Cetane Index 45.8 45.9 Density kg/m3 860 845 Viscosity, mPa.s 4.5 2.4

63
the water pumped during the experiment. The water content of the aqueous portion
ranged between 97.5 and 99.8 wt% while that of the organic portion ranged between
0.85 and 1.12 wt% (Appendix C). For the runs conducted at 800oC, the organic and the
aqueous phases could not be separated because the organic portion was quite small. The
quantity of the organic portion was therefore estimated by deducting the quantity of the
water pumped from the total condensate (this evaluation assumes that water did not react
which might not be the case). The determinations of the water content of the condensates
obtained at 800oC gave inconsistent results and were therefore not reported.
5.3.1 Effects of temperature on steam reforming of lard
The effects of temperature (500-600oC) on steam reforming of lard to gas and
liquid were studied while keeping the bed height (70 mm of quartz, 0.7-1.4), steam to
lard ratio (S/L 1:1) and lard flow rate (≈ 5.0 g/h) constant. No carrier gas was used.
Figure 5.12 shows the mass of the gas product increased from 1.2 wt% at 500oC to 31.8
wt% at 600oC. For comparison purpose, the results from pyrolysis experiment at a
carrier gas flow rate of 50 cm3/min were plotted along side with that of steam reforming
(Figure 5.12). It is seen that the mass of the gas product increased from 4.7 wt% at
500oC to 39.8 wt% at 600oC during pyrolysis. The amount of liquid product during
pyrolysis decreased linearly from 78.3 to 55.6 wt% as the temperature increased from
500 to 600oC. The same trend was observed when steam was co-fed (88.7 to 63.2 wt%).
The effect of co-feeding steam was to increase the liquid product. For example at 500oC,
78.3 wt% of liquid was obtained during pyrolysis whereas 88.7 wt% was obtained when
steam was co-fed. This same trend was observed by Idem et al. (1996) during their study

64
0
25
50
75
100
480 520 560 600 640 Temperature, oC
Prod
uct y
ield
, wt%
of t
otal
pro
duct
Liquid
GasAt S/L mass ratio of 1:1At N2 flow rate of 50 cm3/min
Figure 5.12 Comparison of the effects of temperature on gas and liquid yields of pyrolysis (Carrier gas N2: 50 cm3/min) and steam reforming (S/L :1, Quartz packing height 70mm, Size 0.7-1.4 mm, Time 30 min)

65
on canola oil where the organic liquid product increased from 14.8 to 21.1wt% when
steam was introduced. On the other hand, the diesel-like liquid product was maximized
at 550oC (Figure 5.13). Similar observation was made for the pyrolysis reaction (cf
Figure 5.10) but contrary to the case of pyrolysis, the same yield was not maintained at
600oC.
The cetane index was high and found to remain almost constant (52 to 54) with
increase in reaction temperature (Figure 5.14). The viscosity was observed to decrease
with increase in temperature. The same trend was observed during pyrolysis but the
viscosity was generally lower during steam reforming. It is shown from Figure 5.14 as
compared to Figure 5.11 that the addition of steam helps to lower the viscosity. This is
probably due to the higher water content of the liquid (see Appendix C).
5.3.2 Effects of steam to lard ratio on steam reforming of lard
The effects of steam to lard mass ratio (S/L) on product yield and product gas
composition at a reaction temperature of 600oC are shown in Figures 5.15 and 5.16
respectively. It should be noted that the term “liquid product” or “total liquid product”
refers to the organic phase of the total condensate. The aqueous phase was removed and
treated as unreacted water. Increasing the S/L from 0.5 to 1.5 increased the liquid
product from 49.1 to 75.9 wt% and correspondingly decreased the gas product from 46
to 18.6 wt%. The char and residue yields were not affected by increase in S/L. A similar
trend was observed by Idem et al. (1996). They explained that the effect of increasing
S/L is similar to that of decreasing the residence time in the reactor. Therefore, the
decrease in gas production with increase in S/L can be explained thus: the reactions

66
0
30
60
90
500 550 600
Temperature, oC
Liqu
id p
rodu
ct, g
/100
g of
lard
Total liquid productDiesel-like liquid
Figure 5.13 Effects of temperature on total and diesel-like liquid yields (Process:
steam reforming, S/L: 1, quartz packing height: 70mm, size: 0.7-1.4 mm, reaction time: 30 min)
49
51
53
55
500 550 600Temperature, oC
Cet
ane
Inde
x (C
I)
3
9
15
21
27
Vis
cosi
ty @
40o C
, mPa
.s
Figure 5.14 Effects of temperature on cetane index and viscosity of the total liquid product (process: steam reforming, S/L: 1, quartz packing height: 70mm, size: 0.7-1.4 mm, reaction time: 30 min)

67
0
20
40
60
80
0.0 0.5 1.0 1.5 2.0Steam to lard mass ratio
Prod
uct y
ield
, wt%
of t
otal
pro
duct
Gas productLiquid productChar + Residue
Figure 5.15 Effects of steam to lard mass ratio (S/L) on products yield (process:
steam reforming, temperature 600oC, quartz packing height 70mm, size: 0.7-1.4 mm, reaction time: 30 min)
0
15
30
45
60
0.5 1.0 1.5Steam to lard mass ratio
prod
uct g
as c
ompo
sitio
n, m
ol%
HydrogenCOCO2C1 + C2Olefins (C2+C3)C3+
Figure 5.16 Effects of steam to lard mass ratio (S/L) on product gas composition
(process: steam reforming, temperature 600oC, quartz packing height: 70 mm, size: 0.7-1.4 mm, reaction time: 30 min)
68
responsible for the formation of most of the compounds in the gas phase are further
down in the reaction sequence and so a low residence time is detrimental to gas
formation. The composition of the gas (Figure 5.16) is seen to almost be independent of
S/L which might be due to equilibrium being reached in the gas phase. The yield of the
diesel-like liquid was not affected by an increase in S/L even though the total liquid
product increased with temperature (Figure 5.17). The effects of S/L on cetane index and
viscosity are shown in Figure 5.18. Both viscosity and cetane index were found to
increase with increase in S/L.
Steam reforming of lard was also conducted at 800oC with the intent of totally
gasifying the lard. However, it is interesting to observe that the trends followed by the
liquid, gas and char yields were different from those observed at 600oC as the S/L was
increased (Figure 5.19). The gas yield increased with an increase in S/L while the liquid
yield followed the reverse trend. An initial increase in S/L from 1 to 1.5 reduced the char
formation from 11.8 to 7.8 wt% but a further increase in S/L caused an increase in char
formation to 17 wt%. High temperature promotes cracking of feed to char (Czernik et
al., 2004), as the S/L ratio was increased more steam was available to gasify the char. At
higher S/L ratio, the residence time of the steam in the reactor was reduced so that there
was not sufficient time to gasify the char. The variation observed in the composition of
the gas is shown in Figure 5.20. Just as for the case at 600oC, the composition of the gas
was independent of S/L.

69
0
20
40
60
80
0.5 1 1.5
Steam to lard mass ratio
Liqu
id p
rodu
ct, g
/100
g of
lard
Total liquid product
Diesel-like liquid
Figure 5.17 Effects of steam to lard mass ratio (S/L) on total and diesel-like liquid
yields (process: steam reforming, temperature 600oC, quartz packing height: 70mm, size: 0.7-1.4 mm, reaction time: 30 min)
0
20
40
60
0.5 1 1.5Steam to lard mass ratio
Cet
ane
Inde
x (C
I)
0
2
4
6
8
Vis
cosi
ty @
40o C
, mPa
.s
Figure 5.18 Effects of steam to lard mass ratio (S/L) on cetane index and viscosity of the total liquid product (process: steam reforming, temperature 600oC, quartz packing height: 70mm, size: 0.7-1.4 mm, reaction time: 30 min)

70
0
25
50
75
100
0.5 1.0 1.5 2.0 2.5
Steam to lard mass ratio
Prod
uct y
ield
, wt%
of t
otal
pro
duct
Gas productLiquid productChar
Figure 5.19 Effects of steam to lard mass ratio (S/L) on products yield (process: steam reforming, temperature 800oC, quartz packing height: 70 mm, size: 0.7-1.4 mm, reaction time: 30 min)
0
10
20
30
40
50
1.0 1.5 2.0Steam to lard mass ratio
Prod
uct g
as c
ompo
sitio
n, m
ol%
Hydrogen CO CO2 C1 + C2 Olefins (C2+C3) C3+
Figure 5.20 Effects of steam to lard mass ratio (S/L) on product gas composition
(process: steam reforming, temperature 800oC, quartz packing height: 70 mm, size: 0.7-1.4 mm, reaction time: 30 min)

71
5.4 Fuel Properties of the Pyrolysis and Steam Reforming Liquid Products
The data collected from the characterization studies of the liquid product allowed
for the comparison of the properties of this product with those of conventional diesel
fuels. A comparison is shown in Table 5.6. The liquid product obtained through
pyrolysis at 600oC and 50 cm3/min carrier gas (N2) flow rate has a cetane index of 46
and density of 860 kg/m3 at 25oC, which are in agreement with the specification for #2
diesel fuel. However, the viscosity (4.5 mPa.s at 40oC) exceeds the specified value of 3.5
mPa.s for #2 diesel fuel. Also, the higher heating value of this liquid (~40 MJ/kg) is
approximately 11% less than that of diesel fuel indicating a considerable amount of
oxygenated compounds in the fuel (Schwab et al., 1988). The cloud point is high and
well above that of #2 diesel whereas the pour point is comparable to that of #2 diesel.
This is because the oxygenated compounds present interfere with the cloud point
determination but did not interfere with that of pour point. A small amount of water (~
0.5 wt%) was found in the liquid product. The water could easily be removed or retained
as the case may be. There are some beneficial consequences of the presence of water. It
causes a decrease in viscosity (as observed in this study), lowers the combustion
temperature and, as a consequence, lowers the NOx emission (Diebold, 1997). The liquid
obtained during steam reforming has better fuel properties than that of the pyrolysis
liquid (Table 5.6). No GC/MS studies were done on the liquid products from steam
reforming experiments. These studies are necessary to elucidate the reason for the
marked difference in the characteristics of the liquid products.
The simulated distillation curves for these liquids are compared to that of #2
diesel in Figure 5.21. These curves can be used to relate the volatilities of the three fuels

72
Table 5.6 Comparison of the properties of the optimum liquid obtained to automotive diesel fuel specifications for #2 diesel according to ASTM D975
Fuel property #2
Diesel Liquid product from
pyrolysis Liquid product
from steam reforming
Cetane Index 45 46 52 Density @ 25oC, kg/m3 860 860 860 Viscosity @ 40oC, mPa.s 3.5 4.5 4.0 Water content, %w/w <0.05 0.53 0.89 Gross heat of combustion, MJ/kg 45 39.9 40.1 Cloud point, oC* -8 10 nd Pour point, oC* -15 -18 nd nd: not determined * cloud and pour points were determined for the run conducted
over a period of 225 minutes
0
200
400
600
800
0 25 50 75 100Fraction distilled, wt%
Boi
ling
poin
t, o C
#2 diesel
Fuel from pyrolysis
Fuel from steam reforming
Figure 5.21 Comparison of the simulated distillation curves of the optimum
liquid products obtained to that of #2 diesel

73
(Song, 2000). The distillation behaviour of the pyrolysis fuels is comparable to that of
diesel at temperatures between 170 and 220oC. Beyond 220oC, #2 diesel is more
volatile. It rapidly distilled and lost about 95 % of its initial weight when heated up to
300oC. At about 350oC, the diesel fuel was totally distilled off whereas only 70 wt% of
the pyrolysis liquid product was distilled off at this temperature. Some residue still
remained up to about 500oC. The distillation curve of the fuel obtained through steam
reforming is similar to that of the pyrolysis fuel. A discrepancy is however observed at
about 400oC. Only 60 wt% of the fuel obtained from steam reforming was distilled off at
350oC. Some residue still remained until about 600oC. The oxygenated compounds
present in the liquid products contributed to their poor volatility as compared to #2
diesel. The liquid products can be improved by deoxygenation in order to obtain an
enriched hydrocarbon diesel-like fuel (Lema et al., 2004). This might also improve the
viscosity. The simulated distillation data for the other experimental runs are given in
Appendix G.
5.5 Energy Balance
Due to the complex composition of lard (Neff et al, 2002), the energy balance
study of this work was based on tristearin, a typical component of lard, whose
thermodynamics data are readily available. Also, it was assumed that 1 mole tristearin
cracked to produce 3 moles n-hexadecane, 2 moles ethylene, 4 moles CO and 1 mole
CO2. The energy balance was done for the experimental run conducted at a lard flow
rate of 5g/h, temperature of 600oC and carrier gas flow rate of 50 cm3/min and also for
the steam reforming experiment conducted at an S/L of 1:1 and 600oC. The detailed
energy balance is given in Appendix H. A summary table is shown in Table 5.7. The

74
Table 5.7 Summary of the energy balance during pyrolysis and steam reforming of lard
Process Pyrolysis Steam Reforming
Heat input kJ/g lard 2.4 6.3
Heat output kJ/g lard 24.2 28.2
Net energy gain kJ/g lard 21.8 21.9
heat required to preheat the feed to the reaction temperature and that required for the
endothermic cracking (pyrolysis) reaction at 600oC, taking 15% heat loss into
consideration, sum up to 2.4 kJ/g of lard fed. The energy content of the liquid and
gaseous fuels produced sum up to 24.2 kJ/g lard fed. Therefore, the net energy gain was
21.7 kJ/g of lard.
For the case of the steam reforming experiment, it was assumed that steam did
not take part in the reaction. The total energy required for preheating lard and water and
for the reaction, accounting for 15% heat loss, was 6.3 kJ/g of lard. The total energy
recoverable from the liquid and gaseous fuel produced was 28.1 kJ/g of lard. Therefore,
the net energy gain from the steam reforming process was 21.9 kJ/g of lard.
It should be noted that substantial amount of heat can be recovered by cooling
the products to room temperature from the reaction temperature. This heat has not been
considered in the energy balance calculation. Inclusion of this heat will give the energy
balance a better picture.

75
5.6 Comparison of Products from Pyrolysis of BDO and Lard
A comparison between the products yields, gas composition and properties
obtained during pyrolysis of BDO and lard is given in Table 5.8. The data is based on
the runs conducted at 800oC, carrier gas (N2) flow rate of 30 cm3/min and quartz packing
particles of 1.7-2.4 mm using Eldex A-10-S pump.
It is interesting to note from Table 5.8 that under similar operating conditions,
hydrogen yield from lard is over 56% more than that obtainable from BDO. This can be
explained based on their respective CHN analysis. The percentage of hydrogen in BDO
is 8.3 wt% whereas it is 12.2 wt% in lard (Tables 4.2 and 5.1). The higher percentage of
carbon oxides (CO and CO2) observed in BDO (45.8 mol%) than lard (20.7 mol%) is
also due to the marked difference (56.0 wt% for BDO and 10.5 wt% for lard) in the
oxygen wt% obtained by difference from CHN analysis. The synthesis gas yield from
BDO (73.0 mol%) was higher than from lard (62.2 mol%) because the CO yield from
BDO was very large. However, very high H2/CO (~5) was obtained from lard as against
~1 from BDO. In addition, the hydrocarbon yield from lard (28.3 mol%) was slightly
higher than that from BDO (21.2 mol%).
Thus, higher heating value gas was obtained from lard. This is probably also due
to the marked difference in their (BDO and lard) carbon content. The volume of gas
produced per 100 g of feed was quite high for lard (~ 160 L) whereas about 38 L of gas
per 100g of feed was obtained for BDO. The lard was completely converted to gas and
char. About 42 wt% of condensate was obtained from BDO which explains why the gas
yield was low.

76
Table 5.8 Comparison of products obtained from BDO and lard pyrolysis (temperature: 800oC, quartz packing height: 70mm, size: 1.7-2.4 mm, reaction time: 30 min)
Feed stock Biomass-derived oil Lard Temperature oC 800 800 Q. particle size mm 1.7-2.4 1.7-2.4 Carrier gas (N2) cm3/min 30 30 Feed pumped 2.0 2.2 Condensate wt% 41.9 0 Char wt% 23.4 31.8 Gas wt% 34.8 67.2
Gas composition mol% H2 33.1 51.8 CO 39.9 10.4 CO2 5.9 10.3 CH4 14.4 11.4 C2H4 5.5 10.1 C2H6 0.6 2.5 C3H6 0.4 2.7 C3H8 0.03 0.1 C4+ 0.3 1.5 H2+CO 73.0 62.2 H2/CO 0.83 4.98 Heating Value MJ/m3 22.1 30.5 Volume of gas L/100g feed 37.7 160.0
On the basis the results in Table 5.8, it can be inferred that lard is a better
feedstock for the production of hydrogen, char, high heating value gas and high H2/CO
ratio than BDO. On the other hand, BDO is the preferred feedstock for the production of
synthesis gas with H2/CO in the vicinity of 1. With possible steam reforming reaction,
this feedstock can be further improved to H2/CO ratio of 2 which is a good ratio for
Fischer-Tropsch synthesis.

77
6. CONCLUSIONS AND RECOMMENDATIONS
6.1 Conclusions
This research focused on two main feed stocks (BDO and lard) and their
conversion to value added products. The main objective of the study on BDO was to use
CO2 for its reforming thereby finding a sink for the greenhouse gas (CO2). A list of the
conclusions drawn from the observations on this study is presented in Section 6.1.1. The
objective on the study on lard was based on converting animal fats, a waste product of
the livestock industry, to gaseous and liquid fuels. The conclusions drawn from results
obtained on this study are listed in Section 6.1.2.
6.1.1 CO2 reforming of biomass derived oil
The following conclusions were drawn from the studies on CO2 reforming of
BDO.
1. BDO has been converted to synthesis gas and medium heating value gaseous fuel by
CO2 reforming. The product gas consisted mostly of H2, CO, CO2, CH4 and C2H4.
Composition of product gas ranged between synthesis gas 61-76 mol%, CH4 3-18
mol%, and C2H4 1-6.5 mol%.
2. The synthesis gas production was high (> 60 mol%) in all cases, with or without
addition of CO2. The maximum production of synthesis gas (~76 mol%) was
observed at a total carrier gas flow rate of 60 cm3/min and a mole fraction of CO2 in
carrier gas of 0.1. The maximum gas production (51 wt%) was observed at a total
carrier gas flow rate of 30 cm3/min containing 20 mol% of CO2.

78
3. Maximum hydrogen (42 mol%) and H2 to CO molar ratio (1.44) were obtained while
using only N2 as the carrier gas at a flow rate of 50 cm3/min.
4. The addition of CO2 to N2 in the carrier gas led to less char formation and more gas
production. The char formation decreased with an increase in mole fraction of CO2
in the carrier gas (50 cm3/min) from 0 to 0.5 but increased as the mole fraction of
CO2 increased to one. The minimum char formation (18 wt%) for all the experiments
conducted was observed at a total carrier gas (N2 + CO2) flow rate of 50 cm3/min
containing 50 mol% CO2.
5. The maximum product gas heating value (25 MJ/m3) and alkanes production (18
mol%) were obtained at a total carrier gas flow rate of 30 cm3/min containing 40
mol% CO2.
6. The study shows that in the range of residence time considered, CO2 is not consumed
in BDO gasification at 800oC.
6.1.2 Pyrolysis and steam reforming of lard
The following conclusions were drawn from the studies on pyrolysis and steam
reforming of lard in a fixed bed reactor.
1. A diesel-like liquid has been produced from pyrolysis and steam reforming of
lard in the absence of a catalyst. This study also identifies animal fats as a source
of high calorific value (68 - 165 MJ/m3) gaseous fuel. Lard was converted to
liquid product containing diesel boiling range hydrocarbons and gas product
which consists mostly of C1-C3 hydrocarbons, CO, CO2 and H2 by pyrolysis and
steam reforming.

79
2. Pyrolysis of lard is strongly influenced by temperature, residence time and
packing particle size in the reactor. The total liquid product increased with
decrease in temperature. The diesel-like liquid yield decreased with increase in
residence time but was not affected with increase in packing particle size. The
maximum yield for diesel-like liquid product (37g/100g lard) was obtained at
600oC, residence time of 1.5 s and packing particle size of 1.7- 2.4 mm.
3. The liquid product essentially consists of linear and cyclic alkanes and alkenes,
aromatics, ketones, aldehydes and carboxylic acids. The liquid product having
fuel properties closest to that of conventional #2 diesels was obtained at a
pyrolysis temperature of 600oC and carrier gas flow rate of 50 cm3/min
(residence time 1.8 s) while using quartz chips particle size of 0.7-1.4 mm as
reactor packing material. The liquid has a CI of 46, specific gravity of 0.86,
viscosity of 4.5 mPa.s at 40oC, a heating value of ~ 40MJ/kg, and cloud and pour
points of 10 and -18 respectively.
4. The total liquid product from steam reforming of lard increased with increase in
the steam to lard ratio. The maximum diesel-like liquid yield from the steam
reforming process (39 g/100g of lard) was obtained at a steam to lard mass ratio
of 1.5 and a temperature of 600oC. This value is not significantly different from
that obtained from pyrolysis. Higher cetane index (52) and lower viscosity (4.0 at
40oC) were obtained by adding steam.
5. The net energy recovered from pyrolysis and steam reforming processes was
approximately 21.9 kJ/g of lard. Thus, the processes are energy efficient.

80
In comparison, lard is a better feedstock for the production of hydrogen, char,
high heating value gas and high H2/CO ratio than BDO. On the other hand, BDO is the
preferred feedstock for the production of synthesis gas with H2/CO in the vicinity of 1.
6.2 Recommendations
6.2.1 CO2 reforming of biomass-derived oil
From the experimental work and the results obtained from CO2 reforming of
BDO, the following recommendations are made:
1. CO2 reforming of BDO could be carried out at a higher pressure and/or
temperature to enhance char gasification to CO.
2. Analysis of the liquid products obtained of CO2 reforming of BDO is necessary
to thoroughly understand the role of CO2 in the process
6.2.2 Pyrolysis and steam reforming of lard
The following recommendations are made based on the experiments and the
results obtained from pyrolysis and steam reforming of lard to fuels and chemicals.
1. A detailed analysis of the liquid product is required; this could be done by first
converting the carboxylic acids in the product into water soluble salts by
neutralization with KOH. The water insoluble hydrocarbon phase can then be
separated and analyzed by GC. The resultant solution of salts of carboxylic acids
can then be converted to esters by acidification. The esters can then be analyzed
by gas chromatography (Dandik and Aksoy, 1998).
2. For the heat source, microwave assisted heating rather than the conventional
heating can be considered. It has been shown that microwave assisted heating

81
during pyrolysis leads to less aromatics and polyaromatics formation
(Dominguez et al, 2003)
3. Although there is an advantage of using oxygenated fuel (e.g. biodiesel) in terms
of reduction in the release of CO into the atmosphere, if needed, the produced
fuel can be deoxygenated further by distillation to remove the heavy oxygenated
compounds.
4. The experimental design in this study was based on the study of a single factor
such as temperature at a time. A further study is needed to examine the
interactive effects of the factors affecting the process so as to obtain a “true”
optimum.

82
6. REFERENCES
Adjaye, J. D., R. K. Sharma. and N. N. Bakhshi, “Characterization and Stability Analysis of Wood-Derived Bio-oil”, Fuel Processing Technology, 31, 241-256 (1992).
Alencer, J.W., P. B. Alves and A. A. Craveiro, “Pyrolysis of Tropical Vegetable Oils”, J. Agric. Food Chem., 31, 1268-1270 (1983).
Ali, Y. and M. A. Hanna, “Physical Properties of Tallow Ester and Diesel Fuel Blends”, Bioresource Technology, 47, 131-134 (1994).
AOCS Ca 5a-40: Free fatty acids. In: Official Methods and Recommended Practices of the AOCS, 5th ed. American Oil Chemists' Society Press, Champaign, IL (1997).
ASTM D97-96: Standard test method for pour point of petroleum products. In: Annual Book of ASTM Standards, vol. 05.01. ASTM, Philadelphia, PA, 76–79 (1998).
ASTM D240-92: Standard test method for heat of combustion of liquid hydrocarbon fuels by bomb calorimeter. In: Annual Book of ASTM Standards, vol. 05.01. ASTM, Philadelphia, PA,133–140 (1998).
ASTM D2500-91: Standard test method for cloud point of petroleum products. In: Annual Book of ASTM Standards, vol. 05.01. ASTM, Philadelphia, PA, 845–847 (1998).
ASTM D5002-94: Standard test method for calculated cetane index of distillate fuels. In: Annual Book of ASTM Standards, vol. 05.03. ASTM, Philadelphia, PA, 263–266 (1998).
ASTM D976-91: Standard test method for cloud point of petroleum products. In: Annual Book of ASTM Standards, vol. 05.01. ASTM, Philadelphia, PA, 340-342) (1998).
ASTM D2887-97: Standard test method for boiling range distribution of petroleum fractions by gas chromatography. In: Annual Book of ASTM Standards, vol. 05.03. ASTM, Philadelphia, PA, 195–204 (1998).
Bharadwaj, S.S. and L.D. Schmidt, “Catalytic Partial Oxidation of Natural Gas to Syngas”, Fuel Processing Technology, 42, 109-127 (1995).

83
Billaud, F., V. Dominguez, P. Broitin and C. Busson, “Production of Hydrocarbons by Pyrolysis of Methyl Esters from Rapeseed Oil”, J. Am. Oil Chem. Soc., 72, 1149–1154 (1995).
Caballero, M. A., M. P. Aznar, J. Gil, J.A. Martin, E. Frances and J. Corella, “Commercial Steam Reforming Catalysts To Improve Biomass Gasification with Steam-Oxygen Mixtures: 1. Hot Gas Upgrading by the Catalytic Reactor”, Ind. Eng. Chem. Res., 36, 5227-5239 (1997).
Chaala A. and C. Roy, “Recycling of Meat and Bone Meal Animal Feed by Vacuum Pyrolysis”, Environ. Sci. Technol., 37, 4517-4522 (2003).
Chang, C.C. and S.W. Wan, “China's Motor Fuels from Tung Oil”, Ind. Eng. Chem., 39, 1543-548 (1947).
Chaudhari, S.T. and N.N. Bakhshi “Steam Gasification of Chars and Bio-oil” Report to Bioenergy Development Program Renewable Energy Branch, Energy, Mines and Resources, Ottawa Canada, 219-242 (2002).
Chaudhari, S.T., S.K. Bej, N. N. Bakhshi, and A.K. Dalai, “Steam Gasification of Biomass-Derived Char for the Production of Carbon Monoxide-Rich Synthesis Gas”, Energy & Fuels, 15, 736-742 (2001).
Corella, J., A. Orio, and P. Aznar, “Biomass Gasification with Air in Fluidized Bed: Reforming of the Gas Composition with Commercial Steam Reforming Catalysts” Ind. Eng. Chem. Res, 37, 4617- 4624 (1998).
Czernik, S., R. French, C. Feik and E. Chornet, “Production of Hydrogen from Biomass Derived Liquids”, Proceeding of the 2001 DOE Hydrogen Program Review NREL/CP-570-30535 (2001).
Dandik, L. and H.A. Aksoy, “Pyrolysis of Used Sunflower Oil in the Presence of Sodium Carbonate by Using Fractionating Pyrolysis Reactor”, Fuel Processing Technology, 57, 81- 92 (1998).
Demirbas, A “Biodiesel Fuels from Vegetable Oils via Catalytic and Non-catalytic Supercritical Alcohol Transesterifications and Other Methods: a Survey”, Energy Conversion and Management, 44, 2093-2109 (2003).
Diebold, J.P., T.A. Milne, S. Czernik, A. Oasmaa, A.V. Bridgwater, A. Cuevas, S. Gust, D. Huffman and J. Piskorz, “Proposed Specifications for Various Grades of Pyrolysis Oils” In: A.V. Bridgwater and D.G.B. Boocock (Eds.), Developments in Thermochemical Biomass Conversion, Blackie Academic and Professionals, London, 433–447 (1997).

84
Dominguez, A., J.A. Menendez, M. Inguanzo, P.L. Bernad, and J.J. Pis, “Gas Chromatographic-Mass Spectrometric Study of the Oil Fractions Produced by Microwave-Assisted Pyrolysis of Different Sewage Sludges”, Journal of Chromatography A, 1012, 193-206 (2003)
Diebold, J. and J. Scahill, “Production of Primary Pyrolysis Oil in a Vortex Reactor” In: E.J. Soltes, T.A. Milne (Eds.), Pyrolysis Oils from Biomass: Producing, Analyzing and Upgrading, ACS Symposium Series 376, American Chemical Society, 31- 40 (1988). Diebold, J. P. and A.V. Bridgwater, “Overview of Fast Pyrolysis of Biomass for the Production of Liquid Fuels” In: A.V. Bridgwater, D.G.B. Boocock (Eds.), Developments in Thermochemical Biomass Conversion, Blackie, London, 1, 5-26 (1997). DynaMotive Energy Systems Corporation,”Fast Pyrolysis of Bagasse to Produce Bio-oil Fuel for Power Generation” 2001 Sugar Conference, (2001).
Ferdous, D., A.K. Dalai, S.K. Bej, R.W. Thring, and N.N. Bakhshi, “Production of H2 and Medium Btu Gas via Pyrolysis of Lignins in a Fixed-Bed Reactor”, Fuel Process. Technol., 70, 9-26 (2001).
Graham, R.G., B.A. Freel and M.A. Bergougnou, “The Production of Pyrolysis Liquids, Gas, and Char from Wood and Cellulose by Fast Pyrolysis” In: A.V. Bridgwater, J.L. Kuester (Eds.), Research in Thermochemical Biomass Conversion, Elsevier, London, 629-641 (1988). Green Oasis EnviroEconomicsTM, http://www.greenoasis.com/product/overview.html, accessed on March 10, 2004 Gunstone, F.D. http://www.britanniafood.com/german/invite_05.htm#three, accessed on Sept 4, 2004 Hoogwijk, M., A. Faaij, R. Broek, G. Berndes, D. Gielen and W. Turkenburg “Exploration of the Ranges of the Global Potential of Biomass for Energy”, Biomass and Bioenergy, 25, 119-133 (2003). Idem, R.O., S.P.R. Katikaneni, and N. N. Bakhshi, “Thermal Cracking of Canola Oil: Reaction Products in the Presence and Absence of Steam”, Energy and Fuels 10, 1150-1162 (1996). Ikura, M, M. Stanciulescu, and E. Hogan, “Emulsification of Pyrolysis Derived Bio-oil in Diesel Fuel” Biomass and Bioenergy, 24, 221-232 (2003). Islam, M. N., M. N. Islam and M. R. A. Beg, “The Fuel Properties of Pyrolysis Liquid Derived from Urban Solid Wastes in Bangladesh” Bioresource Technology, 92, 181-186 (2004).

85
Janse, A.M.C., W. Prins and W.P.M. van Swaaij, “Development of a Small Integrated Pilot Plant for Flash Pyrolysis of Biomass” In: A.V. Bridgwater, D.G.B. Boocock (Eds.), Developments in Thermochemical Biomass Conversion, 1, 368-377 (1997).
Katikaneni, S. P. R., J. D. Adjaye, R.O. Idem and N. N. Bakhshi. ” Performance Studies of Various Cracking Catalysts in the Conversion of Canola Oil to Fuels and Chemicals in a Fluidized-Bed Reactor” J. Am. Oil Chem. Soc., 75, 381-391 (1998).
Karaosmonoglu, F. “Vegetable Oil Fuels: a Review” Energy Sources, 21, 221–231 (1999).
Krawczyk, T., “Biodiesel – Alternative Fuel Makes Inroads but Hurdles Remain”. INFORM 7, 801–829 (1996)
Lima, D. G., V. C. D. Soares, E. B. Ribeiro, D. A. Carvalho, E.C.V. Cardoso, F.C. Rassi, K.C. Mundim, J.C. Rubim and P. A. Z. Suarez, “Diesel-like Fuel Obtained by Pyrolysis of Vegetable Oils” Journal of Analytical and Applied Pyrolysis, 71, 987-996 (2004). Ma, F. and M.A. Hanna, “Biodiesel Production: a Review” Bioresource Technology, 70,1-15 (1999). Ma, F., L. D.Clements, and M.A. Hanna, “The Effects of Catalyst, Free Fatty Acids and Water on Transesterification of Beef Tallow” Trans. ASAE, 41, 1261–1264 (1998).
Marquevich, M., R. Coll and D. Montane, “Steam Reforming of Sunflower Oil for Hydrogen Production”, Ind. Eng. Chem. Res., 39, 2140–2147 (2000).
Meier, D., A. Oasmaa and G.V.C. Peacocke, “Properties of Fast Pyrolysis Liquids: Status of Test Methods” In: A.V. Bridgwater, D.G.B. Boocock (Eds.), Developments in Thermochemical Biomass Conversion, Blackie, London, 1, 391- 408 (1997). Milne, T., F. Agblevor and M. Davis., ”A Review of the Chemical Composition of Fast Pyrolysis Oils from Biomass” In: A.V. Bridgwater, D.G.B. Boocock (Eds.), Developments in Thermochemical Biomass Conversion, Blackie, London, 1, 409-424 (1997). Mleczko, L., S. Malcus, and T. Wurzel “Catalytic Reformer-Combustor: A Novel Reactor Concept for Synthesis Gas Production”, Ind. Eng. Chem. Res., 36, 4459 – 4465 (1997).
Neff, W. E., K. R. Steidley, G. R. List, G. Snowder and W.C. Byrdwell, “Triacylglycerol Structure of Animal Tallows, Potential Food Formulation Fats, by High Performance Liquid Chromatography Coupled with Mass Spectrometry”, Journal of Liquid Chromatography and Related Technologies, 25, 985-998 (2002).
Panigrahi, S., A.K. Dalai and N.N. Bakhshi, “Production of Syngas/High Btu Gaseous

86
Fuel from the Pyrolysis of Biomass Derived Oil”, Paper # 508572. ACS Division of Fuel Chemistry Symposium, Orlando, FL, April 7-11, 6 pages, (2002). Panigrahi, S., A.K. Dalai, S. T. Chaudhari, and N.N. Bakhshi, “Synthesis Gas Production from Steam Gasification of Biomass-Derived Oil”, Energy and Fuels, 17, 637-642 (2003). Panigrahi, S, “Pyrolysis and Steam Gasification of Bio-oil to Produce High Calorific Value and Synthesis Gases”, M.Sc. thesis, University of Saskatchewan, (2003). Parr® Operating Instructions Manual for the 1108 Oxygen Combustion Bomb, 2 (1997). Pioch, P., P. Lozano, M.C. Rasoanatoandro, J. Grailla, P. Geneste and A. Guida, “Biofuels from Catalytic Cracking of Tropical Vegetable Oils”, Oleagineux, 48, 289–291 (1993). Piskorz, J., D.S. Scott, and D. Radlein, “Composition of Oils Obtained by Fast Pyrolysis of Different Woods” In: E.J. Soltes, T.A. Milne (Eds.), “Pyrolysis Oils From Biomass: Producing, Analyzing and Upgrading”, ACS Symposium Series 376, American Chemical Society, Washington, D.C., 167-178, (1988). Prasad, Y.S., N. N. Bakhshi, J. F. Mathews and R. L. Eager. “Catalytic Conversion of Canola Oil to Fuels and Chemical Feedstocks. Part I. Effect of Process Conditions on the Performance of HZSM-5 Catalyst”, Can. J. Chem. Eng., 64, 278-284 (1986). Quick, G.R. “Developments in Use of Vegetable Oil as Fuel for Diesel Engines” In: ASAE paper No. 80-1525, ASAE, St Joseph, MI (1980). Radovanovic, M., R. H. Venderbosch, W. Prins and W. P. M. van Swaaij, “Some Remarks on the Viscosity Measurement of Pyrolysis Liquids”, Biomass and Bioenergy, 18, 209-222 (2000). Rathi, A. K. A., “Environmental Control, Energy Conservation and Utilization of Carbon-dioxide”, Chemical Engineering World, Industrial Publications, Bombay, India, 33-39, (1994). Robertson, Ernest E. “Biomass” Solar Energy Conversion 2: Selected Lectures from the 1980 International Symposium on Solar Energy Utilization, London, Ontario, Canada Pergamon Press 355-357 (1981). Russell, S. and M. Cannon, “Cattle market update”, Saskatchewan Agricultural, Food and Rural Revitalization, August 16-20, 2004 accessed on Jan 4, 2005 http://www.agr.gov.sk.ca/docs/reports/catt_market/CM040820.pdf Sanford S. and J. Allshouse, “Have we turned the corner on fats consumptions?” Food Review (http://www.findarticles.com/p/articles/mi_m3765/is_3_21/ai_56013999) Sept-Dec (1998) assessed on Jan 4, 2005

87
Schwab, A.W., M.O. Bagby and B. Freedman, “Preparation and Properties of Diesel Fuels from Vegetable Oils”, Fuel, 66, 1372–1378 (1987). Schwab, A.W., G.J. Dykstra, E. Selke, S.C. Sorenson and E.H. Pryde, “Diesel Fuel from Thermal Decomposition of Soybean Oil” J. Am. Oil Chem. Soc., 65, 1781–1785 (1988). Scott, D.S., J. Piskorz and D. Radlein, “Liquid Products from Continuous Flash Pyrolysis of Biomass”, Ind. Eng. Chem. Process Des. Dev., 24, 581-588 (1985). Sipila, K., E. Kuoppala, L. Fagernas, and A. Oasmaa, “Characterization of Biomass-Based Flash Pyrolysis Oils", Biomass and Bioenergy, 14, 103-113 (1998). Snoeck, J.W. and G.F. Froment, “Steam/CO2 Reforming of Methane. Carbon Filament Formation by the Boudouard Reaction and Gasification by CO2, by H2, and by Steam: Kinetic Study”, Ind.Eng.Chem.Res, 41, 4252-4265 (2002). Song, C. “Introduction to Chemistry of Diesel Fuels” In: C. Song, C.S. Hsu and I. Moshida (Eds.), Chemistry of Diesel Fuels, Taylor and Francis, London, 13 (2000).
Sonntag, N.O.V, “Structure and Composition of Fats and Oils. Bailey's Industrial Oil and Fat Products”, vol. 1, 4th edition, Swern, D. (Ed.) John Wiley and Sons, New York, 1(1979).
Srivastava, A and R. Prasad, “Triglycerides-Based Diesel Fuels”, Renewable and Sustainable Energy Reviews, 4, 111-133 (2000) Supple, B., R. Howard-Hildige, E. Gonzalez-Gomez, and J.J. Leahy, “The Effect of Steam Treating Waste Cooking Oil on the Yield of Methyl Ester”, J. Am. Oil Chem. Soc., 79, 175–178 (1999). Vonghia, E., D.G. B. Boocock, S. K. Konar and A. Leung. “Pathways for the Deoxygenation of Triglycerides to Aliphatic Hydrocarbons over Activated Alumina” Energy and Fuel, 9, 1090- 1096 (1995). Watson, R.T. and the Core Writing Team (Eds.) “Climate Change 2001 Synthesis Report- Summary for Policy Makers” Intergovernmental Panel on Climate Change (IPCC), Geneva, Switzerland, (2001). Wiltsee, G., “Waste Grease Resource in 30 US Metropolitan Areas” In: Proceedings of Bioenergy Conference, 4-8 October Wisconsin Madison USA, 956–963 (1998). Zhenyi, C. J. Xing, L. Shuyuan and L. Li, “Thermodynamics Calculation of the Pyrolysis of Vegetable Oils” Energy Sources, 26, 849 – 856 (2004)

88
APPENDICES
Appendix A: Calibration Curves
0
200
400
600
800
1000
0 2 4 6 8Distance from base of Packing, cm
Rea
ctor
bed
tem
pera
ture
, o C
T= 550 deg CelsiusT= 600 deg CelsiusT = 650 deg celsiusT= 700 deg CelsiusT = 750 deg CelsiusT = 800 deg CelsiusT = 810 deg Celsius
Figure A-1 Temperature profile in the reactor
y = 0.9934x - 1.1313R2 = 1
500
600
700
800
900
500 550 600 650 700 750 800 850
Controller set point 0C
Ave
rage
bed
tem
pera
ture
0C
Figure A-2 Temperature Controller Calibration

89
y = 13.837x - 1.4893R2 = 0.9976
0
5
10
15
20
0 0.2 0.4 0.6 0.8 1 1.2
Pump setting
Mas
s flo
wra
te (g
/hr)
Figure A-3 Calibration of Eldex A-10-S pump for BDO
y = 0.9484x + 0.4453R2 = 0.9998
0
20
40
60
80
0 10 20 30 40 50 60 70
Set point
Nitr
ogen
flo
w ra
te (m
l/min
)
Figure A-4 Calibration of mass flow meter (SN 70327) for N2 at STP

90
y = 0.7546x - 0.1818R2 = 0.9993
0
20
40
60
80
0 10 20 30 40 50 60 70 80 90
Set point
CO
2 flo
w ra
te (m
l/min
)
Figure A-5 Calibration of mass flow meter (SN 70328) for CO2 at STP
y = -3E-15x2 + 4E-10xR2 = 0.9968
0.0E+00
4.0E-06
8.0E-06
1.2E-05
1.6E-05
0 10 20 30 40 50
Peak Area x 10-3
Mol
e H
2 inj
ecte
d at
STP
Figure A-6 Calibration of GC 5890 for Hydrogen

91
y = 7E-12xR2 = 0.9994
0.E+00
1.E-06
2.E-06
3.E-06
4.E-06
5.E-06
0 200 400 600
Peak Area x 10-3
Mol
e C
O2 i
njec
ted
at S
TP
Figure A-7 Calibration of GC 5890 for Carbon dioxide
y = 5E-19x2 + 8E-12xR2 = 0.9998
0.E+00
4.E-06
8.E-06
1.E-05
2.E-05
2.E-05
2.E-05
0 1000 2000 3000
Peak Area x 10-3
Mol
e C
O in
ject
ed a
t STP
Figure A-8 Calibration of GC 5890 for Carbon monoxide

92
y = 9E-13x + 4E-09R2 = 0.9992
0.E+00
2.E-07
4.E-07
6.E-07
8.E-07
0 200 400 600 800
Peak area x 10-3
Mol
e m
etha
ne in
ject
ed a
t STP
Figure A-9 Calibration of Carle GC for methane
y = 3E-13x - 7E-09R2 = 0.9976
0.E+00
1.E-07
2.E-07
3.E-07
0 200 400 600 800
Peak Area x 10-3
Mol
e pr
opyl
ene
inje
cted
at S
TP
Figure A-10 Calibration of Carle GC for propylene
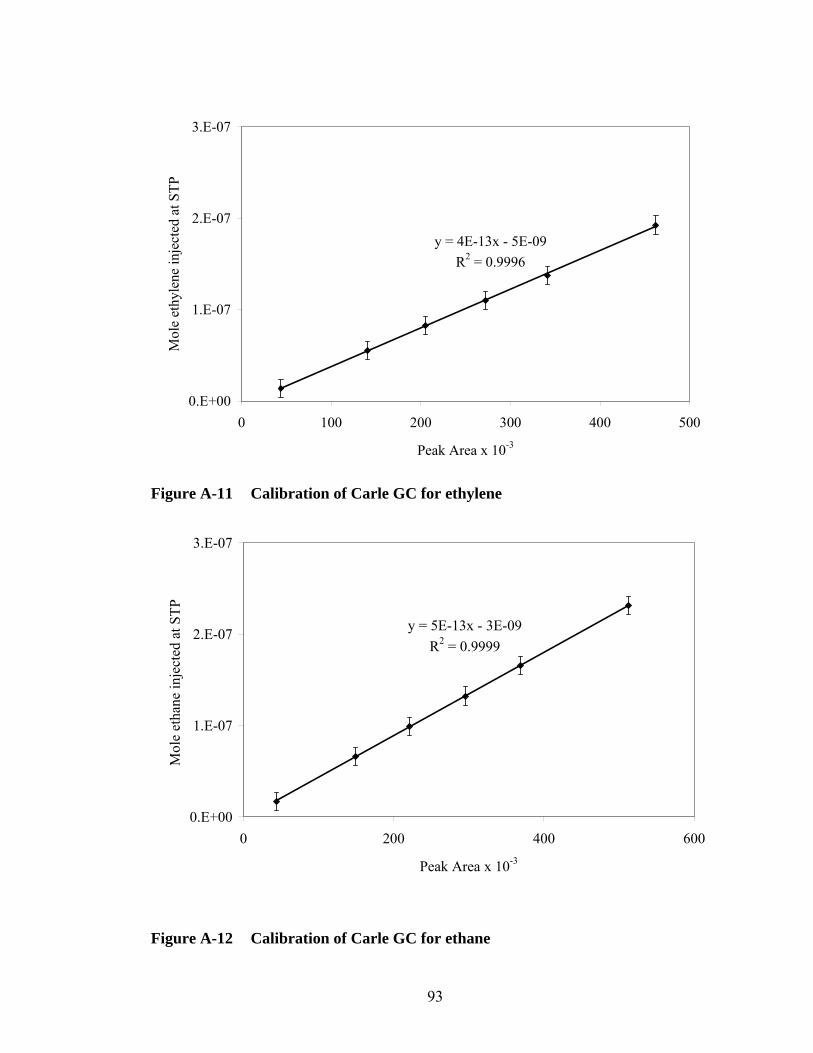
93
y = 4E-13x - 5E-09R2 = 0.9996
0.E+00
1.E-07
2.E-07
3.E-07
0 100 200 300 400 500
Peak Area x 10-3
Mol
e et
hyle
ne in
ject
ed a
t STP
Figure A-11 Calibration of Carle GC for ethylene
y = 5E-13x - 3E-09R2 = 0.9999
0.E+00
1.E-07
2.E-07
3.E-07
0 200 400 600
Peak Area x 10-3
Mol
e et
hane
inje
cted
at S
TP
Figure A-12 Calibration of Carle GC for ethane

94
y = 3E-13x - 3E-09R2 = 0.9997
0.E+00
4.E-08
8.E-08
1.E-07
2.E-07
2.E-07
0 200 400 600
Peak area x 10-3
Mol
e pr
opan
e in
ject
ed a
t STP
Figure A-13 Calibration of Carle GC for propane
y = 2E-13x - 3E-09R2 = 0.9999
0.E+00
4.E-08
8.E-08
1.E-07
2.E-07
2.E-07
0 200 400 600 800
Peak area x 10-3
Mol
e is
obut
ene
inje
cted
at S
TP
Figure A-14 Calibration of Carle GC for isobutene

95
y = 3E-13x - 6E-09R2 = 0.992
0.E+00
2.E-08
4.E-08
6.E-08
8.E-08
0 50 100 150 200
Peak area x 10-3
Mol
e 1-
bute
ne in
ject
ed a
t STP
Figure A-15 Calibration of Carle GC for 1-butene
y = 1E-19x2 + 1E-13x - 2E-09R2 = 0.9909
0.E+00
2.E-08
4.E-08
6.E-08
8.E-08
0 100 200 300 400
Peak area x 10-3
Mol
e n-
buta
ne in
ject
ed a
t ST
P
Figure A-16 Calibration of Carle GC for n-butane

96
y = 8E-13x - 2E-08R2 = 0.9828
0.0E+00
4.0E-08
8.0E-08
1.2E-07
1.6E-07
0 40 80 120 160
Peak area x 10-3
Mol
e tr
ans/
cis b
uten
e in
ject
ed a
t ST
P
Figure A-17 Calibration of Carle GC for cis/trans-butene
y = 5E-12xR2 = 0.9999
0.E+00
2.E-07
4.E-07
6.E-07
8.E-07
1.E-06
0 40 80 120 160 200
Peak Area x 10-3
Mol
e m
etha
ne in
ject
ed a
t ST
P
Figure A-18 Calibration of GC 5880 for methane

97
y = 3E-12xR2 = 0.9996
0.E+00
1.E-07
2.E-07
3.E-07
4.E-07
0 20 40 60 80 100
Peak Area x 10-3
Mol
e E
thyl
ene
inje
cted
at S
TP
Figure A-19 Calibration of GC 5880 for ethylene
y = 3E-12xR2 = 0.9999
0.E+00
1.E-07
2.E-07
3.E-07
4.E-07
0 40 80 120
Peak Area x 10-3
Mol
e et
hane
inje
cted
at S
TP
Figure A-20 Calibration of GC 5880 for ethane

98
y = 3E-12xR2 = 1
0.E+00
1.E-07
2.E-07
3.E-07
4.E-07
0 40 80 120
Peak Area x 10-3
Mol
e pr
opyl
ene
inje
cted
at S
TP
Figure A-21 Calibration of GC 5880 for propylene
y = 2E-12xR2 = 1
0.E+00
5.E-08
1.E-07
2.E-07
2.E-07
3.E-07
0 20 40 60 80 100
Peak Area x 10-3
Mol
e pr
opan
e in
ject
ed a
t ST
P
Figure A-22 Calibration of GC 5880 for propane

99
y = 3E-12xR2 = 0.9999
0.0E+00
4.0E-08
8.0E-08
1.2E-07
0 10 20 30 40
Peak Area x 10-3
Mol
e 1-
bute
ne in
ject
ed a
t ST
P
Figure A-23 Calibration of GC 5880 for 1-butene
y = 2E-12xR2 = 0.9996
0.E+00
1.E-07
2.E-07
3.E-07
0 40 80 120
peak area x10-3
Mol
e is
obut
ene
inje
cted
at S
TP
Figure A-24 Calibration of GC 5880 for isobutene

100
y = 2E-12xR2 = 0.9989
0.0E+00
4.0E-08
8.0E-08
1.2E-07
0 10 20 30 40 50
peak area x10-3
Mol
e n-
buta
ne in
ject
ed a
t ST
P
Figure A-25 Calibration of GC 5880 for n-butane
y = -6E-17x2 + 1E-11xR2 = 0.9981
0.E+00
4.E-08
8.E-08
1.E-07
2.E-07
2.E-07
0 4 8 12 16 20
peak area x 10-3
Mol
e ci
s/tr
ans b
uten
e in
ject
ed a
t ST
P
Figure A-26 Calibration of GC 5880 for cis/trans butene

101
Appendix B: Sample Calculations of Mass Balance Appendix B-1 Pyrolysis of Lard The calculations are based on the data collected for experimental Run # 23 (Appendix C-2) Feed Lard = 2.79g Duration of experiment 30 minutes Mass Balance calculation: Total volume of gas collected excluding nitrogen at room temperature and pressure
= 3107 cm3 = 2713 cm3 at STP Gas analysis from GC: Volume of gas injected into GCs was 0.5 cm3 at room temperature and pressure which is 0.44 cm3 at STP. Table B-1 shows the calculations of gas composition and mass of the product gas. Weight of the liquid product collected in the condenser = 1.48g Weight of the char and residue retained in the reactor = 0.12 g Weight of the product gas (calculated above) = 1.06g Total product = 1.48 +0.12+ 1.06 =2.66 g Mass balance = [(mass of feed - mass of total product)/Mass of feed]*100 = (2.79-2.66)/2.79 *100 = 95.3 % Appendix B-2 Steam Reforming of Lard The calculations are based on the data collected for experimental Run # 39 (Appendix C-2) Feed Lard = 2.68 g Duration of experiment 30 minutes Water pumped = 2.58 g Mass Balance Calculation: Total volume of gas collected excluding nitrogen at room temperature and pressure
= 1102 cm3 = 962 cm3 at STP Gas analysis from GC: Volume of gas injected into GCs was 0.5 cm3 at room temperature and pressure which is 0.44 cm3 at STP. Table B-2 shows the calculations of gas composition and mass of the product gas. Weight of the liquid collected in the condenser = 4.19 g Weight of water obtained from total liquid = 2.54 g Weight of liquid product = 1.65

102
Table B-1 Calculation of gas composition and mass during pyrolysis of lard at
600oC and carrier gas flow rate of 50 cm3/min
Components Volume (cm3)
Sample (g mole)
Total (g mole) Total (ml)
Composition mol%
Total (g)
Hydrogen 0.0000 0.00E+00 0.00E+00 0.0000 0.00E+00 0.0000 Nitrogen 0.3353 1.50E-05 9.30E-02 2083.8365 2.6043 CO 0.0116 5.19E-07 3.23E-03 72.3655 1.15E+01 0.0904 CO2 0.0049 2.17E-07 1.35E-03 30.1784 4.79E+00 0.0593 Methane 0.0107 4.75E-07 2.95E-03 66.1979 1.05E+01 0.0474 Ethylene 0.0262 1.17E-06 7.26E-03 162.7733 2.59E+01 0.2037 Ethane 0.0073 3.27E-07 2.03E-03 45.5161 7.23E+00 0.0611 propylene 0.0166 7.40E-07 4.60E-03 103.0281 1.64E+01 0.1934 propane 0.0008 3.52E-08 2.19E-04 4.9004 7.78E-01 0.0096 1-butene 0.0132 5.90E-07 3.67E-03 82.2345 1.31E+01 0.2058 isobutene 0.0001 3.12E-09 1.94E-05 0.4342 6.90E-02 0.0011 n-butane 0.0005 2.15E-08 1.34E-04 2.9993 4.76E-01 0.0078 cis/trans 0.0013 5.95E-08 3.70E-04 8.2908 1.32E+00 0.0208 C5+ 0.0081 3.63E-07 2.26E-03 50.6356 8.04E+00 0.1584 Product Gas 0.1013 0.0281 629.5543 100.00 1.0588 Total Gas 0.44 0.1211 3.6631
Weight of the char and residue retained in the reactor = 0.13 g Weight of the product gas (calculated above) = 0.83g Total product = 1.65 + 0.13 + 0.83 =2.61 g Mass balance = [(mass of feed - mass of total product)/Mass of feed]*100 = (2.68-2.61)/2.68 *100 = 97 %

103
Table B-2 Calculation of gas composition and mass during steam reforming at
600oC and S/L ratio of 1
Component Volume (cm3)
sample (g mole)
Total (g mole) Total (ml)
Composition (mol%)
Total (g)
Hydrogen 0.0068 3.01E-07 6.64E-04 14.8940 2.65E+00 0.0013Nitrogen 0.1815 8.10E-06 1.79E-02 400.2652 0.5002CO 0.0323 1.44E-06 3.17E-03 71.1438 1.26E+01 0.0889CO2 0.0141 6.29E-07 1.39E-03 31.0874 5.53E+00 0.0610Methane 0.0337 1.50E-06 3.32E-03 74.3698 1.32E+01 0.0532Ethylene 0.0689 3.07E-06 6.77E-03 151.8335 2.70E+01 0.1900Ethane 0.0224 9.99E-07 2.20E-03 49.3602 8.77E+00 0.0662propylene 0.0433 1.93E-06 4.26E-03 95.4582 1.70E+01 0.1792propane 0.0028 1.27E-07 2.80E-04 6.2706 1.11E+00 0.01231-butene 0.0209 9.32E-07 2.06E-03 46.0698 8.19E+00 0.1153isobutene 0.0001 3.39E-09 7.48E-06 0.1677 2.98E-02 0.0004n-butane 0.0014 6.36E-08 1.40E-04 3.1429 5.59E-01 0.0081cis/trans 0.0034 1.50E-07 3.32E-04 7.4378 1.32E+00 0.0186C5+ 0.0051 2.28E-07 5.04E-04 11.2925 2.01E+00 0.0353 Product Gas 0.255 0.0251 562.5283 100.0000 0.8301Total Gas 0.44 0.0430 1.3303
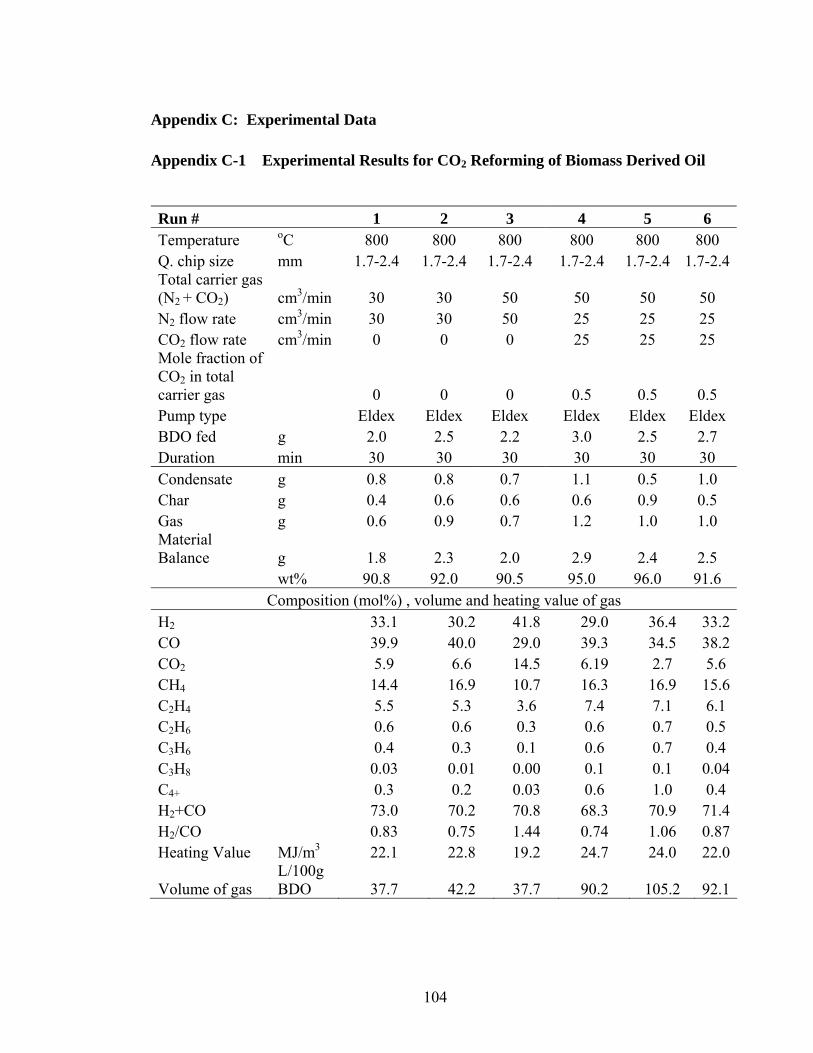
104
Appendix C: Experimental Data Appendix C-1 Experimental Results for CO2 Reforming of Biomass Derived Oil Run # 1 2 3 4 5 6 Temperature oC 800 800 800 800 800 800 Q. chip size mm 1.7-2.4 1.7-2.4 1.7-2.4 1.7-2.4 1.7-2.4 1.7-2.4Total carrier gas (N2 + CO2) cm3/min 30 30 50 50 50 50 N2 flow rate cm3/min 30 30 50 25 25 25 CO2 flow rate cm3/min 0 0 0 25 25 25 Mole fraction of CO2 in total carrier gas 0 0 0 0.5 0.5 0.5 Pump type Eldex Eldex Eldex Eldex Eldex Eldex BDO fed g 2.0 2.5 2.2 3.0 2.5 2.7 Duration min 30 30 30 30 30 30 Condensate g 0.8 0.8 0.7 1.1 0.5 1.0 Char g 0.4 0.6 0.6 0.6 0.9 0.5 Gas g 0.6 0.9 0.7 1.2 1.0 1.0 Material Balance g 1.8 2.3 2.0 2.9 2.4 2.5 wt% 90.8 92.0 90.5 95.0 96.0 91.6
Composition (mol%) , volume and heating value of gas H2 33.1 30.2 41.8 29.0 36.4 33.2CO 39.9 40.0 29.0 39.3 34.5 38.2CO2 5.9 6.6 14.5 6.19 2.7 5.6 CH4 14.4 16.9 10.7 16.3 16.9 15.6C2H4 5.5 5.3 3.6 7.4 7.1 6.1 C2H6 0.6 0.6 0.3 0.6 0.7 0.5 C3H6 0.4 0.3 0.1 0.6 0.7 0.4 C3H8 0.03 0.01 0.00 0.1 0.1 0.04C4+ 0.3 0.2 0.03 0.6 1.0 0.4 H2+CO 73.0 70.2 70.8 68.3 70.9 71.4H2/CO 0.83 0.75 1.44 0.74 1.06 0.87Heating Value MJ/m3 22.1 22.8 19.2 24.7 24.0 22.0
Volume of gas L/100g BDO 37.7 42.2 37.7 90.2 105.2 92.1

105
Run # 7 8 9 10 11 12 Temperature oC 800 800 800 800 800 800 Q. chip size mm 1.7-2.4 1.7-2.4 1.7-2.4 1.7-2.4 1.7-2.4 1.7-2.4 Total carrier gas (N2 + CO2) cm3/min 30 30 60 60 60 30 N2 flow rate cm3/min 18 24 48 60 54 24 CO2 flow rate cm3/min 12 6 12 0 6 6 Mole fraction of CO2 in total carrier gas 0.4 0.2 0.2 0 0.1 0.2 Pump type Eldex Eldex Eldex Eldex Eldex Eldex BDO fed g 2.7 2.5 2.5 3.0 3.1 2.2 Duration min 30 30 30 30 30 30 Condensate g 0.7 0.5 0.9 1.0 1.1 0.7 Char g 0.6 0.6 0.8 0.9 0.5 0.7 Gas g 1.3 1.2 0.7 0.8 1.1 0.7 Material Balance g 2.6 2.4 2.4 2.7 2.7 2.1 wt% 94.0 94.2 95.8 90.2 90.0 98.4
Composition (mol%) and volume and heating value of gas H2 27.0 28.4 25.9 23.7 24.5 22.6 CO 38.0 33.4 45.8 45.2 44.5 42.0 CO2 9.9 15.0 12.5 13.7 11.9 24.7 CH4 17.0 15.7 11.0 11.8 13.3 7.8 C2H4 6.5 6.0 4.2 4.4 4.8 2.6 C2H6 0.7 0.6 0.3 0.4 0.4 0.2 C3H6 0.6 0.5 0.1 0.3 0.2 0.1 C3H8 0.1 0.1 0.0 0.03 0.0 0.0 C4+ 0.4 0.4 0.3 0.5 0.5 0.1 H2+CO 65.0 61.8 71.6 68.9 69.0 64.6 H2/CO 0.71 0.85 0.56 0.52 0.55 0.54 Heating Value MJ/m3 24.9 24.5 20.6 19.2 22.2 18.8
Volume of gas L/100g BDO 96.5 101.5 56.8 55.0 82.6 59.6

106
Run # 13 14 15 16 17 18 Temperature oC 800 800 800 800 800 800 Q. chip size mm 1.7-2.4 1.7-2.4 1.7-2.4 1.7-2.4 1.7-2.4 1.7-2.4 Total carrier gas (N2 + CO2) cm3/min 60 60 50 50 50 30 N2 flow rate cm3/min 0 54 45 40 0 0 CO2 flow rate cm3/min 60 6 5 10 50 30 Mole fraction of CO2 in total carrier gas 1 0.1 0.1 0.2 1 1 Pump type Eldex Eldex Eldex Eldex Eldex Eldex BDO fed g 2.5 2.7 2.8 3.0 2.9 2.1 Duration min 30 30 30 30 30 30 Condensate g 0.8 0.9 2.1 1.0 1.1 0.6 Char g 0.7 0.9 1.1 0.6 0.8 0.7 Gas g 0.8 0.7 2.4 1.1 0.8 0.6 Material Balance g 2.3 2.6 5.6 2.7 2.7 1.9 wt% 92.4 93.8 90.4 90.2 90.8 89.8
Composition (mol%) and volume and heating value of gas H2 22.7 28.4 23.4 22.8 24.7 24.7 CO 43.5 47.2 46.6 45.9 48.8 47.7 CO2 20.2 8.4 15.4 19.2 12.6 16.4 CH4 9.8 11.4 10.2 8.6 9.8 8.1 C2H4 3.2 3.9 3.6 3.1 3.3 2.7 C2H6 0.2 0.3 0.3 0.2 0.2 0.2 C3H6 0.1 0.1 0.2 0.1 0.1 0.1 C3H8 0.02 0.0 0.0 0.01 0.01 0.01 C4+ 0.2 0.2 0.3 0.3 0.3 0.1 H2+CO 66.2 75.6 70.0 68.6 73.5 72.4 H2/CO 0.52 0.60 0.50 0.50 0.51 0.52 Heating Value MJ/m3 20.1 18.7 20.4 19.4 19.8 18.5
Volume of gas L/100g BDO 58.8 117.2 83.0 66.4 56.5 53.9
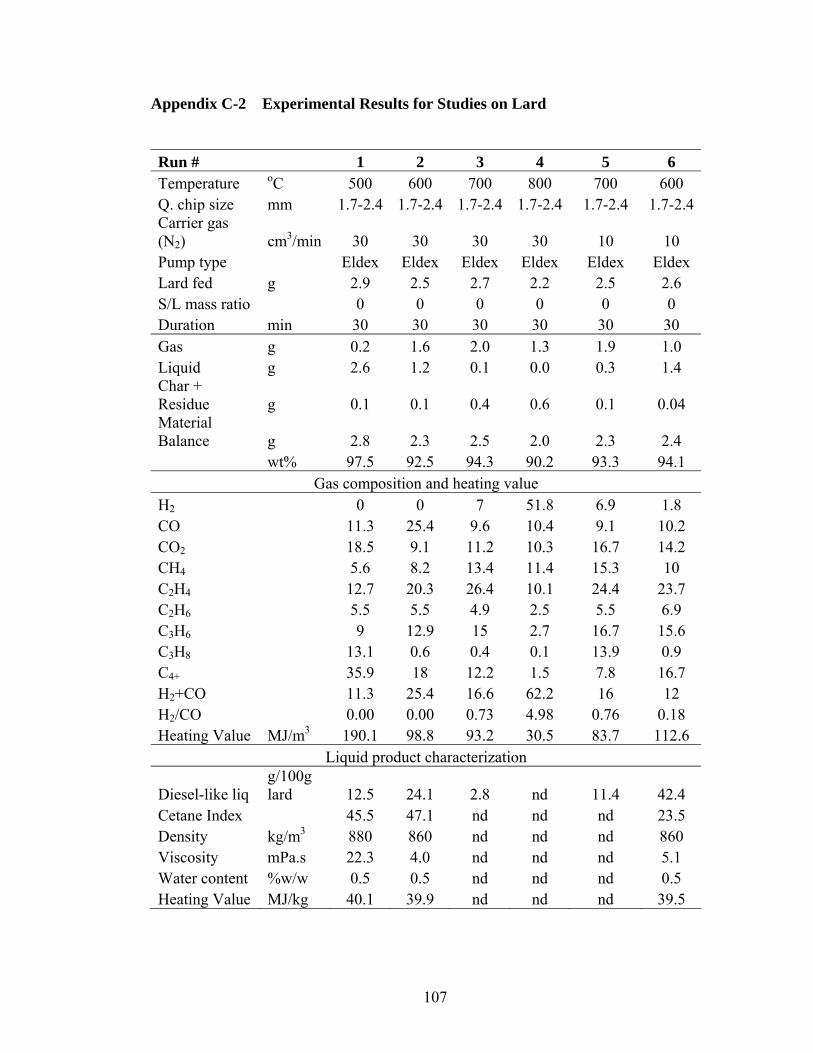
107
Appendix C-2 Experimental Results for Studies on Lard Run # 1 2 3 4 5 6 Temperature oC 500 600 700 800 700 600 Q. chip size mm 1.7-2.4 1.7-2.4 1.7-2.4 1.7-2.4 1.7-2.4 1.7-2.4Carrier gas (N2) cm3/min 30 30 30 30 10 10 Pump type Eldex Eldex Eldex Eldex Eldex Eldex Lard fed g 2.9 2.5 2.7 2.2 2.5 2.6 S/L mass ratio 0 0 0 0 0 0 Duration min 30 30 30 30 30 30 Gas g 0.2 1.6 2.0 1.3 1.9 1.0 Liquid g 2.6 1.2 0.1 0.0 0.3 1.4 Char + Residue g 0.1 0.1 0.4 0.6 0.1 0.04 Material Balance g 2.8 2.3 2.5 2.0 2.3 2.4 wt% 97.5 92.5 94.3 90.2 93.3 94.1
Gas composition and heating value H2 0 0 7 51.8 6.9 1.8 CO 11.3 25.4 9.6 10.4 9.1 10.2 CO2 18.5 9.1 11.2 10.3 16.7 14.2 CH4 5.6 8.2 13.4 11.4 15.3 10 C2H4 12.7 20.3 26.4 10.1 24.4 23.7 C2H6 5.5 5.5 4.9 2.5 5.5 6.9 C3H6 9 12.9 15 2.7 16.7 15.6 C3H8 13.1 0.6 0.4 0.1 13.9 0.9 C4+ 35.9 18 12.2 1.5 7.8 16.7 H2+CO 11.3 25.4 16.6 62.2 16 12 H2/CO 0.00 0.00 0.73 4.98 0.76 0.18 Heating Value MJ/m3 190.1 98.8 93.2 30.5 83.7 112.6
Liquid product characterization
Diesel-like liq g/100g lard 12.5 24.1 2.8 nd 11.4 42.4
Cetane Index 45.5 47.1 nd nd nd 23.5 Density kg/m3 880 860 nd nd nd 860 Viscosity mPa.s 22.3 4.0 nd nd nd 5.1 Water content %w/w 0.5 0.5 nd nd nd 0.5 Heating Value MJ/kg 40.1 39.9 nd nd nd 39.5

108
Run # 7 8 9 10 11 12 Temperature oC 650 450 600 550 750 600 Q. chip size mm 1.7-2.4 1.7-2.4 1.7-2.4 1.7-2.4 1.7-2.4 1.7-2.4 Carrier gas (N2) cm3/min 10 10 50 10 10 70 Pump type Eldex Syinge Syinge Syinge Syinge Syinge Lard fed g 2.5 2.5 2.1 2.7 2.5 2.5 S/L mass ratio 0 0 0 0 0 0 Duration min 30 30 30 30 30 30 Gas g 1.6 0.2 0.9 0.5 1.8 0.9 Liquid g 0.7 2.2 0.9 2.1 0.4 1.4 Char + Residue g 0.04 0.2 0.2 0.01 0.01 0.2 Material Balance g 2.3 2.5 2.0 2.6 2.2 2.4 wt% 93.7 98.3 97.2 95.1 90.5 96.2
Gas composition and heating value H2 2.5 0 0 0 6.2 0 CO 8.4 19.1 10.4 12.4 9.1 11.5 CO2 11.2 34.5 5.9 9.9 5.4 4.9 CH4 12.4 3.6 9.7 9.8 22 10.2 C2H4 25.6 5.3 25.2 23.8 32.8 25.9 C2H6 6.6 4 6.3 8.1 5.7 6.7 C3H6 17.2 8.3 15.8 15.6 12 16.3 C3H8 0.6 2.4 0.6 1.4 0.3 1.7 C4+ 15.5 22.8 26.1 19 6.5 22.8 H2+CO 10.9 19.1 10.4 12.4 15.3 11.5 H2/CO 0.30 0.00 0.00 0.00 0.68 0.00 Heating Value MJ/m3 109.4 121.5 133.2 116.7 78.1 122.7
Liquid product characterization
Diesel-like liq g/100g lard 26.6 25.8 25.0 36.7 13.0 34.2
Cetane Index 20.2 45.4 40.7 52.2 nd 34.5 Density kg/m3 860 900 860 870 nd 860 Viscosity mPa.s 2.0 21.7 2.3 6.4 nd 2.0 Water content %w/w 0.5 0.5 0.5 0.5 nd 0.5 Heating Value MJ/kg 39.9 39.2 40.0 40.1 nd 39.5

109
Run # 13 14 15 16 17 18 Temperature oC 600 800 800 800 800 500 Q. chip size mm 1.7-2.4 1.7-2.4 1.7-2.4 1.7-2.4 1.7-2.4 1.7-2.4 Carrier gas (N2) cm3/min 70 10 50 70 30 30 Pump type Syinge Syinge Syinge Syinge Syinge Syinge Lard fed g 2.2 2.5 2.6 2.5 2.5 2.5 S/L mass ratio 0 0 0 0 0 0 Duration min 30 30 30 30 30 30 Gas g 0.7 1.6 1.9 2.0 2.0 0.1 Liquid g 1.3 0.6 0.3 0.2 0.1 2.1 Char + Residue g 0.1 0.2 0.2 0.2 0.1 0.1 Material Balance g 2.0 2.3 2.4 2.4 2.3 2.3 wt% 93.1 93.8 91 94.7 90.7 92.2
Gas composition and heating value H2 0 9.4 8.7 7.9 8.6 0 CO 10.2 8.8 8.9 8.6 8.6 12.2 CO2 14.7 5 6.8 5 4.7 8.6 CH4 10.3 25.3 23.9 22.7 27.1 8.8 C2H4 23.4 33.8 35.9 37.7 36.7 22.5 C2H6 6.9 4.3 3.5 3.2 3.9 8.3 C3H6 15.1 7.2 6.5 7.6 5.9 14.1 C3H8 0.8 0.2 0.1 0.1 0.1 1.9 C4+ 10.6 6 5.7 7.2 4.6 23.6 H2+CO 10.2 18.2 17.6 16.5 17.2 12.2 H2/CO 0.00 1.07 0.98 0.92 1.00 0.00 Heating Value MJ/m3 119.4 70.5 70.2 74.9 67.6 126.5
Liquid product characterization
Diesel-like liq g/100g lard 38.4 16.9 10.7 6.1 1.9 19.7
Cetane Index 38.7 nd nd nd nd 47.8 Density kg/m3 860 nd nd nd nd 880 Viscosity mPa.s 1.8 nd nd nd nd 18.3 Water content %w/w 0.5 nd nd nd nd 0.5 Heating Value MJ/kg 39.6 nd nd nd nd 40.1

110
Run # 19 20 21 22 23 24 Temperature oC 600 700 500 550 600 550 Q. chip size mm 1.7-2.4 1.7-2.4 0.7-1.4 0.7-1.4 0.7-1.4 0.7-1.4 Carrier gas (N2) cm3/min 30 30 50 50 50 50 Pump type Syinge Syinge Syinge Syinge Syinge Syinge Lard fed g 2.6 2.2 2.5 2.5 2.8 2.5 S/L mass ratio 0 0 0 0 0 0 Duration min 30 30 30 30 30 30 Gas g 1.2 1.7 0.1 0.4 1.1 0.4 Liquid g 1.1 0.2 1.9 2.0 1.5 1.8 Char + Residue g 0.1 0.1 0.4 0.2 0.1 0.3 Material Balance g 2.5 2.1 2.4 2.5 2.7 2.5 wt% 94.5 92.8 95.2 99.4 95.3 99.5
Gas composition and heating value H2 0 3.4 0 0 0 0 CO 9.2 7.3 0 10.5 9 9.4 CO2 3.9 3.4 13.9 5.1 3.6 4.6 CH4 11.6 15.7 8.3 9.1 11 8.4 C2H4 28.1 31.5 22.3 24.1 27 21.6 C2H6 7.5 5.8 7.9 7.5 7.6 7.3 C3H6 17.7 18 15.4 15.2 17.1 10 C3H8 0.7 0.4 1.4 0.9 0.8 1.1 C4+ 21.3 14.5 30.9 27.5 24 33.5 H2+CO 9.2 10.7 0 10.5 9 9.4 H2/CO 0.00 0.47 0.00 0.00 0.00 0.00 Heating Value MJ/m3 124.1 104.0 165.2 135.6 130.0 147.6
Liquid product characterization
Diesel-like liq g/100g lard 31.2 6.9 16.4 28.1 31.8 30.7
Cetane Index 19.9 nd 53.6 50.4 45.8 50.3 Density kg/m3 870 nd 870 880 860 880 Viscosity mPa.s 3.8 nd 22.1 12.4 4.5 10.6 Water content %w/w 0.5 nd 0.5 0.5 0.5 0.5 Heating Value MJ/kg 39.2 nd 39.5 39.5 38.4 40.0

111
Run # 25 26 27 28 29 30 Temperature oC 550 550 550 650 700 600 Q. chip size mm 0.7-1.4 0.7-1.4 0.7-1.4 0.7-1.4 0.7-1.4 0.7-1.4 Carrier gas (N2) cm3/min 50 50 50 50 50 50 Pump type Syinge Syinge Syinge Syinge Syinge Syinge Lard fed g 2.5 2.5 2.5 2.5 2.0 2.9 S/L mass ratio 0 0 0 0 0 0 Duration min 30 30 30 30 30 30 Gas g 0.4 0.4 0.4 1.6 1.6 1.5 Liquid g 1.6 1.9 1.8 0.6 0.2 1.1 Char + Residue g 0.4 0.2 0.2 0.2 0.2 0.1 Material Balance g 2.4 2.5 2.3 2.3 1.9 2.6 wt% 97.2 98.0 93.0 93.8 95.5 92.0
Gas composition and heating value H2 0 0 0 0 3.7 0 CO 9.8 10.6 11.3 8.4 7.3 11.1 CO2 4.5 5.1 5.4 3.6 5 7 CH4 9.5 9.5 9 13 14.1 11 C2H4 24.6 24.6 23.5 28.7 30.7 25.9 C2H6 7.8 8 7.7 6.7 4.9 7.2 C3H6 15.6 15.6 15 18.7 17.5 16.8 C3H8 1 1.1 1 0.6 0.4 0.8 C4+ 27.1 25.4 27.2 20.5 16.4 20.1 H2+CO 9.8 10.6 11.3 8.4 11 11.1 H2/CO 0.00 0.00 0.00 0.00 0.51 0.00 Heating Value MJ/m3 135.8 131.6 134.6 122.8 108.7 119.8
Liquid product characterization
Diesel-like liq g/100g lard 31.4 37.2 38.2 12.3 10.8 24.3
Cetane Index 52.3 49.3 54.8 9.6 nd 34.4 Density kg/m3 870 880 860 860 nd 850 Viscosity mPa.s 9.5 11.1 10.3 1.7 nd 2.9 Water content %w/w 0.5 0.5 0.5 0.6 nd 0.5 Heating Value MJ/kg 39.5 39.9 39.5 39.8 nd 39.8

112
Run # 31 32 33 34 35 36 Temperature oC 600 600 500 600 600 500 Q. chip size mm 0.7-1.4 0.7-1.4 0.7-1.4 0.7-1.4 0.7-1.4 0.7-1.4 Carrier gas (N2) cm3/min 0 0 0 0 0 0 Pump type Syinge Syinge Syinge Syinge Syinge Syinge Lard fed g 2.2 2.5 2.2 2.7 2.5 2.2 S/L mass ratio 0 4 1 1.5 1.5 1 Duration min 30 30 30 30 30 30 Gas g 1.1 0.5 0.3 0.5 0.7 0.2 Liquid g 1.3 1.9 1.8 1.9 1.5 1.7 Char + Residue g 0.1 0.1 0.03 0.1 0.1 0.2 Material Balance g 2.0 2.5 2.1 2.5 2.3 2.1 wt% 93.0 98.0 97.0 95.0 93.0 92.0
Gas composition and heating value H2 2.8 0 0 0 3.2 0 CO 11.9 11.1 0 12.7 14.5 0 CO2 6.7 9.1 51.1 5.8 8.5 39.4 CH4 13.1 10.0 1.0 13.3 12.9 2.0 C2H4 26 28.6 9.3 29.7 28.4 11.2 C2H6 8.9 5.5 1.3 9.0 8.0 3.1 C3H6 17 15.1 10 17.2 14.6 14.3 C3H8 1.2 0.5 0 1.1 0.8 0.7 C4+ 12.5 20.1 27.4 11.3 9.1 29.5 H2+CO 14.7 11.1 0 12.7 17.7 0 H2/CO 0.24 0.00 0.00 0.00 0.22 0.00 Heating Value MJ/m3 98.8 119.8 223.1 98.9 87.3 211.0
Liquid product characterization
Diesel-like liq g/100g lard 40.9 24.5 32.4 38.9 35.7 19.8
Cetane Index 40.5 56.3 50.3 54.6 49.7 50.6 Density kg/m3 850 860 870 860 860 880 Viscosity mPa.s 1.2 5.2 8.2 6.6 4.3 14.6 Water content %w/w 0.5 1.0 1.1 0.9 0.9 1.0 Heating Value MJ/kg 38.6 38.9 39.0 38.5 38.5 38.5
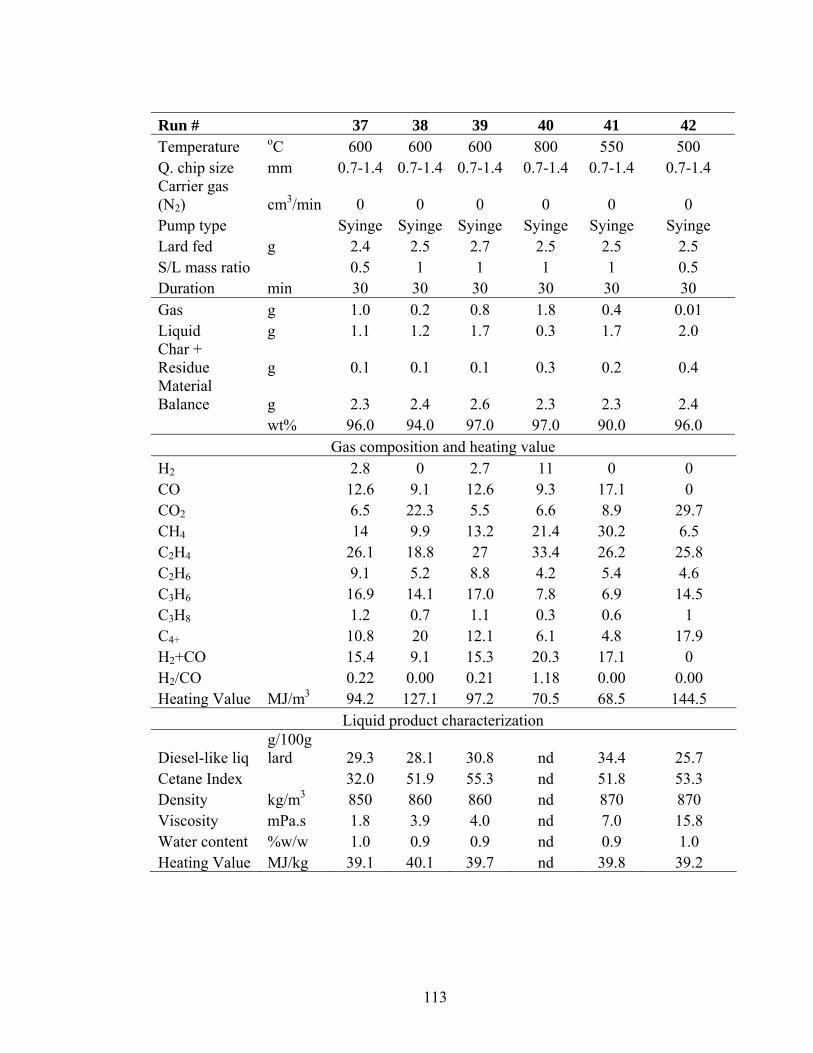
113
Run # 37 38 39 40 41 42 Temperature oC 600 600 600 800 550 500 Q. chip size mm 0.7-1.4 0.7-1.4 0.7-1.4 0.7-1.4 0.7-1.4 0.7-1.4 Carrier gas (N2) cm3/min 0 0 0 0 0 0 Pump type Syinge Syinge Syinge Syinge Syinge Syinge Lard fed g 2.4 2.5 2.7 2.5 2.5 2.5 S/L mass ratio 0.5 1 1 1 1 0.5 Duration min 30 30 30 30 30 30 Gas g 1.0 0.2 0.8 1.8 0.4 0.01 Liquid g 1.1 1.2 1.7 0.3 1.7 2.0 Char + Residue g 0.1 0.1 0.1 0.3 0.2 0.4 Material Balance g 2.3 2.4 2.6 2.3 2.3 2.4 wt% 96.0 94.0 97.0 97.0 90.0 96.0
Gas composition and heating value H2 2.8 0 2.7 11 0 0 CO 12.6 9.1 12.6 9.3 17.1 0 CO2 6.5 22.3 5.5 6.6 8.9 29.7 CH4 14 9.9 13.2 21.4 30.2 6.5 C2H4 26.1 18.8 27 33.4 26.2 25.8 C2H6 9.1 5.2 8.8 4.2 5.4 4.6 C3H6 16.9 14.1 17.0 7.8 6.9 14.5 C3H8 1.2 0.7 1.1 0.3 0.6 1 C4+ 10.8 20 12.1 6.1 4.8 17.9 H2+CO 15.4 9.1 15.3 20.3 17.1 0 H2/CO 0.22 0.00 0.21 1.18 0.00 0.00 Heating Value MJ/m3 94.2 127.1 97.2 70.5 68.5 144.5
Liquid product characterization
Diesel-like liq g/100g lard 29.3 28.1 30.8 nd 34.4 25.7
Cetane Index 32.0 51.9 55.3 nd 51.8 53.3 Density kg/m3 850 860 860 nd 870 870 Viscosity mPa.s 1.8 3.9 4.0 nd 7.0 15.8 Water content %w/w 1.0 0.9 0.9 nd 0.9 1.0 Heating Value MJ/kg 39.1 40.1 39.7 nd 39.8 39.2

114
Run # 43 44 45 46 47 48 Temperature oC 600 500 600 800 800 800 Q. chip size mm 0.7-1.4 0.7-1.4 0.7-1.4 0.7-1.4 0.7-1.4 0.7-1.4 Carrier gas (N2) cm3/min 50 0 0 0 0 0 Pump type Syinge Syinge Syinge Syinge Syinge Syinge Lard fed g 19.4 2.5 2.5 2.5 2.5 2.6 S/L mass ratio 0 1 3 1.5 1.5 2 Duration min 225 30 30 30 30 30 Gas g 9.2 0.03 0.1 1.9 2.0 2.1 Liquid g 8.5 2.0 2.0 0.3 0.2 0.1 Char + Residue g 0.1 0.2 0.4 0.1 0.2 0.4 Material Balance g 17.8 2.3 2.4 2.4 2.4 2.6 wt% 92.0 93.0 98.0 95.0 94.0 98.0
Gas composition and heating value H2 0 0 0 8.8 10.2 11.4 CO 10.9 0 0 8.1 8.8 9 CO2 4.7 50.2 68.3 6 7.2 6.2 CH4 12.0 4.8 5.6 20 20.6 21.4 C2H4 27.2 21.7 13.8 36.4 35.1 34.9 C2H6 8.0 1.3 1.7 3.3 3.2 7.1 C3H6 17.2 7.8 4.4 8.5 7.4 7.1 C3H8 0.9 0 0 0.2 0.2 0.1 C4+ 19.1 14.2 6.1 8.7 7.4 6.4 H2+CO 10.9 0 0 16.9 19 20.4 H2/CO 0.0 0.00 0.00 1.09 1.16 1.27 Heating Value MJ/m3 116.4 142.0 115.9 78.9 73.8 70.3
Liquid product characterization
Diesel-like liq g/100g lard 25.0 18.1 36.1 8.1 5.6 2.2
Cetane Index 45.9 53.6 55.5 nd nd nd Density kg/m3 845 870 860 nd nd nd Viscosity mPa.s 2.4 21.2 3.7 nd nd nd Water content %w/w 0.5 0.9 0.9 nd nd nd Heating Value MJ/kg 38.7 39.8 38.8 nd nd nd Pour point oC -18.0 nd nd nd nd nd Cloud point oC 10.0 nd nd nd nd nd

115
Appendix D: Residence Time Calculation Assumptions for calculating residence time of the reactant in the pyrolysis process
1. Residence time of the reactant was calculated based on the flow rate of carrier gas
2. Reactor bed volume was calculated on the basis of empty bed Height of bed h = 7.0 cm Radius of the reactor r = 0.5 cm Volume of the reactor bed V = п r2h
= 3.14 x 0.52 x 7.0 = 5.50 cm3
For a volumetric flow rate of nitrogen of 50 cm3/min (STP) and a reactor temperature T of 600oC Actual volumetric flow rate in the reactor Q = 50 cm3/min x 873.15/273.15 = 159.8 cm3/min Residence time t = V / Q = 0.034 min = 2.1 s Table D-1 Residence time of reactant during pyrolysis at 600 and 800oC Carrier gas flow rate at STP
(mL/min) Residence time (s)
600oC 800oC 10 10.3 8.4 30 3.4 2.8 50 2.1 1.7 60 1.7 1.4 70 1.5 1.2
Appendix E: Determination of the Heating Value of the Product Gas
Heating value of a fuel gas mixture can be calculated as the sum of the heating values of the components, each multiplied by the corresponding mole fraction, the sum so obtained being corrected for the compressibility of the mixture. The ideal gas mixture heating value is given by Wrobel and Wirght(1978) as CVideal = x1*CV1 + x2*CV2 + ………….. where x1,x2, …. are the mole fractions, CV1, CV2, ….. are the heating values. The compressibility factor zm for the mixture is calculated and the real gas heating value is given by: CVreal = CVideal / zm

116
The factor zm is given by: zm =1-(x1*√b1+x2*√b2.....)2 + 5 * 10-4 * (2*xH-xH
2) where b1,b2,……. are the gas law deviations of the components (except hydrogen) b= 1-pV/RT and xH is the mol fraction of hydrogen present in the gas mixture. Sample calculation of the heating value of the product gas is presented in Table E-1 Table E-1 Sample calculation of the product gas heating value for steam
reforming experiment at 800oC and S/L of 2
Comp.
Total volume (cm3)
Total moles
mol%
CV (MJ/m
3) b xi * bi Total
wt. (g)
CV (total) (MJ/m
3) H2 206.3 9.2E-03 11.4 12.1 0.00 0.02 1.6 CO 163.6 7.3E-03 9.0 12.0 0.02 0.014 0.20 1.2 CO2 112.6 5.0E-03 6.2 0.0 0.06 0.016 0.22 0.0 Methane 387.8 1.7E-02 21.4 37.7 0.04 0.045 0.28 9.1 Ethylene 633.1 2.8E-02 34.9 59.7 0.08 0.097 0.79 23.6 Ethane 62.0 2.8E-03 3.4 66.1 0.09 0.010 0.08 2.6 propene 128.9 5.8E-03 7.1 87.1 0.13 0.025 0.24 7.0 propane 2.8 1.2E-04 0.2 93.9 0.13 0.001 0.01 0.2 1-butene 83.8 3.7E-03 4.6 115.0 0.17 0.019 0.21 6.0 i-butene 3.1 1.4E-04 0.2 114.3 0.18 0.001 0.01 0.2 n-butane 1.4 6.3E-05 0.1 121.8 0.18 0.000 0.00 0.1 cis/trans 6.2 2.7E-04 0.3 114.6 0.19 0.001 0.02 0.4 C5+ 20.9 9.3E-04 1.2 147.1 0.22 0.005 0.07 1.9 Product Gas 1812.4 0.0809 100 0.23 2.15 70.3 *zm= 0.7654

117
Appendix F: Compounds Identified and Quantified by GC/MS
In order to determine the distribution of compounds in the liquid product, a
semi-quantitative study was made by means of the percentage of area of the
chromatographic peaks. It should be pointed out that these values do not represent the
real concentration of the compounds. They serve to show the different composition of
the pyrolysis fuel. Peaks with relatively weak intensity were not identified.
Table F-1 Compounds identified in GC/MS for the liquid product obtained during pyrolysis of lard at 500oC, carrier gas flow rate of 30 cm3/min, quartz particles packing height of 70 mm and size 1.7-2.4 mm
Components scan no peak area area%
3-methyl-1-butanol 61 7.00E+06 0.69 cyclopentene 67 4.50E+06 0.44 1-hexene 71 1.10E+07 1.08 methyl-1,3 cyclopentadiene 83 4.40E+06 0.43 benzene 90 4.40E+06 0.43 1,5 hexadiene 94 5.30E+06 0.52 cyclohexene 93 5.30E+06 0.52 1-heptene 97 1.50E+07 1.47 ethylidenecyclopentane 115 4.00E+06 0.39 3-methyl-cyclohexene 124 3.90E+06 0.38 1-ethyl-3- methylene cyclobutane 133 3.30E+06 0.32 1,7-octadiene 156 5.30E+06 0.52 toulene 144 6.40E+06 0.63 1-octene 164 1.10E+07 1.08 octane 173 4.00E+06 0.39 cyclohexanone 181 3.80E+06 0.37 2-octene 190 3.10E+06 0.30 1,3 octadiene 207 4.00E+06 0.39 1-nonene 308 1.20E+07 1.18 cyclooctene 315 4.30E+07 4.21 1,3 nonadiene 366 4.00E+06 0.39 3,4 nonadiene 398 4.20E+06 0.41 1-decene 479 1.53E+07 1.50 decane 494 4.10E+06 0.40 cyclodecene 537 4.40E+06 0.43 11-octadecynoic acid 598 4.40E+06 0.43 1-undecene 648 1.70E+07 1.67 undecane 662 5.20E+06 0.51

118
2-undecene 682 4.80E+06 0.47 heptanoic acid 667 8.30E+06 0.81 1,4 undecadiene 703 8.40E+06 0.82 6-butyl-1,4-cycloheptadiene 733 4.00E+06 0.39 pentyl-benzene 748 5.20E+06 0.51 2,4 dodecadiene 758 4.20E+06 0.41 1,13 Tetradecadiene 799 3.80E+06 0.37 1-dodecene 806 1.70E+07 1.67 octanoic acid 813 5.00E+06 0.49 dodecane 818 4.80E+06 0.47 cyclododecyne 837 3.80E+06 0.37 cyclododecene 858 8.60E+06 0.84 2-methyl-bicyclo(2.2.1)-heptane 890 3.50E+06 0.34 1-tridecene 958 1.30E+07 1.27 tridecane 963 5.70E+06 0.56 1-pentadecene 1092 3.20E+07 3.14 decanoic acid 1103 1.50E+07 1.47 1- propenyl-cyclohexane 1170 4.80E+06 0.47 1-octadecene 1222 9.90E+06 0.97 hexadecane 1231 1.35E+07 1.32 9-octadecen-1-ol 1320 7.80E+06 0.76 1-hexadecene 1345 1.50E+07 1.47 1-octadecene 1442 9.70E+06 0.95 1-heptadecene 1462 6.00E+06 0.59 heptadecane 1470 8.00E+06 0.78 hexadecanal 1487 1.65E+07 1.62 tetradecanoic acid 1555 1.70E+07 1.67 9-octadecenal 1678 1.25E+07 1.23 2-nonadecanone 1685 7.50E+06 0.74 17-octadecenal 1705 6.80E+06 0.67 9-hexadecenoic acid 1736 8.00E+06 0.78 hexadecanoic acid 1796 1.00E+08 9.80 2-propenyl ester octadecanoic acid 1861 2.70E+07 2.65 2-hydroxycyclopentadecanone 1841 7.00E+06 0.69 2,3 -dihydroxypropyl ester-9-octadecenoic acid 1965 1.20E+08 11.76 octadecanoic acid 1983 1.05E+08 10.29 1-eicosanol 2022 4.30E+07 4.21 tricosane-2,4-dione 2046 2.30E+07 2.25 cyclotetracosane 2125 1.25E+07 1.23 octahydro-4,8a-dimethyl-4a(2H)-Naphthalenol 2154 1.00E+07 0.98 3-hydroxypropyl ester, oleic acid 2170 1.58E+07 1.55 2-hydroxy-1-(hydroxymethyl)ethyl ester, octadecanoic acid 2193 1.10E+07 1.08 1,2- benzenedicarboxylic acid, diisooctyl ester 2252 1.20E+07 1.18 11 haxacosyne 2267 1.55E+07 1.52 9-hexacosene 2287 9.00E+06 0.88 sum 1.02E+09 100.00

119
Table F-2 Compounds identified in GC/MS for the liquid product obtained during pyrolysis of lard at 600oC, carrier gas flow rate of 30 cm3/min, quartz chips packing height of 70 mm and size 1.7-2.4 mm
Components scan no peak area area %
cyclopentene 71 1.40E+07 0.44 2,4 dimethyl-1-heptene 66 1.25E+07 0.39 1-hexene 75 6.00E+07 1.87 2-methyl-1,3 pentadiene 80 2.50E+07 0.78 acetic acid 83 2.90E+07 0.90 trans-hexa-2,4-dienyl acetate 87 3.60E+07 1.12 1-methyl-cyclopentene 89 2.10E+07 0.65 benzene 92 4.30E+07 1.34 1,3-cyclohexadiene 95 2.90E+07 0.90 cycloheptane 102 8.10E+07 2.53 1-heptene 97 3.65E+07 1.14 3-methyl-cyclohexanol 106 1.00E+07 0.31 1,5-dimethylcyclopentene 112 8.10E+06 0.25 ethylidenecyclopentane 118 1.80E+07 0.56 3-methyl-cyclohexene 127 2.40E+07 0.75 methylene-cyclohexane 138 2.05E+07 0.64 toulene 146 5.10E+07 1.59 2-methyl-bicyclo(4.1.0)heptane 155 9.00E+06 0.28 cis-bicyclo(5.1.0)octane 162 6.20E+07 1.93 1-octene 171 7.50E+07 2.34 1-nonyne 179 1.30E+07 0.41 1,7-octadiene 187 9.00E+06 0.28 2-octene 196 7.00E+06 0.22 1,3-cycloheptadiene 201 7.50E+06 0.23 ethylidenecyclohexane 205 1.80E+07 0.56 1,3-octadiene 213 8.00E+06 0.25 3-methylfuran 223 1.50E+07 0.47 3-propylcyclopentene 239 7.50E+06 0.23 1-ethyl-cyclohexene 245 1.10E+07 0.34 2,4-octadiene 252 1.35E+07 0.42 ethylbenzene 260 2.20E+07 0.69 3-methyl-1,4-heptadiene 265 8.00E+06 0.25 p-xylene 276 1.60E+07 0.50 1-ethenyl-2-methyl-cyclohexane 285 9.00E+06 0.28 1-8-nonadiene 298 1.60E+07 0.50 benzenepropanoic acid 310 2.60E+07 0.81 1-nonene 315 7.00E+07 2.18 cyclooctene 321 5.90E+07 1.84 nonane 327 8.00E+06 0.25 3,6-nonadien-1-ol 335 9.00E+06 0.28 ethyl-cyclohexane 339 1.20E+07 0.37 1-propenyl-cyclohexane 358 1.10E+07 0.34

120
1,1'-dimethyl-1,1'-bicyclopropyl 365 9.00E+06 0.28 2-cyclohexen-1-one 376 1.30E+07 0.41 2-methyl-octyne 402 1.15E+07 0.36 propyl-benzene 412 1.85E+07 0.58 2-4-nonadiene 420 7.00E+06 0.22 1-ethyl-3-methyl-benzene 426 9.50E+06 0.30 1-methylethyl-benzene 432 1.00E+07 0.31 1,3-octadiene 437 6.00E+06 0.19 9-decen-1-ol 470 1.60E+07 0.50 phenyl propyl ester carbonic acid 472 1.20E+07 0.37 1-decene 486 8.30E+07 2.59 1-ethenyl-4-methyl-benzene 493 9.00E+06 0.28 tetradecane 499 8.00E+06 0.25 9,12,15-octadecatrienoic acid 509 9.00E+06 0.28 bicyclo(2.2.1)-5-heptene-2-carboxaldehyde 517 1.70E+07 0.53 1,3,5-trimethyl-benzene 526 9.00E+06 0.28 cyclohexanebutanol 533 9.20E+06 0.29 2-propenyl-benzene 540 1.30E+07 0.41 indane 547 1.00E+07 0.31 2,4-decadien-1-ol 551 1.00E+07 0.31 indene 563 1.60E+07 0.50 4,5-dimethyl-2,6-octadiene 570 1.60E+07 0.50 1-methyl-3-propyl-benzene 580 9.50E+06 0.30 butyl-benzene 588 1.80E+07 0.56 2-methyl-phenol 593 1.00E+07 0.31 bicyclo(3.3.1)nonane 602 2.10E+07 0.65 2,2-dimethyl-5-methylene-bicyclo(2.2.1)-heptane 618 1.00E+07 0.31 2,4,4-trimethyl-2-pentenal 631 9.50E+06 0.30 1-hexadecyne 639 1.00E+07 0.31 4-dodecen-2-yne 647 1.20E+07 0.37 1-dodecene 652 9.10E+07 2.84 3-nonen-1-ol 661 9.10E+06 0.28 5-undecene 674 1.60E+07 0.50 4-undecene 686 1.50E+07 0.47 methyl ester-12,15- octadecadienoic acid 704 1.60E+07 0.50 1,10-undecadiene 708 1.80E+07 0.56 4-methylindan 719 7.50E+06 0.23 1,5-diethenyl-2,3-dimethylcyclohexane 728 9.10E+06 0.28 3-methylindene 733 1.40E+07 0.44 2-methyl-5-(1-methylethenyl)-cyclohexanone 738 1.20E+07 0.37 pentyl-benzene 752 2.45E+07 0.76 1,1-dimethyl-propyl-benzene 776 5.00E+06 0.16 napthalene 790 1.40E+07 0.44 1,11-dodecadiene 797 1.20E+07 0.37 1-tridecene 812 8.90E+07 2.77 1,15-pentadecanediol 817 1.20E+07 0.37 cyclododecene 861 1.50E+07 0.47

121
6,9-pentadecadine-1-ol 869 1.30E+07 0.41 5,7-dodecadiene 879 1.30E+07 0.41 cyclobuta[1,2:3,4]dicyclopentene 906 2.05E+07 0.64 2,4-dodecadiene 912 1.30E+07 0.41 3-pentylfuran 922 1.40E+07 0.44 3-decen-1-ol 949 1.80E+07 0.56 8-nonenoic acid 964 1.50E+07 0.47 hexadecanoic acid 969 1.50E+07 0.47 alpha.,4-dimethyl-3-cyclohexene 1016 9.00E+06 0.28 3-hexadecene 1099 1.10E+08 3.43 1-tetradecanol 1100 2.80E+07 0.87 decanoic acid 1131 4.40E+07 1.37 1-propenylcyclohexane 1174 1.80E+07 0.56 1-undecenoic acid 1218 2.40E+07 0.75 9-eicosene 1227 6.80E+07 2.12 hexadecane 1236 3.25E+07 1.01 1,13-tetradecadiene 1324 3.80E+07 1.18 oleyl alcohol 1330 3.30E+07 1.03 dodecanoic acid 1337 1.40E+07 0.44 1-octadecene 1350 7.10E+07 2.21 1-decyl-cyclohexene 1364 1.30E+07 0.41 heptadecane 1438 2.40E+07 0.75 1-heptadecene 1466 2.20E+07 0.69 heneicosane 1474 1.50E+07 0.47 hexadecanal 1491 2.20E+07 0.69 tetradecanoic acid 1564 3.60E+07 1.12 1-nonadecene 1576 1.10E+07 0.34 cyclononanone 1654 2.20E+07 0.69 9-octadecenal 1682 1.30E+07 0.41 2-pentadecanone 1690 1.70E+07 0.53 15-octadecanal 1709 9.00E+06 0.28 9-hexadecenoic acid 1800 1.20E+08 3.74 hexadecanoic acid methyl ester 1715 3.00E+06 0.09 4-octyldodecyl-cyclopentane 1835 9.00E+06 0.28 1-docosene 1865 3.70E+07 1.15 2-nonadecanone 1890 1.10E+07 0.34 9-12-octadecadienoic acid 1899 1.28E+07 0.40 2-(9-12-octadecadienyloxy)-ethanol 1908 1.28E+07 0.40 oleic acid 1934 1.08E+08 3.37 stearic acid 1971 1.00E+08 3.12 1-cyclopentyl-4-(3-cyclopentylpropyl)-dodecane 2025 2.40E+07 0.75 oxacyclohexadecan-2-one 2037 1.60E+07 0.50 2-propenyl ester octadecanoic acid 2050 1.90E+07 0.59 octahydro-4,8a-dimethyl-4a(2H)-Naphthalenol 2158 1.45E+07 0.45 octadecanedioic acid 2076 7.90E+06 0.25 2-octyl-cyclopropaneoctanal 2083 9.00E+06 0.28 cyclotetracosane 2129 8.30E+06 0.26

122
diisooctyl ester,1,2-benzenedicarboxylic acid 2256 3.90E+07 1.22 Total 3.21E+09 100.00
Table F-3 Compounds Identified in GC/MS for the liquid product obtained
during pyrolysis of lard at 650oC, carrier gas flow rate of 10 cm3/min, quartz chips packing height of 70 mm and size 1.7-2.4 mm
Components scan no peak area % area
2-methyl-3-buten-1-ol 58 1.60E+07 0.55 1,3-cyclopentadiene 62 3.00E+07 1.03 1-hexene 68 5.65E+07 1.95 trans-hexa-2,4-dienyl acetate 80 6.80E+07 2.34 ethenylmethyl-benzene 488 2.90E+07 1.00 benzene 84 1.00E+08 3.45 1-heptene 93 7.75E+07 2.67 1-ethyl-cyclopentene 110 2.40E+07 0.83 2,4 heptadiene 121 3.40E+07 1.17 1-decyne 130 1.90E+07 0.65 1,5-heptadien-3-yne 171 1.40E+07 0.48 toulene 140 9.60E+07 3.31 1,4-octadiene 153 3.55E+07 1.22 1-octene 162 7.00E+07 2.41 spiro[2.5]octane 199 1.50E+07 0.52 2-methyl-5-(1-methylethenyl)-2--cyclohexen-1-one 217 2.10E+07 0.72 1-ethenyl-3-methylene-cyclopentene 254 4.20E+07 1.45 p-Xylene 270 4.20E+07 1.45 12-heptadecyn-1-ol 278 7.50E+06 0.26 1,8-nonadiene 292 1.30E+07 0.45 styrene 301 9.10E+07 3.14 1-nonene 309 7.40E+07 2.55 cyclooctene 314 2.10E+07 0.72 1-propenyl-benzene 394 2.00E+07 0.69 (7S)-Trans-bicyclo(4.3.0)-3-nonen-7-ol 407 3.00E+07 1.03 1-ethyl-3-methyl-benzene 420 2.20E+07 0.76 1,3,5-trimethyl-benzene 425 2.00E+07 0.69 1,2,4-trimethyl-benzene 449 2.10E+07 0.72 alpha.-methylstyrene 456 1.35E+07 0.47 phenol 468 1.80E+07 0.62 1-decene 481 1.00E+08 3.45 bicyclo(2.2.1)-5-heptene-2-carboxaldehyde 513 2.30E+07 0.79 1-ethenyl-3-methyl-benzene 535 3.35E+07 1.15 2,2-dimethyl-5-methylene-bicyclo(2.2.1)-heptane 547 2.20E+07 0.76 Indene 561 4.70E+07 1.62 1-methyl-2-propyl-benzene 575 1.60E+07 0.55

123
butyl-benzene 582 2.80E+07 0.97 2-methyl-phenol 590 1.90E+07 0.65 3,4-diethenyl-cyclohexene 614 2.70E+07 0.93 1-ethenyl-3-ethyl-benzene 628 1.90E+07 0.65 2-norbornene 650 8.80E+07 3.03 3-methyl-1H indene 729 4.10E+07 1.41 1-methyl-1H indene 734 3.90E+07 1.34 pentyl-benzene 747 3.00E+07 1.03 1,2 -dihydro-naphthalene 754 4.90E+07 1.69 1-dodecene 800 8.40E+07 2.90 1-methyl-naphthalene 954 7.95E+07 2.74 1-ethylidene-1H indene 972 3.90E+07 1.34 biphenyl 1068 1.70E+07 0.59 hexadecene 1093 9.50E+07 3.27 decanoic acid 1119 4.00E+07 1.38 2-ethenyl-naphthalene 1135 1.60E+07 0.55 acenaphthylene 1156 1.80E+07 0.62 undecenoic acid 1211 2.25E+07 0.78 1-pentadecene 1221 5.00E+07 1.72 hexadecane 1231 3.40E+07 1.17 cyclododecene 1318 2.35E+07 0.81 2-propyl-1,1'-bicyclohexyl 1323 3.20E+07 1.10 1-octadecene 1344 5.40E+07 1.86 1-hexadecenoic acid 1432 2.10E+07 0.72 1,22-docosanediol 1440 1.30E+07 0.45 octadecene 1460 2.35E+07 0.81 octadecane 1469 2.05E+07 0.71 hexadecanal 1485 1.80E+07 0.62 phenanthrene 1550 2.70E+07 0.93 tetradecanoic acid 1555 2.90E+07 1.00 2-nonadecanone 1684 1.95E+07 0.67 hexadecanoic acid 1760 1.00E+08 3.45 2-propenyl ester octadecanoic acid 1858 1.70E+07 0.59 9-hexadecenoic acid 1925 6.20E+07 2.14 4-nonyn-1-ol 1940 5.10E+07 1.76 octadecanoic acid 1963 9.00E+07 3.10 diisooctyl ester,1,2-benzenedicarboxylic acid 2250 5.10E+07 1.76 2-propenyl-benzene 542 3.20E+07 1.10 2.90E+09 100.00

124
Table F-4 Compounds identified in GC/MS for the liquid product obtained during pyrolysis of lard at 550oC, carrier gas flow rate of 10 cm3/min, quartz particles packing height of 70 mm and size 1.7-2.4 mm
Components scan no peak area % area
2-methyl-1-propene 58 2.20E+07 1.4 1-pentene 62 4.90E+07 3.0 1,3 pentadiene 67 3.70E+07 2.3 hexane 73 8.10E+07 5.0 4-methyl-1-pentene 79 4.00E+07 2.5 acetic acid 82 3.40E+07 2.1 4-methyl-cyclopentene 85 3.40E+07 2.1 benzene 88 3.30E+07 2.0 1,7-octadiene 156 4.30E+07 2.6 cycloheptane 98 7.50E+07 4.6 ethylidenecyclopentane 114 1.30E+07 0.8 3-methyl-cyclohexene 124 2.50E+07 1.5 toulene 143 3.20E+07 2.0 1-octene 165 5.70E+07 3.5 1-nonene 308 3.40E+07 2.1 cyclooctene 318 6.80E+07 4.2 1-decene 482 6.00E+07 3.7 bicyclo(2.2.1)-5-heptene-2-carboxaldehyde 515 2.00E+07 1.2 methyl ester-11- octadecynoic acid 600 8.60E+06 0.5 1-undecene 650 5.80E+07 3.6 1-dodecene 808 5.50E+07 3.4 1-tridecene 955 4.50E+07 2.8 1-tetradecene 1095 8.20E+06 0.5 decanoic acid 1128 2.60E+07 1.6 13-heptadecyn-1-ol 1171 9.20E+06 0.6 1-pentadecene 1223 3.30E+07 2.0 hexadecane 1234 2.30E+07 1.4 1,13-tetradecadiene 1321 2.10E+07 1.3 1-octadecene 1347 4.30E+07 2.6 Oleyl alcohol 1435 1.38E+07 0.9 8-heptadecene 1443 1.32E+07 0.8 1-tetradecanol 1451 5.70E+06 0.4 1-nonadecene 1463 1.22E+07 0.8 heptadecane 1471 1.12E+07 0.7 tetradecanal 1489 2.32E+07 1.4 tetradecanoic acid 1560 2.32E+07 1.4 (Z)6-pentadecene-1-ol 1612 6.00E+06 0.4 octadecanedioic acid 1651 8.90E+06 0.5 9-octadecenal 1680 1.54E+07 0.9 2-heptadecanone 1688 2.40E+07 1.5 hexadecanal 1706 9.80E+06 0.6 1-docosene 1863 3.90E+07 2.4
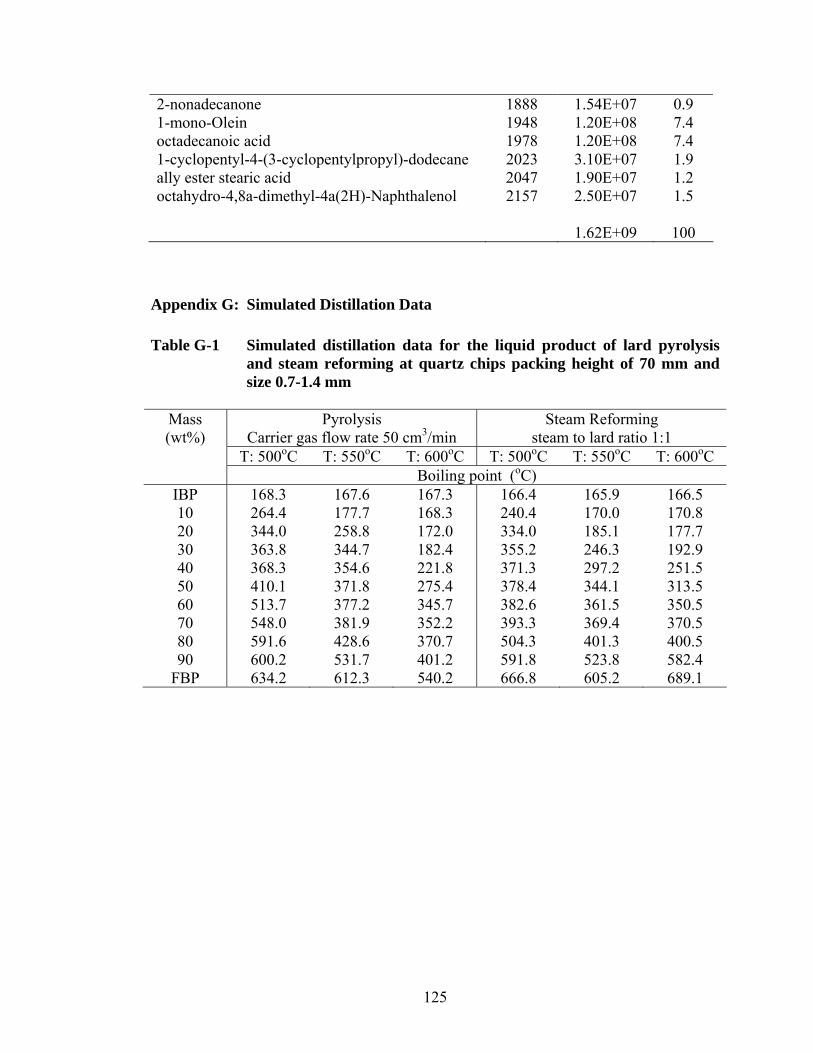
125
2-nonadecanone 1888 1.54E+07 0.9 1-mono-Olein 1948 1.20E+08 7.4 octadecanoic acid 1978 1.20E+08 7.4 1-cyclopentyl-4-(3-cyclopentylpropyl)-dodecane 2023 3.10E+07 1.9 ally ester stearic acid 2047 1.90E+07 1.2 octahydro-4,8a-dimethyl-4a(2H)-Naphthalenol 2157 2.50E+07 1.5 1.62E+09 100
Appendix G: Simulated Distillation Data Table G-1 Simulated distillation data for the liquid product of lard pyrolysis
and steam reforming at quartz chips packing height of 70 mm and size 0.7-1.4 mm
Pyrolysis
Carrier gas flow rate 50 cm3/min Steam Reforming
steam to lard ratio 1:1 T: 500oC T: 550oC T: 600oC T: 500oC T: 550oC T: 600oC
Mass (wt%)
Boiling point (oC) IBP 168.3 167.6 167.3 166.4 165.9 166.5 10 264.4 177.7 168.3 240.4 170.0 170.8 20 344.0 258.8 172.0 334.0 185.1 177.7 30 363.8 344.7 182.4 355.2 246.3 192.9 40 368.3 354.6 221.8 371.3 297.2 251.5 50 410.1 371.8 275.4 378.4 344.1 313.5 60 513.7 377.2 345.7 382.6 361.5 350.5 70 548.0 381.9 352.2 393.3 369.4 370.5 80 591.6 428.6 370.7 504.3 401.3 400.5 90 600.2 531.7 401.2 591.8 523.8 582.4
FBP 634.2 612.3 540.2 666.8 605.2 689.1

126
Table G-2 Simulated distillation data for the liquid product of lard pyrolysis at quartz chips packing height of 70 mm and size 1.7-2.4 mm
Temperature 600oC Temperature 800oC
N2: 30 cm3/min
N2: 50 cm3/min
N2: 70 cm3/min
N2: 30 cm3/min
N2: 50 cm3/min
N2: 70 cm3/min
Mass (wt%)
Boiling point (oC) IBP 169.6 170.3 170.6 170.8 170.3 170.7 10 170.8 171.7 171.9 177.2 171.4 174.0 20 171.7 173.3 173.7 178.2 172.2 177.4 30 174.1 180.4 177.2 178.8 173.3 178.2 40 182.7 199.6 189.3 179.3 174.7 178.8 50 209.3 252.8 230.9 180.0 177.9 184.6 60 261.6 318.5 283.5 186.4 178.9 195.1 70 352.4 362.9 359.7 198.9 179.4 204.7 80 367.1 404.3 382.7 208.4 180.2 273.8 90 403.4 464.3 432.7 288.8 195.8 372.0
FBP 537.5 568.4 549.5 458.9 284.1 501.0
Table G-3 Simulated distillation data for the liquid product during steam
reforming of lard at quartz chips packing height of 70 mm and size 0.7-1.4 mm
Steam Reforming
steam to lard ratio 0.5:1 Steam Reforming
steam to lard ratio 1.5:1 T: 500oC T: 600oC T: 600oC T: 800oC
Mass (wt%)
Boiling point (oC) IBP 166.5 165.8 167.3 167.1 10 244.6 166.8 169.1 168.0 20 338.9 168.8 173.5 169.1 30 348.7 173.3 189.4 169.9 40 366.1 182.8 257.7 173.6 50 371.2 214.3 341.5 181.8 60 374.7 259.7 353.2 184.0 70 401.3 313.7 372.3 184.8 80 522.9 353.3 377.6 221.6 90 590.6 375.6 500.9 294.8
FBP 652.0 590.5 605.3 459.3

127
Appendix H: Energy Balance Calculation Appendix H-1: Energy balance for the pyrolysis experiment Properties of tristearin are readily available in the literature. It is thus chosen to represent the lard for the purpose of energy balance. The energy balance calculations are based on the following simplified cracking reaction. H2C-OCO(CH2)16CH3 HC-OCO(CH2)16CH3 = 3C16H34 + 2C2H4 + CO2 + 4CO (H-1) H2C-OCO (CH2)16CH3
Basis: 1mole of tristearin (TS) The feed is assumed to be at 25 oC and products at 600 oC The properties of TS are given in Table H-1. Calculation of heat required to preheat the feed to reaction temperature Qp Heat required to take TS from 25oC to melting point: Q1 = 1 mol x 1288.4 J/mol oC x (54.7-25)oC = 38266.1 J Heat required to melt TS at the melting point: Q2 = 1 mol x 93838.8 J/mol = 93838.8 J Assuming the heat capacity is constant from melting point to boiling point, Heat required to take TS from melting point (54.7oC) to boiling point (505.8oC): Q3 = 1 mol x 2201.3 J/mol oC x (505.8 -54.7oC) = 993006 J
Heat required to vaporize TS at its boiling point:
Q4 = 1 mol x 174900 J/mol = 174900 J
Heat required to take TS vapour from 505.8oC to the reaction temperature (600oC)
Q5 = 1 mol x 2010.5 J/mol oC x (600 -505.8 oC) = 189389.1 J
Total energy required to preheat the feed to the reaction temperature:
Qp = Q1 + Q2 +Q3 + Q4 + Q5
Qp = 1489400 J

128
Table H-1 Properties of Tristearin Heat of vaporization, J/mola 174900 Molecular wta 890 Heat capacity as solid J/mol oC (22-mp)b 1288.4 Heat of fusion J/molb 93838.8 Activation energy kJ/mola 170.7 Heat capacity as liquid J/oC mola 2201.3 Heat capacity as gas J/oC mola 2010.5 Melting pointb oC 54.7 Boiling pointa oC 505.8 aKishore and Shobha (1990) bO’Brien et al(2000)
Determination of the heat of reaction, QR
The specific heat capacities and heats of formation at 25oC of CO, CO2, C2H4 and C16H34 were obtained from Chemical Properties handbook by Yaws (1999). The data were used to evaluate the heat of reaction as stated below. The integration was done over T1 = 273 K and T2 = 873 K
∆Hr(C16H34) = 3*[∆Hf(C16H34) + ∆CpdT]
= 3x [-493 + ∫ (131.75 +6.7397x 10⁻¹ T + 8.777 x 10⁻⁴T2 – 1.243 x 10⁻⁶T3 + 3.9785x10⁻¹⁰T4) dT]
= 1053621 J
∆Hr(C2H4) = 2*[∆Hf(C2H4) + ∆CpdT]
= 2 x [52.3+ ∫ (32.083 -1.4831x 10⁻² T + 2.4774 x 10⁻⁴T2 – 2.3766 x 10⁻⁷T3 + 6.8274x10⁻¹¹T4)dT]
= 78244.6 J
∆Hr (CO2) = 1*[∆Hf (CO2) + ∆CpdT]
= 1 x [-393.51 + ∫ (27.437+ 4.231x 10⁻²T -1.9555 x 10⁻⁵T2 + 3.9968 x 10⁻⁹T3 – 2.9872x10⁻¹³T4)dT]
= 26006.5J
∆Hr (CO) = 4*[∆Hf (CO) + ∆CpdT]

129
4 x [-110.54 + ∫ (29.556-6.5807x 10⁻³T + 2.013 x 10⁻⁵T2-1.2227 x 10⁻⁸T3+ 2.2617x10-
12T4) dT]
= 69714.8 J
∆Hr (TS) = 1*[∆Hf (TS) + ∆CpdT]
The standard heat of formation of TS is obtained from its heat of combustion as follows
57C(s) + 57O2(g) = 57CO2(g) ∆Ho298 = (57)(-393,509) J
55H2(g) +27½O2(g) = 55H2O(l) ∆Ho298 = (55)(-285,830) J
57CO2(g) +55H2O(l) = C57H110O6 (s) + 81½O2(g) ∆Ho298 = 37760000 J
57C(s) + 55H2(g) + 3O2 = C57H110O6 (s) ∆Ho298 = -390663 J
And its ∆CpdT is the same as QP calculated above less heat of fusion and vaporization
Thus
(∆CpdT)TS = QP – Q2 - Q4
= 1489400 - 93838.8 – 174900 = 1220662 J
Therefore,
∆Hr (TS) = 1*( -390663 + 1220662) = 829998.6 J
∆Hr(reaction) = QR = ∑(∆Hr)product - ∑(∆Hr)reactants
= 78244.6+26006.5+69717.8+1053621-829998.6
= 397591.3 J (endothermic) The positive heat of reaction is confirmed by the TG/DTA analysis.
Total energy required is
QT = QP + QR
= 1489400 + 397591.3 = 1886992 J/mol TS Accounting for 15% heat loss QTactual = 2170040 J/mol TS = 2170.0 kJ/mol TS

130
The enthalpies of combustion of the products at 25oC are given by Yaws (1999) as: CO (g): 283 kJ/mol CO2 (g): 0 C2H4 (g): 1322.6 kJ/mol C16H34 (g): 9952.8 kJ/mol Based of equation (H-1), total energy available in the product is: QA= 3*(9952.8) + 2*(1322.6) + 4*(283) = 33635.6 kJ/ mol TS = 2.44 kJ/g Therefore, for the pyrolysis reaction, the net energy gain is 33635.6 – 2170.0 = 31465.6 kJ/ mol TS (Based on stoichiometry) Evaluation of heat obtainable from products from material balance From the material balance (Appendix B-1), Total mole of ethylene produced per 2.79 g of lard was
= 7.26E-03 gmole Assuming all lard is TS, mole of TS in lard fed =2.79 g/ 891g/gmole = 0.003131 gmole Therefore mole of ethylene produced per mole of lard fed was
2.32 mole ethylene/mol lard Similarly for CO, Mole produced from material balance = 3.23E-03 mole Mole of CO produced per mole of lard fed is 1.03 mole CO/mole lard Using the enthalpy of combustion of these compounds, heat recoverable from the gas products is 2.32 x 1322.6 kJ/mol +1.03 x 283 kJ/mol =3358.4 kJ/mol lard = 3.8 kJ/g of lard fed The liquid product obtained was not analyzed so the energy recoverable from the liquid is based on the heating value of the liquid. From Appendix B-1, 1.48 g of liquid was produced per 2.79 g of lard fed i.e. 1.48 / 2.79 g = 0.530466g of liquid/ g of lard fed From Appendix C-2, the heating value of this liquid is (Run #23) 38.44 kJ/g Therefore heat recoverable from the liquid is

131
0.530466g of liquid/ g of lard fed x 38.44 kJ/g of liquid 20.4 kJ/g of lard fed
Total heat recoverable from products = 3.8+20.4 = 24.2kJ/g of lard The net heat gain 24.2 – 2.4 = 21.8 kJ/g lard Appendix H-2: Energy balance for steam reforming of lard for the case of steam to lard ratio (S/L) of 1 (Basis 1 mol TS) 1 mole tristearin = 891 g Therefore for S/L of 1, 891 g of water = 49.5 moles is fed. The energy balance is done for the reaction H2C-OCO(CH2)16CH3 HC-OCO(CH2)16CH3 + 49.5 H2O = 3C16H34 + 2C2H4 + CO2 + 4CO + 49.5 H2O H2C-OCO (CH2)16CH3 Calculation of the heat required for the feed water Boiling temperature of water is 100oC at 1 atm Heat capacity of liquid water is given by the expression, CpL = 8.712 +1.25x 10⁻³T -1.8x 10⁻⁷T2 J/mol.K Energy required to take liquid water from 25oC to 100oC is: Q6 = 49.5 mol x ∫ CpLdT = 33825.33 J Heat of vaporization of water at 1 atm is 40656 J/mol Energy required to vaporise the water at 100oC is Q7 = 49.5 mol x 40656J/mol = 2012472 J Heat capacity of water vapour is given by the expression Cpg = 32.24+1.924x10⁻³T+1.055x10⁻⁵T2-3.596x10⁻⁹T3
Energy required to take water from 100oC to reaction temperature of 600oC is Q8 = 49.5 mol x ∫ Cpg dT = 909315 J Total energy required to take liquid water to the reaction temperature is QW = Q6 + Q7 +Q8
= 33825.33 + 2012472 + 909315 = 2955612 J
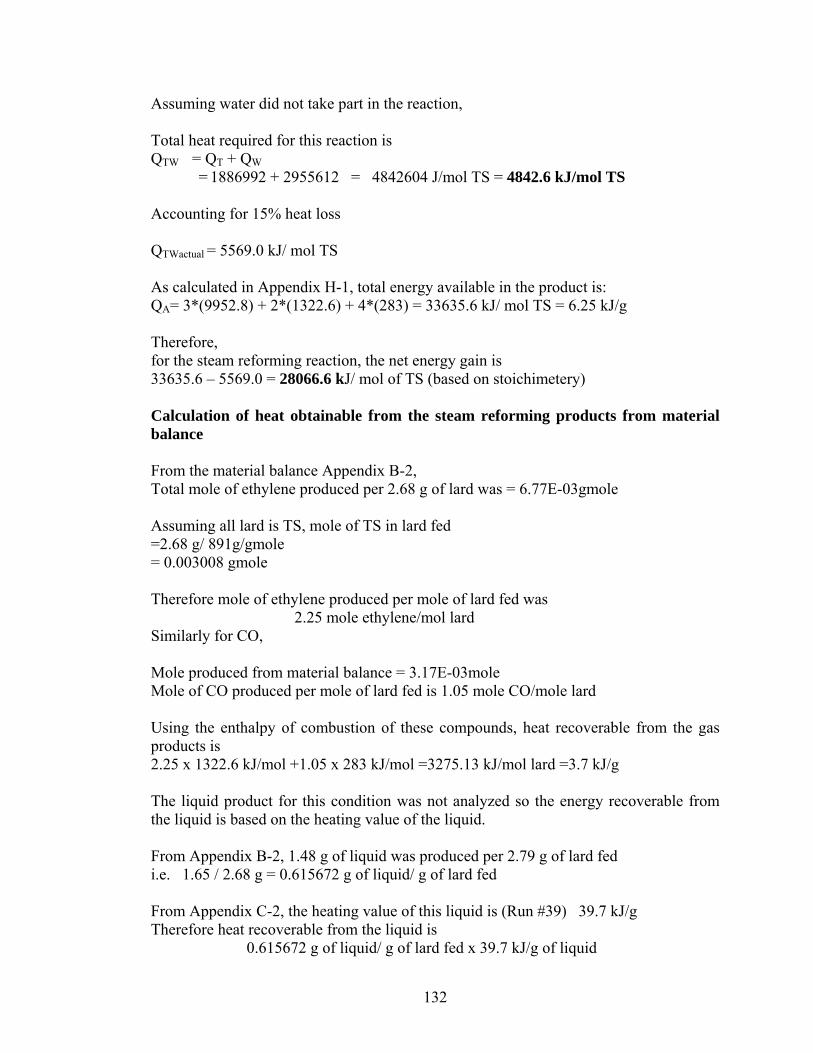
132
Assuming water did not take part in the reaction, Total heat required for this reaction is QTW = QT + QW
= 1886992 + 2955612 = 4842604 J/mol TS = 4842.6 kJ/mol TS Accounting for 15% heat loss QTWactual = 5569.0 kJ/ mol TS As calculated in Appendix H-1, total energy available in the product is: QA= 3*(9952.8) + 2*(1322.6) + 4*(283) = 33635.6 kJ/ mol TS = 6.25 kJ/g Therefore, for the steam reforming reaction, the net energy gain is 33635.6 – 5569.0 = 28066.6 kJ/ mol of TS (based on stoichimetery) Calculation of heat obtainable from the steam reforming products from material balance From the material balance Appendix B-2, Total mole of ethylene produced per 2.68 g of lard was = 6.77E-03gmole Assuming all lard is TS, mole of TS in lard fed =2.68 g/ 891g/gmole = 0.003008 gmole Therefore mole of ethylene produced per mole of lard fed was
2.25 mole ethylene/mol lard Similarly for CO, Mole produced from material balance = 3.17E-03mole Mole of CO produced per mole of lard fed is 1.05 mole CO/mole lard Using the enthalpy of combustion of these compounds, heat recoverable from the gas products is 2.25 x 1322.6 kJ/mol +1.05 x 283 kJ/mol =3275.13 kJ/mol lard =3.7 kJ/g The liquid product for this condition was not analyzed so the energy recoverable from the liquid is based on the heating value of the liquid. From Appendix B-2, 1.48 g of liquid was produced per 2.79 g of lard fed i.e. 1.65 / 2.68 g = 0.615672 g of liquid/ g of lard fed From Appendix C-2, the heating value of this liquid is (Run #39) 39.7 kJ/g Therefore heat recoverable from the liquid is
0.615672 g of liquid/ g of lard fed x 39.7 kJ/g of liquid

133
24.45 kJ/g of lard fed Total heat recoverable from products = 3.7+24.5 = 28.2 kJ/g of lard The net heat gain 28.2 – 6.3 = 21.9 kJ/g lard