Embed Size (px)
Citation preview
NOVEMBER, 2013
DEPARTMENT OF CHEMICAL AND ENVIRONMENTAL
ENGINEERING
UNIVERSITY OF OVIEDO
PRODUCTION OF EMULSIONS WITH
CONTROLLED DROPLET SIZE
CONTAINING BIOACTIVE COMPOUNDS
USING MEMBRANES
DOCTORAL THESIS
BY
MARÍA MATOS GONZÁLEZ
AGRADECIMIENTOS
Al Prof. José Coca por haberme dado la oportunidad de llevar a cabo este
trabajo, de participar en varios proyectos, cursos y congresos, por las enseñanzas
recibidas y por el apoyo mostrado durante todo este tiempo.
A la Prof. Carmen Pazos, por permitirme formar parte del Grupo de Investigación
de Emulsiones y Fenómenos Interfaciales, por sus consejos a la hora de ayudarme a
estructurar y desarrollar este trabajo, por toda su paciencia y comprensión, y por sus
extraordinarias correcciones.
A la Dra. Gemma Gutiérrez, no sólo por supervisar este trabajo, sino por su
amistad incondicional y grata compañía a lo largo de todos estos años.
Al Dr. José Manuel Benito, por siempre estar ahí cuando se le necesita, a pesar
de encontrarse a muchos kilómetros de distancia, y responder desinteresadamente
con esa rapidez tan sorprendente a todas las dudas que se me han planteado.
A la Dra. Marilyn Rayner y al Prof. Petr Dejmek, por permitirme llevar a cabo una
breve pero fructífera estancia en el Departamento de Tecnología de Alimentos,
Ingeniería y Nutrición de la Universidad de Lund (Suecia). Agradezco también a la Dra.
Malin Sjöö por haberme dejado participar en el proyecto Speximo y a la Dra. Anna
Timgren, que desgraciadamente ya no está entre nosotros, por su apoyo constante en
el laboratorio durante mi estancia.
Al programa de Formación de Personal Investigador (FPI) del Ministerio de
Economía y Competitividad, cofinanciado por el fondo social europeo (FEDER), por el
apoyo económico para la realización de la presente Tesis Doctoral, así como a los
proyectos CTQ2007-65348 y CTQ2010-20009-C02-01.
A los becarios que durante estos dos últimos años han pertenecido al Grupo de
Emulsiones y Fenómenos Interfaciales, David, Alberto, Miguel y Daniel por su
compañía y por el ánimo transmitido en todo momento.
A todos los compañeros, tanto de la sala de becarios como del Departamento,
por ser estupendos tanto a nivel personal como de trabajo, y por todos los buenos
ratos que hemos pasado.
Agradecer finalmente a mi familia y a mi pareja por apoyarme en todo momento.
INDEX
ABSTRACT................................................................................................................. RESUMEN.................................................................................................................. 1. INTRODUCTION.................................................................................................. 1.1. ANTIOXIDANT COMPOUNDS…………………………………………………………………….
1.2. EMULSIONS………………………………………………………………………………………………
1.2.1. Stabilizers……………………………………………………………………………………………
1.2.2. Pickering emulsions…………………………………………………………………………….
1.2.3. High Internal Phase Emulsions (HIPEs)…………………………………………………
1.2.4. Double emulsions………………………………………………………………………………..
1.3. MEMBRANE EMULSIFICATION………………………………………………………………….
1.3.1. Direct membrane emulsification………………………………………………………….
1.3.1.1. Droplet formation mechanism……………………………………………………….
A. Shear-based mechanism……………………………………………………………….
B. Spontaneous emulsification…………………………………………………………..
1.3.2. Premix emulsification………………………………………………………………………....
2. OBJECTIVES......................................................................................................... 3. RESULTS..............................................................................................................
I. EMULSIFICATION WITH CERAMIC MICROFILTRATION MEMBRANES: A DIFFERENT APPROACH TO DROPLET FORMATION MECHANISM……………….
I
III
1
2
4
5
8
10
10
13
14
15
15
16
18
19
21
22
II. PREPARATION AND ENCAPSULATION PROPERTIES OF DOUBLE PICKERING EMULSIONS STABILIZED BY QUINOA STARCH GRANULES………………………….
III. PREPARATION OF WATER-IN-OIL-IN-WATER (W1/O/W2) DOUBLE EMULSIONS CONTAINING TRANS-RESVERATROL………………….…………………..
IV. PREPARATION OF HIPES WITH CONTROLLED DROPLET SIZE CONTAINING LUTEIN……………………………………………………………………………………………………..
4. GENERAL CONCLUSIONS..................................................................................... 5. CONCLUSIONES GENERALES............................................................................... 6. REFERENCES........................................................................................................
41
50
63
85
87
89
ABSTRACT
The objective of this thesis is the preparation of simple and double emulsions of interest in food, pharmaceutical and cosmetic industries, containing bioactive compounds with antioxidant capacity both of lipophilic (lutein) and hydrophilic character (resveratrol). Several technologies were used, such as, mechanical agitation, membrane emulsification and vacuum evaporation.
Taking into consideration the importance of the droplet size control in this type of emulsions, a fundamental study of the membrane emulsification process was carried out. Flat and tubular ceramic microfiltration membranes were used to prepare oil-in-water (O/W) emulsions. The performed experiments enabled to understand the effect of operation parameters on droplet size distributions, and to determine the droplet formation mechanism and the optimal operation conditions. Stable monodisperse emulsions were obtained with very low span values. A spontaneous emulsification mechanism is proposed for both flat and tubular membranes as the continuous phase shear stress had little influence on the oil droplet size.
Based on previous studies, which showed the extreme stability of simple oil-in-water (W/O) Pickering emulsions stabilized with starch granules from Quinoa, the feasibility of preparing double water-in-oil-in-water (W1/O/W2) emulsions was studied. The initial encapsulation efficiency was higher than 98.5% immediately after emulsification process, and the encapsulation stability remained over 90% after 21 days for all systems formulated.
Food-grade water-in-oil-in-water (W1/O/W2) double emulsions to encapsulate trans-resveratrol were formulated and prepared by mechanical agitation and membrane emulsification. A technique based on RP-HPLC to determine trans-resveratrol concentration in the external aqueous phase with UV–vis and fluorescence detectors was developed to measure the encapsulation efficiency (EE) and the encapsulation stability (ES). Several stabilizers were used, both in the oily phase and in the external aqueous phase, to achieve the optimal formulation.
Finally, highly concentrated oil-in-water (O/W) emulsions, also called high internal phase emulsions (HIPEs), containing lutein were formulated and prepared by two-step technique, combining either membrane emulsification or mechanical agitation with vacuum evaporation. The oil droplet size distribution and viscosity were measured to assess the vacuum evaporation performance. Oil-in-water (O/W) emulsions with an internal phase concentration up to 90% (v/v) were prepared by
I
mechanical agitation and evaporation. Emulsions obtained by membrane emulsification showed higher monodispersity but they could only be concentrated up to 75% (v/v) of internal phase. An appropriate formulation led to lutein encapsulation efficiency up to 97%.
II
III
RESUMEN
En el presente trabajo, se han preparado emulsiones simples y dobles, de interés
en la industria alimentaria, farmacéutica y cosmética, conteniendo biocompuestos con
capacidad antioxidante, tanto de carácter lipófilo (luteína), como hidrófilo
(resveratrol). Para ello, se utilizaron diferentes tecnologías, como agitación mecánica,
emulsificación con membranas y evaporación a vacío.
Teniendo en cuenta la importancia del control del tamaño de gota en este tipo
de emulsiones, se llevó a cabo un estudio fundamental del proceso de emulsificación
con membranas. Se utilizaron membranas cerámicas de microfiltración con formato
plano y tubular y se prepararon emulsiones aceite-agua (O/W). Los experimentos
programados permitieron comprender el efecto de los parámetros de operación sobre
la distribución de tamaños de gota, así como determinar el mecanismo de formación
de gotas que tiene lugar y establecer las condiciones de operación óptimas. Se
obtuvieron emulsiones monodispersas estables que presentaban valores muy bajos de
span. Asimismo, se propuso un mecanismo espontáneo para la formación de las gotas
de fase dispersa, al constatar la escasa influencia del esfuerzo cortante ejercido por la
fase continua sobre el tamaño de gota obtenido
Basándonos en estudios previos, en los cuales se había demostrado la elevada
estabilidad de emulsiones simples aceite-agua (O/W) tipo Pickering, con gránulos de
almidón procedentes de la Quinoa como estabilizantes, se analizó si resultaba viable la
preparación de emulsiones dobles agua-aceite-agua (W1/O/W2). Los resultados
indicaban que el valor de la eficacia de encapsulación inicial, inmediatamente después
del proceso de emulsificación, era del 98.5%. Además, la estabilidad de encapsulación
se mantenía, después de 21 días, en un valor del orden del 90% para todos los
sistemas formulados.
A continuación, se formularon y prepararon emulsiones dobles agua-aceite-agua
(W1/O/W2) de grado alimentario para encapsular trans-resveratrol, empleando
agitación mecánica y emulsificación con membranas. Se desarrolló un protocolo para
analizar la concentración de trans-resveratrol en la fase acuosa externa, utilizando
cromatografía líquida de alta resolución de fase inversa (RP-HPLC) con detectores UV-
VIS y de fluorescencia, con el fin de determinar la eficacia de encapsulación (EE) y la
estabilidad de encapsulación (ES). Se estudió el comportamiento de varios tipos de
estabilizantes, tanto en la fase aceitosa, como en la fase acuosa externa, lo que
permitió establecer una formulación óptima.
IV
Finalmente, se formularon y prepararon emulsiones aceite-agua (O/W), con
elevada proporción de fase interna (HIPEs) y conteniendo luteína, empleando una
técnica en dos etapas, que combinaba emulsificación con membranas o agitación
mecánica con evaporación a vacío. Para evaluar el rendimiento de la evaporación a
vacío, se midió la distribución de tamaño de las gotas de aceite y la viscosidad de las
emulsiones. Se obtuvieron emulsiones aceite-agua (O/W) con una concentración de
fase interna que llegaba hasta el 90% (v/v), mediante agitación mecánica y
evaporación. Las emulsiones obtenidas mediante emulsificación con membranas
mostraban un superior carácter monodisperso, aunque con concentraciones máximas
de fase interna del 75% (v/v). Una adecuada selección de los componentes de la
formulación permitió alcanzar una eficacia de encapsulación de luteína del 97%.

INTRODUCTION
Introduction
2
The current way of life and the high sensibility towards health, creates the need
to develop functional foods containing biological active components (such as vitamins,
fatty acids, antioxidants, minerals, etc). These components supplement the nutritional
characteristics of food, and contribute to health improvement and decrease the risk of
diseases.
The main disadvantage is that most of the antioxidants are lipophilic, with none
or very low solubility in water, and processes such as emulsification and/or
microencapsulation allow to supply the bioactive compounds in stable structures, such
as colloidal systems, of well-defined size. Some of the most common colloidal systems
are emulsions.
Encapsulation techniques have been developed basically in the pharmaceutical
and cosmetic industries and they are of different nature depending on the type of the
bioactive compound and the application purpose. Food emulsions require the use of
ingredients of food degree, such as natural components, which form structures
(proteins, carbohydrates, lipids or their mixtures, polycarbonates, etc.), or ingredients
functionalized in physical or enzymatic form.
The aim of this thesis is to contribute to the preparation of emulsions containing
natural bioactive compounds (lutein and resveratrol) for food, pharmaceutical and
cosmetic applications.
1.1. Bioactive compounds
Bioactive compounds are defined as essential and nonessential compounds (e.g.,
vitamins or polyphenols) that occur in nature, are part of the food chain, and can be
shown to have an effect on human health (Biesalski et al., 2009).
Bioactive substances present as natural constituents in food provide health
benefits beyond the basic nutritional value of the product. Until recently, vitamins and
other micronutrients have been recommended just to avoid deficiency symptoms .
Nowadays, the most extensively studied compounds are antioxidants, which prevent
the risk of chronic diseases including cancer and cardiovascular disorders (Biesalski et
al., 2009).
Antioxidant compounds, such as carotenoids, polyphenols, phytosterols, omega-
3 fatty acids, etc., protect the cells from the oxidative stress caused by the action of
free radicals, and they are being used as active ingredients in several food products.
Introduction
3
Carotenoids are compounds soluble in lipids (lipophilic antioxidants) and are
responsible for the colour of fruits and vegetables. Among the most important for the
organism are: -carotenes, -carotenes, lycopene, cryptoxanthin, lutein and
zeaxanthin.
Lutein is a natural yellow carotenoid that can be found in many fruits and
vegetables, in some algae and in egg-yolk. Foods with a high content in lutein are:
peas, leeks, broccoli, spinach, spinach beet, cabbage, corn, parsley, celery, squash,
bananas and oranges. This compound is a dihydroxylated derivative of -carotene,
belonging to the xantophylls group, which is also of great interest for its antioxidant
properties, since it prevents macular degeneration, avoiding the progress of cataracts
and glaucoma that lead to the loss of vision. Lutein is also found naturally in human
skin, where it acts as a potential antioxidant maintaining skin health by reducing UV-
induced erythema and inflammation. Because of the link between UV radiation
(particularly its UVB component) exposure and skin cancer, lutein may play a
protective role against skin cancer. It has been demonstrated that topical treatment
with 50 mg/L lutein twice a day induces immediate increase in skin surface lipids and a
significant reduction in skin lipid peroxidation, improving the photoprotective activity
and also the skin elasticity and hydration (Mitri et al., 2011).
Lutein addition in food and cosmetic formulations is limited by its instability
towards oxygen, light and temperature, and hence the use of oil droplets as lutein
carriers is considered a suitable technique (Mitri et al., 2011; Qv et al., 2011).
Polyphenols are a typical example of hydrophilic antioxidants of food interest, as
it is the case of resveratrol (trans-3,4',5-trihydroxystilbene), a phytoalexin present in
dried fruits and in the grape skin where from it goes into the red wines, with a
solubility up to 0.03 g/L in water and 50 g/L in ethanol. It has beneficial effects for
human health, such as anti-oxidant, anti-inflammatory, cardioprotective and anti-
tumour properties.
However, the applications of trans-resveratrol are limited because it is an easily
oxidizable and extremely photosensitive compound, with low water solubility, short
biological half-life, and rapid metabolism and elimination (Peng et al., 2010; Amri et al.,
2012; Saiko et al., 2008).
Encapsulation studies have been carried out to protect trans-resveratrol from
degradation and to mitigate effectively these limitations (Fang and Bhandari, 2010;
Amri et al., 2012). Several methods for the encapsulation of polyphenols have been
reported: spray drying, coacervation, liposome or niosome entrapment (Caddeo et al.,
Introduction
4
2008; Fabris et al., 2008; Kristl et al., 2009; Pando et al., 2013a; Pando et al., 2013b;
Wang et al., 2011), inclusion complexation (Lucas-Abelán et al., 2007),
cocrystallization, nanoencapsulation (Shao et al., 2010; Teskac and Kristl, 2010), freeze
drying and emulsification (Fang and Bhandari, 2007; Donsi et al., 2011).
In general, all the former compounds show strong antioxidant activity that helps
to prevent cancer and delay aging. Furthermore, some of them offer specific clinical
demonstrated benefits, as the anti-obesity effect of resveratrol or the protection of
the macula of retina by lutein. Many of these antioxidants are available as a dietetic
supplement, which is taken orally as tablets, capsules or suspensions, and they are sold
in dietetic products shops, herbal and drugstores.
1.2. Emulsions
An emulsion is defined as a two-phase system consisting of two immiscible
liquids of different composition, one of which is in the shape of drops, dispersed in the
other one. The liquid in drop shape is called the dispersed phase or inner phase,
whereas the liquid in which these drops are suspended is called continuous phase or
external phase. The most common situation corresponds to an emulsion formed by a
hydrophilic liquid (water) and another one hydrophobic (oil).
The structure of an emulsion depends to a great extent on the volume fraction of
water, oil and a third component called emulsifying agent or emulsifier, as well as the
nature of the interfacial film.
Emulsions play an important role in the formulation of foods for production of
oil-in-water (O/W) emulsions (e.g. dressings or artificial milks) as well as for the
preparation of some water-in-oil (W/O) emulsions (e.g. margarine and low fat
spreads). Some emulsions are final products (e.g. coffee creamers) and other
emulsions can be used as ingredients, which help in forming the structures of more
complex products (e.g. yoghourts that must interact with other food ingredients, but
that must not be destabilized in the process). However, emulsion droplets can also
create new structures in the product (i.e., ice-creams) where being emulsion
destabilization required for this purpose (Charcosset, 2009).
Two special types of emulsions are microemulsions and nanoemulsions, with
droplet sizes below 100 nm (Mason et al., 2006). The appearance of these emulsions is
translucent due to the fact that the light can penetrate through the emulsion without
being scattered if the droplet sizes in the emulsion are below about 100 nm. The main
difference is that nanoemulsions require specialized equipment to be produced, while
Introduction
5
microemulsions are spontaneously formed by solubilizing oil molecules with a mixture
of stabilizers (surfactants, co-surfactants, and co-solvents) (Mason et al., 2006).
However, in most cases emulsions are inherently unstable and, therefore, do not
tend to form spontaneously. An energy input is required to form an emulsion being the
most common industrial emulsification processes: high pressure homogenizers, rotor
stator devices and static mixers.
1.2.1. Stabilizers
The main kind of emulsifiers are surfactants. A surfactant, a contraction of the
term surface-active agent, is a substance that, at low concentration in a system, has
the property of adsorbing onto the surfaces or interfaces altering the associated free
energies. The term interface refers to the boundary between two inmiscible phases.
The interfacial free energy is the minimum amount of work required to create that
interface (Rosen J. Milton, 2004).
The interfacial free energy per unit of area is the interfacial tension between two
phases. A surfactant is therefore a substance that at low concentration adsorbs at the
interfaces in a system and significantly reduces the work required to expand the
interfaces.
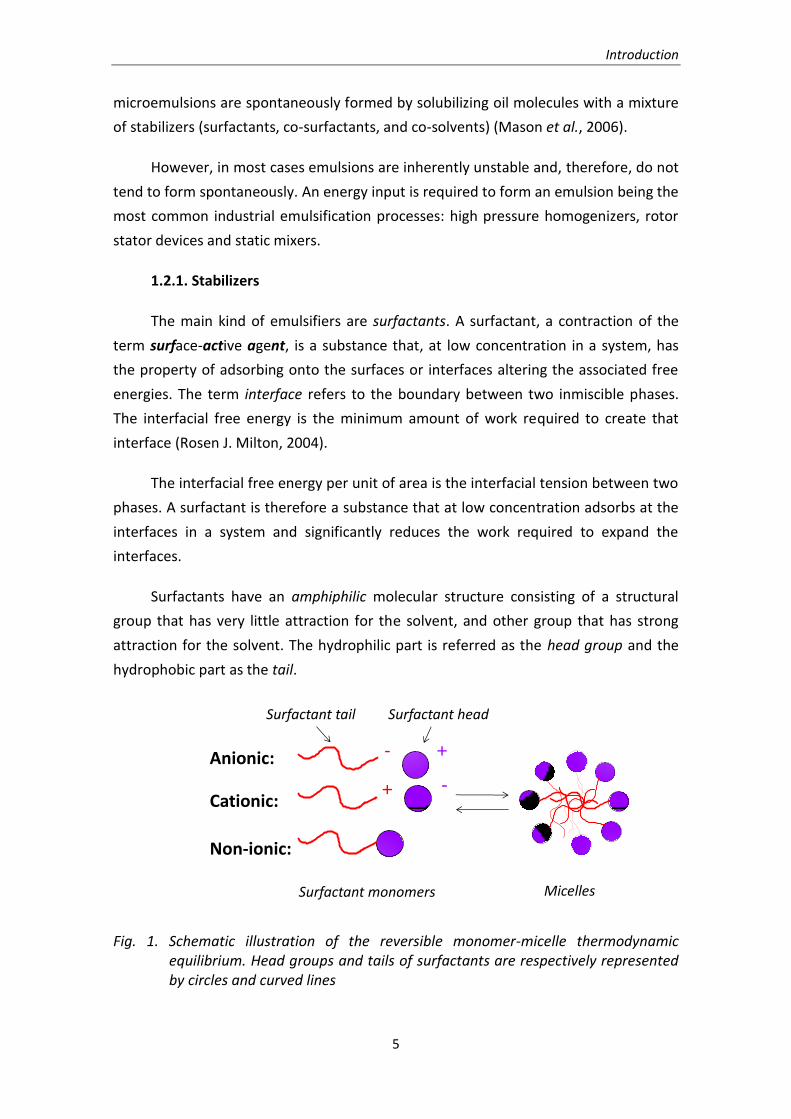
Surfactants have an amphiphilic molecular structure consisting of a structural
group that has very little attraction for the solvent, and other group that has strong
attraction for the solvent. The hydrophilic part is referred as the head group and the
hydrophobic part as the tail.
Fig. 1. Schematic illustration of the reversible monomer-micelle thermodynamic equilibrium. Head groups and tails of surfactants are respectively represented by circles and curved lines
Anionic:
Cationic:
Non-ionic:
- +
+ -
Surfactant monomers Micelles
Surfactant tail Surfactant head
Introduction
6
Depending on the nature of the hydrophilic group, surfactants can be classified
as:
1. Anionic. The surface-active portion of the molecule has a negative charge.
Carboxylate, sulfate, sulfonate and phosphate are the polar group of this type
of surfactants.
2. Cationic. The surface-active portion has a positive charge, and the nitrogen
atom usually has the cationic charge. Amine and quaternary ammonium-based
products are common groups, e.g., RN(CH3)3+Cl- (quaternary ammonium
chloride).
3. Zwitterionic. Both positive and negative charges may be present in the surface-
portion. Whereas the positive charge is almost invariably ammonium, the
source of negative charge may vary, although carboxylate is the most common.
4. Non-ionic. The surface-active portion has no apparent ionic charge with a
polyether or a polyhydroxyl unit as the polar group.
The physical, chemical and electrical properties of matter confined to phase
boundaries are often quite different from those of the same matter in bulk. For many
systems (e.g., emulsions, foams and dispersions of solids) where a substantial fraction
of the total mass is located at the boundaries (interfaces or surfaces), being relatively
large with respect to the total volume of the system, surfactants are expected to play
an important role.
Another fundamental property of surfactants is that monomers in solution tend
to form aggregates called micelles. Surfactants molecules have very different behavior
when they are present in micelles instead of free monomers in solution. Only
surfactants monomers contribute to surface and interfacial tensions reduction and
dynamic phenomena (e.g., wetting and foaming) are governed by the concentration of
free monomers in solution.
Surfactants are among the most versatile products of the chemical industry and
the world production is of several millions of metric tons. Some of their main
applications are related to cosmetic, food and pharmaceutical industries (Myers,
2006).
Cosmetic and personal care products make up a multi-billion-dollar market
worldwide. Most of these products are formulated at least with a small amount of
surfactant (e.g. tints, lipsticks, hair dyes, mascara, etc.). Although the possible adverse
Introduction
7
effects of surfactants in cosmetics and personal care products are an important aspect
that must be studied in depth for safety reasons, due to the interaction of cosmetic
formulation components with the human skin, membranes and other tissues or
organs.
The presence of surfactants is crucial for obtaining products with specific
characteristics in the food industry. Some examples are foam or sponge cakes, bread
mayonnaise, salad dressing and ice creams. The surfactants used in these cases are
identical to surfactants present in animal and vegetable systems (mono- and
diglycerides derived from fats and oils, phospholipids, such as lecithin, glycerides with
natural lactic and fruits acids, etc.).
The pharmaceutical industry uses surfactants extensively in spite of the strong
regulatory standards of toxicity, allergenicity and collateral effects. They play an
important role in formulation of solutions, emulsions, dispersions, gel capsules or
tablets with delivery of active ingredients, such as timed-release medications or
transdermal dosage.
The hydrophilic-lipophilic balance (HLB) of a surfactant is a measure of the
degree to which it is hydrophilic or lipophilic, determined by calculating values for the
different regions of the molecule, which ranges from 1 to 20. Its value can be used to
determine final product that it is going to be obtained, as shown in Table 1 :
Table 1. HLB scale used to classify the surfactants
HLB GENERAL APPLICATION
1-3 Antifoaming
3-6 Water-in-oil emulsions
7-9 Dispersants
8-18 Oil-in-water emulsions
13-15 Detergents
15-18 Solubilization
Introduction
8
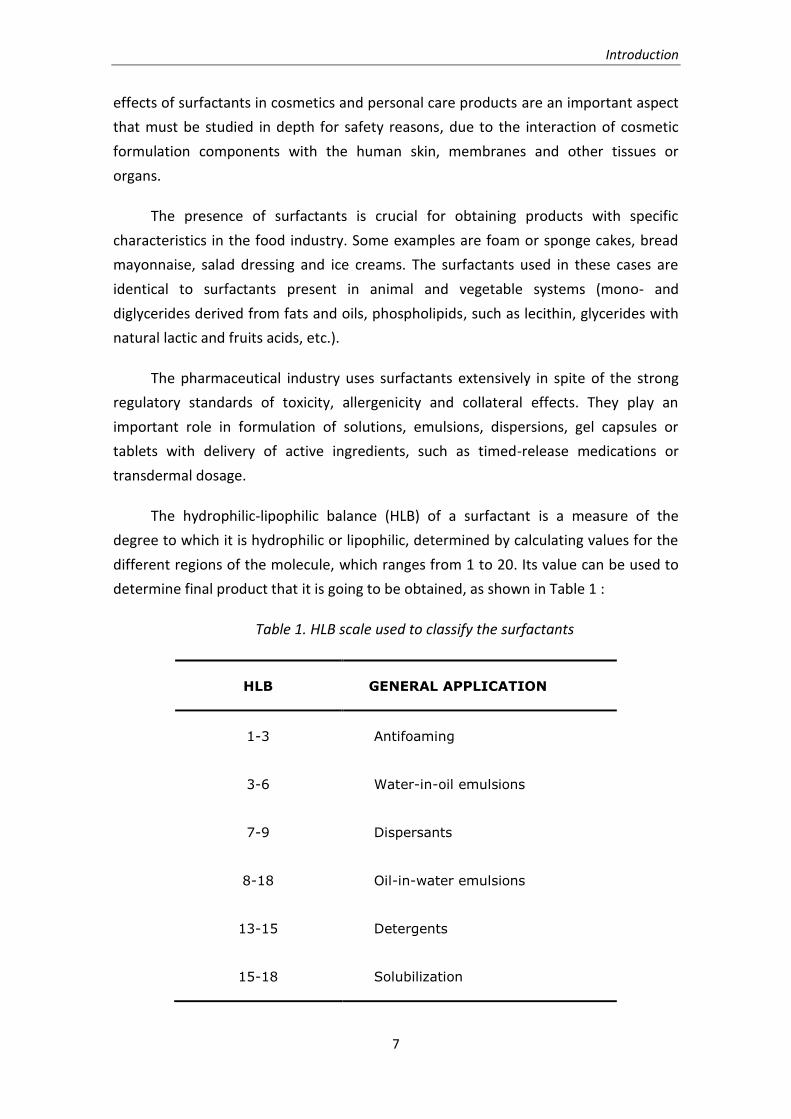
Bancroft's rule suggests that the type of emulsion is dictated by the type of
emulsifier and that it should be soluble in the continuous phase (Bancroft, 1913;
Bancroft, 1915). This empirical observation can be rationalised by considering the
interfacial tension at oil-surfactant and water-surfactant interfaces. Moreover, W/O
emulsions are usually formed when the water volume fraction is low, whereas O/W
emulsions are formed when a small oil volume fraction is dispersed in a large amount
of water. On the other hand, in systems formulated with the same fraction of oil and
water, a bicontinuous emulsion is likely to exist. A theoretical ternary phase diagram of
an emulsion is shown in Fig. 2.
Fig. 2. Theoretical ternary phase diagram of an emulsion. O, oil component, W, water component, S, amphiphilic component (surfactant)
1.2.2. Pickering emulsions
Particle stabilized emulsions, known as Pickering emulsions, were originally
observed independently by Ramsden (Ramsden, 1903) and Pickering (Pickering, 1907).
This type of emulsion show special features due to its high degree of stability.
The use of particles to stabilize emulsions has received substantial and increasing
research interest during the last decades due to their distinctive characteristics and
promising technological applications in a wide range of fields (Binks, 2002; Tcholakova
et al., 2008) including foods.
Increasing O WO
S
1 phase
2 phases
Amphiphilic
Oil
Water
Nonpolargroup
Polar group
Oil
Water
Introduction
9
Properties such as hydrophobicity, shape, particle size can affect the emulsion
stability. The particle contact angle to the interface (droplet surface) is a characteristic
of its hydrophobicity. Particles that are partially hydrophobic (i.e. contact angle of
approximately 90°) are better stabilizers due to their partial dual wettability. This
allows the spontaneous accumulation of particles at the oil-water interface with the
subsequent stabilization against coalescence by volume exclusion and steric
hindrances (Aveyard et al., 2003), i.e. particles prevent oil-water interfaces of oil
droplets from coming in to direct physical contact. Thus, Pickering emulsions are
extremely stable against coalescence and Ostwald ripening compared to systems
stabilized by surfactants.
Reduced use of surfactants via development of surfactant free particle stabilized
emulsions is especially attractive due to their strong regulatory standards of toxicity,
allergenicity, collateral effects and for safety reasons. The possible adverse effects of
surfactants in topical formulations of personal care and cosmetics are due to the
interaction of the components of the formulation with the human skin (i.e. irritation),
membranes and other tissues or organs with which it will come into contact.
A high number of food-grade particles for stabilizing Pickering type emulsions
have been reported in the literature, such as fat crystals, globular proteins and
aggregated hydrocolloids (Dickinson, 2010), insoluble flavonoid particles (Luo et al.,
2011), cellulose-ethyl cellulose complexes for stabilizing emulsions and foams (Murray
et al., 2011), freeze fractured starch granules and protein mixtures (Murray et al. 2011;
Yusoff et al., 2011), and chitin-nano crystals stabilized emulsions (Tzoumaki et al.,
2011).
Starch is one of the most common food ingredients and it has been proved to be
a suitable stabiliser for food grade Pickering emulsions. In previous studies intact
starch granules isolated from Quinoa were modified hydrophobically with Octenyl
Succinic Anhydride (OSA) and used to produce Pickering emulsions with excellent
stability and barrier properties (Timgren et al., 2010; Rayner et al. 2012). They could
be suitable for applications such as encapsulation of sensitive, bioactive, or valuable
ingredients in food and pharmaceutical products with starch particles acting as a
barrier controlling release properties.
1.2.3. High internal phase emulsions (HIPEs)
Another emulsions that play an important role in pharmaceutical, food and
cosmetic applications are the High Internal Phase Emulsions (HIPEs) or gels. This type
of emulsions can be used as a primary step to prepare microcapsules for drug delivery
Introduction
10
systems (Lissant, 1966; Galvin et al., 2001; Muschiolik, 2007; Augustin and Hemar,
2009; Dubensky and Reed, 2010; Pilcer and Amighi, 2010) or as reaction media,
because of their high interfacial area (Solans et al., 2003).
HIPEs contain typically more than 74% (v/v) of oil (internal phase), which
corresponds to the Ostwald critical volume, and 26% (v/v) of external phase filling the
free space between them (Lissant, 1970; Princen, 1979; Princen et al., 1980; Tyrode et
al., 2005; Rondón-González et al., 2006; Rondón-González et al., 2008; Liu and Friberg,
2009). Thus, an appropriate stabilizer selection is crucial to prepare this kind of
emulsions.
The use of HIPEs as carriers offers clear advantages from the transport point of
view, making creams one of the most common drug delivery systems used for topical
application.
HIPEs have been widely investigated in the last years and their preparation
arouses great interest, as some recent studies point out (Princen and Kiss, 1986;
Esquena et al., 2003; Mishchuk et al., 2004; Márquez et al., 2007; Lim et al., 2009;
Matsumoto et al., 2009; Reynolds et al., 2009; Alvarez et al., 2010; Tcholakova et al.,
2011; Campbell et al., 2012). However, although several techniques have been applied,
their drop size has not yet been controlled in a proper and easy way. Monodisperse
emulsions can be obtained with microfluidic devices (Priest et al., 2006), but their
major limitations are the large droplet size obtained and the process scale-up.
1.2.4. Double emulsions
Multiple emulsions are another type of emulsion which was first reported in
1925 by Seifriz (Seifriz, 1924). The simplest multiple emulsions are double emulsions,
ternary systems where the dispersed droplets contain smaller droplets of a different
phase. They have either a water-in-oil-in-water (W1/O/W2) or an oil-in-water-in-oil
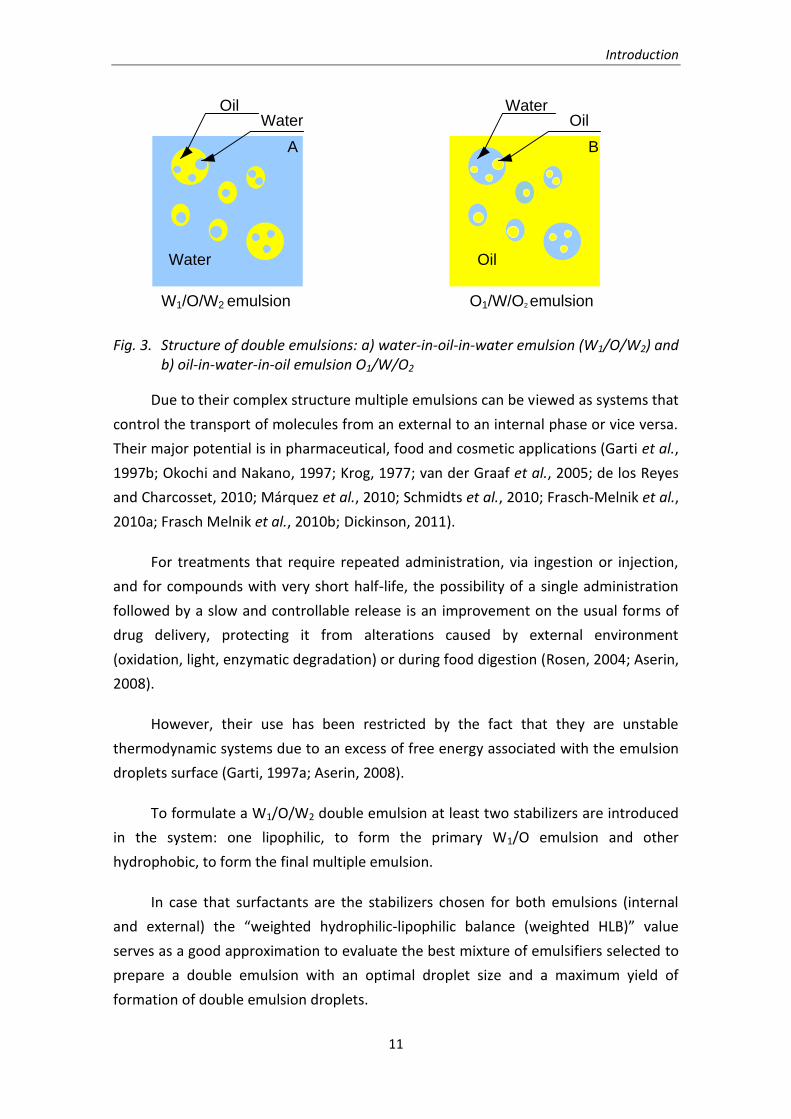
(O1/W/O2) structure (Aserin, 2008), as shown schematically in Fig. 3.
Introduction
11
Fig. 3. Structure of double emulsions: a) water-in-oil-in-water emulsion (W1/O/W2) and b) oil-in-water-in-oil emulsion O1/W/O2
Due to their complex structure multiple emulsions can be viewed as systems that
control the transport of molecules from an external to an internal phase or vice versa.
Their major potential is in pharmaceutical, food and cosmetic applications (Garti et al.,
1997b; Okochi and Nakano, 1997; Krog, 1977; van der Graaf et al., 2005; de los Reyes
and Charcosset, 2010; Márquez et al., 2010; Schmidts et al., 2010; Frasch-Melnik et al.,
2010a; Frasch Melnik et al., 2010b; Dickinson, 2011).
For treatments that require repeated administration, via ingestion or injection,
and for compounds with very short half-life, the possibility of a single administration
followed by a slow and controllable release is an improvement on the usual forms of
drug delivery, protecting it from alterations caused by external environment
(oxidation, light, enzymatic degradation) or during food digestion (Rosen, 2004; Aserin,
2008).
However, their use has been restricted by the fact that they are unstable
thermodynamic systems due to an excess of free energy associated with the emulsion
droplets surface (Garti, 1997a; Aserin, 2008).
To formulate a W1/O/W2 double emulsion at least two stabilizers are introduced
in the system: one lipophilic, to form the primary W1/O emulsion and other
hydrophobic, to form the final multiple emulsion.
In case that surfactants are the stabilizers chosen for both emulsions (internal
and external) the “weighted hydrophilic-lipophilic balance (weighted HLB)” value
serves as a good approximation to evaluate the best mixture of emulsifiers selected to
prepare a double emulsion with an optimal droplet size and a maximum yield of
formation of double emulsion droplets.
Water
OilWater
Oil
WaterOil
W1/O/W2 emulsion O1/W/O2 emulsion
A B
Introduction
12
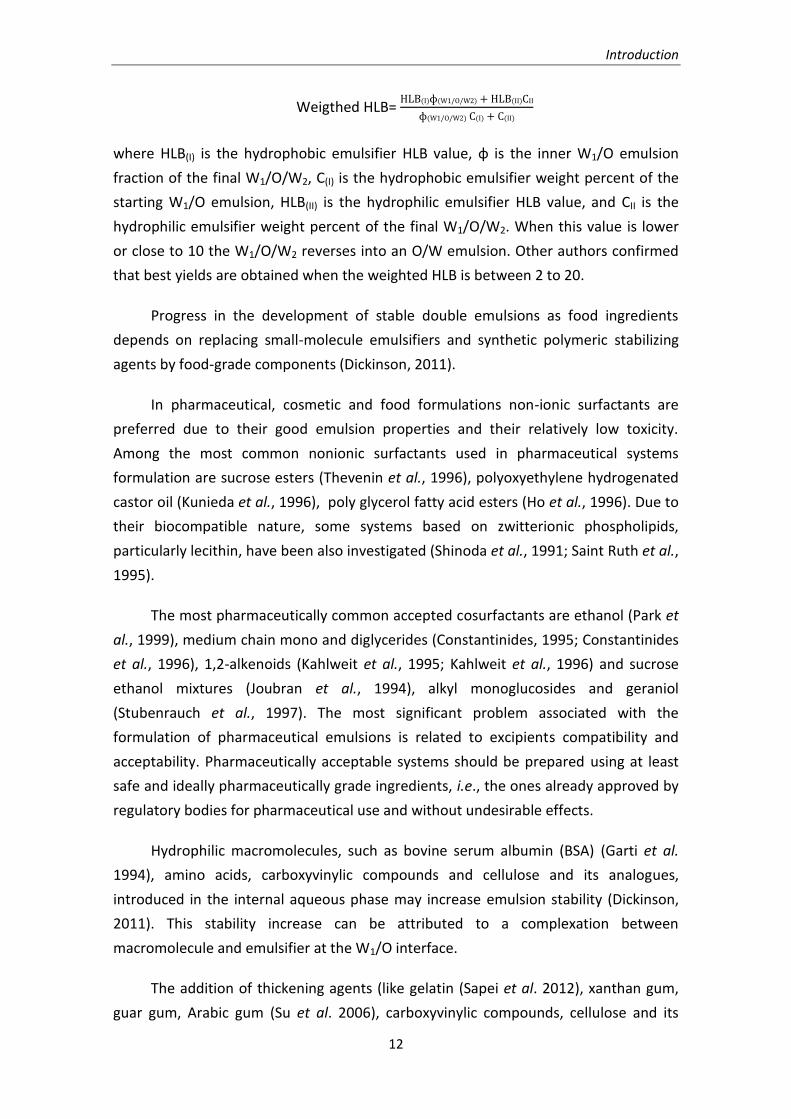
Weigthed HLB=
where HLB(I) is the hydrophobic emulsifier HLB value, ɸ is the inner W1/O emulsion
fraction of the final W1/O/W2, C(I) is the hydrophobic emulsifier weight percent of the
starting W1/O emulsion, HLB(II) is the hydrophilic emulsifier HLB value, and CII is the
hydrophilic emulsifier weight percent of the final W1/O/W2. When this value is lower
or close to 10 the W1/O/W2 reverses into an O/W emulsion. Other authors confirmed
that best yields are obtained when the weighted HLB is between 2 to 20.
Progress in the development of stable double emulsions as food ingredients
depends on replacing small-molecule emulsifiers and synthetic polymeric stabilizing
agents by food-grade components (Dickinson, 2011).
In pharmaceutical, cosmetic and food formulations non-ionic surfactants are
preferred due to their good emulsion properties and their relatively low toxicity.
Among the most common nonionic surfactants used in pharmaceutical systems
formulation are sucrose esters (Thevenin et al., 1996), polyoxyethylene hydrogenated
castor oil (Kunieda et al., 1996), poly glycerol fatty acid esters (Ho et al., 1996). Due to
their biocompatible nature, some systems based on zwitterionic phospholipids,
particularly lecithin, have been also investigated (Shinoda et al., 1991; Saint Ruth et al.,
1995).
The most pharmaceutically common accepted cosurfactants are ethanol (Park et
al., 1999), medium chain mono and diglycerides (Constantinides, 1995; Constantinides
et al., 1996), 1,2-alkenoids (Kahlweit et al., 1995; Kahlweit et al., 1996) and sucrose
ethanol mixtures (Joubran et al., 1994), alkyl monoglucosides and geraniol
(Stubenrauch et al., 1997). The most significant problem associated with the
formulation of pharmaceutical emulsions is related to excipients compatibility and
acceptability. Pharmaceutically acceptable systems should be prepared using at least
safe and ideally pharmaceutically grade ingredients, i.e., the ones already approved by
regulatory bodies for pharmaceutical use and without undesirable effects.
Hydrophilic macromolecules, such as bovine serum albumin (BSA) (Garti et al.
1994), amino acids, carboxyvinylic compounds and cellulose and its analogues,
introduced in the internal aqueous phase may increase emulsion stability (Dickinson,
2011). This stability increase can be attributed to a complexation between
macromolecule and emulsifier at the W1/O interface.
The addition of thickening agents (like gelatin (Sapei et al. 2012), xanthan gum,
guar gum, Arabic gum (Su et al. 2006), carboxyvinylic compounds, cellulose and its
Introduction
13
derivatives) to increase emulsion viscosity and consequently emulsion stability has also
been reported (Dickinson, 2011).
The oil nature has great influence on final emulsions properties, such as viscosity,
density and polarity, which will determine their final applications. The oil phases most
frequently used to form double emulsions are hydrocarbons (i.e. liquid paraffin),
triglycerides (most of them are vegetable oils), and fatty acid esters such as myristate,
isopropyl palmitate and ethyl oleate, and medium-chain trIglicerides. Nowadays,
medium-chain trIglicerides are widely used because they are lighter, which allows
obtaining emulsions with an oily external phase less viscous and greasy (Fanun, 2009).
A common water-in-oil emulsifying agent used in food formulations is
polyglycerol polyricinoleate (PGPR) (Wilson et al, 1998). It has been demonstrated to
be highly effective for stabilizing this type of emulsions (Márquez et al., 2010).
Active species or markers can be included in the internal phase. Typical markers
used are dyes, sugars, fluorescence agents or electrolytes which are most often used
to control the osmotic gradient between both aqueous phases, to increase emulsion
stability (due to salt-out effects) and to monitor the rate of break-down.
1.3. Membrane emulsification
Emulsions must fulfil certain conditions of stability once they are formulated to
keep their functional properties. Therefore, it is very important to study the properties
and phenomena that may lead to destabilization. The problem with most emulsions, as
the ones used in food, pharmaceutical and cosmetic industries, is that the droplets of
the dispersed phase do not have a uniform size, bringing up problems of stability and
loss of functional properties, as well as limitations in their applications. Conventional
manufacturing processes used to produce these emulsions, such as high pressure
homogenizers, rotor-stator systems, colloid mills, ultrasonics and microfluidizers, do
not allow to obtain emulsions with a uniform droplet size. These techniques rely on
the application of a high shear stress that deforms an interface generating
polydisperse droplet size distributions and may damage shear-sensitive molecules,
lead to phase inversion (Groeneweg et al., 1998), and have lower efficiency in terms of
energy density requirements (Vladisavljevic et al., 2005).
Droplet size and droplet size distribution may determine the final properties of
an emulsion. In some applications, such as drug delivery systems, a good control on
droplet size and a narrow distribution are required to ensure a proper activity.
Therefore, it becomes necessary to develop new manufacturing methods.
Introduction
14
Techniques for membrane emulsification (ME) may be classified into two groups
(Suzuki et al., 1996; Kawakatsu et al., 1997): (1) Direct ME, when a dispersed phase is
injected through the membrane into the continuous phase; (2) Premix ME, when a
coarse emulsion is pressed through the membrane to reduce the droplet size.
1.3.1. Direct membrane emulsification
ME was developed for the first time in Japan at the beginning of 1990s and it has
been widely studied for the last two decades. This technique consists of injection of a
dispersed phase through the membrane pores while continuous phase moves over the
membrane surface enhancing droplet detachment. It gives high control on droplet size,
since droplet diameter is in the range of 2-10 times the membrane pore diameter.
Moreover, in ME the strain on liquid phases is reduced, and droplet size can be
narrowly distributed with less shear stress and energy consumption.
Two membrane disposition are mainly used: (i) cross-flow membrane
emulsification with tubular membranes in which dispersed phase is injected from the
outer part of the membrane while continuous phase flows through the membrane
lumen (Abrahamse et al., 2001; De Luca et al., 2008; Timgren et al., 2010), and (ii) flat
membranes where dispersed phase is injected from the bottom side of the membrane
and continuous phase is placed in the upper part (Abrahamse et al., 2002; Aryanti and
Williams, 2009; Pathak, 2011).
Other membrane disposition more recently investigated can be also found in the
literature (Pawlik and Norton, 2012; Vladisavljevic and Williams, 2006; Yuan et al.,
2009) in which rotating and vibrating membranes are used remaining the continuous
phase static, while the membrane is continuously moving enhancing droplet
detachment.
Several factors influence in mean droplet size and droplet size distribution when
using membrane emulsification: emulsion formulation, membrane characteristics,
equipment and operating parameters.
Membranes of several materials have been tested and reported in the literature
Shirasu Porous Glass (SPG) membranes were widely used in production of emulsions
and emulsification chemical reactions (Kukizaki, 2009; Kukizaki and Goto, 2009;
Vladisavljevic et al., 2005; Vladisavljevic et al., 2006ab; Yasuno et al. 2002), other types
of membranes, such as filtration membranes (Williams et al. 1998; Shröder et al.,
1999) or hollow fibre modules (Vladisavljevic et al. 2002) have been used more
recently for this purpose.
Introduction
15
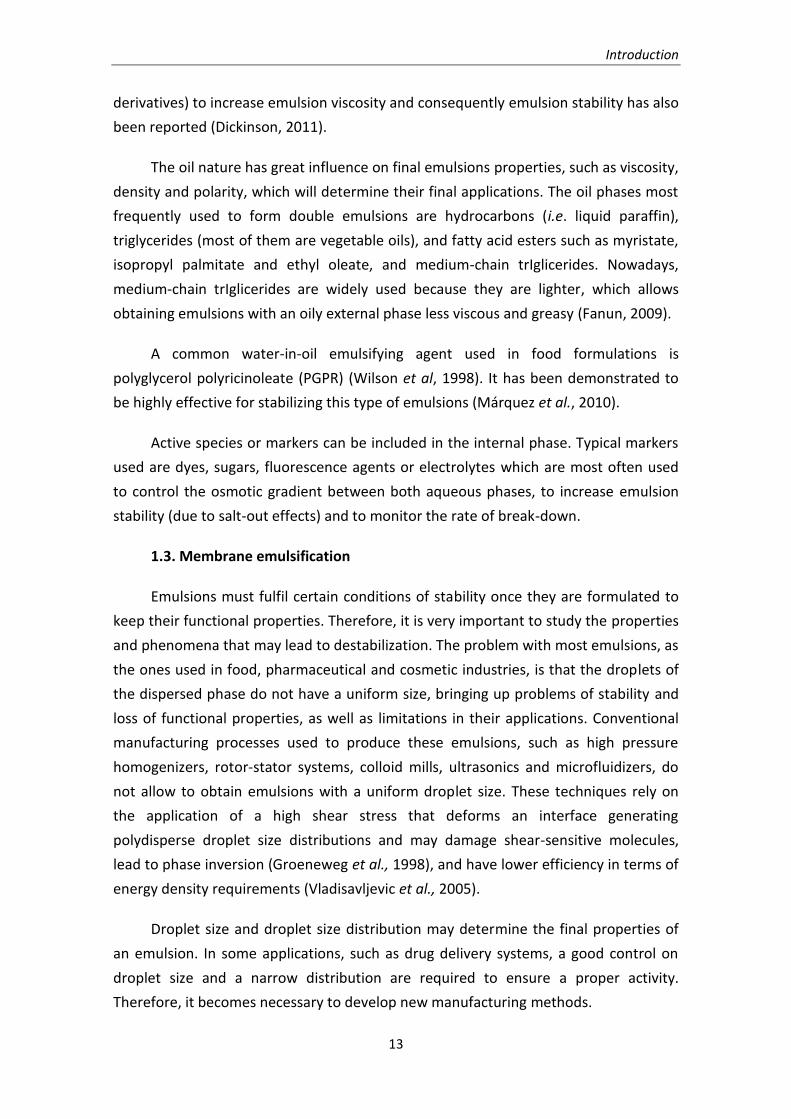
Dispersed phase can be gently dosed by means of a pump or a pressurized
vessel. Droplet detachment usually takes place because of shear acting on membrane
surface, which is often provided by the continuous phase flow, as shown in Fig. 4.
Fig. 4. Schematic diagram of membrane emulsification
Another achievement in ME was the design of silicon microengineered devices to
promote droplet detachment in emulsions preparation. They have a wide variety of
shapes and some of them (straight-through microchannels) have some similarities with
membranes (Kobayashi et al., 2003). Microchannel emulsification is not considered a
membrane emulsification technique because of the different emulsification principle.
However, tailor-made microchannels have been useful in understanding droplet
formation mechanisms in direct membrane emulsification (van der Graaf et al., 2005b;
Eisner, 2007; Steegmans et al., 2009) and in premix emulsification (van der Zwan et al.,
2006).
Several reviews have reported the state-of-the-art of membrane emulsification
(Joscelyne and Trägårdh, 2000; Charcosset et al., 2004; Gijbertsen-Abrahamse et al.,
2004; Lambrich and Schubert, 2005; Vladisavljevic and Williams, 2005; Yuan et al.,
2010; Suárez et al., 2012). Furthermore, specific reviews on multiple emulsions
formation (van der Graaf et al., 2005a), premix membrane emulsification (Nazir et al.,
2011) and spontaneous emulsification (Maan et al., 2011) have been also published.
1.3.1.1. Droplet formation mechanisms
a. Shear-based mechanism
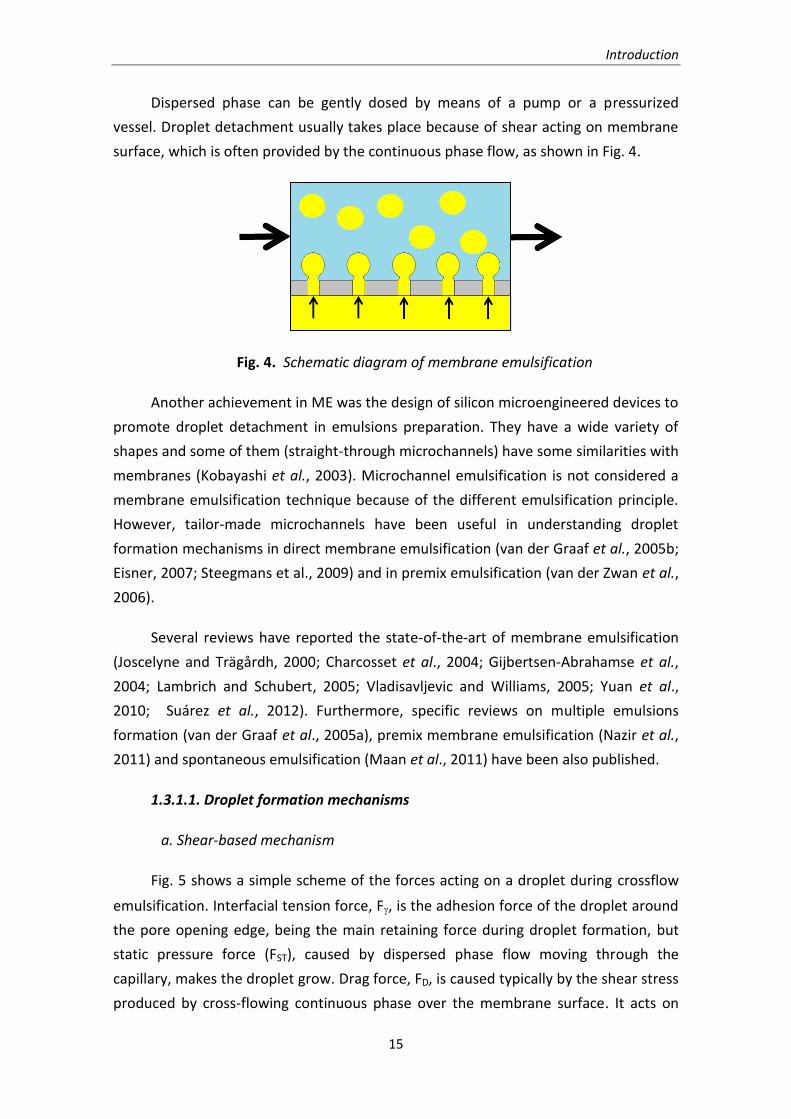
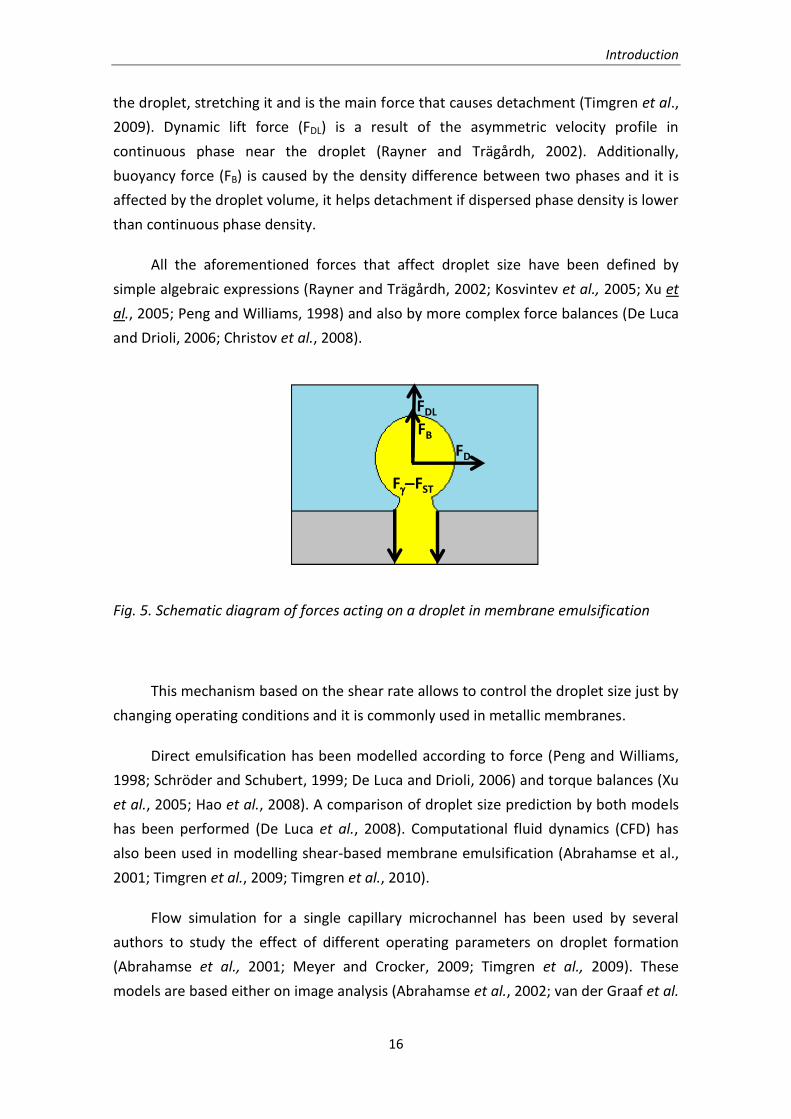
Fig. 5 shows a simple scheme of the forces acting on a droplet during crossflow
emulsification. Interfacial tension force, F, is the adhesion force of the droplet around
the pore opening edge, being the main retaining force during droplet formation, but
static pressure force (FST), caused by dispersed phase flow moving through the
capillary, makes the droplet grow. Drag force, FD, is caused typically by the shear stress
produced by cross-flowing continuous phase over the membrane surface. It acts on
Introduction
16
the droplet, stretching it and is the main force that causes detachment (Timgren et al.,
2009). Dynamic lift force (FDL) is a result of the asymmetric velocity profile in
continuous phase near the droplet (Rayner and Trägårdh, 2002). Additionally,
buoyancy force (FB) is caused by the density difference between two phases and it is
affected by the droplet volume, it helps detachment if dispersed phase density is lower
than continuous phase density.
All the aforementioned forces that affect droplet size have been defined by
simple algebraic expressions (Rayner and Trägårdh, 2002; Kosvintev et al., 2005; Xu et
al., 2005; Peng and Williams, 1998) and also by more complex force balances (De Luca
and Drioli, 2006; Christov et al., 2008).
Fig. 5. Schematic diagram of forces acting on a droplet in membrane emulsification
This mechanism based on the shear rate allows to control the droplet size just by
changing operating conditions and it is commonly used in metallic membranes.
Direct emulsification has been modelled according to force (Peng and Williams,
1998; Schröder and Schubert, 1999; De Luca and Drioli, 2006) and torque balances (Xu
et al., 2005; Hao et al., 2008). A comparison of droplet size prediction by both models
has been performed (De Luca et al., 2008). Computational fluid dynamics (CFD) has
also been used in modelling shear-based membrane emulsification (Abrahamse et al.,
2001; Timgren et al., 2009; Timgren et al., 2010).
Flow simulation for a single capillary microchannel has been used by several
authors to study the effect of different operating parameters on droplet formation
(Abrahamse et al., 2001; Meyer and Crocker, 2009; Timgren et al., 2009). These
models are based either on image analysis (Abrahamse et al., 2002; van der Graaf et al.
F-FST
FDL
FB
FD
Introduction
17
2005; Meyer and Crocker, 2009) or simulations (Timgren et al., 2009; Pathak, 2011).
Devices in which shear is produced by membrane movement have been also modelled
by force balances (Aryanti et al., 2009; Holdich et al., 2010).
b. Spontaneous emulsification
Sugiura (Sugiura et al., 2002) found that droplets could be spontaneously formed
in microchannels. Moreover, when ME process with SPG membranes was optically
monitored (Christov et al., 2002; Yasuno et al., 2002) it was observed that small
droplets were formed under certain conditions, even in absence of shear. These results
showed that droplet formation mechanism might be different than expected; this
effect is mainly found in systems with slotted or tortuous pores (Kobayashi et al.,
2004).
It has been suggested that spontaneous emulsification is a result of surface free
energy minimization. When dispersed phase flows through a tortuous pore or an
oblong slot, the deformation makes the flow energetically non-favourable, so that
itsplits in droplets in order to minimize the surface free energy (Christov et al., 2002;
Sugiura at al., 2002; Kobayashi et al., 2004; Kukizaki, 2009).
Emulsions prepared by this mechanism are extremely monodisperse, with span
factors of 0.3-0.4 (Vladisavlejvic et al., 2005). Spontaneous emulsification has been
also reported in experiments in which droplet size is smaller than the predicted value
by the force or torque balance models or even when no conversion is reached in
theoretical dynamic balances (Hao et al., 2008). Spontaneous mechanism can be
coupled with shear-based in the same membrane, resulting in larger droplets (Christov
et al., 2002).
Emulsification membrane under shear and non-shear conditions (Kukizaki and
Goto, 2009) has been studied using SPG membranes. It was observed that
monodisperse emulsions were obtained without shear. This might be related to the
mass transfer of surfactant to the droplet, as it has been demonstrated in models
based on mass transfer (Rayner et al., 2004; Rayner et al., 2005). Spontaneous
emulsification has been modelled using the force balance (Danov et al., 2007; Christov
et al., 2008).
1.3.2. Premix emulsification
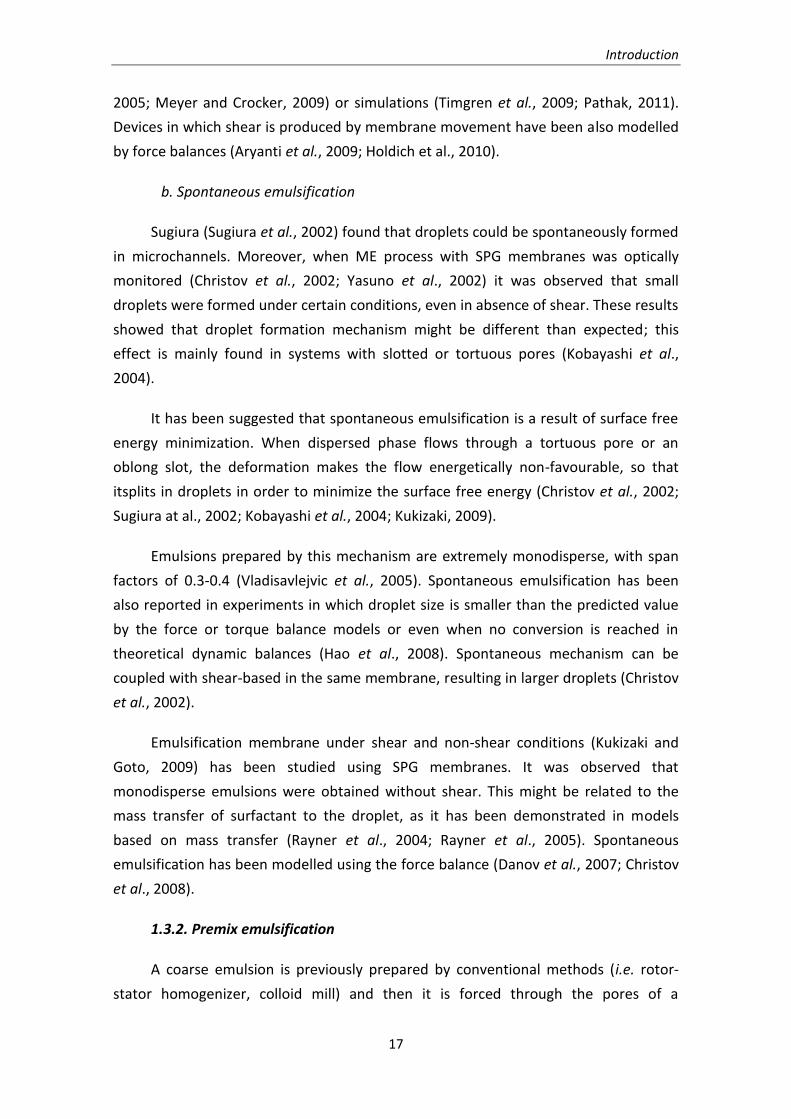
A coarse emulsion is previously prepared by conventional methods (i.e. rotor-
stator homogenizer, colloid mill) and then it is forced through the pores of a
Introduction
18
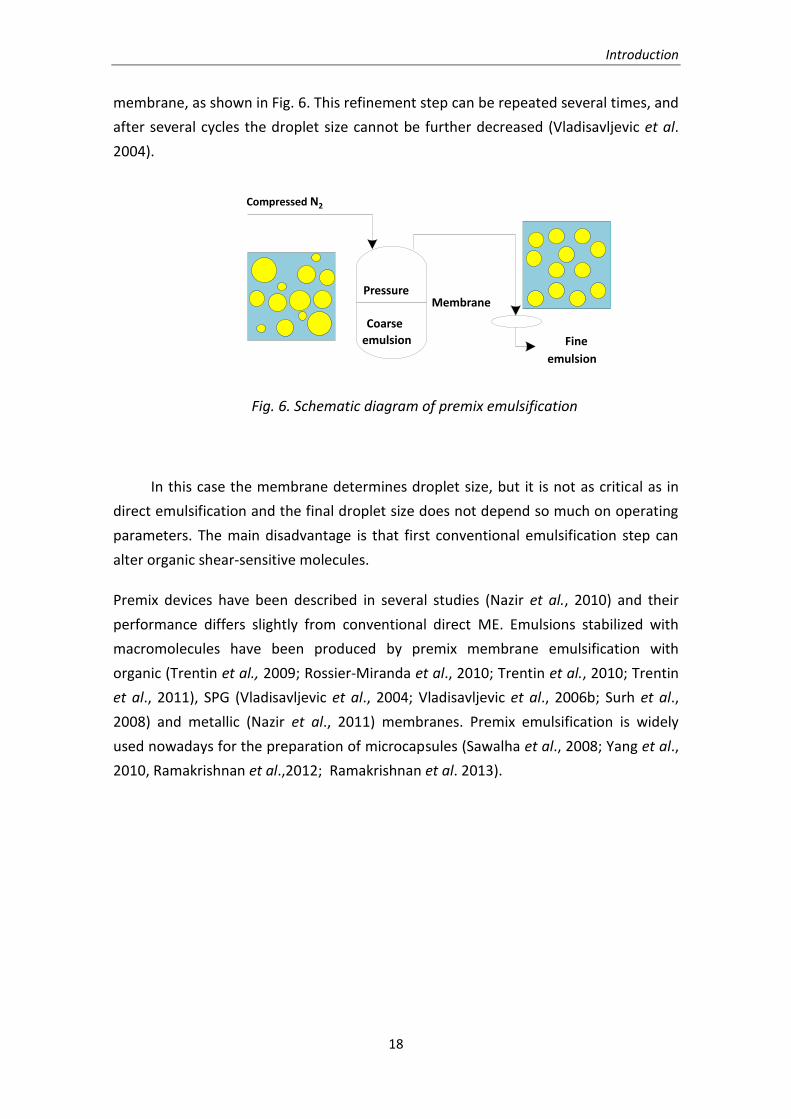
membrane, as shown in Fig. 6. This refinement step can be repeated several times, and
after several cycles the droplet size cannot be further decreased (Vladisavljevic et al.
2004).
Fig. 6. Schematic diagram of premix emulsification
In this case the membrane determines droplet size, but it is not as critical as in
direct emulsification and the final droplet size does not depend so much on operating
parameters. The main disadvantage is that first conventional emulsification step can
alter organic shear-sensitive molecules.
Premix devices have been described in several studies (Nazir et al., 2010) and their
performance differs slightly from conventional direct ME. Emulsions stabilized with
macromolecules have been produced by premix membrane emulsification with
organic (Trentin et al., 2009; Rossier-Miranda et al., 2010; Trentin et al., 2010; Trentin
et al., 2011), SPG (Vladisavljevic et al., 2004; Vladisavljevic et al., 2006b; Surh et al.,
2008) and metallic (Nazir et al., 2011) membranes. Premix emulsification is widely
used nowadays for the preparation of microcapsules (Sawalha et al., 2008; Yang et al.,
2010, Ramakrishnan et al.,2012; Ramakrishnan et al. 2013).
Fine
emulsion
Membrane
Coarse
emulsion
Pressure
Compressed N2

OBJECTIVES
Objectives
20
In this work, membrane emulsification, mechanical agitation and vacuum
evaporation have been used individually or in combined form to prepare simple and
double emulsions containing bioactive compounds (i.e. lutein and resveratrol). The
following specific objectives have been pursued:
Preparation of oil-in-water (O/W) emulsions by membrane emulsification (ME)
using common ceramic microfiltration (MF) membranes. Influence of operation
parameters on droplet size distribution, determination of droplet formation
mechanism and optimal operation conditions.
Preparation of double Pickering emulsions stabilized by starch granules isolated
from Quinoa and modified with octenyl succinic acid (OSA). Study of the
encapsulation stability and the effect of lipophilic emulsifier content and salt
concentration in the inner aqueous phase.
Formulation of food-grade water-in-oil-in-water (W1/O/W2) double emulsions to
encapsulate trans-resveratrol, and preparation by mechanical agitation and
membrane emulsification (ME).
Formulation and preparation of emulsions with high proportion of internal
phase, containing lutein (a lipophilic antioxidant), combining mechanical
agitation or ME with vacuum evaporation.

RESULTS
Results
22
I. Emulsification with microfiltration ceramic membranes: a different approach to droplet formation mechanism
Because of the high cost of some membranes used in membrane emulsification processes, such as Shirasou Porous Glass (SPG), the possibility of using microfiltration ceramic membranes was considered. The main disadvantage of this type of membranes is that the pore size distribution is not so well controlled. Membrane emulsification was carried out using flat membranes in a 1 liter stirred tank. Subsequently, experiments were performed at larger scale (5 liters) using tubular membranes in a continuous system. Furthermore, the droplet formation mechanism was observed in both systems and the obtained results were compared.
Article 1. M. Matos, M.A. Suárez, G. Gutiérrez, J. Coca and C. Pazos. “Emulsification with microfiltration ceramic membranes: a different approach to droplet formation mechanism”.
Journal of Membrane Science 444 (2013) 345-‐358.
Personal contribution to work
This work was undertaken with Dr. Miguel Ángel Suárez. Information was gathered regarding the state of the art and the droplet formation mechanisms reported in the literature. I also conducted flat ceramic membranes experiments, wrote most of the manuscript and drew the figures.
Resultados
23
I. Emulsificación con membranas cerámicas de microfiltración: una visión diferente del mecanismo de formación de gota
El elevado coste de las membranas más comúnmente utilizadas en procesos de emulsificación, caso de las membranas Shirasou Porous Glass (SPG), nos hizo plantearnos la posibilidad de utilizar membranas cerámicas de microfiltración con el mismo propósito. La principal desventaja de este tipo de membranas es que su distribución de tamaños de poro no es tan estrecha. Para ello, programamos diversos experimentos, empleando membranas planas en un tanque agitado de 1 litro de capacidad. A continuación, realizamos experimentos a mayor escala (5 litros) empleando membranas tubulares en un sistema que operaba en continuo. Adicionalmente, estudiamos el mecanismo de formación de gota en ambos dispositivos y comparamos los resultados obtenidos.
Artículo 1. M. Matos, M.A. Suárez, G. Gutiérrez, J. Coca y C. Pazos. “Emulsification with microfiltration ceramic membranes: a different approach to droplet formation mechanism”.
Journal of Membrane Science 444 (2013) 345-‐358.
Aportación personal al trabajo
Durante su desarrollo, compartí con mi compañero Miguel Ángel Suárez la tarea de recopilar la información acerca del estado del arte y sobre los diferentes mecanismos de formación de gota descritos en la bibliografía. Asimismo, llevé a cabo los experimentos realizados con membranas cerámicas planas, redacté la mayor parte del manuscrito y elaboré las figuras que lo acompañan.
Results
24
Emulsification with microfiltration ceramic membranes: A differentapproach to droplet formation mechanism
M. Matos, M.A. Suárez, G. Gutiérrez, J. Coca, C. Pazos n
Department of Chemical and Environmental Engineering, University of Oviedo, C/Julián Clavería 8, 33006 Oviedo, Spain
a r t i c l e i n f o
Article history:Received 1 April 2013Received in revised form17 May 2013Accepted 18 May 2013Available online 27 May 2013
Keywords:Membrane emulsificationMicrofiltration ceramic membranesSpontaneous emulsificationMembrane pore activation
a b s t r a c t
Oil-in-water (O/W) emulsions were prepared by membrane emulsification (ME) in a large scale stirredtank with a submerged cell using flat membranes, and in a cross-flow tubular unit. Results obtained withflat and tubular membranes devices were compared. Common ceramic microfiltration (MF) membranes(ZrO2 supported on TiO2) were used in both cases. The main advantage of these membranes is their lowcost compared to others frequently used in ME (SPG membranes), which implies a reduction up to 60%.The effect of operation parameters on droplet size distributions was studied to understand the dropletformation mechanism that takes place in both devices.
Monodisperse O/W emulsions were obtained using flat membranes with a droplet-to-pore diameterratio (Dd/Dp) in the range 2.1–2.9. Span values of 0.58, 0.66 and 0.81 corresponded to membrane porediameters of 0.45, 0.80, and 1.4 μm, respectively, being the active pores fraction in the range of 27–36%.The cross-flow tubular unit allowed for production of monodisperse O/W emulsions but with largerdroplet sizes, having droplet-to-pore diameter ratios (Dd/Dp) in the range 3.9–4.7. It was observed a majorinfluence of pore activation by dispersed phase pressure on droplet size distribution.
Shear stress had little influence on the droplet size, with both flat and tubular membranes. Thissuggested that droplet formation mechanism was not shear stress-based. A spontaneous emulsificationmechanism was proposed.
& 2013 Elsevier B.V. All rights reserved.
1. Introduction
Producing emulsions by dispersion of a liquid into anotherimmiscible liquid is an area of interest in pharmaceutical, chemical,cosmetic and food industries. Current industrial emulsificationprocesses, such as high pressure homogenizers, rotor stator devices(e.g., colloid mills), and static mixers techniques, can produce smalldroplets but with a high strain on the liquids, causing activity loss incompounds. Furthermore, droplet size is difficult to control and,therefore, usually polydisperse emulsions are obtained. In mem-brane emulsification (ME) the strain on the liquid phases is reduced,and droplet size can be narrowly distributed with less shear stressand energy consumption [1–6]. Although ME is technically simplerand needs less surfactant, the production of highly monodisperseemulsions requires the use of membranes with well-controlled poresize distribution [7].
Techniques for ME may be classified into two groups [8,9]:(1) Direct ME: The dispersed phase is injected through the mem-brane into the continuous phase; (2) Premix ME: A coarse emulsionis pressed through the membrane to reduce the droplet size.
Membranes frequently used in ME processes have been man-ufactured specifically for this purpose, such as, Shirasu Porous
Glass (SPG) membranes, which have a narrow pore size distribu-tion [10–12]. The most common processes involve cross-flowsystems where the shear stress required for the droplet detach-ment is induced by the continuous phase flow, although rotatingdevices can also be used [13].
There have been several studies using tubular, microporousmembranes made of SPG, α-Al2O3 or ZrO2 [2,3,14–21]. Some ofthem used asymmetric, tubular-ME membranes [2,3,14,19–21],which are more cost-effective and easier available than the SPGmembranes. In these studies, the performance of ME was inves-tigated with changes in the operation and composition parameters[2,3,14–21]. Several studies about the potential ME applications inproducing high-value products were also performed [22–28].
Flat ceramic membranes have been used for ME with cross-flow systems [29–31]. In commercial cells with flat-disc metallicmembranes, the shear stress required for the droplet detachmentwas provided by a simple paddle-impeller that was rotating overthe membrane [1,32–35].
The effect of ME process parameters on droplet formation hasbeen evaluated by relating them to the forces acting on the system[6,16,32,36,37]. Several mathematical models have been devel-oped to explain ME performance. The simplest ones were basedeither on a force balance [6,14,16,20,32,38] or a torque balance[16,36,37]. More complex models were also developed by usingthe Navier–Stokes equation and computational fluid dynamics[38–40], while others were based on dynamic diffusion [41,42].
Contents lists available at SciVerse ScienceDirect
journal homepage: www.elsevier.com/locate/memsci
Journal of Membrane Science
0376-7388/$ - see front matter & 2013 Elsevier B.V. All rights reserved.http://dx.doi.org/10.1016/j.memsci.2013.05.033
n Corresponding author. Tel.: +34 985103509; fax: +34 985103434.E-mail address: [email protected] (C. Pazos).
Journal of Membrane Science 444 (2013) 345–358
Results
25
In this work, we investigated the performance of commerciallyavailable microfiltration (MF) flat-disc ceramic membranes in atailor-made emulsification cell. Several membrane pore diameterswere selected for batch emulsification in a high-capacity stirred tank.
The effect of operation parameters such as impeller rotationalspeed, transmembrane pressure, continuous phase viscosity andgeometric parameters on droplet size distribution was studied todetermine the optimal operation conditions. The stability of theemulsions obtained by the ME and conventional agitation wasmonitored and compared.
Experimental results were compared with predicted values bya droplet size estimation model and with the force balance, tounderstand the emulsification performance and droplet formationmechanism. Experiments were also carried out using a cross-flowemulsification equipment with the MF tubular ceramic mem-branes at the same pore diameter, to understand the actualmechanism of the droplet formation in the process.
One advantage of MF membranes for ME is their low costcompared to SPG membranes. The cost of these membranes isaround 0.17 €/cm2 while the estimated cost for conventional MFmembranes is around 0.07 €/cm2, roughly a reduction of 60%.
2. Theoretical background
2.1. Pressure and dispersed phase flux
In order to produce droplets, the pressure on the dispersedphase should overcome the interfacial tension to permeatethrough the membrane pores [43]. The minimum value requiredis the critical pressure (Pc) and may be expressed by
Pc ¼4γ cos θ
Dpð1Þ
where γ is the interfacial tension, θ is the contact angle betweenthe dispersed phase and the membrane surface and Dp is thenominal membrane pore diameter. The driving force for dispersedphase flow through the pores is the transmembrane pressure (ΔP):
ΔP ¼ Pd−P0 ð2Þwhere Pd and P0 are the pressures at the dispersed phase side andat the continuous phase side, respectively. For a flat membranemodule P0 is the pressure on the membrane surface.
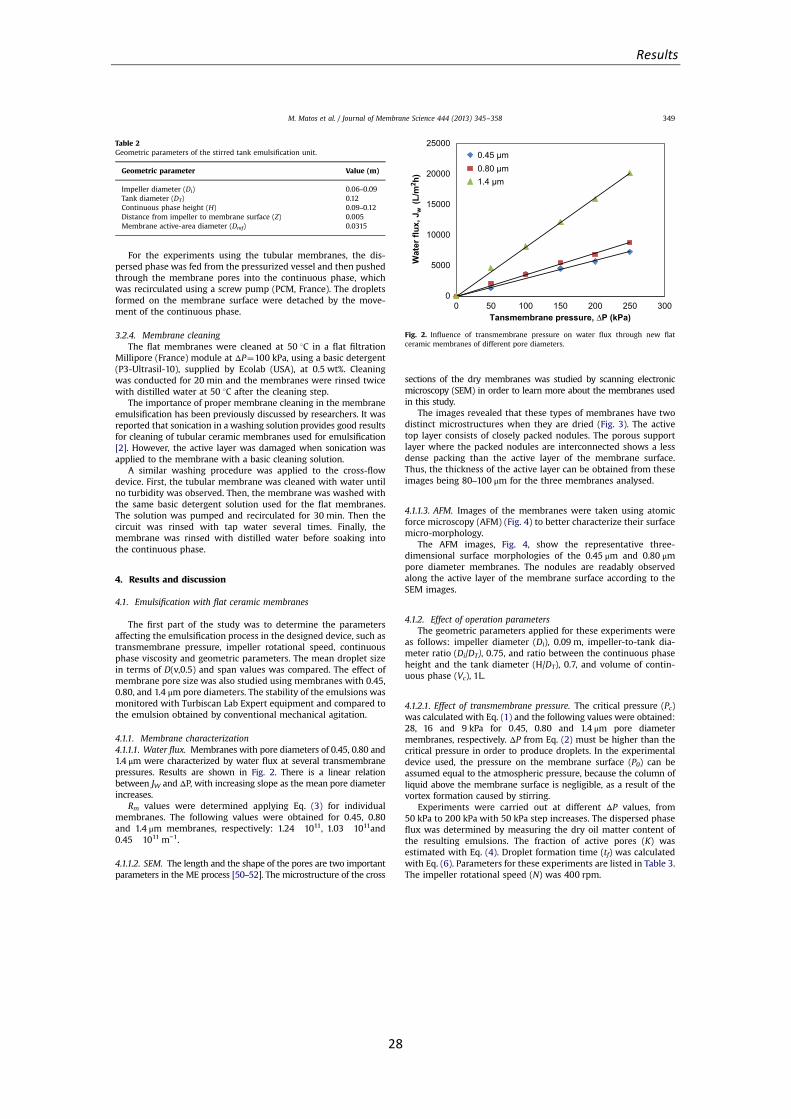
It is desirable to have a higher flux rate of dispersed phase forthe industrial-scale emulsion production using membranes [15,44].The dispersed phase flux (Jd) increases as the mean pore diameterand/or the transmembrane pressure (ΔP) increases [2,3,12]. Theflux, Jd, is given as a function of ΔP by Darcy´s law [14]:
Jd ¼ΔPμdRm
ð3Þ
where μd is the viscosity of the dispersed phase (Pa s) and Rm is theintrinsic membrane resistance (m−1). It may be experimentallydetermined by measuring pure water flux at different ΔP valuessince the resistance depends only on membrane characteristics,such as pore size, porosity and tortuosity.
2.2. Fraction of membrane active pores
Droplets are produced by only a fraction of membrane pores inthe emulsification process using ceramic and SPG membranes. Thefraction of active pores determines the flow in every pore and thusthe dispersed phase velocity.
There have been several mathematical models for estimating thefraction of active pores (K), most of them based on dispersed phaseflux data. Vladisavljevic and Schubert developed a simple model
correlating the fraction of active pores (K) with the membranehydraulic resistance (Rm) and the dispersed phase flux (Jd):
K ¼ JdμdRm
ΔPð4Þ
where μd is the viscosity of the dispersed phase [18].A similar model was proposed by Lepercq et al. [21] in their
study of the droplet coalescence on ceramic membranes. Flowthrough the membrane is explained in terms of flow through apacked bed using the Carman–Kozeny equation [21]. This model,however, uses a theoretical parameter that does not take intoaccount certain membrane characteristics (e.g., tortuosity) that arerelated to the hydraulic resistance.
Coalescence of droplets is an undesirable phenomenon in theemersion process. It takes place on the surface of a ceramicmembrane when two droplets are formed very close to each other.The fraction of active pores should be kept below a maximum valueto avoid coalescence. Vladisavljevic and Schubert proposed anequation to estimate this maximum fraction [18]. Assuming thatthe active pores were in a square-array on the membrane surfaceand that there is no coalescence at the membrane pore openings,the maximum fraction value (Kmax) can be expressed as
Kmax ¼π
4ε
� � Dd
Dp
� �−2
ð5Þ
where Dd is the droplet diameter, Dp is the pore diameter and ε isthe membrane porosity.
Droplet formation time (tf) can be calculated with the ratio ofthe droplet volume (Vd) and the volumetric flow rate through asingle pore (Qdp). This can then be rearranged as shown in thefollowing equation:
tf ¼Vd
Qdp¼
π6D
3d
π4D
2p
JdεK
¼ 2εKD3d
3D2pJd
ð6Þ
where K is the fraction of active pores. The droplet formation timeis also affected by the dynamic interfacial tension, and therefore,the type of the emulsifier [14,43].
2.3. Shear stress
For an emulsification cell in a stirred tank, droplet detachmentis caused by the shear stress. The phenomenon can be modelledwell by conventional hydrodynamics [1,32–35]. A liquid moving ina stirred tank may be in a regime of either free or forced vortex[45]. The free vortex regime is influenced by the tank walls. Shearstress decreases in proximity to the wall. The forced vortex regimedevelops around the rotation axis and, there, the liquid moves as arigid body. The distance of the boundary between the two regionsfrom the axis is called the critical radius (rc). The shear stressexpression for the each region can be expressed by Eqs. (7) and (8),in the forced and free vortex regions, respectively [32]:
τ¼ 0:825ð2πÞ1:5ρ0:5c μ0:5c N1:5r ð7Þ
τ¼ 0:825ð2πÞ1:5ρ0:5c μ0:5c N1:5r1:6c r0:6 ð8Þ
where ρc and μc are the density and viscosity of the continuousphase, respectively, N is the impeller rotational speed and r thedistance to the rotation axis. These equations may be applied ifdroplet diameter is smaller than the boundary layer thickness. It isa modification of Nagata's model [45] using a correction factor of0.825 based on experimental data obtained with an impeller-to-tank diameter ratio of 0.8 [46].
These expressions for the shear stress differ from the one fortubular membranes (τ), which is based on the pressure drop due to
M. Matos et al. / Journal of Membrane Science 444 (2013) 345–358346
Results
26
the continuous phase flow (ΔP0):
τ¼ ΔP0Dm
4Lmð9Þ
Furthermore, the shear stress depends on membrane para-meters such as the length (Lm) and the internal diameter (Dm).
2.4. Force balance
Modelling droplet formation in membrane emulsification hasbeen specifically undertaken, and the importance of process para-meters in each case has been reported. Intensive work includingnumerical approaches has been performed for a better under-standing of membrane emulsification mechanisms and to predictmembrane performance. Although several models based on forcebalance have been reported, it is not clear how well they fit the data[6,16,38,43]. Most of these models have been developed for tubularmembranes operating in cross-flow. To have a better understandingof the forces involved in the process, all forces involved in dropletformation at the membrane surface during the membrane emulsi-fication are listed in Table 1 [16,36,37,43,47].
The drag force, FD, is caused by the cross-flowing continuousphase over the membrane surface. It is usually defined by the Stokesequation (Eq. (10)) because droplet formation is assumed to takeplace within the laminar sub-layer [16]. Depending on the model,this force is expressed either as a function of the velocity or shearstress. In both cases, the wall correction factor kx is a key parameterfor determining the magnitude of the force [48]. The configuration ofthe system (tubular or flat) also influences the shear stress.
The interfacial tension force, Fγ, is the adhesion force of thedroplet around the edge of the pore opening, being the mainretaining force during droplet formation. It depends on interfacialtension (γ) and pore diameter (Dp), as Eq. (11) indicates.
The static pressure difference force, FST, corresponds to thepressure difference between the drop and the surrounding con-tinuous phase at the membrane surface. It is determined by theinterfacial tension, pore diameter and the ratio of the diameter ofthe neck, which connects the droplet and the pore, and the dropletdiameter. However, this neck diameter is often assumed to beequal to the pore diameter [36] as shown in Eq. (12).
The dynamic lift force, FDL, results from the asymmetric velocityprofile of the continuous phase near the droplet. It depends onshear stress and droplet size (Eq. (13)).
The buoyancy force, FB, is caused by the density differencebetween the two phases and it is affected by the droplet volume(Eq. (14)).
The last force listed in Table 1 is the inertial force, which isassociated with a mass of the fluid flowing out from the opening ofthe pore (Eq. (15)).
The relative magnitude of the forces involved in the process[41,43] changes as the droplet size increases. The size of thedroplet grows until the detachment forces (FST, FDL, FB and FD)exceed the retaining forces. Peng and Williams [16] found that
their model of the torque balance among drag, buoyancy andinterfacial tension forces fit well for the cross-flow velocity in therange 0.1–0.4 m/s. In their work with droplets formed with a0.45 μm diameter capillary, they reported that buoyancy effectsbecome more important at the droplet size scale of 200 μm.However, for the smallest droplets in the micron scale, the inertialand buoyancy forces are of 9 and 6 orders of magnitude smallerthan the drag and interfacial tension forces, respectively [6,47].
A force balance model taking into account only interfacialtension and drag forces has been proposed by Kosvintsev et al.,for flat metallic membranes in a commercial stirred tank emulsi-fication unit with a simple paddle impeller. The droplet diameteris given by [30]
Dd ¼13τ
ffiffiffiffiffiffiffiffiffiffiffiffiffiffiffiffiffiffiffiffiffiffiffiffiffiffiffiffiffiffiffiffiffiffiffiffiffiffiffiffiffiffiffiffiffiffiffiffiffiffiffiffiffiffiffiffiffiffiffiffiffiffiffiffi92τ2D2
p þ 2
ffiffiffiffiffiffiffiffiffiffiffiffiffiffiffiffiffiffiffiffiffiffiffiffiffiffiffiffiffiffiffiffiffiffiffiffiffiffi8116
τ4D4p þ ðγτDpÞ2
rsð16Þ
In this force balance, the shear stress corresponds to the shearstress produced by the continuous phase flowing on the mem-brane surface given by Eqs. (7) and (8).
3. Experimental
3.1. Materials
Emulsions were prepared with a food-grade extra virgin oliveoil (μd¼51 mPa s, ρd¼886 kg/m³, refractive index¼1.4677, at 25 1C,and an acid value lower than 0.8) as dispersed phase. The non-ionic surfactant added to the continuous aqueous phase wasTweens 20 at 2% (w/v) along with a viscosity modifier, mediumviscosity sodium carboxymethylcellulose with polymerizationdegree 1100 (CMCNa), at 0.01–1.0% (w/v), both supplied by SigmaAldrich (USA).
Commercially available, ceramic MF membranes (Tami Indus-tries, France) at pore diameters of 0.45, 0.80 and 1.4 μmwere used.The membrane active layer consists of microporous zirconia (ZrO2)supported on titania (TiO2). The flat-disc membranes (InsideDisRamTM) have dimensions of 47 mm diameter and thickness of2.5 mm, with a diameter of 31.5 mm for the effective area. Tubularmembranes (Inside CéRamTM) have a 10 mm external diameter,with a length of 20 mm for the effective area and a thickness of2 mm. Both types of membranes were supplied from TAMIIndustries (France).
3.2. Methods
3.2.1. Emulsion characterizationDroplet size distributions were determined by laser light
scattering with a long bench Mastersizer S (Malvern instrumentsLtd., UK). Three replicates were obtained for each emulsion andresults were reported as the typical droplet size distribution inmicrons. The width of the droplet size distribution is expressed interms of the span, defined according to the following equation:
span¼ Dðv;0:9Þ−Dðv;0:1ÞDðv;0:5Þ ð17Þ
where D(v,0.5), D(v,0.1) and D(v,0.9) are standard percentile readingsfrom the analysis. D(v,0.5) is the size in microns at which 50% of thesample is smaller and 50% is larger. D(v,0.1) and D(v,0.9) are the sizeof the droplets below 10% and 90%, respectively, of the sample lies.
The emulsion stability was determined with a Turbiscan Lab Expert(Formulaction Co., France) by the static, multiple light scattering (MLS),which consists of sending a light beam through a cylindrical glass cellcontaining the sample. Emulsions were placed, without dilution, in thetest cells and the transmitted and backscattered lights were monitoredas a function of time and cell height for 2 days at 30 1C. The profiles
Table 1Forces acting on a droplet during membrane emul-sification process.
Force Expression
Drag FD ¼ 32 πk�D
2dτ ð10Þ
Interfacial tension Fγ ¼ πγDP ð11ÞStatic pressure FST ¼ πγ D2
PDd
ð12ÞDynamic lift FDL ¼ 0:761 τ1:5D3
dρ0:5c
μcð13Þ
Buoyancy FB ¼ π6ΔρgD
3d ð14Þ
Inertial FI ¼ π4 ρdv
2dD
2p ð15Þ
M. Matos et al. / Journal of Membrane Science 444 (2013) 345–358 347
Results
27
obtained build up a macroscopic fingerprint of the sample at agiven time.
The viscosity of the continuous phase was measured by anUbbelohde type viscometer PSL-Rheotek (Poulten Selfe & Lee Ltd.,UK) at 25 1C.
The flow rate of the dispersed phase was determined bymeasuring the dry oil matter of the emulsion. Emulsion sampleswere collected at known time ranges. Samples were placed inporcelain cells, pre-dried at 110 1C and cooled under vacuum toavoid adsorbing moisture. The cells were weighed before and afterplacing the sample and they were immediately placed in an ovenat 110 1C for 24 h. The cells were again weighed and the dry oilmatter content in the emulsion was determined. Each sample wasmeasured a minimum of three times.
3.2.2. Membrane characterizationThe intrinsic resistance of the membrane was determined by
measuring the flux of deionized water through it at varioustransmembrane pressures.
The scanning electron microscopy (SEM) of the membrane crosssections was performed using a MEB JEOL-6100 microscope (Japan).
The Atomic Force Microscopy (AFM) was performed using Nano-Tec Cervantes System (Nanotec Electrónica S.L., Spain), which wasoperated in the dynamic mode using Olympus OMCL-RC800PSASilicon Nitride (Si3N4) point probes (k¼0.76 N/m, ω0¼76 kHz).
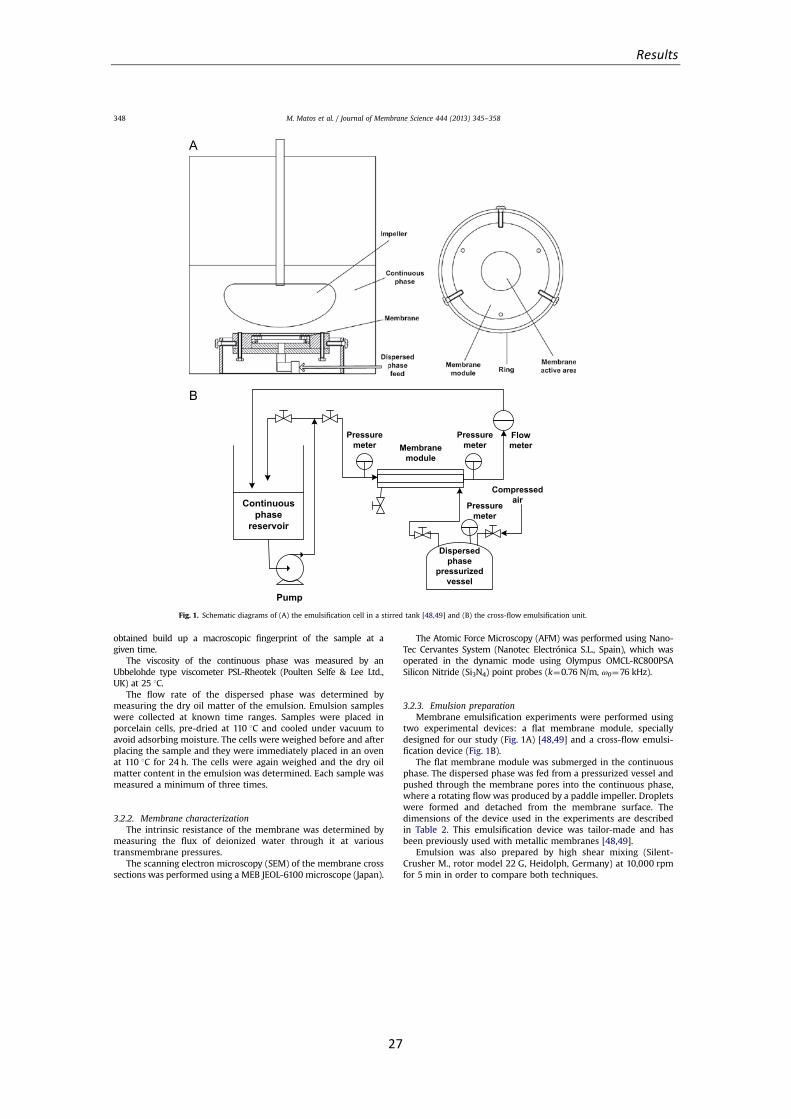
3.2.3. Emulsion preparationMembrane emulsification experiments were performed using
two experimental devices: a flat membrane module, speciallydesigned for our study (Fig. 1A) [48,49] and a cross-flow emulsi-fication device (Fig. 1B).
The flat membrane module was submerged in the continuousphase. The dispersed phase was fed from a pressurized vessel andpushed through the membrane pores into the continuous phase,where a rotating flow was produced by a paddle impeller. Dropletswere formed and detached from the membrane surface. Thedimensions of the device used in the experiments are describedin Table 2. This emulsification device was tailor-made and hasbeen previously used with metallic membranes [48,49].
Emulsion was also prepared by high shear mixing (Silent-Crusher M., rotor model 22 G, Heidolph, Germany) at 10,000 rpmfor 5 min in order to compare both techniques.
Pump
Dispersedphase
pressurizedvessel
Membranemodule
CompressedairContinuous
phasereservoir
Flowmeter
Pressuremeter
Pressuremeter
Pressuremeter
Fig. 1. Schematic diagrams of (A) the emulsification cell in a stirred tank [48,49] and (B) the cross-flow emulsification unit.
M. Matos et al. / Journal of Membrane Science 444 (2013) 345–358348
Results
28
For the experiments using the tubular membranes, the dis-persed phase was fed from the pressurized vessel and then pushedthrough the membrane pores into the continuous phase, whichwas recirculated using a screw pump (PCM, France). The dropletsformed on the membrane surface were detached by the move-ment of the continuous phase.
3.2.4. Membrane cleaningThe flat membranes were cleaned at 50 1C in a flat filtration
Millipore (France) module at ΔP¼100 kPa, using a basic detergent(P3-Ultrasil-10), supplied by Ecolab (USA), at 0.5 wt%. Cleaningwas conducted for 20 min and the membranes were rinsed twicewith distilled water at 50 1C after the cleaning step.
The importance of proper membrane cleaning in the membraneemulsification has been previously discussed by researchers. It wasreported that sonication in a washing solution provides good resultsfor cleaning of tubular ceramic membranes used for emulsification[2]. However, the active layer was damaged when sonication wasapplied to the membrane with a basic cleaning solution.
A similar washing procedure was applied to the cross-flowdevice. First, the tubular membrane was cleaned with water untilno turbidity was observed. Then, the membrane was washed withthe same basic detergent solution used for the flat membranes.The solution was pumped and recirculated for 30 min. Then thecircuit was rinsed with tap water several times. Finally, themembrane was rinsed with distilled water before soaking intothe continuous phase.
4. Results and discussion
4.1. Emulsification with flat ceramic membranes
The first part of the study was to determine the parametersaffecting the emulsification process in the designed device, such astransmembrane pressure, impeller rotational speed, continuousphase viscosity and geometric parameters. The mean droplet sizein terms of D(v,0.5) and span values was compared. The effect ofmembrane pore size was also studied using membranes with 0.45,0.80, and 1.4 μm pore diameters. The stability of the emulsions wasmonitored with Turbiscan Lab Expert equipment and compared tothe emulsion obtained by conventional mechanical agitation.
4.1.1. Membrane characterization4.1.1.1. Water flux. Membranes with pore diameters of 0.45, 0.80 and1.4 μm were characterized by water flux at several transmembranepressures. Results are shown in Fig. 2. There is a linear relationbetween JW and ΔP, with increasing slope as the mean pore diameterincreases.
Rm values were determined applying Eq. (3) for individualmembranes. The following values were obtained for 0.45, 0.80and 1.4 μm membranes, respectively: 1.24�1011, 1.03�1011and0.45�1011 m−1.
4.1.1.2. SEM. The length and the shape of the pores are two importantparameters in the ME process [50–52]. The microstructure of the cross
sections of the dry membranes was studied by scanning electronicmicroscopy (SEM) in order to learn more about the membranes usedin this study.
The images revealed that these types of membranes have twodistinct microstructures when they are dried (Fig. 3). The activetop layer consists of closely packed nodules. The porous supportlayer where the packed nodules are interconnected shows a lessdense packing than the active layer of the membrane surface.Thus, the thickness of the active layer can be obtained from theseimages being 80–100 μm for the three membranes analysed.
4.1.1.3. AFM. Images of the membranes were taken using atomicforce microscopy (AFM) (Fig. 4) to better characterize their surfacemicro-morphology.
The AFM images, Fig. 4, show the representative three-dimensional surface morphologies of the 0.45 μm and 0.80 μmpore diameter membranes. The nodules are readably observedalong the active layer of the membrane surface according to theSEM images.
4.1.2. Effect of operation parametersThe geometric parameters applied for these experiments were
as follows: impeller diameter (Di), 0.09 m, impeller-to-tank dia-meter ratio (Di/DT), 0.75, and ratio between the continuous phaseheight and the tank diameter (H/DT), 0.7, and volume of contin-uous phase (Vc), 1L.
4.1.2.1. Effect of transmembrane pressure. The critical pressure (Pc)was calculated with Eq. (1) and the following values were obtained:28, 16 and 9 kPa for 0.45, 0.80 and 1.4 μm pore diametermembranes, respectively. ΔP from Eq. (2) must be higher than thecritical pressure in order to produce droplets. In the experimentaldevice used, the pressure on the membrane surface (P0) can beassumed equal to the atmospheric pressure, because the column ofliquid above the membrane surface is negligible, as a result of thevortex formation caused by stirring.
Experiments were carried out at different ΔP values, from50 kPa to 200 kPa with 50 kPa step increases. The dispersed phaseflux was determined by measuring the dry oil matter content ofthe resulting emulsions. The fraction of active pores (K) wasestimated with Eq. (4). Droplet formation time (tf) was calculatedwith Eq. (6). Parameters for these experiments are listed in Table 3.The impeller rotational speed (N) was 400 rpm.
Table 2Geometric parameters of the stirred tank emulsification unit.
Geometric parameter Value (m)
Impeller diameter (Di) 0.06–0.09Tank diameter (DT) 0.12Continuous phase height (H) 0.09–0.12Distance from impeller to membrane surface (Z) 0.005Membrane active-area diameter (Dmf) 0.0315
0
5000
10000
15000
20000
25000
0 50 100 150 200 250 300
Wat
er fl
ux, J
w (
L/m
2 h)
Tansmembrane pressure, ΔP (kPa)
0.45 µm0.80 µm1.4 µm
Fig. 2. Influence of transmembrane pressure on water flux through new flatceramic membranes of different pore diameters.
M. Matos et al. / Journal of Membrane Science 444 (2013) 345–358 349
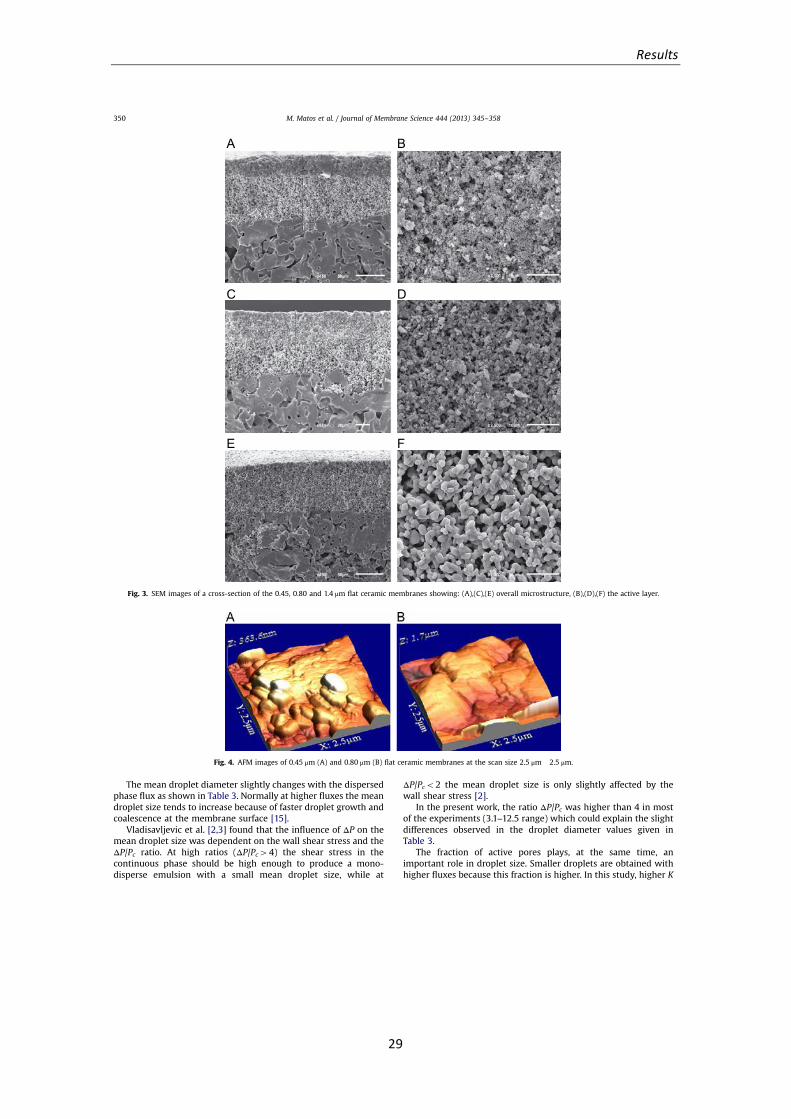
Results
29
The mean droplet diameter slightly changes with the dispersedphase flux as shown in Table 3. Normally at higher fluxes the meandroplet size tends to increase because of faster droplet growth andcoalescence at the membrane surface [15].
Vladisavljevic et al. [2,3] found that the influence of ΔP on themean droplet size was dependent on the wall shear stress and theΔP/Pc ratio. At high ratios (ΔP/Pc44) the shear stress in thecontinuous phase should be high enough to produce a mono-disperse emulsion with a small mean droplet size, while at
ΔP/Pco2 the mean droplet size is only slightly affected by thewall shear stress [2].
In the present work, the ratio ΔP/Pc was higher than 4 in mostof the experiments (3.1–12.5 range) which could explain the slightdifferences observed in the droplet diameter values given inTable 3.
The fraction of active pores plays, at the same time, animportant role in droplet size. Smaller droplets are obtained withhigher fluxes because this fraction is higher. In this study, higher K
Fig. 3. SEM images of a cross-section of the 0.45, 0.80 and 1.4 μm flat ceramic membranes showing: (A),(C),(E) overall microstructure, (B),(D),(F) the active layer.
Fig. 4. AFM images of 0.45 μm (A) and 0.80 μm (B) flat ceramic membranes at the scan size 2.5 μm�2.5 μm.
M. Matos et al. / Journal of Membrane Science 444 (2013) 345–358350
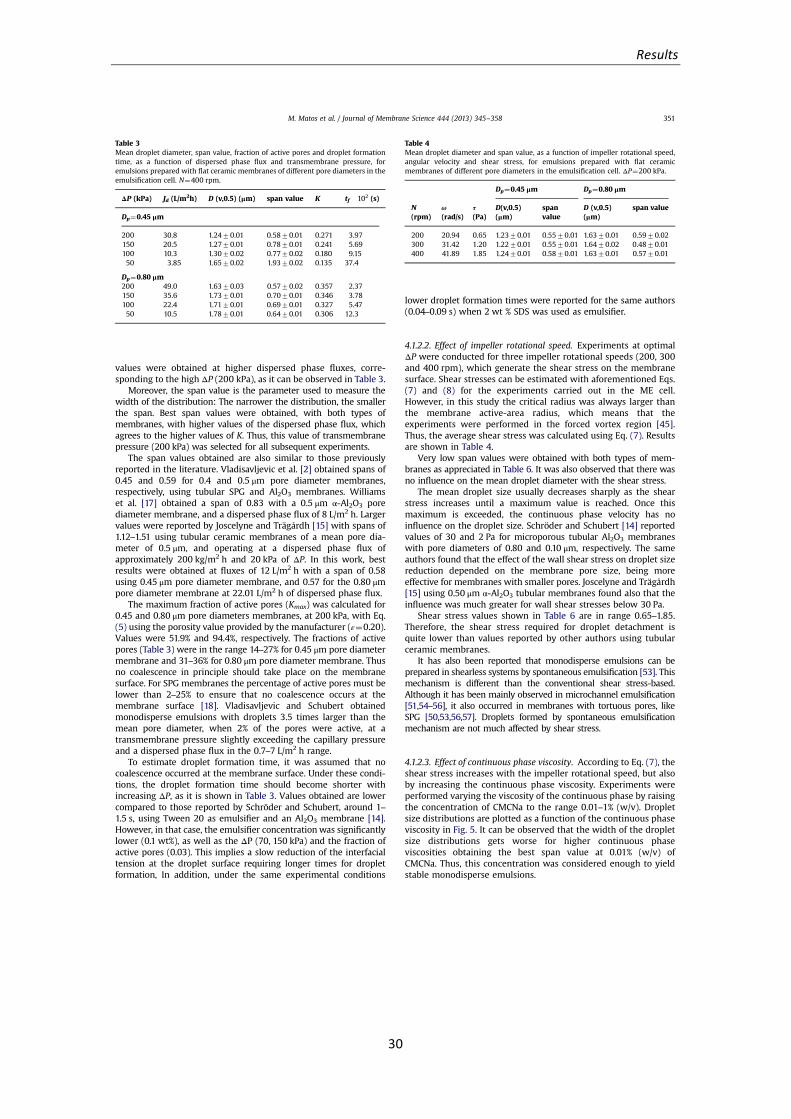
Results
30
Results
31
values were obtained at higher dispersed phase fluxes, corre-sponding to the high ΔP (200 kPa), as it can be observed in Table 3.
Moreover, the span value is the parameter used to measure thewidth of the distribution: The narrower the distribution, the smallerthe span. Best span values were obtained, with both types ofmembranes, with higher values of the dispersed phase flux, whichagrees to the higher values of K. Thus, this value of transmembranepressure (200 kPa) was selected for all subsequent experiments.
The span values obtained are also similar to those previouslyreported in the literature. Vladisavljevic et al. [2] obtained spans of0.45 and 0.59 for 0.4 and 0.5 μm pore diameter membranes,respectively, using tubular SPG and Al2O3 membranes. Williamset al. [17] obtained a span of 0.83 with a 0.5 μm α-Al2O3 porediameter membrane, and a dispersed phase flux of 8 L/m2 h. Largervalues were reported by Joscelyne and Trägårdh [15] with spans of1.12–1.51 using tubular ceramic membranes of a mean pore dia-meter of 0.5 μm, and operating at a dispersed phase flux ofapproximately 200 kg/m2 h and 20 kPa of ΔP. In this work, bestresults were obtained at fluxes of 12 L/m2 h with a span of 0.58using 0.45 μm pore diameter membrane, and 0.57 for the 0.80 μmpore diameter membrane at 22.01 L/m2 h of dispersed phase flux.
The maximum fraction of active pores (Kmax) was calculated for0.45 and 0.80 μm pore diameters membranes, at 200 kPa, with Eq.(5) using the porosity value provided by the manufacturer (ε¼0.20).Values were 51.9% and 94.4%, respectively. The fractions of activepores (Table 3) were in the range 14–27% for 0.45 μm pore diametermembrane and 31–36% for 0.80 μm pore diameter membrane. Thusno coalescence in principle should take place on the membranesurface. For SPG membranes the percentage of active pores must belower than 2–25% to ensure that no coalescence occurs at themembrane surface [18]. Vladisavljevic and Schubert obtainedmonodisperse emulsions with droplets 3.5 times larger than themean pore diameter, when 2% of the pores were active, at atransmembrane pressure slightly exceeding the capillary pressureand a dispersed phase flux in the 0.7–7 L/m2 h range.
To estimate droplet formation time, it was assumed that nocoalescence occurred at the membrane surface. Under these condi-tions, the droplet formation time should become shorter withincreasing ΔP, as it is shown in Table 3. Values obtained are lowercompared to those reported by Schröder and Schubert, around 1–1.5 s, using Tween 20 as emulsifier and an Al2O3 membrane [14].However, in that case, the emulsifier concentration was significantlylower (0.1 wt%), as well as the ΔP (70, 150 kPa) and the fraction ofactive pores (0.03). This implies a slow reduction of the interfacialtension at the droplet surface requiring longer times for dropletformation, In addition, under the same experimental conditions
lower droplet formation times were reported for the same authors(0.04–0.09 s) when 2 wt % SDS was used as emulsifier.
4.1.2.2. Effect of impeller rotational speed. Experiments at optimalΔP were conducted for three impeller rotational speeds (200, 300and 400 rpm), which generate the shear stress on the membranesurface. Shear stresses can be estimated with aforementioned Eqs.(7) and (8) for the experiments carried out in the ME cell.However, in this study the critical radius was always larger thanthe membrane active-area radius, which means that theexperiments were performed in the forced vortex region [45].Thus, the average shear stress was calculated using Eq. (7). Resultsare shown in Table 4.
Very low span values were obtained with both types of mem-branes as appreciated in Table 6. It was also observed that there wasno influence on the mean droplet diameter with the shear stress.
The mean droplet size usually decreases sharply as the shearstress increases until a maximum value is reached. Once thismaximum is exceeded, the continuous phase velocity has noinfluence on the droplet size. Schröder and Schubert [14] reportedvalues of 30 and 2 Pa for microporous tubular Al2O3 membraneswith pore diameters of 0.80 and 0.10 μm, respectively. The sameauthors found that the effect of the wall shear stress on droplet sizereduction depended on the membrane pore size, being moreeffective for membranes with smaller pores. Joscelyne and Trägårdh[15] using 0.50 μm α-Al2O3 tubular membranes found also that theinfluence was much greater for wall shear stresses below 30 Pa.
Shear stress values shown in Table 6 are in range 0.65–1.85.Therefore, the shear stress required for droplet detachment isquite lower than values reported by other authors using tubularceramic membranes.
It has also been reported that monodisperse emulsions can beprepared in shearless systems by spontaneous emulsification [53]. Thismechanism is different than the conventional shear stress-based.Although it has been mainly observed in microchannel emulsification[51,54–56], it also occurred in membranes with tortuous pores, likeSPG [50,53,56,57]. Droplets formed by spontaneous emulsificationmechanism are not much affected by shear stress.
4.1.2.3. Effect of continuous phase viscosity. According to Eq. (7), theshear stress increases with the impeller rotational speed, but alsoby increasing the continuous phase viscosity. Experiments wereperformed varying the viscosity of the continuous phase by raisingthe concentration of CMCNa to the range 0.01–1% (w/v). Dropletsize distributions are plotted as a function of the continuous phaseviscosity in Fig. 5. It can be observed that the width of the dropletsize distributions gets worse for higher continuous phaseviscosities obtaining the best span value at 0.01% (w/v) ofCMCNa. Thus, this concentration was considered enough to yieldstable monodisperse emulsions.
Table 3Mean droplet diameter, span value, fraction of active pores and droplet formationtime, as a function of dispersed phase flux and transmembrane pressure, foremulsions prepared with flat ceramic membranes of different pore diameters in theemulsification cell. N¼400 rpm.
ΔP (kPa) Jd (L/m2h) D (v,0.5) (μm) span value K tf�102 (s)
Dp¼0.45 μm
200 30.8 1.2470.01 0.5870.01 0.271 3.97150 20.5 1.2770.01 0.7870.01 0.241 5.69100 10.3 1.3070.02 0.7770.02 0.180 9.1550 3.85 1.6570.02 1.9370.02 0.135 37.4
Dp¼0.80 μm200 49.0 1.6370.03 0.5770.02 0.357 2.37150 35.6 1.7370.01 0.7070.01 0.346 3.78100 22.4 1.7170.01 0.6970.01 0.327 5.4750 10.5 1.7870.01 0.6470.01 0.306 12.3
Table 4Mean droplet diameter and span value, as a function of impeller rotational speed,angular velocity and shear stress, for emulsions prepared with flat ceramicmembranes of different pore diameters in the emulsification cell. ΔP¼200 kPa.
Dp¼0.45 μm Dp¼0.80 μm
N(rpm)
ω(rad/s)
τ(Pa)
D(v,0.5)(μm)
spanvalue
D (v,0.5)(μm)
span value
200 20.94 0.65 1.2370.01 0.5570.01 1.6370.01 0.5970.02300 31.42 1.20 1.2270.01 0.5570.01 1.6470.02 0.4870.01400 41.89 1.85 1.2470.01 0.5870.01 1.6370.01 0.5770.01
M. Matos et al. / Journal of Membrane Science 444 (2013) 345–358 351
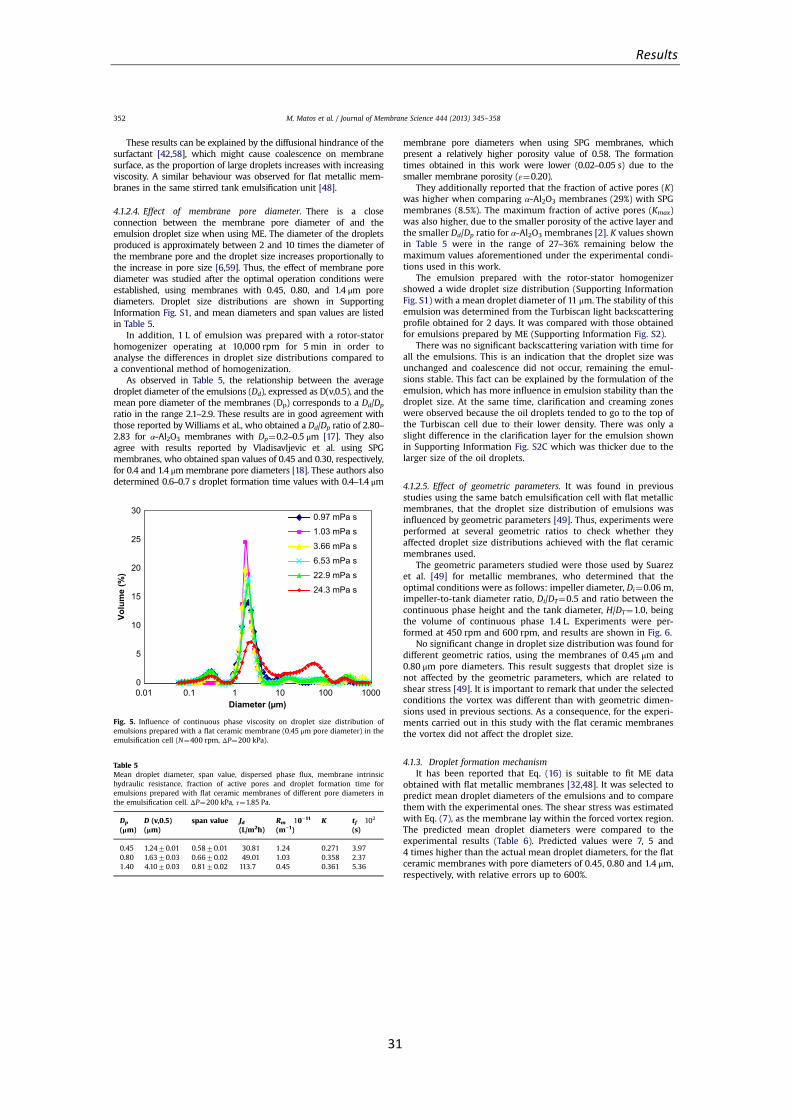
Results
31
These results can be explained by the diffusional hindrance of thesurfactant [42,58], which might cause coalescence on membranesurface, as the proportion of large droplets increases with increasingviscosity. A similar behaviour was observed for flat metallic mem-branes in the same stirred tank emulsification unit [48].
4.1.2.4. Effect of membrane pore diameter. There is a closeconnection between the membrane pore diameter of and theemulsion droplet size when using ME. The diameter of the dropletsproduced is approximately between 2 and 10 times the diameter ofthe membrane pore and the droplet size increases proportionally tothe increase in pore size [6,59]. Thus, the effect of membrane porediameter was studied after the optimal operation conditions wereestablished, using membranes with 0.45, 0.80, and 1.4 μm porediameters. Droplet size distributions are shown in SupportingInformation Fig. S1, and mean diameters and span values are listedin Table 5.
In addition, 1 L of emulsion was prepared with a rotor-statorhomogenizer operating at 10,000 rpm for 5 min in order toanalyse the differences in droplet size distributions compared toa conventional method of homogenization.
As observed in Table 5, the relationship between the averagedroplet diameter of the emulsions (Dd), expressed as D(v,0.5), and themean pore diameter of the membranes (Dp) corresponds to a Dd/Dp
ratio in the range 2.1–2.9. These results are in good agreement withthose reported by Williams et al., who obtained a Dd/Dp ratio of 2.80–2.83 for α-Al2O3 membranes with Dp¼0.2–0.5 μm [17]. They alsoagree with results reported by Vladisavljevic et al. using SPGmembranes, who obtained span values of 0.45 and 0.30, respectively,for 0.4 and 1.4 μmmembrane pore diameters [18]. These authors alsodetermined 0.6–0.7 s droplet formation time values with 0.4–1.4 μm
membrane pore diameters when using SPG membranes, whichpresent a relatively higher porosity value of 0.58. The formationtimes obtained in this work were lower (0.02–0.05 s) due to thesmaller membrane porosity (ε¼0.20).
They additionally reported that the fraction of active pores (K)was higher when comparing α-Al2O3 membranes (29%) with SPGmembranes (8.5%). The maximum fraction of active pores (Kmax)was also higher, due to the smaller porosity of the active layer andthe smaller Dd/Dp ratio for α-Al2O3 membranes [2]. K values shownin Table 5 were in the range of 27–36% remaining below themaximum values aforementioned under the experimental condi-tions used in this work.
The emulsion prepared with the rotor-stator homogenizershowed a wide droplet size distribution (Supporting InformationFig. S1) with a mean droplet diameter of 11 μm. The stability of thisemulsion was determined from the Turbiscan light backscatteringprofile obtained for 2 days. It was compared with those obtainedfor emulsions prepared by ME (Supporting Information Fig. S2).
There was no significant backscattering variation with time forall the emulsions. This is an indication that the droplet size wasunchanged and coalescence did not occur, remaining the emul-sions stable. This fact can be explained by the formulation of theemulsion, which has more influence in emulsion stability than thedroplet size. At the same time, clarification and creaming zoneswere observed because the oil droplets tended to go to the top ofthe Turbiscan cell due to their lower density. There was only aslight difference in the clarification layer for the emulsion shownin Supporting Information Fig. S2C which was thicker due to thelarger size of the oil droplets.
4.1.2.5. Effect of geometric parameters. It was found in previousstudies using the same batch emulsification cell with flat metallicmembranes, that the droplet size distribution of emulsions wasinfluenced by geometric parameters [49]. Thus, experiments wereperformed at several geometric ratios to check whether theyaffected droplet size distributions achieved with the flat ceramicmembranes used.
The geometric parameters studied were those used by Suarezet al. [49] for metallic membranes, who determined that theoptimal conditions were as follows: impeller diameter, Di¼0.06 m,impeller-to-tank diameter ratio, Di/DT¼0.5 and ratio between thecontinuous phase height and the tank diameter, H/DT¼1.0, beingthe volume of continuous phase 1.4 L. Experiments were per-formed at 450 rpm and 600 rpm, and results are shown in Fig. 6.
No significant change in droplet size distribution was found fordifferent geometric ratios, using the membranes of 0.45 μm and0.80 μm pore diameters. This result suggests that droplet size isnot affected by the geometric parameters, which are related toshear stress [49]. It is important to remark that under the selectedconditions the vortex was different than with geometric dimen-sions used in previous sections. As a consequence, for the experi-ments carried out in this study with the flat ceramic membranesthe vortex did not affect the droplet size.
4.1.3. Droplet formation mechanismIt has been reported that Eq. (16) is suitable to fit ME data
obtained with flat metallic membranes [32,48]. It was selected topredict mean droplet diameters of the emulsions and to comparethem with the experimental ones. The shear stress was estimatedwith Eq. (7), as the membrane lay within the forced vortex region.The predicted mean droplet diameters were compared to theexperimental results (Table 6). Predicted values were 7, 5 and4 times higher than the actual mean droplet diameters, for the flatceramic membranes with pore diameters of 0.45, 0.80 and 1.4 μm,respectively, with relative errors up to 600%.
0
5
10
15
20
25
30
0.01 0.1 1 10 100 1000
Volu
me
(%)
Diameter (µm)
0.97 mPa s
1.03 mPa s
3.66 mPa s
6.53 mPa s
22.9 mPa s
24.3 mPa s
Fig. 5. Influence of continuous phase viscosity on droplet size distribution ofemulsions prepared with a flat ceramic membrane (0.45 μm pore diameter) in theemulsification cell (N¼400 rpm, ΔP¼200 kPa).
Table 5Mean droplet diameter, span value, dispersed phase flux, membrane intrinsichydraulic resistance, fraction of active pores and droplet formation time foremulsions prepared with flat ceramic membranes of different pore diameters inthe emulsification cell. ΔP¼200 kPa, τ¼1.85 Pa.
Dp
(μm)D (v,0.5)(μm)
span value Jd(L/m2h)
Rm�10−11
(m−1)K tf�102
(s)
0.45 1.2470.01 0.5870.01 30.81 1.24 0.271 3.970.80 1.6370.03 0.6670.02 49.01 1.03 0.358 2.371.40 4.1070.03 0.8170.02 113.7 0.45 0.361 5.36
M. Matos et al. / Journal of Membrane Science 444 (2013) 345–358352
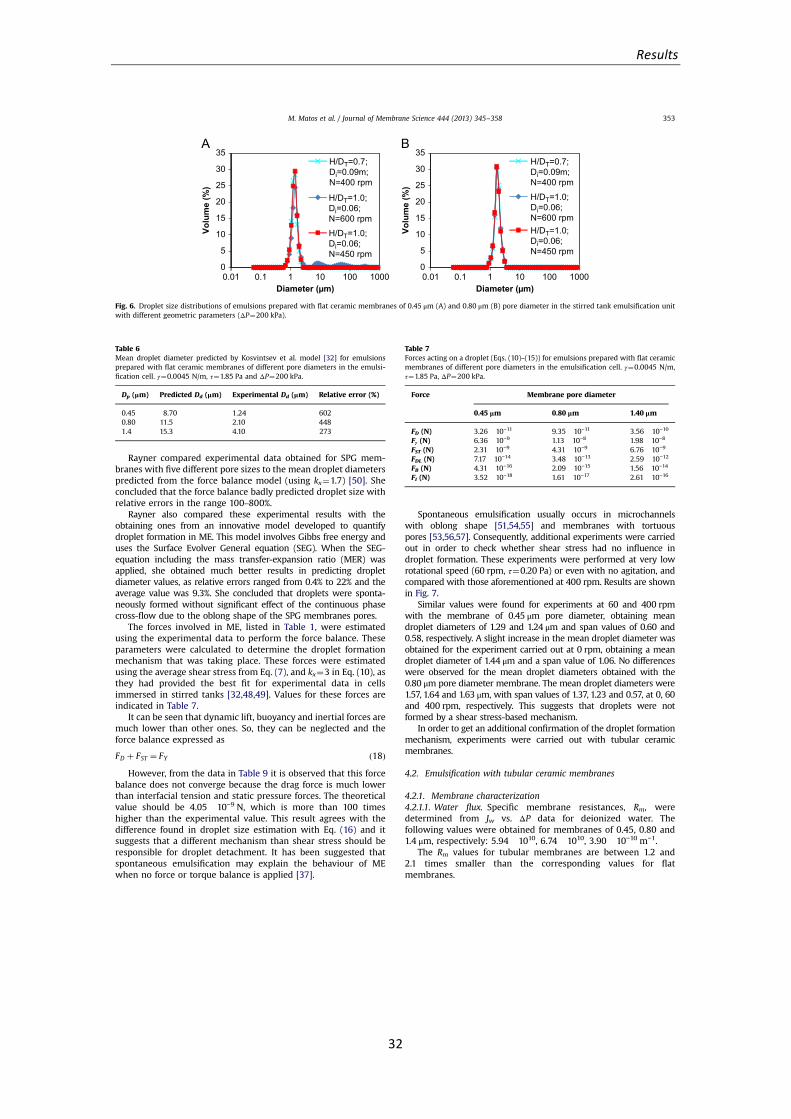
Results
32
Rayner compared experimental data obtained for SPG mem-branes with five different pore sizes to the mean droplet diameterspredicted from the force balance model (using kx¼1.7) [50]. Sheconcluded that the force balance badly predicted droplet size withrelative errors in the range 100–800%.
Rayner also compared these experimental results with theobtaining ones from an innovative model developed to quantifydroplet formation in ME. This model involves Gibbs free energy anduses the Surface Evolver General equation (SEG). When the SEG-equation including the mass transfer-expansion ratio (MER) wasapplied, she obtained much better results in predicting dropletdiameter values, as relative errors ranged from 0.4% to 22% and theaverage value was 9.3%. She concluded that droplets were sponta-neously formed without significant effect of the continuous phasecross-flow due to the oblong shape of the SPG membranes pores.
The forces involved in ME, listed in Table 1, were estimatedusing the experimental data to perform the force balance. Theseparameters were calculated to determine the droplet formationmechanism that was taking place. These forces were estimatedusing the average shear stress from Eq. (7), and kx¼3 in Eq. (10), asthey had provided the best fit for experimental data in cellsimmersed in stirred tanks [32,48,49]. Values for these forces areindicated in Table 7.
It can be seen that dynamic lift, buoyancy and inertial forces aremuch lower than other ones. So, they can be neglected and theforce balance expressed as
FD þ FST ¼ FY ð18ÞHowever, from the data in Table 9 it is observed that this force
balance does not converge because the drag force is much lowerthan interfacial tension and static pressure forces. The theoreticalvalue should be 4.05�10−9 N, which is more than 100 timeshigher than the experimental value. This result agrees with thedifference found in droplet size estimation with Eq. (16) and itsuggests that a different mechanism than shear stress should beresponsible for droplet detachment. It has been suggested thatspontaneous emulsification may explain the behaviour of MEwhen no force or torque balance is applied [37].
Spontaneous emulsification usually occurs in microchannelswith oblong shape [51,54,55] and membranes with tortuouspores [53,56,57]. Consequently, additional experiments were carriedout in order to check whether shear stress had no influence indroplet formation. These experiments were performed at very lowrotational speed (60 rpm, τ¼0.20 Pa) or even with no agitation, andcompared with those aforementioned at 400 rpm. Results are shownin Fig. 7.
Similar values were found for experiments at 60 and 400 rpmwith the membrane of 0.45 μm pore diameter, obtaining meandroplet diameters of 1.29 and 1.24 μm and span values of 0.60 and0.58, respectively. A slight increase in the mean droplet diameter wasobtained for the experiment carried out at 0 rpm, obtaining a meandroplet diameter of 1.44 μm and a span value of 1.06. No differenceswere observed for the mean droplet diameters obtained with the0.80 μm pore diameter membrane. The mean droplet diameters were1.57, 1.64 and 1.63 μm, with span values of 1.37, 1.23 and 0.57, at 0, 60and 400 rpm, respectively. This suggests that droplets were notformed by a shear stress-based mechanism.
In order to get an additional confirmation of the droplet formationmechanism, experiments were carried out with tubular ceramicmembranes.
4.2. Emulsification with tubular ceramic membranes
4.2.1. Membrane characterization4.2.1.1. Water flux. Specific membrane resistances, Rm, weredetermined from Jw vs. ΔP data for deionized water. Thefollowing values were obtained for membranes of 0.45, 0.80 and1.4 μm, respectively: 5.94�1010, 6.74�1010, 3.90�10−10 m−1.
The Rm values for tubular membranes are between 1.2 and2.1 times smaller than the corresponding values for flatmembranes.
0
5
10
15
20
25
30
35
Volu
me
(%)
H/DT=0.7;Di=0.09m;N=400 rpm
H/DT=1.0;Di=0.06;N=600 rpm
H/DT=1.0;Di=0.06;N=450 rpm
Diameter (µm)
0
5
10
15
20
25
30
35
0.01 0.1 1 10 100 1000 0.01 0.1 1 10 100 1000
Volu
me
(%)
H/DT=0.7;Di=0.09m;N=400 rpm
H/DT=1.0;Di=0.06;N=600 rpmH/DT=1.0;Di=0.06;N=450 rpm
Diameter (µm)
Fig. 6. Droplet size distributions of emulsions prepared with flat ceramic membranes of 0.45 μm (A) and 0.80 μm (B) pore diameter in the stirred tank emulsification unitwith different geometric parameters (ΔP¼200 kPa).
Table 6Mean droplet diameter predicted by Kosvintsev et al. model [32] for emulsionsprepared with flat ceramic membranes of different pore diameters in the emulsi-fication cell. γ¼0.0045 N/m, τ¼1.85 Pa and ΔP¼200 kPa.
Dp (μm) Predicted Dd (μm) Experimental Dd (μm) Relative error (%)
0.45 8.70 1.24 6020.80 11.5 2.10 4481.4 15.3 4.10 273
Table 7Forces acting on a droplet (Eqs. (10)–(15)) for emulsions prepared with flat ceramicmembranes of different pore diameters in the emulsification cell. γ¼0.0045 N/m,τ¼1.85 Pa, ΔP¼200 kPa.
Force Membrane pore diameter
0.45 μm 0.80 μm 1.40 μm
FD (N) 3.26�10−11 9.35�10−11 3.56�10−10
Fγ (N) 6.36�10−9 1.13�10−8 1.98�10−8
FST (N) 2.31�10−9 4.31�10−9 6.76�10−9
FDL (N) 7.17�10−14 3.48�10−13 2.59�10−12
FB (N) 4.31�10−16 2.09�10−15 1.56�10−14
FI (N) 3.52�10−18 1.61�10−17 2.61�10−16
M. Matos et al. / Journal of Membrane Science 444 (2013) 345–358 353
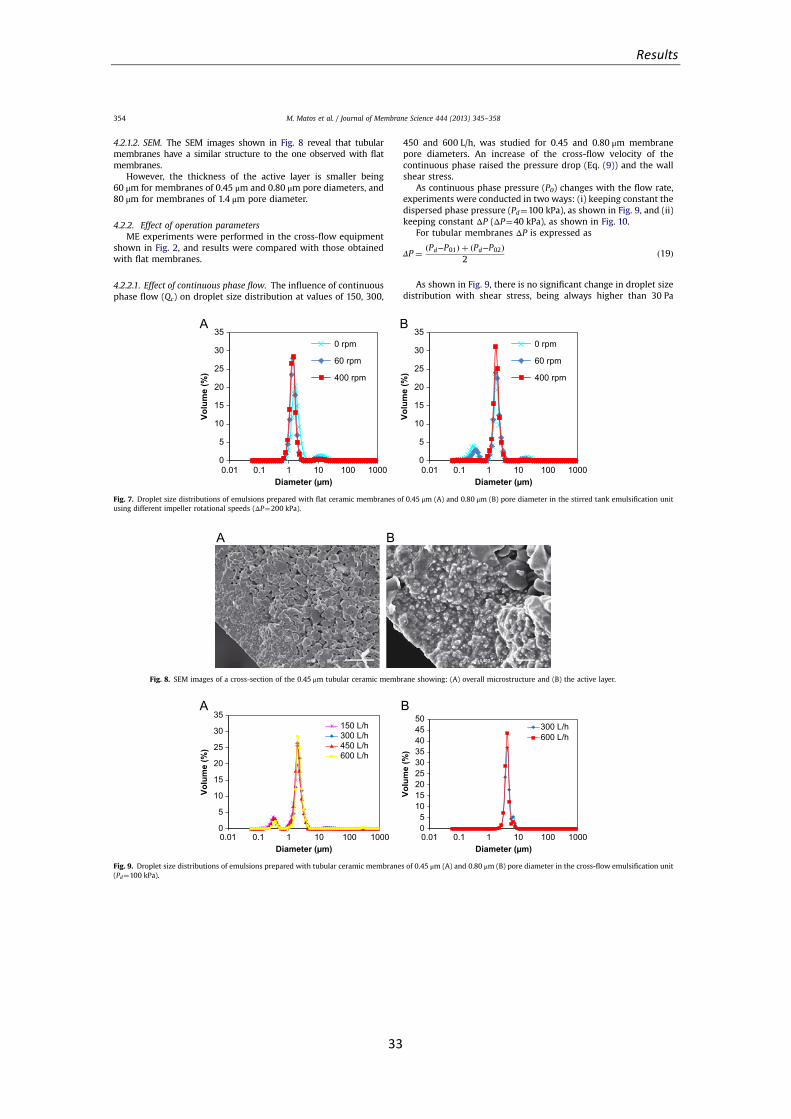
Results
33
4.2.1.2. SEM. The SEM images shown in Fig. 8 reveal that tubularmembranes have a similar structure to the one observed with flatmembranes.
However, the thickness of the active layer is smaller being60 μm for membranes of 0.45 μm and 0.80 μm pore diameters, and80 μm for membranes of 1.4 μm pore diameter.
4.2.2. Effect of operation parametersME experiments were performed in the cross-flow equipment
shown in Fig. 2, and results were compared with those obtainedwith flat membranes.
4.2.2.1. Effect of continuous phase flow. The influence of continuousphase flow (Qc) on droplet size distribution at values of 150, 300,
450 and 600 L/h, was studied for 0.45 and 0.80 μm membranepore diameters. An increase of the cross-flow velocity of thecontinuous phase raised the pressure drop (Eq. (9)) and the wallshear stress.
As continuous phase pressure (P0) changes with the flow rate,experiments were conducted in two ways: (i) keeping constant thedispersed phase pressure (Pd¼100 kPa), as shown in Fig. 9, and (ii)keeping constant ΔP (ΔP¼40 kPa), as shown in Fig. 10.
For tubular membranes ΔP is expressed as
ΔP ¼ ðPd−P01Þ þ ðPd−P02Þ2
ð19Þ
As shown in Fig. 9, there is no significant change in droplet sizedistribution with shear stress, being always higher than 30 Pa
0
5
10
15
20
25
30
35
Volu
me
(%)
Diameter (µm)
0 rpm
60 rpm
400 rpm
0
5
10
15
20
25
30
35
0.01 0.1 1 10 100 1000 0.01 0.1 1 10 100 1000
Volu
me
(%)
Diameter (µm)
0 rpm
60 rpm
400 rpm
Fig. 7. Droplet size distributions of emulsions prepared with flat ceramic membranes of 0.45 μm (A) and 0.80 μm (B) pore diameter in the stirred tank emulsification unitusing different impeller rotational speeds (ΔP¼200 kPa).
Fig. 8. SEM images of a cross-section of the 0.45 μm tubular ceramic membrane showing: (A) overall microstructure and (B) the active layer.
0
5
10
15
20
25
30
35
Volu
me
(%)
Diameter (µm)
150 L/h300 L/h450 L/h600 L/h
05
101520253035404550
Volu
me
(%)
0.01 0.1 1 10 100 1000 0.01 0.1 1 10 100 1000Diameter (µm)
300 L/h600 L/h
Fig. 9. Droplet size distributions of emulsions prepared with tubular ceramic membranes of 0.45 μm (A) and 0.80 μm (B) pore diameter in the cross-flow emulsification unit(Pd¼100 kPa).
M. Matos et al. / Journal of Membrane Science 444 (2013) 345–358354
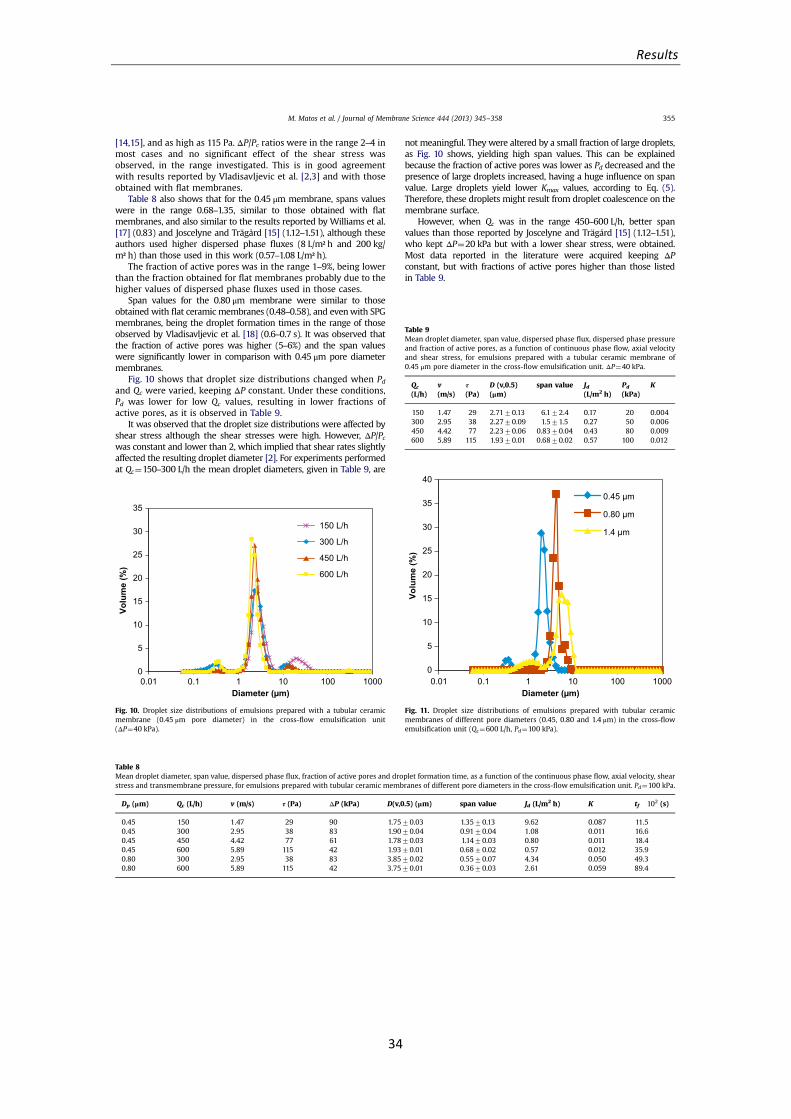
Results
34
[14,15], and as high as 115 Pa. ΔP/Pc ratios were in the range 2–4 inmost cases and no significant effect of the shear stress wasobserved, in the range investigated. This is in good agreementwith results reported by Vladisavljevic et al. [2,3] and with thoseobtained with flat membranes.
Table 8 also shows that for the 0.45 μm membrane, spans valueswere in the range 0.68–1.35, similar to those obtained with flatmembranes, and also similar to the results reported by Williams et al.[17] (0.83) and Joscelyne and Trägård [15] (1.12–1.51), although theseauthors used higher dispersed phase fluxes (8 L/m² h and 200 kg/m² h) than those used in this work (0.57–1.08 L/m² h).
The fraction of active pores was in the range 1–9%, being lowerthan the fraction obtained for flat membranes probably due to thehigher values of dispersed phase fluxes used in those cases.
Span values for the 0.80 μm membrane were similar to thoseobtained with flat ceramic membranes (0.48–0.58), and evenwith SPGmembranes, being the droplet formation times in the range of thoseobserved by Vladisavljevic et al. [18] (0.6–0.7 s). It was observed thatthe fraction of active pores was higher (5–6%) and the span valueswere significantly lower in comparison with 0.45 μm pore diametermembranes.
Fig. 10 shows that droplet size distributions changed when Pdand Qc were varied, keeping ΔP constant. Under these conditions,Pd was lower for low Qc values, resulting in lower fractions ofactive pores, as it is observed in Table 9.
It was observed that the droplet size distributions were affected byshear stress although the shear stresses were high. However, ΔP/Pcwas constant and lower than 2, which implied that shear rates slightlyaffected the resulting droplet diameter [2]. For experiments performedat Qc¼150–300 L/h the mean droplet diameters, given in Table 9, are
not meaningful. They were altered by a small fraction of large droplets,as Fig. 10 shows, yielding high span values. This can be explainedbecause the fraction of active pores was lower as Pd decreased and thepresence of large droplets increased, having a huge influence on spanvalue. Large droplets yield lower Kmax values, according to Eq. (5).Therefore, these droplets might result from droplet coalescence on themembrane surface.
However, when Qc was in the range 450–600 L/h, better spanvalues than those reported by Joscelyne and Trägård [15] (1.12–1.51),who kept ΔP¼20 kPa but with a lower shear stress, were obtained.Most data reported in the literature were acquired keeping ΔPconstant, but with fractions of active pores higher than those listedin Table 9.
0
5
10
15
20
25
30
35
0.01 0.1 1 10 100 1000
Volu
me
(%)
Diameter (µm)
150 L/h
300 L/h
450 L/h
600 L/h
Fig. 10. Droplet size distributions of emulsions prepared with a tubular ceramicmembrane (0.45 μm pore diameter) in the cross-flow emulsification unit(ΔP¼40 kPa).
Table 8Mean droplet diameter, span value, dispersed phase flux, fraction of active pores and droplet formation time, as a function of the continuous phase flow, axial velocity, shearstress and transmembrane pressure, for emulsions prepared with tubular ceramic membranes of different pore diameters in the cross-flow emulsification unit. Pd¼100 kPa.
Dp (μm) Qc (L/h) v (m/s) τ (Pa) ΔP (kPa) D(v,0.5) (μm) span value Jd (L/m2 h) K tf�102 (s)
0.45 150 1.47 29 90 1.7570.03 1.3570.13 9.62 0.087 11.50.45 300 2.95 38 83 1.9070.04 0.9170.04 1.08 0.011 16.60.45 450 4.42 77 61 1.7870.03 1.1470.03 0.80 0.011 18.40.45 600 5.89 115 42 1.9370.01 0.6870.02 0.57 0.012 35.90.80 300 2.95 38 83 3.8570.02 0.5570.07 4.34 0.050 49.30.80 600 5.89 115 42 3.7570.01 0.3670.03 2.61 0.059 89.4
Table 9Mean droplet diameter, span value, dispersed phase flux, dispersed phase pressureand fraction of active pores, as a function of continuous phase flow, axial velocityand shear stress, for emulsions prepared with a tubular ceramic membrane of0.45 μm pore diameter in the cross-flow emulsification unit. ΔP¼40 kPa.
Qc
(L/h)v(m/s)
τ(Pa)
D (v,0.5)(μm)
span value Jd(L/m2 h)
Pd
(kPa)K
150 1.47 29 2.7170.13 6.172.4 0.17 20 0.004300 2.95 38 2.2770.09 1.571.5 0.27 50 0.006450 4.42 77 2.2370.06 0.8370.04 0.43 80 0.009600 5.89 115 1.9370.01 0.6870.02 0.57 100 0.012
0
5
10
15
20
25
30
35
40
0.01 0.1 1 10 100 1000
Volu
me
(%)
Diameter (µm)
0.45 µm
0.80 µm
1.4 µm
Fig. 11. Droplet size distributions of emulsions prepared with tubular ceramicmembranes of different pore diameters (0.45, 0.80 and 1.4 μm) in the cross-flowemulsification unit (Qc¼600 L/h, Pd¼100 kPa).
M. Matos et al. / Journal of Membrane Science 444 (2013) 345–358 355
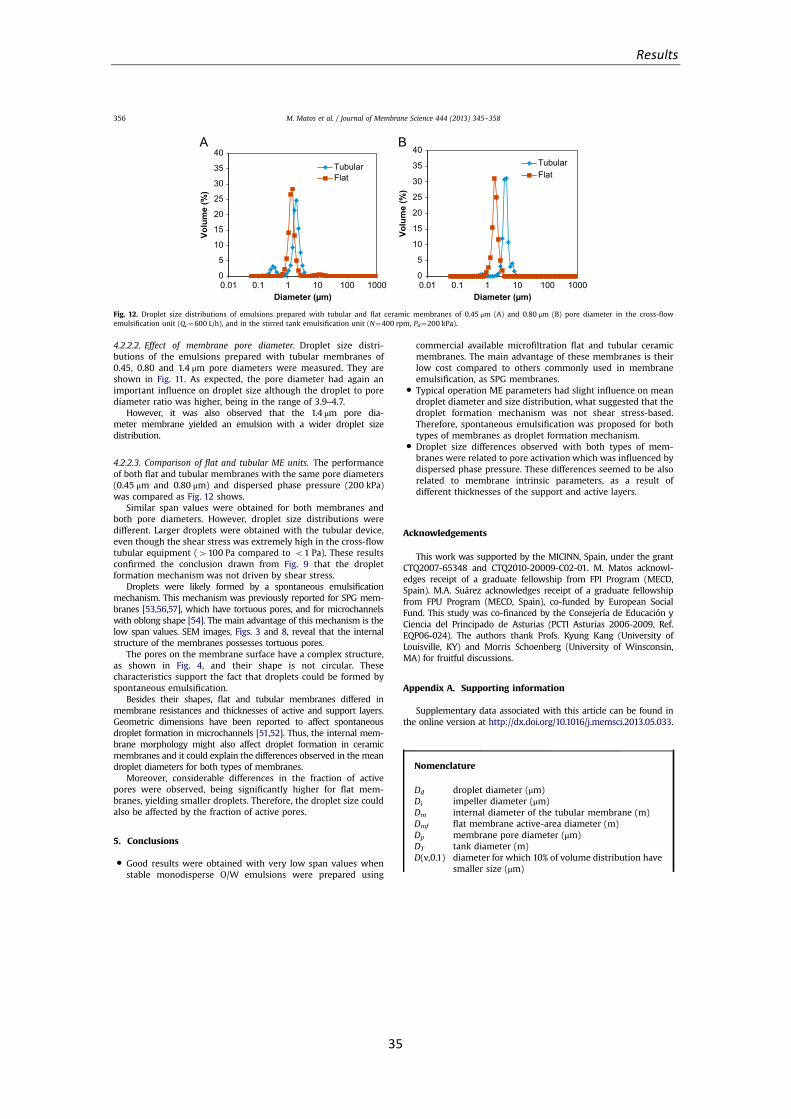
Results
35
4.2.2.2. Effect of membrane pore diameter. Droplet size distri-butions of the emulsions prepared with tubular membranes of0.45, 0.80 and 1.4 μm pore diameters were measured. They areshown in Fig. 11. As expected, the pore diameter had again animportant influence on droplet size although the droplet to porediameter ratio was higher, being in the range of 3.9–4.7.
However, it was also observed that the 1.4 μm pore dia-meter membrane yielded an emulsion with a wider droplet sizedistribution.
4.2.2.3. Comparison of flat and tubular ME units. The performanceof both flat and tubular membranes with the same pore diameters(0.45 μm and 0.80 μm) and dispersed phase pressure (200 kPa)was compared as Fig. 12 shows.
Similar span values were obtained for both membranes andboth pore diameters. However, droplet size distributions weredifferent. Larger droplets were obtained with the tubular device,even though the shear stress was extremely high in the cross-flowtubular equipment (4100 Pa compared to o1 Pa). These resultsconfirmed the conclusion drawn from Fig. 9 that the dropletformation mechanism was not driven by shear stress.
Droplets were likely formed by a spontaneous emulsificationmechanism. This mechanism was previously reported for SPG mem-branes [53,56,57], which have tortuous pores, and for microchannelswith oblong shape [54]. The main advantage of this mechanism is thelow span values. SEM images, Figs. 3 and 8, reveal that the internalstructure of the membranes possesses tortuous pores.
The pores on the membrane surface have a complex structure,as shown in Fig. 4, and their shape is not circular. Thesecharacteristics support the fact that droplets could be formed byspontaneous emulsification.
Besides their shapes, flat and tubular membranes differed inmembrane resistances and thicknesses of active and support layers.Geometric dimensions have been reported to affect spontaneousdroplet formation in microchannels [51,52]. Thus, the internal mem-brane morphology might also affect droplet formation in ceramicmembranes and it could explain the differences observed in the meandroplet diameters for both types of membranes.
Moreover, considerable differences in the fraction of activepores were observed, being significantly higher for flat mem-branes, yielding smaller droplets. Therefore, the droplet size couldalso be affected by the fraction of active pores.
5. Conclusions
� Good results were obtained with very low span values whenstable monodisperse O/W emulsions were prepared using
commercial available microfiltration flat and tubular ceramicmembranes. The main advantage of these membranes is theirlow cost compared to others commonly used in membraneemulsification, as SPG membranes.
� Typical operation ME parameters had slight influence on meandroplet diameter and size distribution, what suggested that thedroplet formation mechanism was not shear stress-based.Therefore, spontaneous emulsification was proposed for bothtypes of membranes as droplet formation mechanism.
� Droplet size differences observed with both types of mem-branes were related to pore activation which was influenced bydispersed phase pressure. These differences seemed to be alsorelated to membrane intrinsic parameters, as a result ofdifferent thicknesses of the support and active layers.
Acknowledgements
This work was supported by the MICINN, Spain, under the grantCTQ2007-65348 and CTQ2010-20009-C02-01. M. Matos acknowl-edges receipt of a graduate fellowship from FPI Program (MECD,Spain). M.A. Suárez acknowledges receipt of a graduate fellowshipfrom FPU Program (MECD, Spain), co-funded by European SocialFund. This study was co-financed by the Consejería de Educación yCiencia del Principado de Asturias (PCTI Asturias 2006-2009, Ref.EQP06-024). The authors thank Profs. Kyung Kang (University ofLouisville, KY) and Morris Schoenberg (University of Winsconsin,MA) for fruitful discussions.
Appendix A. Supporting information
Supplementary data associated with this article can be found inthe online version at http://dx.doi.org/10.1016/j.memsci.2013.05.033.
Nomenclature
Dd droplet diameter (μm)Di impeller diameter (μm)Dm internal diameter of the tubular membrane (m)Dmf flat membrane active-area diameter (m)Dp membrane pore diameter (μm)DT tank diameter (m)D(v,0.1) diameter for which 10% of volume distribution have
smaller size (μm)
0
5
10
15
20
25
30
35
40
Volu
me
(%)
Diameter (µm)
TubularFlat
0
5
10
15
20
25
30
35
40
0.01 0.1 1 10 100 1000 0.01 0.1 1 10 100 1000
Volu
me
(%)
Diameter (µm)
TubularFlat
Fig. 12. Droplet size distributions of emulsions prepared with tubular and flat ceramic membranes of 0.45 μm (A) and 0.80 μm (B) pore diameter in the cross-flowemulsification unit (Qc¼600 L/h), and in the stirred tank emulsification unit (N¼400 rpm, Pd¼200 kPa).
M. Matos et al. / Journal of Membrane Science 444 (2013) 345–358356
Results
36
D(v,0.5) diameter for which 50% of volume distributionhave smaller size (μm)
D(v,0.9) diameter for which 90% of volume distributionhave smaller size (μm)
FB buoyancy force (N)FD drag force (N)FDL dynamic lift force (N)Fi inertial force (N)FST static pressure force (N)Fγ interfacial tension force (N)g gravity constant (9.81 m/s²)H continuous phase height (m)J flux (m3/m² s)kx wall correction factor for a simple sphere touching
an impermeable wallK fraction of membrane active poresKmax maximum fraction of membrane active poresLm tubular membrane length (m)N impeller rotational speed (rps)Pc capillary pressure (Pa)Pd dispersed phase pressure (Pa)P0 continuous phase pressure on the membrane
surface (Pa)Qdp dispersed phase flow in a pore (m³/s)r distance to the rotation axis (m)rc critical radius (m)Rm membrane intrinsic hydraulic resistance (m−1)t time (s)tf droplet formation time (s)v axial velocity (m/s)vd dispersed phase velocity (m/s)V volume (m³)Z distance from impeller to membrane surface (m)
Greek letters
γ interfacial tension (N/m)ε membrane porosityΔρ density difference between dispersed and contin-
uous phases (kg/m³)ΔP transmembrane pressure (Pa)θ contact angle (1)μ dynamic viscosity (Pa s)ρ density (kg/m³)τ shear stress (Pa)ω angular velocity (rad/s)
Subscripts
c continuous phased dispersed phase/dropletm membranep porew pure water
References
[1] E. Egidi, G. Gasparini, R.G. Holdich, G.T. Vladisavljevic, S. Kosvintsev, Mem-brane emulsification using membranes of regular pore spacing: droplet sizeand uniformity in the presence of surface shear, J. Membr. Sci. 323 (2008)414–420.
[2] G.T. Vladisavljevic, U. Lambrich, M. Nakajima, H. Schubert, Production of O/Wemulsions using SPG membranes, ceramic-aluminium oxide membranes,
microfluidizer and a silicon microchannel plate-a comparative study, ColloidsSurf. A: Physicochem. Eng. Aspects 232 (2004) 199–207.
[3] G.T. Vladisavljevic, H. Schubert, Preparation of emulsions with a narrowparticle size distribution using microporous α‐alumina membranes, J. Disper-sion Sci. Technol. 24 (2003) 811–819.
[4] S.M. Joscelyne, G. Trägård, Membrane emulsification-a literature review,J. Membr. Sci. 169 (2000) 107–117.
[5] C. Charcosset, Preparation of emulsions and particles by membrane emulsi-fication for food processing industry, J. Food. Eng. 92 (2009) 241–249.
[6] M. Rayner, G. Trägård, Membrane emulsification modelling: how can we getfrom characterisation to design? Desalination 145 (2002) 165–172.
[7] M. Nakajima, M.A. Neves, I. Kobayashi, Novel Microchannel EmulsificationTechnology for Monodisperse Emulsions, WCCE8 Program Book, 516e, 2009.
[8] U. Lambrich, H. Schubert, Emulsification using microporous systems, J. Membr.Sci. 257 (2005) 76–84.
[9] M.A. Suárez, J. Coca, C. Pazos, Membrane emulsification: factors influencingthe size and distribution of the drops, Ing. Quim. 505 (2012) 58–73.
[10] T Nakashima, M. Shimizu, M. Kukizaki, Membrane emulsification by micro-porous glass, Key Eng. Mater. 61&62 (1991) 513–516.
[11] T Nakashima, M. Shimizu, M. Kukizaki, Particle control of emulsion bymembrane emulsification and its applications, Adv. Drug Delivery Rev. 45(2000) 47–56.
[12] R. Katoh, Y. Asano, A. Furuya, K. Sotoyama, M. Tomita, Preparation of foodemulsions using a membrane emulsification system, J. Membr. Sci. 113 (1996)131–135.
[13] A.K. Pawlik, I.T. Norton, Encapsulation stability of duplex emulsions preparedwith SPG cross-flow membrane, SPG rotating membrane and rotor-statortechniques-A comparison, J. Membr. Sci. 415–416 (2012) 459–468.
[14] V. Schröder, H. Schubert, Production of emulsions using microporous ceramicmembranes, Colloids Surf. A: Physicochem. Eng. Aspects 152 (1999) 103–109.
[15] S.M. Joscelyne, G. Trägård, Food emulsions using membrane emulsification:conditions for producing small droplets, J. Food Eng. 39 (1999) 59–64.
[16] S.J. Peng, R.A. Williams, Controlled production of emulsions using a crossflowmembrane: Part I: droplet formation from a single pore, Chem. Eng. Res. Des.76 (1998) 894–901.
[17] R.A. Williams, S.J. Peng, D.A. Wheeler, N.C. Morley, D. Taylor, M. Whalley, D.W. Houldsworth, Controlled production of emulsions using a crossflowmembrane. Part II: industrial scale manufacture, Chem. Eng. Res. Des. 76(1998) 902–910.
[18] G.T. Vladisavljevic, H. Schubert, Preparation and analysis of oil-in-wateremulsions with narrow droplet size distribution using Shirasu-porous glass(SPG) membranes, Desalination 144 (2002) 167–172.
[19] Q. Yuan, R.A. Williams, N. Aryanti, Innovations in high throughput manufac-turing of uniform emulsions and capsules, Adv. Powder Technol. 21 (2010)599–608.
[20] E. Lepercq-Bost, M.L. Giorgi, A. Isambert, C. Arnaud, Use of the capillarynumber for the prediction of droplet size in membrane emulsification,J. Membr. Sci. 314 (2008) 76–89.
[21] E. Lepercq-Bost, M.L. Giorgi, A. Isambert, C. Arnaud, Estimating the risk ofcoalescence in membrane emulsification, J. Membr. Sci. 357 (2010) 36–46.
[22] I. Limayem Blouza, C. Charcosset, S. Sfar, H. Fessi, Preparation and character-ization of spironolactone-loaded nanocapsules for paediatric use, Int. J. Pharm.325 (2006) 124–131.
[23] M. Ebrahimi, G. Lavi, T. Schmidts, F. Runkel, P. Czermak, Development andproduction of oil-in-water vehicles-sub-micron emulsion using tubular cera-mic membranes, Desalination 224 (2008) 40–45.
[24] J.S. de los Reyes, C. Charcosset, Preparation of water-in-oil and ethanol-in-oilemulsions by membrane emulsification, Fuel 89 (2010) 3482–3488.
[25] C. Charcosset, H. Fessi, Preparation of nanoparticles with a membranecontactor, J. Membr. Sci. 266 (2006) 115–120.
[26] N. Sheibat-Othman, T. Burne, C. Charcosset, H. Fessi, Preparation of pH-sensitive particles by membrane contactor, Colloids Surf. A: Physicochem.Eng. Aspects 315 (1–3) (2008) 13–22.
[27] R. Mazzei, E. Drioli, L. Giorno, Biocatalitic membrane reactor and membraneemusification concepts combined in a single unti to assist production andseparation of wáter unstable reaction products, J. Membr. Sci. 352 (1–2) (2010)166–172.
[28] L. Giorno, E. D'Amore, R. Mazzei, E. Piacentini, J. Zhang, E. Drioli, R. Cassano,N. Picci, An innovative approach to improve the performance of a two separatephase enzyme membrane reactor by inmobilizing lipase in presence ofemulsion, J. Membr. Sci. 295 (1–2) (2007) 95–101.
[29] N.A. Wagdare, A.T.M. Marcelis, O. Boen, Ho, R.M. Boom, C.J.M. van Rijn, Highthroughput vegetable oil-in-water emulsification with a high porosity micro-engineered membrane, J. Membr. Sci. 347 (2010) 1–7.
[30] M.J. Geerken, R.G.H. Lammertink, M. Wessling, Interfacial aspects of waterdrop formation at micro-engineered orifices, J. Colloid Interface Sci. 312(2007) 460–469.
[31] A.J. Gijsbertsen-Abrahamse, A. van der Padt, R.M. Boom, Influence of mem-brane morphology on pore activation in membrane emulsification, J. Membr.Sci. 217 (2003) 141–150.
[32] S.R. Kosvintsev, G. Gasparini, R.G. Holdich, I.W. Cumming, M.T. Stillwell,Liquid-liquid membrane dispersion in a stirred cell with and withoutcontrolled shear, Ind. Eng. Chem. Res. 44 (2005) 9323–9330.
[33] S.R. Kosvintsev, G. Gasparini, R.G. Holdich, Membrane emulsification: dropletsize and uniformity in the absence of surface shear, J. Membr. Sci. 313 (2008)182–189.
M. Matos et al. / Journal of Membrane Science 444 (2013) 345–358 357
Results
37
[34] M.T. Stillwell, R.G. Holdich, S.R. Kosvintsev, G. Gasparini, I.W. Cumming,Stirred cell membrane emulsification and factors influencing dispersion dropsize and uniformity, Ind. Eng. Chem. Res. 46 (2007) 965–972.
[35] M.M. Dragosavac, M.N. Sovilj, S.R. Kosvintsev, R.G. Holdich, G.T. Vladisavljevic,Controlled production of oil-in-water emulsions containing unrefined pump-kin seed oil using stirred cell membrane emulsification, J. Membr. Sci. 322(2008) 178–188.
[36] J.H. Xu, G.S. Luo, G.G. Chen, J.D. Wang, Experimental and theoreticalapproaches on droplet formation from a micrometer screen hole, J. Membr.Sci. 266 (2005) 121–131.
[37] D.X. Hao, F.L. Gong, G.H. Hu, Y.J. Zhao, G.P. Lian, G.H. Ma, Z. Su, Controllingfactors on droplets uniformity in membrane emulsification: experiment andmodelling analysis, Ind. Eng. Chem. Res. 47 (2008) 6418–6425.
[38] G. De Luca, F. Di Maio, A. Di Renzo, E. Drioli, Droplet detachment in cross-flowmembrane emulsification: comparison among torque- and force-based mod-els, Chem. Eng. Process. 47 (2008) 1150–1158.
[39] K.D. Danov, D.K. Danova, P.A. Kralchevsky, Hydrodynamic forces acting on amicroscopic emulsion drop growing at a capillary tip in relation to the processof membrane emulsification, J. Colloid Interface Sci. 316 (2007) 844–857.
[40] A. Timgren, G. Trägård, C. Trägård, A model for drop size prediction duringcross-flow emulsification, Chem. Eng. Res. Des. 88 (2) (2010) 229–238.
[41] M. Rayner, G. Trägård, C. Trägård, The impact of mass transfer and interfacialtension expansion rate on droplet size in membrane emulsification processes,Colloids Surf. A: Physicochem. Eng. Aspects 266 (2005) 1–17.
[42] M. Rayner, G. Trägård, C. Trägård, P. Dejmek, Using the surface evolver tomodel droplet formation processes in membrane emulsification, J. ColloidInterface Sci. 279 (2004) 175–185.
[43] V. Schröder, O. Behrend, H. Schubert, Effect of dynamic interfacial tension onthe emulsification process using microporous ceramic membranes, J. ColloidInterface Sci. 202 (1998) 334–340.
[44] Q. Yuan, N. Aryanti, G. Gutiérrez, R.A. Williams, Enhancing the throughput ofmembrane emulsification techniques to manufacture functional particles, Ind.Eng. Chem. Res. 48 (2009).
[45] S. Nagata, Mixing. Principles and Applications, John Wiley & Sons Inc., NewYork, 1975.
[46] M. Ciofalo, Turbulent flow in closed and free surface unbaffled tanks stirred byradial impellers, Chem. Eng. Sci. 51 (14) (1996) 3557–3573.
[47] G. Trägård, Fundamentals and Applications in Membrane Emulsification.NanoMemCourse Italy, 2010.
[48] M.A. Suárez, G. Gutiérrez, J. Coca, C. Pazos. Stirred tank membrane emulsifica-tion using flat metallic membranes: a dimensional analysis, Chem. Eng.Process., 69, 2013, 31–43.
[49] M.A. Suárez, G. Gutiérrez, J. Coca, C. Pazos, Geometric parameters influencingproduction of O/W emulsions using flat metallic membranes and scale-up,J. Membr. Sci. 430 (2013) 140–149.
[50] M. Rayner, Manufacturing Method of a Membrane and a Membrane Thereof,for Emulsification, Patent Application No. PCT/SE2007/000490, 2007.
[51] S. Sugiura, M. Nakajima, N. Kumazawa, S. Iwamoto, M. Seki, Characterization ofspontaneous transformation-based droplet formation during microchannelemulsification, J. Phys. Chem. B. 106 (2002) 9405–9409.
[52] M.L.J. Steegmans, C.G.P.H. Schroën, R.M. Boom, Generalised insights in dropletformation at T-junction through statistical analysis, Chem. Eng. Sci. 64 (2009)3042–3050.
[53] M. Kukizaki, Shirasu porous glass (SPG) membrane emulsification in theabsence of shear flow at the membrane surface: influence of surfactant typeand concentration, viscosities of dispersed and continuous phases, andtransmembrane pressure, J. Membr. Sci. 327 (2009) 234–243.
[54] I. Kobayashi, S. Mukataka, M. Nakajima, Effect of slot aspect ratio on dropletformation from silicon straight-through microchannels, J. Colloid Interface Sci.279 (2004) 277–280.
[55] A.A. Maan, K. Schroën, R. Boom, Spontaneous droplet formation techniques formonodisperse emulsions preparation-perspectives for food applications,J. Food Eng. 107 (2011) 334–346.
[56] M. Yasuno, M. Nakajima, S. Iwamoto, T. Maruyama, S. Sugiura, I. Kobayashi,A. Shono, K. Satoh, Visualization and characterization of SPG membraneemulsification, J. Membr. Sci. 210 (2002) 29–37.
[57] N.C. Christov, D.N. Ganchev, N.D. Vassileva, N.D. Denkov, K.D. Danov,P.A. Kralchevsky, Capillary mechanisms in membrane emulsification: oil-in-water emulsions stabilized by Tween 20 and milk proteins, Colloids Surf. A:Physicochem. Eng. Aspects 209 (2002) 83–104.
[58] Q. Yuan, R.A. Williams, S. Biggs, Surfactant selection for accurate size control ofmicrocapsules using membrane emulsification, Colloids Surf. A: Physicochem.Eng. Aspects 347 (2009) 97–103.
[59] G. Gutiérrez, M. Rayner, P. Dejmek, Production of vegetable oil in milkemulsions using membrane emulsification, Desalination 245 (2009) 631–638.
M. Matos et al. / Journal of Membrane Science 444 (2013) 345–358358
Results
38
Supporting information
Emulsification with microfiltration ceramic membranes: a different approach to droplet formation mechanism
María Matos, Miguel Suárez, Gemma Gutiérrez, José Coca, Carmen Pazos*
Department of Chemical and Environmental Engineering, University of Oviedo, Julián
Clavería 8, 33006 Oviedo, Spain
*Corresponding author: Prof. C. Pazos
Tel: +34 985103509;
Fax: +34 985103434
E-mail address: [email protected]
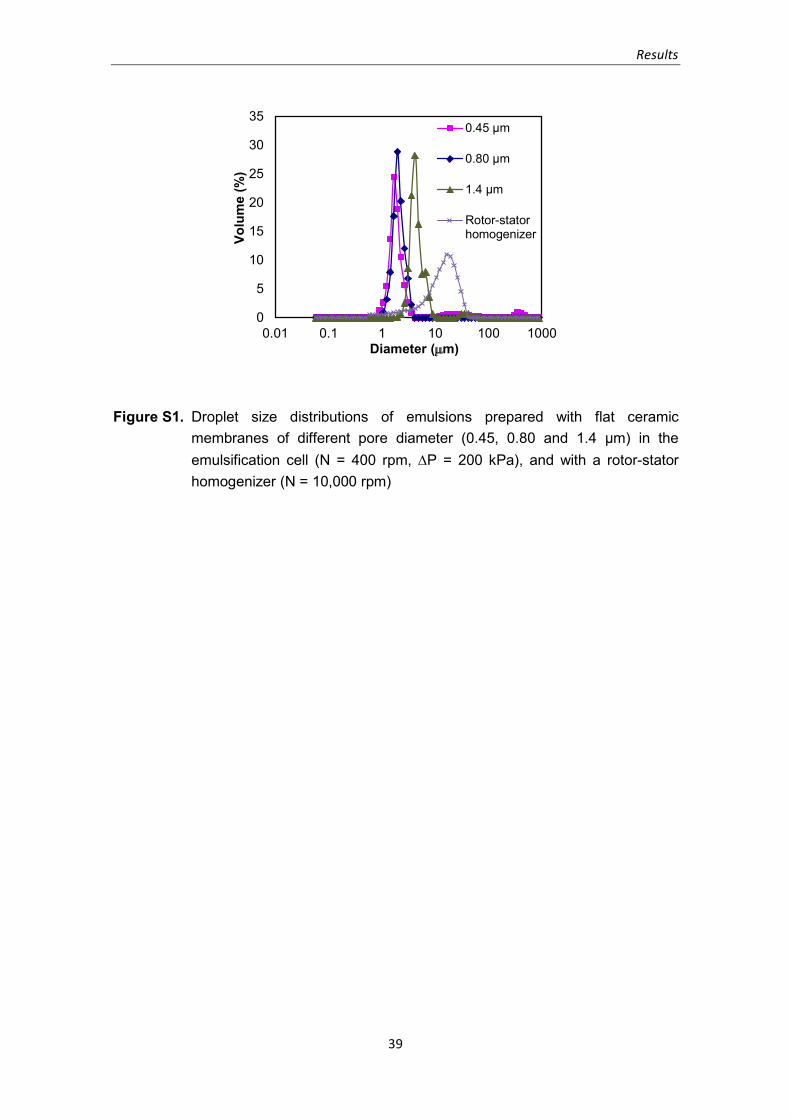
Results
39
Supporting information
Emulsification with microfiltration ceramic membranes: a different approach to droplet formation mechanism
María Matos, Miguel Suárez, Gemma Gutiérrez, José Coca, Carmen Pazos*
Department of Chemical and Environmental Engineering, University of Oviedo, Julián
Clavería 8, 33006 Oviedo, Spain
*Corresponding author: Prof. C. Pazos
Tel: +34 985103509;
Fax: +34 985103434
E-mail address: [email protected]
0
5
10
15
20
25
30
35
0.01 0.1 1 10 100 1000
Volu
me
(%)
Diameter (µm)
0.45 µm
0.80 µm
1.4 µm
Rotor-statorhomogenizer
Figure S1. Droplet size distributions of emulsions prepared with flat ceramic membranes of different pore diameter (0.45, 0.80 and 1.4 µm) in the emulsification cell (N = 400 rpm, ∆P = 200 kPa), and with a rotor-stator homogenizer (N = 10,000 rpm)
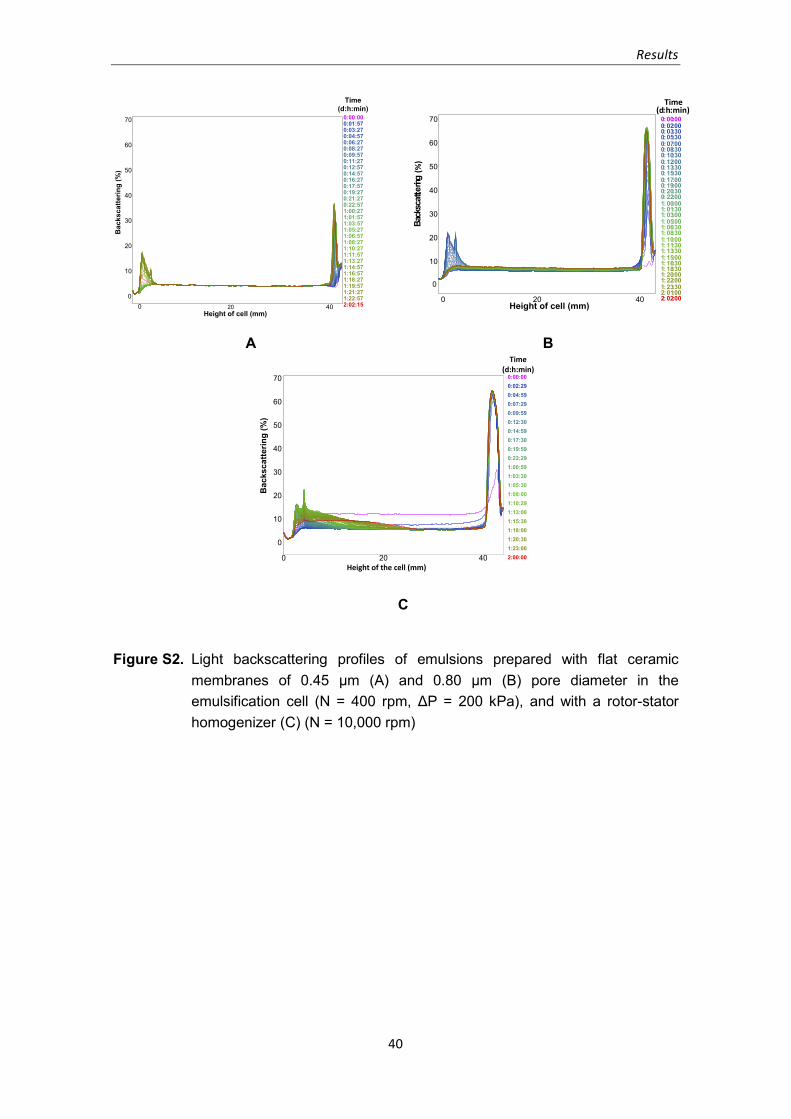
Results
40
Results
41
II. Preparation and encapsulation properties of double Pickering emulsions stabilized by Quinoa starch granules
Progress in the development of stable double emulsions as food ingredients intends to replace small-‐molecule emulsifiers and synthetic polymeric stabilizing agents by food-‐grade components. One way to produce systems with high stability is using Pickering type emulsions. The use of particles to stabilize emulsions has received considerable attention and research has been conducted to determine their distinctive characteristics and technological applications in a variety of fields. There are several particles reported in the literature for stabilizing Pickering emulsions, being starch one of the most common ingredients in food applications. Starch shows novel and useful emulsifying properties after its hydrophobic modification. In previous studies starch granules isolated from Quinoa were modified with Octenyl Succinic Anhydride (OSA) and used to produce Pickering emulsions with excellent stability. So, we thought that a double emulsion could be a good choice to achieve encapsulation of hydrophilic ingredients. For this purpose, double Pickering emulsions stabilized with starch granules were prepared, and their encapsulation stability was determined.
Article 2. M. Matos, A. Timgren, M. Sjöö, P. Dejmek and M. Rayner. “Preparation and encapsulation properties of double Pickering emulsions stabilized by Quinoa starch granules”.
Colloids and Surfaces A: Physicochemical and Engineering Aspects 423 (2013) 147-‐153.
Personal contribution to work
This work was carried out during my stay at the Department of Food, Engineering and Nutrition of University of Lund (Sweden). After understanding double emulsions behaviour, I performed the experiments that led to the results included in this publication. Finally, I collaborated in the manuscript and figures preparation under Prof. Petr Dejmek’s supervision.
Time(d:h:min)
Bac
ksca
tterin
g(%
)
20 400
10
20
30
40
50
60
70 0:00:000:01:570:03:270:04:570:06:270:08:270:09:570:11:270:12:570:14:570:16:270:17:570:19:270:21:270:22:571:00:271:01:571:03:571:05:271:06:571:08:271:10:271:11:571:13:271:14:571:16:571:18:271:19:571:21:271:22:572:02:150
Height of cell (mm)
20 40
0
10
20
30
40
50
60
70 0:00:000:02:000:03:300:05:300:07:000:08:300:10:300:12:000:13:300:15:300:17:000:19:000:20:300:22:001:00:001:01:301:03:001:05:001:06:301:08:301:10:001:11:301:13:301:15:001:16:301:18:301:20:001:22:001:23:302:01:002:02:000
Height of cell (mm)
Time(d:h:min)
Back
sca
tterin
gt
(%)
A B
Bac
ksca
tterin
g(%
)
0 20 40
0
10
20
30
40
50
60
70 0:00:000:02:290:04:590:07:290:09:590:12:300:14:590:17:300:19:590:22:291:00:591:03:301:05:301:08:001:10:291:13:001:15:301:18:001:20:301:23:002:00:00
Time(d:h:min)
Height of the cell (mm)
C
Figure S2. Light backscattering profiles of emulsions prepared with flat ceramic membranes of 0.45 µm (A) and 0.80 µm (B) pore diameter in the emulsification cell (N = 400 rpm, ΔP = 200 kPa), and with a rotor-stator homogenizer (C) (N = 10,000 rpm)
Resultados
42
II. Preparación y propiedades de encapsulación de emulsiones dobles tipo Pickering estabilizadas mediante gránulos de almidón procedentes de la Quinoa
El avance en el desarrollo de emulsiones dobles estables con fines alimentarios depende de la sustitución de las pequeñas moléculas de emulsionantes y agentes estabilizantes poliméricos sintéticos por componentes de grado alimentario. Una forma de producir sistemas de elevada estabilidad es utilizar emulsiones tipo Pickering. El uso de partículas para estabilizar emulsiones ha recibido un interés considerable y creciente en los últimos tiempos, debido a sus características distintivas y a sus prometedoras aplicaciones tecnológicas en diversos ámbitos. En la bibliografía, se encuentran referencias a numerosos tipos de partículas capaces de estabilizar emulsiones tipo Pickering, siendo el almidón uno de los ingredientes alimentarios más comunes, el cual se ha demostrado que presenta buenas propiedades emulsionantes después de una modificación hidrófoba. En estudios anteriores, se modificaron gránulos de almidón aislados procedentes de la Quinoa con anhídrido octenil succínico (OSA) y se utilizaron para producir emulsiones tipo Pickering con excelente estabilidad. Por ello, pensamos que una emulsión doble de tipo agua-‐aceite-‐agua podría resultar un sistema adecuado para encapsular ingredientes de tipo hidrófilo. Para ello, se prepararon emulsiones dobles tipo Pickering estabilizadas con gránulos de almidón modificados y se determinó su estabilidad de encapsulación con el tiempo.
Artículo 2. M. Matos, A. Timgren, M. Sjöö, P. Dejmek y M. Rayner. “Preparation and encapsulation properties of double Pickering emulsions stabilized by quinoa starch granules”.
Colloids and Surfaces A: Physicochemical and Engineering Aspects 423 (2013) 147-‐153.
Aportación personal al trabajo
Llevé a cabo este trabajo durante mi estancia en el Departamento de Food, Engineering and Nutrition de la Universidad de Lund (Suecia). Allí me inicié en el conocimiento sobre emulsiones dobles y realicé la experimentación reflejada en este artículo. Finalmente, participé en la redacción del manuscrito y en la elaboración de las figuras en él incluidas, bajo la supervisión del Prof. Petr Dejmek.
Results
43
Results
43
Colloids and Surfaces A: Physicochem. Eng. Aspects 423 (2013) 147–153
Contents lists available at SciVerse ScienceDirect
Colloids and Surfaces A: Physicochemical andEngineering Aspects
journa l homepage: www.e lsev ier .com/ locate /co lsur fa
Preparation and encapsulation properties of double Pickeringemulsions stabilized by quinoa starch granules
María Matosa, Anna Timgrenb,1, Malin Sjööb, Petr Dejmekb, Marilyn Raynerb,∗
a Department of Chemical Engineering and Environmental Technology, University of Oviedo, Spainb Department of Food Technology, Engineering, and Nutrition, Lund University, Lund, Sweden
h i g h l i g h t s
� Quinoa starch granule stabilizedW/O/W double Pickering emulsionswere prepared.
� Encapsulation stability of ahydrophilic inner water phase as afunction of time was determined.
� Initial encapsulation efficiency wasover 98.5% immediately after emul-sification.
� The encapsulation stability remainedover 90% after 21 days.
g r a p h i c a l a b s t r a c t
Release of hydrophilic marker from Quinoa starch granule stabilized double emulsions.
a r t i c l e i n f o
Article history:Received 10 September 2012Received in revised form 2 January 2013Accepted 22 January 2013Available online 8 February 2013
Keywords:Double emulsionsStarch granuleEncapsulationPickering emulsions
a b s t r a c t
Double emulsions have potential applications in the food, cosmetic and pharmaceutical industries asvehicles for encapsulation and delivery of nutrients during food digestion or for drug release. The majordrawback of this type of emulsions is that they are often difficult to stabilize. Particle stabilized emul-sions, known as Pickering emulsions, show special features, such as being extremely stable with respectto coalescence. Starch granules have proved to be a suitable stabiliser for food grade Pickering emulsions.In this work, starch double W1/O/W2 Pickering emulsions were prepared and their encapsulation stabil-ity was studied as well as the impact of varying the lipophilic emulsifier (PGPR90) content and the saltconcentration in the W1 inner aqueous phase. Encapsulation properties were quantified by monitoringthe release of a hydrophilic dye from the inner aqueous phase spectrophotometrically. Two double emul-sion systems were studied, one with an inner aqueous phase with 0.1 M NaCl and the other with 0.2 MNaCl. The initial encapsulation efficiency was over 98.5% immediately after emulsification production.The encapsulation stability (ES) remained over 90% after 21 days for both systems studied, where 0.1 MNaCl W1 emulsion had a ES of 95.2% and the 0.2 M NaCl W1 emulsion had a ES of 91.1% respectively.
© 2013 Elsevier B.V. All rights reserved.
1. Introduction
The simplest multiple emulsions are called double emulsionsand are ternary systems, having either a water-in-oil-in-water(W1/O/W2) or an oil-in-water-in-oil (O1/W/O2) structure, wherebythe dispersed droplets contain smaller droplets of a different phase
∗ Corresponding author. Tel.: +46 46 222 4743; fax: +46 46 222 4622.E-mail address: [email protected] (M. Rayner).
1 deceased Nov 12th, 2012
[1] essentially an emulsion in an emulsion. Multiple emulsionshave been studied since their first description in 1924 by Seifriz[2]. The structural properties of this kind of multiple emulsionsallow a controlled release of a component from the inner to theouter phase which leads to a number of potential applications inthe fields of medicine, pharmacy, cosmetics and separation pro-cesses [1,3–10]. Double emulsions have also applications in thefood industry [4,9,11–16].
Water-in-oil-in-water (W1/O/W2) type emulsions considered inthis study have several food applications such as in the formulationof reduced fat-food products (by replacing some of the volume of
0927-7757/$ – see front matter © 2013 Elsevier B.V. All rights reserved.http://dx.doi.org/10.1016/j.colsurfa.2013.01.060
Results
44
148 M. Matos et al. / Colloids and Surfaces A: Physicochem. Eng. Aspects 423 (2013) 147–153
the oil droplets with entrapped water drops) and as vehicles forencapsulation and delivery of hydrophilic nutrients [12]. For exam-ple to fortify foods with water soluble vitamins [17–19] or minerals[20], to entrap poorly tasting bio-actives in taste-masking appli-cations, and to protect probiotics against the harsh effects of bileacids and gastric juices [21]. Through designing W/O/W structuretaste perception can be controlled modifying the release of internalaqueous phase which interacts with oral surfaces [12]. Sensory testshave indicated that there is a significant taste difference betweenW/O/W emulsions in which there is a delayed release of flavour andO/W emulsions containing the same ingredients [8].
The main reasons why W1/O/W2 emulsions have not been yetwidely used is that they are more complicated to produce becausethey have an additional internal surface (and the excess free energyassociated with it) of the W1/O emulsion which needs to be sta-bilized in addition to the surface of the secondary emulsion [1].Furthermore homogenisation conditions must also be such thatthey can create the secondary emulsion but at the same timekeep the primary W1/O emulsion more or less intact. Progress inthe development of stable double emulsions as food ingredientsdepends on replacing small-molecule emulsifiers and syntheticpolymeric stabilizing agents by food-grade components . One wayto produce emulsions with a high degree of stability is throughthe use of Pickering type emulsions. The use of particles to sta-bilize emulsions has received substantial and increasing researchinterest as of late due to their distinctive characteristics and promis-ing technological applications in a range of fields including foods.The stabilization of emulsion droplets by particles is possible dueto their partial dual wettability. This allows for the spontaneousaccumulation of particles at the oil–water interface and stabilizingit against coalescence by volume exclusion and steric hindrances[22], i.e. the particles prevent oil–water interfaces of oil dropletsfrom coming in to direct physical contact.
There are numerous varieties of particles reported in the litera-ture for stabilizing Pickering type emulsions, and due to advancesin nano technology and micro-manufacturing their availabilityand design ability will no-doubt increase in the future. Exampleswhere food based/edible stabilizing particles have been studiedhave included: fat crystals, globular proteins and aggregated hydro-colloids [10], insoluble flavonoid particles [24], cellulose–ethylcellulose complexes for stabilizing emulsions and foams [25],freeze fractured starch granules and protein mixtures [25,26], andchitin-nano crystals stabilized emulsions [27]. For comprehensivereviews on particle stabilized emulsions, applications and relatedtheory please refer to [28], Aveyard et al. [22] Hunter et al. [29], andfor food emulsion in particular see [23,30]. Recent work where Pick-ering type double emulsions have been studies include those usingfat-crystals to stabilize the inner emulsion of a W/O/W emulsions[31] and combinations of fat-crystals and particles producing highlystable Pickering-in-Pickering double emulsions. This novel designenables food technologists to achieve a significant fat replacementin a way that is imperceptible to the consumer [32].
Starch is one of the most common food ingredients, and afterhydrophobic modification intact starch granules has been shownto have novel and useful emulsifying properties [20,33–35]. In ourprevious studies starch granules isolated form quinoa were mod-ified with octenyl succinic anhydride (OSA) and used to producePickering emulsions with excellent stability. Quinoa starch gran-ules were chosen as Pickering agents because the granules arerelatively small (0.5–3 �m in diameter) with a unimodal size dis-tribution. Small size is of interest as it reduces the amount required(mg starch per ml oil) to stabilize a given emulsion droplet inter-face. The size of the emulsion drops produced were a function ofthe starch to oil ratio used, but were independent of the overalldispersed phase content over a range of 7–33% v/v oil [37]. Fur-thermore these emulsions have shown an outstanding degree of
stability being un-changed after 2 years of storage under peri-kinetic conditions [35]. By taking advantage of starches’ distinctivephysical–chemical characteristics and careful application of heatwe have been able to increase the cohesively of the partially gela-tinized starch layer to increase resistance to lipolysis by up to 70%[37]. Although the drop size of starch granule stabilized emulsionswas relatively large, their excellent stability and barrier propertiescan prove suitable for applications such as encapsulation of variousingredients in food and pharmaceutical products with the starchparticles controlling the release properties. In order to achieveencapsulation of hydrophilic ingredients a double emulsion sys-tem may be a good choice of system. Thus, in this study, starchgranule stabilized double Pickering emulsions were prepared andtheir encapsulation stability of a hydrophilic inner water phase asa function of time was determined.
2. Materials
Starch was isolated form quinoa (Biofood-Biolivs AB, Sweden)by a wet-milling process and OSA-modified with a degree of sub-stitution of 1.8% using the method described in Rayner et al. [33](processed by Lyckeby-Culinar AB, Sweden). The external waterphase of the double emulsions (W2) was a 5 mM phosphate bufferwith 0.2 M NaCl. As internal water phase (W1) two (0.1 M and0.2 M NaCl) solutions were used. The oil phase was the medium-chain triglyceride oil Miglyol 812, density 945 kg/m3 at 20 ◦C (SasolGmbH, Germany) was prepared containing several concentra-tions (1–5% w/v) of polyglycerol polyricinoleate PGPR 90 (GrinstedDanisco AS, Denmark). Polyglycerol polyricinoleate (PGPR) is apowerful water-in-oil emulsifying agent commonly used withlimited concentrations in food formulations [9]. The encapsula-tion efficiency was determined with carmine, an approved pigmentfood colouring agent (E120). It is stable to heat and light but sen-sitive to low and high pH. At neutral pH it has a bright red colourwith a maximum UV light absorption at 520 nm [38]. Carmine waspurchased as commercial water-soluble red dye solution from thelocal supermarket (Ekströms röd hushållsfärg, Procordia Foods AB,Sweden).
3. Methods
3.1. Preparation of primary (W1/O) water in oil emulsions
Water in oil emulsions (W1/O), 20% W1 and 80% oil-phase witha total volume of 7 mL were prepared. The W1 disperse phase wasdeionized water containing carmine dye solution (4 �L dye/mLdeionised water) with the corresponding amount of NaCl addedto obtain either 0.1 M or 0.2 M. The continuous oil phase consistedof Miglyol 812 with varying concentrations 1–5% (w/v) of PGPR90as lipophilic surfactant dissolved into it by stirring the oil phase in acovered container at 25–30 ◦C for 1 h at 240 rpm. The 5.6 mL of con-tinuous and 1.4 mL of dispersed phase were emulsified in glass testtubes by high shear mixing in an Ystral X10 mixer (Ystral GmbH,Germany) with 6 mm dispersing tool at 24,000 rpm for 10 min.
3.2. Preparation of double W1/O/W2 emulsions
Double Pickering (W1/O/W2) emulsions consisting of totalphase volumes: 8.25% v/v internal aqueous phase containingcarmine dye (W1), 33% v/v Miglyol 812 oil phase including 5% w/vPGPR (O), and 58.75% v/v outer aqueous phase (W2). The total dis-persed phase fraction was 41.25%. A sodium phosphate buffer wasused in the outer aqueous phase as it has been shown to enablethe separation of oil droplets by centrifugation and also promotesa more accurate measurement of some polymeric dyes, used as
Results
45
M. Matos et al. / Colloids and Surfaces A: Physicochem. Eng. Aspects 423 (2013) 147–153 149
markers, in the recovered outer aqueous phase [39]. This is impor-tant us to be able to quantify the encapsulation efficiency andstability described in Section 3.4. The amount of granules (214 mgper ml of oil) was based on our previous studies on simple starchPickering emulsions [37].
The preparations of the double emulsions are as follows: first4.1 mL of W2 containing 5 mM phosphate buffer with pH 7.0 and0.2 M NaCl in deionized water was added to a glass test tube with494 mg of 1.8% OSA modified quinoa starch (214 mg/mL Miglyol812 oil) and then throughly dispersed using a vortex mixer. Then2.9 mL of the W1/O primary emulsion prepared as described abovewas added to the W2 starch dispersion in the glass test tube andemulsified using an Ystral X10 mixer with 6 mm dispersing tool at22,000 rpm for 30 s. All the emulsions were prepared in triplicatefor each analysis time and stored at room temperature.
A sodium phosphate buffer was used as outer aqueous phaseas it has been shown to enable the separation of oil droplets bycentrifugation and also promotes a more accurate measurementof some polymeric dyes, used as markers, in the recovered outeraqueous phase [35]. This is important us to be able to quantify theencapsulation efficiency and stability described in Section 3.4.
3.3. Emulsion characterization
Particle size distributions of the emulsions prepared were mea-sured by laser diffraction using a Malvern Particle Size Analyzer(Mastersizer 2000 S, Malvern Instruments Ltd. UK). For starchcovered double emulsions dispersed in an aqueous phase a refrac-tive index of 1.54 was used [40]. In case of the W1/O emulsionthe water refractive index was used and the samples were dis-persed in paraffin oil (Petromax, Germany). Micrographs of theemulsions were obtained with a light microscope (Olympus BX50,Tokyo, Japan) with 10–100× magnification and digital camera (DFK41AF02, Imaging source, Germany) with the software ImageJ (NIH,version 1.42 m) one day after emulsification.
3.4. Determination of the recovery yield of the marker,encapsulation efficiency and stability of the double emulsion
The encapsulation efficiency is related to the initial amountof marker lost from the W1 phase into the W2 phase during theemulsification process creating the final double emulsions and theemulsification stability is a measure of how much of the markerleaks from the internal W1 phase into the outer continuous W2phase during storage. It may be considered that a double emul-sion has a good stability when the initial encapsulation efficiencyis around 95% and after a few weeks of storage it is still around70–80% [12,41].
In order to measure marker concentration in the external W2phase in a spectrophotometer it has to be separated from the emul-sion drops and free starch particles. Centrifugation is the mostcommon and simple method of separation used for measuring theencapsulation stability of double emulsions, where the oily phasecontaining the small W1 droplets (cream phase) is separated fromthe outer aqueous phase (W2) [4,13,41].
In this study the samples were centrifuged for 10 min at4000 rpm and the subnatant aqueous phase was then recoveredcarefully with a Pasteur pipette and filtered using a 0.2 �m syringefilter of polyethersulfone (PES). To determine the concentration ofthe carmine dye used as a marker present in the external aque-ous phase a calibration curve was prepared by measuring theabsorbance values of several solutions of known concentration. Themarker was dissolved in the same sodium phosphate buffer used asexternal phase (pH 7.0 and 0.2 M NaCl) and in the same concentra-tions as added to the inner aqueous phase. The absorbance valueswere determined using a UV–visible spectrophotometer (Hitachi
U-1500) at 520 nm. The calibration curve had a good correlationcoefficient (r2 = 1) over the relevant range of concentrations mea-sured.
To determine properly the encapsulation efficiency or encapsu-lation stability of a system it is necessary to know the recovery yieldof the marker used after the separation of the external aqueousphase, in this case after isolating the subnatant after centrifugationand filtration. The reason being to ensure that if some of the markerinteracts with the starch or oil or containers or is in some way lostduring the separation and analysis it can be accounted for in thecalibration curve. Thus by adding 100% of the inner phase to in theouter aqueous phase, simulating as if the emulsion had completelylost its W1 phase to the outer continuous phase we create a standardto determine the recovery yield of the marker from the emulsion[12]. For this purpose a simple oil-in-water emulsion (O/W2) wasprepared using the same oily phase (O) and the same outer aqueousphase (W2) as in the double emulsions. Then the O/W2 emulsionwas diluted with the same proportion of inner aqueous phase (W1)containing the red dye at the same concentrations used for thepreparation of the double emulsions. The concentration of dye inthe recovered aqueous phases was calculated from the absorbancevalues of the calibration curve. This concentration was then com-pared to the actual concentration initially added to the water phaseused for dilution. To determine the value of the corresponding ref-erence blank, O/W2 emulsions were prepared and diluted by addingthe same proportion of W1 but without dye. Several standard sam-ples (n = 11) were prepared and the absorbance of the aqueousphases recovered by centrifugation and filtration were measured.Using the calibration absorbance curve the concentration of dyein the recovered water phase was determined (Crecovered) and therecovery yield (Ry) was calculated as:
Ry(%) = Crecovered × 100C0
(1)
where C0 is the expected concentration based on the amount ofmarker added.
The recovery yield of our marker after centrifugation and filtra-tion is 51% ± 2 of the freshly prepared O/W2. Although 51% could beconsidered as a rather low recovery yield, the method had a highdegree of reproducibility over the concentrations tested.
The encapsulation efficiency of a double emulsion can be definedas the percentage of primary emulsion aqueous phase that isretained in the inner aqueous phase (W1) after the second emulsi-fication step on manufacture of the W1/O/W2.
The encapsulation efficiency (EE) was then determined by mea-suring the concentration of dye present in the external water phaseapplying the described method but replacing O/W2 by W1/O/W2.The encapsulation efficiency was calculated using the followingequations:
EE(%) = 100 − Crecovered × 100RyC0
(2)
In Eq. (2) the encapsulation efficiency is related to the concen-tration initially added to the inner aqueous phase and includesthe correction of the recovery yield of marker. The encapsulationstability (ES) can be defined as the amount of the aqueous phasemarker which remains entrapped in the inner aqueous phase (W1)on storage or by exposure of the double emulsion to environmentalstresses [41]. Thus, the encapsulation stability was calculated usingthe equation:
ES(%) = 100 − Ct × 100RyC0
(3)
where Ct is the recovered phase concentration of marker afterstorage time, t. For determining the encapsulation stability withtime samples were prepared and stored at room temperature. The
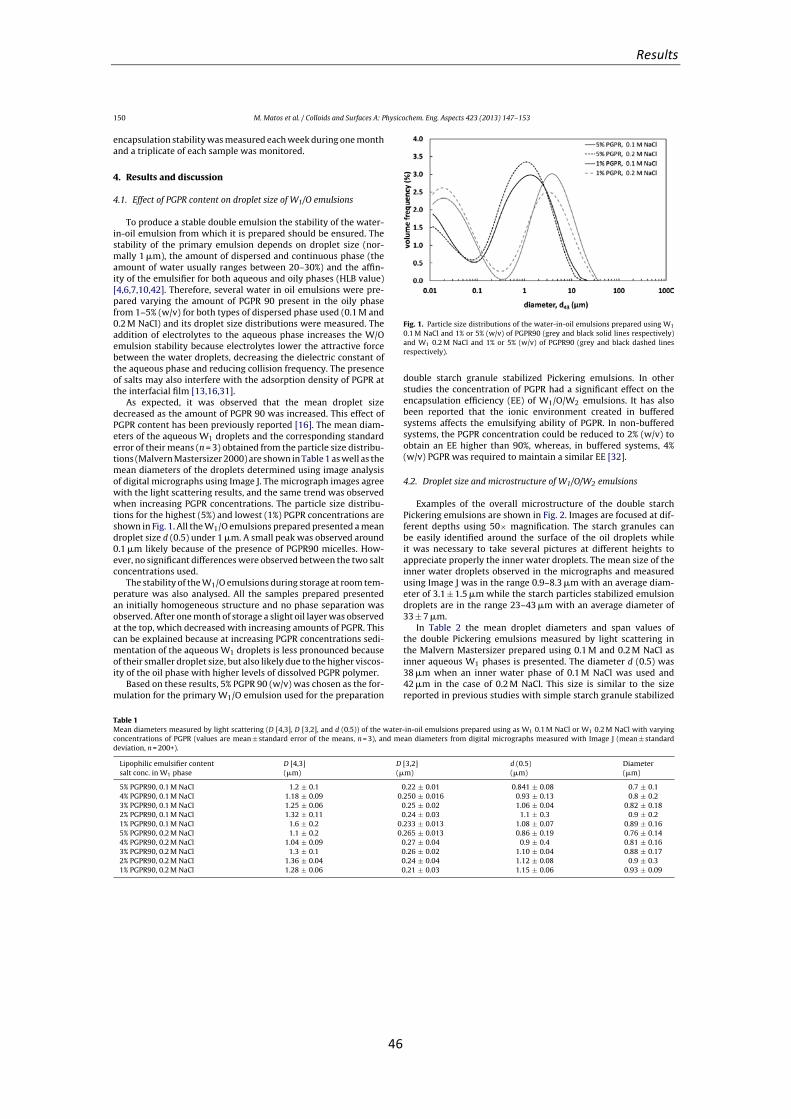
Results
46
150 M. Matos et al. / Colloids and Surfaces A: Physicochem. Eng. Aspects 423 (2013) 147–153
encapsulation stability was measured each week during one monthand a triplicate of each sample was monitored.
4. Results and discussion
4.1. Effect of PGPR content on droplet size of W1/O emulsions
To produce a stable double emulsion the stability of the water-in-oil emulsion from which it is prepared should be ensured. Thestability of the primary emulsion depends on droplet size (nor-mally 1 �m), the amount of dispersed and continuous phase (theamount of water usually ranges between 20–30%) and the affin-ity of the emulsifier for both aqueous and oily phases (HLB value)[4,6,7,10,42]. Therefore, several water in oil emulsions were pre-pared varying the amount of PGPR 90 present in the oily phasefrom 1–5% (w/v) for both types of dispersed phase used (0.1 M and0.2 M NaCl) and its droplet size distributions were measured. Theaddition of electrolytes to the aqueous phase increases the W/Oemulsion stability because electrolytes lower the attractive forcebetween the water droplets, decreasing the dielectric constant ofthe aqueous phase and reducing collision frequency. The presenceof salts may also interfere with the adsorption density of PGPR atthe interfacial film [13,16,31].
As expected, it was observed that the mean droplet sizedecreased as the amount of PGPR 90 was increased. This effect ofPGPR content has been previously reported [16]. The mean diam-eters of the aqueous W1 droplets and the corresponding standarderror of their means (n = 3) obtained from the particle size distribu-tions (Malvern Mastersizer 2000) are shown in Table 1 as well as themean diameters of the droplets determined using image analysisof digital micrographs using Image J. The micrograph images agreewith the light scattering results, and the same trend was observedwhen increasing PGPR concentrations. The particle size distribu-tions for the highest (5%) and lowest (1%) PGPR concentrations areshown in Fig. 1. All the W1/O emulsions prepared presented a meandroplet size d (0.5) under 1 �m. A small peak was observed around0.1 �m likely because of the presence of PGPR90 micelles. How-ever, no significant differences were observed between the two saltconcentrations used.
The stability of the W1/O emulsions during storage at room tem-perature was also analysed. All the samples prepared presentedan initially homogeneous structure and no phase separation wasobserved. After one month of storage a slight oil layer was observedat the top, which decreased with increasing amounts of PGPR. Thiscan be explained because at increasing PGPR concentrations sedi-mentation of the aqueous W1 droplets is less pronounced becauseof their smaller droplet size, but also likely due to the higher viscos-ity of the oil phase with higher levels of dissolved PGPR polymer.
Based on these results, 5% PGPR 90 (w/v) was chosen as the for-mulation for the primary W1/O emulsion used for the preparation
Fig. 1. Particle size distributions of the water-in-oil emulsions prepared using W1
0.1 M NaCl and 1% or 5% (w/v) of PGPR90 (grey and black solid lines respectively)and W1 0.2 M NaCl and 1% or 5% (w/v) of PGPR90 (grey and black dashed linesrespectively).
double starch granule stabilized Pickering emulsions. In otherstudies the concentration of PGPR had a significant effect on theencapsulation efficiency (EE) of W1/O/W2 emulsions. It has alsobeen reported that the ionic environment created in bufferedsystems affects the emulsifying ability of PGPR. In non-bufferedsystems, the PGPR concentration could be reduced to 2% (w/v) toobtain an EE higher than 90%, whereas, in buffered systems, 4%(w/v) PGPR was required to maintain a similar EE [32].
4.2. Droplet size and microstructure of W1/O/W2 emulsions
Examples of the overall microstructure of the double starchPickering emulsions are shown in Fig. 2. Images are focused at dif-ferent depths using 50× magnification. The starch granules canbe easily identified around the surface of the oil droplets whileit was necessary to take several pictures at different heights toappreciate properly the inner water droplets. The mean size of theinner water droplets observed in the micrographs and measuredusing Image J was in the range 0.9–8.3 �m with an average diam-eter of 3.1 ± 1.5 �m while the starch particles stabilized emulsiondroplets are in the range 23–43 �m with an average diameter of33 ± 7 �m.
In Table 2 the mean droplet diameters and span values ofthe double Pickering emulsions measured by light scattering inthe Malvern Mastersizer prepared using 0.1 M and 0.2 M NaCl asinner aqueous W1 phases is presented. The diameter d (0.5) was38 �m when an inner water phase of 0.1 M NaCl was used and42 �m in the case of 0.2 M NaCl. This size is similar to the sizereported in previous studies with simple starch granule stabilized
Table 1Mean diameters measured by light scattering (D [4,3], D [3,2], and d (0.5)) of the water-in-oil emulsions prepared using as W1 0.1 M NaCl or W1 0.2 M NaCl with varyingconcentrations of PGPR (values are mean ± standard error of the means, n = 3), and mean diameters from digital micrographs measured with Image J (mean ± standarddeviation, n = 200+).
Lipophilic emulsifier contentsalt conc. in W1 phase
D [4,3](�m)
D [3,2](�m)
d (0.5)(�m)
Diameter(�m)
5% PGPR90, 0.1 M NaCl 1.2 ± 0.1 0.22 ± 0.01 0.841 ± 0.08 0.7 ± 0.14% PGPR90, 0.1 M NaCl 1.18 ± 0.09 0.250 ± 0.016 0.93 ± 0.13 0.8 ± 0.23% PGPR90, 0.1 M NaCl 1.25 ± 0.06 0.25 ± 0.02 1.06 ± 0.04 0.82 ± 0.182% PGPR90, 0.1 M NaCl 1.32 ± 0.11 0.24 ± 0.03 1.1 ± 0.3 0.9 ± 0.21% PGPR90, 0.1 M NaCl 1.6 ± 0.2 0.233 ± 0.013 1.08 ± 0.07 0.89 ± 0.165% PGPR90, 0.2 M NaCl 1.1 ± 0.2 0.265 ± 0.013 0.86 ± 0.19 0.76 ± 0.144% PGPR90, 0.2 M NaCl 1.04 ± 0.09 0.27 ± 0.04 0.9 ± 0.4 0.81 ± 0.163% PGPR90, 0.2 M NaCl 1.3 ± 0.1 0.26 ± 0.02 1.10 ± 0.04 0.88 ± 0.172% PGPR90, 0.2 M NaCl 1.36 ± 0.04 0.24 ± 0.04 1.12 ± 0.08 0.9 ± 0.31% PGPR90, 0.2 M NaCl 1.28 ± 0.06 0.21 ± 0.03 1.15 ± 0.06 0.93 ± 0.09
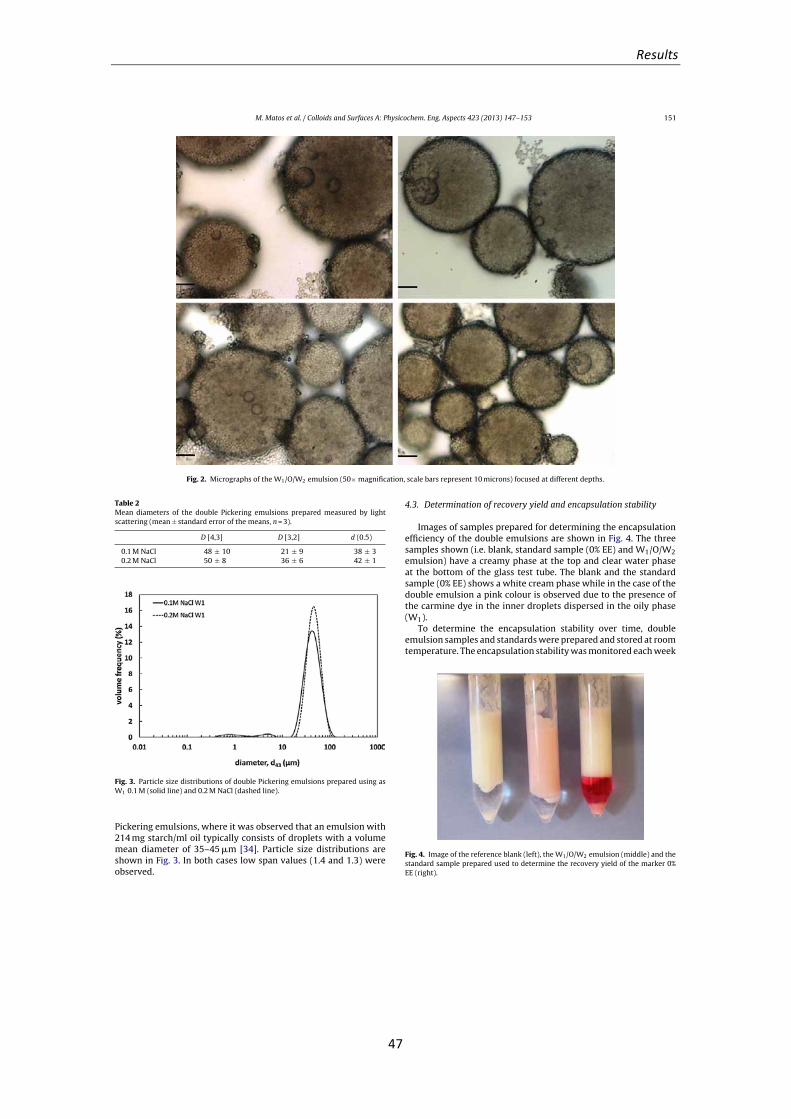
Results
47
M. Matos et al. / Colloids and Surfaces A: Physicochem. Eng. Aspects 423 (2013) 147–153 151
Fig. 2. Micrographs of the W1/O/W2 emulsion (50× magnification, scale bars represent 10 microns) focused at different depths.
Table 2Mean diameters of the double Pickering emulsions prepared measured by lightscattering (mean ± standard error of the means, n = 3).
D [4,3] D [3,2] d (0.5)
0.1 M NaCl 48 ± 10 21 ± 9 38 ± 30.2 M NaCl 50 ± 8 36 ± 6 42 ± 1
Fig. 3. Particle size distributions of double Pickering emulsions prepared using asW1 0.1 M (solid line) and 0.2 M NaCl (dashed line).
Pickering emulsions, where it was observed that an emulsion with214 mg starch/ml oil typically consists of droplets with a volumemean diameter of 35–45 �m [34]. Particle size distributions areshown in Fig. 3. In both cases low span values (1.4 and 1.3) wereobserved.
4.3. Determination of recovery yield and encapsulation stability
Images of samples prepared for determining the encapsulationefficiency of the double emulsions are shown in Fig. 4. The threesamples shown (i.e. blank, standard sample (0% EE) and W1/O/W2emulsion) have a creamy phase at the top and clear water phaseat the bottom of the glass test tube. The blank and the standardsample (0% EE) shows a white cream phase while in the case of thedouble emulsion a pink colour is observed due to the presence ofthe carmine dye in the inner droplets dispersed in the oily phase(W1).
To determine the encapsulation stability over time, doubleemulsion samples and standards were prepared and stored at roomtemperature. The encapsulation stability was monitored each week
Fig. 4. Image of the reference blank (left), the W1/O/W2 emulsion (middle) and thestandard sample prepared used to determine the recovery yield of the marker 0%EE (right).
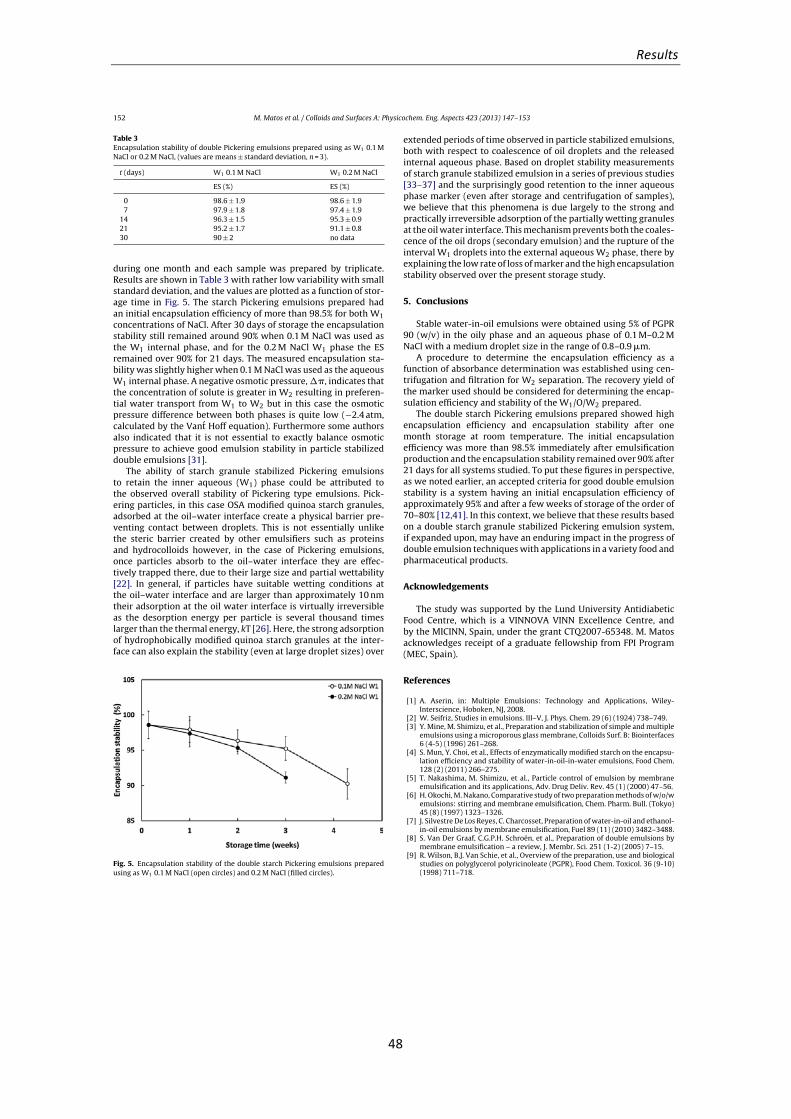
Results
48
152 M. Matos et al. / Colloids and Surfaces A: Physicochem. Eng. Aspects 423 (2013) 147–153
Table 3Encapsulation stability of double Pickering emulsions prepared using as W1 0.1 MNaCl or 0.2 M NaCl, (values are means ± standard deviation, n = 3).
t (days) W1 0.1 M NaCl W1 0.2 M NaCl
ES (%) ES (%)
0 98.6 ± 1.9 98.6 ± 1.97 97.9 ± 1.8 97.4 ± 1.9
14 96.3 ± 1.5 95.3 ± 0.921 95.2 ± 1.7 91.1 ± 0.830 90 ± 2 no data
during one month and each sample was prepared by triplicate.Results are shown in Table 3 with rather low variability with smallstandard deviation, and the values are plotted as a function of stor-age time in Fig. 5. The starch Pickering emulsions prepared hadan initial encapsulation efficiency of more than 98.5% for both W1concentrations of NaCl. After 30 days of storage the encapsulationstability still remained around 90% when 0.1 M NaCl was used asthe W1 internal phase, and for the 0.2 M NaCl W1 phase the ESremained over 90% for 21 days. The measured encapsulation sta-bility was slightly higher when 0.1 M NaCl was used as the aqueousW1 internal phase. A negative osmotic pressure, ��, indicates thatthe concentration of solute is greater in W2 resulting in preferen-tial water transport from W1 to W2 but in this case the osmoticpressure difference between both phases is quite low (−2.4 atm,calculated by the Vant Hoff equation). Furthermore some authorsalso indicated that it is not essential to exactly balance osmoticpressure to achieve good emulsion stability in particle stabilizeddouble emulsions [31].
The ability of starch granule stabilized Pickering emulsionsto retain the inner aqueous (W1) phase could be attributed tothe observed overall stability of Pickering type emulsions. Pick-ering particles, in this case OSA modified quinoa starch granules,adsorbed at the oil–water interface create a physical barrier pre-venting contact between droplets. This is not essentially unlikethe steric barrier created by other emulsifiers such as proteinsand hydrocolloids however, in the case of Pickering emulsions,once particles absorb to the oil–water interface they are effec-tively trapped there, due to their large size and partial wettability[22]. In general, if particles have suitable wetting conditions atthe oil–water interface and are larger than approximately 10 nmtheir adsorption at the oil water interface is virtually irreversibleas the desorption energy per particle is several thousand timeslarger than the thermal energy, kT [26]. Here, the strong adsorptionof hydrophobically modified quinoa starch granules at the inter-face can also explain the stability (even at large droplet sizes) over
Fig. 5. Encapsulation stability of the double starch Pickering emulsions preparedusing as W1 0.1 M NaCl (open circles) and 0.2 M NaCl (filled circles).
extended periods of time observed in particle stabilized emulsions,both with respect to coalescence of oil droplets and the releasedinternal aqueous phase. Based on droplet stability measurementsof starch granule stabilized emulsion in a series of previous studies[33–37] and the surprisingly good retention to the inner aqueousphase marker (even after storage and centrifugation of samples),we believe that this phenomena is due largely to the strong andpractically irreversible adsorption of the partially wetting granulesat the oil water interface. This mechanism prevents both the coales-cence of the oil drops (secondary emulsion) and the rupture of theinterval W1 droplets into the external aqueous W2 phase, there byexplaining the low rate of loss of marker and the high encapsulationstability observed over the present storage study.
5. Conclusions
Stable water-in-oil emulsions were obtained using 5% of PGPR90 (w/v) in the oily phase and an aqueous phase of 0.1 M–0.2 MNaCl with a medium droplet size in the range of 0.8–0.9 �m.
A procedure to determine the encapsulation efficiency as afunction of absorbance determination was established using cen-trifugation and filtration for W2 separation. The recovery yield ofthe marker used should be considered for determining the encap-sulation efficiency and stability of the W1/O/W2 prepared.
The double starch Pickering emulsions prepared showed highencapsulation efficiency and encapsulation stability after onemonth storage at room temperature. The initial encapsulationefficiency was more than 98.5% immediately after emulsificationproduction and the encapsulation stability remained over 90% after21 days for all systems studied. To put these figures in perspective,as we noted earlier, an accepted criteria for good double emulsionstability is a system having an initial encapsulation efficiency ofapproximately 95% and after a few weeks of storage of the order of70–80% [12,41]. In this context, we believe that these results basedon a double starch granule stabilized Pickering emulsion system,if expanded upon, may have an enduring impact in the progress ofdouble emulsion techniques with applications in a variety food andpharmaceutical products.
Acknowledgements
The study was supported by the Lund University AntidiabeticFood Centre, which is a VINNOVA VINN Excellence Centre, andby the MICINN, Spain, under the grant CTQ2007-65348. M. Matosacknowledges receipt of a graduate fellowship from FPI Program(MEC, Spain).
References
[1] A. Aserin, in: Multiple Emulsions: Technology and Applications, Wiley-Interscience, Hoboken, NJ, 2008.
[2] W. Seifriz, Studies in emulsions. III–V, J. Phys. Chem. 29 (6) (1924) 738–749.[3] Y. Mine, M. Shimizu, et al., Preparation and stabilization of simple and multiple
emulsions using a microporous glass membrane, Colloids Surf. B: Biointerfaces6 (4-5) (1996) 261–268.
[4] S. Mun, Y. Choi, et al., Effects of enzymatically modified starch on the encapsu-lation efficiency and stability of water-in-oil-in-water emulsions, Food Chem.128 (2) (2011) 266–275.
[5] T. Nakashima, M. Shimizu, et al., Particle control of emulsion by membraneemulsification and its applications, Adv. Drug Deliv. Rev. 45 (1) (2000) 47–56.
[6] H. Okochi, M. Nakano, Comparative study of two preparation methods of w/o/wemulsions: stirring and membrane emulsification, Chem. Pharm. Bull. (Tokyo)45 (8) (1997) 1323–1326.
[7] J. Silvestre De Los Reyes, C. Charcosset, Preparation of water-in-oil and ethanol-in-oil emulsions by membrane emulsification, Fuel 89 (11) (2010) 3482–3488.
[8] S. Van Der Graaf, C.G.P.H. Schroën, et al., Preparation of double emulsions bymembrane emulsification – a review, J. Membr. Sci. 251 (1-2) (2005) 7–15.
[9] R. Wilson, B.J. Van Schie, et al., Overview of the preparation, use and biologicalstudies on polyglycerol polyricinoleate (PGPR), Food Chem. Toxicol. 36 (9-10)(1998) 711–718.
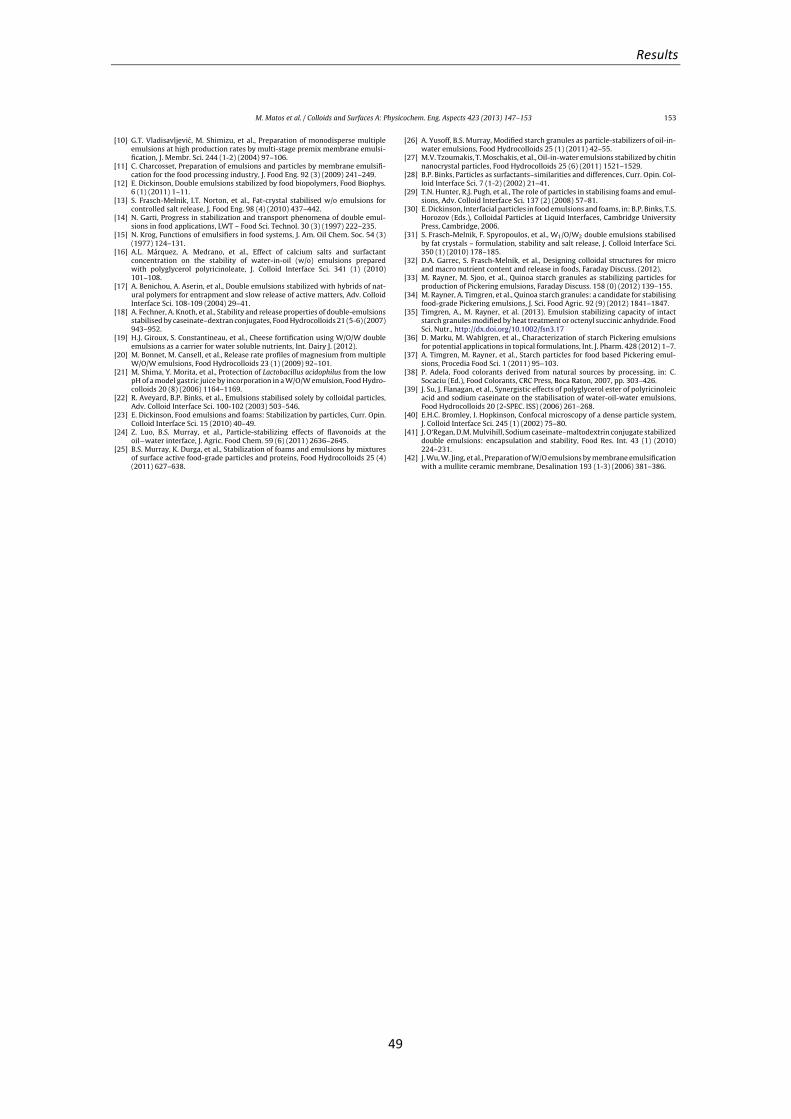
Results
49
M. Matos et al. / Colloids and Surfaces A: Physicochem. Eng. Aspects 423 (2013) 147–153 153
[10] G.T. Vladisavljevic, M. Shimizu, et al., Preparation of monodisperse multipleemulsions at high production rates by multi-stage premix membrane emulsi-fication, J. Membr. Sci. 244 (1-2) (2004) 97–106.
[11] C. Charcosset, Preparation of emulsions and particles by membrane emulsifi-cation for the food processing industry, J. Food Eng. 92 (3) (2009) 241–249.
[12] E. Dickinson, Double emulsions stabilized by food biopolymers, Food Biophys.6 (1) (2011) 1–11.
[13] S. Frasch-Melnik, I.T. Norton, et al., Fat-crystal stabilised w/o emulsions forcontrolled salt release, J. Food Eng. 98 (4) (2010) 437–442.
[14] N. Garti, Progress in stabilization and transport phenomena of double emul-sions in food applications, LWT – Food Sci. Technol. 30 (3) (1997) 222–235.
[15] N. Krog, Functions of emulsifiers in food systems, J. Am. Oil Chem. Soc. 54 (3)(1977) 124–131.
[16] A.L. Márquez, A. Medrano, et al., Effect of calcium salts and surfactantconcentration on the stability of water-in-oil (w/o) emulsions preparedwith polyglycerol polyricinoleate, J. Colloid Interface Sci. 341 (1) (2010)101–108.
[17] A. Benichou, A. Aserin, et al., Double emulsions stabilized with hybrids of nat-ural polymers for entrapment and slow release of active matters, Adv. ColloidInterface Sci. 108-109 (2004) 29–41.
[18] A. Fechner, A. Knoth, et al., Stability and release properties of double-emulsionsstabilised by caseinate–dextran conjugates, Food Hydrocolloids 21 (5-6) (2007)943–952.
[19] H.J. Giroux, S. Constantineau, et al., Cheese fortification using W/O/W doubleemulsions as a carrier for water soluble nutrients, Int. Dairy J. (2012).
[20] M. Bonnet, M. Cansell, et al., Release rate profiles of magnesium from multipleW/O/W emulsions, Food Hydrocolloids 23 (1) (2009) 92–101.
[21] M. Shima, Y. Morita, et al., Protection of Lactobacillus acidophilus from the lowpH of a model gastric juice by incorporation in a W/O/W emulsion, Food Hydro-colloids 20 (8) (2006) 1164–1169.
[22] R. Aveyard, B.P. Binks, et al., Emulsions stabilised solely by colloidal particles,Adv. Colloid Interface Sci. 100-102 (2003) 503–546.
[23] E. Dickinson, Food emulsions and foams: Stabilization by particles, Curr. Opin.Colloid Interface Sci. 15 (2010) 40–49.
[24] Z. Luo, B.S. Murray, et al., Particle-stabilizing effects of flavonoids at theoil−water interface, J. Agric. Food Chem. 59 (6) (2011) 2636–2645.
[25] B.S. Murray, K. Durga, et al., Stabilization of foams and emulsions by mixturesof surface active food-grade particles and proteins, Food Hydrocolloids 25 (4)(2011) 627–638.
[26] A. Yusoff, B.S. Murray, Modified starch granules as particle-stabilizers of oil-in-water emulsions, Food Hydrocolloids 25 (1) (2011) 42–55.
[27] M.V. Tzoumakis, T. Moschakis, et al., Oil-in-water emulsions stabilized by chitinnanocrystal particles, Food Hydrocolloids 25 (6) (2011) 1521–1529.
[28] B.P. Binks, Particles as surfactants–similarities and differences, Curr. Opin. Col-loid Interface Sci. 7 (1-2) (2002) 21–41.
[29] T.N. Hunter, R.J. Pugh, et al., The role of particles in stabilising foams and emul-sions, Adv. Colloid Interface Sci. 137 (2) (2008) 57–81.
[30] E. Dickinson, Interfacial particles in food emulsions and foams, in: B.P. Binks, T.S.Horozov (Eds.), Colloidal Particles at Liquid Interfaces, Cambridge UniversityPress, Cambridge, 2006.
[31] S. Frasch-Melnik, F. Spyropoulos, et al., W1/O/W2 double emulsions stabilisedby fat crystals – formulation, stability and salt release, J. Colloid Interface Sci.350 (1) (2010) 178–185.
[32] D.A. Garrec, S. Frasch-Melnik, et al., Designing colloidal structures for microand macro nutrient content and release in foods, Faraday Discuss. (2012).
[33] M. Rayner, M. Sjoo, et al., Quinoa starch granules as stabilizing particles forproduction of Pickering emulsions, Faraday Discuss. 158 (0) (2012) 139–155.
[34] M. Rayner, A. Timgren, et al., Quinoa starch granules: a candidate for stabilisingfood-grade Pickering emulsions, J. Sci. Food Agric. 92 (9) (2012) 1841–1847.
[35] Timgren, A., M. Rayner, et al. (2013). Emulsion stabilizing capacity of intactstarch granules modified by heat treatment or octenyl succinic anhydride. FoodSci. Nutr., http://dx.doi.org/10.1002/fsn3.17
[36] D. Marku, M. Wahlgren, et al., Characterization of starch Pickering emulsionsfor potential applications in topical formulations, Int. J. Pharm. 428 (2012) 1–7.
[37] A. Timgren, M. Rayner, et al., Starch particles for food based Pickering emul-sions, Procedia Food Sci. 1 (2011) 95–103.
[38] P. Adela, Food colorants derived from natural sources by processing, in: C.Socaciu (Ed.), Food Colorants, CRC Press, Boca Raton, 2007, pp. 303–426.
[39] J. Su, J. Flanagan, et al., Synergistic effects of polyglycerol ester of polyricinoleicacid and sodium caseinate on the stabilisation of water-oil-water emulsions,Food Hydrocolloids 20 (2-SPEC. ISS) (2006) 261–268.
[40] E.H.C. Bromley, I. Hopkinson, Confocal microscopy of a dense particle system,J. Colloid Interface Sci. 245 (1) (2002) 75–80.
[41] J. O‘Regan, D.M. Mulvihill, Sodium caseinate–maltodextrin conjugate stabilizeddouble emulsions: encapsulation and stability, Food Res. Int. 43 (1) (2010)224–231.
[42] J. Wu, W. Jing, et al., Preparation of W/O emulsions by membrane emulsificationwith a mullite ceramic membrane, Desalination 193 (1-3) (2006) 381–386.
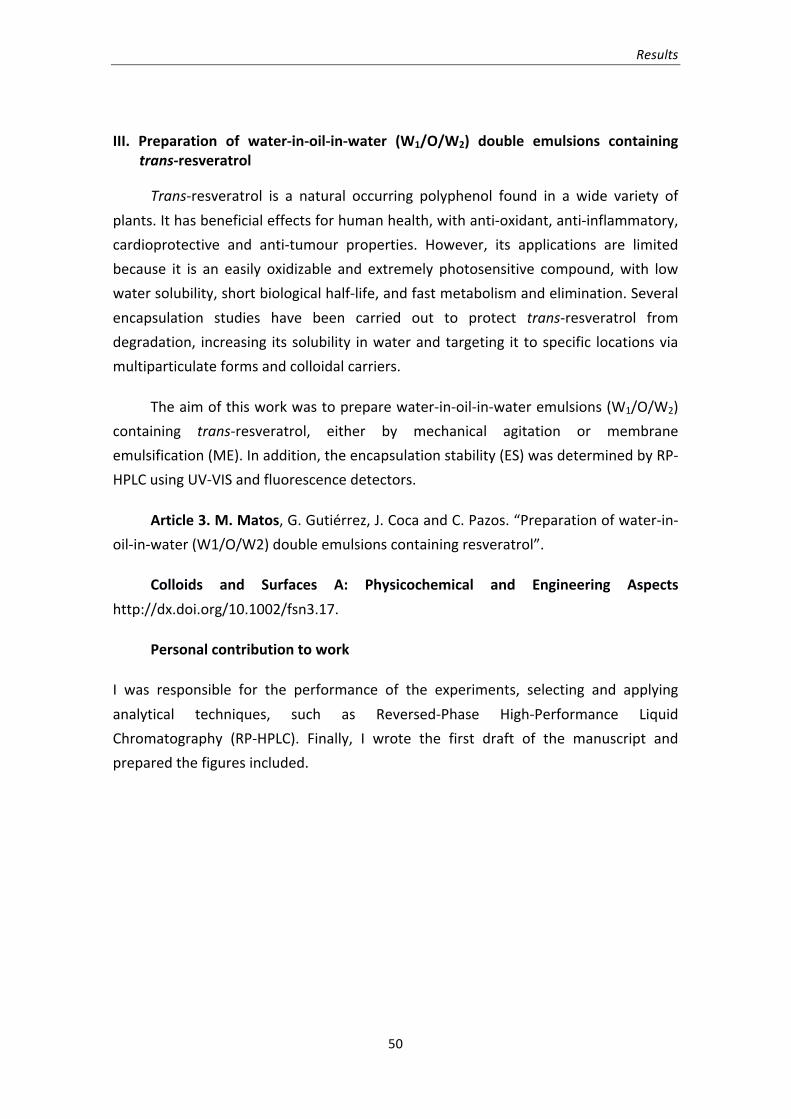
Results
50
III. Preparation of water-‐in-‐oil-‐in-‐water (W1/O/W2) double emulsions containing trans-‐resveratrol
Trans-‐resveratrol is a natural occurring polyphenol found in a wide variety of plants. It has beneficial effects for human health, with anti-‐oxidant, anti-‐inflammatory, cardioprotective and anti-‐tumour properties. However, its applications are limited because it is an easily oxidizable and extremely photosensitive compound, with low water solubility, short biological half-‐life, and fast metabolism and elimination. Several encapsulation studies have been carried out to protect trans-‐resveratrol from degradation, increasing its solubility in water and targeting it to specific locations via multiparticulate forms and colloidal carriers.
The aim of this work was to prepare water-‐in-‐oil-‐in-‐water emulsions (W1/O/W2) containing trans-‐resveratrol, either by mechanical agitation or membrane emulsification (ME). In addition, the encapsulation stability (ES) was determined by RP-‐HPLC using UV-‐VIS and fluorescence detectors.
Article 3. M. Matos, G. Gutiérrez, J. Coca and C. Pazos. “Preparation of water-‐in-‐oil-‐in-‐water (W1/O/W2) double emulsions containing resveratrol”.
Colloids and Surfaces A: Physicochemical and Engineering Aspects http://dx.doi.org/10.1002/fsn3.17.
Personal contribution to work
I was responsible for the performance of the experiments, selecting and applying analytical techniques, such as Reversed-‐Phase High-‐Performance Liquid Chromatography (RP-‐HPLC). Finally, I wrote the first draft of the manuscript and prepared the figures included.
Resultados
51
III. Preparación de emulsiones dobles agua-‐aceite-‐agua (W1/O/W2) conteniendo trans-‐resveratrol
El trans-‐resveratrol es un polifenol natural que se encuentra en una amplia variedad de plantas. Presenta efectos beneficiosos para la salud humana, ya que, además de sus propiedades antioxidantes y anti-‐inflamatorias, es cardioprotector y antitumoral. Sin embargo, sus aplicaciones están limitadas por ser un compuesto fácilmente oxidable, extremadamente fotosensible, con baja solubilidad en agua, corta vida media biológica, rápido metabolismo y eliminación. Se han llevado a cabo diversos estudios de encapsulación con el fin de proteger el trans-‐resveratrol de la degradación, aumentando su solubilidad en agua y facilitando su vehiculización a lugares específicos, a través de formas multiparticuladas y sistemas coloidales.
El objetivo de este trabajo era preparar emulsiones dobles del tipo agua-‐ aceite-‐ agua (W1/O/W2) conteniendo trans-‐resveratrol, ya fuera por agitación mecánica o emulsificación con membranas. Paralelamente, se determinó la estabilidad de encapsulación, analizando la concentración de trans-‐resveratrol mediante RP-‐HPLC con detectores UV-‐VIS y de fluorescencia.
Artículo 3. M. Matos, G. Gutiérrez, J. Coca y C. Pazos. “Preparation of water-‐in-‐oil-‐in-‐water (W1/O/W2) double emulsions containing trans-‐resveratrol”.
Colloids and Surfaces A: Physicochemical and Engineering Aspects http://dx.doi.org/10.1002/fsn3.17.
Aportación personal al trabajo
En este trabajo llevé a cabo la labor experimental, lo que me permitió adquirir experiencia en el manejo de técnicas poco conocidas para mí hasta entonces, caso de la cromatografía líquida de alta eficacia (HPLC) y fase reversa (RP). Al mismo tiempo, realicé la búsqueda bibliográfica correspondiente. Finalmente, redacté la mayor parte del manuscrito y preparé las figuras incluidas en el mismo.
Results
52
Please cite this article in press as: M. Matos, et al., Preparation of water-in-oil-in-water (W1/O/W2) double emulsions containing trans-resveratrol,Colloids Surf. A: Physicochem. Eng. Aspects (2013), http://dx.doi.org/10.1016/j.colsurfa.2013.05.065
ARTICLE IN PRESSG Model
COLSUA-18467; No. of Pages 11
Colloids and Surfaces A: Physicochem. Eng. Aspects xxx (2013) xxx–xxx
Contents lists available at SciVerse ScienceDirect
Colloids and Surfaces A: Physicochemical andEngineering Aspects
journa l homepage: www.e lsev ier .com/ locate /co lsur fa
Preparation of water-in-oil-in-water (W1/O/W2) double emulsionscontaining trans-resveratrol
M. Matos, G. Gutiérrez, J. Coca, C. Pazos ∗
Department of Chemical and Environmental Engineering, University of Oviedo, Julián Clavería 8, 33006 Oviedo, Spain
h i g h l i g h t s
• Resveratrol was encapsulatedin water-in-oil-in-water doubleemulsions.
• These emulsions were prepared bymechanical agitation and membraneemulsification.
• Resveratrol encapsulation efficiencywas determined by RP-HPLC method.
• An appropriate selection of emul-sion stabilizers increased resveratrolencapsulation.
• Encapsulation and release of resvera-trol were influenced by PGPR content.
g r a p h i c a l a b s t r a c t
a r t i c l e i n f o
Article history:Received 30 November 2012Received in revised form 20 March 2013Accepted 16 May 2013Available online xxx
Keywords:trans-ResveratrolEncapsulationDouble emulsionsRP-HPLCStability
a b s t r a c t
trans-Resveratrol (3,5,4�-trihydroxystilbene) is a naturally occurring polyphenol phytoalexin easily oxi-dizable and extremely photosensitive with a short biological half-life. The goal of this work was toprepare W1/O/W2 double emulsions of food-grade formulation to encapsulate trans-resveratrol. Mechan-ical agitation and membrane emulsification (ME) were the techniques used for emulsion preparation. Atechnique based on RP-HPLC to determine trans-resveratrol concentration in the external aqueous phasewith UV–vis and fluorescence detectors was developed. Several inner emulsifiers were tested to producestable water-in-oil (W1/O) emulsions containing 20% (v/v) of ethanol. Polyglycerol polyricinoleate (PGPR)was the only emulsifier with good stabilizing properties. Non-ionic surfactants (Tween 20 and Tween 80)were used as outer emulsifiers. Other food bioemulsifiers, such as sodium caseinate (NaCn), sodium car-boxymethylcellulose (CMCNa) or gelatin, were also added as stabilizers to improve W1/O/W2 doubleemulsions stability. Initial encapsulation efficiency (EE) and encapsulation stability (ES) were measured.The combination of Tween 20 and CMCNa in the external aqueous phase seemed to have a synergeticeffect leading to better initial EE values. More stable emulsions were obtained with mechanical agitation.An increase in PGPR content yielded a slight increase in initial EE values.
© 2013 Elsevier B.V. All rights reserved.
1. Introduction
trans-Resveratrol (3,5,4�-trihydroxystilbene) is a natural occur-ring polyphenol found in a wide variety of plants. It hasbeneficial effects for human health, such as anti-oxidant,anti-inflammatory, cardioprotective and anti-tumor properties.
∗ Corresponding author. Tel.: +34 985103509; fax: +34 985103434.E-mail address: [email protected] (C. Pazos).
However, the applications of trans-resveratrol are limited becauseit is an easily oxidizable and extremely photosensitive compound,with low water solubility, short biological half-life, and rapidmetabolism and elimination [1–3]. The level of trans-resveratrol inwines depends on the production technology and is usually lowerin white wines [4]. The average content in red wines reported byGürbüz et al. was 1.089 ± 0.002 mg/L [5].
Encapsulation of polyphenols can effectively mitigate theselimitations [1,6]. Encapsulation studies have been carried out toprotect trans-resveratrol from degradation, increasing its solubility
0927-7757/$ – see front matter © 2013 Elsevier B.V. All rights reserved.http://dx.doi.org/10.1016/j.colsurfa.2013.05.065
Results
53
Please cite this article in press as: M. Matos, et al., Preparation of water-in-oil-in-water (W1/O/W2) double emulsions containing trans-resveratrol,Colloids Surf. A: Physicochem. Eng. Aspects (2013), http://dx.doi.org/10.1016/j.colsurfa.2013.05.065
ARTICLE IN PRESSG Model
COLSUA-18467; No. of Pages 11
2 M. Matos et al. / Colloids and Surfaces A: Physicochem. Eng. Aspects xxx (2013) xxx–xxx
in water and targeting it to specific locations via multiparticulateforms and colloidal carriers [1,3,7–14].
Several methods for the encapsulation of polyphenols have beenreported, such as spray drying, coacervation, liposome entrap-ment [11,12,14,15], inclusion complexation [13], cocrystallization,nanoencapsulation [7,10], freeze drying and emulsification [8,9].
Multiple emulsions were first reported in 1925 by Seifriz. Thesimplest multiple emulsions are called double emulsions andthey are ternary systems, having either a water-in-oil-in-water(W1/O/W2) or an oil-in-water-in-oil (O1/W/O2) structure, wherebythe dispersed droplets contain smaller droplets of a different phase[16]. The structural properties of this kind of multiple emulsionspermit controlled release of a component from the inner to theouter phase. This leads to a number of potential applications in thefields of medicine, pharmacy, cosmetics and separation processes[16–23].
W1/O/W2 double emulsions have potential applications in food,cosmetic and pharmaceutical industries as vehicles for encapsu-lation and delivery of nutrients during food digestion or for drugrelease [24–30,22]. This type of emulsions may also be used forthe encapsulation of sensitive food materials and flavors and in theformulation of low calorie food products [26]. The main problem inthe production of double emulsions is their instability, due to theexcess of free energy associated with the surface of the emulsiondroplets [16,17].
The suitability of W1/O/W2 double emulsions to encapsulatetrans-resveratrol has been reported by Hemar et al. [31]. Its con-centration in the external aqueous phase was measured by a simpleUV method. However, other techniques have been developed fordetermining trans-resveratrol content, such as gas chromatogra-phy with mass selective detection (GC–MS) and high-performanceliquid chromatography (HPLC) with UV or fluorescence detection[4,5,32,33].
The aim of this work was to prepare W1/O/W2 double emul-sions containing trans-resveratrol, either by mechanical agitationor membrane emulsification (ME). Encapsulation stability (ES) wasdetermined by RP-HPLC using UV–vis and fluorescence detectors.
2. Materials and methods
2.1. Materials
trans-Resveratrol, absolute ethanol, Tween 20, Tween 80, Span80, sodium carboximethylcellulose (CMCNa), gelatin and sodiumcaseinate salt from bovine milk (NaCn) were purchased fromSigma–Aldrich (USA). Miglyol 812 (density 945 kg/m3 at 20 ◦C) wassupplied by Sasol GmbH (Germany). Polyglycerol polyricinoleate(PGPR) was supplied by Brenntag AG (Germany). Sodium chloridewas obtained from Panreac (Spain). Plurol oleique (polyglyceril-6-dioleate) and Peceol (glycerylmonoleate, type 40) were purchasedfrom Gattefossé SAS (France). Methanol, acetonitrile, 2-propanoland acetic acid of HPLC-grade were obtained from Sigma–Aldrich(USA).
2.2. Methods
2.2.1. Water-in-oil (W1/O) emulsions preparationPrimary W1/O single emulsions were prepared using 20% (v/v)
of the inner aqueous phase (W1) and 80% (v/v) of the continuousoily phase (O). trans-Resveratrol is barely soluble in water and itssolubility in alcohols decreases as the carbon number of the alcoholincreases [33]. Thus, a 20% ethanol (v/v) solution was used as thedispersed phase containing 50 mg/L of trans-resveratrol.
Miglyol 812 was used as the continuous phase containingthe corresponding hydrophobic emulsifier previously dissolved
by stirring at 50 ◦C for 30 min. The hydrophilic–lipophilic balance(HLB) of an emulsifier is an adequate parameter to predict theresulting emulsion type (W/O or O/W) [20,27]. The HLB values of theinner emulsifiers tested in this study are as follows: Span 80 = 4.3,PGPR = 3.0, Peceol = 3.0, and Plurol oleique = 6.0. PGPR is commonlyused in food formulation and it has been demonstrated to be highlyeffective for stabilizing W1/O emulsions [24,34].
It has been reported that the addition of electrolytes to theaqueous phase increases the W1/O emulsion stability. It has beensuggested that the presence of electrolytes lowers the attractiveforce between water droplets, decreasing the dielectric constantof the aqueous phase and therefore reducing collision frequency[24,29,30]. Consequently, 0.1 M NaCl was added to the internalaqueous phase to ensure inner droplets stability.
Both continuous and dispersed phases were emulsified in glassvessels by high shear mixing (Miccra D-9 mixer, ART, Germany)using a 6 mm dispersing tool at 20,000 rpm for 2 min.
2.2.2. Water-in-oil-in-water (W1/O/W2) double emulsionspreparation
W1/O/W2 double emulsions were prepared either by mechani-cal agitation or ME by dispersion of 20% (v/v) of W1/O emulsions inan external continuous phase (W2) containing 0.1 M NaCl in orderto match the osmotic pressure between the two aqueous phases.
When Tween 20, Tween 80 and NaCn were used as outerstabilizers they were previously dissolved by stirring for 30 min.Nevertheless, when CMCNa and gelatin were used they needed tobe agitated overnight.
For mechanical agitation, the continuous and dispersed phaseswere emulsified using the aforementioned Miccra D-9 mixer at11,000 rpm for 2 min.
A 200 mL Amicon model 8200 stirred batch ultrafiltration cell(Amicon Inc., USA) was fitted to the membrane emulsificationexperiments. The dispersed phase was injected from the bottomside of the cell by a syringe pump KDS-100-CE (Kd Scientific, USA)at a rate of 20 mL/min. The continuous phase was placed on theupper part of the cell being continuously stirred at 600 rpm, toenhance droplet detachment. Operating conditions were selectedbased on results obtained from previous studies (results notshown).
The membrane used was a hydrophilic metallic membrane with5 �m pore size, supplied by Micropore Ltd. (UK). When using thismembrane emulsification technique, the diameter of the dropletsproduced is approximately between 2 and 10 times the diameterof the membrane pore [25,35].
After each experiment membranes were cleaned with a dish-washing detergent and rinsed with deionized water and acetonein an ultrasound bath for 15 min. Finally, they were dried usingcompressed air and pre-soaked in the continuous phase.
2.2.3. Emulsion characterizationDroplet size distributions were obtained by the laser light scat-
tering technique in a Mastersizer S long bench apparatus (MalvernInstruments, Ltd., UK). For double emulsions a refractive index of1.54 was used.
Samples were first diluted with deionized water to preventmultiple scattering effects. They were then circulated through themeasuring zone using a Hydro SM small volume sample dispersionunit, following the manufacturer recommendations for this type ofemulsions. For the single W1/O emulsion, the water refractive indexwas used and the samples were dispersed in paraffin oil (VWR Int.,USA).
Several measurements were made for each emulsion chang-ing the dilution ratio. No significant differences were observedin the mean droplet diameters, ranging from 1:10 to 1:100 dilu-tion ratios. Three replicates were obtained for each emulsion and
Results
54
Please cite this article in press as: M. Matos, et al., Preparation of water-in-oil-in-water (W1/O/W2) double emulsions containing trans-resveratrol,Colloids Surf. A: Physicochem. Eng. Aspects (2013), http://dx.doi.org/10.1016/j.colsurfa.2013.05.065
ARTICLE IN PRESSG Model
COLSUA-18467; No. of Pages 11
M. Matos et al. / Colloids and Surfaces A: Physicochem. Eng. Aspects xxx (2013) xxx–xxx 3
results were reported as the typical droplet size distribution in �m.The mean diameters, D[4,3] and D[3,2], were calculated by Eqs. (1)and (2):
D[4,3] =∑
nid4i∑
nid3i
(1)
D[3,2] =∑
nid3i∑
nid2i
(2)
where di is the droplet diameter and ni the number of droplets withdiameter di. D[4,3] is the volume weighted mean diameter and D[3,2]is the surface weighted mean diameter or Sauter mean.
A Zetasizer NanoZS (Malvern Instruments Ltd., UK) was utilizedfor zeta potential (�) measurements of the W1/O/W2 double emul-sions. Three replicates were conducted for each sample at constanttemperature of 25 ◦C.
Micrographs of the emulsions were obtained with a lightmicroscope Olympus BX50 (Olympus, Japan) with 10–100× mag-nification using UV–vis and fluorescence lamps.
Emulsion stability was analyzed by measuring backscatter-ing (BS) and transmission (TS) profiles in a Turbiscan apparatus(Formulaction, France). Emulsions samples were placed withoutdilution in the test cells and transmitted and backscattered lightwas monitored as a function of time and cell height for 7 daysat 30 ◦C. The optical reading head scans the sample in the cell,providing TS and BS data every 40 �m in % relative to standards(suspension of monodisperse spheres and silicone oil) as a functionof the sample height (in mm). These profiles build up a macroscopicfingerprint of the emulsion at a given time, providing useful infor-mation about changes in droplet size distribution or appearance ofa creaming layer or a clarification front with time [36,37].
Emulsions viscosity measurements were performed with aHaake RS50 rheometer (Haake, Germany) using plate-plate config-uration at 25 ◦C. Viscosity was measured at 20 s−1 constant shearrate for 180 s.
The viscosities of external aqueous phases were measured by anUbbelohde type viscometer PSL-Rheotek (Poulten Selfe & Lee Ltd.,UK) at 25 ◦C.
Interfacial tension (�) was determined following the Du Noüy’splatinum ring method at 20 ◦C using a Sigma 700 tensiometer (KSVInstruments Ltd., Finland).
2.2.4. Determination of the initial encapsulation efficiency (EE)and encapsulation stability (ES) by RP-HPLC analysis
trans-Resveratrol content in the external aqueous phase wasdetermined by chromatography (HP series 1100 chromatograph,Hewlett Packard, USA). The system was equipped with a UV–visabsorbance detector HP G1315A and a fluorescence detector 1260Infinity A (Agilent Technologies, USA).
The column used for the separation was a reversedphase column Zorbax Eclipse Plus C18 of 5 �m particle size,4.6 mm × 150 mm (Agilent Technologies, USA). The mobile phaseconsisted of a mixture of (A) 100% milliQ-water and (B) 100%methanol with gradient elution at a flow rate of 0.8 mL/min. Thestep gradient started with 80% mobile phase (A) running 100% ofmobile phase (B) in min 5 for 10 min. The mobile phase (B) wasrun for 2 min after each injection to prepare the column for thenext run. The separation was carried out at room temperature.
A wavelength of 305 nm was used for UV–vis detector while flu-orescence detector was used at �excitation/�emission at 310/410 nm.The column was cleaned after each analysis by running first mobilephase (A) for 20 min and a mobile phase (C) consisting of 50% ace-tonitrile, 25% milliQ-water, 25% 2-propanol and 0.01% acetic acidfor 40 min at a flow rate of 0.25 mL/min. Finally, the column was
rinsed with 50% of mobile phase (A) and 50% of mobile phase (B)for another 20 min.
The external aqueous phase injected in the HPLC system waspreviously recovered by centrifugation at low speed (1000 rpmfor 20 min) and filtration with a 0.22 �m polyvinylidene difluo-ride (PVDF) syringe filter, to eliminate all the cream oily phase stillpresent.
Other filters as polyethersulfone (PES) or nylon were alsotested although considerably high resveratrol retention valueswere obtained: 29 and 100%, respectively.
The recovery yield (Ry) was determined to measure the amountof trans-resveratrol retained during the centrifugation and filtra-tion processes. A standard emulsion, where 100% of the W1 ispresent in W2, was required. For this purpose, an oil-in-wateremulsion (O/W2) was prepared using the same formulation asin the experiments. This O/W2 emulsion was then diluted at thesame ratio with W1, which contained the appropriate amount oftrans-resveratrol. Then, the concentration of trans-resveratrol inthe recovered aqueous phases (Crecovered) was determined by RP-HPLC, using the absorbance and fluorescence calibration curvespreviously obtained. For this analysis, a blank reference was used.It consisted of an O/W2 emulsion diluted with W1, in which trans-resveratrol was not present. Finally, the Ry was calculated as:
Ry (%) = Crecovered × 100C0
(3)
where C0 is the maximum concentration of trans-resveratrolexpected in the external aqueous phase.
The encapsulation efficiency (EE) of these double emulsions wasdefined as the percentage of trans-resveratrol in W1 that remainedin the primary emulsion (W1/O) after the second emulsificationstep [26,38]. It was calculated by Eq. (4):
EE (%) = 100 − Crecovered × 100C0Ry
(4)
The encapsulation stability (ES) was defined as the amount of trans-resveratrol that remained entrapped in the inner aqueous phase(W1) during storage or after double emulsion exposure to environ-mental stresses [38]. It was calculated by Eq. (5):
ES (%) = 100 − Crecovered × 100C0Ry
(5)
Several samples were prepared and stored at room temperatureto measure the ES weekly along a month. Three replicates of eachsample were determined.
3. Results and discussion
3.1. Water-in-oil (W1/O) emulsions
To obtain a stable double emulsion, the stability of the singleW1/O emulsion must be ensured. This stability depends on dropletsize (normally around 1 �m), amounts of dispersed and continuousphase (water is usually in the range 20–30%, v/v), and emulsifieraffinity for both phases (HLB) [17–20,27].
Several W1/O emulsions were prepared at the same concentra-tion, 5% (w/v), varying the type of inner emulsifier present in theoily phase. The droplet size distributions of the resulting emulsionswere measured and their stability was determined and comparedby laser light scattering.
The mean diameters obtained with the Malvern Mastersizer Sare shown in Table 1. The D[3,2] values are in the 0.3–1.7 �m range,except for Peceol, which leads to sizes considerably higher. Thepolydispersity of the droplet size distribution was expressed in
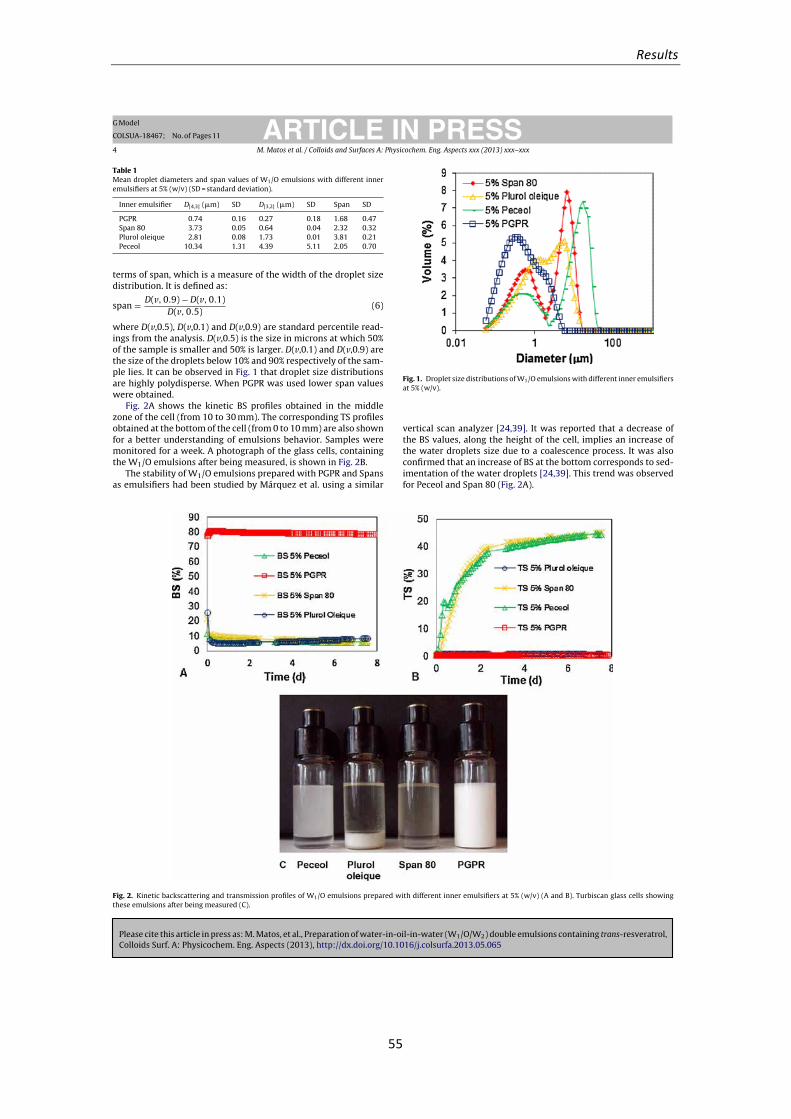
Results
55
Please cite this article in press as: M. Matos, et al., Preparation of water-in-oil-in-water (W1/O/W2) double emulsions containing trans-resveratrol,Colloids Surf. A: Physicochem. Eng. Aspects (2013), http://dx.doi.org/10.1016/j.colsurfa.2013.05.065
ARTICLE IN PRESSG Model
COLSUA-18467; No. of Pages 11
4 M. Matos et al. / Colloids and Surfaces A: Physicochem. Eng. Aspects xxx (2013) xxx–xxx
Table 1Mean droplet diameters and span values of W1/O emulsions with different inneremulsifiers at 5% (w/v) (SD = standard deviation).
Inner emulsifier D[4,3] (�m) SD D[3,2] (�m) SD Span SD
PGPR 0.74 0.16 0.27 0.18 1.68 0.47Span 80 3.73 0.05 0.64 0.04 2.32 0.32Plurol oleique 2.81 0.08 1.73 0.01 3.81 0.21Peceol 10.34 1.31 4.39 5.11 2.05 0.70
terms of span, which is a measure of the width of the droplet sizedistribution. It is defined as:
span = D(v, 0.9) − D(v, 0.1)D(v, 0.5)
(6)
where D(v,0.5), D(v,0.1) and D(v,0.9) are standard percentile read-ings from the analysis. D(v,0.5) is the size in microns at which 50%of the sample is smaller and 50% is larger. D(v,0.1) and D(v,0.9) arethe size of the droplets below 10% and 90% respectively of the sam-ple lies. It can be observed in Fig. 1 that droplet size distributionsare highly polydisperse. When PGPR was used lower span valueswere obtained.
Fig. 2A shows the kinetic BS profiles obtained in the middlezone of the cell (from 10 to 30 mm). The corresponding TS profilesobtained at the bottom of the cell (from 0 to 10 mm) are also shownfor a better understanding of emulsions behavior. Samples weremonitored for a week. A photograph of the glass cells, containingthe W1/O emulsions after being measured, is shown in Fig. 2B.
The stability of W1/O emulsions prepared with PGPR and Spansas emulsifiers had been studied by Márquez et al. using a similar
Fig. 1. Droplet size distributions of W1/O emulsions with different inner emulsifiersat 5% (w/v).
vertical scan analyzer [24,39]. It was reported that a decrease ofthe BS values, along the height of the cell, implies an increase ofthe water droplets size due to a coalescence process. It was alsoconfirmed that an increase of BS at the bottom corresponds to sed-imentation of the water droplets [24,39]. This trend was observedfor Peceol and Span 80 (Fig. 2A).
Fig. 2. Kinetic backscattering and transmission profiles of W1/O emulsions prepared with different inner emulsifiers at 5% (w/v) (A and B). Turbiscan glass cells showingthese emulsions after being measured (C).
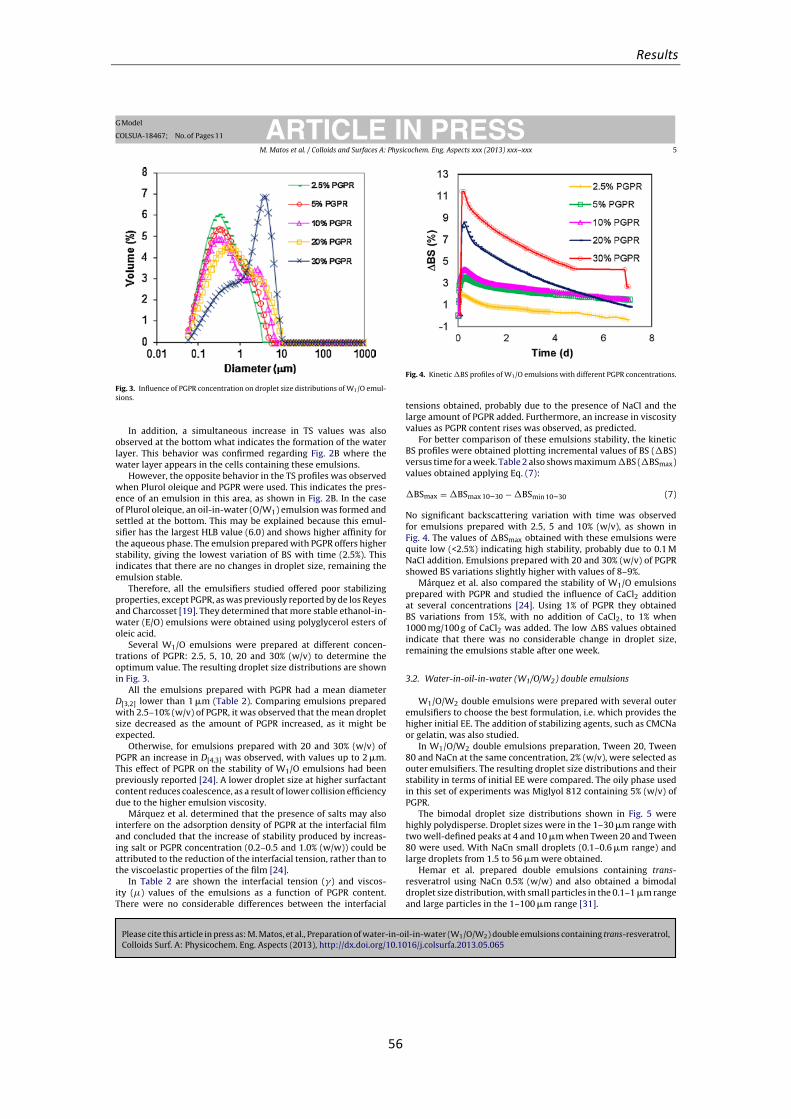
Results
56
Please cite this article in press as: M. Matos, et al., Preparation of water-in-oil-in-water (W1/O/W2) double emulsions containing trans-resveratrol,Colloids Surf. A: Physicochem. Eng. Aspects (2013), http://dx.doi.org/10.1016/j.colsurfa.2013.05.065
ARTICLE IN PRESSG Model
COLSUA-18467; No. of Pages 11
M. Matos et al. / Colloids and Surfaces A: Physicochem. Eng. Aspects xxx (2013) xxx–xxx 5
Fig. 3. Influence of PGPR concentration on droplet size distributions of W1/O emul-sions.
In addition, a simultaneous increase in TS values was alsoobserved at the bottom what indicates the formation of the waterlayer. This behavior was confirmed regarding Fig. 2B where thewater layer appears in the cells containing these emulsions.
However, the opposite behavior in the TS profiles was observedwhen Plurol oleique and PGPR were used. This indicates the pres-ence of an emulsion in this area, as shown in Fig. 2B. In the caseof Plurol oleique, an oil-in-water (O/W1) emulsion was formed andsettled at the bottom. This may be explained because this emul-sifier has the largest HLB value (6.0) and shows higher affinity forthe aqueous phase. The emulsion prepared with PGPR offers higherstability, giving the lowest variation of BS with time (2.5%). Thisindicates that there are no changes in droplet size, remaining theemulsion stable.
Therefore, all the emulsifiers studied offered poor stabilizingproperties, except PGPR, as was previously reported by de los Reyesand Charcosset [19]. They determined that more stable ethanol-in-water (E/O) emulsions were obtained using polyglycerol esters ofoleic acid.
Several W1/O emulsions were prepared at different concen-trations of PGPR: 2.5, 5, 10, 20 and 30% (w/v) to determine theoptimum value. The resulting droplet size distributions are shownin Fig. 3.
All the emulsions prepared with PGPR had a mean diameterD[3,2] lower than 1 �m (Table 2). Comparing emulsions preparedwith 2.5–10% (w/v) of PGPR, it was observed that the mean dropletsize decreased as the amount of PGPR increased, as it might beexpected.
Otherwise, for emulsions prepared with 20 and 30% (w/v) ofPGPR an increase in D[4,3] was observed, with values up to 2 �m.This effect of PGPR on the stability of W1/O emulsions had beenpreviously reported [24]. A lower droplet size at higher surfactantcontent reduces coalescence, as a result of lower collision efficiencydue to the higher emulsion viscosity.
Márquez et al. determined that the presence of salts may alsointerfere on the adsorption density of PGPR at the interfacial filmand concluded that the increase of stability produced by increas-ing salt or PGPR concentration (0.2–0.5 and 1.0% (w/w)) could beattributed to the reduction of the interfacial tension, rather than tothe viscoelastic properties of the film [24].
In Table 2 are shown the interfacial tension (�) and viscos-ity (�) values of the emulsions as a function of PGPR content.There were no considerable differences between the interfacial
Fig. 4. Kinetic �BS profiles of W1/O emulsions with different PGPR concentrations.
tensions obtained, probably due to the presence of NaCl and thelarge amount of PGPR added. Furthermore, an increase in viscosityvalues as PGPR content rises was observed, as predicted.
For better comparison of these emulsions stability, the kineticBS profiles were obtained plotting incremental values of BS (�BS)versus time for a week. Table 2 also shows maximum �BS (�BSmax)values obtained applying Eq. (7):
�BSmax = �BSmax 10–30 − �BSmin 10–30 (7)
No significant backscattering variation with time was observedfor emulsions prepared with 2.5, 5 and 10% (w/v), as shown inFig. 4. The values of �BSmax obtained with these emulsions werequite low (<2.5%) indicating high stability, probably due to 0.1 MNaCl addition. Emulsions prepared with 20 and 30% (w/v) of PGPRshowed BS variations slightly higher with values of 8–9%.
Márquez et al. also compared the stability of W1/O emulsionsprepared with PGPR and studied the influence of CaCl2 additionat several concentrations [24]. Using 1% of PGPR they obtainedBS variations from 15%, with no addition of CaCl2, to 1% when1000 mg/100 g of CaCl2 was added. The low �BS values obtainedindicate that there was no considerable change in droplet size,remaining the emulsions stable after one week.
3.2. Water-in-oil-in-water (W1/O/W2) double emulsions
W1/O/W2 double emulsions were prepared with several outeremulsifiers to choose the best formulation, i.e. which provides thehigher initial EE. The addition of stabilizing agents, such as CMCNaor gelatin, was also studied.
In W1/O/W2 double emulsions preparation, Tween 20, Tween80 and NaCn at the same concentration, 2% (w/v), were selected asouter emulsifiers. The resulting droplet size distributions and theirstability in terms of initial EE were compared. The oily phase usedin this set of experiments was Miglyol 812 containing 5% (w/v) ofPGPR.
The bimodal droplet size distributions shown in Fig. 5 werehighly polydisperse. Droplet sizes were in the 1–30 �m range withtwo well-defined peaks at 4 and 10 �m when Tween 20 and Tween80 were used. With NaCn small droplets (0.1–0.6 �m range) andlarge droplets from 1.5 to 56 �m were obtained.
Hemar et al. prepared double emulsions containing trans-resveratrol using NaCn 0.5% (w/w) and also obtained a bimodaldroplet size distribution, with small particles in the 0.1–1 �m rangeand large particles in the 1–100 �m range [31].
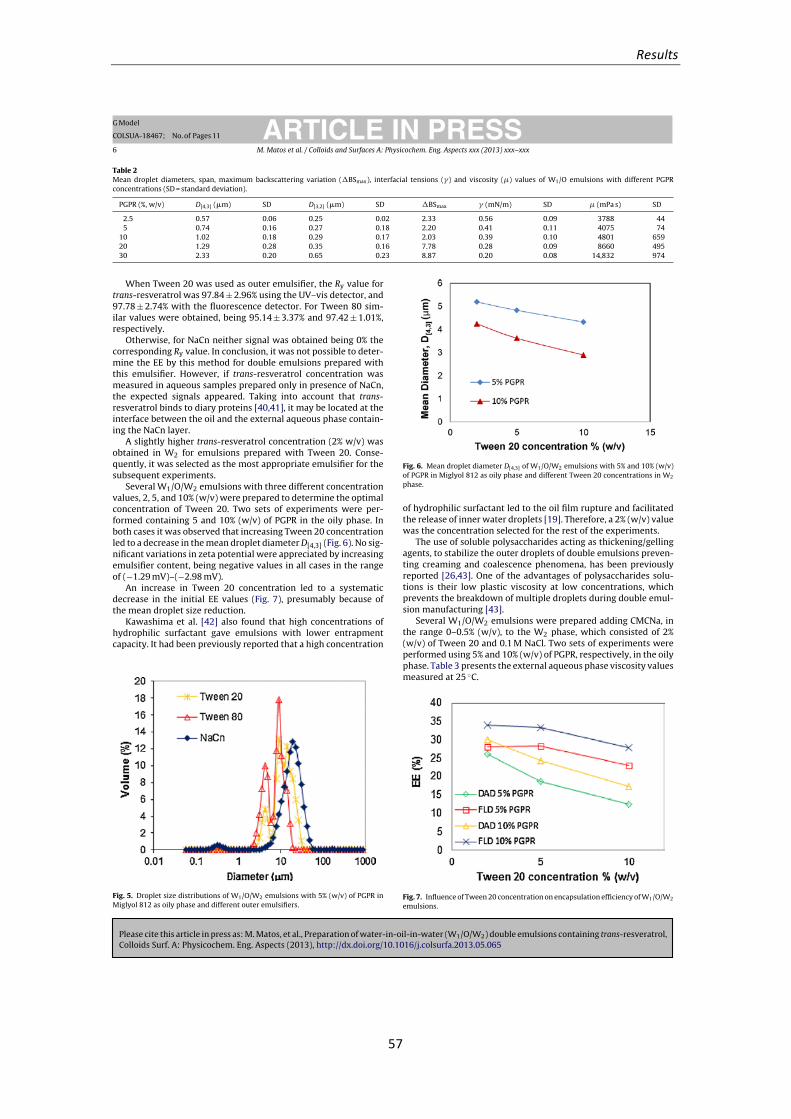
Results
57
Please cite this article in press as: M. Matos, et al., Preparation of water-in-oil-in-water (W1/O/W2) double emulsions containing trans-resveratrol,Colloids Surf. A: Physicochem. Eng. Aspects (2013), http://dx.doi.org/10.1016/j.colsurfa.2013.05.065
ARTICLE IN PRESSG Model
COLSUA-18467; No. of Pages 11
6 M. Matos et al. / Colloids and Surfaces A: Physicochem. Eng. Aspects xxx (2013) xxx–xxx
Table 2Mean droplet diameters, span, maximum backscattering variation (�BSmax), interfacial tensions (�) and viscosity (�) values of W1/O emulsions with different PGPRconcentrations (SD = standard deviation).
PGPR (%, w/v) D[4,3] (�m) SD D[3,2] (�m) SD �BSmax � (mN/m) SD � (mPa s) SD
2.5 0.57 0.06 0.25 0.02 2.33 0.56 0.09 3788 445 0.74 0.16 0.27 0.18 2.20 0.41 0.11 4075 74
10 1.02 0.18 0.29 0.17 2.03 0.39 0.10 4801 65920 1.29 0.28 0.35 0.16 7.78 0.28 0.09 8660 49530 2.33 0.20 0.65 0.23 8.87 0.20 0.08 14,832 974
When Tween 20 was used as outer emulsifier, the Ry value fortrans-resveratrol was 97.84 ± 2.96% using the UV–vis detector, and97.78 ± 2.74% with the fluorescence detector. For Tween 80 sim-ilar values were obtained, being 95.14 ± 3.37% and 97.42 ± 1.01%,respectively.
Otherwise, for NaCn neither signal was obtained being 0% thecorresponding Ry value. In conclusion, it was not possible to deter-mine the EE by this method for double emulsions prepared withthis emulsifier. However, if trans-resveratrol concentration wasmeasured in aqueous samples prepared only in presence of NaCn,the expected signals appeared. Taking into account that trans-resveratrol binds to diary proteins [40,41], it may be located at theinterface between the oil and the external aqueous phase contain-ing the NaCn layer.
A slightly higher trans-resveratrol concentration (2% w/v) wasobtained in W2 for emulsions prepared with Tween 20. Conse-quently, it was selected as the most appropriate emulsifier for thesubsequent experiments.
Several W1/O/W2 emulsions with three different concentrationvalues, 2, 5, and 10% (w/v) were prepared to determine the optimalconcentration of Tween 20. Two sets of experiments were per-formed containing 5 and 10% (w/v) of PGPR in the oily phase. Inboth cases it was observed that increasing Tween 20 concentrationled to a decrease in the mean droplet diameter D[4,3] (Fig. 6). No sig-nificant variations in zeta potential were appreciated by increasingemulsifier content, being negative values in all cases in the rangeof (−1.29 mV)–(−2.98 mV).
An increase in Tween 20 concentration led to a systematicdecrease in the initial EE values (Fig. 7), presumably because ofthe mean droplet size reduction.
Kawashima et al. [42] also found that high concentrations ofhydrophilic surfactant gave emulsions with lower entrapmentcapacity. It had been previously reported that a high concentration
Fig. 5. Droplet size distributions of W1/O/W2 emulsions with 5% (w/v) of PGPR inMiglyol 812 as oily phase and different outer emulsifiers.
Fig. 6. Mean droplet diameter D[4,3] of W1/O/W2 emulsions with 5% and 10% (w/v)of PGPR in Miglyol 812 as oily phase and different Tween 20 concentrations in W2
phase.
of hydrophilic surfactant led to the oil film rupture and facilitatedthe release of inner water droplets [19]. Therefore, a 2% (w/v) valuewas the concentration selected for the rest of the experiments.
The use of soluble polysaccharides acting as thickening/gellingagents, to stabilize the outer droplets of double emulsions preven-ting creaming and coalescence phenomena, has been previouslyreported [26,43]. One of the advantages of polysaccharides solu-tions is their low plastic viscosity at low concentrations, whichprevents the breakdown of multiple droplets during double emul-sion manufacturing [43].
Several W1/O/W2 emulsions were prepared adding CMCNa, inthe range 0–0.5% (w/v), to the W2 phase, which consisted of 2%(w/v) of Tween 20 and 0.1 M NaCl. Two sets of experiments wereperformed using 5% and 10% (w/v) of PGPR, respectively, in the oilyphase. Table 3 presents the external aqueous phase viscosity valuesmeasured at 25 ◦C.
Fig. 7. Influence of Tween 20 concentration on encapsulation efficiency of W1/O/W2
emulsions.
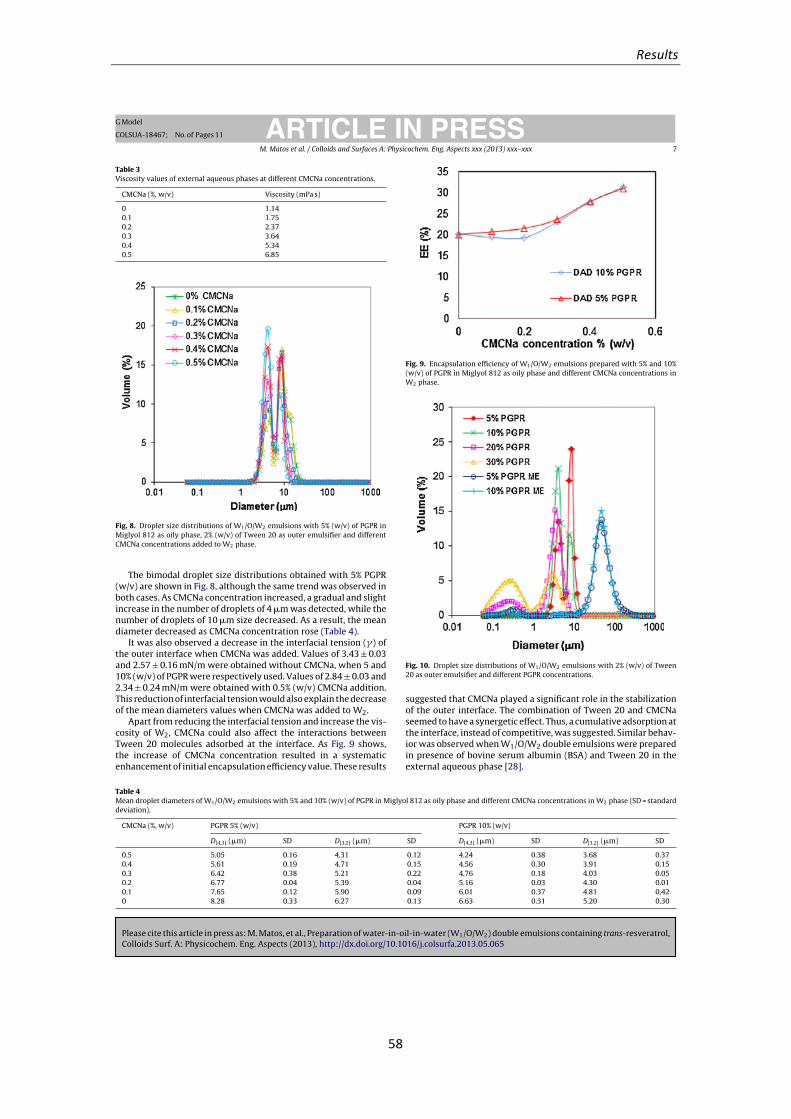
Results
58
Please cite this article in press as: M. Matos, et al., Preparation of water-in-oil-in-water (W1/O/W2) double emulsions containing trans-resveratrol,Colloids Surf. A: Physicochem. Eng. Aspects (2013), http://dx.doi.org/10.1016/j.colsurfa.2013.05.065
ARTICLE IN PRESSG Model
COLSUA-18467; No. of Pages 11
M. Matos et al. / Colloids and Surfaces A: Physicochem. Eng. Aspects xxx (2013) xxx–xxx 7
Table 3Viscosity values of external aqueous phases at different CMCNa concentrations.
CMCNa (%, w/v) Viscosity (mPa s)
0 1.140.1 1.750.2 2.370.3 3.640.4 5.340.5 6.85
Fig. 8. Droplet size distributions of W1/O/W2 emulsions with 5% (w/v) of PGPR inMiglyol 812 as oily phase, 2% (w/v) of Tween 20 as outer emulsifier and differentCMCNa concentrations added to W2 phase.
The bimodal droplet size distributions obtained with 5% PGPR(w/v) are shown in Fig. 8, although the same trend was observed inboth cases. As CMCNa concentration increased, a gradual and slightincrease in the number of droplets of 4 �m was detected, while thenumber of droplets of 10 �m size decreased. As a result, the meandiameter decreased as CMCNa concentration rose (Table 4).
It was also observed a decrease in the interfacial tension (�) ofthe outer interface when CMCNa was added. Values of 3.43 ± 0.03and 2.57 ± 0.16 mN/m were obtained without CMCNa, when 5 and10% (w/v) of PGPR were respectively used. Values of 2.84 ± 0.03 and2.34 ± 0.24 mN/m were obtained with 0.5% (w/v) CMCNa addition.This reduction of interfacial tension would also explain the decreaseof the mean diameters values when CMCNa was added to W2.
Apart from reducing the interfacial tension and increase the vis-cosity of W2, CMCNa could also affect the interactions betweenTween 20 molecules adsorbed at the interface. As Fig. 9 shows,the increase of CMCNa concentration resulted in a systematicenhancement of initial encapsulation efficiency value. These results
Fig. 9. Encapsulation efficiency of W1/O/W2 emulsions prepared with 5% and 10%(w/v) of PGPR in Miglyol 812 as oily phase and different CMCNa concentrations inW2 phase.
Fig. 10. Droplet size distributions of W1/O/W2 emulsions with 2% (w/v) of Tween20 as outer emulsifier and different PGPR concentrations.
suggested that CMCNa played a significant role in the stabilizationof the outer interface. The combination of Tween 20 and CMCNaseemed to have a synergetic effect. Thus, a cumulative adsorption atthe interface, instead of competitive, was suggested. Similar behav-ior was observed when W1/O/W2 double emulsions were preparedin presence of bovine serum albumin (BSA) and Tween 20 in theexternal aqueous phase [28].
Table 4Mean droplet diameters of W1/O/W2 emulsions with 5% and 10% (w/v) of PGPR in Miglyol 812 as oily phase and different CMCNa concentrations in W2 phase (SD = standarddeviation).
CMCNa (%, w/v) PGPR 5% (w/v) PGPR 10% (w/v)
D[4,3] (�m) SD D[3,2] (�m) SD D[4,3] (�m) SD D[3,2] (�m) SD
0.5 5.05 0.16 4.31 0.12 4.24 0.38 3.68 0.370.4 5.61 0.19 4.71 0.15 4.56 0.30 3.91 0.150.3 6.42 0.38 5.21 0.22 4.76 0.18 4.03 0.050.2 6.77 0.04 5.39 0.04 5.16 0.03 4.30 0.010.1 7.65 0.12 5.90 0.09 6.01 0.37 4.81 0.420 8.28 0.33 6.27 0.13 6.63 0.31 5.20 0.30
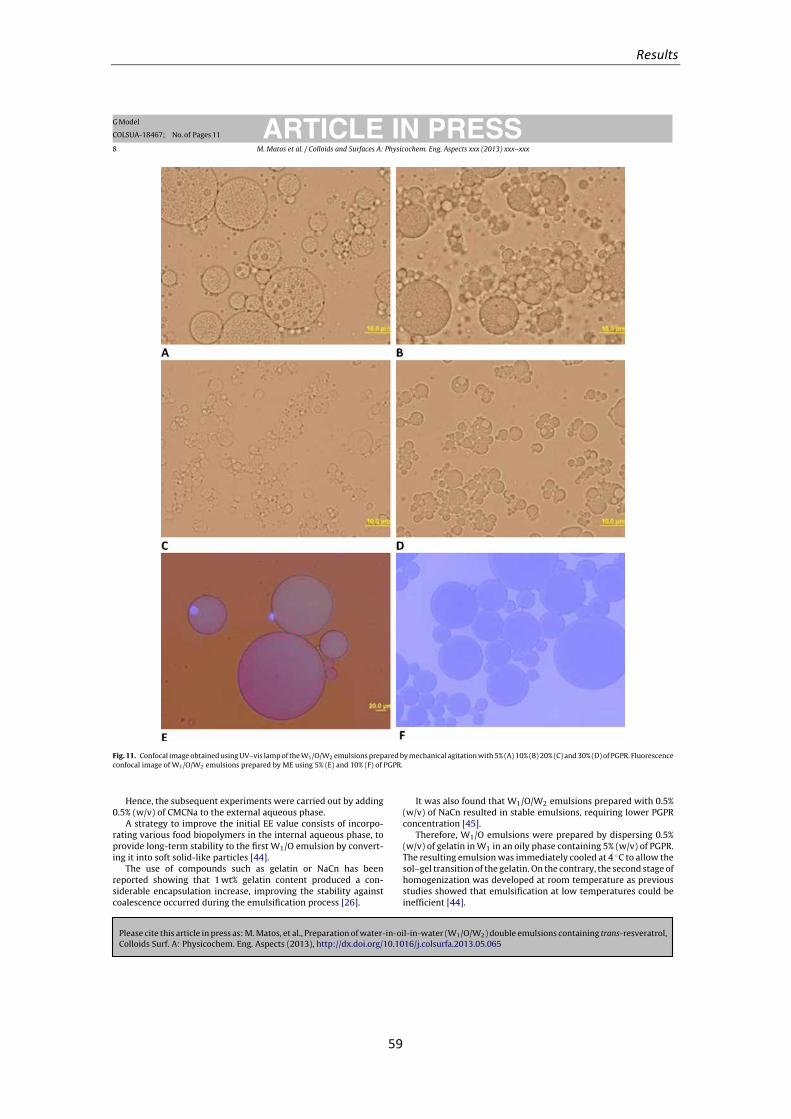
Results
59
Please cite this article in press as: M. Matos, et al., Preparation of water-in-oil-in-water (W1/O/W2) double emulsions containing trans-resveratrol,Colloids Surf. A: Physicochem. Eng. Aspects (2013), http://dx.doi.org/10.1016/j.colsurfa.2013.05.065
ARTICLE IN PRESSG Model
COLSUA-18467; No. of Pages 11
8 M. Matos et al. / Colloids and Surfaces A: Physicochem. Eng. Aspects xxx (2013) xxx–xxx
Fig. 11. Confocal image obtained using UV–vis lamp of the W1/O/W2 emulsions prepared by mechanical agitation with 5% (A) 10% (B) 20% (C) and 30% (D) of PGPR. Fluorescenceconfocal image of W1/O/W2 emulsions prepared by ME using 5% (E) and 10% (F) of PGPR.
Hence, the subsequent experiments were carried out by adding0.5% (w/v) of CMCNa to the external aqueous phase.
A strategy to improve the initial EE value consists of incorpo-rating various food biopolymers in the internal aqueous phase, toprovide long-term stability to the first W1/O emulsion by convert-ing it into soft solid-like particles [44].
The use of compounds such as gelatin or NaCn has beenreported showing that 1 wt% gelatin content produced a con-siderable encapsulation increase, improving the stability againstcoalescence occurred during the emulsification process [26].
It was also found that W1/O/W2 emulsions prepared with 0.5%(w/v) of NaCn resulted in stable emulsions, requiring lower PGPRconcentration [45].
Therefore, W1/O emulsions were prepared by dispersing 0.5%(w/v) of gelatin in W1 in an oily phase containing 5% (w/v) of PGPR.The resulting emulsion was immediately cooled at 4 ◦C to allow thesol–gel transition of the gelatin. On the contrary, the second stage ofhomogenization was developed at room temperature as previousstudies showed that emulsification at low temperatures could beinefficient [44].
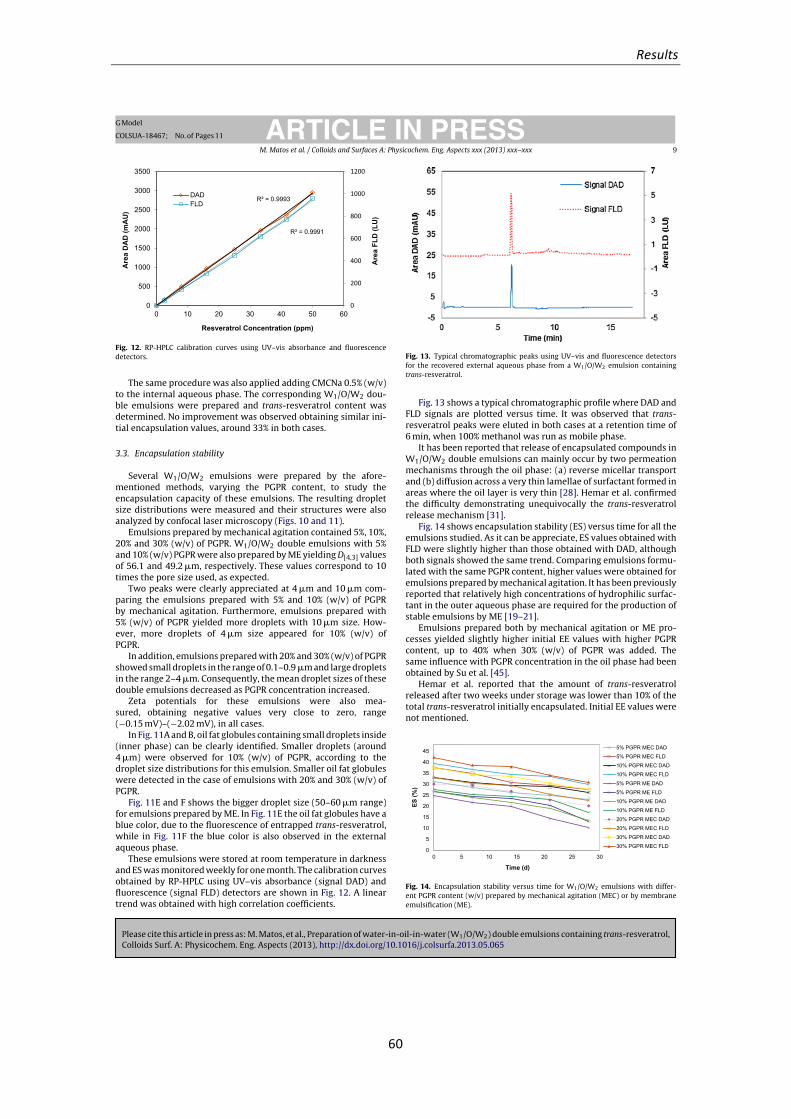
Results
60
Please cite this article in press as: M. Matos, et al., Preparation of water-in-oil-in-water (W1/O/W2) double emulsions containing trans-resveratrol,Colloids Surf. A: Physicochem. Eng. Aspects (2013), http://dx.doi.org/10.1016/j.colsurfa.2013.05.065
ARTICLE IN PRESSG Model
COLSUA-18467; No. of Pages 11
M. Matos et al. / Colloids and Surfaces A: Physicochem. Eng. Aspects xxx (2013) xxx–xxx 9
R² = 0.9993
R² = 0.9991
0
200
400
600
800
1000
1200
0
500
1000
1500
2000
2500
3000
3500
0 10 20 30 40 50 60
Are
a FL
D (L
U)
Are
a D
AD
(mA
U)
Resveratrol Concentration (ppm)
DADFLD
Fig. 12. RP-HPLC calibration curves using UV–vis absorbance and fluorescencedetectors.
The same procedure was also applied adding CMCNa 0.5% (w/v)to the internal aqueous phase. The corresponding W1/O/W2 dou-ble emulsions were prepared and trans-resveratrol content wasdetermined. No improvement was observed obtaining similar ini-tial encapsulation values, around 33% in both cases.
3.3. Encapsulation stability
Several W1/O/W2 emulsions were prepared by the afore-mentioned methods, varying the PGPR content, to study theencapsulation capacity of these emulsions. The resulting dropletsize distributions were measured and their structures were alsoanalyzed by confocal laser microscopy (Figs. 10 and 11).
Emulsions prepared by mechanical agitation contained 5%, 10%,20% and 30% (w/v) of PGPR. W1/O/W2 double emulsions with 5%and 10% (w/v) PGPR were also prepared by ME yielding D[4,3] valuesof 56.1 and 49.2 �m, respectively. These values correspond to 10times the pore size used, as expected.
Two peaks were clearly appreciated at 4 �m and 10 �m com-paring the emulsions prepared with 5% and 10% (w/v) of PGPRby mechanical agitation. Furthermore, emulsions prepared with5% (w/v) of PGPR yielded more droplets with 10 �m size. How-ever, more droplets of 4 �m size appeared for 10% (w/v) ofPGPR.
In addition, emulsions prepared with 20% and 30% (w/v) of PGPRshowed small droplets in the range of 0.1–0.9 �m and large dropletsin the range 2–4 �m. Consequently, the mean droplet sizes of thesedouble emulsions decreased as PGPR concentration increased.
Zeta potentials for these emulsions were also mea-sured, obtaining negative values very close to zero, range(−0.15 mV)–(−2.02 mV), in all cases.
In Fig. 11A and B, oil fat globules containing small droplets inside(inner phase) can be clearly identified. Smaller droplets (around4 �m) were observed for 10% (w/v) of PGPR, according to thedroplet size distributions for this emulsion. Smaller oil fat globuleswere detected in the case of emulsions with 20% and 30% (w/v) ofPGPR.
Fig. 11E and F shows the bigger droplet size (50–60 �m range)for emulsions prepared by ME. In Fig. 11E the oil fat globules have ablue color, due to the fluorescence of entrapped trans-resveratrol,while in Fig. 11F the blue color is also observed in the externalaqueous phase.
These emulsions were stored at room temperature in darknessand ES was monitored weekly for one month. The calibration curvesobtained by RP-HPLC using UV–vis absorbance (signal DAD) andfluorescence (signal FLD) detectors are shown in Fig. 12. A lineartrend was obtained with high correlation coefficients.
Fig. 13. Typical chromatographic peaks using UV–vis and fluorescence detectorsfor the recovered external aqueous phase from a W1/O/W2 emulsion containingtrans-resveratrol.
Fig. 13 shows a typical chromatographic profile where DAD andFLD signals are plotted versus time. It was observed that trans-resveratrol peaks were eluted in both cases at a retention time of6 min, when 100% methanol was run as mobile phase.
It has been reported that release of encapsulated compounds inW1/O/W2 double emulsions can mainly occur by two permeationmechanisms through the oil phase: (a) reverse micellar transportand (b) diffusion across a very thin lamellae of surfactant formed inareas where the oil layer is very thin [28]. Hemar et al. confirmedthe difficulty demonstrating unequivocally the trans-resveratrolrelease mechanism [31].
Fig. 14 shows encapsulation stability (ES) versus time for all theemulsions studied. As it can be appreciate, ES values obtained withFLD were slightly higher than those obtained with DAD, althoughboth signals showed the same trend. Comparing emulsions formu-lated with the same PGPR content, higher values were obtained foremulsions prepared by mechanical agitation. It has been previouslyreported that relatively high concentrations of hydrophilic surfac-tant in the outer aqueous phase are required for the production ofstable emulsions by ME [19–21].
Emulsions prepared both by mechanical agitation or ME pro-cesses yielded slightly higher initial EE values with higher PGPRcontent, up to 40% when 30% (w/v) of PGPR was added. Thesame influence with PGPR concentration in the oil phase had beenobtained by Su et al. [45].
Hemar et al. reported that the amount of trans-resveratrolreleased after two weeks under storage was lower than 10% of thetotal trans-resveratrol initially encapsulated. Initial EE values werenot mentioned.
0
5
10
15
20
25
30
35
40
45
0 5 10 15 20 25 30
ES (%
)
Time (d)
5% PGPR MEC DAD
5% PGPR MEC FLD
10% PGPR MEC DAD
10% PGPR MEC FLD
5% PGPR ME DAD
5% PGPR ME FLD
10% PGPR ME DAD
10% PGPR ME FLD
20% PGPR MEC DAD
20% PGPR MEC FLD
30% PGPR MEC DAD
30% PGPR MEC FLD
Fig. 14. Encapsulation stability versus time for W1/O/W2 emulsions with differ-ent PGPR content (w/v) prepared by mechanical agitation (MEC) or by membraneemulsification (ME).
Results
61
Please cite this article in press as: M. Matos, et al., Preparation of water-in-oil-in-water (W1/O/W2) double emulsions containing trans-resveratrol,Colloids Surf. A: Physicochem. Eng. Aspects (2013), http://dx.doi.org/10.1016/j.colsurfa.2013.05.065
ARTICLE IN PRESSG Model
COLSUA-18467; No. of Pages 11
10 M. Matos et al. / Colloids and Surfaces A: Physicochem. Eng. Aspects xxx (2013) xxx–xxx
For double emulsions prepared by mechanical agitation with10, 20 and 30% (w/v) of PGPR, trans-resveratrol release after twoweeks was 10%, while for emulsions prepared with 5% the releasewas 15%. Thereby, the stability of double emulsions was also influ-enced by PGPR concentration. Similar results were reported bySu et al. [45].
Emulsions prepared by ME showed higher release probablydue to the bigger size of the oil fat globules obtained by thistechnique.
4. Conclusions
A procedure to determine the encapsulation efficiency (EE)of W1/O/W2 double emulsions containing trans-resveratrol usingRP-HPLC with UV–vis absorbance and fluorescence detectors wasdescribed.
For the formulation of water-in-oil-in-water (W1/O/W2) doubleemulsions to encapsulate trans-resveratrol, polyglycerol polyrici-noleate (PGPR) was the best inner emulsifier. The combination ofTween 20 and CMCNa in the external aqueous phase seemed tohave a synergetic effect leading to better initial EE values.
More stable emulsions were obtained when they were preparedby mechanical agitation. An increase in PGPR content yielded aslight increase in initial EE values.
W1/O/W2 double emulsions formulated to encapsulate trans-resveratrol are complex systems due to ethanol present in W1,which was required to dissolve trans-resveratrol in water. Furtherformulations tests should be undertaken to improve the encapsu-lation ability of these emulsions.
Acknowledgments
M. Matos is recipient of a FPI pre-doctoral fellowship (MEC,Spain). Financial support by the Ministerio de Ciencia e Innovación(MICINN, Spain) and the European Commission (projects Ref.:CTQ2007-65348 and MICINN-10-CTQ2010-20009-C02-01 Euro-pean Regional Development Fund) are gratefully acknowledged.
This study was co-financed by the Consejería de Educación yCiencia del Principado de Asturias (PCTI Asturias 2006–2009, Ref.:EQP06-024).
References
[1] A. Amri, J.C. Chaumeil, S. Sfar, C. Charreau, Administration of resveratrol: whatformulation solutions to bioavailability limitations? J. Control. Release 158(2012) 182–193.
[2] P. Saiko, A. Szakmary, W. Jaeger, T. Szekeres, Resveratrol and its analogs:defense against cancer, coronary disease and neurodegenerative maladies orjust a fad? Mutat. Res.: Rev. Mutat. Res. 658 (2008) 68–94.
[3] H. Peng, H. Xiong, J. Li, M. Xie, Y. Liu, C. Bai, L. Chen, Vanillin cross-linked chi-tosan microspheres for controlled release of resveratrol, Food Chem. 121 (2010)23–28.
[4] I. Kolouchová-Hanzlíková, K. Melzoch, V. Filip, J. Samidrkl, Rapid method forresveratrol determination by HPLC with electrochemical and UV detections inwines, Food Chem. 87 (2004) 151–158.
[5] O. Gürbüz, D. Göcmen, F. Dagdelen, M. Gürsoy, S. Aydin, I. Sahin, L. Büyükuysal,M. Usta, Determination of flavan-3-ols and trans-resveratrol in grapes andwines using HPLC fluorescence detection, Food Chem. 100 (2007) 518–525.
[6] Z.X. Fang, B. Bhandari, Encapsulation of polyphenols—a review, Trends FoodSci. Technol. 21 (2010) 510–523.
[7] K. Teskac, J. Kristl, The evidence for solid lipid nanoparticles mediated celluptake of resveratrol, Int. J. Pharm. 390 (2010) 61–69.
[8] J.Y. Fang, C.F. Hung, M.H. Liao, C.C. Chien, A study of the formulation designof acoustically active lipospheres as carriers for drug delivery, Eur. J. Pharm.Biopharm. 67 (2007) 67–75.
[9] F. Donsi, M. Sessa, H. Mediouni, A. Mgaidi, G. Ferrari, Encapsulation of bioac-tive compounds in nanoemulsion-based delivery systems, Procedia Food Sci. 1(2011) 1666–1671.
[10] J. Shao, X. Li, X. Lu, C. Jiang, Y. Hu, Q. Li, Y. You, Z. Fu, Enhanced growth inhibi-tion effect of resveratrol incorporated into biodegradable nanoparticles againstglioma cells is mediated by the induction of intracellular reactive oxygenspecies levels, Colloids Surf. B: Biointerfaces 72 (2009) 40–47.
[11] B. Caddeo, K. Teskac, C. Sinico, J. Kristl, Effect of resveratrol incorporated inliposomes on proliferation and UV-B protection of cells, Int. J. Pharm. 363 (2008)183–191.
[12] X.-X. Wang, Y.-B. Li, H.-J. Yao, R.-J. Ju, Y. Zhang, R.-J. Li, Y. Yu, L. Zhang, W.-L. Lu, The use of mitochondrial targeting resveratrol liposomes modified witha dequalinium polyethylene glycol–distearoylphosphatidyl ethanolamine con-jugate to induce apoptosis in resistant lung cancer cells, Biomaterials 32 (2011)5673–5687.
[13] C. Lucas-Abellán, I. Fortea, J.M. López-Nicolás, E. Núnez-Delicado, Cyclodextrinsas resveratrol carrier system, Food Chem. 104 (2007) 39–44.
[14] J. Kristl, K. Teskac, C. Caddeo, Z. Abramovic, M. Sentjurc, Improvements of cel-lular stress response on resveratrol in liposomes, Eur. J. Pharm. Biopharm. 773(2009) 253–259.
[15] S. Fabris, F. Momo, G. Ravagnan, R. Stevanato, Antioxidant properties of resver-atrol and piceid on lipid peroxidation in micelles and monolamellar liposomes,Biophys. Chem. 135 (2008) 76–83.
[16] A. Aserin, Multiple Emulsions: Technology and Applications, Wiley Inter-science, Hoboken, USA, 2008.
[17] N. Garti, Double emulsions—scope, limitations and new achievements, ColloidsSurf. A: Physicochem. Eng. Aspects 123/124 (1997) 233–246.
[18] H. Okochi, M. Nakano, Comparative study of two preparation methods ofW/O/W emulsions: stirring and membrane emulsification, Chem. Pharm. Bull.45 (1997) 1323–1326.
[19] J.S. de los Reyes, C. Charcosset, Preparation of water-in-oil and ethanol-in-oilemulsions by membrane emulsification, Fuel 89 (2010) 3482–3488.
[20] T. Schmidts, D. Dobler, A.-C. Guldan, N. Paulus, F. Runkel, Multiple W/O/Wemulsions—using the required HLB for emulsifier evaluation, Colloids Surf. A:Physicochem. Eng. Aspects 372 (2010) 48–54.
[21] S. van der Graaf, C.G.P.H. Schroën, R.M. Boom, Preparation of double emulsionsby membrane emulsification—a review, J. Membr. Sci. 251 (2005) 7–15.
[22] T. Nakashima, M. Shimizu, M. Kukizaki, Particle control of emulsion by mem-brane emulsification and its applications, Adv. Drug Deliv. Rev. 45 (2000)47–56.
[23] Y. Mine, M. Shimizu, T. Nakashima, Preparation and stabilization of simpleand multiple emulsions using a microporous glass membrane, Colloids Surf.B: Biointerfaces 6 (1996) 261–268.
[24] A.L. Márquez, A. Medrano, L.A. Panizzolo, J.R. Wagner, Effect of calcium saltsand surfactant concentration on the stability of water-in-oil emulsions pre-pared with polyglycerol polyricinoleate, J. Colloid Interface Sci. 341 (2010)101–108.
[25] C. Charcosset, Preparation of emulsions and particles by membrane emulsifi-cation for the food processing industry, J. Food Eng. 92 (2009) 241–249.
[26] E. Dickinson, Double emulsions stabilized by food biopolymers, Food Biophys.6 (2011) 1–11.
[27] N. Krog, Functions of emulsifiers in food systems, J. Am. Oil Chem. Soc. 54 (1977)124–131.
[28] N. Garti, Progress in stabilization and transport phenomena of double emul-sions in food applications, LWT – Food Sci. Technol. 30 (1997) 222–235.
[29] S. Frasch-Melnik, F. Spyropoulos, I.T. Norton, W1/O/W2 double emulsions sta-bilised by fat crystals—formulation, stability and salt release, J. Colloid InterfaceSci. 350 (2010) 178–185.
[30] S. Frasch-Melnik, I.T. Norton, F. Spyropoulos, Fat-crystal stabilised w/o emul-sions for controlled salt release, J. Food Eng. 98 (2010) 437–442.
[31] Y. Hemar, L.J. Cheng, C.M. Oliver, L. Sanguansri, M. Augustin, Encapsulationof resveratrol using water-in-oil-in-water double emulsions, Food Biophys. 5(2010) 120–127.
[32] P. Vinas, C. López-Erroz, J.J. Marín-Hernández, M. Marín-Hernández, Determi-nation of phenols in wines by liquid chromatography with photodiode arrayand fluorescence detection, J. Chromatogr. A 871 (2000) 85–93.
[33] Xilan Sun, Bin Peng, Weidong Yan, Measurement and correlation of solubilityof trans-resveratrol in 11 solvents at T = (278.2, 288. 2, 298. 2, 308. 2 and 318.2) K, J. Chem. Thermodyn. 40 (2008) 735–738.
[34] R. Wilson, B.J. Van Schie, D. Howes, Overview of the preparation, use and bio-logical studies on polyglycerol polyricinoleate (PGPR), Food Chem. Toxicol. 36(1998) 711–718.
[35] G. Gutiérrez, M. Rayner, P. Dejmek, Production of vegetable oil inmilk emulsions using membrane emulsification, Desalination 245 (2009)631–638.
[36] Y.P. Zhao, R. Turay, L. Hundley, Monitoring and predicting emulsion stability ofmetalworking fluids by salt titration and laser light scattering method, Tribol.Trans. 49 (2006) 117–123.
[37] M. Matos, A. Lobo, J.M. Benito, A. Cambiella, J. Coca, C. Pazos, Extending the use-ful life of metalworking fluids in a copper wire drawing industry by monitoringtheir functional properties, Tribol. Trans. 55 (2012) 685–692.
[38] J. O’Regan, D.M. Mulivhill, Water soluble inner aqueous phase mark-ers as indicators of the encapsulation properties of water-in-oil-in-wateremulsions stabilized with sodium caseinate, Food Hydrocolloids 23 (2009)2339–2345.
[39] A.L. Márquez, G.G. Palazolo, J.R. Wagner, Water in oil (w/o) and double (w/o/w)emulsions prepared with spans: microstructure, stability, and rheology, ColloidPolym. Sci. 285 (2007) 1119–1128.
[40] L. Liang, H.A. Tajmir-Riahi, M. Subirade, Interaction of beta-lactoglobulin withresveratrol and its biological implications, Biomacromolecules 9 (2008) 50–56.
[41] Y. Hemar, M. Gerbeaud, C.M. Oliver, M.A. Augustin, Investigation into the inter-action between resveratrol and whey proteins using fluorescence spectroscopy,Int. J. Food Sci. Technol. 46 (2011) 2137–2144.
Results
62
Please cite this article in press as: M. Matos, et al., Preparation of water-in-oil-in-water (W1/O/W2) double emulsions containing trans-resveratrol,Colloids Surf. A: Physicochem. Eng. Aspects (2013), http://dx.doi.org/10.1016/j.colsurfa.2013.05.065
ARTICLE IN PRESSG Model
COLSUA-18467; No. of Pages 11
M. Matos et al. / Colloids and Surfaces A: Physicochem. Eng. Aspects xxx (2013) xxx–xxx 11
[42] Y. Kawashima, T. Hino, H. Takeuchi, T. Niwa, K. Horibe, Shear-induced phaseinversion and size control of water/oil/water emulsion droplets with porousmembrane, J. Colloid Interface Sci. 145 (1991) 512–523.
[43] M. Benna-Zayani, N. Kbir-Ariguib, N. Trabelsi-Ayadi, J.-L. Grossiord, Stabilisa-tion of W/O/W double emulsion by polysaccharides as weak gels, Colloids Surf.A: Physicochem. Eng. Aspects 316 (2008) 46–54.
[44] L. Sapei, M.A. Naqvi, D. Rousseau, Stability and release properties ofdouble emulsions for food applications, Food Hydrocolloids 27 (2012)316–323.
[45] J. Su, J. Flanagan, Y. Hemar, H. Singha, Synergistic effects of polyglycerolester of polyricinoleic acid and sodium caseinate on the stabilisation ofwater–oil–water emulsions, Food Hydrocolloids 20 (2006) 261–268.
Results
63
IV. Preparation of HIPEs with controlled droplet size containing lutein
Lutein is a natural carotenoid of lipophilic character which possesses exceptional physiological functions since it enhances body immunity against atherosclerosis and cataracts. It is also found naturally in human skin, where it acts as a potential antioxidant maintaining skin health by reducing UV-‐induced erythema and inflammation. Because of the link between UV radiation exposure and skin cancer, lutein may play a protective role against skin cancer. Nevertheless, lutein applications in food and cosmetic formulations are limited due to its instability towards oxygen, light and heat. So, the use of oil droplets as lutein carriers is a way to avoid those limitations.
The aim of this study was to prepare highly concentrated O/W emulsions containing lutein, with controlled droplet size by a two-‐step technique, using a non-‐ionic surfactant as stabilizer. For this purpose, a 50% (v/v) emulsion was prepared by either mechanical agitation or membrane emulsification, and it was subsequently concentrated by vacuum evaporation to obtain a gel emulsion.
Article 3. G. Gutiérrez, M. Matos, J.M. Benito, J. Coca and C. Pazos. “Preparation of HIPEs with controlled droplet size containing lutein”.
Colloids and Surfaces A: Physicochemical and Engineering Aspects http://dx.doi.org/10.1016/j.colsurfa.2013.05.077
Personal contribution to work
I developed experiments to optimize the emulsions preparation technique by membrane emulsification and vacuum evaporation. I prepared lutein-‐containing emulsions and established the procedure for measuring encapsulation efficiency by spectroscopy. Finally, I shared with my thesis co-‐supervisor, Dr. Gemma Gutiérrez, the task of writing the manuscript and preparing the figures included.
Resultados
64
IV. Preparación de HIPES con tamaño de gota controlado conteniendo luteína
La luteína es un carotenoide natural con carácter lipófilo que posee funciones fisiológicas excepcionales, ya que mejora la inmunidad del cuerpo contra la aterosclerosis y las cataratas. También se encuentra de manera natural en la piel humana, donde actúa como antioxidante potencial manteniendo la salud de este órgano, al reducir el eritema inducido por radiación UV y la inflamación. Debido a la relación entre la exposición a la radiación UV y el cáncer de piel, la luteína podría jugar un papel protector contra el mismo. Sin embargo, su aplicación en alimentos y formulaciones de tipo cosmético se encuentra limitada por su inestabilidad frente al oxígeno, la luz y la temperatura. En este sentido, el uso de gotas de aceite portadoras de luteína se ofrece como una alternativa para paliar estas limitaciones.
El objetivo de este trabajo fue preparar emulsiones aceite-‐agua (O/W) con elevada proporción de fase interna conteniendo luteína y tamaño de gota controlado mediante una técnica en dos etapas, usando un tensioactivo no iónico como estabilizante. Para ello, se preparó inicialmente una emulsión del 50% (v/v), mediante agitación mecánica o emulsificación con membranas, que posteriormente se concentró por evaporación a vacío hasta obtener una emulsión tipo gel.
Artículo 3. G. Gutiérrez, M. Matos, J.M. Benito, J. Coca y C. Pazos. “Preparation of HIPEs with controlled droplet size containing lutein”.
Colloids and Surfaces A: Physicochemical and Engineering Aspects http://dx.doi.org/10.1016/j.colsurfa.2013.05.077
Aportación personal al trabajo
Desarrollé los experimentos para optimizar el proceso de preparación de emulsiones concentradas mediante emulsificación con membranas y evaporación a vacío. Preparé las emulsiones conteniendo luteína y establecí el procedimiento para medir la eficacia de encapsulación mediante espectroscopía. Finalmente, compartí con mi co-‐directora de Tesis, Dr. Gemma Gutiérrez, la tarea de redactar el manuscrito y preparar las figuras en él incluidas.
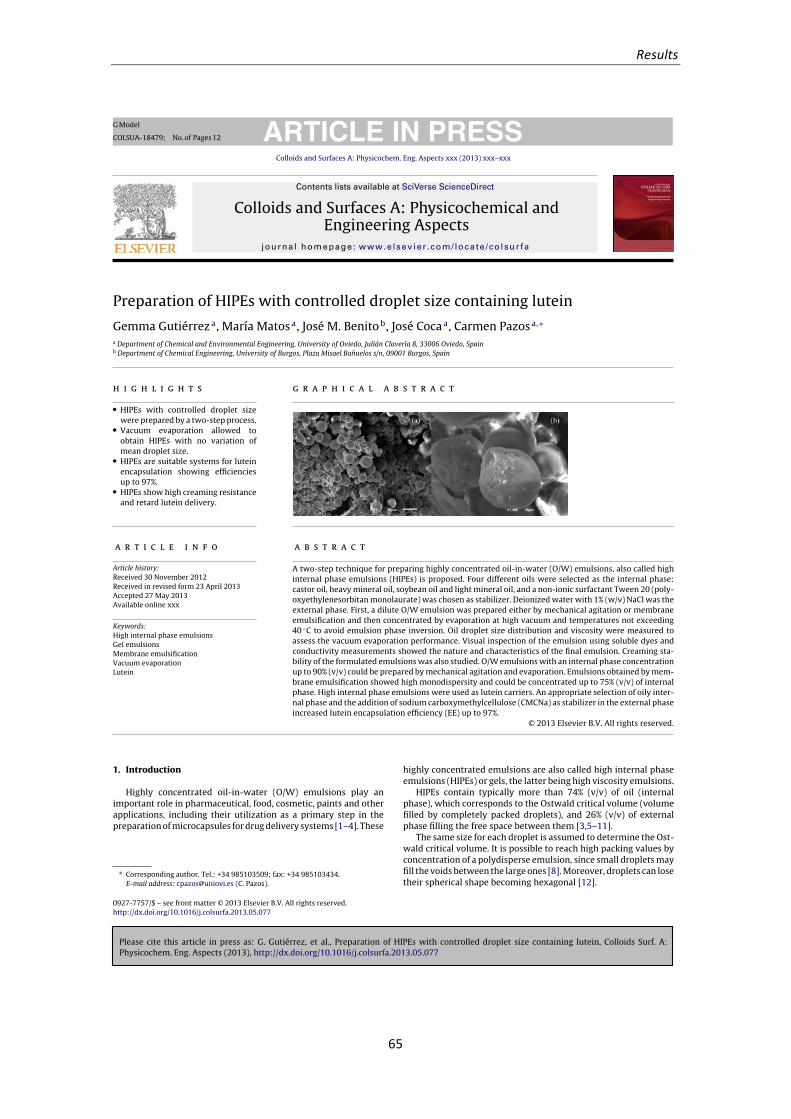
Results
65
Please cite this article in press as: G. Gutiérrez, et al., Preparation of HIPEs with controlled droplet size containing lutein, Colloids Surf. A:Physicochem. Eng. Aspects (2013), http://dx.doi.org/10.1016/j.colsurfa.2013.05.077
ARTICLE IN PRESSG Model
COLSUA-18479; No. of Pages 12
Colloids and Surfaces A: Physicochem. Eng. Aspects xxx (2013) xxx–xxx
Contents lists available at SciVerse ScienceDirect
Colloids and Surfaces A: Physicochemical andEngineering Aspects
journa l homepage: www.e lsev ier .com/ locate /co lsur fa
Preparation of HIPEs with controlled droplet size containing lutein
Gemma Gutiérreza, María Matosa, José M. Benitob, José Cocaa, Carmen Pazosa,∗
a Department of Chemical and Environmental Engineering, University of Oviedo, Julián Clavería 8, 33006 Oviedo, Spainb Department of Chemical Engineering, University of Burgos, Plaza Misael Banuelos s/n, 09001 Burgos, Spain
h i g h l i g h t s
• HIPEs with controlled droplet sizewere prepared by a two-step process.
• Vacuum evaporation allowed toobtain HIPEs with no variation ofmean droplet size.
• HIPEs are suitable systems for luteinencapsulation showing efficienciesup to 97%.
• HIPEs show high creaming resistanceand retard lutein delivery.
g r a p h i c a l a b s t r a c t
a r t i c l e i n f o
Article history:Received 30 November 2012Received in revised form 23 April 2013Accepted 27 May 2013Available online xxx
Keywords:High internal phase emulsionsGel emulsionsMembrane emulsificationVacuum evaporationLutein
a b s t r a c t
A two-step technique for preparing highly concentrated oil-in-water (O/W) emulsions, also called highinternal phase emulsions (HIPEs) is proposed. Four different oils were selected as the internal phase:castor oil, heavy mineral oil, soybean oil and light mineral oil, and a non-ionic surfactant Tween 20 (poly-oxyethylenesorbitan monolaurate) was chosen as stabilizer. Deionized water with 1% (w/v) NaCl was theexternal phase. First, a dilute O/W emulsion was prepared either by mechanical agitation or membraneemulsification and then concentrated by evaporation at high vacuum and temperatures not exceeding40 ◦C to avoid emulsion phase inversion. Oil droplet size distribution and viscosity were measured toassess the vacuum evaporation performance. Visual inspection of the emulsion using soluble dyes andconductivity measurements showed the nature and characteristics of the final emulsion. Creaming sta-bility of the formulated emulsions was also studied. O/W emulsions with an internal phase concentrationup to 90% (v/v) could be prepared by mechanical agitation and evaporation. Emulsions obtained by mem-brane emulsification showed high monodispersity and could be concentrated up to 75% (v/v) of internalphase. High internal phase emulsions were used as lutein carriers. An appropriate selection of oily inter-nal phase and the addition of sodium carboxymethylcellulose (CMCNa) as stabilizer in the external phaseincreased lutein encapsulation efficiency (EE) up to 97%.
© 2013 Elsevier B.V. All rights reserved.
1. Introduction
Highly concentrated oil-in-water (O/W) emulsions play animportant role in pharmaceutical, food, cosmetic, paints and otherapplications, including their utilization as a primary step in thepreparation of microcapsules for drug delivery systems [1–4]. These
∗ Corresponding author. Tel.: +34 985103509; fax: +34 985103434.E-mail address: [email protected] (C. Pazos).
highly concentrated emulsions are also called high internal phaseemulsions (HIPEs) or gels, the latter being high viscosity emulsions.
HIPEs contain typically more than 74% (v/v) of oil (internalphase), which corresponds to the Ostwald critical volume (volumefilled by completely packed droplets), and 26% (v/v) of externalphase filling the free space between them [3,5–11].
The same size for each droplet is assumed to determine the Ost-wald critical volume. It is possible to reach high packing values byconcentration of a polydisperse emulsion, since small droplets mayfill the voids between the large ones [8]. Moreover, droplets can losetheir spherical shape becoming hexagonal [12].
0927-7757/$ – see front matter © 2013 Elsevier B.V. All rights reserved.http://dx.doi.org/10.1016/j.colsurfa.2013.05.077
Results
66
Please cite this article in press as: G. Gutiérrez, et al., Preparation of HIPEs with controlled droplet size containing lutein, Colloids Surf. A:Physicochem. Eng. Aspects (2013), http://dx.doi.org/10.1016/j.colsurfa.2013.05.077
ARTICLE IN PRESSG Model
COLSUA-18479; No. of Pages 12
2 G. Gutiérrez et al. / Colloids and Surfaces A: Physicochem. Eng. Aspects xxx (2013) xxx–xxx
Although these types of emulsions were formulated long ago,their preparation arouses great interest, as some recent studiespoint out [6,13–19]. The most common method for preparing agel emulsion consists of the slow addition of an internal phaseinto an external phase, followed by homogenization [8,20,21]. Analternative method is the Phase Inversion Temperature (PIT) method[14,22], in which an initial dilute emulsion is prepared using a non-ionic surfactant. The temperature is then increased to reach thephase transition of the emulsion. A concentrated HIPE is the resultwhere the external phase is the internal phase of the initial diluteemulsion and vice versa. This technique has some advantages withrespect to conventional ones, since lower energy and less surfactantconcentration are required and the final emulsion is more stableand less prone to creaming.
Membrane emulsification is a technique widely studied for thelast 20 years [23–25], which consists of the injection of an inter-nal phase through the membrane pores while the external phasemoves over the membrane surface enhancing droplet detachment.Two techniques are mainly used: (i) tubular membranes in whichinternal phase is injected from the outer part of the membranewhile the external phase flows through the membrane lumen[26,27], and (ii) flat membranes where the internal phase is injectedfrom the bottom side of the membrane and the external phase isplaced in the upper part [28].
Membrane emulsification gives high control on droplet size,since the droplet diameter is in the range of 2–10 times the mem-brane pore diameter [23–25].
Emulsions are often used as carriers of biocompounds either forfood or cosmetic applications. The use of HIPEs as carriers offersclear advantages from the transport point of view. Moreover, theaddition of small amounts of a concentrated system can increasethe added value of previously formed product.
Lutein is a natural carotenoid with lipophilic character, found inseveral vegetables and egg yolk [29–31]. Lutein possesses excep-tional physiological functions since it enhances body immunityagainst atherosclerosis and cataracts. Lutein is also found naturallyin human skin, where acts as a potential antioxidant maintainingskin health by reducing UV-induced erythema and inflammation.Because of the link between UV radiation (particularly its UVB com-ponent) exposure and skin cancer, lutein may play a protective roleagainst skin cancer [29].
Lutein concentration was based on studies where it was demon-strated that topical treatment with 50 mg/L lutein twice per dayinduces immediate increase in superficial skin lipids and significantreduction in skin lipid peroxidation, improving the photoprotectiveactivity and also the skin elasticity and hydration [29].
Lutein application in food and cosmetic formulations is limitedby its instability towards oxygen, light and temperature, and hencethe use of oil droplets as lutein carriers is considered a suitabletechnique [29,30].
The aim of this study was to prepare highly concentrated O/Wemulsions containing lutein, a lipophilic biocompound, with con-trolled droplet size by a two-step technique, using a non-ionicsurfactant as stabilizer. A 50% (v/v) emulsion was prepared by eithermechanical agitation or membrane emulsification and it was con-centrated by vacuum evaporation to obtain a gel emulsion. Severaloils were selected as internal phase and the effect of viscosity andemulsion stability was studied.
2. Materials and methods
2.1. Materials
Four types of oil supplied by Sigma–Aldrich (USA) were tested asinternal phase: castor oil (�d = 541 mPa s, �d = 836 kg/m3 at 25 ◦C),
heavy mineral oil (�d = 99.3 mPa s, �d = 832 kg/m3 at 25 ◦C), soybeanoil (�d = 64.8 mPa s, �d = 850 kg/m3 at 25 ◦C) and light mineral oil(�d = 15.9 mPa s, �d = 838 kg/m3 at 25 ◦C).
A non-ionic surfactant Tween® 20 (polyoxyethylenesor-bitan monolaurate) from Sigma–Aldrich (USA), which hashydrophilic–lipophilic balance (HLB) of 16.7, was selected as stabi-lizer for all emulsions.
Two dyes were used to visualize the external phase of theformulated emulsions, i.e. water-soluble copper II phtalocyanine-tetrasulfonic acid tetrasodium salt (blue), and oil-soluble fat redbluish (red) (Sigma–Aldrich, USA). Traces of both dyes were addedto the emulsion after mechanical agitation to identify the natureof the external phase (water or oil). Deionized water with 1% (w/v)NaCl to increase conductivity (17.2 mS/cm at 25 ◦C) was used as theaqueous phase.
For the encapsulation experiments pure lutein supplied byApplichem GmbH (Germany) was dissolved in soybean oil andused as internal phase. To improve lutein encapsulation, 0.5% (w/v)medium viscosity sodium carboxymethylcellulose (CMCNa) withpolymerization degree 1100 (molar mass = 982 g/mol) supplied bySigma–Aldrich (USA) was used as viscosity modifier.
The following chemicals were used to prepare samples for scan-ning electron microscopy (SEM): agar bacteriological Europeantype (Cultimed, Spain), glutaraldehyde solution 50% (v/v) (Panreac,Spain), imidazole and osmium tetraoxide (Sigma–Aldrich, USA).
2.2. Equipments and methods
2.2.1. Emulsions prepared by mechanical agitationEmulsions were prepared in a first step by mechanical agitation
being their surfactant concentration the same as for the emulsionsprepared by vacuum evaporation. During the evaporation step thesurfactant remained in the concentrate and its concentration (andalso the oil concentration) increased. Thus, for emulsions preparedby mechanical agitation with volumetric water fraction (fw) of 0.5,0.3 and 0.1, surfactant concentrations were 5, 6 and 8% (w/w),respectively. The amounts of aqueous and oil phases were weighed,mixed and left for 24 h before emulsion preparation. Emulsion sam-ples (150 g) were prepared by mechanical agitation using a DIAX900 homogenizer (Heidolph, Germany) with a shaft of 3 mm, at15,000 rpm for 15 min.
2.2.2. Emulsions prepared by membrane emulsificationA 200 mL stirred batch ultrafiltration cell Amicon model 8200
(Millipore, USA) was used for membrane emulsification experi-ments. The internal phase was injected from the bottom part ofthe cell, with the external phase in the upper part.
A tailor-made hydrophilic metallic membrane supplied byMicropore Ltd. (Hatton, Derbyshire, UK) was used in the exper-iments. The membrane had an active diameter of 62.5 mm and200 �m of thickness, with a regular array of circular uniform poresof 5 �m diameter, being 200 �m the distance between pores.
The internal phase was gently fed into the cell by a syringepump KDS-100-CE (KD Scientific, USA) at a rate of 20 mL/min. Theemulsion was continuously stirred at 600 rpm, to favour dropletdetachment.
In previous works with lutein, the oil concentration was in therange of 20–40 mg/L [29,32]. In this work, emulsions containing40 mg/L of lutein in the oil phase were prepared. Lutein was pre-viously dissolved in the oil, and the resulting solution was injectedinto the membrane emulsification device. A schematic diagram ofthe equipment is shown in Fig. 1.
Membranes were cleaned after each experiment with a dish-washing detergent, and rinsed with deionised water (for 15 min)
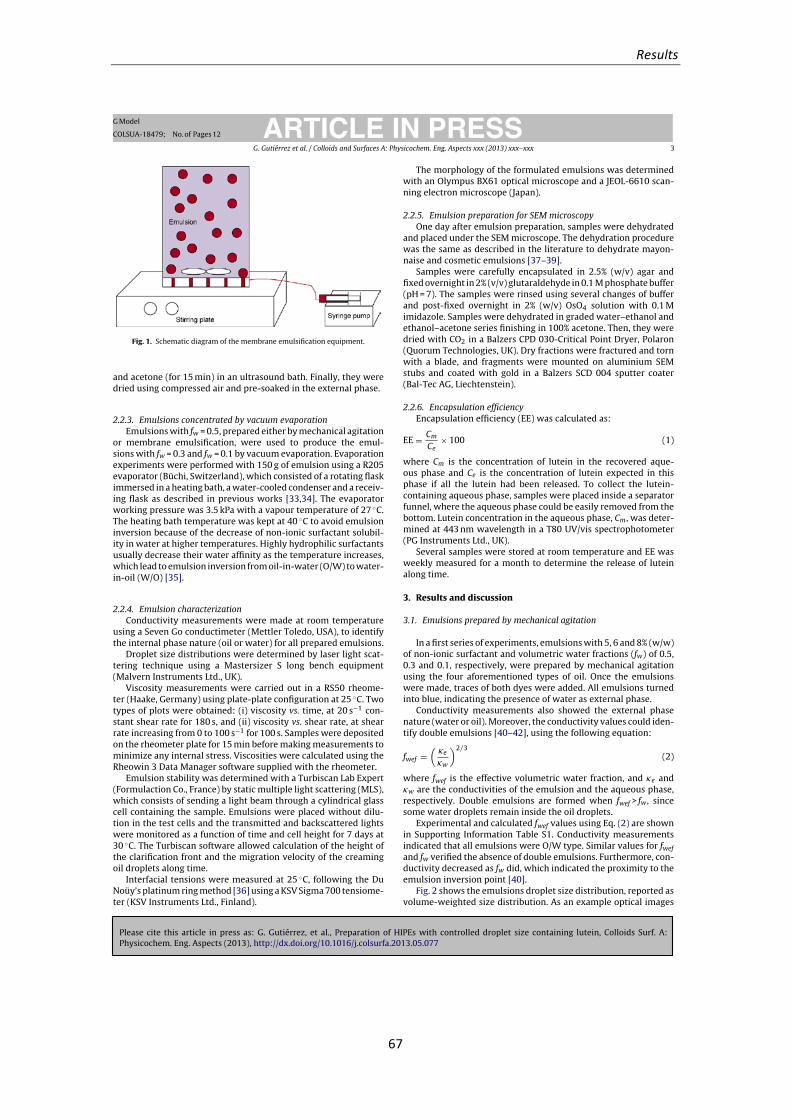
Results
67
Please cite this article in press as: G. Gutiérrez, et al., Preparation of HIPEs with controlled droplet size containing lutein, Colloids Surf. A:Physicochem. Eng. Aspects (2013), http://dx.doi.org/10.1016/j.colsurfa.2013.05.077
ARTICLE IN PRESSG Model
COLSUA-18479; No. of Pages 12
G. Gutiérrez et al. / Colloids and Surfaces A: Physicochem. Eng. Aspects xxx (2013) xxx–xxx 3
Fig. 1. Schematic diagram of the membrane emulsification equipment.
and acetone (for 15 min) in an ultrasound bath. Finally, they weredried using compressed air and pre-soaked in the external phase.
2.2.3. Emulsions concentrated by vacuum evaporationEmulsions with fw = 0.5, prepared either by mechanical agitation
or membrane emulsification, were used to produce the emul-sions with fw = 0.3 and fw = 0.1 by vacuum evaporation. Evaporationexperiments were performed with 150 g of emulsion using a R205evaporator (Büchi, Switzerland), which consisted of a rotating flaskimmersed in a heating bath, a water-cooled condenser and a receiv-ing flask as described in previous works [33,34]. The evaporatorworking pressure was 3.5 kPa with a vapour temperature of 27 ◦C.The heating bath temperature was kept at 40 ◦C to avoid emulsioninversion because of the decrease of non-ionic surfactant solubil-ity in water at higher temperatures. Highly hydrophilic surfactantsusually decrease their water affinity as the temperature increases,which lead to emulsion inversion from oil-in-water (O/W) to water-in-oil (W/O) [35].
2.2.4. Emulsion characterizationConductivity measurements were made at room temperature
using a Seven Go conductimeter (Mettler Toledo, USA), to identifythe internal phase nature (oil or water) for all prepared emulsions.
Droplet size distributions were determined by laser light scat-tering technique using a Mastersizer S long bench equipment(Malvern Instruments Ltd., UK).
Viscosity measurements were carried out in a RS50 rheome-ter (Haake, Germany) using plate-plate configuration at 25 ◦C. Twotypes of plots were obtained: (i) viscosity vs. time, at 20 s−1 con-stant shear rate for 180 s, and (ii) viscosity vs. shear rate, at shearrate increasing from 0 to 100 s−1 for 100 s. Samples were depositedon the rheometer plate for 15 min before making measurements tominimize any internal stress. Viscosities were calculated using theRheowin 3 Data Manager software supplied with the rheometer.
Emulsion stability was determined with a Turbiscan Lab Expert(Formulaction Co., France) by static multiple light scattering (MLS),which consists of sending a light beam through a cylindrical glasscell containing the sample. Emulsions were placed without dilu-tion in the test cells and the transmitted and backscattered lightswere monitored as a function of time and cell height for 7 days at30 ◦C. The Turbiscan software allowed calculation of the height ofthe clarification front and the migration velocity of the creamingoil droplets along time.
Interfacial tensions were measured at 25 ◦C, following the DuNoüy’s platinum ring method [36] using a KSV Sigma 700 tensiome-ter (KSV Instruments Ltd., Finland).
The morphology of the formulated emulsions was determinedwith an Olympus BX61 optical microscope and a JEOL-6610 scan-ning electron microscope (Japan).
2.2.5. Emulsion preparation for SEM microscopyOne day after emulsion preparation, samples were dehydrated
and placed under the SEM microscope. The dehydration procedurewas the same as described in the literature to dehydrate mayon-naise and cosmetic emulsions [37–39].
Samples were carefully encapsulated in 2.5% (w/v) agar andfixed overnight in 2% (v/v) glutaraldehyde in 0.1 M phosphate buffer(pH = 7). The samples were rinsed using several changes of bufferand post-fixed overnight in 2% (w/v) OsO4 solution with 0.1 Mimidazole. Samples were dehydrated in graded water–ethanol andethanol–acetone series finishing in 100% acetone. Then, they weredried with CO2 in a Balzers CPD 030-Critical Point Dryer, Polaron(Quorum Technologies, UK). Dry fractions were fractured and tornwith a blade, and fragments were mounted on aluminium SEMstubs and coated with gold in a Balzers SCD 004 sputter coater(Bal-Tec AG, Liechtenstein).
2.2.6. Encapsulation efficiencyEncapsulation efficiency (EE) was calculated as:
EE = Cm
Ce× 100 (1)
where Cm is the concentration of lutein in the recovered aque-ous phase and Ce is the concentration of lutein expected in thisphase if all the lutein had been released. To collect the lutein-containing aqueous phase, samples were placed inside a separatorfunnel, where the aqueous phase could be easily removed from thebottom. Lutein concentration in the aqueous phase, Cm, was deter-mined at 443 nm wavelength in a T80 UV/vis spectrophotometer(PG Instruments Ltd., UK).
Several samples were stored at room temperature and EE wasweekly measured for a month to determine the release of luteinalong time.
3. Results and discussion
3.1. Emulsions prepared by mechanical agitation
In a first series of experiments, emulsions with 5, 6 and 8% (w/w)of non-ionic surfactant and volumetric water fractions (fw) of 0.5,0.3 and 0.1, respectively, were prepared by mechanical agitationusing the four aforementioned types of oil. Once the emulsionswere made, traces of both dyes were added. All emulsions turnedinto blue, indicating the presence of water as external phase.
Conductivity measurements also showed the external phasenature (water or oil). Moreover, the conductivity values could iden-tify double emulsions [40–42], using the following equation:
fwef =(
�e
�w
)2/3(2)
where fwef is the effective volumetric water fraction, and �e and�w are the conductivities of the emulsion and the aqueous phase,respectively. Double emulsions are formed when fwef > fw, sincesome water droplets remain inside the oil droplets.
Experimental and calculated fwef values using Eq. (2) are shownin Supporting Information Table S1. Conductivity measurementsindicated that all emulsions were O/W type. Similar values for fwefand fw verified the absence of double emulsions. Furthermore, con-ductivity decreased as fw did, which indicated the proximity to theemulsion inversion point [40].
Fig. 2 shows the emulsions droplet size distribution, reported asvolume-weighted size distribution. As an example optical images
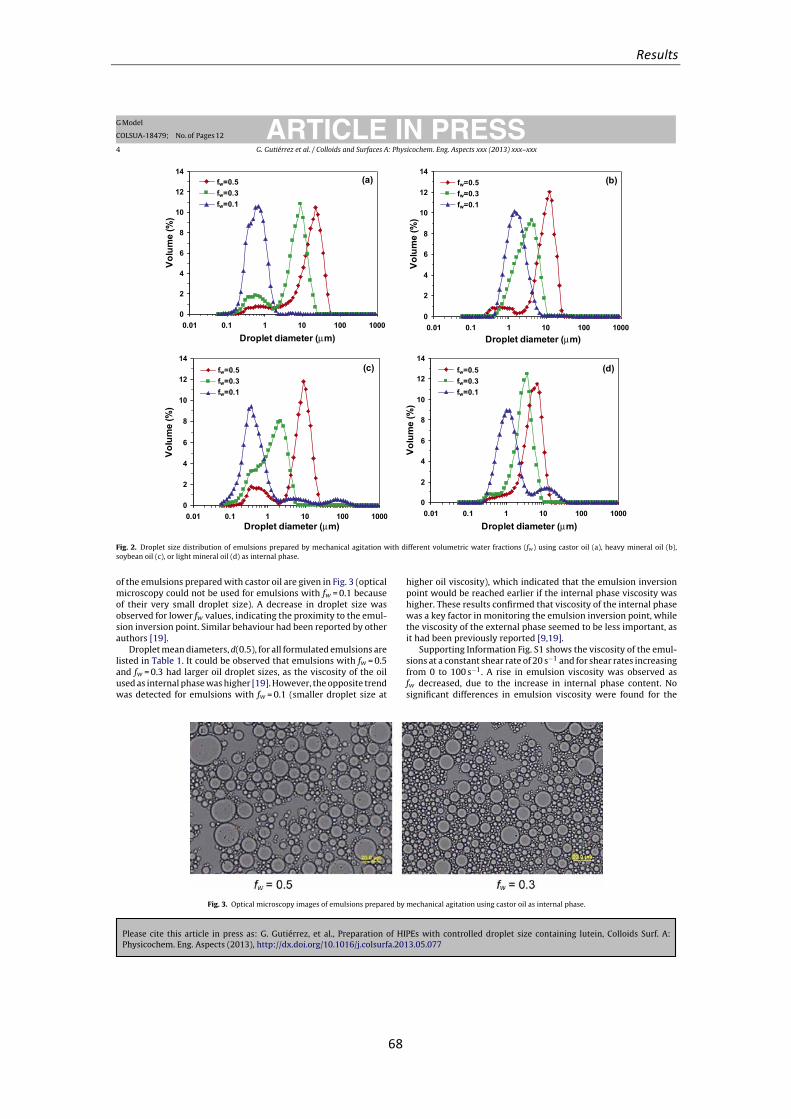
Results
68
Please cite this article in press as: G. Gutiérrez, et al., Preparation of HIPEs with controlled droplet size containing lutein, Colloids Surf. A:Physicochem. Eng. Aspects (2013), http://dx.doi.org/10.1016/j.colsurfa.2013.05.077
ARTICLE IN PRESSG Model
COLSUA-18479; No. of Pages 12
4 G. Gutiérrez et al. / Colloids and Surfaces A: Physicochem. Eng. Aspects xxx (2013) xxx–xxx
0
2
4
6
8
10
12
14
0.01 0.1 1 10 10 0 100 0
Drop let diameter (µm)
Volu
me
(%)
fw=0.5fw=0.3fw=0.1
(a)fw=0.5fw=0.3fw=0.1
0
2
4
6
8
10
12
14
0.01 0.1 1 10 10 0 100 0Drop let diameter (µm)
Volu
me
(%)
fw=0.5fw=0.3fw=0.1
(b)fw=0.5fw=0.3fw=0.1
0
2
4
6
8
10
12
14
0.01 0.1 1 10 10 0 100 0Drop let diameter (µm)
Volu
me
(%)
fw=0.5fw=0.3fw=0.1
(c)fw=0.5fw=0.3fw=0.1
0
2
4
6
8
10
12
14
0.01 0.1 1 10 10 0 100 0
Drop let diameter (µm)
Volu
me
(%)
fw=0.5fw=0.3fw=0.1
(d)fw=0.5fw=0.3fw=0.1
Fig. 2. Droplet size distribution of emulsions prepared by mechanical agitation with different volumetric water fractions (fw) using castor oil (a), heavy mineral oil (b),soybean oil (c), or light mineral oil (d) as internal phase.
of the emulsions prepared with castor oil are given in Fig. 3 (opticalmicroscopy could not be used for emulsions with fw = 0.1 becauseof their very small droplet size). A decrease in droplet size wasobserved for lower fw values, indicating the proximity to the emul-sion inversion point. Similar behaviour had been reported by otherauthors [19].
Droplet mean diameters, d(0.5), for all formulated emulsions arelisted in Table 1. It could be observed that emulsions with fw = 0.5and fw = 0.3 had larger oil droplet sizes, as the viscosity of the oilused as internal phase was higher [19]. However, the opposite trendwas detected for emulsions with fw = 0.1 (smaller droplet size at
higher oil viscosity), which indicated that the emulsion inversionpoint would be reached earlier if the internal phase viscosity washigher. These results confirmed that viscosity of the internal phasewas a key factor in monitoring the emulsion inversion point, whilethe viscosity of the external phase seemed to be less important, asit had been previously reported [9,19].
Supporting Information Fig. S1 shows the viscosity of the emul-sions at a constant shear rate of 20 s−1 and for shear rates increasingfrom 0 to 100 s−1. A rise in emulsion viscosity was observed asfw decreased, due to the increase in internal phase content. Nosignificant differences in emulsion viscosity were found for the
Fig. 3. Optical microscopy images of emulsions prepared by mechanical agitation using castor oil as internal phase.
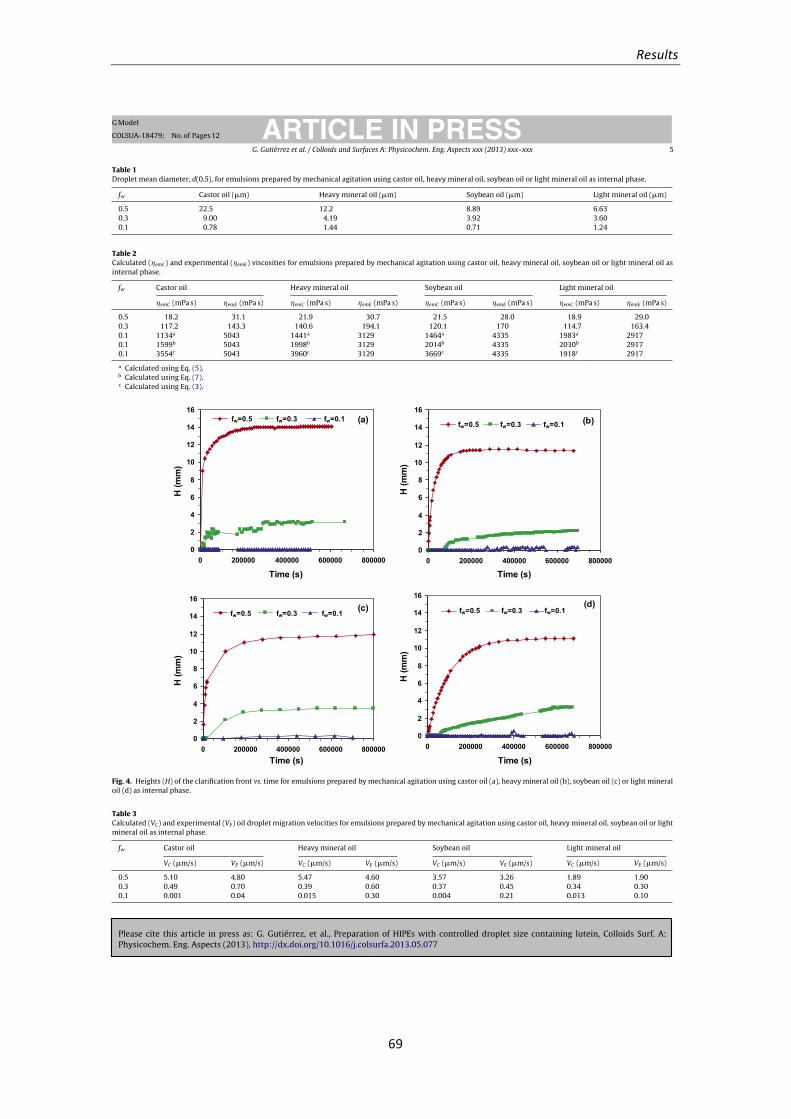
Results
69
Please cite this article in press as: G. Gutiérrez, et al., Preparation of HIPEs with controlled droplet size containing lutein, Colloids Surf. A:Physicochem. Eng. Aspects (2013), http://dx.doi.org/10.1016/j.colsurfa.2013.05.077
ARTICLE IN PRESSG Model
COLSUA-18479; No. of Pages 12
G. Gutiérrez et al. / Colloids and Surfaces A: Physicochem. Eng. Aspects xxx (2013) xxx–xxx 5
Table 1Droplet mean diameter, d(0.5), for emulsions prepared by mechanical agitation using castor oil, heavy mineral oil, soybean oil or light mineral oil as internal phase.
fw Castor oil (�m) Heavy mineral oil (�m) Soybean oil (�m) Light mineral oil (�m)
0.5 22.5 12.2 8.89 6.630.3 9.00 4.19 3.92 3.600.1 0.78 1.44 0.71 1.24
Table 2Calculated (�emC) and experimental (�emE) viscosities for emulsions prepared by mechanical agitation using castor oil, heavy mineral oil, soybean oil or light mineral oil asinternal phase.
fw Castor oil Heavy mineral oil Soybean oil Light mineral oil
�emC (mPa s) �emE (mPa s) �emC (mPa s) �emE (mPa s) �emC (mPa s) �emE (mPa s) �emC (mPa s) �emE (mPa s)
0.5 18.2 31.1 21.9 30.7 21.5 28.0 18.9 29.00.3 117.2 143.3 140.6 194.1 120.1 170 114.7 163.40.1 1134a 5043 1441a 3129 1464a 4335 1983a 29170.1 1599b 5043 1998b 3129 2014b 4335 2030b 29170.1 3554c 5043 3960c 3129 3669c 4335 1918c 2917
a Calculated using Eq. (5).b Calculated using Eq. (7).c Calculated using Eq. (3).
0
2
4
6
8
10
12
14
16
0 20000 0 40000 0 60000 0 80000 0
Time (s)
H (m
m)
fw=0.1 (a)fw=0.5 fw=0.3
0
2
4
6
8
10
12
14
16
0 20000 0 40000 0 60000 0 80000 0
Time (s)
H (m
m)
(b)fw=0.1fw=0.5 fw=0.3
0
2
4
6
8
10
12
14
16
0 20000 0 40000 0 60000 0 80000 0Time (s)
H (m
m)
fw=0.1fw=0.5 fw=0.3 (c)
0
2
4
6
8
10
12
14
16
0 20000 0 40000 0 60000 0 80000 0
Time (s)
H (m
m)
(d)fw=0.1fw=0.5 fw=0.3
Fig. 4. Heights (H) of the clarification front vs. time for emulsions prepared by mechanical agitation using castor oil (a), heavy mineral oil (b), soybean oil (c) or light mineraloil (d) as internal phase.
Table 3Calculated (VC) and experimental (VE) oil droplet migration velocities for emulsions prepared by mechanical agitation using castor oil, heavy mineral oil, soybean oil or lightmineral oil as internal phase.
fw Castor oil Heavy mineral oil Soybean oil Light mineral oil
VC (�m/s) VE (�m/s) VC (�m/s) VE (�m/s) VC (�m/s) VE (�m/s) VC (�m/s) VE (�m/s)
0.5 5.10 4.80 5.47 4.60 3.57 3.26 1.89 1.900.3 0.49 0.70 0.39 0.60 0.37 0.45 0.34 0.300.1 0.001 0.04 0.015 0.30 0.004 0.21 0.013 0.10
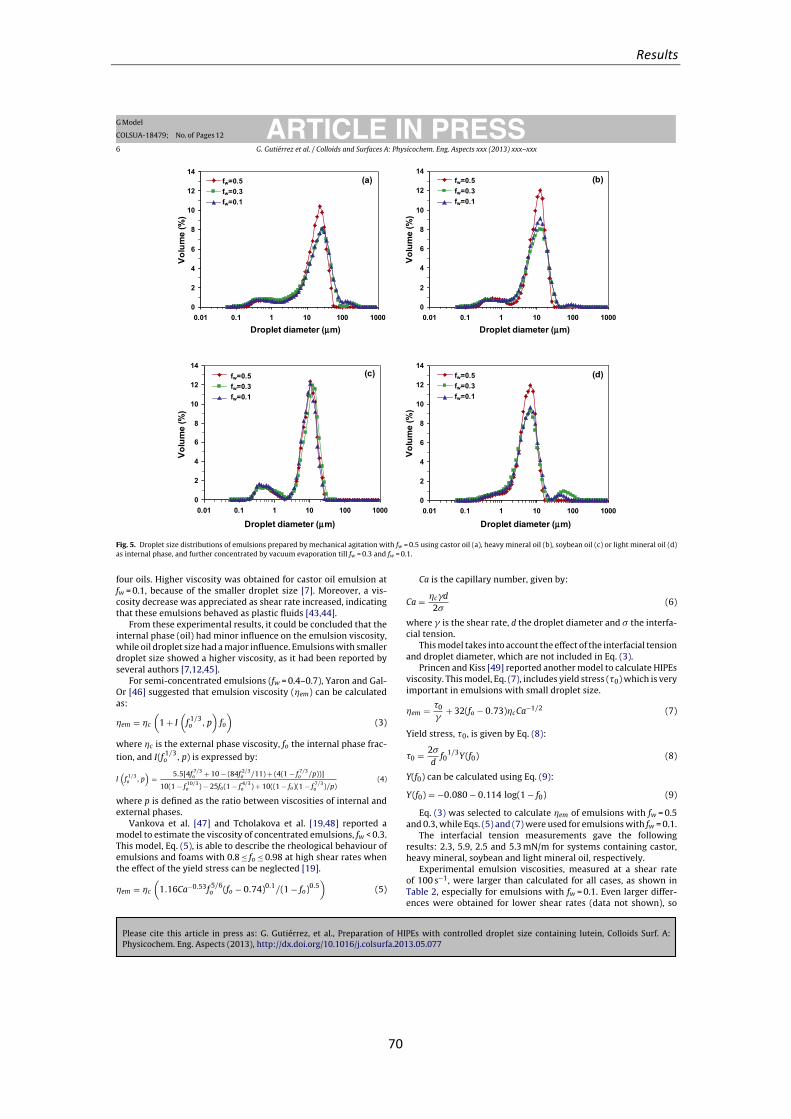
Results
70
Please cite this article in press as: G. Gutiérrez, et al., Preparation of HIPEs with controlled droplet size containing lutein, Colloids Surf. A:Physicochem. Eng. Aspects (2013), http://dx.doi.org/10.1016/j.colsurfa.2013.05.077
ARTICLE IN PRESSG Model
COLSUA-18479; No. of Pages 12
6 G. Gutiérrez et al. / Colloids and Surfaces A: Physicochem. Eng. Aspects xxx (2013) xxx–xxx
0
2
4
6
8
10
12
14
0.01 0.1 1 10 10 0 100 0
Droplet diameter (µm)
Volu
me
(%)
(a)fw=0.5fw=0.3fw=0.1
0
2
4
6
8
10
12
14
0.01 0.1 1 10 10 0 100 0
Droplet diameter (µm)
Volu
me
(%)
(b)fw=0.5fw=0.3fw=0.1
0
2
4
6
8
10
12
14
0.01 0.1 1 10 10 0 100 0
Drop let diameter (µm)
Volu
me
(%)
(c)fw=0.5fw=0.3fw=0.1
0
2
4
6
8
10
12
14
0.01 0.1 1 10 10 0 100 0
Drop let diameter (µm)
Volu
me
(%)
(d)fw=0.5fw=0.3fw=0.1
Fig. 5. Droplet size distributions of emulsions prepared by mechanical agitation with fw = 0.5 using castor oil (a), heavy mineral oil (b), soybean oil (c) or light mineral oil (d)as internal phase, and further concentrated by vacuum evaporation till fw = 0.3 and fw = 0.1.
four oils. Higher viscosity was obtained for castor oil emulsion atfw = 0.1, because of the smaller droplet size [7]. Moreover, a vis-cosity decrease was appreciated as shear rate increased, indicatingthat these emulsions behaved as plastic fluids [43,44].
From these experimental results, it could be concluded that theinternal phase (oil) had minor influence on the emulsion viscosity,while oil droplet size had a major influence. Emulsions with smallerdroplet size showed a higher viscosity, as it had been reported byseveral authors [7,12,45].
For semi-concentrated emulsions (fw = 0.4–0.7), Yaron and Gal-Or [46] suggested that emulsion viscosity (�em) can be calculatedas:
�em = �c
(1 + I
(f 1/3o , p
)fo
)(3)
where �c is the external phase viscosity, fo the internal phase frac-tion, and I(f 1/3
o , p) is expressed by:
I(
f 1/3o , p
)= 5.5[4f 7/3
o + 10 − (84f 2/3o /11) + (4(1 − f 7/3
o /p))]
10(1 − f 10/3o ) − 25fo(1 − f 4/3
o ) + 10((1 − fo)(1 − f 7/3o )/p)
(4)
where p is defined as the ratio between viscosities of internal andexternal phases.
Vankova et al. [47] and Tcholakova et al. [19,48] reported amodel to estimate the viscosity of concentrated emulsions, fw < 0.3.This model, Eq. (5), is able to describe the rheological behaviour ofemulsions and foams with 0.8 ≤ fo ≤ 0.98 at high shear rates whenthe effect of the yield stress can be neglected [19].
�em = �c
(1.16Ca−0.53f 5/6
o (fo − 0.74)0.1/(1 − fo)0.5)
(5)
Ca is the capillary number, given by:
Ca = �c�d
2�(6)
where � is the shear rate, d the droplet diameter and � the interfa-cial tension.
This model takes into account the effect of the interfacial tensionand droplet diameter, which are not included in Eq. (3).
Princen and Kiss [49] reported another model to calculate HIPEsviscosity. This model, Eq. (7), includes yield stress (�0) which is veryimportant in emulsions with small droplet size.
�em = �0
�+ 32(fo − 0.73)�cCa−1/2 (7)
Yield stress, �0, is given by Eq. (8):
�0 = 2�
df0
1/3Y(f0) (8)
Y(f0) can be calculated using Eq. (9):
Y(f0) = −0.080 − 0.114 log(1 − f0) (9)
Eq. (3) was selected to calculate �em of emulsions with fw = 0.5and 0.3, while Eqs. (5) and (7) were used for emulsions with fw = 0.1.
The interfacial tension measurements gave the followingresults: 2.3, 5.9, 2.5 and 5.3 mN/m for systems containing castor,heavy mineral, soybean and light mineral oil, respectively.
Experimental emulsion viscosities, measured at a shear rateof 100 s−1, were larger than calculated for all cases, as shown inTable 2, especially for emulsions with fw = 0.1. Even larger differ-ences were obtained for lower shear rates (data not shown), so
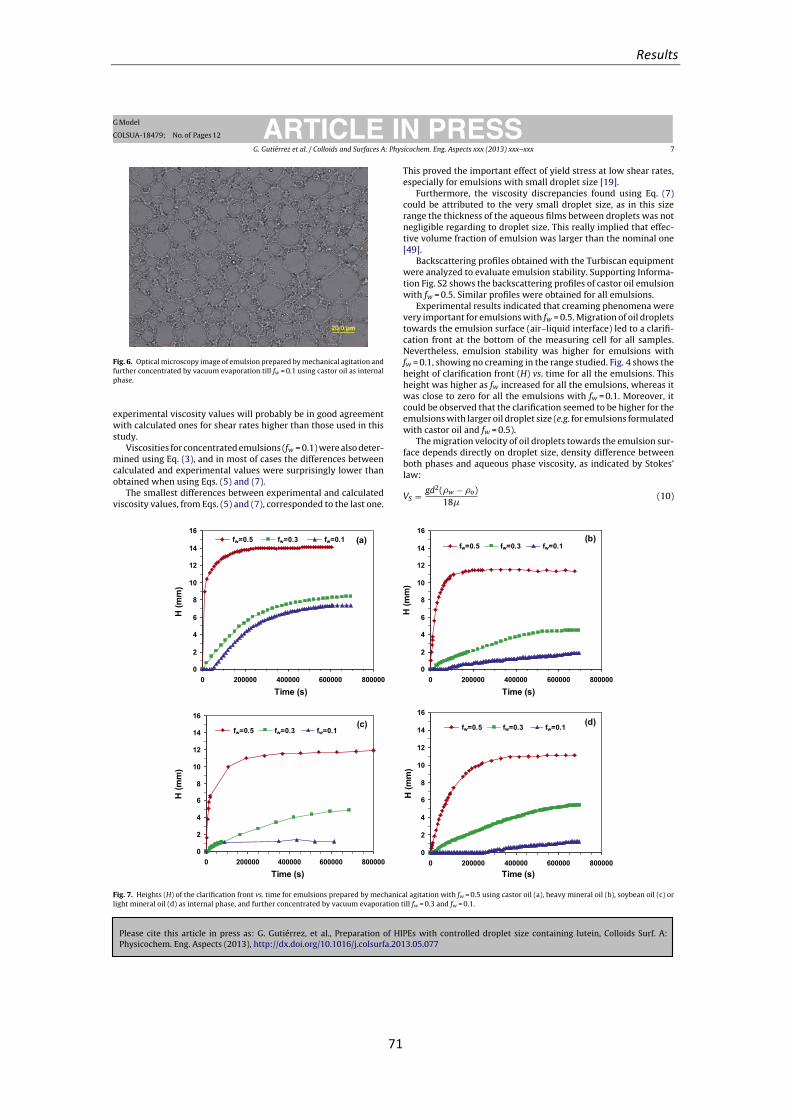
Results
71
Please cite this article in press as: G. Gutiérrez, et al., Preparation of HIPEs with controlled droplet size containing lutein, Colloids Surf. A:Physicochem. Eng. Aspects (2013), http://dx.doi.org/10.1016/j.colsurfa.2013.05.077
ARTICLE IN PRESSG Model
COLSUA-18479; No. of Pages 12
G. Gutiérrez et al. / Colloids and Surfaces A: Physicochem. Eng. Aspects xxx (2013) xxx–xxx 7
Fig. 6. Optical microscopy image of emulsion prepared by mechanical agitation andfurther concentrated by vacuum evaporation till fw = 0.1 using castor oil as internalphase.
experimental viscosity values will probably be in good agreementwith calculated ones for shear rates higher than those used in thisstudy.
Viscosities for concentrated emulsions (fw = 0.1) were also deter-mined using Eq. (3), and in most of cases the differences betweencalculated and experimental values were surprisingly lower thanobtained when using Eqs. (5) and (7).
The smallest differences between experimental and calculatedviscosity values, from Eqs. (5) and (7), corresponded to the last one.
This proved the important effect of yield stress at low shear rates,especially for emulsions with small droplet size [19].
Furthermore, the viscosity discrepancies found using Eq. (7)could be attributed to the very small droplet size, as in this sizerange the thickness of the aqueous films between droplets was notnegligible regarding to droplet size. This really implied that effec-tive volume fraction of emulsion was larger than the nominal one[49].
Backscattering profiles obtained with the Turbiscan equipmentwere analyzed to evaluate emulsion stability. Supporting Informa-tion Fig. S2 shows the backscattering profiles of castor oil emulsionwith fw = 0.5. Similar profiles were obtained for all emulsions.
Experimental results indicated that creaming phenomena werevery important for emulsions with fw = 0.5. Migration of oil dropletstowards the emulsion surface (air–liquid interface) led to a clarifi-cation front at the bottom of the measuring cell for all samples.Nevertheless, emulsion stability was higher for emulsions withfw = 0.1, showing no creaming in the range studied. Fig. 4 shows theheight of clarification front (H) vs. time for all the emulsions. Thisheight was higher as fw increased for all the emulsions, whereas itwas close to zero for all the emulsions with fw = 0.1. Moreover, itcould be observed that the clarification seemed to be higher for theemulsions with larger oil droplet size (e.g. for emulsions formulatedwith castor oil and fw = 0.5).
The migration velocity of oil droplets towards the emulsion sur-face depends directly on droplet size, density difference betweenboth phases and aqueous phase viscosity, as indicated by Stokes’law:
VS = gd2(�w − �o)18�
(10)
0
2
4
6
8
10
12
14
16
0 20000 0 40000 0 60000 0 80000 0
Time (s)
H (m
m)
fw=0.5 fw=0.3 fw=0.1 (a)fw=0.1fw=0.5 fw=0.3
0
2
4
6
8
10
12
14
16
0 20000 0 40000 0 60000 0 80000 0
Time (s)
H (m
m)
fw=0.5 fw=0.3 fw=0.1(b)
fw=0.1fw=0.5 fw=0.3
0
2
4
6
8
10
12
14
16
0 20000 0 40000 0 60000 0 80000 0
Time (s)
H (m
m)
fw=0.5 fw=0.3 fw=0.1fw=0.1fw=0.5 fw=0.3(c)
0
2
4
6
8
10
12
14
16
0 20000 0 40000 0 60000 0 80000 0Time (s)
H (m
m)
fw=0.5 fw=0.3 fw=0.1 (d)fw=0.1fw=0.5 fw=0.3
Fig. 7. Heights (H) of the clarification front vs. time for emulsions prepared by mechanical agitation with fw = 0.5 using castor oil (a), heavy mineral oil (b), soybean oil (c) orlight mineral oil (d) as internal phase, and further concentrated by vacuum evaporation till fw = 0.3 and fw = 0.1.
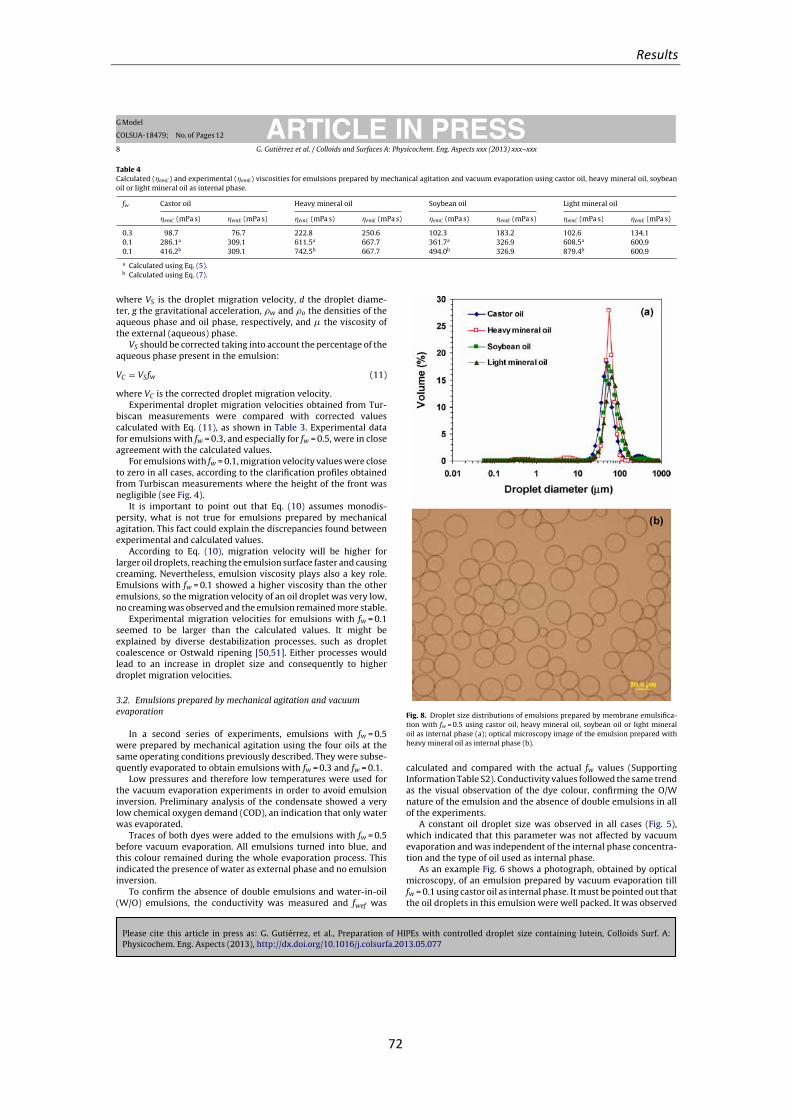
Results
72
Please cite this article in press as: G. Gutiérrez, et al., Preparation of HIPEs with controlled droplet size containing lutein, Colloids Surf. A:Physicochem. Eng. Aspects (2013), http://dx.doi.org/10.1016/j.colsurfa.2013.05.077
ARTICLE IN PRESSG Model
COLSUA-18479; No. of Pages 12
8 G. Gutiérrez et al. / Colloids and Surfaces A: Physicochem. Eng. Aspects xxx (2013) xxx–xxx
Table 4Calculated (�emC) and experimental (�emE) viscosities for emulsions prepared by mechanical agitation and vacuum evaporation using castor oil, heavy mineral oil, soybeanoil or light mineral oil as internal phase.
fw Castor oil Heavy mineral oil Soybean oil Light mineral oil
�emC (mPa s) �emE (mPa s) �emC (mPa s) �emE (mPa s) �emC (mPa s) �emE (mPa s) �emC (mPa s) �emE (mPa s)
0.3 98.7 76.7 222.8 250.6 102.3 183.2 102.6 134.10.1 286.1a 309.1 611.5a 667.7 361.7a 326.9 608.5a 600.90.1 416.2b 309.1 742.5b 667.7 494.0b 326.9 879.4b 600.9
a Calculated using Eq. (5).b Calculated using Eq. (7).
where VS is the droplet migration velocity, d the droplet diame-ter, g the gravitational acceleration, �w and �o the densities of theaqueous phase and oil phase, respectively, and � the viscosity ofthe external (aqueous) phase.
VS should be corrected taking into account the percentage of theaqueous phase present in the emulsion:
VC = VSfw (11)
where VC is the corrected droplet migration velocity.Experimental droplet migration velocities obtained from Tur-
biscan measurements were compared with corrected valuescalculated with Eq. (11), as shown in Table 3. Experimental datafor emulsions with fw = 0.3, and especially for fw = 0.5, were in closeagreement with the calculated values.
For emulsions with fw = 0.1, migration velocity values were closeto zero in all cases, according to the clarification profiles obtainedfrom Turbiscan measurements where the height of the front wasnegligible (see Fig. 4).
It is important to point out that Eq. (10) assumes monodis-persity, what is not true for emulsions prepared by mechanicalagitation. This fact could explain the discrepancies found betweenexperimental and calculated values.
According to Eq. (10), migration velocity will be higher forlarger oil droplets, reaching the emulsion surface faster and causingcreaming. Nevertheless, emulsion viscosity plays also a key role.Emulsions with fw = 0.1 showed a higher viscosity than the otheremulsions, so the migration velocity of an oil droplet was very low,no creaming was observed and the emulsion remained more stable.
Experimental migration velocities for emulsions with fw = 0.1seemed to be larger than the calculated values. It might beexplained by diverse destabilization processes, such as dropletcoalescence or Ostwald ripening [50,51]. Either processes wouldlead to an increase in droplet size and consequently to higherdroplet migration velocities.
3.2. Emulsions prepared by mechanical agitation and vacuumevaporation
In a second series of experiments, emulsions with fw = 0.5were prepared by mechanical agitation using the four oils at thesame operating conditions previously described. They were subse-quently evaporated to obtain emulsions with fw = 0.3 and fw = 0.1.
Low pressures and therefore low temperatures were used forthe vacuum evaporation experiments in order to avoid emulsioninversion. Preliminary analysis of the condensate showed a verylow chemical oxygen demand (COD), an indication that only waterwas evaporated.
Traces of both dyes were added to the emulsions with fw = 0.5before vacuum evaporation. All emulsions turned into blue, andthis colour remained during the whole evaporation process. Thisindicated the presence of water as external phase and no emulsioninversion.
To confirm the absence of double emulsions and water-in-oil(W/O) emulsions, the conductivity was measured and fwef was
Fig. 8. Droplet size distributions of emulsions prepared by membrane emulsifica-tion with fw = 0.5 using castor oil, heavy mineral oil, soybean oil or light mineraloil as internal phase (a); optical microscopy image of the emulsion prepared withheavy mineral oil as internal phase (b).
calculated and compared with the actual fw values (SupportingInformation Table S2). Conductivity values followed the same trendas the visual observation of the dye colour, confirming the O/Wnature of the emulsion and the absence of double emulsions in allof the experiments.
A constant oil droplet size was observed in all cases (Fig. 5),which indicated that this parameter was not affected by vacuumevaporation and was independent of the internal phase concentra-tion and the type of oil used as internal phase.
As an example Fig. 6 shows a photograph, obtained by opticalmicroscopy, of an emulsion prepared by vacuum evaporation tillfw = 0.1 using castor oil as internal phase. It must be pointed out thatthe oil droplets in this emulsion were well packed. It was observed

Results
73
Please cite this article in press as: G. Gutiérrez, et al., Preparation of HIPEs with controlled droplet size containing lutein, Colloids Surf. A:Physicochem. Eng. Aspects (2013), http://dx.doi.org/10.1016/j.colsurfa.2013.05.077
ARTICLE IN PRESSG Model
COLSUA-18479; No. of Pages 12
G. Gutiérrez et al. / Colloids and Surfaces A: Physicochem. Eng. Aspects xxx (2013) xxx–xxx 9
0
2
4
6
8
10
12
14
16
18
20
0.01 0.1 1 10 10 0 100 0
Drop let diameter (m m)
Vol
ume
(%)
fw=0.50fw=0.25
(a)
0
5
10
15
20
25
30
0.01 0.1 1 10 100 1000
Drop let diameter (µm)
Volu
me
(%)
(b)fw=0.50fw=0.25
0
2
4
6
8
10
12
14
16
18
20
0.01 0.1 1 10 10 0 100 0
Drop let diameter (µm)
Volu
me
(%)
(c)fw=0.50fw=0.25
0
2
4
6
8
10
12
14
16
18
0.01 0.1 1 10 10 0 100 0
Drop let diameter (µm)
Volu
me
(%)
(d)fw=0.50fw=0.25
Fig. 9. Droplet size distributions of emulsions prepared by membrane emulsification with fw = 0.5 using castor oil (a), heavy mineral oil (b), soybean oil (c) or light mineraloil (d) as internal phase, and further concentrated by vacuum evaporation till fw = 0.25.
0
5
10
15
20
25
30
0.01 0.1 1 10 10 0 100 0
Drop let diameter ( m)µ µ
Volu
me
(%)
Withou t l uteinWith l utein
(a)
0
2
4
6
8
10
12
14
16
18
0.01 0.1 1 10 10 0 100 0
Drop let diameter ( m)
Volu
me
(%)
fw=0.5fw=0.4
(b)
Fig. 10. Droplet size distribution of emulsion prepared by membrane emulsification with fw = 0.5 using heavy mineral oil as internal phase with and without lutein (a);droplet size distribution of emulsion prepared by membrane emulsification with fw = 0.5 using heavy mineral oil containing lutein, and further concentrated by vacuumevaporation till fw = 0.40 (b).
that these droplets had lost their original spherical shape due to thehigh internal phase concentration, which brought the oil dropletsin closer contact.
Emulsion viscosities are given in Table 4. Supporting Informa-tion Fig. S3 shows the viscosity of the emulsions at a constant shearrate of 20 s−1 and for shear rates increasing from 0 to 100 s−1.
In spite of the fact that all emulsions prepared with the sameoil as internal phase had the same droplet size, their viscosity dif-ferences were remarkable. These differences were likely due to thedifferent internal phase concentration. However, it is important to
point out that the increase in viscosity as fw decreased was not asnoticeable as in the case of emulsions prepared by mechanical agi-tation, indicating that the influence of the oil droplet size was moreimportant than the internal phase concentration.
Eqs. (5) and (7) were also used to calculate the emulsion viscos-ity. Experimental and calculated results are also listed in Table 4. Nolarge differences were found in any case: calculated values usingEq. (5) and experimental values were more similar than those pre-sented in Table 3 for emulsions prepared by mechanical agitation.This indicated the importance of droplet size parameter, which
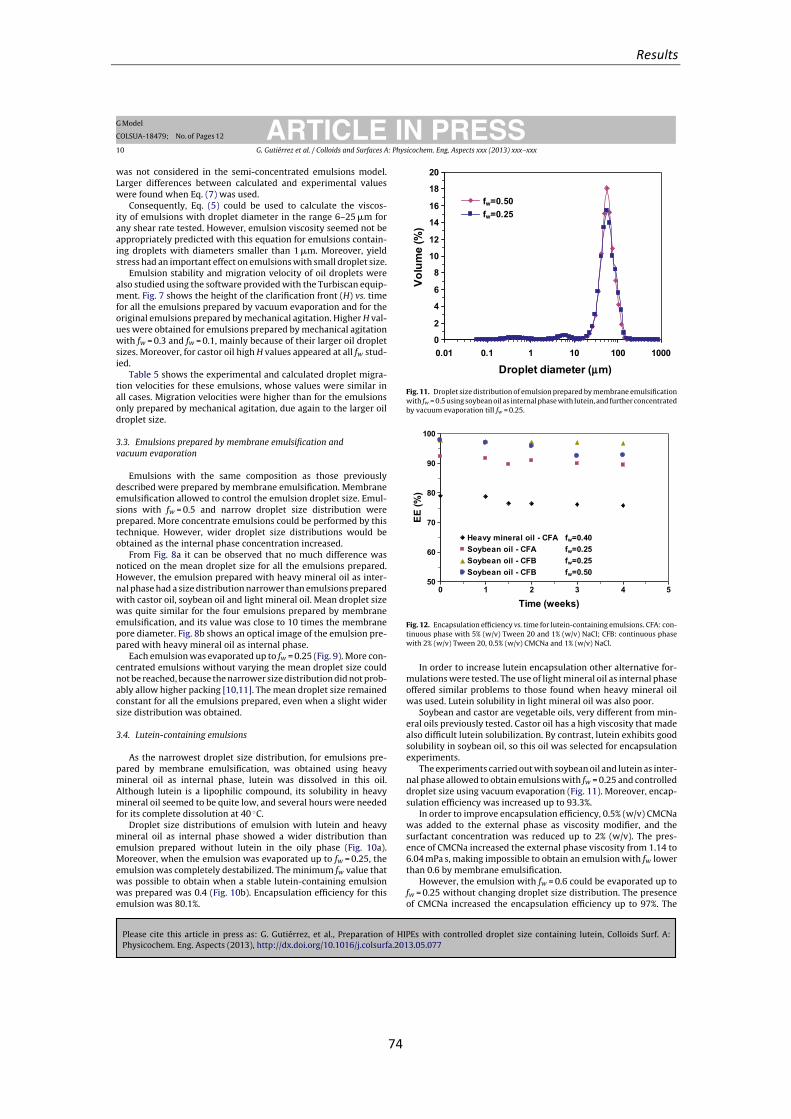
Results
74
Please cite this article in press as: G. Gutiérrez, et al., Preparation of HIPEs with controlled droplet size containing lutein, Colloids Surf. A:Physicochem. Eng. Aspects (2013), http://dx.doi.org/10.1016/j.colsurfa.2013.05.077
ARTICLE IN PRESSG Model
COLSUA-18479; No. of Pages 12
10 G. Gutiérrez et al. / Colloids and Surfaces A: Physicochem. Eng. Aspects xxx (2013) xxx–xxx
was not considered in the semi-concentrated emulsions model.Larger differences between calculated and experimental valueswere found when Eq. (7) was used.
Consequently, Eq. (5) could be used to calculate the viscos-ity of emulsions with droplet diameter in the range 6–25 �m forany shear rate tested. However, emulsion viscosity seemed not beappropriately predicted with this equation for emulsions contain-ing droplets with diameters smaller than 1 �m. Moreover, yieldstress had an important effect on emulsions with small droplet size.
Emulsion stability and migration velocity of oil droplets werealso studied using the software provided with the Turbiscan equip-ment. Fig. 7 shows the height of the clarification front (H) vs. timefor all the emulsions prepared by vacuum evaporation and for theoriginal emulsions prepared by mechanical agitation. Higher H val-ues were obtained for emulsions prepared by mechanical agitationwith fw = 0.3 and fw = 0.1, mainly because of their larger oil dropletsizes. Moreover, for castor oil high H values appeared at all fw stud-ied.
Table 5 shows the experimental and calculated droplet migra-tion velocities for these emulsions, whose values were similar inall cases. Migration velocities were higher than for the emulsionsonly prepared by mechanical agitation, due again to the larger oildroplet size.
3.3. Emulsions prepared by membrane emulsification andvacuum evaporation
Emulsions with the same composition as those previouslydescribed were prepared by membrane emulsification. Membraneemulsification allowed to control the emulsion droplet size. Emul-sions with fw = 0.5 and narrow droplet size distribution wereprepared. More concentrate emulsions could be performed by thistechnique. However, wider droplet size distributions would beobtained as the internal phase concentration increased.
From Fig. 8a it can be observed that no much difference wasnoticed on the mean droplet size for all the emulsions prepared.However, the emulsion prepared with heavy mineral oil as inter-nal phase had a size distribution narrower than emulsions preparedwith castor oil, soybean oil and light mineral oil. Mean droplet sizewas quite similar for the four emulsions prepared by membraneemulsification, and its value was close to 10 times the membranepore diameter. Fig. 8b shows an optical image of the emulsion pre-pared with heavy mineral oil as internal phase.
Each emulsion was evaporated up to fw = 0.25 (Fig. 9). More con-centrated emulsions without varying the mean droplet size couldnot be reached, because the narrower size distribution did not prob-ably allow higher packing [10,11]. The mean droplet size remainedconstant for all the emulsions prepared, even when a slight widersize distribution was obtained.
3.4. Lutein-containing emulsions
As the narrowest droplet size distribution, for emulsions pre-pared by membrane emulsification, was obtained using heavymineral oil as internal phase, lutein was dissolved in this oil.Although lutein is a lipophilic compound, its solubility in heavymineral oil seemed to be quite low, and several hours were neededfor its complete dissolution at 40 ◦C.
Droplet size distributions of emulsion with lutein and heavymineral oil as internal phase showed a wider distribution thanemulsion prepared without lutein in the oily phase (Fig. 10a).Moreover, when the emulsion was evaporated up to fw = 0.25, theemulsion was completely destabilized. The minimum fw value thatwas possible to obtain when a stable lutein-containing emulsionwas prepared was 0.4 (Fig. 10b). Encapsulation efficiency for thisemulsion was 80.1%.
0
2
4
6
8
10
12
14
16
18
20
0.01 0.1 1 10 10 0 100 0
Drop let diameter (µm)
Volu
me
(%)
fw=0.50fw=0.25
Fig. 11. Droplet size distribution of emulsion prepared by membrane emulsificationwith fw = 0.5 using soybean oil as internal phase with lutein, and further concentratedby vacuum evaporation till fw = 0.25.
50
60
70
80
90
100
0 1 2 3 4 5
Time (weeks )
EE (%
)
Heavy mineral oil - CFA fw=0.40Soybea n oil - CFA fw=0.25Soybea n oil - CFB fw=0.25Soybea n oil - CFB fw=0.50
Fig. 12. Encapsulation efficiency vs. time for lutein-containing emulsions. CFA: con-tinuous phase with 5% (w/v) Tween 20 and 1% (w/v) NaCl; CFB: continuous phasewith 2% (w/v) Tween 20, 0.5% (w/v) CMCNa and 1% (w/v) NaCl.
In order to increase lutein encapsulation other alternative for-mulations were tested. The use of light mineral oil as internal phaseoffered similar problems to those found when heavy mineral oilwas used. Lutein solubility in light mineral oil was also poor.
Soybean and castor are vegetable oils, very different from min-eral oils previously tested. Castor oil has a high viscosity that madealso difficult lutein solubilization. By contrast, lutein exhibits goodsolubility in soybean oil, so this oil was selected for encapsulationexperiments.
The experiments carried out with soybean oil and lutein as inter-nal phase allowed to obtain emulsions with fw = 0.25 and controlleddroplet size using vacuum evaporation (Fig. 11). Moreover, encap-sulation efficiency was increased up to 93.3%.
In order to improve encapsulation efficiency, 0.5% (w/v) CMCNawas added to the external phase as viscosity modifier, and thesurfactant concentration was reduced up to 2% (w/v). The pres-ence of CMCNa increased the external phase viscosity from 1.14 to6.04 mPa s, making impossible to obtain an emulsion with fw lowerthan 0.6 by membrane emulsification.
However, the emulsion with fw = 0.6 could be evaporated up tofw = 0.25 without changing droplet size distribution. The presenceof CMCNa increased the encapsulation efficiency up to 97%. The
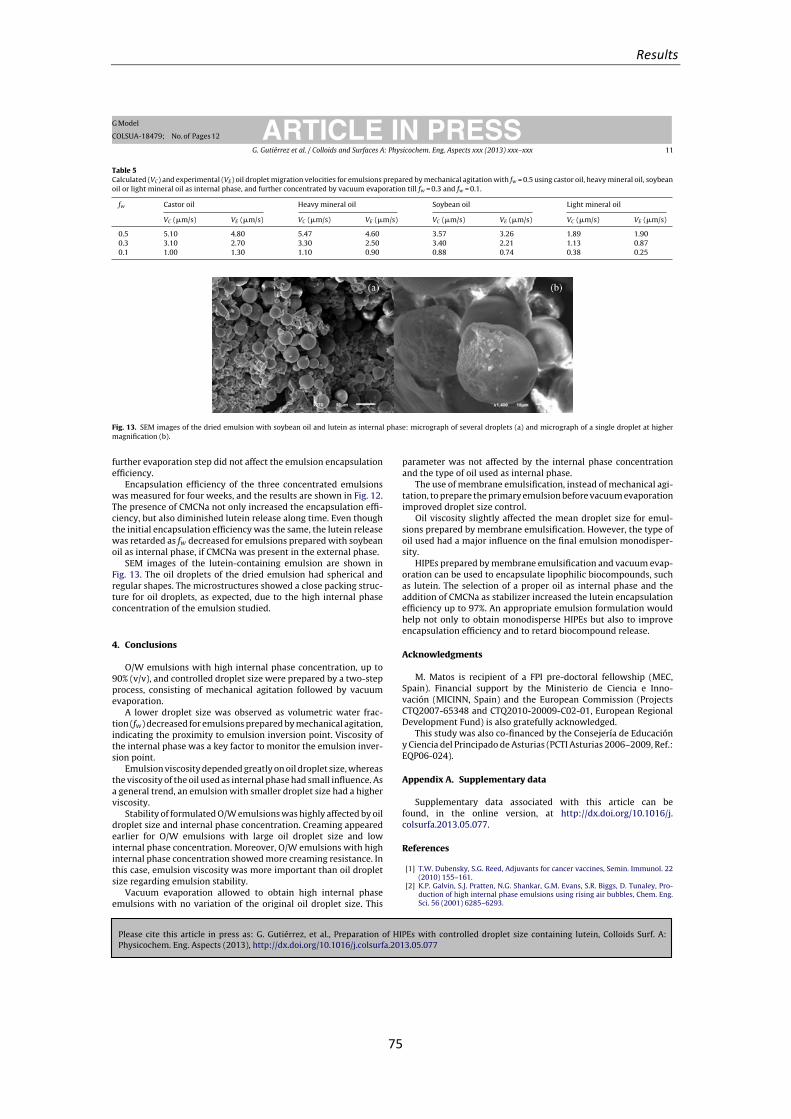
Results
75
Please cite this article in press as: G. Gutiérrez, et al., Preparation of HIPEs with controlled droplet size containing lutein, Colloids Surf. A:Physicochem. Eng. Aspects (2013), http://dx.doi.org/10.1016/j.colsurfa.2013.05.077
ARTICLE IN PRESSG Model
COLSUA-18479; No. of Pages 12
G. Gutiérrez et al. / Colloids and Surfaces A: Physicochem. Eng. Aspects xxx (2013) xxx–xxx 11
Table 5Calculated (VC) and experimental (VE) oil droplet migration velocities for emulsions prepared by mechanical agitation with fw = 0.5 using castor oil, heavy mineral oil, soybeanoil or light mineral oil as internal phase, and further concentrated by vacuum evaporation till fw = 0.3 and fw = 0.1.
fw Castor oil Heavy mineral oil Soybean oil Light mineral oil
VC (�m/s) VE (�m/s) VC (�m/s) VE (�m/s) VC (�m/s) VE (�m/s) VC (�m/s) VE (�m/s)
0.5 5.10 4.80 5.47 4.60 3.57 3.26 1.89 1.900.3 3.10 2.70 3.30 2.50 3.40 2.21 1.13 0.870.1 1.00 1.30 1.10 0.90 0.88 0.74 0.38 0.25
Fig. 13. SEM images of the dried emulsion with soybean oil and lutein as internal phase: micrograph of several droplets (a) and micrograph of a single droplet at highermagnification (b).
further evaporation step did not affect the emulsion encapsulationefficiency.
Encapsulation efficiency of the three concentrated emulsionswas measured for four weeks, and the results are shown in Fig. 12.The presence of CMCNa not only increased the encapsulation effi-ciency, but also diminished lutein release along time. Even thoughthe initial encapsulation efficiency was the same, the lutein releasewas retarded as fw decreased for emulsions prepared with soybeanoil as internal phase, if CMCNa was present in the external phase.
SEM images of the lutein-containing emulsion are shown inFig. 13. The oil droplets of the dried emulsion had spherical andregular shapes. The microstructures showed a close packing struc-ture for oil droplets, as expected, due to the high internal phaseconcentration of the emulsion studied.
4. Conclusions
O/W emulsions with high internal phase concentration, up to90% (v/v), and controlled droplet size were prepared by a two-stepprocess, consisting of mechanical agitation followed by vacuumevaporation.
A lower droplet size was observed as volumetric water frac-tion (fw) decreased for emulsions prepared by mechanical agitation,indicating the proximity to emulsion inversion point. Viscosity ofthe internal phase was a key factor to monitor the emulsion inver-sion point.
Emulsion viscosity depended greatly on oil droplet size, whereasthe viscosity of the oil used as internal phase had small influence. Asa general trend, an emulsion with smaller droplet size had a higherviscosity.
Stability of formulated O/W emulsions was highly affected by oildroplet size and internal phase concentration. Creaming appearedearlier for O/W emulsions with large oil droplet size and lowinternal phase concentration. Moreover, O/W emulsions with highinternal phase concentration showed more creaming resistance. Inthis case, emulsion viscosity was more important than oil dropletsize regarding emulsion stability.
Vacuum evaporation allowed to obtain high internal phaseemulsions with no variation of the original oil droplet size. This
parameter was not affected by the internal phase concentrationand the type of oil used as internal phase.
The use of membrane emulsification, instead of mechanical agi-tation, to prepare the primary emulsion before vacuum evaporationimproved droplet size control.
Oil viscosity slightly affected the mean droplet size for emul-sions prepared by membrane emulsification. However, the type ofoil used had a major influence on the final emulsion monodisper-sity.
HIPEs prepared by membrane emulsification and vacuum evap-oration can be used to encapsulate lipophilic biocompounds, suchas lutein. The selection of a proper oil as internal phase and theaddition of CMCNa as stabilizer increased the lutein encapsulationefficiency up to 97%. An appropriate emulsion formulation wouldhelp not only to obtain monodisperse HIPEs but also to improveencapsulation efficiency and to retard biocompound release.
Acknowledgments
M. Matos is recipient of a FPI pre-doctoral fellowship (MEC,Spain). Financial support by the Ministerio de Ciencia e Inno-vación (MICINN, Spain) and the European Commission (ProjectsCTQ2007-65348 and CTQ2010-20009-C02-01, European RegionalDevelopment Fund) is also gratefully acknowledged.
This study was also co-financed by the Consejería de Educacióny Ciencia del Principado de Asturias (PCTI Asturias 2006–2009, Ref.:EQP06-024).
Appendix A. Supplementary data
Supplementary data associated with this article can befound, in the online version, at http://dx.doi.org/10.1016/j.colsurfa.2013.05.077.
References
[1] T.W. Dubensky, S.G. Reed, Adjuvants for cancer vaccines, Semin. Immunol. 22(2010) 155–161.
[2] K.P. Galvin, S.J. Pratten, N.G. Shankar, G.M. Evans, S.R. Biggs, D. Tunaley, Pro-duction of high internal phase emulsions using rising air bubbles, Chem. Eng.Sci. 56 (2001) 6285–6293.
Results
76
Please cite this article in press as: G. Gutiérrez, et al., Preparation of HIPEs with controlled droplet size containing lutein, Colloids Surf. A:Physicochem. Eng. Aspects (2013), http://dx.doi.org/10.1016/j.colsurfa.2013.05.077
ARTICLE IN PRESSG Model
COLSUA-18479; No. of Pages 12
12 G. Gutiérrez et al. / Colloids and Surfaces A: Physicochem. Eng. Aspects xxx (2013) xxx–xxx
[3] K.J. Lissant, The geometry of high-internal-phase-ratio emulsions, J. ColloidInterface Sci. 22 (1966) 462–468.
[4] G. Pilcer, K. Amighi, Formulation strategy and use of excipients in pulmonarydrug delivery, Int. J. Pharm. 392 (2010) 1–19.
[5] K.J. Lissant, Geometry of emulsions, J. Soc. Cosmet. Chem. 21 (1970) 141–154.[6] Y. Liu, S.E. Friberg, Role of liquid crystal in the emulsification of a gel emulsion
with high internal phase ratio, J. Colloid Interface Sci. 340 (2009) 261–268.[7] M. Rondón-González, V. Sadtler, L. Choplin, J.L. Salager, Emulsion catastrophic
inversion from abnormal to normal morphology. 5. Effect of the water-to-oilratio and surfactant concentration on the inversion produced by continuousstirring, Ind. Eng. Chem. Res. 45 (2006) 3074–3080.
[8] M. Rondón-González, V. Sadtler, P. Marchal, L. Choplin, J.L. Salager, Emulsioncatastrophic inversion from abnormal to normal morphology. 7. Emulsion evo-lution produced by continuous stirring to generate a very high internal phaseratio emulsion, Ind. Eng. Chem. Res. 47 (2008) 2314–2319.
[9] E. Tyrode, J. Allouche, L. Choplin, J.L. Salager, Emulsion catastrophic inversionfrom abnormal to normal morphology 4. Following the emulsion viscosityduring three inversion protocols and extending the critical dispersed-phaseconcept, Ind. Eng. Chem. Res. 44 (2005) 67–74.
[10] H.M. Princen, Highly concentrated emulsions: I. Cylindrical systems, J. ColloidInterface Sci. 71 (1979) 55–66.
[11] H.M. Princen, M.P. Aronson, J.C. Moser, Highly concentrated emulsions: II. Realsystems. The effect of thin film thickness and contact angle on the volumefraction in creamed emulsions, J. Colloid Interface Sci. 75 (1980) 246–270.
[12] H. Rivas, X. Gutiérrez, F. Silva, M. Chirinos, Sobre emulsiones de bitumen enagua, Acta Cient. Venez. 54 (2003) 216–234.
[13] O.A. Alvarez, L. Choplin, V. Sadtler, P. Marchal, M.-J. Stébé, J. Mougel, C. Bara-vian, Influence of semibatch emulsification process conditions on the physicalcharacteristics of highly concentrated water-in-oil emulsions, Ind. Eng. Chem.Res. 49 (2010) 6042–6064.
[14] J. Esquena, G.S.R. Ravi-Sankar, C. Solans, Highly concentrated W/O emulsionsprepared by the PIT method as templates for solid foams, Langmuir 19 (2003)2983–2988.
[15] Y. Matsumoto, M.M. Alam, K. Aramaki, Phase behaviour, formation, and rhe-ology of cubic and hexagonal phase based gel emulsion in water/tetraglyceryllauryl ether/oil systems, Colloid Surf. A: Physicochem. Eng. Asp. 341 (2009)27–32.
[16] N.A. Mishchuk, A. Sanfeld, A. Steinchen, Interparticle interaction in concentratewater–oil emulsions, Adv. Colloid Interface Sci. 112 (2004) 129–157.
[17] P.A. Reynolds, E.P. Gilbert, M.J. Henderson, J.W. White, Structure of highaqueous-in-oil emulsions and related inverse micelle solutions. 4. Surfactantmixtures, J. Phys. Chem. B 113 (2009) 12243–12256.
[18] S.B. Campbell, T. Larson, N.M.B. Smeets, U. El-Jaby, T.F.L. McKenna, Miniemul-sification by catastrophic phase inversion, Chem. Eng. J. 183 (2012) 534–541.
[19] S. Tcholakova, I. Lesov, K. Golemanov, N.D. Denkov, S. Judat, R. Engel, T. Danner,Efficient emulsification of viscous oils at high drop volume fraction, Langmuir27 (2011) 14783–14796.
[20] E. Paruta-Tuarez, P. Marchal, V. Sadtler, L. Choplin, Equation to model the stor-age modulus of highly concentrated emulsions, Ind. Eng. Chem. Res. 50 (2011)10359–10365.
[21] S. Sajjadi, Formulation of fine emulsions at high viscosity or low interfacial ten-sion: a comparative study, Colloid Surf. A: Physicochem. Eng. Asp. 299 (2007)73–78.
[22] K. Ozawa, C. Solans, H. Kunieda, Spontaneous formation of highly concentratedoil-in-water emulsions, J. Colloid Interface Sci. 188 (1997) 275–281.
[23] S.M. Joscelyne, G. Trägårdh, Membrane emulsification—a literature review, J.Membr. Sci. 169 (2000) 107–117.
[24] A. Nazir, K. Schroën, R. Boom, Premix emulsification: a review, J. Membr. Sci.362 (2010) 1–11.
[25] S. van der Graaf, C.G.P.H. Schroën, R.M. Boom, Preparation of double emulsionby membrane emulsification—a review, J. Membr. Sci. 251 (2005) 7–15.
[26] Q. Yuan, R.A. Williams, N. Aryanti, Innovations in high throughput manufac-turing of uniform emulsions and capsules, Adv. Powder Technol. 21 (2010)599–608.
[27] T. Darvishzadeh, N.V. Priezjev, Effects of crossflow velocity and transmembranepressure on microfiltration of oil-in-water emulsions, J. Membr. Sci. 423–424(2012) 466–470.
[28] E. Egidi, G. Gasparini, R.G. Holdich, G.T. Vladisavljevic, S.R. Kosvintsev, Mem-brane emulsification using membranes of regular pore spacing: droplet size anduniformity in the presence of surface shear, J. Membr. Sci. 323 (2008) 414–420.
[29] K. Mitri, R. Shegokar, S. Gohla, C. Anselmi, R.H. Müller, Lipid nanocarriers for der-mal delivery of lutein: preparation, characterization, stability and performance,Int. J. Pharm. 414 (2011) 267–275.
[30] X.-Y. Qv, Z.-P. Zeng, J.-G. Jiang, Preparation of lutein microencapsulation bycomplex coacervation method and its physicochemical properties and stability,Food Hydrocolloids 25 (2011) 1596–1603.
[31] M.W. Davey, I. Van den Bergh, R. Markham, R. Swennen, J. Keulemans, Geneticvariability in Musa fruit provitamin A carotenoids, lutein and mineral micronu-trient contents, Food Chem. 115 (2009) 806–813.
[32] S. Shanmugam, J.-H. Park, K.S. Kim, Z.Z. Piao, C.S. Yong, H.-G. Choi, J.S.Woo, Enhanced bioavailability and retinal accumulation of lutein from self-emulsifying phospholipid suspensions (SEPS), Int. J. Pharm. 412 (2011)99–105.
[33] G. Gutiérrez, A. Cambiella, J.M. Benito, C. Pazos, J. Coca, The effect of additiveson the treatment of oil-in-water emulsions by vacuum evaporation, J. Hazard.Mater. 144 (2007) 649–654.
[34] G. Gutiérrez, J.M. Benito, J. Coca, C. Pazos, Vacuum evaporation of waste oil-in-water emulsions from a copper metalworking industry, Ind. Eng. Chem. Res. 48(2009) 2100–2106.
[35] V.G. Babak, M.-J. Stébé, Highly concentrated emulsions: physicochemical prin-ciples of formulation, J. Disp. Sci. Technol. 23 (2002) 1–22.
[36] T.F. Tadros, B. Vincent, Liquid/liquid interfaces, in: P. Becher (Ed.), Encyclopediaof Emulsion Technology, 1, Marcel Dekker Inc., New York, 1983, pp. 1–56.
[37] B. Egelandsdal, Ø. Langsrud, T. Nyvold, P.K. Sontum, C. Sørensen, G. Enersen,S. Hølland, R. Ofstad, Estimating significant causes of variation in emul-sions’ droplet size distributions obtained by the electrical sensing zone andlaser low angle light scattering techniques, Food Hydrocolloids 15 (2001)521–532.
[38] A. Laca, B. Paredes, M. Díaz, Lipid-enriched egg yolk fraction as ingredient incosmetic emulsions, J. Texture Stud. 43 (2012) 12–28.
[39] A. Laca, M.C. Sáenz, B. Paredes, M. Díaz, Rheological properties, stability andsensory evaluation of low-cholesterol mayonnaises prepared using egg yolkgranules as emulsifying agent, J. Food Eng. 97 (2010) 243–252.
[40] I. Mira, N. Zambrano, E. Tyrode, L. Márquez, A.A. Pena, A. Pizzino, J.L. Salager,Emulsion catastrophic inversion from abnormal to normal morphology. 2.Effect of the stirring intensity on the dynamic inversion frontier, Ind. Eng. Chem.Res. 42 (2003) 57–61.
[41] E. Tyrode, I. Mira, N. Zambrano, L. Márquez, M. Rondón-González, J.L. Salager,Emulsion catastrophic inversion from abnormal to normal morphology. 3.Conditions for triggering the dynamic inversion and application to industrialprocesses, Ind. Eng. Chem. Res. 42 (2003) 4311–4318.
[42] N. Zambrano, E. Tyrode, I. Mira, L. Márquez, M.P. Rodríguez, J.L. Salager, Emul-sion catastrophic inversion from abnormal to normal morphology. 1. Effect ofthe water-to-oil ratio rate of change on the dynamic inversion frontier, Ind.Eng. Chem. Res. 42 (2003) 50–56.
[43] G. Schramm, A Practical Approach to Rheology and Rheometry, Thermo Elec-tron, Karlsruhe, 2004.
[44] J.F. Steffe, Rheological Methods in Food Process Engineering, 2nd ed., FreemanPress, East Lansing, 1996.
[45] M. Rondón-González, L.F. Madariaga, V. Sadtler, L. Choplin, L. Márquez, J.L.Salager, Emulsion catastrophic inversion from abnormal to normal morphol-ogy. 6. Effect of the phase viscosity on the inversion produced by continuousstirring, Ind. Eng. Chem. Res. 46 (2007) 3595–3601.
[46] I. Yaron, B. Gal-Or, On viscous flow and effective viscosity of concentratedsuspensions and emulsions, Rheol. Acta 11 (1972) 241–252.
[47] N. Vankova, S. Tcholakova, N.D. Denkov, I.B. Ivanov, V.D. Vulchev, T. Danner,Emulsification in turbulent flow. 1. Mean and maximum drop diameters ininertial and viscous regimes, J. Colloid Interface Sci. 312 (2007) 363–380.
[48] S. Tcholakova, N.D. Denkov, K. Golemanov, K.P. Ananthapadmanabhan, A. Lips,Theoretical model of viscous friction inside steadily sheared foams and con-centrated emulsions, Phys. Rev. E 78 (2008) 011405.
[49] H.M. Princen, A.D. Kiss, Rheology of foams and highly concentrated emulsions.IV. An experimental study of the shear viscosity and yield stress of concentratedemulsions, J. Colloid Interface Sci. 128 (1989) 176–187.
[50] S.S. Lim, M.Y. Baik, E.A. Decker, L. Henson, L.M. Popplewell, D.J. McClements, S.J.Choi, Stabilization of orange oil-in-water emulsions: a new role for ester gumas an Ostwald ripening inhibitor, Food Chem. 128 (2011) 1023–1028.
[51] K. Ziani, Y. Chang, L. McLandsborough, D.J. McClements, Influence of surfactantcharge on antimicrobial efficacy of surfactant-stabilized thyme oil nanoemul-sions, J. Agric. Food Chem. 59 (2011) 6247–6255.
Results
77
Supporting information
Preparation of HIPEs with controlled droplet size containinglutein
Gemma Gutiérreza, María Matosa, José M. Benitob, José Cocaa, Carmen Pazosa,*
aDepartment of Chemical and Environmental Engineering, University of Oviedo, Julián
Clavería 8, 33006 Oviedo, SpainbDepartment of Chemical Engineering, University of Burgos, Plaza Misael Bañuelos
s/n, 09001 Burgos, Spain
*Corresponding author: Prof. C. Pazos
Tel: +34 985103509;
Fax: +34 985103434
E-mail address: [email protected]
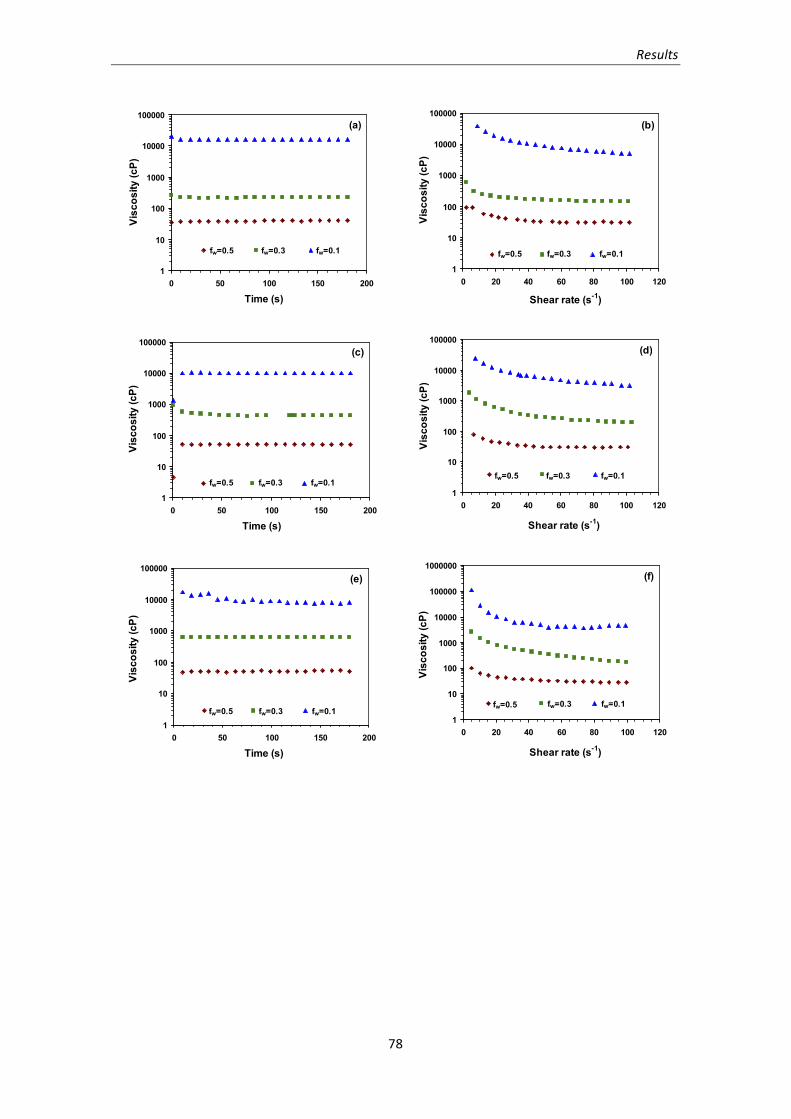
Results
78
1
10
100
1000
10000
100000
0 50 100 150 200
Time (s)
Visc
osity
(cP)
fw=0.5 fw=0.3 fw=0.1
(a)
fw=0.5 fw=0.3 fw=0.1
1
10
100
1000
10000
100000
0 20 40 60 80 100 120
Shear rate (s-1)
Visc
osity
(cP)
fw=0.5 fw=0.3 fw=0.1
(b)
fw=0.5 fw=0.3 fw=0.1
1
10
100
1000
10000
100000
0 50 100 150 200
Time (s)
Visc
osity
(cP)
fw=0.5 fw=0.3 fw=0.1
(c)
fw=0.5 fw=0.3 fw=0.1
1
10
100
1000
10000
100000
0 20 40 60 80 100 120
Shear rate (s-1)
Visc
osity
(cP)
fw=0.5 fw=0.3 fw=0.1
(d)
fw=0.5 fw=0.3 fw=0.1
1
10
100
1000
10000
100000
0 50 100 150 200
Time (s)
Visc
osity
(cP)
fw=0.5 fw=0.3 fw=0.1
(e)
fw=0.5 fw=0.3 fw=0.1
1
10
100
1000
10000
100000
1000000
0 20 40 60 80 100 120
Shear rate (s-1)
Visc
osity
(cP)
fw=0.5 fw=0.3 fw=0.1 fw=0.5 fw=0.3 fw=0.1
(f)
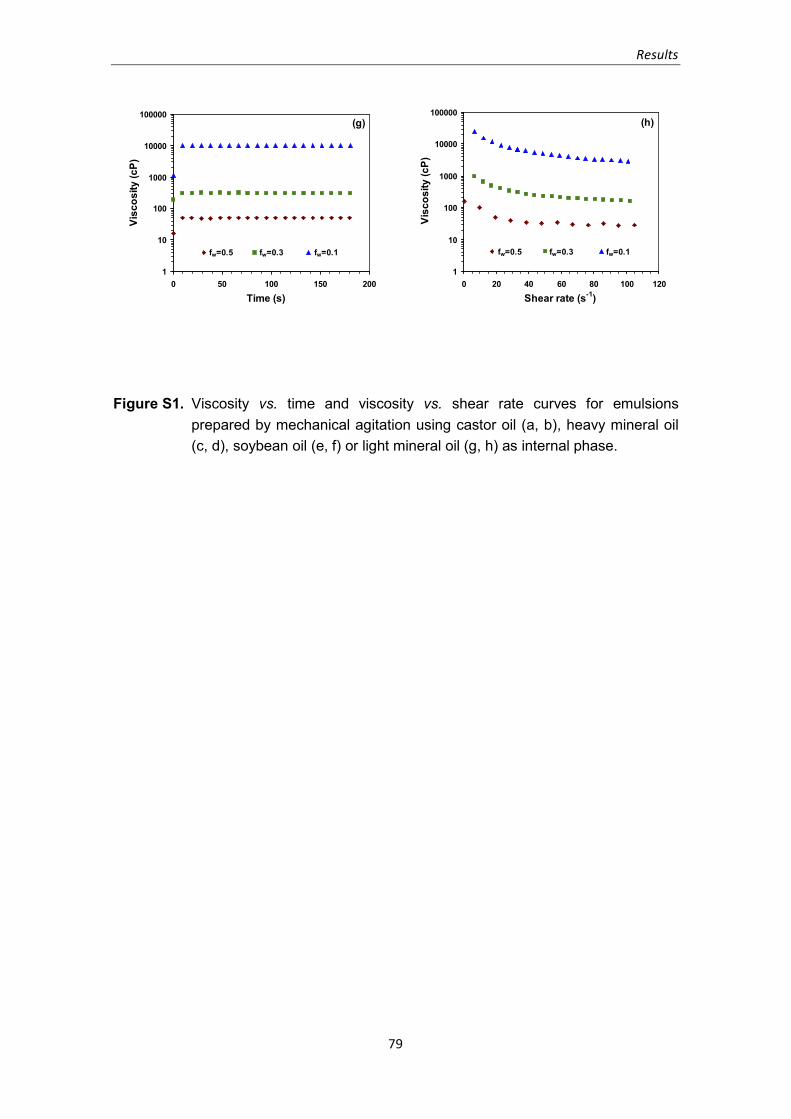
Results
79
1
10
100
1000
10000
100000
0 50 100 150 200
Time (s)
Visc
osity
(cP)
fw=0.5 fw=0.3 fw=0.1
(a)
fw=0.5 fw=0.3 fw=0.1
1
10
100
1000
10000
100000
0 20 40 60 80 100 120
Shear rate (s-1)
Visc
osity
(cP)
fw=0.5 fw=0.3 fw=0.1
(b)
fw=0.5 fw=0.3 fw=0.1
1
10
100
1000
10000
100000
0 50 100 150 200
Time (s)
Visc
osity
(cP)
fw=0.5 fw=0.3 fw=0.1
(c)
fw=0.5 fw=0.3 fw=0.1
1
10
100
1000
10000
100000
0 20 40 60 80 100 120
Shear rate (s-1)
Visc
osity
(cP)
fw=0.5 fw=0.3 fw=0.1
(d)
fw=0.5 fw=0.3 fw=0.1
1
10
100
1000
10000
100000
0 50 100 150 200
Time (s)
Visc
osity
(cP)
fw=0.5 fw=0.3 fw=0.1
(e)
fw=0.5 fw=0.3 fw=0.1
1
10
100
1000
10000
100000
1000000
0 20 40 60 80 100 120
Shear rate (s-1)
Visc
osity
(cP)
fw=0.5 fw=0.3 fw=0.1 fw=0.5 fw=0.3 fw=0.1
(f)
1
10
100
1000
10000
100000
0 50 100 150 200
Time (s)
Visc
osity
(cP)
fw=0.5 fw=0.3 fw=0.1
(g)
fw=0.5 fw=0.3 fw=0.1
1
10
100
1000
10000
100000
0 20 40 60 80 100 120
Shear rate (s-1)
Visc
osity
(cP)
fw=0.5 fw=0.3 fw=0.1
(h)
fw=0.5 fw=0.3 fw=0.1
Figure S1. Viscosity vs. time and viscosity vs. shear rate curves for emulsions prepared by mechanical agitation using castor oil (a, b), heavy mineral oil (c, d), soybean oil (e, f) or light mineral oil (g, h) as internal phase.
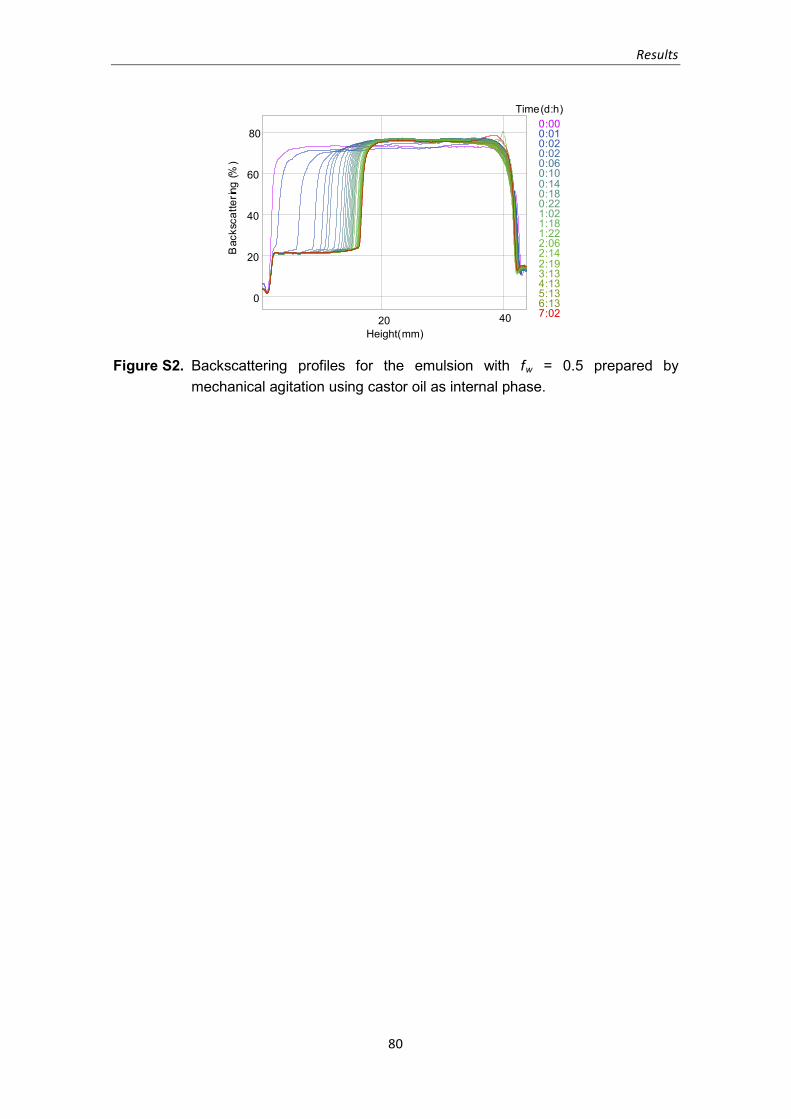
Results
80
Bac
ksca
tterin
g(%
)
20 40
0
20
40
60
800:000:010:020:020:060:100:140:180:221:021:181:222:062:142:193:134:135:136:137:02
Height(mm)
Time(d:h)
Figure S2. Backscattering profiles for the emulsion with fw = 0.5 prepared by mechanical agitation using castor oil as internal phase.
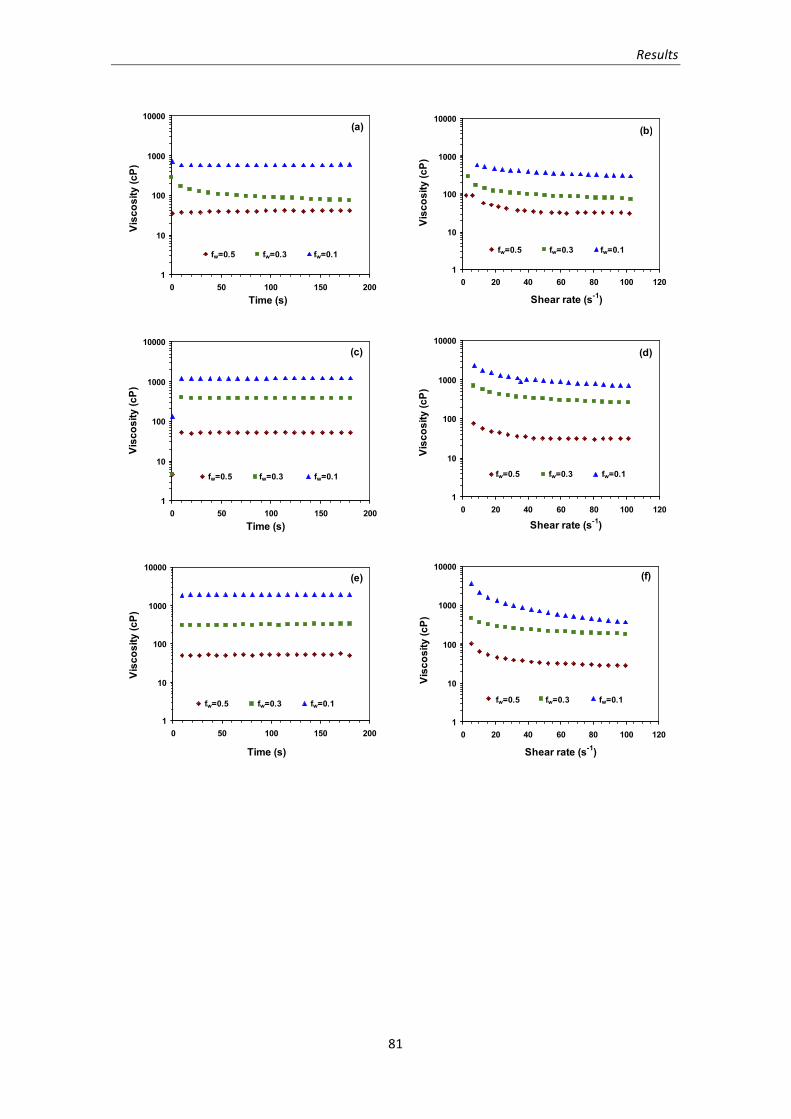
Results
81
Bac
ksca
tterin
g(%
)
20 40
0
20
40
60
800:000:010:020:020:060:100:140:180:221:021:181:222:062:142:193:134:135:136:137:02
Height(mm)
Time(d:h)
Figure S2. Backscattering profiles for the emulsion with fw = 0.5 prepared by mechanical agitation using castor oil as internal phase.
1
10
100
1000
10000
0 50 100 150 200Time (s)
Visc
osity
(cP)
fw=0.5 fw=0.3 fw=0.1
(a)
fw=0.5 fw=0.3 fw=0.1
1
10
100
1000
10000
0 20 40 60 80 100 120
Shear rate (s-1)
Visc
osity
(cP)
fw=0.5 fw=0.3 fw=0.1
(b)
fw=0.5 fw=0.3 fw=0.1
1
10
100
1000
10000
0 50 100 150 200Time (s)
Visc
osity
(cP)
fw=0.5 fw=0.3 fw=0.1
(c)
fw=0.5 fw=0.3 fw=0.1
1
10
100
1000
10000
0 20 40 60 80 100 120
Shear rate (s-1)
Visc
osity
(cP)
fw=0.5 fw=0.3 fw=0.1
(d)
fw=0.5 fw=0.3 fw=0.1
1
10
100
1000
10000
0 50 100 150 200
Time (s)
Visc
osity
(cP)
fw=0.5 fw=0.3 fw=0.1fw=0.5 fw=0.3 fw=0.1
(e)
1
10
100
1000
10000
0 20 40 60 80 100 120
Shear rate (s-1)
Visc
osity
(cP)
fw=0.5 fw=0.3 fw=0.1
(f)
fw=0.5 fw=0.3 fw=0.1
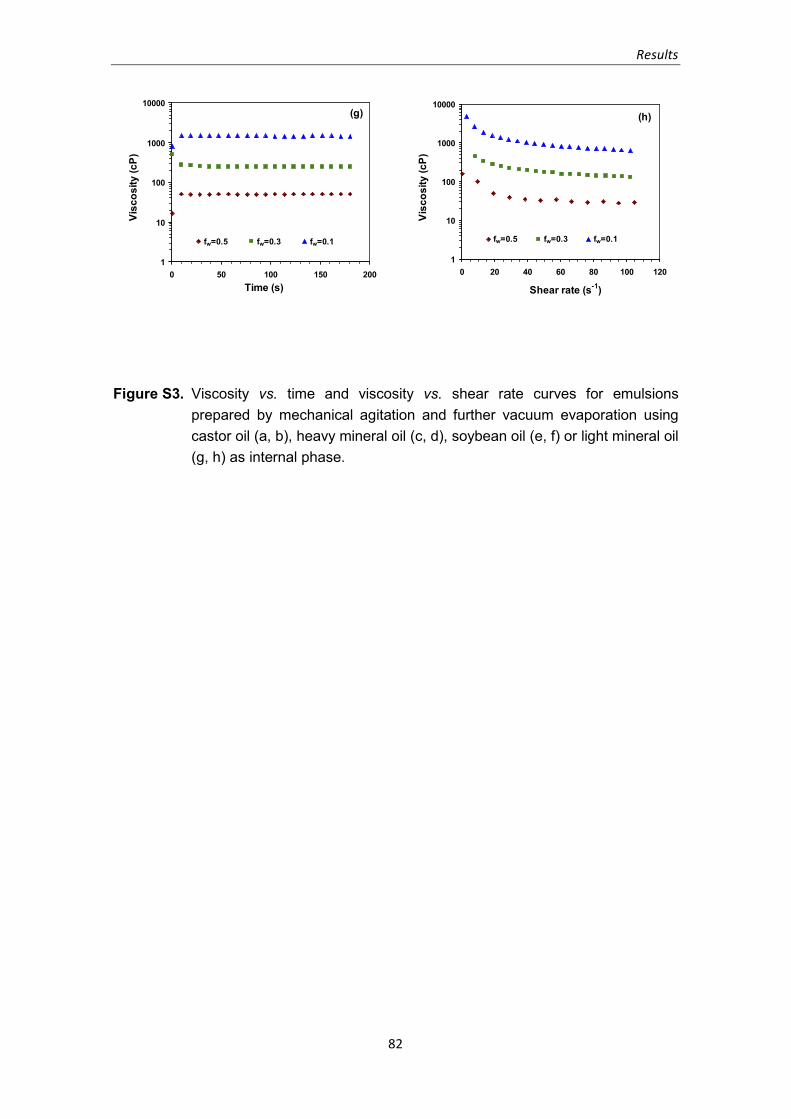
Results
82
1
10
100
1000
10000
0 50 100 150 200Time (s)
Visc
osity
(cP)
fw=0.5 fw=0.3 fw=0.1
(g)
fw=0.5 fw=0.3 fw=0.1fw=0.5 fw=0.3 fw=0.1
1
10
100
1000
10000
0 20 40 60 80 100 120
Shear rate (s-1)
Visc
osity
(cP)
fw=0.5 fw=0.3 fw=0.1
(h)
fw=0.5 fw=0.3 fw=0.1
Figure S3. Viscosity vs. time and viscosity vs. shear rate curves for emulsions prepared by mechanical agitation and further vacuum evaporation using castor oil (a, b), heavy mineral oil (c, d), soybean oil (e, f) or light mineral oil (g, h) as internal phase.
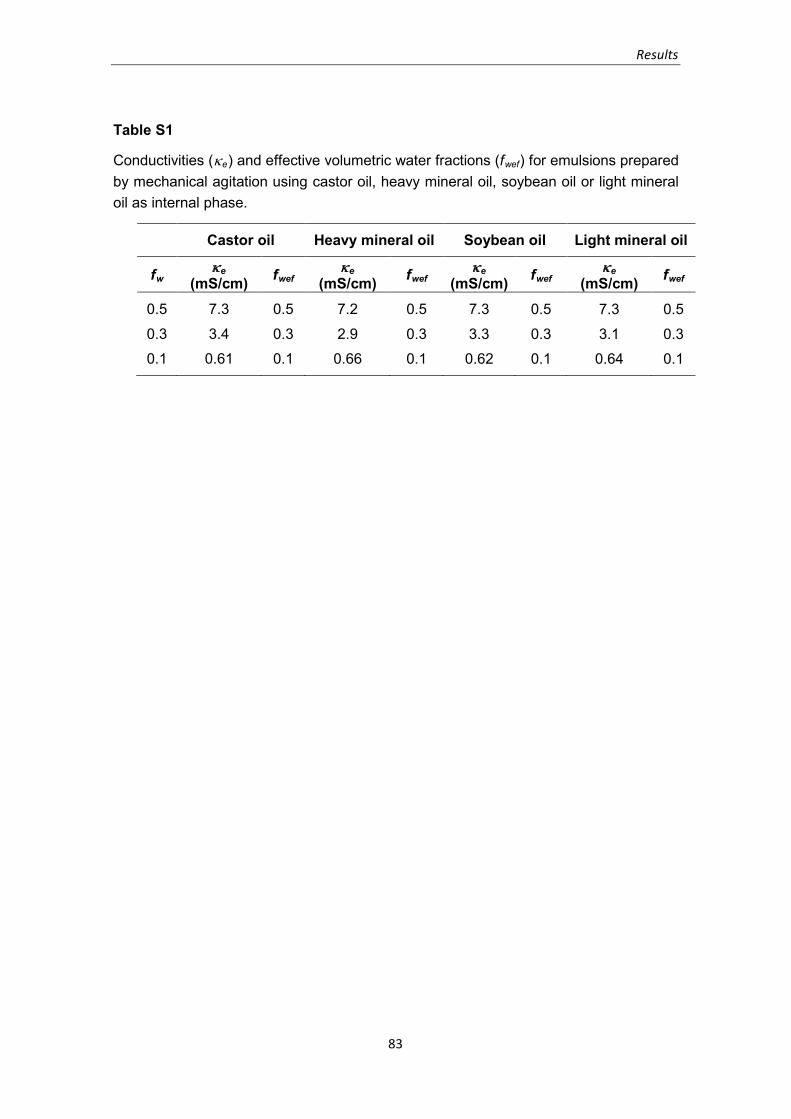
Results
83
1
10
100
1000
10000
0 50 100 150 200Time (s)
Visc
osity
(cP)
fw=0.5 fw=0.3 fw=0.1
(g)
fw=0.5 fw=0.3 fw=0.1fw=0.5 fw=0.3 fw=0.1
1
10
100
1000
10000
0 20 40 60 80 100 120
Shear rate (s-1)
Visc
osity
(cP)
fw=0.5 fw=0.3 fw=0.1
(h)
fw=0.5 fw=0.3 fw=0.1
Figure S3. Viscosity vs. time and viscosity vs. shear rate curves for emulsions prepared by mechanical agitation and further vacuum evaporation using castor oil (a, b), heavy mineral oil (c, d), soybean oil (e, f) or light mineral oil (g, h) as internal phase.
Table S1
Conductivities (κe) and effective volumetric water fractions (fwef) for emulsions prepared by mechanical agitation using castor oil, heavy mineral oil, soybean oil or light mineral oil as internal phase.
Castor oil Heavy mineral oil Soybean oil Light mineral oil
fwκe
(mS/cm) fwefκe
(mS/cm) fwefκe
(mS/cm) fwefκe
(mS/cm) fwef
0.5
0.3
0.1
7.3
3.4
0.61
0.5
0.3
0.1
7.2
2.9
0.66
0.5
0.3
0.1
7.3
3.3
0.62
0.5
0.3
0.1
7.3
3.1
0.64
0.5
0.3
0.1
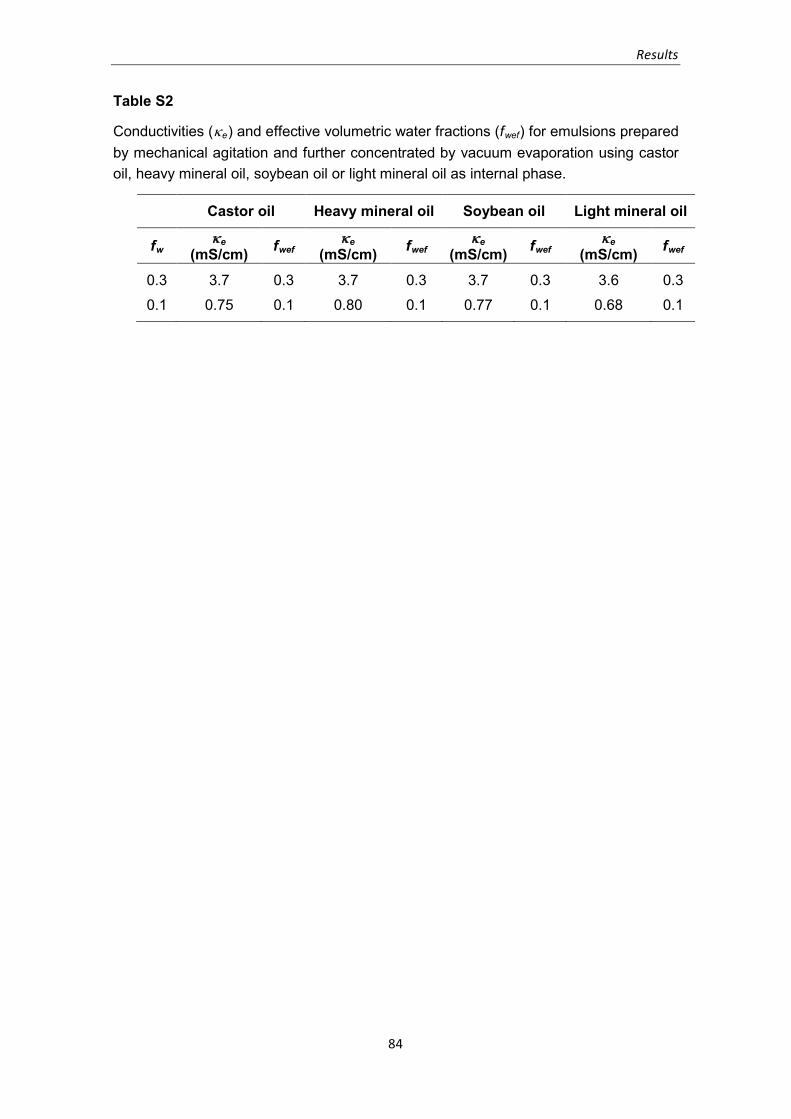
Results
84
Table S2
Conductivities (κe) and effective volumetric water fractions (fwef) for emulsions prepared by mechanical agitation and further concentrated by vacuum evaporation using castor oil, heavy mineral oil, soybean oil or light mineral oil as internal phase.
Castor oil Heavy mineral oil Soybean oil Light mineral oil
fwκe
(mS/cm) fwefκe
(mS/cm) fwefκe
(mS/cm) fwefκe
(mS/cm) fwef
0.3
0.1
3.7
0.75
0.3
0.1
3.7
0.80
0.3
0.1
3.7
0.77
0.3
0.1
3.6
0.68
0.3
0.1

GENERAL CONCLUSIONS
General conclusions
86
From the results presented in this thesis and in the attached publications the
following conclusions can be reached:
1. Stable monodisperse O/W emulsions were obtained using commercial available
microfiltration flat and tubular ceramic membranes. Typical operation
parameters seemed to have a small influence on mean droplet diameter and
size distribution, suggesting that the droplet formation mechanism was not
shear stress-based. A spontaneous emulsification mechanism was proposed for
both types of membranes.
2. Double Pickering emulsions stabilized with starch granules, isolated from
Quinoa and hydrophobically modified, were prepared showing high
encapsulation stability after one month of storage at room temperature. These
results suggest that this type of starch double Pickering emulsions could be
suitable for several applications in food and pharmaceutical products.
3. For water-in-oil-in-water (W1/O/W2) double emulsions formulated to
encapsulate trans-resveratrol, polyglycerol polyricinoleate (PGPR) was the best
inner emulsifier. The combination of Tween 20 and CMCNa in the external
aqueous phase seemed to have a synergetic effect leading to better initial
encapsulation efficiencies. An increase in PGPR content yielded a slight increase
in initial encapsulation efficiency values.
4. Since vacuum evaporation did not modify emulsion droplet size, a combination
of membrane emulsification and vacuum evaporation allowed to obtain O/W
emulsions with high internal phase content (HIPEs) and controlled droplet size
containing lipophilic bioactive compounds, as lutein.

CONCLUSIONES GENERALES
Conclusiones generales
88
A partir de todos los resultados obtenidos en este trabajo, se ha llegado a las
conclusiones generales que a continuación se exponen:
1. Se obtuvieron emulsiones aceite-agua, monodispersas y estables, usando
membranas cerámicas comerciales de microfiltración planas y tubulares. Los
parámetros típicos de operación presentaron poca influencia en el tamaño
medio de gota y en la distribución de tamaños, lo que sugirió que el mecanismo
de formación de gota no estaba basado en el esfuerzo cortante. Se propuso un
mecanismo de formación espontánea de gota para ambos tipos de membranas.
2. Las emulsiones dobles tipo Pickering, estabilizadas con partículas de almidón,
procedente de la Quinoa y modificadas hidrofóbicamente, presentaron una
elevada estabilidad después de un mes de almacenamiento a temperatura
ambiente. Por tanto, estas emulsiones podrían resultar apropiadas para su
aplicación en diversos alimentos y productos cosméticos.
3. El polirricinoleato de poliglicerol (PGPR) resultó ser el estabilizante más
adecuado en la formulación de emulsiones dobles agua-aceite-agua (W/O/W)
para encapsular trans-resveratrol. La combinación en la fase externa del
tensioactivo Tween 20 y la carboximetilcelulosa sódica (CMCNa) dio lugar a un
efecto sinérgico con valores más elevados de eficacia de encapsulación. Se
obtuvieron emulsiones más estables, cuando se prepararon mediante agitación
mecánica, que cuando se prepararon mediante técnicas con membranas. Un
mayor contenido de PGPR condujo a un aumento de la eficacia de
encapsulación inicial.
4. La evaporación a vacío no modifica el tamaño de gota de la emulsión de
partida. Por ello, la combinación de dos técnicas, emulsificación con
membranas y evaporación a vacío, permitió preparar emulsiones O/W con
elevado contenido en fase interna (HIPEs) y tamaño de gota totalmente
controlado, conteniendo biocompuestos lipófilos como la luteína.

REFERENCES
References
Abrahamse A.J., A. van der Padt, R.M. Boom, W.B.C. de Heij (2001) Process fundamentals of membrane emulsification: simulation with CFD, AIChE J. 47, 1285–1291.
Abrahamse A.J., R. van Lierop, R.G.M. van der Sman, A. van der Padt, R.M. Boom (2002) Analysis of droplet formation and interactions during cross-flow membrane emulsification, J. Membr. Sci. 204, 125–137.
Alvarez O.A., L. Choplin, V. Sadtler, P. Marchal, M.-J. Stébé, J. Mougel, C. Baravian (2010) Influence of semibatch emulsification process conditions on the physical characteristics of highly concentrated water-in-oil emulsions, Ind. Eng. Chem. Res. 49, 6042–6064.
Amri A., J.C. Chaumeil, S. Sfar, C. Charreau (2012) Administration of resveratrol: what formulation solutions to bioavailability limitations?, J. Control. Release 158, 182–193.
Aryanti N., R. Hou, R.A. Williams (2009) Performance of a rotating membrane emulsifier for production of coarse droplets, J. Membr. Sci. 326, 9–18.
Aserin A. (2008) Multiple Emulsions: Technology and Applications, Wiley Interscience, Hoboken, USA.
Augustin M.A., Y. Hemar (2009) Nano- and micro-structured assemblies for encapsulation of food ingredients, Chem. Soc. Rev. 38, 902–912.
Aveyard R., B.P. Binks, J.H. Clint (2003) Emulsions stabilised solely by colloidal particles, Adv. Colloid Interface Sci. 100–102, 503–546.
Bancroft W.D. (1913) The theory of emulsification, V, J. Phys. Chem. 17, 501–519.
Bancroft W.D. (1915) The theory of emulsification, VI, J. Phys. Chem. 19, 275–309.
Biesalski H.-K., L.O. Dragsted, I. Elmadfa, R. Grossklaus, M. Müller, D. Schrenk, P. Walter, P. Weber (2009) Bioactive compounds: definition and assessment of activity, Nutrition 25, 1202–1205.
Binks B.P. (2002) Particles as surfactants – similarities and differences, Curr. Opin. Colloid Interface Sci. 7, 21–41.
Caddeo B., K. Teskac, C. Sinico, J. Kristl (2008) Effect of resveratrol incorporated in liposomes on proliferation and UV-B protection of cells, Int. J. Pharm. 363, 183–191.
Campbell S.B., T. Larson, N.M.B. Smeets, U. El-Jaby, T.F.L. McKenna (2012) Miniemulsification by catastrophic phase inversion, Chem. Eng. J. 183, 534–541.
Charcosset C., I. Limayem, H. Fessi (2004) The membrane emulsification process—a review, J. Chem. Technol. Biotechnol. 79, 209–218.
90
References
Charcosset C. (2009) Preparation of emulsions and particles by membrane emulsification for the food processing industry, J. Food. Eng. 92, 241–249.
Christov N.C., D.N. Ganchev, N.D. Vassileva, N.D. Denkov, K.D. Danov, P.A. Kralchevsky (2002) Capillary mechanisms in membrane emulsification: oil-in-water emulsions stabilized by Tween 20 and milk proteins, Colloid Surf. A-Physicochem. Eng. Asp. 209, 83–104.
Christov N.C., K.D. Danov, D.K. Danova, P.A. Kralchevsky (2008) The drop size in membrane emulsification determined from the balance of capillary and hydrodynamic forces, Langmuir 24, 1397–1410.
Constantinides P.P. (1995) Lipid microemulsions for improving drug dissolution and oral absorption: physical and biopharmaceutical aspects, Pharm. Res. 12, 1561–1572.
Constantinides P.P., G. Welzel, H. Ellens, P.L. Smith, S. Sturgis, S.H. Yiv, A.B. Owen (1996) Water-in-oil microemulsions containing medium-chain fatty acids/salts: formulation and intestinal absorption enhancement evaluation, Pharm. Res. 13, 210–215.
Danov K.D., D.K. Danova, P.A. Kralchevsky (2007) Hydrodynamic forces acting on a microscopic emulsion drop growing at a capillary tip in relation to the process of membrane emulsification, J. Colloid Interface Sci. 316, 844–857.
De los Reyes J.S., C. Charcosset (2010) Preparation of water-in-oil and ethanol-in-oil emulsions by membrane emulsification, Fuel 89, 3482–3488.
De Luca G., E. Drioli (2006) Force balance conditions for droplet formation in cross-flow membrane emulsifications, J. Colloid Interface Sci. 294, 436–448.
De Luca G., F.P. Di Maio, A. Di Renzo, E. Drioli (2008) Droplet detachment in cross-flow membrane emulsification: comparison among torque- and force-based models, Chem. Eng. Process. 47, 1150–1158.
Dickinson E. (2010) Food emulsions and foams: stabilization by particles, Curr. Opin. Colloid Interface Sci. 15, 40–49.
Dickinson E. (2011) Double emulsions stabilized by food biopolymers, Food Biophys. 6, 1–11.
Donsi F., M. Sessa, H. Mediouni, A. Mgaidi, G. Ferrari (2011) Encapsulation of bioactive compounds in nanoemulsion-based delivery systems, Procedia Food Sci. 1, 1666–1671.
Dubensky T.W., S.G. Reed (2010) Adjuvants for cancer vaccines, Semin. Immunol. 22, 155–161.
Eisner V. (2007) Emulsion Processing with a Rotating Membrane (ROME), PhD Thesis, Laboratory of Food Process Engineering, ETH Zürich, Switzerland.
91
References
Esquena J., G.S.R. Ravi-Sankar, C. Solans (2003) Highly concentrated W/O emulsions prepared by the PIT method as templates for solid foams, Langmuir 19, 2983–2988.
Fabris S., F. Momo, G. Ravagnan, R. Stevanato (2008) Antioxidant properties of resveratrol and piceid on lipid peroxidation in micelles and monolamellar liposomes, Biophys. Chem. 135, 76–83.
Fang J.Y., C.F. Hung, M.H. Liao, C.C. Chien (2007) A study of the formulation design of acoustically active lipospheres as carriers for drug delivery, Eur. J. Pharm. Biopharm. 67, 67–75.
Fang Z.X., B. Bhandari (2010) Encapsulation of polyphenols—a review, Trends Food Sci. Technol. 21, 510–523.
Fanun M. (2009) Microemulsions: Properties and Applications. Surfactant Science Series 144, CRC Press, Boca Raton, USA.
Frasch-Melnik S., I.T. Norton, F. Spyropoulos (2010a) Fat-crystal stabilised w/o emulsions for controlled salt release, J. Food. Eng. 98, 437–442.
Frasch-Melnik S., F. Spyropoulos, I.T. Norton (2010b) W1/O/W2 double emulsions stabilised by fat crystals—Formulation, stability and salt release, J. Colloid Interface Sci. 350, 178–185.
Galvin K.P., S.J. Pratten, N.G. Shankar, G.M. Evans, S.R. Biggs, D. Tunaley (2001) Production of high internal phase emulsions using rising air bubbles, Chem. Eng. Sci. 56, 6285–6293.
Garti N., A. Aserin, Y. Cohen (1994) Mechanistic considerations on the release of electrolytes from multiple emulsions stabilized by BSA and nonionic surfactants, J. Control. Release 29, 41–51.
Garti N. (1997a) Double emulsions—scope, limitations and new achievements. Colloid Surf. A-Physicochem. Eng. Asp. 123–124, 233–246.
Garti N. (1997b) Progress in stabilization and transport phenomena of double emulsions in food applications, LWT Food Sci. Technol. 30, 222–235.
Gijsbertsen-Abrahamse A.J., A. van der Padt, R.M. Boom (2004) Status of cross-flow membrane emulsification and outlook for industrial application, J. Membr. Sci. 230, 149–159.
Groeneweg F., W.G.M. Agterof, P. Jaeger, J.J.M. Janssen, J.A. Wieringa, J.K. Klahn (1998) On the mechanism of the inversion of emulsions, Chem. Eng. Res. Des. 76, 55–63.
Hao D.X., F.L. Gong, G.H. Hu, Y.J. Zhao, G.P. Lian, G.H. Ma, Z. Su (2008) Controlling factors on droplets uniformity in membrane emulsification: experiment and modeling analysis, Ind. Eng. Chem. Res. 47, 6418–6425.
92
References
Ho H.O., C.C. Hsiao, M.T. Sheu (1996) Preparation of microemulsions using polyglicerol fatty acids as surfactant for the delivery of protein drugs, J. Pharm. Sci. 85, 138–143.
Holdich R.G., M.M. Dragosavac, G.T. Vladisavljevic, S.T. Kosvintsev (2010) Membrane emulsification with oscillating and stationary membranes, Ind. Eng. Chem. Res. 49, 3810–3817.
Joscelyne S.M., G. Trägårdh (2000) Membrane emulsification–a literature review, J. Membr. Sci. 169, 107–117.
Joubran R., N. Parris, D. Lu, S. Trevino (1994) Synergetic effect of sucrose and ethanol on formation of triglyceride microemulsions, J. Dispersion Sci. Technol. 15, 687–704.
Kahlweit M., G. Busse, B. Faulhaber, H. Eibl (1995) Preparing nontoxic microemulsions, Langmuir 11, 4185–4187.
Kahlweit M., G. Busse, B. Faulhaber (1996) Preparing microemulsions with alkyl monoglucosides and the role of alkanediols as cosolvents, Langmuir 12, 861–862.
Kawakatsu T., Y. Kikuchi, M. Nakajima (1997) Regular-sized cell creation in microchannel emulsification by visual microprocessing method, J. Am. Oil Chem. Soc. 74, 317–321.
Kobayashi I., M. Nakajima, S. Mukataka (2003) Preparation characteristics of oil-in-water emulsions using differently charged surfactants in straight-through microchannel emulsification, Colloid Surf. A-Physicochem. Eng. Asp. 229, 33–41.
Kobayashi I., S. Mukataka, M. Nakajima (2004) Effect of slot aspect ratio on droplet formation from silicon straight-through microchannels, J. Colloid Interface Sci. 279, 277–280.
Kosvintsev S.R., G. Gasparini, R.G. Holdich, I.W. Cumming, M.T. Stillwell (2005) Liquid-liquid membrane dispersion in a stirred cell with and without controlled shear, Ind. Eng. Chem. Res. 44, 9323–9330.
Kristl J., K. Teskac, C. Caddeo, Z. Abramovic, M. Sentjurc (2009) Improvements of cellular stress response on resveratrol in liposomes, Eur. J. Pharm. Biopharm. 773, 253–259.
Krog N. (1977) Functions of emulsifiers in food systems, J. Am. Oil Chem. Soc. 54, 124–131.
Kunieda H., Y. Hasegawa, A.C. John, M. Naito, M. Muto (1996) Phase behavior of polyoxyethylene hydrogenated castor oil in oil/water system, Colloid Surf. A-Physicochem. Eng. Asp. 109, 209–216.
Kukizaki M. (2009) Shirasu porous glass (SPG) membrane emulsification in the absence of shear flow at the membrane surface: influence of surfactant type and
93
References
concentration, viscosities of dispersed and continuous phases, and transmembrane pressure, J. Membr. Sci. 327, 234–243.
Kukizaki M., M. Goto (2009) A comparative study of SPG membrane emulsification in the presence and absence of continuous-phase flow, J. Chem. Eng. Jpn. 42, 520–530.
Lambrich U., H. Schubert (2005) Emulsification using microporous systems, J. Membr. Sci. 257, 76–84.
Lim H., A. Kassim, N. Huang, M.A. Yarmo (2009) Palm-based nonionic surfactants as emulsifiers for high internal phase emulsions, J. Surfactants Deterg. 12, 355–362.
Lissant K.J. (1970) Geometry of emulsions, J. Soc. Cosmet. Chem. 21, 141–154.
Lissant K.J. (1996) The geometry of high-internal-phase-ratio emulsions, J. Colloid Interface Sci. 22, 462–468.
Liu Y., S.E. Friberg (2009) Role of liquid crystal in the emulsification of a gel emulsion with high internal phase ratio, J. Colloid Interface Sci. 340, 261–268.
Lucas-Abellán C., I. Fortea, J.M. López-Nicolás, E. Núñez-Delicado (2007) Cyclodextrins as resveratrol carrier system, Food Chem. 104, 39–44.
Luo Z., B.S. Murray, A. Yusoff, M.R.A. Morgan, M.J.W. Povey, A.J. Day (2011) Particle-stabilizing effects of flavonoids at the oil-water interface, J. Agric. Food Chem. 59, 2636–2645.
Maan A.A., K. Schroën, R. Boom (2011) Spontaneous droplet formation techniques for monodisperse emulsions preparation–Perspectives for food applications, J. Food Eng. 107, 334–346.
Márquez A.L., G.G. Palazolo, J.R. Wagner (2007) Water in oil (w/o) and double (w/o/w) emulsions prepared with spans: microstructure, stability, and rheology, Colloid Polym. Sci. 285, 1119–1128.
Márquez A.L., A. Medrano, L.A. Panizzolo, J.R. Wagner (2010) Effect of calcium salts and surfactant concentration on the stability of water-in-oil emulsions prepared with polyglycerol polyricinoleate, J. Colloid Interface Sci. 341, 101–108.
Mason T.G., J.N. Wilking, K. Meleson, C.B. Chang, S.M. Graves (2006) Nanoemulsions: formation, structure, and physical properties, J. Phys.: Condens. Matter 18, R635–R666.
Matsumoto Y., M.M. Alam, K. Aramaki (2009) Phase behaviour, formation, and rheology of cubic and hexagonal phase based gel emulsion in water/tetraglyceryl lauryl ether/oil systems, Colloid Surf. A-Physicochem. Eng. Asp. 341, 27–32.
Meyer R.F., J.C. Crocker (2009) Universal dripping and jetting in a transverse shear flow, Phys. Rev. Lett. 102, 194501.
94
References
Mishchuk N.A., A. Sanfeld, A. Steinchen (2004) Interparticle interaction in concentrate water-oil emulsions, Adv. Colloid Interface Sci. 112, 129–157.
Mitri K., R. Shegokar, S. Gohla, C. Anselmi, R.H. Müller (2011) Lipid nanocarriers for dermal delivery of lutein: preparation, characterization, stability and performance, Int. J. Pharm. 414, 267–275.
Murray B.S., K. Durga, A. Yusoff, S.D. Stoyanov (2011) Stabilization of foams and emulsions by mixtures of surface active food-grade particles and proteins, Food Hydrocolloids 25, 627–638.
Muschiolik G. (2007) Multiple emulsions for food use, Curr. Opin. Colloid Interface Sci. 12, 213–220.
Myers D. (2006) Surfactant Science and Technology, 3rd Ed. Wiley, Hoboken, USA.
Nazir A., K. Schroën, R. Boom (2010) Premix emulsification: a review, J. Membr. Sci. 362, 1–11.
Nazir A., K. Schroën, R. Boom (2011) High-throughput premix membrane emulsification using nickel sieves having straight-through pores, J. Membr. Sci. 383, 116–123.
Okochi H., M. Nakano (1997) Comparative study of two preparation methods of W/O/W emulsions: stirring and membrane emulsification, Chem. Pharm. Bull. 45, 1323–1326.
Pando D., C. Caddeo, M. Manconi, A.M. Fadda, C. Pazos (2013a) Nanodesign of olein vesicles for the topical delivery of antioxidant resveratrol, J. Pharm. Pharmacol. 65, 1158–1167.
Pando D., G. Gutiérrez, J. Coca, C. Pazos (2013b) Preparation and characterization of niosomes containing resveratrol, J. Food Eng. 117, 227–234.
Park K.M., M.K. Lee, K.J. Hwang, C.K. Kim (1999) Phospholipid-based microemulsions of flurbiprofen by the spontaneous emulsification process, Int. J. Pharm. 183, 145–154.
Pathak M. (2011) Numerical simulation of membrane emulsification: effect of flow properties in the transition from dripping to jetting, J. Membr. Sci. 382, 166–176.
Pawlik A.K., I.T. Norton (2012) Encapsulation stability of duplex emulsions prepared with SPG cross-flow membrane, SPG rotating membrane and rotor-stator techniques—A comparison, J. Membr. Sci. 415–416, 459–468.
Peng H., H. Xiong, J. Li, M. Xie, Y. Liu, C. Bai, L. Chen (2010) Vanillin cross-linked chitosan microspheres for controlled release of resveratrol, Food Chem. 121, 23–28.
95

References
Peng S.J., R.A. Williams (1998) Controlled production of emulsions using a crossflow membrane. Part I: Droplet formation from a single pore, Chem. Eng. Res. Des. 76, 894–901.
Pickering S.U. (1907) Emulsions, J. Chem. Soc. Trans. 91, 2001–2021.
Pilcer G., K. Amighi (2010) Formulation strategy and use of excipients in pulmonary drug delivery, Int. J. Pharm. 392, 1–19.
Priest C., S. Herminghaus, R. Seemann (2006) Generation of monodisperse gel emulsions in a microfluidic device, Appl. Phys. Lett. 88, 024106.
Princen H.M. (1979) Highly concentrated emulsions: I. Cylindrical systems, J. Colloid Interface Sci. 71, 55–66.
Princen H.M., M.P. Aronson, J.C. Moser (1980) Highly concentrated emulsions: II. Real systems. The effect of thin film thickness and contact angle on the volume fraction in creamed emulsions, J. Colloid Interface Sci. 75, 246–270.
Princen H.M., A.D. Kiss (1986) Rheology of foams and highly concentrated emulsions. III. Static shear modulus, J. Colloid Interface Sci. 112, 427–437.
Qv X.-Y., Z.-P. Zeng, J.-G. Jiang (2011) Preparation of lutein microencapsulation by complex coacervation method and its physicochemical properties and stability, Food Hydrocolloids 25, 1596–1603.
Ramakrishnan S., M. Ferrando, L. Aceña-Muñoz, S. De Lamo-Castellví, C. Güell (2013a) Fish oil microcapsules from O/W emulsions produced by premix membrane emulsification, Food Bioprocess Technol. 6, 3088–3101.
Ramakrishnan S., M. Ferrando, L. Aceña-Muñoz, S. De Lamo-Castellví, C. Güell (2013b) Influence of emulsification technique and wall composition on physicochemical properties and oxidative stability of fish oil microcapsules produced by spray drying, Food Bioprocess Technol. DOI 10.1007/s11947-013-1187-4
Ramsden W. (1903) Separation of solids in the surface-layers of solutions and suspensions (Observations on surface-membranes, bubbles, emulsions, and mechanical coagulation)—Preliminary account, Proc. R. Soc. London 72, 156–164.
Rayner M., G. Trägårdh (2002) Membrane emulsification modelling: how can we get from characterisation to design?, Desalination 145, 165–172.
Rayner M., G. Trägårdh, C. Trägårdh, P. Dejmek (2004) Using the Surface Evolver to model droplet formation processes in membrane emulsification, J. Colloid Interface Sci. 279, 175–185.
Rayner M., G. Trägårdh, C. Trägårdh (2005) The impact of mass transfer and interfacial tension expansion rate on droplet size in membrane emulsification processes, Colloid Surf. A-Physicochem. Eng. Asp. 266, 1–17.
96
References
Rayner M., M. Sjöö, A. Timgren, P. Dejmek (2012) Quinoa starch granules as stabilizing particles for production of Pickering emulsions, Faraday Discuss. 158, 139–155.
Reynolds P.A., E.P. Gilbert, M.J. Henderson, J.W. White (2009) Structure of high aqueous-in-oil emulsions and related inverse micelle solutions. 4. Surfactant mixtures, J. Phys. Chem. B 113, 12243–12256.
Rondón-González M., V. Sadtler, L. Choplin, J.L. Salager (2006) Emulsion catastrophic inversion from abnormal to normal morphology. 5. Effect of the water-to-oil ratio and surfactant concentration on the inversion produced by continuous stirring, Ind. Eng. Chem. Res. 45, 3074–3080.
Rondón-González M., V. Sadtler, P. Marchal, L. Choplin, J.L. Salager (2008) Emulsion catastrophic inversion from abnormal to normal morphology. 7. Emulsion evolution produced by continuous stirring to generate a very high internal phase ratio emulsion, Ind. Eng. Chem. Res. 47, 2314–2319.
Rosen M.J. (2004) Surfactants and Interfacial Phenomena, 3rd Ed. Wiley Interscience, Hoboken, USA.
Rossier-Miranda F.J., K. Schroën, R. Boom (2010) Mechanical characterisation and release properties of fibril-reinforced microcapsules prepared by layer-by-layer adsorption, Langmuir 26, 19106–19113.
Saiko P., A. Szakmary, W. Jaeger, T. Szekeres (2008) Resveratrol and its analogs: defense against cancer, coronary disease and neurodegenerative maladies or just a fad?, Mutat. Res.-Rev. Mutat. Res. 658, 68–94.
Saint Ruth H., D. Attwood, G. Ktistis, C.J. Taylor (1995) Phase studies and particle size analysis of oil-in-water phospholipid microemulsions, Int. J. Pharm. 116, 253–261.
Sapei L., M.A. Naqvi, D. Rousseau (2012) Stability and release properties of double emulsions for food applications, Food Hydrocolloids 27, 316–323.
Sawalha H., N. Purwanti, A. Rinzema, K. Schroën, R. Boom (2008) Polylactide microspheres prepared by premix membrane emulsification-Effects of solvent removal rate, J. Membr. Sci. 310, 484–493.
Schmidts T., D. Dobler, A.-C. Guldan, N. Paulus, F. Runkel (2010) Multiple W/O/W emulsions–Using the required HLB for emulsifier evaluation, Colloid Surf. A-Physicochem. Eng. Asp. 372, 48–54.
Schröder V., H. Schubert (1999) Production of emulsions using microporous ceramic membranes, Colloid Surf. A-Physicochem. Eng. Asp. 152, 103–109.
Seifriz W. (1924) Studies in emulsions. III-V, J. Phys. Chem. 29, 738–749
Shao J., X. Li, X. Lu, C. Jiang, Y. Hu, Q. Li, Y. You, Z. Fu (2009) Enhanced growth inhibition effect of Resveratrol incorporated into biodegradable nanoparticles against
97
References
glioma cells is mediated by the induction of intracellular reactive oxygen species levels, Colloid Surf. B-Biointerfaces 72, 40–47.
Shinoda K., M. Araki, A. Sadaghiani, A. Khan, B. Lindman (1991) Lecithin-based microemulsions; phase behavior and microstructure, J. Phys. Chem. 95, 989–993.
Solans C., J. Esquena, N. Azemar (2003) Highly concentrated (gel) emulsions, versatile reaction media, Curr. Opin. Colloid Interface Sci. 8, 156–163.
Steegmans M.L.J., C.G.P.H. Schroën, R.M. Boom (2009) Generalised insights in droplet formation at T-junctions through statistical analysis, Chem. Eng. Sci. 64, 3042–3050.
Stubenrauch C., B. Paeplow, G.H. Findenegg (1997) Microemulsions supported by octyl monoglucoside and geraniol. 1. The role of alcohol in the interfacial layer, Langmuir 13, 3652–3658.
Su J., J. Flanagan, Y. Hemar, H. Singh (2006) Synergistic effects of polyglycerol ester of polyricinoleic acid and sodium caseinate on the stabilisation of water-oil-water emulsions, Food Hydrocolloids 20, 261–268.
Suárez M.Á., J. Coca, C. Pazos (2012) Membrane emulsification: factors influencing the size and distribution of the drops, Ing. Quím. 505, 58–73.
Sugiura S., M. Nakajima, N. Kumazawa, S. Iwamoto, M. Seki (2002) Characterization of spontaneous transformation-based droplet formation during microchannel emulsification, J. Phys. Chem. B. 106, 9405–9409.
Surh J., Y.G. Jeong, G.T. Vladisavljevic (2008) On the preparation of lecithin-stabilized oil-in-water emulsions by multi-stage premix membrane emulsification, J. Food Eng. 89, 164–170.
Suzuki K., I. Shuto, Y. Hagura (1996) Characteristics of the membrane emulsification method combined with preliminary emulsification for preparing corn oil-in-water emulsions, Food Sci. Technol. Int. 2, 43–47.
Tcholakova S., N.D. Denkov, A. Lips (2008) Comparison of solid particles, globular proteins and surfactants as emulsifiers, Phys. Chem. Chem. Phys. 10, 1608–1627.
Tcholakova S., I. Lesov, K. Golemanov, N.D. Denkov, S. Judat, R. Engel, T. Danner (2011) Efficient emulsification of viscous oils at high drop volume fraction, Langmuir 27, 14783–14796.
Teskac K., J. Kristl (2010) The evidence for solid lipid nanoparticles mediated cell uptake of resveratrol, Int. J. Pharm. 390, 61–69.
Thevenin M.A., J.L. Grossiord, M.C. Poelman (1996) Sucrose esters cosurfactant microemulsion systems for transdermal delivery—Assesment of bicontinuous structures, Int. J. Pharm. 137, 177–186.
98
References
Timgren A., G. Trägårdh, C. Trägårdh (2009) Effects of cross-flow velocity, capillary pressure and oil viscosity on oil-in-water drop formation from a capillary, Chem. Eng. Sci. 64, 1111–1118.
Timgren A., G. Trägårdh, C. Trägårdh (2010) A model for drop size prediction during cross-flow emulsification, Chem. Eng. Res. Des. 88, 229–238.
Timgren A., M. Rayner, M. Sjöö, P. Dejmek (2011) Starch particles for food based Pickering emulsions, Procedia Food Sci. 1, 95–103.
Trentin A., M. Ferrando, F. López, C. Güell (2009) Premix membrane O/W emulsification: effect of fouling when using BSA as emulsifier, Desalination 245, 388–395.
Trentin A., C. Güell, F. López, M. Ferrando (2010) Microfiltration membranes to produce BSA-stabilized emulsions by premix membrane emulsification, J. Membr. Sci. 356, 22–32.
Trentin A., S. De Lamo, C. Güell, F. López, M. Ferrando (2011) Protein-stabilized emulsions containing beta-carotene produced by premix membrane emulsification, J. Food Eng. 106, 267–274
Van der Graaf S., C.G.P.H. Schroën, R.M. Boom (2005a) Preparation of double emulsions by membrane emulsification—a review, J. Membr. Sci. 251, 7–15.
Van der Graaf S., M.L.J. Steegmans, R.G.M. van der Sman, C.G.P.H. Schroën, R.M. Boom (2005b) Droplet formation in a T-shaped microchannel junction: a model system for membrane emulsification, Colloid Surf. A-Physicochem. Eng. Asp. 266, 106–116.
Van der Zwan E., K. Schroën, K. van Dijke, R. Boom (2006) Visualization of droplet break-up in pre-mix membrane emulsification using microfluidic devices, Colloid Surf. A: Physicochem. Eng. Asp. 277, 223–229
Tyrode E., J. Allouche, L. Choplin, J.L. Salager (2005) Emulsion catastrophic inversion from abnormal to normal morphology 4. Following the emulsion viscosity during three inversion protocols and extending the critical dispersed-phase concept, Ind. Eng. Chem. Res. 44, 67–74.
Tzoumaki M.V., T. Moschakis, V. Kiosseoglou, C.G. Biliaderis (2011) Oil-in-water emulsions stabilized by chitin nanocrystal particles, Food Hydrocolloids 25, 1521–1529.
Vladisavljevic G.T., S. Tesch, H. Schubert (2002) Preparation of water-in-oil emulsions using microporous polypropylene hollow fibers: influence of some operating parameters on droplet size distribution, Chem. Eng. Process. 41, 231–238.
Vladisavljevic G.T., M. Shimizu, T. Nakashima (2004) Preparation of monodisperse multiple emulsions at high production rates by multi-stage premix membrane emulsification, J. Membr. Sci. 244, 97–106.
99
References
Vladisavljevic G.T., R.A. Williams (2005) Recent developments in manufacturing emulsions and particulate products using membranes. Adv. Colloid Interface Sci. 113, 1–20.
Vladisavljevic G.T., M. Shimizu, T. Nakashima (2005) Permeability of hydrophilic and hydrophobic Shirasu-porous-glass (SPG) membranes to pure liquids and its microstructure, J. Membr. Sci. 250, 69–77.
Vladisavljevic G.T., R.A. Williams (2006) Manufacture of large uniform droplets using rotating membrane emulsification, J. Colloid Interface Sci. 299, 396–402.
Vladisavljevic G.T., M. Shimizu, T. Nakashima (2006a) Production of multiple emulsions for drug delivery systems by repeated SPG membrane homogenization: influence of mean pore size, interfacial tension and continuous phase viscosity, J. Membr. Sci. 284, 373–383.
Vladisavljevic G.T., J. Surh, J.D. McClements (2006b) Effect of emulsifier type on droplet disruption in repeated Shirasu porous glass membrane homogenization, Langmuir 22, 4526–4533.
Wang X.-X., Y.-B. Li, H.-J. Yao, R.-J. Ju, Y. Zhang, R.-J. Li, Y. Yu, L. Zhang, W.-L. Lu (2011) The use of mitochondrial targeting resveratrol liposomes modified with a dequalinium polyethylene glycol-distearoylphosphatidyl ethanolamine conjugate to induce apoptosis in resistant lung cancer cells, Biomaterials 32, 5673–5687.
Williams R.A., S.J. Peng, D.A. Wheeler, N.C. Morley, D. Taylor, M. Whalley, D.W. Houldsworth (1998) Controlled production of emulsions using a crossflow membrane. Part II: Industrial scale manufacture, Chem. Eng. Res. Des. 76, 902–910.
Wilson R., B.J. van Schie, D. Howes (1998) Overview of the preparation, use and biological studies on polyglycerol polyricinoleate (PGPR), Food Chem. Toxicol. 36, 711–718.
Xu J.H., G.S. Luo, G.G. Chen, J.D. Wang (2005) Experimental and theoretical approaches on droplet formation from a micrometer screen hole, J. Membr. Sci. 266, 121–131.
Yang J., D.X. Hao, C.X. Bi, Z.G. Su, L.Y. Wang, G.H. Ma (2010) Rapid synthesis of uniform magnetic microspheres by combing premix membrane emulsification and in situ formation techniques, Ind. Eng. Chem. Res. 49, 6047–6053.
Yasuno M., M. Nakajima, S. Iwamoto, T. Maruyama, S. Sugiura, I. Kobayashi, A. Shono, K. Satoh (2002) Visualization and characterization of SPG membrane emulsification, J. Membr. Sci. 210, 29–37.
Yuan Q., N. Aryanti, G. Gutiérrez, R. A. Williams (2009) Enhancing the throughput of membrane emulsification techniques to manufacture functional particles, Ind. Eng. Chem. Res. 48, 8872–8880.
100
References
Yuan Q., R.A. Williams, N. Aryanti (2010) Innovations in high throughput manufacturing of uniform emulsions and capsules, Adv. Powder Technol. 21, 599–608.
Yusoff A., B.S. Murray (2011) Modified starch granules as particle-stabilizers of oil-in-water emulsions, Food Hydrocolloids 25, 42–55.
101

![One Step Formation of Controllable Complex Emulsions: From ...for generating complex emulsions in a controlled manner. [11 – 13 ] Recently, microfl uidic approaches for preparing](https://img.pdfslide.us/doc/110x75/5ea78c517b3fdb564b4bf810/one-step-formation-of-controllable-complex-emulsions-from-for-generating-complex.jpg)