Embed Size (px)
Citation preview

TSX, NYSE AMERICAN: ALO
March 2020
Production into Profits
Alio Gold - The Gold Turnaround Story

TSX, NYSE AMERICAN: ALO
FORWARD LOOKING INFORMATIONCertain statements and information contained in this presentation constitute “forward-looking statements” within the meaning of applicable U.S. securities laws and “forward-looking information” within the meaning of applicable Canadian securities laws, which we refer to collectively as “forward-looking statements”. Forward-looking statements are statements and information regarding possible events, conditions or results of operations that are based upon assumptions about future economic conditions and courses of action. All statements and information other than statements of historical fact may be forward-looking statements. In some cases, forward-looking statements can be identified by the use of words such as “seek”, “expect”, “anticipate”, “budget”, “plan”, “estimate”, “continue”, “forecast”, “intend”, “believe”, “predict”, “potential”, “target”, “may”, “could”, “would”, “might”, “will” and similar words or phrases (including negative variations) suggesting future outcomes or statements regarding an outlook.Forward-looking statements in the presentation include, but are not limited to, statements which relate to future events. Such statements include estimates of future gold prices, current and future gold production at the San Francisco Mine and the Florida Canyon Mine (“the Mines”), the LOM of the Mines, revenue and cash flows generated by the operation of the Mines, operating, capital, cash, closure and all in sustaining costs associated with the Mines, gold grades and recovery at the Mines, mining rates and processes, strip ratios at the Mines and future taxes payable by the Company and its subsidiaries; the Mines’ mineral resource and reserve estimates; and estimates, forecasts and statements with respect to mine plans and designs, including with respect to the replacement of the Florida Canyon mining fleet, the expansion to the leach pad, pit-rim exploration and sulfide potential at the Florida Canyon Mine and the benefits expected to be derived therefrom, planned activities to improve reliability and operating efficiency and reduce operating and sustaining capital cost requirements at the Florida Canyon Mine, processing, capital spending and the timing of such spending at the Florida Canyon Mine, residual leaching and stockpiling at the San Francisco mine, holding costs at the Ana Paula Project, reduced corporate expenses, and general value enhancing alternatives.Such forward-looking statements are based on a number of material factors and assumptions, including, but not limited to: the successful completion of development projects, planned expansions or other projects within the timelines anticipated and at anticipated production levels; the accuracy of gold price, production, revenue, capital expenditure, cost,reserve and resource, grade, mining, strip ratio, recovery, mine life, net present value, and tax estimates and other assumptions, projections and estimates made in respect of the Mines; that mineral resources can be developed as planned; interest and exchange rates; that required financing and permits will be obtained; general economic conditions, that labour disputes, flooding, ground instability, fire, failure of plant, equipment or processes to operate are as anticipated and other risks of the mining industry will not be encountered; that contracted parties provide goods or services in a timelymanner; that there is no material adverse change in the price of gold, silver or other metals; competitive conditions in the mining industry; title to mineral properties costs; and changes in laws, rules and regulations applicable to the Company. Forward- looking statements involve known and unknown risks, uncertainties and other factors which may cause actual results, performance or achievements, or industry results, to differ materially from those anticipated in such forward-looking statements. The Company believes the expectations reflected in such forward-looking statements are reasonable, but no assurance can be given that these expectations will prove to be correct and you are cautioned not to place undue reliance on forward-looking statements contained herein. Some of the risks and other factors which could cause actual results to differ materially from those expressed in the forward-looking statements contained in this presentation herein by reference include, but are not limited to: decreases in the price of gold; risks associated with COVID-19, competition with other companies with greater financial and human resources and technical facilities; maintaining compliance with governmental regulations and expenses associated with such compliance; ability to hire, train, deploy and manage qualified personnel in a timely manner; ability to obtain or renew required government permits; failure to discover new reserves, maintain or enhance existing reserves or develop new operations; risks and hazards associated with exploration and mining operations; accessibility and reliability of existing local infrastructure and availability of adequate infrastructures in the future; environmental regulation;
Cautionary NotesCONTINUEDland reclamation requirements; ownership of, or control over, the properties on which the Company operates; maintaining existingproperty rights or obtaining new rights; inherent uncertainties in the process of estimating mineral reserves and resources; reported reserves and resources may not accurately reflect the economic viability of the Company’s properties; uncertainties in estimating future mine production and related costs; risks associated with expansion and development of mining properties; currency exchange rate fluctuations; directors’ and officers’ conflicts of interest; inability to access additional capital; problems integrating new acquisitions and other problems with strategic transactions; legal proceedings; uncertainties related to the repatriation of funds from foreign subsidiaries; no dividend payments; volatile share price; negative research reports or analyst’s downgrades and dilution; and other factors contained in the section entitled “Risk Factors” in the Company’s annual information form dated March 19, 2019, and filed on the Company’s SEDAR profile. Readers are also encouraged to read, in their entirety, the NI 43-101 Technical Report Life of Mine Plan and Mineral Reserves for the Florida Canyon Gold Mine Pershing County, Nevada, USA, effective date November 2, 2018, report date February 8, 2019 regarding the Florida Canyon Mine and the NI 43-101 F1 Technical Report Updated Resources and Reserves and Mine Plan for the San Francisco Gold Project Sonora, Mexico, effective date April 1, 2017, report date May 25, 2017 regarding the San Francisco mine, both of which are filed on the Company’s SEDAR profile. Although the Company has attempted to identify important factors that could cause actual results or events to differ materially from those described in the forward-looking statements, you are cautioned that this list is not exhaustive and there may be other factors that the Company has not identified. Furthermore, the Company undertakes no obligation to update or revise any forward-looking statements included in, or incorporated by reference in, this news release if these beliefs, estimates and opinions or other circumstances should change, except as otherwise required by applicable law.
NATIONAL INSTRUMENT 43-101 COMPLIANCEThe relevant scientific and technical data prepared by Alio Gold and contained in this presentation has been reviewed and approved by Thomas Bagan, PE, MBA, SME RM, Principal of Thomas H Bagan LLC, a Qualified Person under NI 43-101 who is independent of the Company.
ALTERNATIVE AND NON-GAAP PERFORMANCE MEASURESCash cost per gold ounce and cash cost per gold ounce on a by-product basis are non-GAAP performance measures that management uses to assess the Company’s performance and its expected future performance. The Company has included the non-GAAP performance measures of cash cost per gold ounce and cash cost per gold ounce on a by-product basis throughout this document. In the gold mining industry, these are common performance measures but they do not have any standardized meaning. As such, they are unlikely to be comparable to similar measures presented by other issuers. Management believes that, in addition to conventional measures prepared in accordance with GAAP, certain investors use this information to evaluate the Company’s performance and ability to generate cash flow. Accordingly, presentation of these measures is to provide additionalinformation and should not be considered in isolation or as a substitute for measures of performance prepared in accordance withGAAP. The cash cost per gold ounce is calculated by dividing the operating production costs by the total number of gold ounces sold. The cash cost per gold ounce on a by-product basis is calculated by deducting the by-product silver credits per gold ouncesold from the cash cost per gold ounce. Cash cost per gold ounce is calculated for the San Francisco Mine and the Florida CanyonMine in the same manner as on a consolidated basis. For further details, refer to the Company’s Management Discussion and Analysis for the three month and full year ended December 31, 2019 and 2018.
CURRENCYAll amounts are in US$ unless otherwise specified.
FOOTNOTES AND ENDNOTESRefer to the ENDNOTES slide at the end of this presentation for all footnotes. These endnotes form a critical part of this presentation.

TSX, NYSE AMERICAN: ALO 3
Company Overview
$35 Million Market Capitalization
$17 Million Cash
$15 Million Debt
~65,000 gold ounce production in 2020

TSX, NYSE AMERICAN: ALO
A Clear Strategy for Value CreationProduce Gold Safely and Profitably | Cannot Be All Things to All People
• Florida Canyon is our Cornerstone
• History of undercapitalization
and underperformance
• New mine & haul fleet in place
• Heap Leach Pad Phase II
complete in Q2-2020
• Forecasting 50%↑ production YOY1
• Examining brownfield upsides
• Oxide mine-life extensions
• High-grade sulfides
Establish a Solid Base
• Reduced Corporate Overheads
• 50%↓ corporate headcount
• 33%↓ Board size
• Announced sale of idled San
Francisco mine
• Elimination of significant
potential liabilities
• Ceased Ana Paula works
• Alio Gold not in the business
of greenfield project builds
Spend & Invest Like it is Our Money
• Simple, straightforward portfolio
• US$ cost structure
• Low geopolitical risk
• Delivering on guidance
• Improving balance sheet
• Investments in 2020 to lead to
free cash flow growth in 2021
• New Management team buying
shares in the market in December,
on blackout since
Positioned for Future Gold Strength
4

TSX, NYSE AMERICAN: ALO
$9.79/t
$6.79/t
Q3-2019 Q4-2019
Florida Canyon Operating Costs2
What We Are DoingTurnaround Underway – Q4 Results Demonstrate Meaningful Improvements
31ktpd
41ktpd
Q3-2019 Q4-2019
Florida Canyon Mining Rate1
44koz
65koz
2019A 2020 Guidance
Florida Canyon Gold Production
15ktpd
22ktpd
Q3-2019 Q4-2019
Florida Canyon Processing Rate
$12
$7
2018 Actual 2019 Actual
Corporate & Administration Expenses
$16
Nil
2018 Actual 2020 Budget
Discretionary Growth Capital Spend
+31% +48% +49%
(31%)(44%)
5

TSX, NYSE AMERICAN: ALO
2020 Florida Canyon Guidance
Q1 2020 Q2 2020 Q3 2020 Q4 2020 Full Year 2020
Gold Production 10,000 – 12,000 12,000 – 15,000 15,500 – 18,000 22,500 – 25,000 60,000 – 70,000
Cash Operating Costs $1,130/oz - $1,230/oz $1,025/oz - $1,125/oz $915/oz - $1,015/oz $815/oz - $915/oz $975/oz - $1,075/oz
Capital Spending $8.0M $10.0M $4.0M $3.0M $25.0M
Corporate KPIs Designed Around Exceeding Targets
Key Florida Canyon investments: new mining & haulage fleet (~$10M) and completion of second heap leach pad (~$7M to invest in 2020, as
part of overall $15M capital plan)
Quarterly production guidance provided to demonstrate significant expected quarter on quarter increases throughout 2020
6
TSX, NYSE AMERICAN: ALO
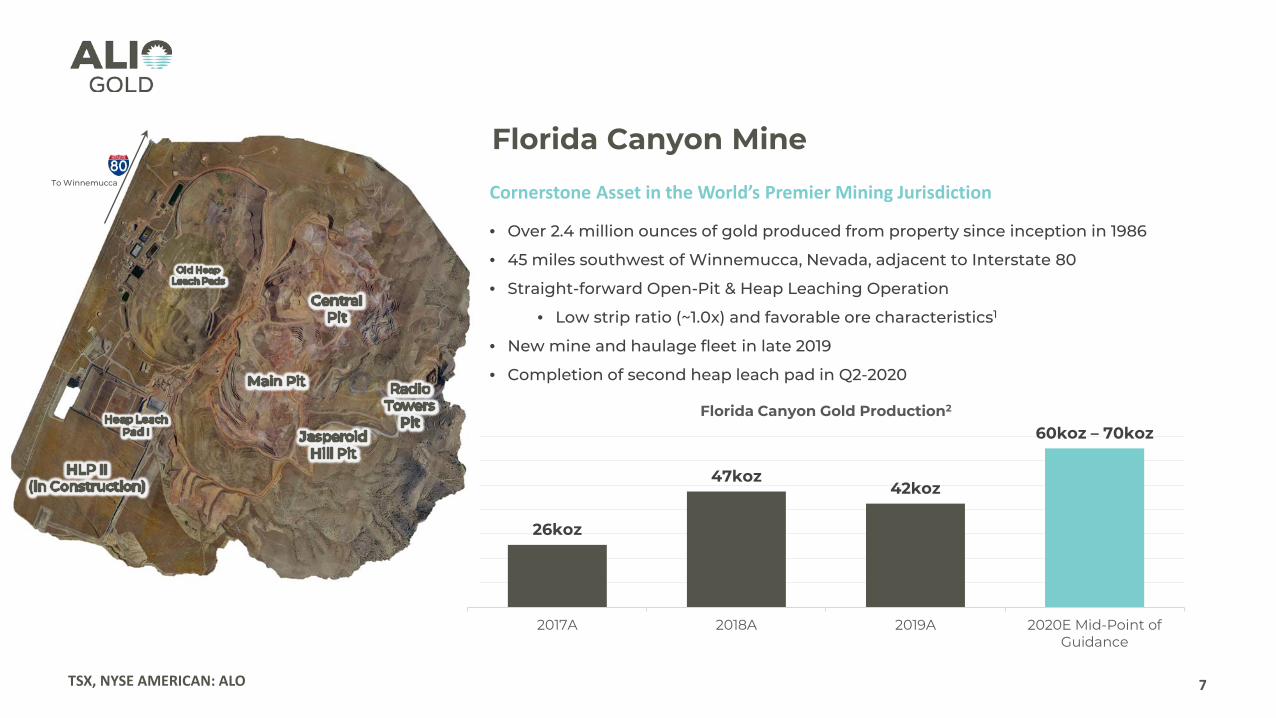
Florida Canyon Mine
• Over 2.4 million ounces of gold produced from property since inception in 1986
• 45 miles southwest of Winnemucca, Nevada, adjacent to Interstate 80
• Straight-forward Open-Pit & Heap Leaching Operation
• Low strip ratio (~1.0x) and favorable ore characteristics1
• New mine and haulage fleet in late 2019
• Completion of second heap leach pad in Q2-2020
Cornerstone Asset in the World’s Premier Mining Jurisdiction
26koz
47koz42koz
60koz – 70koz
2017A 2018A 2019A 2020E Mid-Point ofGuidance
Florida Canyon Gold Production2
To Winnemucca
7

TSX, NYSE AMERICAN: ALO
Opportunity to investigate conversion of
known pit-rim oxide mineralization to
minable material by increasing drill
density
Underlying the existing oxide orebodies,
historical drilling has intersected high-
grade sulfide mineralization
No systematic, modern exploration
programme has yet been undertaken to
understand the size or scope of the
opportunity
Florida CanyonOxide & Sulfide Upside Potential
Central Pit
Greater than 3.0g/t Au
1.0g/t – 3.0g/t Au
0.34g/t – 1.0g/t Au
Nested Grade Shells1
POTENTIAL
8

TSX, NYSE AMERICAN: ALO
• Investigating alternatives to surface
value for ALO stakeholders
• High quality assets that do not fit
with near-term corporate objectives
• Key Considerations:
• No additional spending or
investment from Alio Gold
• Reputable counterparties
with a legitimate plan with
respect to financing,
operations, and stakeholder
affairs
Strategy for Ana Paula & San Francisco
• 100% owned, high-grade gold
deposit
• Guerrero Gold Belt on trend with
Torex’s ELG & Equinox Gold’s Los
Filos
• May 2017 PFS: 2P Reserves1 of 13.4Mt
@ 2.36g/t = 1.0Moz gold
• Higher grade underground
resources below pit design
• Approximately $47M invested since
2016 by ALO
Ana Paula Project, Mexico
• Announced sale of mine to Magna
Gold on March 6
• Closing expected shortly
• Eliminates between $12M and $32M
of potential liabilities
• Received 19.9% of Magna Gold and
$5M cash payment (or 1% NSR)
within 1 year
• Streamlines portfolio in line with
vision
San Francisco Mine, Mexico
Non-Core AssetsExploring Alternatives to Maximize Value
9

TSX, NYSE AMERICAN: ALO
Turning Things Around
• Cornerstone Asset delivering safe and profitable gold production
• Options to realize value from non-core assets
• Strategy to deliver sustainable value for our communities, employees and
shareholders
A Team Focused on Excellence
10

TSX, NYSE AMERICAN: ALO
Additional Information
11

TSX, NYSE AMERICAN: ALO
Share Information
12
US$0.00
US$0.20
US$0.40
US$0.60
US$0.80
US$1.00
US$1.20
C$0.00
C$0.20
C$0.40
C$0.60
C$0.80
C$1.00
C$1.20
C$1.40
C$1.60
Jan-19 Mar-19 Jun-19 Sep-19 Dec-19 Mar-20
TSX (LHS, C$/share) NYSE-A (RHS, US$/share)
Donald Smith & Co. 7.3%
Ruffer LLP 6.4%
Lundin Group 3.9%
Aegis Financial Corp. 3.3%
Newmont Mining 2.9%
Renaissance Technologies 2.0%
Konwave AG 1.8%
Sun Valley 1.5%
Top Shareholders
Basic Shares Outstanding 86M
Fully-Diluted Shares 90M
Average Daily Trading (Past 3 months)
TSX (shares/day) 70,000
NYSE-A 150,000
Share Structure

TSX, NYSE AMERICAN: ALO
Mark Backens President & CEO, Director
Paula Rogers Independent Board Chair
George Brack Independent Director
Stephen Lang Independent Director
John Mansanti Independent Director
David Whittle Independent Director
Board & Management
Shana Blakely General Manager – Florida Canyon
Miguel Bonilla Country Manager – Mexico
Andre Amorim General Manager – San Francisco
Paul Jones Senior VP – Corporate Development
Ian Harcus Vice President – Finance
Board of Directors Key Management
13

TSX, NYSE AMERICAN: ALO
Mineral Reserves and Resources
14
Florida Canyon Mine
Proven Probable Proven & Probable
Metric Tonnes(000’s)
Gold Grade (gpt)
Contained Gold Ounces (000’s)
Metric Tonnes(000’s)
Gold Grade (gpt)
Contained Gold Ounces (000’s)
Metric Tonnes(000’s)
Gold Grade (gpt)
Contained Gold Ounces (000’s)
Central Pit 28,293 0.36 331 2,605 0.32 27 30,899 0.36 358
Central North 5,725 0.37 68 2,018 0.37 24 7,744 0.37 92
Main Pit 20,496 0.33 217 4,932 0.31 49 25,428 0.33 267
Jasperoid Hill 2,000 0.39 25 830 0.30 8 2,831 0.36 34
Radio Towers 16,731 0.44 235 2,219 0.39 28 18,950 0.43 263
Total 73,246 0.38 876 12,605 0.34 136 85,852 0.37 1,013

TSX, NYSE AMERICAN: ALO
Mineral Reserves and Resources
15
Florida Canyon Mine
Measured Indicated Measured & Indicated Inferred
Metric Tonnes(000’s)
Gold Grade (gpt)
Contained Gold Ounces
(000’s)
Metric Tonnes(000’s)
Gold Grade (gpt)
Contained Gold Ounces
(000’s)
Metric Tonnes(000’s)
Gold Grade (gpt)
Contained Gold Ounces
(000’s)
Metric Tonnes(000’s)
Gold Grade (gpt)
Contained Gold Ounces
(000’s)
Central Pit 46,488 0.40 597 9,758 0.37 115 56,206 0.39 712 508 0.39 6
Main Pit 27,983 0.37 331 9,100 0.34 100 37,083 0.36 431 473 0.64 10
Jasperoid Hill 5,393 0.39 68 2,046 0.32 21 7,439 0.37 89 155 0.33 2
Radio Towers 25,243 0.46 375 6,904 0.47 103 32,147 0.46 478 271 0.54 5
Total 105,068 0.41 1,371 27,807 0.38 339 132,875 0.40 1,711 1,407 0.43 22

TSX, NYSE AMERICAN: ALO
Mineral Reserves and Resources
16
Florida Canyon Reserve Reporting Notes1. Mineral Reserves have an effective date of 1 November 2018. The Qualified Person for the estimate is Mr. Justin Smith, P.E., SME-RM. 2. All Mineral Resources are reported inclusive of Mineral Reserves.3. The Mineral Reserves and Resources in this report were estimated using the Canadian Institute of Mining, Metallurgy and Petroleum (CIM), CIM Standards on Mineral Resources and Reserves, Definitions and Guidelines prepared by the CIM
Standing Committee on Reserve Definitions and adopted by CIM Council.4. The reserve was developed using US units, and quantities and grades in the above table reflect conversion to metric units for reporting where applicable. Cut-offs and costs in the notes below are expressed in ounces per short ton (oz/ston)
US$/short ton ($/ston);5. Reserves are reported within a designed pit using a cutoff of 0.006 oz/ston for the radio towers mining area and 0.005 oz/ston for all other areas. 6. The mineral reserves are based on a pit design which in turn aligns with an ultimate pit shell selected from a Lerchs-Grossmann pit optimization exercise. Key inputs for the reserve cutoff calculation are:
• A metal price of $1,250/oz Au; • Ore mining costs by area ranging from $1.42/ston to $2.67/ston; • Waste mining costs by area ranging from $1.24/ston to $1.83/ston; • Crushing and processing costs of $2.85/ston ore; • General and administration costs of $1.02/ston milled; • Pit slope angles varying from 32.5 to 45 degrees; and • Process recoveries of 70%.
7. Mining dilution is assumed to be 5% at zero grade;8. Ore loss is assumed to be 5%;9. The ultimate pit includes 87.6 million tonnes of waste for a stripping ratio of 1.03 tonnes of waste per ton of ore; and10. All figures are rounded to reflect the relative accuracy of the estimate. Totals may not sum due to rounding.
Florida Canyon Resource Reporting Notes1. Mineral Resources are not Mineral Reserves and do not have demonstrated economic viability. There is no certainty that any part of the Mineral Resources estimated will be converted into a Mineral Reserves estimate;2. Au recovery is based on a non-linear relationship to Au Fire Assay grade and is evaluated on a block by block basis in the resource model. To account for this variability, an NSR value was calculated for each block and cutoffs were then applied
to the NSR;3. The resource model was constructed in US units, and quantities and grades in the above table reflect conversion to metric units for reporting where applicable. NSR cut-offs and costs in the notes below are expressed in US$/short ton (ston);4. Resources are reported using a NSR cutoff grade of US$3.99/ston for the Central area, US$4.09/ston for the Central N. and Jasperoid Hill areas, US$3.94/ston for the Main and Radio Towers areas, US$4.04/ston for the Radio Towers N. area, and
US$3.99/ston for the Radio Towers2 area. The variable NSR cutoffs reflect differences in haulage cost;5. Resources in the table above are grouped by major mining area. Central and Central N. were combined, as were all Radio Towers mining areas.;6. Resources stated as contained within a potentially economically minable open pit; pit optimization parameters are: US$1,350/toz Au, an average Au Recovery of 61% for Radio Towers area and 67% for the Central/Main area , US$2.80/toz Au Sales
Cost, US$1.26/ston base waste mining cost, variable haulage costs by mining area, US$3.99/ston base mineralized material processing cost, 45° pit slopes for in-situ rock, and a 37° pit slope for fill/dumps; and7. Numbers in the table have been rounded to reflect the accuracy of the estimate and may not sum due to rounding.
The resource estimate and related geologic modeling for the Florida Canyon Mine were conducted by, or under the supervision of Tim Carew, M.Sc. P.Geo. of SRK Consulting (U.S.), Inc., Reno, Nevada. The mine planning and related reserve estimate were conducted by, or under the supervision of Justin Smith, P.E., SME-RM. of SRK Consulting (U.S.), Inc., Reno, Nevada.

TSX, NYSE AMERICAN: ALO
Mineral Reserves and Resources
17
San Francisco Mine
Proven Probable Proven & Probable
Metric Tonnes(000’s)
Gold Grade (gpt)
Contained Gold Ounces (000’s)
Metric Tonnes(000’s)
Gold Grade (gpt)
Contained Gold Ounces (000’s)
Metric Tonnes(000’s)
Gold Grade (gpt)
Contained Gold Ounces (000’s)
San Francisco Pit 17,757 0.518 274 23,360 0.540 405 41,117 0.514 679
La Chicharra Pit 5,329 0.522 89 1,835 0.437 26 7,164 0.501 115
Total Pits 23,086 0.489 363 25,195 0.532 431 48,281 0.512 794
Low Grade Stockpile 7,199 0.26 60 - - - 7,199 0.26 60

TSX, NYSE AMERICAN: ALO
Mineral Reserves and Resources
18
San Francisco Mine
Measured Indicated Measured & Indicated Inferred
Metric Tonnes (000’s)
Gold Grade (gpt)
Contained Gold Ounces
(000’s)
Metric Tonnes (000’s)
Gold Grade (gpt)
Contained Gold Ounces
(000’s)
Metric Tonnes (000’s)
Gold Grade (gpt)
Contained Gold Ounces
(000’s)
Metric Tonnes (000’s)
Gold Grade (gpt)
Contained Gold Ounces
(000’s)
San Francisco Pit 33,041 0.547 581 38,486 0.557 689 71,527 0.552 1,269 1,726 0.528 29
La Chicharra Pit 6,675 0.550 118 6,020 0.500 97 12,694 0.526 215 222 0.462 3
Total Resources 39,716 0.547 699 44,505 0.549 786 84,221 0.548 1,484 1,948 0.520 33

TSX, NYSE AMERICAN: ALO
Mineral Reserves and Resources
19
San Francisco Mine Reserve and Resource Reporting Notes1. All Mineral Reserves and Mineral Resources have been calculated in accordance with the standards of the Canadian Institute of Mining, Metallurgy and Petroleum and National Instrument 43-101, or the AusIMM JORC equivalent.2. All Mineral Resources are reported inclusive of Mineral Reserves.3. Mineral Resources which are not Mineral Reserves do not have demonstrated economic viability.4. Mineral Reserves are estimated using appropriate recovery rates and US$ commodity prices of $1,250 per ounce of gold5. Mineral Resources are estimated using US$ commodity prices of $1,350 per ounce of gold6. San Francisco reserve and resource figures are effective July 1, 2018 as disclosed in Alio Gold’s Annual Information form dated March 19, 2019 for the year ending December 31, 2018.
Information regarding data verification, surveys and investigations, exploration information, quality assurance programs and quality control measures, and a summary of sample analytical or testing procedures for the San Francisco Mine are contained in the Company’s annual information form for the year ended December 31, 2018, dated March 19, 2019, and filed on SEDAR at www.sedar.com and EDGAR at www.sec.gov (the “AIF”). Also included in the AIF is a description of the key assumptions, parameters and methods not included in these tables that are used to estimate mineral reserves and resources and a general discussion of the extent to which the estimates may be affect by any known environmental, permitting, legal, title, taxation, socio-political, marketing or other relevant factors.

TSX, NYSE AMERICAN: ALO
Mineral Reserves and Resources
20
Ana Paula Project
Proven Probable Proven & Probable
Metric Tonnes(000’s)
Gold Grade (gpt)
Contained Gold Ounces (000’s)
Metric Tonnes(000’s)
Gold Grade (gpt)
Contained Gold Ounces (000’s)
Metric Tonnes(000’s)
Gold Grade (gpt)
Contained Gold Ounces (000’s)
Total 6,533 2.62 550 6,907 2.12 471 13,440 2.36 1,021
Measured Indicated Measured & Indicated Inferred
Metric Tonnes(000’s)
Gold Grade (gpt)
Contained Gold Ounces
(000’s)
Metric Tonnes(000’s)
Gold Grade (gpt)
Contained Gold Ounces
(000’s)
Metric Tonnes(000’s)
Gold Grade (gpt)
Contained Gold Ounces
(000’s)
Metric Tonnes(000’s)
Gold Grade (gpt)
Contained Gold Ounces
(000’s)
Total 7,582 2.43 593 13,416 2.01 869 20,995 2.17 1,462 870 1.84 51

TSX, NYSE AMERICAN: ALO
Mineral Reserves and Resources
21
Ana Paula Project Reserve & Resource Reporting Notes1. For more information on the Ana Paula For more information on the Ana Paula mineral reserves and mineral resources, see the Ana Paula technical report entitled “NI 43-101 Preliminary Feasibility Study, Guerrero, Mexico”, dated May 16, 2017,
which is available on Alio Gold’s SEDAR profile at www.sedar.com. 2. Mineral resources that are not mineral reserves do not have demonstrated economic viability.3. Mineral resources are shown inclusive of mineral reserves

TSX, NYSE AMERICAN: ALO
A Clear Strategy for Value Creation1. For further information on Alio Gold’s 2020 guidance, see the News Release dated December 3, 2019. The 50% increase referenced is
for the years 2019 vs. 2020, and represents forecasted production levels at Florida Canyon only.
What We Are Doing1. For further information on Alio Gold’s 2020 guidance, see the News Release dated December 3, 20192. Refer to the Company’s Management Discussion and Analysis for the Three Months and Year Ended December 31, 2019 for further
details.
2020 Guidance1. For further information on Alio Gold’s 2020 guidance, see the News Release dated December 3, 20192. Cash cost per gold ounce and cash cost per gold ounce on a by-product basis are non-GAAP performance measures that
management uses to assess the Company’s performance and its expected future performance. The Company has included the non-GAAP performance measures of cash cost per gold ounce and cash cost per gold ounce on a by-product basis throughout this document. In the gold mining industry, these are common performance measures but they do not have any standardized meaning. As such, they are unlikely to be comparable to similar measures presented by other issuers. Management believes that, in addition to conventional measures prepared in accordance with GAAP, certain investors use this information to evaluate the Company’s performance and ability to generate cash flow. Accordingly, presentation of these measures is to provide additional information and should not be considered in isolation or as a substitute for measures of performance prepared in accordance with GAAP. The cash cost per gold ounce is calculated by dividing the operating production costs by the total number of gold ounces sold. The cash cost per gold ounce on a by-product basis is calculated by deducting the by-product silver credits per gold ounce sold from the cash cost per gold ounce. Cash cost per gold ounce is calculated for the San Francisco Mine and the Florida Canyon Mine in the same manneras on a consolidated basis. For further details, refer to the Company’s Management Discussion and Analysis for Three Months and Year Ended December 31, 2019
Florida Canyon Mine1. For further information refer to the NI 43-101 Technical Report Life of Mine Plan and Mineral Reserves for the Florida Canyon Gold Mine
Pershing County, Nevada, USA, effective date November 2, 20182. Refer to the Company’s Management Discussion and Analysis for the Three Months and Years Ended December 31, 2019, 2018 and
2017 for further details.
Florida Canyon1. The schematic diagram is not intended to infer or in any way imply the declaration of a mineral resource. This graphic is conceptual
in nature and there has been insufficient exploration to define a mineral resource and it is uncertain if further exploration will result in the target being delineated as a mineral resource. The nested grade shells displayed have been estimated using historical drilling intercepts.
Non-Core Assets1. For more information on the Ana Paula mineral reserves and mineral resources, see the Ana Paula technical report entitled “NI 43-101
Preliminary Feasibility Study, Guerrero, Mexico”, dated May 16, 2017, which is available on Alio Gold’s SEDAR profile at www.sedar.com2. For further information on Alio Gold’s 2020 guidance, see the News Release dated December 3, 20193. For further information refer to the NI 43-101 F1 Technical Report Updated Resources and Reserves and Mine Plan for the San
Francisco Gold Project Sonora, Mexico, effective date April 1, 2017, report date May 25, 2017 regarding the San Francisco mine, both of which are filed on the Company’s SEDAR profile. San Francisco reserve and resource figures are effective July 1, 2018 as disclosed in Alio Gold’s Annual Information form dated March 19, 2019 for the year ending December 31, 2018.
ENDNOTES
22