Embed Size (px)
Citation preview

lable at ScienceDirect
Energy 36 (2011) 3170e3178
Contents lists avai
Energy
journal homepage: www.elsevier .com/locate/energy
Production behavior of methane hydrate in porous media using huff and puffmethod in a novel three-dimensional simulator
Gang Li, Xiao-Sen Li*, Yi Wang, Yu ZhangKey Laboratory of Renewable Energy and Gas Hydrate, Guangzhou Institute of Energy Conversion, Chinese Academy of Sciences, No. 2 Nengyuan Road, Wushan,Guangzhou 510640, China
a r t i c l e i n f o
Article history:Received 8 December 2010Received in revised form1 March 2011Accepted 2 March 2011Available online 29 March 2011
Keywords:Hydrate dissociationPorous mediaThree-dimensionHuff and puffVertical well
* Corresponding author. Tel./fax: þ86 20 87057037E-mail address: [email protected] (X.-S. Li).
0360-5442/$ e see front matter � 2011 Elsevier Ltd.doi:10.1016/j.energy.2011.03.006
a b s t r a c t
The gas production behavior of methane hydrate in porous media using the huff and puff method wasinvestigated in the Cubic Hydrate Simulator (CHS), a novel developed three-dimensional 5.8-L cubicpressure vessel. Three horizontal layers equally divide the CHS into four regions. A 9-spot distribution ofthe vertical wells, a single horizontal well and a 25-spot distribution of the thermometers are arrangedon each layer, respectively. The vertical wells at the axis of the CHS were used as the injection andproduction wells. The huff and puff method includes the injection, soaking and production stages. Theamount of water injected and produced, the gas production rate, the percentage of the hydrate disso-ciation and the gas-to-water ratio were evaluated. Under the thermodynamic conditions in this work, thegas production from the sediment in this work using the huff and puff method is economically profitablefrom the relative criterion point of view. The sensitivity analysis demonstrates the dependence of the gasproduction on the initial hydrate saturation, and the temperature and the injection rate of the injectedhot water.
� 2011 Elsevier Ltd. All rights reserved.
1. Introduction
Natural gas hydrates (NGH) are crystalline solids composed ofwater and gas. The gas molecules (guests) are trapped in watercavities (host) that are composed of hydrogen-bonded water mole-cules. Typical natural gas molecules include methane, ethane,propane, and carbon dioxide etc. Natural gas hydrate deposits involvemainly CH4, and occur in the permafrost and in deep ocean sedi-ments, where the necessary conditions of low temperatures and highpressures exist forhydrate stability [1]. Estimatesof theworldhydratereserves are very high, and vary from 0.2 � 1015e120 � 1015 m3 ofmethane at STP (Standard Temperature and Pressure). However, evenwith the most conservative estimates, it is clear that the energy inthese hydrate deposits is likely to be significant compared to all otherfossil fuel deposits [1], and was considered to be a potential strategicenergy resource [2e5].
There are three main methods for gas production from thehydrate deposit: 1) Depressurization [6e11], to decrease the depositpressure below the hydrate dissociation pressure at a specifiedtemperature; 2) Thermal stimulation [6,12e14], to heat the depositabove the hydrate dissociation temperature with the hot water, hot
.
All rights reserved.
brine or steam injection; 3) Thermodynamic inhibitor injection[15e17], to inject the chemicals, such as the salts and the alcohols toshift the hydrate pressureetemperature equilibrium conditions;4) A combination of these methods [18e20]. Of the above singlemethods for hydrate dissociation for gas production, the depres-surization appears to be the most efficient one [5,21,22], and thethermal stimulation could be the auxiliarymethod [5,10]. TheMallik2002 well demonstrated the proof of the concept that it is possibleto recover energy from permafrost hydrates combining the disso-ciation techniques of the depressurization and the thermal stimu-lation [1]. Experimental investigations of the hydrate dissociationbehaviors under the depressurization or thermal stimulation in thesediments using one-dimensional [6,12,14] and two-dimensionalapparatuses [23] have been reported. Actually, the hydrate depositin the nature is a three-dimensional (3-D) reservoir. In order toinvestigate into the gas production characteristics in a 3-D reservoir,it is quite significant to simulate the hydrate dissociation behaviorsin the 3-D experimental apparatus. However, so far, there are fewreports on this aspect.
The huff and puff method, also known as the cyclic steamstimulation (CSS), was accidentally discovered by ShellOil Companyin 1960 during a Venezuela recovery project, and is widely used inthe oil industry to enhance oil recovery [24e26]. The hot water, hotbrine or steam huff and puff method is a special form of thecombination of depressurization and thermal stimulation methods

G. Li et al. / Energy 36 (2011) 3170e3178 3171
for gas production from hydrate deposit. A numerical simulation ofgas production from marine gas hydrate deposit using the huff andpuff method has been used to investigate into the gas productionstrategy in the Shenhu Area of the South China Sea [20].
In this work, the Cubic Hydrate Simulator (CHS), a novel three-dimensional 5.8-L cubic pressure vessel has been developed for theproduction of the gas hydrate. The gas production behavior ofmethane hydrate in the porous media using the huff and puffmethodwas investigated in the CHS. Vertical wells at the axis of theCHS are used as the injection and the production wells.
2. Experiment
2.1. Experimental apparatus
The schematic of the experimental apparatus used in this workis shown in Fig. 1. The CHS is made of stainless steel, and canwithstand pressures of up to 30 MPa. The low temperaturesrequired for the experiments are achieved by placing the CHS vesselin a water bath. Fig. 2 shows the schematic of the layers and thewell design of the CHS. The CHS is a cubic pressure vessel with theinternal length of side of 0.18 m and the inner volume of 5.8-L. Asshown in Figs. 1 and 2, there are 3 horizontal layers named LayersAeA, BeB and CeC inside the vessel, which equally divide the cubicvessel into 4 regions. In other words, the distance between theLayer AeA and Layer BeB is 0.045 m, a quarter of the internallength of side of the CHS, which is the same with that between theLayer BeB and Layer CeC, while the Layer BeB is in the middle ofthe CHS. As shown in Fig. 2, a 9-spot distribution of the verticalwells is fixed in the top flange (the Top Square) of the CHS, andthere are 3 vertical wells at each spot (V1, V2, . V9), which extendinto the vessel to the Layers AeA, BeB and CeC, respectively. Asa typical example, it is shown in Fig. 2 that the Wells V5A, V5B andV5C are all placed on the spot V5, and the bottoms of thesewells areon the Layers AeA, BeB and CeC, respectively. In general, a total of27 vertical wells are distributed in the CHS, and each of them(except the 3 vertical wells, Wells V5A, V5B and V5C at the axis) is
Fig. 1. Schematic of the ex
immediately close to the inside edge of the CHS, and the bottom ofeach well is right on the corresponding layer. As shown in Fig. 2, inthe Right Square of the CHS, 3 horizontal wells, the Wells HA, HBand HC, are inserted into the spots H1, H2 and H3 on the LayersAeA, BeB and CeC, respectively. Each horizontal well is extendedto the inside surface of the Left Square of the CHS. Fig. 3 shows theschematic of the distribution of the thermometers (the tempera-ture measuring spots) in the CHS. There are 25 thermometersevenly distributed on each layer, with a total of 75 spots in the CHS.In other words, on each layer (Layers AeA, BeB and CeC), it is a 25-spot distribution of the thermometers (T1eT25), with T13 at thecenter and T1, T5, T21 and T25 at the corner. The thermometersexcept those at T7eT9, T12eT14 and T17eT19 are immediatelyclose to the inside edge of the CHS. The thermometers at the samespots are distinguished by the different layers, for example, asshown in Fig. 3, the 21st thermometer on Layer AeA is called T21A,and those on the Layer BeB and Layer CeC are T21B and T21C,respectively. A pressure transducer at the center of the bottom ofthe CHS (the “Inlet Pressure”) is used tomeasure the pressure of thebase of the Hydrate-Bearing Layer (HBL). And another pressuretransducer (the “Outlet Pressure”) is placed at the production well.A sampling valve is placed on each layer. A safety valve anda vacuum pump are connected to the CHS.
The thermometers are Pt100 with the range of �20e200 �C,�0.1� C. The pressure transducers are TRAGAG NAT 8251.84.2517,0e40 MPa, �0.1%. Two gas flowmeters, which are used to measurethe cumulative gas injected into the CHS, the gas production rateand the cumulative gas produced from the vessel, are both of D07-11CM, 0e10 L/min, �2% from “seven star company”. The ther-mometers, pressure transducers, gas flow meters, were calibratedusing a mercury thermometer with the tolerance of �0.01� C,a pressure test gauge with the error of �0.05%, and a wet gas meterwith the accuracy of �10 ml/min, respectively.
A metering pump “Beijing Chuangxintongheng” HPLC P3000Awith the range of 50 ml/min can withstand pressures of up to30 MPa. An inlet liquid container with the inner volume of 10 L isused to contain the deionized water used in the experiments. In
perimental apparatus.

Fig. 2. Schematic of the layers and the well design of the CHS.
G. Li et al. / Energy 36 (2011) 3170e31783172
order to protect the metering pump from corrosion by the hot brineor the chemicals, 3 middle containers are used for the solutioninjection, and the inner volume of each container is 4 L. A back-pressure regulator (the pressure range of 0e30 MPa, �0.02 MPa)connected to the outlet of the CHS is used to control the pressure ofthe production well. A gas cylinder is used to provide the drivingforce of the back-pressure regulator. A balance, used tomeasure themass of liquid produced from the CHS, is Sartorius BS 2202S,0e2200 g, �0.01 g. The data acquisition system records thetemperature, the pressure, the amount of the cumulative gas
Fig. 3. Schematic of the distribution of the thermometers in the CHS.
produced from the vessel, the gas production rate and the liquidproduction rate. The liquid injection rate can be controlled by themetering pump, which is connected to the data acquisition system.In this work, the methane gas with its purity of 99.99% is used.
2.2. Well design
Fig. 2 shows the design of the vertical and horizontal wells in theCHS. Vertical wells at the axis of the CHS are used during gasproduction using the huff and puff method in this work. As shownin Fig. 2, there are 4 grooves evenly distributed along the circum-ference of each vertical well, thus as Well V5A, Well V5B and WellV5C. The grooves on Well V5A extend from the internal surface ofthe Top Square of the CHS to the Layer AeA, while those on WellV5B are from the Layer AeA to the Layer BeB, and the top and thebottom of the grooves onWell V5C are the Layer BeB and the LayerCeC, respectively. As shown in Fig. 2, the grooves on each hori-zontal well are from the internal surface of the Right Square to thatof the Left Square of the CHS. The hot water or steam injected intothe CHS and the gas and water produced from the CHS are allthrough the grooves shown in Fig. 2. Previous numerical study hasshown a similar well design [20], in which there are 8 groovesevenly distributed along the circumference of the single horizontalwell. Comparing with using the single well with hot brine injectionand gas production simultaneously [10] and the well with hotwater circulating inside the wellbore [18,19], this well design ismuch simpler and practically feasible.
2.3. Huff and puff method
Numerical studies have shown that thermal stimulation by hotwater, hot brine or steam injection enhances gas production whenused in conjunction with depressurization with the vertical well

Fig. 4. Inlet and outlet pressures during hydrate dissociation in the CHS.
G. Li et al. / Energy 36 (2011) 3170e3178 3173
[22,27], but tends to be ineffective when used as the main disso-ciation strategy [22]. In this work, combining the advantages of thedepressurization and thermal stimulation methods, the huff andpuff method is used for gas production from methane hydratedeposit with the vertical wells.
The typical huff and puff method, also known as the cyclic steamstimulation (CSS), consists of 3 stages: injection, soaking andproduction. Firstly, hot water, hot brine or steam is injected intoa well for some time to heat the hydrate deposit around the well.Then, thewell is allowed to sit for a period to allow heat to soak intothe deposit. Finally, the fluid is pumped out of the well for sometime. Once the production rate falls off, the well is put throughanother cycle of injection, soaking and production. This process isrepeated until the cost of injecting water becomes higher than themoney made from producing gas.
The special characteristics of the huff and puff method used inthis work include (i) the injection stage begins immediately at theend of the production stage of the former cycle; (ii) the hot waterinjection rate and the duration of the hot water injection areconstant during the injection stage; (iii) the soaking stage does notend until the injected heat completely soaks into the vessel and thepressure of the well has little increase; (iv) reasonable driving forceof depressurization is used during the production stage. In otherwords, as soon as the pressure at the mouth of thewell decreases toa certain value Pmim, the production stage ceases and the injectionstage of the next cycle begins; (v) thewell of the hot water injectionis Well V5C (Fig. 2), while that of the gas and water production isWell V5A. In other words, the injected hot water and the producedgas and water from the vessel flow in different wells during theinjection and the production stage, respectively. The usage of thesewells is similar to that of the vertical well used in the earlier studies[10,11], in which the hot water injection and the gas and waterproduction occurred using a single vertical well.
2.4. Experimental procedure
The methane hydrate was firstly formed in the pressure vessel.During the experiment, the raw dry quartz sand with a size rangebetween 300 and 450 mmwas tightly packed in the vessel, and thenthe vessel was evacuated twice to remove air in it with a vacuumpump. The quartz sand in the vessel was wetted to saturation withdistilled water at atmospheric pressure using ametering pump. Thesand sediment as the porous media was considered as saturationwhen the amount of water produced from the vessel was equal tothe amount of water injected. Using the fugacity model of Li et al.[28], the equilibrium hydrate dissociation pressure in the sedimentat the working temperature of 8.6 �C was calculated, and thecalculated value is 6.1 MPa. Then the methane gas was injected intothe vessel until the pressure in the vessel reached approximately20 MPa, which was much higher than the equilibrium hydratedissociation pressure at the working temperature. After that, thevessel was closed as an isochoric system. The temperature wasgradually decreased to form the hydrate by changing thewater bathtemperature. The hydrate formation process lasted for 10e15 days,and then the pressure in the vessel decreased to 9.8e14.22 MPa.
The following procedure was used to investigate into thedissociation characteristics of methane hydrate using the huff andpuff method. Firstly, the back-pressure regulator was used torelease the gas from the vessel and the pressure of the productionwell (Well V5A) gradually decreased to 6.40e6.50 MPa, which ishigher than the equilibrium pressure at the working temperature.Secondly, the vessel was closed for approximately 10 min, and thepressure and the temperature in the vessel maintained stableduring this period, which indicated that there was little hydratedissociated. Then, the huff and puff cycles including the injection,
the soaking and the production stages were carried out for hydratedissociation. Finally, after more than 10 cycles of the huff and puffprocess, the system was closed for more than 2 h and then thesystem pressure was released to 1 atm gradually. During thehydrate dissociation, the temperatures and pressure in the vessel,the gas production rate, the water injection and production rateswere recorded at 5 s intervals.
3. Production from CHS in the reference case
3.1. Reference case
Fig. 4 shows the inlet and outlet pressures of the reference caseduringhydrate dissociation in theCHS. The inlet andoutlet pressureschange simultaneously due to the high porosity and permeability ofthe sediment, which are taken as the system pressure of the CHS. Inthe referencecase, after thehydrate formation, thesystempressure isapproximately 9.8 MPa (0e34 min, Fig. 4), the initial hydrate satu-ration (volume) SH ¼ 0.335, and the initial aqueous saturation(volume) SA ¼ 0.323 in the vessel. After the free gas release from thevessel, the system pressure decreases to approximately 6.4 MPa(34e46 min), and the vessel is closed for approximately 10 min(46e56 min). The huff and puff process including a total of 13injection-soaking-production cycles lasts from approximately56e500 min. During each injection stage of the huff and puff cycle,the initial temperature of the hot water from the heater in Fig. 1, theinjection rate and the duration of the hot water injection maintainTinj ¼ 130 �C, Qinj ¼ 0.040 L/min and tinj ¼ 5 min, respectively.
A typical pressure-time curve of a whole huff and puff process isgiven in Fig. 4. The 11th huff and puff cycle from 370 to 409 min isshown in the partial enlarged plot of Fig. 4. As shown in Fig. 4, theinjection stage of the 11th huff and puff cycle lasts from 370 to375 min. During the injection stage, the CHS is pressurized by hotwater injection from the injection well (Well V5C in Fig. 2) and thesystem pressure increases to approximately 7.3 MPa due to (i) themass (water) injection and (ii) the gas production from hydratedissociation under thermal stimulation in the vicinity of the hotwater injection well. Within the first minute of the soaking stage(375e376min), the systempressure continues increasing in the CHS(a closed system during the soaking stage) without mass injection,which confirms the thermal stimulation effect on the hydrate

G. Li et al. / Energy 36 (2011) 3170e31783174
dissociation. From376 to 405min of the soaking stage, the heat fromthe injected hot water soaks into the CHS gradually, andmeanwhilethe system pressure increases quite slowly, which is caused by thelimited hydrate dissociation rate after ceasing the hot water injec-tionprocess. During the production stage (405e409min), the CHS isdepressurized to approximately 6.5 MPa using the back-pressureregulator, and both gas and water are produced from the produc-tion well (Well V5A in Fig. 2). At the end of the production stage(approximately 407e409 min), little gas and water are producedfrom the production well. Then the production well (Well V5A) isclosed at 409 min, and the next huff and puff cycle begins at thesame time.
3.2. Temperature profiles and spatial distributions
Fig. 5 shows the temperature profiles of T1, T3 and T13 (Fig. 3) onall the three layers (Layers AeA, BeB and CeC) during hydratedissociation in the CHS. Because of symmetry in the cubic vessel, T1approximately represents T5, T21 and T25, and T3, T11, T15 and T23have the similar profiles. Both the injectionwell (Well V5C in Fig. 2)and the production well (Well V5A) are vertical and at the axis ofthe CHS, and extend to the Layer CeC and the Layer AeA, respec-tively. As shown in Fig. 3, the thermometers T13A, T13B and T13C atspot T13 are also at the axis of the CHS and on Layers AeA, BeB andCeC, respectively. In general, T13A is at the bottom of the verticalproductionwell (Well V5A), while T13B and T13C are at the top andbottom of the grooves on the vertical injection well (Well V5C),respectively.
As shown in the partial enlarged plot of Fig. 5, during theinjection stage of the 11th huff and puff cycle (370e375 min), thetemperatures of T13A, T13B and T13C in the vicinity of the injectionwell (Well V5C) increase rapidly, while the hot water injection hasa limited effect on the temperatures of T1 and T3, which areimmediately close to the inside edge of the CHS. T13B and T13C areat the top and the bottom of the grooves on the injectionwell (WellV5C), respectively. The temperature of T13C is higher than that ofT13B at the end of the injection stage (375 min), due to the gravityeffect of the injected hot water. Similar with the pressure profilesshown in Fig. 4, the temperatures of T13AeT13C continueincreasing in the first minute after ceasing the hot water injection,i.e. from 375 to 376 min of the soaking stage, which is named theinertia effect of the hot water injection in this work, and it is also anadditional reason for the pressure increase during this period
Fig. 5. Temperature profiles during hydrate dissociation in the CHS.
(Fig. 4). From 376 to 405 min of the soaking stage, with the heatof the injected hot water soaking into the CHS, the temperatures ofT13AeT13C decrease consistently, a decline of the temperatures ofT3B and T3C begins after reaching the maximum value at approx-imately 384 min, and the temperatures of T1AeT1C and T3Acontinue increasing slowly before the end of the soaking stage.These temperatureetime profiles are affected by the distribution ofthe thermometers, the distance away from the injection well andthe boundary conditions of the CHS in this work. During theproduction stage (405e409 min), with the decrease of the pressurein the CHS from 7.4 to approximately 6.5 MPa (Fig. 4), the hydrate inthe CHS dissociates andmeanwhile the gas and water are producedfrom the production well (Well V5A). The temperature of T13A onthe bottom of the production well (Well V5A) decreases afterreaching the maximum, which is a result of the fluid flow of therelative warmer water from the injection well (Well V5C) and thecooling effect caused by the endothermic hydrate dissociation,the latter is also the main reason for the decrease of the tempera-tures of T1AeT1C, T3AeT3C, T13B and T13C (Fig. 5). The next huffand puff cycle begins at 409 min and the temperatures of all thespots in the CHS increase continuously with the hot water injection.
Fig. 6 shows the evolution of the temperature distribution overtime during hydrate dissociation in the CHS. Fig. 6a is the beginningof the 11th huff and puff cycle. The high temperature zones (definedas the zone with T � 20 �C) in Fig. 6b and c occur in the vicinity ofthe injection well (Well V5C in Fig. 2, T13 in Fig. 3), and the highesttemperature in the CHS (approximately 42 �C) is observed aroundT13C (the bottom of the injection well) at the end of the injectionstage (375 min), as shown in Fig. 6c. It can be seen from Fig. 6c to e(375e405 min) that, generally, the temperatures in the CHS declinewith the injected heat soaking into the CHS during the soakingstage, and the highest temperatures in the CHS are lower than 18 �Cafter 390 min. During the production stage (405e409 min,Fig. 6eeg), the cooling effect of the hydrate dissociation during gasand water production is observed in the CHS.
Fig. 6g shows the end of the 11th huff and puff cycle (thebeginning of the 12th cycle, i.e. the start point of the injection stageof that cycle, which is similar to Fig. 6a). Fig. 6h gives the temper-ature distribution of the end of the injection stage of the 12th huffand puff cycle (414 min), which is similar to Fig. 6c.
3.3. Gas and water production rate
Fig. 7 shows the cumulative volumes of gas and water producedfrom thewell during the hydrate dissociation in the CHS. As alreadydiscussed above (Fig. 4), the huff and puff process begins at 56 min.As shown in Fig. 7, the gas and water are only produced from theproduction well during the production stage of each cycle. Forexample, as shown in the partial enlarged plot of Fig. 7, during the11th huff and puff cycle, most of the gas and water are produced inthe first 2 min of the production stage (405e407 min). With theconstant hot water injection rate and time (Qinj ¼ 0.040 L/min andtinj ¼ 5.0 min), 0.20 L of the hot water (Tinj ¼ 130 �C) is injected intothe CHS during each cycle. During the first 5 cycles (1st:56e72min; 2nd: 72e97min; 3rd: 97e120min; 4th: 120e150 min;5th: 150e178 min), the amount of water injected into the CHS ineach cycle (0.20 L) is larger than that produced from thewell, whichare approximately 3 ml, 49 ml, 120 ml, 170 ml and 191 ml,respectively. This indicates that some of the injected water stays inthe vessel. The cumulative gas produced during each cycle gradu-ally decreases over time, which indicates that the hydrate dissoci-ation rate decreases over time during using the huff and puffmethod with constant injection rates Qinj and the same drivingforce of depressurization DP. The reason for this is that with theconstant hot water injection rate, the range of the thermal diffusion
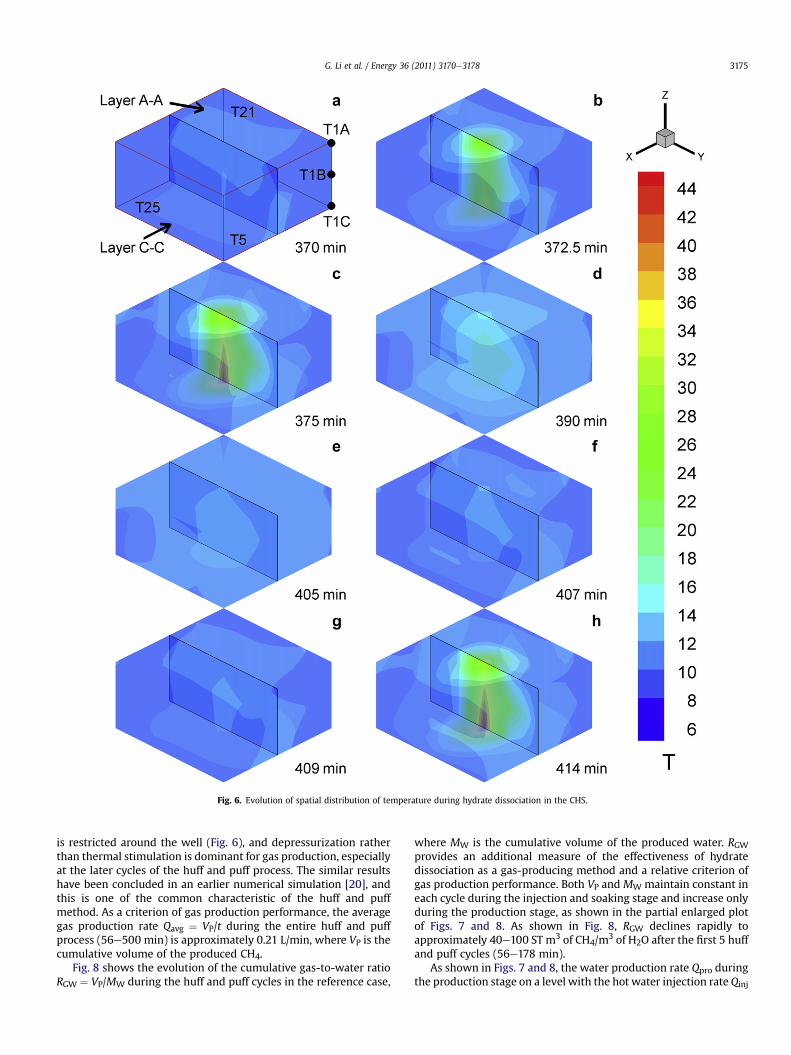
Fig. 6. Evolution of spatial distribution of temperature during hydrate dissociation in the CHS.
G. Li et al. / Energy 36 (2011) 3170e3178 3175
is restricted around the well (Fig. 6), and depressurization ratherthan thermal stimulation is dominant for gas production, especiallyat the later cycles of the huff and puff process. The similar resultshave been concluded in an earlier numerical simulation [20], andthis is one of the common characteristic of the huff and puffmethod. As a criterion of gas production performance, the averagegas production rate Qavg ¼ VP/t during the entire huff and puffprocess (56e500 min) is approximately 0.21 L/min, where VP is thecumulative volume of the produced CH4.
Fig. 8 shows the evolution of the cumulative gas-to-water ratioRGW ¼ VP/MW during the huff and puff cycles in the reference case,
where MW is the cumulative volume of the produced water. RGWprovides an additional measure of the effectiveness of hydratedissociation as a gas-producing method and a relative criterion ofgas production performance. Both VP and MW maintain constant ineach cycle during the injection and soaking stage and increase onlyduring the production stage, as shown in the partial enlarged plotof Figs. 7 and 8. As shown in Fig. 8, RGW declines rapidly toapproximately 40e100 ST m3 of CH4/m3 of H2O after the first 5 huffand puff cycles (56e178 min).
As shown in Figs. 7 and 8, the water production rate Qpro duringthe production stage on a level with the hot water injection rateQinj

Fig. 7. Cumulative volumes of gas and water produced from the well during hydratedissociation in the CHS. Fig. 9. Sensitivity analysis: effect of SH on the percentage of the hydrate dissociated
during hydrate dissociation in the CHS (SH ¼ 0.335 in the reference case).
G. Li et al. / Energy 36 (2011) 3170e31783176
(0.040 L/min) indicates that the water production is manageable,and the gas-to-water ratio RGW is not prohibitively low evenconsidering the energy cost during the hot water injection process,mainly the cost of the power used to pump the fluid into the well.Under the thermodynamic conditions in this work, the gasproduction from the sediment in this work using the huff and puffmethod is economically profitable from the relative criterion (RGW)point of view.
4. Sensitivity analysis of production from CHS
In this work, we investigate into the sensitivities of the hydratedissociation to the initial hydrate saturation SH, the hot waterinjection time tinj during the injection stageof thehuff andpuff cycle,and the temperature of the hot water injected into the CHS Tinj.
4.1. Sensitivity to SH
Fig. 9 shows the dependence of the percentage of the hydratedissociated during the hydrate dissociation in the CHS on the initialhydrate saturation SH. The volume of the water, gas and hydrate in
Fig. 8. Cumulative gas-to-water ratio RGW during the huff and puff cycles.
the vessel before hydrate dissociation is equal to the total volume ofwater, gas and hydrate (if still exist) after hydrate dissociation.During the hydrate dissociation process, there is water injected intothe vessel, and both gas and water are produced. The percentage ofthe hydrate dissociated during the hydrate dissociation could becalculated according to the mass balance equation. It is assumedthat there is 5.75 mol water in 1 mol methane hydrate, the densityof methane hydrate is 0.94 g/cm3 and water in the vessel isincompressible. The volume of the gas in the vessel after hydrateformation is calculated by the pressure and temperature conditionsin the vessel using the PengeRobinson equation. In the referencecase, SH ¼ 0.335, which is already discussed above. As shown inFig. 9, a lower SH leads to a higher percentage of the hydratedissociated after several huff and puff cycles, confirming the resultsof an earlier study [20]. The reason for this is that the system hasa higher effective permeability in the lower SH cases, which resultsin a faster depressurization in the CHS and higher hydrate disso-ciation rate in the production process. In the reference case, thepercentage of the hydrate dissociated after 13 huff and puff cycles isless than 55% (Fig. 9), and most of the dissociated hydrate wasinitially in the vicinity of the injection and the production well. Asshown in Fig. 6, although the hot water is injected and the heatsoaks into the CHS, the thermal effect is mainly confined around thewell, the increase of the temperature around the inside edge of theCHS is quite small (the temperatures of T1AeT1C and T3AeT3C areall lower than 12.3 �C, as shown in Fig. 5), and most of the undis-sociated hydrate is in this area. Consequently, in the cases withlower SH, the efficiency of thermal stimulation with hot waterflowing during the injection stage (convection as the main heattransfer mechanism) and heat soaking during the soaking stage(conduction as the main heat transfer mechanism) is higher thanthat with higher SH.
4.2. Sensitivity to tinj
Fig. 10 shows the dependence of the percentage of the hydratedissociated during hydrate dissociation in the CHS on the injectiontime of the hotwater tinj. In the reference case,with the constant hotwater injection rate and time (Qinj¼ 0.040 L/min and tinj¼ 5.0 min),0.20 L of the hot water (Tinj¼ 130 �C) is injected into the CHS duringeach cycle. Increasing tinj from 5.0 to 10.0min results in a significantenhancement of gas production performance, and the percentage of
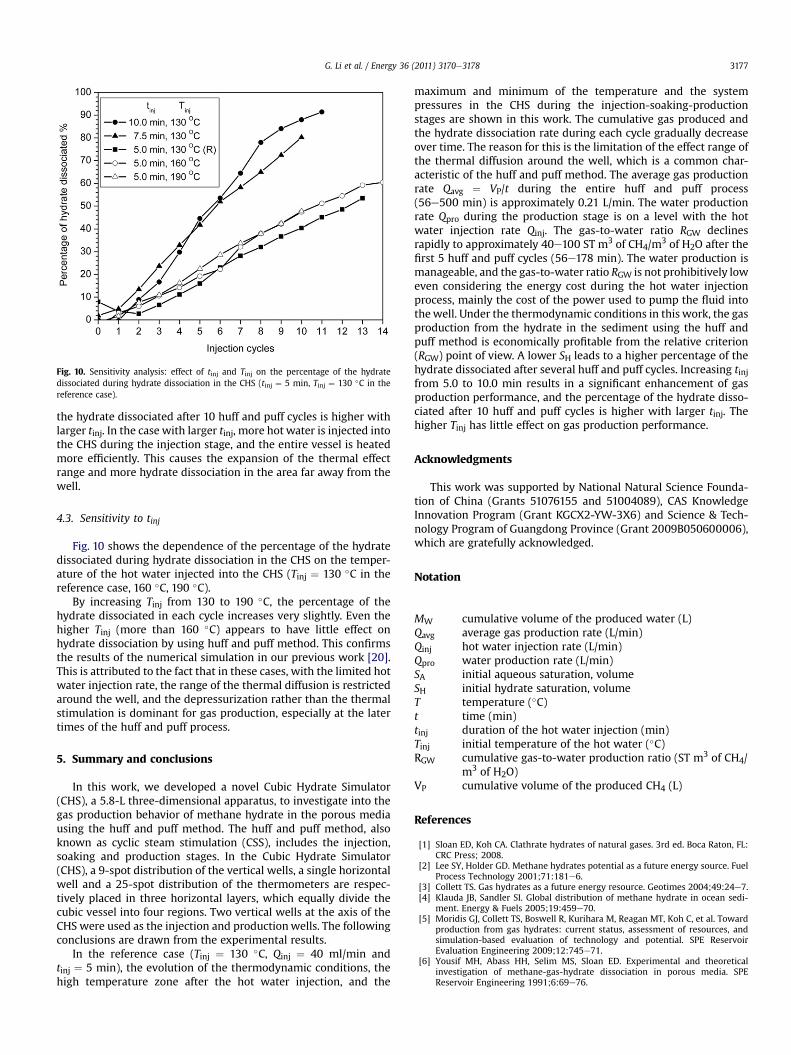
Fig. 10. Sensitivity analysis: effect of tinj and Tinj on the percentage of the hydratedissociated during hydrate dissociation in the CHS (tinj ¼ 5 min, Tinj ¼ 130 �C in thereference case).
G. Li et al. / Energy 36 (2011) 3170e3178 3177
the hydrate dissociated after 10 huff and puff cycles is higher withlarger tinj. In the case with larger tinj, more hot water is injected intothe CHS during the injection stage, and the entire vessel is heatedmore efficiently. This causes the expansion of the thermal effectrange and more hydrate dissociation in the area far away from thewell.
4.3. Sensitivity to tinj
Fig. 10 shows the dependence of the percentage of the hydratedissociated during hydrate dissociation in the CHS on the temper-ature of the hot water injected into the CHS (Tinj ¼ 130 �C in thereference case, 160 �C, 190 �C).
By increasing Tinj from 130 to 190 �C, the percentage of thehydrate dissociated in each cycle increases very slightly. Even thehigher Tinj (more than 160 �C) appears to have little effect onhydrate dissociation by using huff and puff method. This confirmsthe results of the numerical simulation in our previous work [20].This is attributed to the fact that in these cases, with the limited hotwater injection rate, the range of the thermal diffusion is restrictedaround the well, and the depressurization rather than the thermalstimulation is dominant for gas production, especially at the latertimes of the huff and puff process.
5. Summary and conclusions
In this work, we developed a novel Cubic Hydrate Simulator(CHS), a 5.8-L three-dimensional apparatus, to investigate into thegas production behavior of methane hydrate in the porous mediausing the huff and puff method. The huff and puff method, alsoknown as cyclic steam stimulation (CSS), includes the injection,soaking and production stages. In the Cubic Hydrate Simulator(CHS), a 9-spot distribution of the vertical wells, a single horizontalwell and a 25-spot distribution of the thermometers are respec-tively placed in three horizontal layers, which equally divide thecubic vessel into four regions. Two vertical wells at the axis of theCHS were used as the injection and productionwells. The followingconclusions are drawn from the experimental results.
In the reference case (Tinj ¼ 130 �C, Qinj ¼ 40 ml/min andtinj ¼ 5 min), the evolution of the thermodynamic conditions, thehigh temperature zone after the hot water injection, and the
maximum and minimum of the temperature and the systempressures in the CHS during the injection-soaking-productionstages are shown in this work. The cumulative gas produced andthe hydrate dissociation rate during each cycle gradually decreaseover time. The reason for this is the limitation of the effect range ofthe thermal diffusion around the well, which is a common char-acteristic of the huff and puff method. The average gas productionrate Qavg ¼ VP/t during the entire huff and puff process(56e500 min) is approximately 0.21 L/min. The water productionrate Qpro during the production stage is on a level with the hotwater injection rate Qinj. The gas-to-water ratio RGW declinesrapidly to approximately 40e100 ST m3 of CH4/m3 of H2O after thefirst 5 huff and puff cycles (56e178 min). The water production ismanageable, and the gas-to-water ratio RGW is not prohibitively loweven considering the energy cost during the hot water injectionprocess, mainly the cost of the power used to pump the fluid intothewell. Under the thermodynamic conditions in this work, the gasproduction from the hydrate in the sediment using the huff andpuff method is economically profitable from the relative criterion(RGW) point of view. A lower SH leads to a higher percentage of thehydrate dissociated after several huff and puff cycles. Increasing tinjfrom 5.0 to 10.0 min results in a significant enhancement of gasproduction performance, and the percentage of the hydrate disso-ciated after 10 huff and puff cycles is higher with larger tinj. Thehigher Tinj has little effect on gas production performance.
Acknowledgments
This work was supported by National Natural Science Founda-tion of China (Grants 51076155 and 51004089), CAS KnowledgeInnovation Program (Grant KGCX2-YW-3X6) and Science & Tech-nology Program of Guangdong Province (Grant 2009B050600006),which are gratefully acknowledged.
Notation
MW cumulative volume of the produced water (L)Qavg average gas production rate (L/min)Qinj hot water injection rate (L/min)Qpro water production rate (L/min)SA initial aqueous saturation, volumeSH initial hydrate saturation, volumeT temperature (�C)t time (min)tinj duration of the hot water injection (min)Tinj initial temperature of the hot water (�C)RGW cumulative gas-to-water production ratio (ST m3 of CH4/
m3 of H2O)VP cumulative volume of the produced CH4 (L)
References
[1] Sloan ED, Koh CA. Clathrate hydrates of natural gases. 3rd ed. Boca Raton, FL:CRC Press; 2008.
[2] Lee SY, Holder GD. Methane hydrates potential as a future energy source. FuelProcess Technology 2001;71:181e6.
[3] Collett TS. Gas hydrates as a future energy resource. Geotimes 2004;49:24e7.[4] Klauda JB, Sandler SI. Global distribution of methane hydrate in ocean sedi-
ment. Energy & Fuels 2005;19:459e70.[5] Moridis GJ, Collett TS, Boswell R, Kurihara M, Reagan MT, Koh C, et al. Toward
production from gas hydrates: current status, assessment of resources, andsimulation-based evaluation of technology and potential. SPE ReservoirEvaluation Engineering 2009;12:745e71.
[6] Yousif MH, Abass HH, Selim MS, Sloan ED. Experimental and theoreticalinvestigation of methane-gas-hydrate dissociation in porous media. SPEReservoir Engineering 1991;6:69e76.

G. Li et al. / Energy 36 (2011) 3170e31783178
[7] Kono HO, Narasimhan S, Song F, Smith DH. Synthesis of methane gas hydratein porous sediments and its dissociation by depressurizing. Powder Tech-nology 2002;122:239e46.
[8] Sun X, Nanchary N, Mohanty KK. 1-D modeling of hydrate depressurization inporous media. Transport in Porous Media 2005;58:315e38.
[9] Tang LG, Li XS, Feng ZP, Li G, Fan SS. Control mechanisms for gas hydrateproduction by depressurization in different scale hydrate reservoirs. Energy &Fuels 2007;21:227e33.
[10] Moridis GJ, Reagan MT, Kim SJ, Seol Y, Zhang K. Evaluation of the gasproduction potential of marine hydrate deposits in the Ulleung Basin of theKorean East Sea. SPE Journal 2009;14:759e81.
[11] Li G, Li XS, Chen Q, Chen ZY. Numerical simulation of gas production from gashydrate zone in Shenhu Area, South China Sea. Acta Chim Sinica 2010;68:1083e92.
[12] Tang LG, Xiao R, Huang C, Feng ZP, Fan SS. Experimental investigation ofproduction behavior of gas hydrate under thermal stimulation in unconsoli-dated sediment. Energy & Fuels 2005;19:2402e7.
[13] Kawamura T, Ohtake M, Sakamoto Y, Yamamoto Y, Haneda H, Komai T, et al.Experimental study on steam injection method using methane hydrate coresamples. In: Proceedings of the seventh (2007) ISOPE ocean mining sympo-sium, http://www.isope.org; 2007. Lisbon, Portugal; July 1e6.
[14] Li XS, Wan LH, Li G, Li QP, Chen ZY, Yan KF. Experimental investigation intothe production behavior of methane hydrate in porous sediment with hotbrine stimulation. Industrial & Engineering Chemistry Research 2008;47:9696e702.
[15] Kawamura T, Yamamoto Y, Ohtake M, Sakamoto Y, Komai T, Haneda H.Experimental study on dissociation of hydrate core sample accelerated bythermodynamic inhibitors for gas recovery from natural gas hydrate. In:Proceedings of the fifth international conference on gas hydrates, http://www.icgh.org; 2005. Trondheim, Norway; June 2e6.
[16] Li G, Li XS, Tang LG, Zhang Y, Feng ZP, Fan SS. Experimental investigation ofproduction behavior of methane hydrate under ethylene glycol injection.Journal of Chemical Industry and Engineering (China) 2007;58:2067e74.
[17] Najibi H, Chapoy A, Haghighi H, Tohidi B. Experimental determination andprediction of methane hydrate stability in alcohols and electrolyte solutions.Fluid Phase Equilibria 2009;275:127e31.
[18] Moridis GJ, Reagan MT, Boyle KL, Zhang K. Evaluation of the gas productionpotential of challenging hydrate deposits. In: TOUGH symposium. Berkeley,CA, USA: Lawrence Berkeley National Laboratory, http://esd.lbl.gov/newsandevents/toughsymposium09; 2009. September 14e16.
[19] Li G, Moridis GJ, Zhang K, Li XS. Evaluation of gas production potential frommarine gas hydrate deposits in Shenhu Area of the South China Sea. Energy &Fuels 2010;24(11):6018e33.
[20] Li G, Moridis GJ, Zhang K, Li XS. The use of huff and puff method in a singlehorizontal well in gas production from marine gas hydrate deposits in theShenhu Area of the South China Sea. In: 2010 SPE International oil & gasConference & Exhibition in China, http://www.spe.org/events/iogcec; 2010.Beijing, China; June 8e10.
[21] Kurihara M, Funatsu K, Ouchi H, Masuda Y, Narita H. Investigation on appli-cability of methane hydrate production methods to reservoirs with diversecharacteristics. In: Proceedings of the fifth international conference on gashydrates, http://www.icgh.org; 2005. Trondheim, Norway; June 2e6.
[22] Moridis GJ, Reagan MT. Strategies for gas production from oceanic Class 3hydrate accumulations. In: 2007 offshore technology conference, http://www.otcnet.org; 2007. Houston, Texas, USA; April 30eMay 3.
[23] Bai YH, Li QP, Zhao Y, Li XF, Du Y. The experimental and numerical studies ongas production from hydrate reservoir by depressurization. Transport inPorous Media 2009;79:443e68.
[24] Sayegh SG, Maini BB. Laboratory evaluation of the CO2 Huff-N-puff process forheavy oil-Reservoirs. Journal of Canadian Petroleum Technology 1984;23:29e36.
[25] Vittoratos E. Flow regimes during cyclic steam stimulation at cold lake.Journal of Canadian Petroleum Technology 1991;30:82e6.
[26] Leaute RP, Carey BS. Liquid addition to steam for enhancing recovery (LASER)of bitumen with CSS: results from the first pilot cycle. Journal of CanadianPetroleum Technology 2007;46:22e30.
[27] Moridis GJ, Reagan MT. Gas production from oceanic class 2 hydrate accu-mulations. In: 2007 offshore technology conference, http://www.otcnet.org;2007. Houston, Texas, USA; April 30eMay 3.
[28] Li XS, Zhang Y, Li G, Chen ZY, Yan KF, Li QP. Gas hydrate equilibrium disso-ciation conditions in porous media using two thermodynamic approaches.Journal of Chemical Thermodynamics 2008;40:1464e74.