Embed Size (px)
Citation preview
Efficient Take-Back Legislation
Atalay AtasuCollege of Management, Georgia Institute of Technology, Atlanta, GA 30308
Luk N. Van Wassenhove, Miklos SarvaryINSEAD, Boulevard de Constance, 77300 Fontainebleau, France{[email protected], [email protected]}
P roduct and waste take-back is becoming more regulated by countries to protect the environment. Suchregulation puts an economic burden on firms, while creating fairness concerns and potentially even missing
its primary target: environmental benefits. This research discusses the economic and environmental impacts ofextended producer responsibility type of legislation and identifies efficiency conditions. It is shown that the rightpolicy would (i) make producers responsible for their own waste to avoid fairness concerns and (ii) favor eco-design producers to create stronger environmental benefits. Furthermore, the efficiency of take-back systems isalso driven by environmental classification of products, industry structure, and end-user willingness to par-ticipate in take-back programs.
Key words: WEEE; regulation; environment; social welfareHistory: Received: April 2007; Accepted April 2008 by Kalyan Singhal; after 1 revision.
1. IntroductionTake-back legislation holds manufacturers responsiblefor environmentally safe treatment of their productswhen they return at the end of their life. Under suchextended producer responsibility (EPR) legislation,manufacturers are required to provide a system orfinancial means of collecting and processing the wastestream of used products to control environmentalpollution. Responding to increased pressure fromgreen organizations, a number of governmental take-back regulations have been enacted in the world’sleading economies. The environmental directivesin the European Union (EU) (Europa-Environment2005a, b) and Japan (Japanese Ministry of Environ-ment 2005) have been introduced earlier, while thetake-back movement is currently spreading in theUnited States. Green organizations won their firstbattle on take-back legislation in Maine in 2004, whenthe state passed the first US take-back law (Woellert2006). States such as Washington, California (US Stateof California 2005), and Maryland joined Maine inenacting take-back legislation (http://www.computertakeback.com) and 19 other states are currently con-sidering legislation.
There are two basic types of take-back directiveprinciples: (i) consumer pays and (ii) producer pays.Under the consumer pays principle, the end-user isdirectly charged for the costs of environmentallysound treatment of used products. Under the pro-
ducer pays principle, the manufacturer is responsiblefor the environmentally friendly treatment of end-of-use products at no cost to the end user. While Japa-nese and Californian governments have chosen theformer, European and Washington governments haveopted for the latter principle.
Our focus in this paper is on take-back directivesimplemented under the EPR with manufacturer paysprinciple. Several European take-back directives, e.g.,for batteries, packaging, and end-of-life vehicles (seeTables A1–A3 in Appendix A.1) have been operationalfor a long time. These directives are likely templates forfuture legislation in other regions of the world (seehttp://www.computertakeback.com). We base our dis-cussion on the European Waste Electrical and Elec-tronic Equipment (WEEE) Directive (Europa-Environ-ment 2005a, b), as it is the most recently updated onesince its initial adoption in 2003.
The WEEE Directive introduces producer responsi-bilities for electrical and electronics waste. It is basedon collection, recycling, and recovery targets imposedon all EU member countries (see Table 1). Recyclingis defined as reprocessing of the waste materials forthe original purpose or for other purposes, butexcluding energy recovery which means the use ofcombustible waste as a means of generating energythrough direct incineration with or without otherwaste but with recovery of the heat. Recovery on theother hand has a broader definition, which includes
243
PRODUCTION AND OPERATIONS MANAGEMENTVol. 18, No. 3, May–June 2009, pp. 243–258ISSN 1059-1478|EISSN 1937-5956|09|1803|0243
POMSDOI 10.3401/poms.1080.01004
r 2009 Production and Operations Management Society

recycling of materials and harvesting residual energycontent of used products (Europa-Environment2005a, b). European governments are responsible forensuring a minimum collection target of WEEE, cur-rently set at 4 kg per capita per year, free of charge toconsumers. Then, producers are responsible forproper treatment of all collected products so that theimposed recycling and recovery targets are met. Thislegislative structure has been designed consideringtwo basic assumptions: (i) by making producersresponsible, an economic incentive is created todesign more ecological products, and (ii) recyclingand recovery of large quantities of waste should leadto a reduction in environmental impact (Mayers et al.2005).
Unfortunately, the WEEE Directive has faced im-portant implementation problems and it is stillunclear to which extent this directive achieves its in-tentions. The directive is (to be) implemented in 27countries, and each country has its own system. Thisstems from the fact that the EU can impose directiveson the member countries, but the latter are free totranslate those into national laws as they please, aslong as they comply with the directive. So, nationallaws can be stricter, and implementation details maydiffer substantially. As a consequence, companiesstruggle with inter-country differences and unclearspecifications on how to comply. The need for im-provements from the industry’s perspective has beenevident as producers, treatment providers, and regu-lators formed public forums to discuss implemen-tation problems related to the WEEE Directive. Onesuch initiative has resulted in the WEEE DirectiveSeries held at INSEAD. The INSEAD WEEE DirectiveSeries is a forum composed of producers, treatmentproviders, legislators, green groups, and academics,organizing regular meetings to discuss issues relatedto the WEEE Directive in a neutral setting (see http://www.insead.edu/weee).
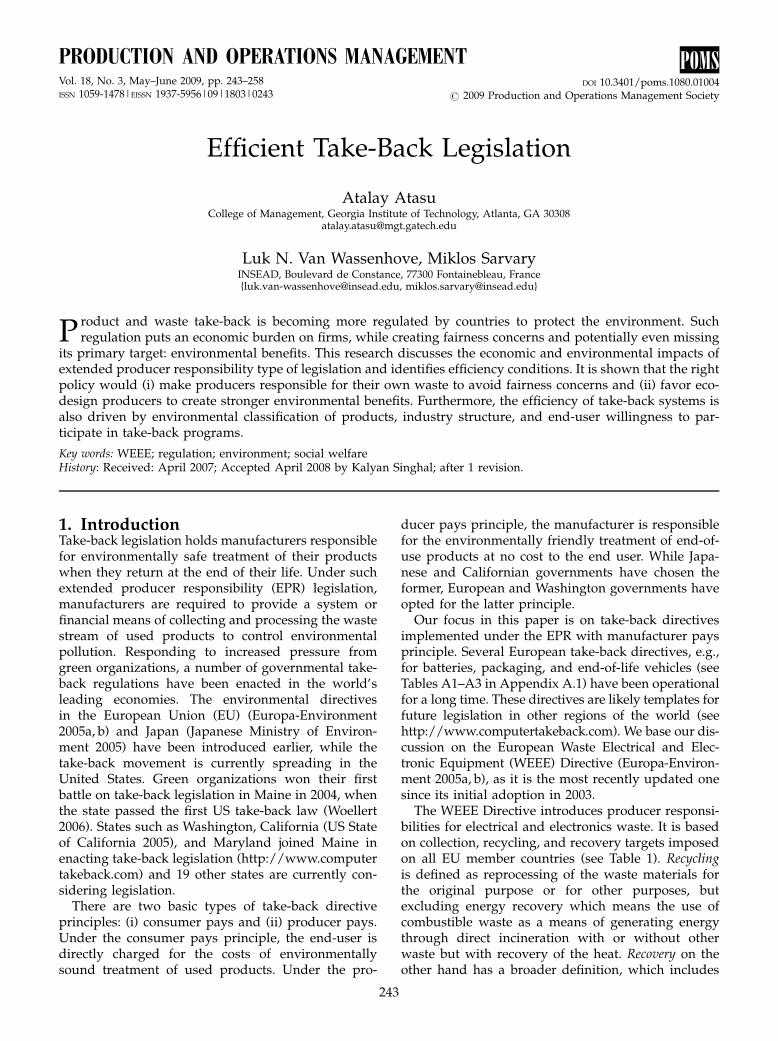
Because our purpose in this paper is to understandmajor issues in designing and implementing WEEE-type EPR legislation, we took advantage of our WEEEDirective Series to interview a number of (anony-mous) producers (six), treatment providers (eight),and legislators (two). These interviews have helped usidentify the following issues, summarized in Figure 1.
Setting targets: To the question ‘‘How were the cur-rent collection and recycling targets initially set?’’, thecommon answer was ‘‘lobbying.’’ Before the legislationwas enacted, producers lobbied to decrease the targetsto avoid the potential future costs. The green organi-zations lobbied to increase the targets to increasethe environmental savings. The treatment providerswere teaming up with the green organizations to in-crease their business. This lobbying process resultedin the current targets of the WEEE Directive. The im-pact of these rather arbitrary targets is still unclear.
Product categorization: Intuitively, one would expectthat collection and treatment targets be related to theenvironmental hazard of the products. However,the WEEE targets are only based on the weight ofthe products. Contrary to the original assumptions,the use of weight-based targets does not assure thatproducers adapt the design of their products as in-tended (Mayers et al. 2005).
Individual producer responsibility: Currently, manu-facturers see no incentive for individual systems.Most manufacturers prefer collective systems to takeadvantage of scale economies. They have formed col-lective take-back systems (see European RecyclingPlatform 2007), where most take-back-related activi-ties are delegated to third-party treatment providers.Cost allocation between manufacturers is weightbased and is managed at best by sampling the col-lected products.
Fairness: The most important problem from themanufacturers’ point of view is lack of fairness. Theyfear the existence of free riders, and look for levelplaying grounds. Compliance assurance is very im-portant to them.
Collection assurance: It is not clear in the directivewho pays for the cost of assuring a 4 kg per capitacollection target. A tendency to shift the cost of col-lection assurance to the manufacturers has beenobserved in some countries such as Portugal andIreland, but it is unknown to which extent this couldbe managed.
To date, the WEEE Directive raises more problemsthan it solves, and it does not seem to cover its statedintentions. Its environmental benefits are limited, andthe directive mainly serves for landfill avoidance, toplease consumers and green organizations. Because
Table 1 EU Legislation for Waste Electrical and Electronic Equipment (WEEE) for Different Categories Defined by the Directive (Percentages of Total Weight)
Category Collection level Recycling level (%) Recovery level (%)
Large household appliances and automatic dispensers To be decided 75 80
IT, telecom and consumer equipments To be decided 65 75
Small household equipment, electrical and electronic
tools, medical devices and monitoring and control equipment
To be decided 50 70
Lamps To be decided 80 80
Overall 44 kg per inhabitant until 2009 – –
Atasu, Van Wassenhove and Sarvary: Efficient Take-Back Legislation244 Production and Operations Management 18(3), pp. 243–258, r 2009 Production and Operations Management Society
the classification of product categories and selection oftargets are not related to any environmental impactmeasure but weight, most producers state that they donot have an incentive to increase the environmentalfriendliness of their products, and therefore they donot invest in environmental designs. The WEEEDirective also creates fairness concerns and it is per-ceived as a hidden tax by producers. The cost of take-back is estimated to be around 2% of revenues, whichis enormous given the small profit margins of manyelectrical and electronics products. Needs for im-provement are evident, and one needs to betterunderstand under what conditions it makes sense toenact such legislation.
As such, our purpose in this paper is to provide aframework for thinking about the environmental andeconomic impacts of such legislation, and all relatedissues of implementing it. Using a stylized economicmodel of a take-back system, we discuss improve-ments to the existing implementations from a market-based legislative perspective. In Section 2, we developour economic model to account for the economic andenvironmental impacts of the take-back legislation. InSection 3, we analyze our model. We first discuss atarget setting mechanism that balances the costs andenvironmental benefits of taking back used products.Then, we discuss the competitive implications of suchlegislation. We show that the legislation should con-sider the competition intensity in the market to decideon the take-back targets. Next, we argue that the fair-ness concerns of the manufacturers can be solved byenforcing individual producer responsibility. We then
consider the cost of collection assurance, i.e., con-sumer education. We also discuss the possibility ofrewarding manufacturers for implementing take-backsystems, and show that take-back subsidies can onlybe optimal for taking back very hazardous products.Finally, in Section 4, we extend our main model todiscuss the impact of alternative cost structures onthe efficiency of the target setting mechanism identi-fied before. In Section 5, we summarize the results ofour stylized models and conclude with our sugges-tions for designing efficient WEEE-type take-backsystems.
2. ModelIn this section, we formulate our generic model of astylized market for a single product category, consid-ering the current form of the WEEE legislation withcollection and recycling targets. There are three typesof decision makers: consumers, manufacturers, and asocial planner (government).
The sequence of events is as follows: First, the socialplanner sets a target collection rate (c) and a targetrecycling rate (r). This formulation assumes that thecollection target is defined as a fraction of what hasbeen sold (unlike WEEE, where the collection target is4 kg). Given the collection and recycling targets, themanufacturers set the sales quantity (q) given the costsof collection, recycling, and manufacturing for thespecific product of interest. Then, given the prices/quantities, the consumers buy the product.
Consumers: Consumers are differentiated in terms oftheir willingness to pay (y) for the specific product of
Col
lect
ion
Individual Collection Collective Collection
Collection System Collection System
EP
R T
reat
men
t
End-of-use products End-of-use products
Individual Treatment Collective Treatment
Cost to Producers Cost to Producers
Phase 1: Bringing end-of-use products tocollection centers
Question: Who shouldpay for collectionassurance?
Phase 2: Bringingcollected products totreatment centers
Question: Collective vs.individual systems?
Phase 3: Providingtreatment
Question: How to setrecycling targets? How tocategorize products?
Phase 4: Costs andenvironmental impact
Question: Fairnessconcerns?
Figure 1 The WEEE Directive at a Glance
Atasu, Van Wassenhove and Sarvary: Efficient Take-Back LegislationProduction and Operations Management 18(3), pp. 243–258, r 2009 Production and Operations Management Society 245

interest. For the sake of analytical tractability, weassume that consumer willingness to pay for theproduct is uniformly distributed between 0 and 1, andthe market density is normalized to 1. Given the priceof the product p, a consumer with willingness to payy0 buys the product if y0 � p. This results in a simpleCournot inverse demand function, i.e., p 5 1� q,where q is the total quantity sold.
Manufacturers: We consider n identical manufactur-ers in the market. Manufacturers play a Cournot gameto obtain their market shares. They choose sales quan-tities to maximize their profits. Price is driven by thetotal quantity sold by n players in Cournot competi-tion, i.e., p ¼ 1�
Pni¼1 qi, where qi is the amount sold
by firm i (i 5 1, . . ., n). The manufacturer quantity de-cisions depend on the market structure as well as oncosts involved. Each unit costs m to produce. f(r, c) isthe cost per unit of product sold, of taking back afraction c (0 � c � 1) of sold products, and recycling afraction r (0 � r � 1) of products taken back. We as-sume f(r, c) is an increasing convex function of c and rand f(1, 1)o1� m, such that the take-back obligationdoes not drive manufacturers out of the market. Acertain proportion of manufacturers’ take-back costmay be subsidized by the social planner. Denoting thesubsidy per recycled product by s, each manufacturerreceives a total of qircs. Manufacturer i then maxi-mizes his profits:
PMi¼ qiðp� m� fðr; cÞ þ srcÞ;
where p ¼ 1�Pn
i¼1 qi: It is straightforward to showthat at equilibrium, manufacturer i chooses
q�i ¼1� m� fðr; cÞ þ src
nþ 1; pðq�i Þ ¼ 1� nq�i ð1Þ
and obtains
PMi¼ ðpðq�i Þ � m� fðr; cÞ þ srcÞq�i : ð2Þ
Social planner: By anticipating the manufacturers’and consumers’ actions (1), the social planner uses thecollection rate c and recycling rate r to maximize totalwelfare. The total welfare in the economy consists offive main terms:
1. Manufacturer profit:
PM ¼Xn
i¼1
PMi¼ nðpðq�i Þ � m� fðr; cÞ þ srcÞq�i :ð3Þ
2. Consumer surplus:
PC ¼ ð1� pðq�i ÞÞq�i n=2: ð4Þ
3. Environmental benefits: We assume that the en-vironmental hazard is perceived at a per productbasis. The environmental cost of not recycling aproduct is given by e. This parameter is a critical
one in this model set-up and is discussed in detailin Section 2.1. Then:
PE ¼ �eð1� rcÞq�i n: ð5Þ
4. The social planner also needs to assure that thetargeted collection rates are made available bythe consumers. This requires marketing take-back programs to inform the consumers. Whenthe social planner runs such marketing pro-grams, she incurs an additional cost ac2 toensure the collection level c. This cost is chosenas a function of the collection rate, not the totalquantity collected, as c can be thought of asthe percentage of environmentally educated con-sumers (see Savaskan et al. 2004 for a similaroperations approach, and Lilien et al. 1992and Fruchter and Kalish 1997 for marketingapproaches).
5. Finally, the social planner may choose to rewardthe manufacturers for recycling by providingtake-back subsidies. In this case, the social plan-ner’s cost of subsidizing is given by Oðr; c; sÞ ¼n qi r c s:
The problem to be solved by the social planner ismaximizing the total welfare (W) in the system insteady-state:
maxr; c; s
W ¼ PM þPC þPE � ac2 � Oðr; c; sÞ ð6Þ
s:t: 0 � r � 1 ð7Þ
0 � c � 1 ð8Þ
This formulation has three underlying additionalassumptions: (i) free disposal of non-recycled prod-ucts (ii) linear additivity in total welfare, and (iii)integrated manufacturer and treatment provider. Wediscuss the implications of these assumptions inAppendix A.2.
2.1. Cost to the Environment (e)The cost to the environment e is a critical parameter inour model set-up. Naturally, this cost should be re-lated to the physical and environmental aspects of theproduct of interest, i.e., the physical damage inflictedon the environment. Thus, it is important to measurethe environmental impact of manufacturing and notrecycling a product. Life Cycle Assessment techniquesare popular for this purpose in the field of environ-mental economics. For a detailed review of thisliterature, we refer to Mayers et al. (2005) and Huis-man et al. (2003). This literature suggests that theenvironmental impact of the product is related to theweight of the ‘‘hazardous waste’’ it contains. Takingthis into account, we define the e parameter such thatit is a measure of environmental hazard which differs
Atasu, Van Wassenhove and Sarvary: Efficient Take-Back Legislation246 Production and Operations Management 18(3), pp. 243–258, r 2009 Production and Operations Management Society

depending on the environmental impact of the prod-uct. Such a measure e would take into account severalissues. For instance, the value of e would depend onthe recycling technology used. One form of recyclingcan be more environmentally friendly than the others.It would also depend on the hazardous material contentand the product’s physical properties such as volume orweight. This parameter would also reflect the differ-ences of sales volumes between products. For productsthat are sold at a larger scale and that have higher en-vironmental impact, this value would be higher. While adetailed analysis of these issues is beyond the scope ofthis paper, we refer the reader to Huisman et al. (2008),who provide a highly detailed analysis of these issuesspecifically in the European WEEE context.
For our purposes, we need to find a way ofcomparing the ecological impact with the economicsurplus change. Environmental economists usuallyplot these two on two-dimensional graphs where theycorrelate the environmental costs with the environ-mental savings obtained (Bovenberg and Goulder1996, Kalimo 2006, Mayers et al. 2005, Ruedenaueret al. 2005). Unlike this classical approach, measuringthe cost to the environment in monetary terms is animportant requirement for our model. In principle,determining the economic value of this parameterneeds scientific investigation that takes into accountvarious long-term sustainability goals. Recent workon measuring the economic impact on global warm-ing is one example of such an approach. For instance,Sir Nicholas Stern (2006) concludes that a yearly in-vestment of one percent of global gross domesticproduct (GDP) is required to avoid the worst impactof climate change, while the failure to do so coulddecrease the global GDP by 20%. A comparison be-tween the potential environmental cost of landfill andcertain recycling technologies can be made in a similarway. Another possible approach could be interpretingthe e parameter as the market’s perception ofenvironmental hazard. By looking at the public will-ingness-to-pay for avoiding the harm to theenvironment, one could find another economic mea-sure to quantify e. This is still hard to measure: Somecould argue that this approach is fundamentallywrong because the consumers would never careenough for the environment while the authors of thispaper are more optimistic. The environmental eco-nomics literature is very helpful in this sense as itsuggests ways of measuring the willingness-to-pay.For instance, Hazilla and Kopp (1990) have been ableto estimate the social cost of implementing environ-mental quality regulations, and Smith and Huang(1995) estimate the consumer willingness-to-pay for amarginal increase in the air quality.
Estimating or quantifying this parameter is beyondthe scope of our analysis, because our purpose is to
generate insights using stylized models. For the re-mainder of our analysis, we assume that this kind ofmeasure exists with the economic interpretation.
3. Analysis
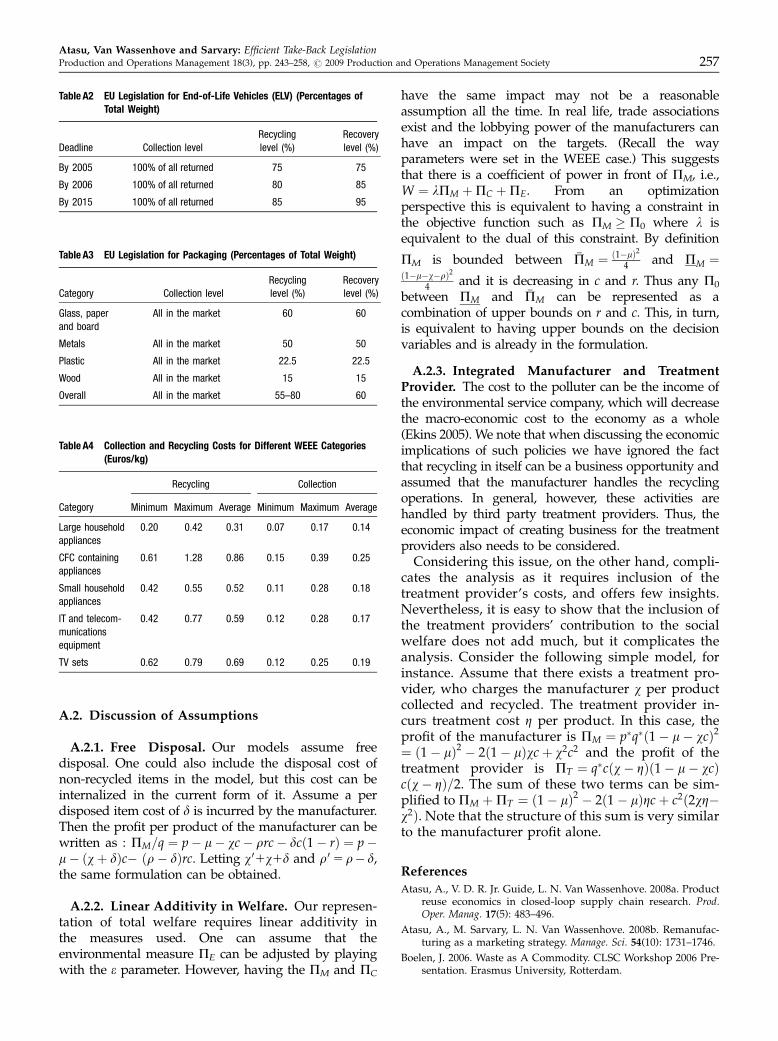
3.1. Base ModelLet us first consider a simple monopolistic scenario(n 5 1) where market information is costless (a5 0)and no subsidies are allowed (s5 0), to focus on theselection of collection and recycling targets at opti-mality. We consider the case where collection andrecycling costs are linear in the collection and recy-cling rates, i.e., fðr; cÞ ¼ wcþ rrc; as most practicaldata provides average treatment and collection costs(see Table A4 in Appendix A.1 for examples fromChen et al. 2004). We will discuss the relaxation of thislinear cost assumption later.
PROPOSITION 1. The social planner’s optimal decisionunder the base model is summarized in Table 2. Therecycling target (as a percentage of the collected returns) rshould always be selected at its upper bound (r 5 1) forc40. The optimal collection rate is decreasing in the col-lection and recycling costs (w and r), and increasing in thecost to the environment (e).
PROOF. All proofs are provided in the e-companion.&
The solution to the social planner’s problem issummarized in Proposition 1. A positive collectionrate is optimal only when the environmental cost issufficiently high. It turns out that for all c�40, theoptimal recycling rate is r�5 1. This is intuitive, be-cause collection is costly and the cost of recycling aproduct can always be avoided by not collecting thatproduct. This result is obviously driven by the factthat we assume a linear cost structure and perfect re-covery is possible. In practice however, there may beupper bounds on the recovery levels, i.e., it may notbe technically feasible to recycle everything. Never-theless, the intuition of the above result suggests thatthe recycling rate be selected at its upper bound whenthe costs are linear. The situation may be differentwhen the cost of recycling is increasing in the recy-cling percentage. In this case, the optimal solutionchanges. We consider this issue in Section 4.
Table 2 Optimal Solutions for Social Planner Given the Possible ParameterRealizations
e � 3ð1�mÞ2
wþr1�mþwþr
� �3ð1�mÞ
2wþr
1�mþwþr
� �� e � 3ðwþrÞ
2 e � 3ðwþrÞ2
c� 0 c ¼ 12
1�mwþrþ
3ð1�mÞ�4 e3 ðwþrÞ�4 e
� �1
r� any rA[0, 1] 1 1
Atasu, Van Wassenhove and Sarvary: Efficient Take-Back LegislationProduction and Operations Management 18(3), pp. 243–258, r 2009 Production and Operations Management Society 247

As one reason for enacting take-back directives iscreating incentives for the manufacturers for eco-effi-cient designs, one would expect that the monopolistwould invest in economical collection and recyclingsystems, or even change the design of the productsuch that it would be cheaper to collect and recycleand less harmful to the environment. Recall that ourmodel assumes an explicit consideration of environ-mental impact in the formulation. Let us nowinvestigate whether the directive achieves its targetswith this consideration. According to Proposition 1,the higher the cost to the environment (or the con-sumer perception of e), and the lower the collectionand recycling costs, the higher the optimal collectionrate. In other words, assuring the best welfare out-come requires the legislative targets to be adapted tothe changes in the system and if the above-mentionedscenario takes place, increased targets would helpimprove the total welfare. On the other hand, the mo-nopolist’s anticipation of changes in the legislationmay result in unexpected outcomes. The monopolistmay anticipate that if he reduces the cost of treatment,the government will increase the optimal collectionrate. This, in turn, may result in the monopolist notinvesting in reducing the treatment costs by antic-ipating the social planner’s action.
COROLLARY 1. The monopolist’s profit is decreasing in thecost of treatment (w1r) when e � 3ð1�mÞ
4 , and increasingotherwise, as long as the optimal collection rate c�A(0, 1).
When the optimal collection rate is equal to zero(c� ¼ 0), the monopolist is worse off with reducedtreatment cost (w1r) because reducing this may leadto a positive imposed collection rate c. On the otherhand, when c� ¼ 1 the monopolist is better off withreduced costs as after c 5 1 the collection rate can nolonger increase. Interestingly, for an interior c, thebasic driver of this investment decision is the manu-facturing cost m. When the profit margin of themonopolist is sufficiently high (i.e., m low), the man-ufacturer’s profit will be decreasing with lowertreatment costs, as the imposed collection rates willbe higher. On the other hand, when the monopolist’sprofit margins are low (i.e., m high), the decrease in thetreatment cost will increase manufacturer profits,even though the imposed collection rate increases.
On the other hand, from Table 2 it is easy to see thatthe targets are always increasing in e and it is alwaysto the manufacturer’s benefit to reduce e, if the leg-islation sets targets according to the environmentalimpact e. This suggests that: A take-back legislationsetting collection and recycling targets according toenvironmental impact may result in improved welfare out-comes by providing economic incentives to the monopolist.This has important implications for the WEEE Direc-
tive where collection and recovery targets are weightbased and categorization is done with respect to in-dustrial segments (e.g., white goods or consumerelectronics): (i) weight-based take-back legislationmay not necessarily be efficient because weight maynot always be a good measure of environmental im-pact, and (ii) the take-back legislation should considerthe environmental impact of each product individu-ally. Product categorization should be done withrespect to the environmental impact of products.
3.2. CompetitionIn this section, we extend our base model to anoligopolistic setting to account for the impact of com-petition on: (i) the target setting mechanism, and (ii)the environmental and economic efficiency of take-back legislation. There are n firms in the market, in-formation is again costless (a5 0), and no subsidiesare allowed (s5 0). Considering the result from Prop-osition 1, due to the linear cost assumption, weassume all collected items will be recycled (r� ¼ 1). Wewill use the same notation except that r now denotesthe sum of collection and recycling costs, i.e.,f(r, c) 5 rc.
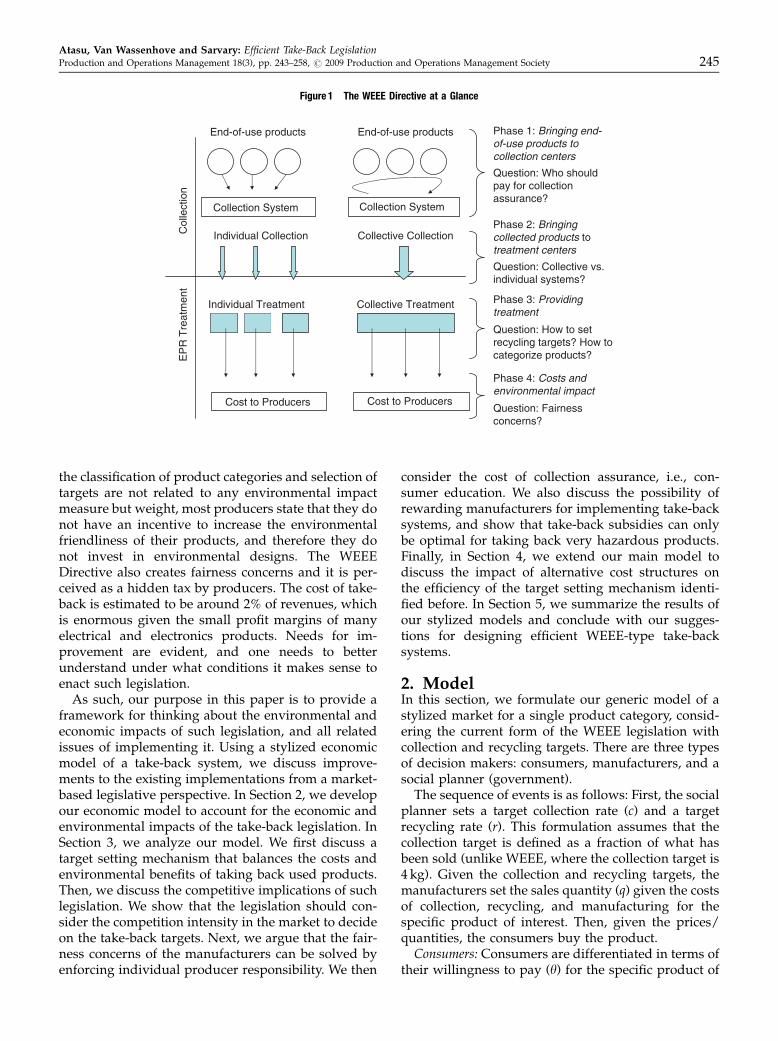
PROPOSITION 2. The optimal decision of the social plannerunder competition (of n firms) is summarized in Table 3.The optimal collection rate is decreasing in collection andrecycling costs (r) and increasing in the degree of compe-tition (n) and cost to the environment (e).
Proposition 2 points to a strong result: The optimalcollection rate is increasing in the degree of competition (n).Figure 2 illustrates this result by displaying the impactof competition and environmental hazard on the op-timal collection rate. To understand the underlyingcauses of this result, we need to observe how the el-ements of welfare change under competition. Whenthe number of competing firms increase, price de-clines. This leads to lower manufacturer profits andhigher consumer surplus. At the same time, due tolower price more consumers buy the product,increasing the output. Thus, while the consumersurplus is increasing, manufacturer profits and theenvironmental benefits are decreasing in the degree ofcompetition. The last effect is what we call the envi-ronmental externality of competition.
Figure 3 displays the environmental externality ofcompetition. It illustrates the case of a static legislation,where the collection rate is independent of the num-
Table 3 Optimal Collection Rate Under Competition
e � ð1�mÞr1�mþrnþ2nþ1
� �ð1�mÞr1�mþr
nþ2nþ1
� �� e � r nþ2
nþ1
� �e � r nþ2
nþ1
� �
c� 0 �1þmð Þ n 2þnð Þrþe n 1þnð Þ 1�mþrð Þn r 2 e 1þnð Þ� 2þnð Þrð Þ 1
Atasu, Van Wassenhove and Sarvary: Efficient Take-Back Legislation248 Production and Operations Management 18(3), pp. 243–258, r 2009 Production and Operations Management Society
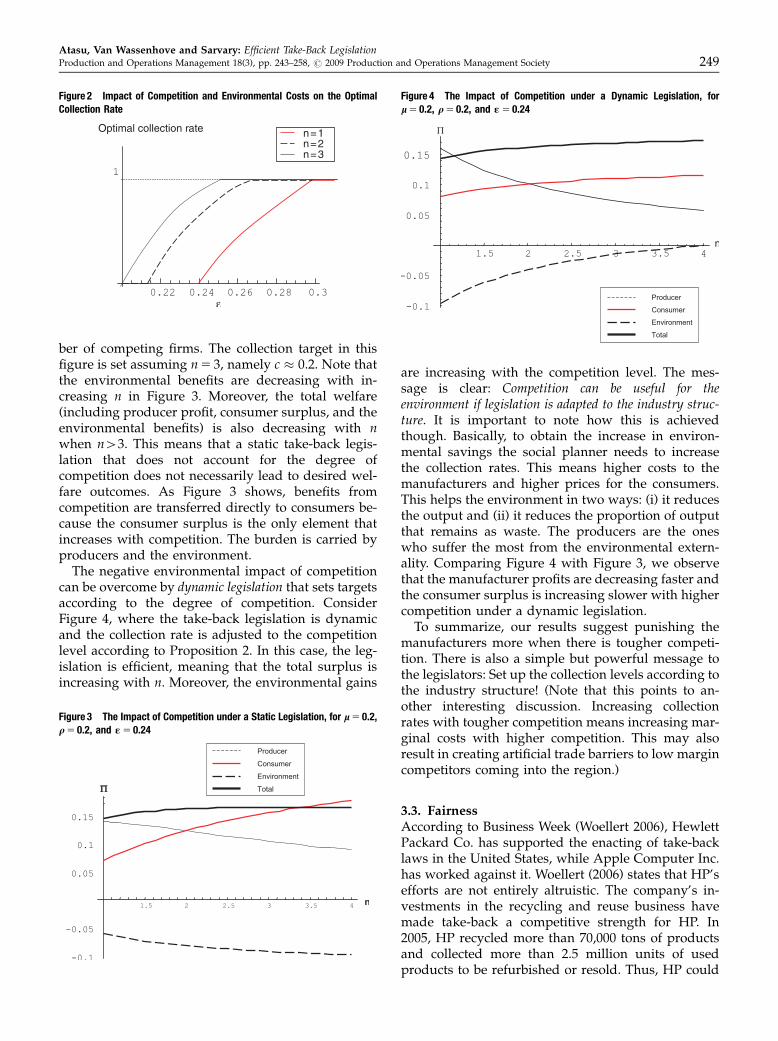
ber of competing firms. The collection target in thisfigure is set assuming n 5 3, namely c � 0.2. Note thatthe environmental benefits are decreasing with in-creasing n in Figure 3. Moreover, the total welfare(including producer profit, consumer surplus, and theenvironmental benefits) is also decreasing with nwhen n43. This means that a static take-back legis-lation that does not account for the degree ofcompetition does not necessarily lead to desired wel-fare outcomes. As Figure 3 shows, benefits fromcompetition are transferred directly to consumers be-cause the consumer surplus is the only element thatincreases with competition. The burden is carried byproducers and the environment.
The negative environmental impact of competitioncan be overcome by dynamic legislation that sets targetsaccording to the degree of competition. ConsiderFigure 4, where the take-back legislation is dynamicand the collection rate is adjusted to the competitionlevel according to Proposition 2. In this case, the leg-islation is efficient, meaning that the total surplus isincreasing with n. Moreover, the environmental gains
are increasing with the competition level. The mes-sage is clear: Competition can be useful for theenvironment if legislation is adapted to the industry struc-ture. It is important to note how this is achievedthough. Basically, to obtain the increase in environ-mental savings the social planner needs to increasethe collection rates. This means higher costs to themanufacturers and higher prices for the consumers.This helps the environment in two ways: (i) it reducesthe output and (ii) it reduces the proportion of outputthat remains as waste. The producers are the oneswho suffer the most from the environmental extern-ality. Comparing Figure 4 with Figure 3, we observethat the manufacturer profits are decreasing faster andthe consumer surplus is increasing slower with highercompetition under a dynamic legislation.
To summarize, our results suggest punishing themanufacturers more when there is tougher competi-tion. There is also a simple but powerful message tothe legislators: Set up the collection levels according tothe industry structure! (Note that this points to an-other interesting discussion. Increasing collectionrates with tougher competition means increasing mar-ginal costs with higher competition. This may alsoresult in creating artificial trade barriers to low margincompetitors coming into the region.)
3.3. FairnessAccording to Business Week (Woellert 2006), HewlettPackard Co. has supported the enacting of take-backlaws in the United States, while Apple Computer Inc.has worked against it. Woellert (2006) states that HP’sefforts are not entirely altruistic. The company’s in-vestments in the recycling and reuse business havemade take-back a competitive strength for HP. In2005, HP recycled more than 70,000 tons of productsand collected more than 2.5 million units of usedproducts to be refurbished or resold. Thus, HP could
Figure 4 The Impact of Competition under a Dynamic Legislation, forl 5 0.2, q 5 0.2, and « 5 0.24
Figure 3 The Impact of Competition under a Static Legislation, for l 5 0.2,q 5 0.2, and « 5 0.24
Optimal collection rate n=1 n=2 n=3
Figure 2 Impact of Competition and Environmental Costs on the OptimalCollection Rate
Atasu, Van Wassenhove and Sarvary: Efficient Take-Back LegislationProduction and Operations Management 18(3), pp. 243–258, r 2009 Production and Operations Management Society 249

see the implementation of take-back laws as a means ofcreating competitive advantage. On the other hand,Apple has been the Greens’ disappointment. Althoughthe company’s brand image is more environmentallyoriented, Apple lags behind HP and Dell in voluntaryrecycling. However, Apple says critiques ignore thecompany’s efforts to use recyclable and clean mate-rials in its products, i.e., 90% of Apple products can berecycled. The Chief Operations Officer Timothy D.Cook said: ‘‘It’s important to look at the process as awhole. Not just one part.’’ (Woellert 2006).
So far, our competition model considered identicalfirms and did not reflect this problem. We assumedwith this model that all products from all manufac-turers had identical collection and recycling costs aswell as environmental impacts, hence there were nofree riders. In reality, this is not the case. Firms withlower treatment costs and higher environmentalimpacts may be given a competitive advantage. Thestructural improvements for the legislation suggestedby our models so far are not sufficient to overcome thefairness issue. Consider the following examples:
EXAMPLE 1. Assume that there are two identical firms withm1 ¼ m2 ¼ 0:5, r1 ¼ r2 ¼ 0:2, and e1 ¼ e2 ¼ 0:22. Usingproposition 2, the optimal collection rate can be calculatedas c� ¼ 0:596154 and the manufacturer profits at this pointare realized at PM 5 0.0161095.
EXAMPLE 2. Now, assume that there are two firms differ-entiated in their product design for the environment. Forthe first firm (M1), let m1 5 0.5, r1 5 0.2, and e1 5 0.22,and for the second firm (M2), m2 5 0.5, r2 5 0.2, ande2 5 0.24. In this case, with a simple numerical analysis theoptimal collection rate is found to be c� ¼ 0:715517 and themanufacturer profits at this point are realized at PM1
¼PM2
¼ 0:0141528.
Example 2 shows that the manufacturer with lowerenvironmental impact is punished for the other man-ufacturer’s environmental hazard even when thetargets are intelligently set. The collection target ishigher in Example 2 due to the fact that the weightedaverage environmental hazard is higher because ofthe second manufacturer’s product. So the question is,why should a manufacturer increase the environmen-tal quality of his product, if he is going to pay for thefree riders?
EXAMPLE 3. Now, assume that there are two firms differ-entiated in their treatment costs. For the first firm (M1), letm1 5 0.5, r1 5 0.2, and e1 5 0.22 and, for the second firm(M2), m2 5 0.5, r2 5 0.18, and e2 5 0.22. In this case, theoptimal collection rate is found to be c� ¼ 0:742058 and themanufacturer profits at this point are realized at PM1
¼0:0125998 and PM2
¼ 0:0161519.
Example 3 shows that the second manufacturer, byreducing the treatment costs, can gain a competitiveadvantage and lower the other manufacturer’s profitsby 25% while increasing his profits. So, there may be astronger incentive on reducing the treatment costsrather than increasing the environmental quality ofthe product. If the government considers an averagetreatment cost and an average environmental impactfor broad product categories and then imposes thetargets accordingly, this may not create incentives forthe manufacturers to design greener products. Notethat this is precisely what the WEEE Directive does!
One manager from a global computer manufacturermade the following statement during our interview atthe WEEE Directive Series held at INSEAD (seewww.insead.edu/weee): ‘‘We would invest in theenvironmental specs only if we could benefit fromthose. If I am going to collect some competitor’s non-recyclable computers, why should I invest in recycla-ble computers with better environmental quality?’’The important message here is that individual pro-ducer responsibility is ‘‘the key’’ to efficient and fairlegislation. The take-back legislation may lead to betterenvironmental outcomes if every single manufacturer isresponsible for what he produces. It seems that the betterway of implementing such legislation is enforcing moreindividual producer responsibility. If every manufac-turer were responsible for his product’s environmentalquality and the targets were set up accordingly, thefairness issue could be solved. The current WEEE Di-rective unfortunately signals important free ridingopportunities to high environmental hazard productmanufacturers with low recycling costs.
Naturally, the practical feasibility of individual pro-ducer responsibility legislation is not obvious.Measuring the environmental quality of each productfrom each manufacturer, and monitoring all collectionand recovery activities is a very difficult task. This isprobably the reason why the legislators have not cho-sen this alternative. Nevertheless, the parties thatcould benefit from individual responsibility would bewilling to invest in systems to assure individual pro-ducer responsibility. In our context, these playerswould be the firms that suffer from fairness issues,and the green organizations. Recalling the BusinessWeek example (Woellert 2006) on computer take-back,there is a message to the green manufacturer: lobby-ing for the inclusion of environmental impact into thetake-back legislation can be wiser than fightingagainst the legislation.
3.4. Consumer Education and MarketingCulture plays an important role in the efficiency oftake-back legislation. If the end-users do not returnproducts, reaching collection targets may not befeasible. Practical evidence from European countries
Atasu, Van Wassenhove and Sarvary: Efficient Take-Back Legislation250 Production and Operations Management 18(3), pp. 243–258, r 2009 Production and Operations Management Society

supports this argument because collection rates aresignificantly different. Kim (2002) shows that this isthe case under the European End-of-Life VehicleDirective. While very high collection rates (estimatedaround 99%) have been achieved in Sweden, the col-lection rates in the United Kindom are significantlylower (estimated around 50%). Boelen (2006) pointsto a similar result in household waste collection inEurope. While the household waste processing per-centage in Sweden is 86%, this rate goes down to 26%in the United Kingdom. Therefore, achieving collec-tion targets not only requires collection systems butalso end-user consciousness. So far, we assumed thatthe level of collection could be chosen by the socialplanner without incurring any cost. Higher collectionrates may require additional effort (i.e., for B2C typesof products this would mean educating consumers,advertising, etc.) in different societies.
In this section, we extend our competition model toaccount for the social planner’s cost of consumer ed-ucation a. The social planner incurs ac2 additional costto ensure the collection level c.
PROPOSITION 3. The optimal decision of the educatingsocial planner under competition (of n firms) can be sum-marized as in the Table 4. The optimal collection rate is
decreasing in collection and recycling costs (r) and cost ofeducation (a), and increasing in the degree of competition(n) and cost to the environment (e).
Proposition 3 states that the optimal collection rateis decreasing in the cost of education, which is quiteintuitive. Figure 5, on the other hand, points to aninteresting question: Who carries the burden for thecost of education?
Consider Figure 5a first. In this figure, the cost ofeducation is neither reflected on manufacturers, noron consumers. In this case, the environmental benefitsare decreasing in the cost of education and the cost ofeducation is carried solely by the environment. Bothmanufacturer profit and consumer surplus are in-creasing in the cost of education because the higherthe cost of education, the lower the collection rate.This results in lower manufacturer costs and thusprices for the products. Lower costs and prices in-crease manufacturer profits and consumer surplus. Inthis case, both manufacturers and consumers are bet-ter off with consumers that are harder to educate.Educating consumers is not beneficial to these play-ers, which seems to resemble an ostrich’s policy.When the end-users do not care about the environ-ment, it is the environment that suffers. The currentsituation in the United States may be an example ofsuch cases because no active consumer educationpolicy is observed.
Figure 5b shows how the situation changes whenthe consumer behavior is altered. When the consum-ers consider the environmental burden as a cost totheir budget, the situation is different. In this case theconsumer welfare can be represented as the sum ofeconomic consumer surplus and the environmental
Table 4 Optimal Solutions for Educating Planner Given the PossibleParameter Realizations
e � ð1�mÞr1�mþrnþ2nþ1
� � ð1�mÞr1�mþr
nþ2nþ1
� �� e � r nþ2
nþ1
� �
þ 2a1�m�r
nþ1n
� �e � r nþ2
nþ1
� �
þ 2a1�m�r
nþ1n
� �
c� 0 �1þmð Þ n 2þnð Þ rþe n 1þnð Þ 1�mþrð Þ2 a 1þnð Þ2 þn r 2 e 1þnð Þ� 2þnð Þrð Þ
1
Reflection of cost of education on the manufac-turer profit, consumer surplus, and environmentalsavings (at the optimal collection rate)
Reflection of cost of education on the man-ufacturer profit, and consumer surplus when theconsumer bears the environmental costs (at theoptimal collection rate)
(a) (b)
α
α
Figure 5 Collection Impact for n 5 1, l 5 0.2, q 5 0.2 and r 5 1
Atasu, Van Wassenhove and Sarvary: Efficient Take-Back LegislationProduction and Operations Management 18(3), pp. 243–258, r 2009 Production and Operations Management Society 251
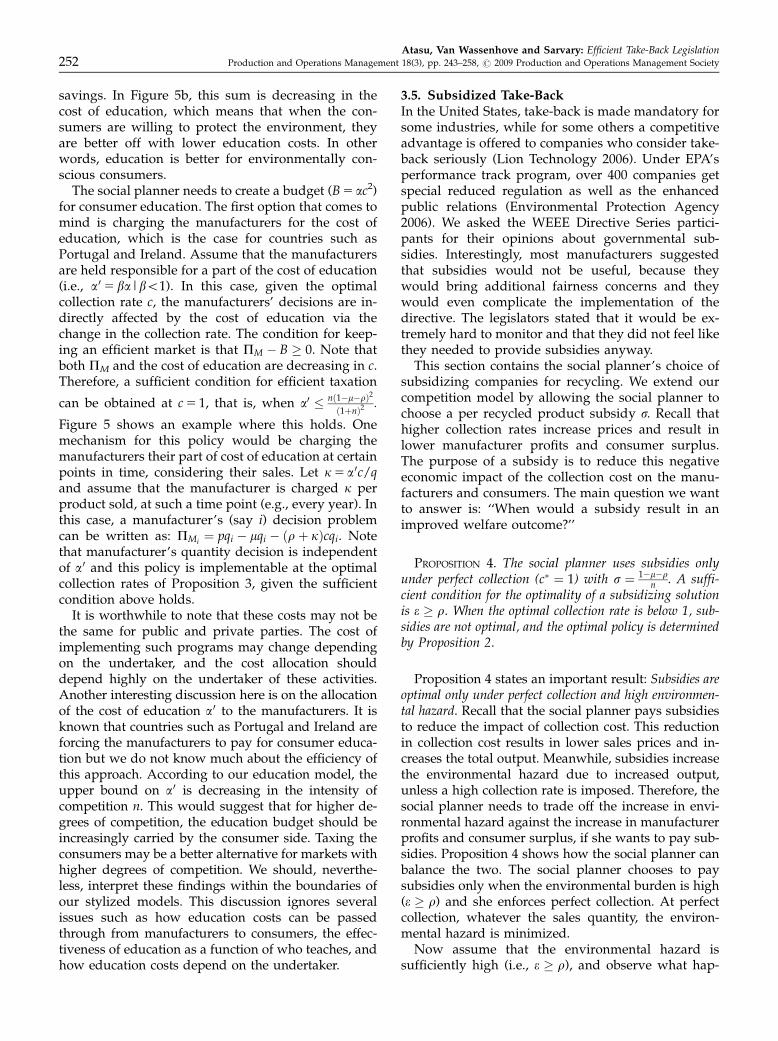
savings. In Figure 5b, this sum is decreasing in thecost of education, which means that when the con-sumers are willing to protect the environment, theyare better off with lower education costs. In otherwords, education is better for environmentally con-scious consumers.
The social planner needs to create a budget (B 5 ac2)for consumer education. The first option that comes tomind is charging the manufacturers for the cost ofeducation, which is the case for countries such asPortugal and Ireland. Assume that the manufacturersare held responsible for a part of the cost of education(i.e., a05 ba|bo1). In this case, given the optimalcollection rate c, the manufacturers’ decisions are in-directly affected by the cost of education via thechange in the collection rate. The condition for keep-ing an efficient market is that PM � B � 0. Note thatboth PM and the cost of education are decreasing in c.Therefore, a sufficient condition for efficient taxation
can be obtained at c 5 1, that is, when a0 � nð1�m�rÞ2
ð1þnÞ2 :
Figure 5 shows an example where this holds. Onemechanism for this policy would be charging themanufacturers their part of cost of education at certainpoints in time, considering their sales. Let k5 a0c/qand assume that the manufacturer is charged k perproduct sold, at such a time point (e.g., every year). Inthis case, a manufacturer’s (say i) decision problemcan be written as: PMi
¼ pqi � mqi � ðrþ kÞcqi. Notethat manufacturer’s quantity decision is independentof a0 and this policy is implementable at the optimalcollection rates of Proposition 3, given the sufficientcondition above holds.
It is worthwhile to note that these costs may not bethe same for public and private parties. The cost ofimplementing such programs may change dependingon the undertaker, and the cost allocation shoulddepend highly on the undertaker of these activities.Another interesting discussion here is on the allocationof the cost of education a0 to the manufacturers. It isknown that countries such as Portugal and Ireland areforcing the manufacturers to pay for consumer educa-tion but we do not know much about the efficiency ofthis approach. According to our education model, theupper bound on a0 is decreasing in the intensity ofcompetition n. This would suggest that for higher de-grees of competition, the education budget should beincreasingly carried by the consumer side. Taxing theconsumers may be a better alternative for markets withhigher degrees of competition. We should, neverthe-less, interpret these findings within the boundaries ofour stylized models. This discussion ignores severalissues such as how education costs can be passedthrough from manufacturers to consumers, the effec-tiveness of education as a function of who teaches, andhow education costs depend on the undertaker.
3.5. Subsidized Take-BackIn the United States, take-back is made mandatory forsome industries, while for some others a competitiveadvantage is offered to companies who consider take-back seriously (Lion Technology 2006). Under EPA’sperformance track program, over 400 companies getspecial reduced regulation as well as the enhancedpublic relations (Environmental Protection Agency2006). We asked the WEEE Directive Series partici-pants for their opinions about governmental sub-sidies. Interestingly, most manufacturers suggestedthat subsidies would not be useful, because theywould bring additional fairness concerns and theywould even complicate the implementation of thedirective. The legislators stated that it would be ex-tremely hard to monitor and that they did not feel likethey needed to provide subsidies anyway.
This section contains the social planner’s choice ofsubsidizing companies for recycling. We extend ourcompetition model by allowing the social planner tochoose a per recycled product subsidy s. Recall thathigher collection rates increase prices and result inlower manufacturer profits and consumer surplus.The purpose of a subsidy is to reduce this negativeeconomic impact of the collection cost on the manu-facturers and consumers. The main question we wantto answer is: ‘‘When would a subsidy result in animproved welfare outcome?’’
PROPOSITION 4. The social planner uses subsidies onlyunder perfect collection (c� ¼ 1) with s ¼ 1�m�r
n . A suffi-cient condition for the optimality of a subsidizing solutionis e � r. When the optimal collection rate is below 1, sub-sidies are not optimal, and the optimal policy is determinedby Proposition 2.
Proposition 4 states an important result: Subsidies areoptimal only under perfect collection and high environmen-tal hazard. Recall that the social planner pays subsidiesto reduce the impact of collection cost. This reductionin collection cost results in lower sales prices and in-creases the total output. Meanwhile, subsidies increasethe environmental hazard due to increased output,unless a high collection rate is imposed. Therefore, thesocial planner needs to trade off the increase in envi-ronmental hazard against the increase in manufacturerprofits and consumer surplus, if she wants to pay sub-sidies. Proposition 4 shows how the social planner canbalance the two. The social planner chooses to paysubsidies only when the environmental burden is high(e � r) and she enforces perfect collection. At perfectcollection, whatever the sales quantity, the environ-mental hazard is minimized.
Now assume that the environmental hazard issufficiently high (i.e., e � r), and observe what hap-
Atasu, Van Wassenhove and Sarvary: Efficient Take-Back Legislation252 Production and Operations Management 18(3), pp. 243–258, r 2009 Production and Operations Management Society

pens with the legislation. Proposition 4 states thatin this case s ¼ 1�m�r
n , and perfect collection (c� ¼ 1)is optimal. The optimal sales quantity q� ¼1�mþ1�m�r
n �r1þn ¼ 1�m�r
n , and the optimal price p� ¼ mþ r.
This quantity-price pair gives us the perfect compe-tition outcome. In other words, the legislation makessure that at optimality the perfect competition out-come is obtained. At this solution, the consumersurplus is maximized at PC ¼ ð1�m�rÞ
2
2 (as the situationis perfect competition), the environmental damage isminimized (PE 5 0), and the total manufacturer profitis PM ¼ 1�m�rð Þ2
n 40:Similarly to the previous section, an important prob-
lem is creating a budget for the subsidy. Thegovernment needs to create a budget of size Oðc�; s�Þ ¼s�cq�n ¼ ð1�m�rÞ
2
n � PC; 8n41: Thus, this policy isimplementable if the budget is created from consumers.
Even though we assumed a perfect setting in ourmodel, where there are no fairness concerns, subsi-dizing did not turn out to be an effective strategy. Ourstylized model suggests that subsidizing is not alwaysoptimal because of the increased environmental bur-den due to increased output. Especially when thetreatment costs are sufficiently high (i.e., r4e) andperfect recovery is expensive, the social planner doesnot subsidize. Without a subsidy, the social plannerchooses an imperfect collection policy to protect themanufacturers and consumers.
4. Extension: The Impact of CostStructure
It is important to understand the impact of the take-back cost structure because different cost structures areobserved in practice. Our interviews with Europeanelectrical and electronic equipment manufacturersand treatment providers have suggested two types ofcost structures: (i) treatment costs linear in the ratesand (ii) treatment costs increasing in the rates. Fur-thermore, sometimes recycling can be profitable andmanufacturers may be better off with take-back. Ex-amples of such cases include cell phones and productswith high steel volume, where material recovery cancompensate for the costs of collection and recycling.
We have discussed the costly take-back situationunder linear treatment costs in the previous section. Inthis section, we consider the impact of non-linear costsand profitable take-back. We first consider the impactof non-linear recycling costs. Then, we look at theimpact of non-linear collection costs. Finally, we con-sider the case of profitable take-back.
4.1. Non-Linear Recycling CostsThe manufacturers we interviewed suggested that re-cycling costs can sometimes be increasing in the
recycling rate. This is usually the case when higherrecycling rates require more advanced and costlierrecycling technologies. To take this into account,we change our treatment cost structure tofðr; cÞ ¼ wcþ rr2c, i.e., the recycling cost increasesquadratically in the recycling rate.
Recall that under the linear cost assumption, therecycling rate had to be selected at its upper bound.This logic is no longer true if the marginal cost ofrecycling is increasing in the recycling rate.
PROPOSITION 5. Assume increasing marginal recycling
costs with fðr; cÞ ¼ wcþ rr2c. When the optimal collectionrate c� 2 ð0; 1Þ, the upper bound on the optimal recycling
rate is given as �r� ¼ffiffiwr
qwhen w � r and �r� ¼ 1 otherwise.
Proposition 5 states that the linear case logic nolonger applies. There exists an economic upper boundon the optimal recycling rate to be imposed by thesocial planner that is given by �r� ¼
ffiffiwr
q. Note that
when w is higher than r, the optimal recycling rate isset at 1, which is the natural upper bound. On theother hand, when w is lower than r, only a certainproportion of collected items will be recycled.
This result can be explained when �r� is replacedin the manufacturer’s treatment cost f(r, c). At�r� ¼
ffiffiwr
q; rr2cq ¼ wcq. This leads to the interpretation
that the optimal recycling rate should be chosen at thepoint where the marginal cost of recycling is equal tothe marginal cost of collection. We call �r� ¼
ffiffiwr
qthe
economically efficient recycling rate. (For similar eco-nomic bounds see Geyer et al. 2007.) It is interesting tonote that the economically efficient recycling rate isindependent of the cost to the environment e. The onlything that drives the recycling rate is the relationbetween marginal collection and recycling costs.However, the optimal collection rate c in the interiorregion, as given below, does depend on e:
c� ¼
0 if e � 3 � ffiffiffiffiwrpð Þþm ffiffiffiffiwrpð Þ�1þm�2
ffiffiffiffiwrp
1 if e � 3ð�ð ffiffiffiffiwrp Þþ2w32ffiffirp þm ffiffiffiffiwrp Þ
�1þ4wþm�2ffiffiffiffiwrp
eð�1þmÞþ ffiffiffiffiwrp ð3�2e�3mÞ
�4weþ6w32ffiffirp o=w
8>>>>><>>>>>:
ð9Þ
Increasing the environmental hazard measure edoes not affect the optimal recycling rate but increasesthe optimal collection rate up to perfect collection, i.e.,c 5 1. In other words, when e is sufficiently low, thesocial planner uses the collection rate as the maindriver of the legislation and sets the recycling rate at theeconomically efficient level defined above. On the otherhand, once the environmental hazard measure e issufficiently high to require perfect collection, the envi-ronmental concerns outweigh the economic concerns,and the optimal recycling rate increases in e. The
Atasu, Van Wassenhove and Sarvary: Efficient Take-Back LegislationProduction and Operations Management 18(3), pp. 243–258, r 2009 Production and Operations Management Society 253

imposed recycling target exceeds the economicallyefficient recycling rate as the following example shows:
EXAMPLE 4. Assume that m5 0.2, w5 0.05, and r5 0.1.Then using equation 9, for e40.200281, the optimal col-lection rate is c 5 1. Figure 6 shows that the optimalrecycling rate is increasing in the cost to the environmentwhen e exceeds this threshold for perfect collection.
4.2. Non-linear Collection CostsSimilar to the recycling cost, the linear collection costassumption can be questioned, depending on the wayreturns are collected. Manufacturers may have to col-lect the used products in one of two ways: from publiccollection centers or directly from consumers. Whenthe returns are collected from public centers, the linearcollection cost assumption would be suitable for themanufacturers. On the other hand, when the manu-facturers have to collect from individuals, thisassumption may not be reasonable. The cost of reach-ing additional individuals may increase as thecollection rate increases (see Savaskan et al. 2004,for instance). The answers we obtained from ourinterviews also suggested this. While a significantproportion of manufacturers and treatment providersnoted linear costs in the collection rate, others didsuggest increasing collection costs.
To model the increasing marginal collection cost, weslightly change our treatment cost structure andassume that fðr; cÞ ¼ wc2 þ rrc.
PROPOSITION 6. Assume increasing marginal collectioncost with fðr; cÞ ¼ wc2 þ rrc. The recycling target (as apercentage of the collected returns) r should always be se-lected at its upper bound (r 5 1) for c40.
Proposition 6 states that, under the increasingmarginal collection cost assumption with fðr; cÞ ¼wc2 þ rrc, the policy from the linear cost model ap-plies. In other words, when the marginal collection
cost is quadratically increasing in the collection rate,the recycling rate should still be selected at its upperbound and the collection rate should be selecteddepending on the cost parameters. Unfortunately,with this assumption, the optimal collection rate can-not be obtained in simple closed form. Nevertheless,the optimal collection rate can be calculated numer-ically for any parameter setting, and the behavior ofthe optimal collection rate is similar to its behaviorunder the linear cost assumption.
The investigation of non-linear collection and recy-cling costs extend the interpretation of our resultsfrom the base model with linear cost assumptions.Our results suggest that at the optimal welfare out-come, one of the two instruments (collection rate orrecovery rate) is always at its upper bound. The upperbound on the collection rate is a physical one, i.e., onecannot collect more than what is available. The effi-cient recycling rate on the other hand has an economicupper bound when the environmental hazard of theproduct is low, and one needs to compare the marginalcosts of recycling and collection to determine thisbound. We expect that these findings hold for otherforms increasing marginal cost functions, but thislevel of generalization is beyond our scope.
4.3. Profitable RecyclingSeveral examples from industry show that firms canmake a profit by recycling or reusing product returns(Geyer et al. 2007, Krikke and Zuidwijk 2006). Forcertain industries and product categories, these op-tions can be quite attractive. Therefore, it is importantto consider the cases where recovery of used productsis beneficial to the manufacturer.
To consider the profitable take-back cases, wechange our base model slightly. The consumer partof the model remains the same, i.e., p 5 1� q. We con-sider a monopolist, who has the option to collect andrecycle used products for profitable material recovery.
Manufacturer: Similar to the base model, it costs m toproduce a unit to the monopolist. The net benefit ofrecycling (revenue from recycling minus cost of recy-cling) a used product is denoted by r. Collectingrecyclable products is costly and collection cost de-pends on the collection rate. When the monopolistchooses a collection rate of g, it costs wg2 to collect eachproduct. The reason for this assumption is that whenthe manufacturer is willing to beat the natural sup-ply/demand side limitations, he has to put effort (e.g.,collect faster to catch the market, invest in better re-covery technology, go to consumers for collection).Furthermore, this was the suggestion of a significantproportion of the manufacturers and service provid-ers we interviewed. We skip the linear collection costcase, which is trivial, as it leads to a binary solutiondepending on the sign of r� w.
Figure 6 Optimal Recycling Rate at Perfect Collection
Atasu, Van Wassenhove and Sarvary: Efficient Take-Back Legislation254 Production and Operations Management 18(3), pp. 243–258, r 2009 Production and Operations Management Society
Note that, in this case, the monopolist’s collectiondecision is not the same as the social planner’s im-posed collection rate c. The monopolist’s g can belarger than the imposed target c. Under these as-sumptions, the take-back cost is written as fðgÞ ¼wg2 � rg.
The manufacturer’s objective is
maxq;g
PM ¼ qðp� mþ rg� wg2Þ
s:t: c � g � 1:
Assuming the manufacturer has positive margins(1� m� w40) and recovery is profitable (r4w), themanufacturer’s optimal decisions given the imposedrecovery target c are summarized in the followinglemma:
LEMMA 1. When c � r=2w � 1, q� ¼ r2þ4 wð1�mÞ8 w and
g� ¼ r=2w. However, when r=2w � c � 1, q� ¼ 1�mþcðr�cwÞ2
and g� ¼ c. Otherwise, g� ¼ 1 and q� ¼ 1�mþr�w2 .
Social planner: Lemma 1 shows that when the im-posed collection rate c is less than r=2w, the collectionrate chosen by the manufacturer will be higher thanthe imposed target. Therefore, we focus on the rele-vant case and develop the social planner’s problembelow. In this formulation, we assume that the costof consumer education a is endogenized in w and thesocial planner does not provide subsidies (s5 1).
maxc
W ¼ PM þPC þPE
s:t: r=2w � c � 1;
where PC ¼ ð1� pðq�ÞÞq�=2 and the environmentalsavings PE ¼ �eð1� cÞq�.
Proposition 7. Assume r � 2w. Then the imposed re-covery target is c� ¼ r=2w40 even at e5 0. Moreover,c� is monotonically increasing in the cost to theenvironment e. When r42w, c� ¼ 1.
Proposition 7 states that the intuition under thebenefit model is similar to that of the cost models, i.e.,higher recovery targets are required for higher envi-ronmental hazard and lower recovery costs (i.e., loww). Nevertheless, there is an important difference inthe social planner’s strategy. When recovery is profit-able, the optimal collection rate is positive even atzero environmental hazard, while under costly recov-ery the optimal rate in this case would be zero. Thereis an intuitive explanation to that: when recovery isprofitable, the unit manufacturing cost to the manu-facturer decreases in the recovery rate, increasing themanufacturer profit. This is reflected in the sales price,increasing the consumer surplus. At the same time,
the total hazard to the environment is reduced withhigher recovery rates. This means that all the elementsof the total welfare are improved with profitablerecovery.
We finalize this section by noting that we did notconsider a competition scenario. Previously, we haveconsidered only market competition for the sales ofnew products as recovery was costly and manufac-turers would not benefit from it. When recovery isbeneficial, however, manufacturers may have to com-pete for the acquisition of returned products. We referthe reader to Atasu et al. (2008a, b), Ferguson andToktay (2006), and Majumder and Groenevelt (2001)for a discussion of how the profitable product returnsimpact competition.
5. Discussion and Summary of ResultsThis paper presents a model, an abstraction of a fewkey elements that can be influential in a take-backlegislation context. With our stylized economic model,we consider the impact of take-back legislation on theeconomy and look at the efficiency of existing policiessuch as the WEEE directive of the European Com-mission. We argue that the weight (mass) baseddirectives and the weight-based categorization ofproducts may not necessarily be efficient (neither eco-nomically nor ecologically). A better categorization ofproducts and the selection of targets would consider:(i) the treatment cost or the benefit from recycling, (ii)the environmental impact of the product, (iii) thewillingness-to-pay of customers for the decrease inthe environmental impact, and (iv) the competitionintensity of the specific market. (See Huisman et al.2008, a recent study financed by the European Com-mission for similar empirical findings.)
We also argue that, although the WEEE legislationwas aimed at creating incentives for environmentallyfriendly designs, the manufacturers have not seenmuch incentive there. According to our stylized mod-els, it appears that a required adjustment to the WEEEdirective is the inclusion of individual producer re-sponsibility, where targets are set with respect toenvironmental measures. This would provide betterincentives for manufacturers to create more environ-mentally efficient designs considering future producttake-back. In a take-back framework, setting targetsfor an industrial category, e.g., IT equipment,may result in cost competition instead of creatingenvironmental design incentives. With individualresponsibility, the fairness/free-riding concerns ofthe manufacturers can also be addressed, i.e., who-ever creates the least environmental impact gets themost benefit or pays the least. We should also notethat we have ignored the impact of economies of scalethat can be obtained via collective systems. It is truethat collective systems may come with a cost advan-
Atasu, Van Wassenhove and Sarvary: Efficient Take-Back LegislationProduction and Operations Management 18(3), pp. 243–258, r 2009 Production and Operations Management Society 255
tage, however, it seems that free rider avoidance ismost important from the manufacturer perspective.Thus, the best application of a collective system seemsto be where cost allocation is done according to theenvironmental contribution of manufacturers.
Copying environmental legislation does not seem tobe a healthy approach. Even in our stylized setting,the targets need to be adjusted to the cost, environ-mental impact, and to the competition level differencesin the industry. This means that copying existingWEEE-type legislation may not lead to improved wel-fare outcomes, as different regions of the world mayface different cost structures, environmental conscious-ness levels, and competition.
Consumer education is very important for the effi-ciency of take-back legislation. However, consumereducation is costly and consumer consciousness toenvironmental policies is crucial for the efficiency oftake-back legislation. It is known in the European ex-ample that some member states are trying to pushmanufacturers to pay for consumer education. Thiscost may harm industries working with small profitmargins and it is not clear to which extent manufac-turers should be responsible for consumer education.An education policy that is optimal in one state maynot be optimal in another, unless the market structureand consumer preferences are in line. Thus, furtherresearch taking into account real life complexities ofconsumer education and identifying cost allocation ofconsumer education on manufacturers and consum-ers is essential.
Governments may also consider the possibility ofrewarding manufacturers for recycling, but it is im-portant to know when this would help improve totalwelfare in the system. According to our models, sub-sidizing is not optimal unless the environmentalhazard of the product is very high and perfect collec-tion is optimal. Otherwise, subsidies may increase thetotal output and hence the environmental impact. Thissuggests that subsidies may be more meaningful forproducts that are environmentally hazardous andcostly to recycle, e.g., batteries.
Another issue to be mentioned is that the targetsetting approach in the European Directive need notbe the only way of designing legislation. Unlike theWEEE Directive, there is no collection target inthe Japanese take-back legislation for white goods(Japanese Ministry of Environment 2005). In Japan,consumers are responsible for returning products tocollection facilities and pay for recycling related costs.The Californian Directive on the other hand chargesconsumers a fixed fee at the moment of sales. Al-though our models can easily be adapted to thesedifferent models, the undertaker of the treatment canbe different under different forms of legislation, aswell as the incentives and the transaction costs in-
volved. The performance of different forms oflegislation is a promising research subject.
There are several other future research directions inthis context. We did not specify the undertaker of thetake-back activity. In our models, the undertaker ofany take-back activity, e.g., collection, recovery oreven consumer education, incurs the same cost. Inpractice, however, these costs may differ dependingon the undertaker. The cost differences between pub-lic and private parties can also drive the efficiency ofsuch systems.
Next, academia has to compare the environmentalimpact of reuse and recycling. According to the WEEEDirective, reuse is defined as any operation by whichWEEE, or components thereof, are used for the samepurpose for which they were conceived, including thecontinued use of the equipment or components thereofwhich are returned to collection points, distributors,recyclers or manufacturers. A detailed discussion oneconomics of product reuse can be found in Atasu et al.(2008a, b). From a waste avoidance perspective, reuseseems to be an environmentally favorable option be-cause it keeps used products away from the wastestream, and a used product can be recycled after beingreused. However, efficiency of collection systems isimportant here. If the collected amount is decreasedafter each reuse cycle and the uncollected products aredumped or land-filled, reuse may not be an environ-mentally benign option. Interestingly, the WEEEDirective favors recycling over reuse, and this seemsto be an important avenue of future research. The im-pact of legislation on international trade is also anextremely important issue (Kalimo 2006). Research onthe impact of take-back legislation on internationaltrade is required to create suggestions for countriesthat would like to attract foreign investors.
AcknowledgmentsThis paper is a part of first author’s dissertation re-search at INSEAD. We thank Paul Kleindorfer for hishelpful comments at all stages of this work.
Appendix A
A.1. European Legislation
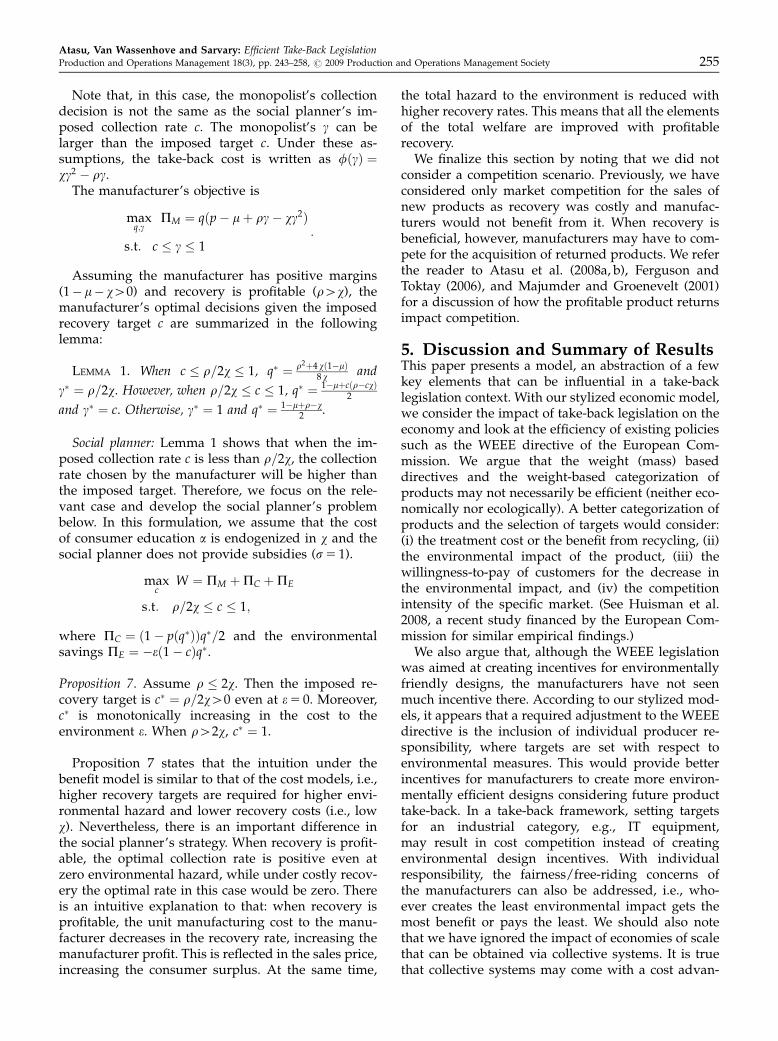
Table A1 EU Legislation for Batteries and Accumulators (Percentages ofTotal Weight)
Collection Level
Recycling level
Lead-acid type Ni–Cd type
OthersLead Overall Cd Overall
4160 gr/inhabitant and 480% 100% 65% 100% 75% 55%
Atasu, Van Wassenhove and Sarvary: Efficient Take-Back Legislation256 Production and Operations Management 18(3), pp. 243–258, r 2009 Production and Operations Management Society
A.2. Discussion of Assumptions
A.2.1. Free Disposal. Our models assume freedisposal. One could also include the disposal cost ofnon-recycled items in the model, but this cost can beinternalized in the current form of it. Assume a perdisposed item cost of d is incurred by the manufacturer.Then the profit per product of the manufacturer can bewritten as : PM=q ¼ p� m� wc� rrc� dcð1� rÞ ¼ p�m� ðwþ dÞc� ðr� dÞrc. Letting w01w1d and r05r� d,the same formulation can be obtained.
A.2.2. Linear Additivity in Welfare. Our represen-tation of total welfare requires linear additivity inthe measures used. One can assume that theenvironmental measure PE can be adjusted by playingwith the e parameter. However, having the PM and PC
have the same impact may not be a reasonableassumption all the time. In real life, trade associationsexist and the lobbying power of the manufacturers canhave an impact on the targets. (Recall the wayparameters were set in the WEEE case.) This suggeststhat there is a coefficient of power in front of PM, i.e.,W ¼ lPM þPC þPE. From an optimizationperspective this is equivalent to having a constraint inthe objective function such as PM � P0 where l isequivalent to the dual of this constraint. By definition
PM is bounded between �PM ¼ ð1�mÞ2
4 and PM ¼ð1�m�w�rÞ2
4 and it is decreasing in c and r. Thus any P0
between PM and �PM can be represented as acombination of upper bounds on r and c. This, in turn,is equivalent to having upper bounds on the decisionvariables and is already in the formulation.
A.2.3. Integrated Manufacturer and TreatmentProvider. The cost to the polluter can be the income ofthe environmental service company, which will decreasethe macro-economic cost to the economy as a whole(Ekins 2005). We note that when discussing the economicimplications of such policies we have ignored the factthat recycling in itself can be a business opportunity andassumed that the manufacturer handles the recyclingoperations. In general, however, these activities arehandled by third party treatment providers. Thus, theeconomic impact of creating business for the treatmentproviders also needs to be considered.
Considering this issue, on the other hand, compli-cates the analysis as it requires inclusion of thetreatment provider’s costs, and offers few insights.Nevertheless, it is easy to show that the inclusion ofthe treatment providers’ contribution to the socialwelfare does not add much, but it complicates theanalysis. Consider the following simple model, forinstance. Assume that there exists a treatment pro-vider, who charges the manufacturer w per productcollected and recycled. The treatment provider in-curs treatment cost Z per product. In this case, theprofit of the manufacturer is PM ¼ p�q�ð1� m� wcÞ2¼ ð1� mÞ2 � 2ð1� mÞwcþ w2c2 and the profit of thetreatment provider is PT ¼ q�cðw� ZÞð1� m� wcÞcðw� ZÞ=2. The sum of these two terms can be sim-plified to PM þPT ¼ ð1� mÞ2 � 2ð1� mÞZcþ c2ð2wZ�w2Þ. Note that the structure of this sum is very similarto the manufacturer profit alone.
References
Atasu, A., V. D. R. Jr. Guide, L. N. Van Wassenhove. 2008a. Productreuse economics in closed-loop supply chain research. Prod.Oper. Manag. 17(5): 483–496.
Atasu, A., M. Sarvary, L. N. Van Wassenhove. 2008b. Remanufac-turing as a marketing strategy. Manage. Sci. 54(10): 1731–1746.
Boelen, J. 2006. Waste as A Commodity. CLSC Workshop 2006 Pre-sentation. Erasmus University, Rotterdam.
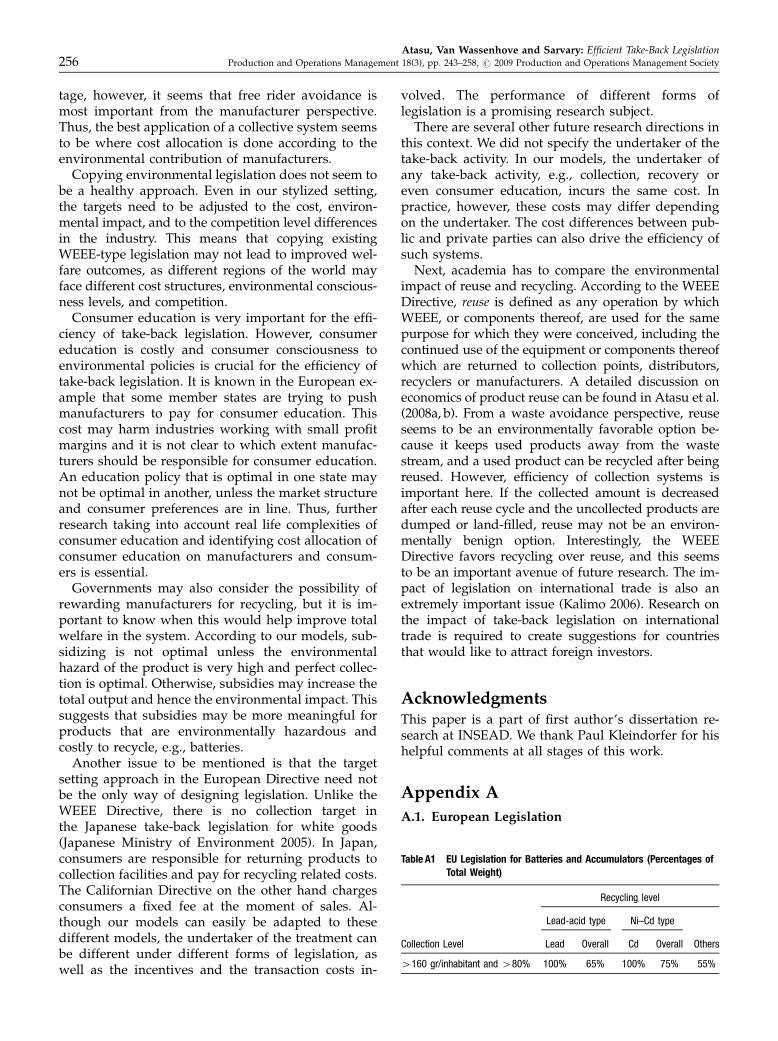
Table A2 EU Legislation for End-of-Life Vehicles (ELV) (Percentages ofTotal Weight)
Deadline Collection level
Recycling
level (%)
Recovery
level (%)
By 2005 100% of all returned 75 75
By 2006 100% of all returned 80 85
By 2015 100% of all returned 85 95
Table A3 EU Legislation for Packaging (Percentages of Total Weight)
Category Collection level
Recycling
level (%)
Recovery
level (%)
Glass, paper
and board
All in the market 60 60
Metals All in the market 50 50
Plastic All in the market 22.5 22.5
Wood All in the market 15 15
Overall All in the market 55–80 60
Table A4 Collection and Recycling Costs for Different WEEE Categories(Euros/kg)
Category
Recycling Collection
Minimum Maximum Average Minimum Maximum Average
Large household
appliances
0.20 0.42 0.31 0.07 0.17 0.14
CFC containing
appliances
0.61 1.28 0.86 0.15 0.39 0.25
Small household
appliances
0.42 0.55 0.52 0.11 0.28 0.18
IT and telecom-
munications
equipment
0.42 0.77 0.59 0.12 0.28 0.17
TV sets 0.62 0.79 0.69 0.12 0.25 0.19
Atasu, Van Wassenhove and Sarvary: Efficient Take-Back LegislationProduction and Operations Management 18(3), pp. 243–258, r 2009 Production and Operations Management Society 257

Bovenberg, A. L., L. H. Goulder. 1996. Optimal environmental tax-ation in the presence of other taxes: General equilibriumanalyses. Am. Econom. Rev. 86(4): 985–1000.
Chen, P., P. Narayan, L. N. Van Wassenhove, H. Ghaziri. 2004. TheWEEE Challenge. INSEAD Case Study. ECCH Case #304-624-1.
Ekins, P. 2005. Eco-efficiency. J. Ind. Ecol. 9(4): 12–14.
Environmental Protection Agency. 2006. Performance Track Pro-gram. Available at http://www.epa.gov/performancetrack(accessed January, 2006).
Europa-Environment. 2005a. Directive 75/442/EEC, RecoveryOperations. Available at http://europa.eu.int/eur-lex/en/consleg/pdf/ (accessed January, 2006).
Europa-Environment. 2005b. Waste. Available at http://europa.eu.int/comm/environment/waste/index.htm (accessed Janu-ary, 2006).
European Recycling Platform. 2007. European Recycling Platform.Available at http://www.erp-recycling.org (accessed January,2006).
Ferguson, M. E., L. B. Toktay. 2006. The effect of competition onrecovery strategies. Prod. Oper. Manag. 15(3): 351–368.
Fruchter, G. E., S. Kalish. 1997. Closed-loop advertising strategies ina duopoly. Manage. Sci. 43(1): 54–63.
Geyer, R., L. N. Van Wassenhove, A. Atasu. 2007. The impact oflimited component durability and finite life cycles on reman-ufacturing profit. Manage. Sci. 53(1): 88–100.
Hazilla, M., R. J. Kopp. 1990. Social cost of environmental qualityregulations: A general equilibrium. J. Politic. Econom. 98(4):853–873.
Huisman, J., C. B. Boks, A. L. N. Stevels. 2003. Quotes for Environ-mentally Weighted Recyclability (QWERTY): Concept ofdescribing product recyclability in terms of environmentalvalue. Int. J. Product. Res. 41(16): 3649–3665.
Huisman, J., F. Magalini, K. Ruediger, C. Maurer, S. Ogilvie, J. Poll,C. Delgado, E. Artim, J. Szlezak, A. L. N. Stevels. 2008. 2008Review of Directive 2002/96 on WEEE-Final Report. UnitedNations University Report, Study No: 07010401/2006/442493/ETU/G4.
Japanese Ministry of Environment. 2005. Available at Laws andRegulations. http://www.env.go.jp/en/laws (accessed Decem-ber, 2007).
Kalimo, H. 2006. E-Cycling: Linking Trade and Environmental Law inthe EC and the U.S. Transnational Publishers, Ardsley, NY.
Kim, N. 2002. Exploring Determinant Factors for Effective End-of-LifeVehicle Policy. The International Institute for Industrial Envi-ronmental Economics Thesis. Lund, Sweden.
Krikke, H., R. Zuidwijk. 2006. On the Value of Product Data Man-agement in disassembly of consumer electronic products.Tilburg University Working Paper.
Lilien, G. L., P. Kotler, K. S. Moorthy. 1992. Marketing Models.Prentice-Hall, Englewood Cliffs, NJ.
Lion Technology. 2006. Am I responsible for my customers waste?Available at http://www.lion.com/Reference_Library/Newsletter/Vol7Issue17.htm.
Majumder, P., H. Groenevelt. 2001. Competiton in remanufacturing.Prod. Oper. Manag. 10(2): 125–141.
Mayers, C. K., C. M. France, S. J. Powell. 2005. Extended pro-ducer responsibility for waste electronics. J. Ind. Ecol. 9(3):169–189.
Ruedenauer, I., C. Gensch, R. Griesshammer, D. Bunke. 2005. Inte-grated environmental and economic assessment of productsand processes. J. Ind. Ecol. 9(4): 105–116.
Savaskan, R. C., S. Bhattacharya, L. N. Van Wassenhove. 2004.Closed-loop supply chain models with product remanufactur-ing. Manage. Sci. 50(2): 239–252.
Smith, V. K., J. C. Huang. 1995. Can Markets value air quality? Ameta analysis of hedonic property value models. J. Politic.Econom. 103(11): 209–227.
Stern, N. 2006. The Economics of Climate Change. Cambridge Press,Cambridge, UK.
US State of California. 2005. Air Resources Board Updated Infor-mative Digest. Available at http://www.arb.ca.gov/regact/levii01/uid.pdf.
Woellert, L. 2006, HP wants your old PCs Back. Business Week, 10/4/2006, pp. 82–83.
Atasu, Van Wassenhove and Sarvary: Efficient Take-Back Legislation258 Production and Operations Management 18(3), pp. 243–258, r 2009 Production and Operations Management Society