Embed Size (px)
Citation preview

Production and Marketing of Vegetables
L.P. Rupasena
Research Study No. 102 February 1999
Hector Kobbekaduwa Agrar ian Research and Training Institute
1 1 4 , Wi jerama Mawatha Colombo 07
Sr i Lanka

> o 10 f 6 <f
Production and Marketing of Vegetables
Hector Kobbekaduwa Agrarian Research and Training Institute
114, Wijerama Mawatha Colombo 07 Sri Lanka
L.P. Rupasena
Research Study No. 102 February 1999
\

I S B N 955-612-035-1

F O R E W O R D
This study explores the production and marketing system of vegetables in Sri Lanka. Vegetable farming is an important source of livelihood for many farmers because it gives income in between short intervals, e.g., every week. Also, next to rice, vegetables are the most important item in the Sri Lankan diet and the cheapest source of many of the elements required for human nutrition.
The report underlines the major changes that are taking place in the vegetable sector. It shows that the centralized marketing system based on the Colombo and Kandy markets has now shifted to a more decentralized system in which production areas link with demand areas, by passing the terminal markets. This has made more opportunities for farmers to sell their vegetables and consumers are also benefited with quality vegetables at lower price. The study found that credit is one of the most important inputs in vegetable growing in the face of high input prices, but money lenders are no longer playing a major role in lending. S A N A S A is becoming very popular due to easy access. It is also found that majority of vegetable farmers are still depending on rain to water crops and hence weather is the highest risk factor.
The study stresses that many marketing problems are associated with production, and therefore a system of production planning in line with market demand is imperative. A suggestion has been made to implement area wise specialized production programmes, which ensures year round production.
This study was initiated by Mr. L.P. Rupasena Senior Research and Training Officer, and financial assistance was granted by the Sri Lanka Council for Agricultural Research Policy. My thanks are due to all of them.
Dr. S .G . Samarasinghe Director.
i i i

A C K N O W L E D G M E N T
I initiated this study to provide detailed information on vegetable production and marketing system operating in the growing areas, to diagnose problems and constrains faced by the farmers and to find ways and means to improve the production and marketing system for vegetables.
I wish to acknowledge the Sri Lanka Council for Agricultural Research Policy for financial assistance and the Director, Hector Kobbekaduwa Agrarian Research and Training Institute, for administrative support.
I am grateful to the members of the Research and Training committee, especially Professor Karunanayake of the University of Jayawardanepura, for their valuable suggestions on the draft report. Mr. R.L.N. Jayatissa, Research and Training Officer, of H A R T I , assisted me in conducting field work. Thanks are due for his services.
This study heavily depended on the primary data collected by a well trained team consisting of Messes T . G . Somaratne, N . S J . K . Nissanka, M.L. Nandasiri, U.A.S. Edussuriya, Ranjith Karunaratne, and P.G. Prasanna Kumara. Mr. K.A.S. Dayananda, Head of the Publication Unit made arrangements for publication. Mr. W. Ranasinghe edited the report and type setting of the final report was done by Mr. L.A. Palitha Gunaratne. I express my deepest thanks to all of them.
A work of this magnitude and nature cannot be carried out without the help of farmers, traders and field officers, who should provide basic information. Hence I appreciate their cooperation with much gratitude.
L.P. Rupasena
iv

C O N T E N T S Foreword i i i Acknowledgment iv List of Tables vi i Executive Summary ix
Chapter One 1
Introduction
1 .1 Background 1
1.2 Research Problem 1 1.3 Objectives of the Study 2 1.4 Methodology of the Study 2
1.5 Organization of the Report 3
Chapter Two 4
Historical Review of the Vegetable Industry
2 .1 Vegetable Production 4
2.2 Vegetable Consumption 6 2.3 Prices 2.4 Foreign Trade Chapter Three
Vegetable Farming System in the Study Area
L I B R a p. y
3.1 Socic-Economic Conditions 3.2 Vegetable Production 3.3 Production Practices 3.4 Input Use 3.5 Fertilizer Use 3.6 Labour 3.7 Credit 3.8 Productivity 3.9 Production Problems reported by Farmers
H.\K ! i
8 9 9
1 2 1 2 13 13
v
14

Chapter Four 15
Marketing System in the Study Area 15
4.1 Marketable Surplus 15
4.2 Marketing Channels 1 5 4.3 Marketing Functions 1 7 4.4 Price Formation 17
4.5 Marketing Problems Reported by Farmers 18
Chapter Five 19
Conclusions and Recommendations 19
5.1 Conclusions 19
5.2 Recommendations 2 1
References 25
Annexes 26
vi

L I S T O F T A B L E S
1 .1 Study Location and Sample Size 26 2 . 1 - A Vegetable Production - Sri Lanka 27 2 .1 -B Vegetable Production - Sri Lanka 28 2.2 Per Capita Vegetable Consumption Per Month (gms) all Island 29 2.3 Vegetable Consumption by Sectors (gms/month) 30 2.4 Seasonal Price Index - Vegetables 3 1 2.5 Amplitude of Seasonal Price Variance 32 2.6 Annual Average Retail Prices of Vegetables (Rs/Kg) 1995-1995 33 2.7 Percentage Change in Vegetable Prices 1986-1995 34 2.8 Real Price of Vegetables (Rs/kg) 35 2.9 Percentage Change in real Price of Vegetables 36 3.1 Frequency Distribution of Family Size 37 3.2 Age and Sex Distribution of the Sample Population 38 3.3 Educational Level of Sample Population 39 3.4 Occupational Pattern of Sample Population 40 3.5 Experience in Vegetable Farming 41 3.6 Classification of Vegetable Farmers by Crops 41 3.7 Importance of Vegetable Farming as an Income Source 42 3.8 Factors Affecting Selection of Crops 42 3.9 Number of Vegetable Plots Grown by a Farmer 43 3.10 Farm Size 44 3 . 1 1 Ownership Pattern of Vegetable Plots 45 3.12 Rotation of Crops 46 3.13 Patterns of Cultivation 46 3.14 Sources of Water 47 3.15 Sources of Seed Supply 48 3.16 Types of Payments for Seeds 49 3.17 Fertilizer use by Crops 49 3.18 Sources of Supply of Fertilizer 50 3.19 Type of Payments for Fertilizer 5 1 3.20 Sources of Obtaining Agro Chemicals 52 3.21 Type of Payments for Agro Chemicals 52 3.22 Use of Labour 53 3.23 Labour Use by Operations 54 3.24 Sources of Credit 54 3.25 Yield Variation Over Tune 55
vii

3.26 Production Problems Reported by Fanners 55 4.1 Marketable Surplus of Selected Vegetables 56 4.2 Marketing Outlets at Farm Level 57 4.3 Sources of Market Information 58 4.4 Marketing Problems Reported by Farmers 59
vi i i

EXECUTIVE SUMMARY
This study was initiated by the Hector Kobbekaduwa Agrarian Research and Training Institute (HARTI) for which the Sri Lanka Council for Agricultural Research Policy (CARP) provided funds. Since early 1990s vegetable has been a key commodity addressed by the Members of Parliament and media personnel. Their main concern is high prices of vegetables, which indicates that production does not match the existing demand. Why production was not increasing in line with the market demand is the research question addressed in this study.
The study is basically based on primary data collected from the sample survey. The survey was undertaken in six major vegetable producing districts; viz. Nuwara-Eliya, Badulla, Kandy, Mat2le, Kurunegala, and Anuradhapura. Both farmers and traders were interviewed using a well structured questionnaire. The farmers were chosen following the multistage random sampling technique. Market intermediaries were selected purposively. Apart from the primary data, secondary data were used to provide more information on the subject
An analysis of secondary data shows that vegetable production has declined from the mid 1980s. This is due to the reduction of extent under cultivation and productivity of the land (average yields). The area occupied with vegetables declined mainly due to the reduction of chena cultivation resulting from large scale irrigation projects, which aim at developing paddy cultivation, and cultivation of high value crops such as tobacco on regular vegetable plots. The productivity of vegetable cultivation is low because of the inferior quality of seeds and poor cultural practices.
The vegetable consumption data reveal that the per capita vegetable consumption has declined in the recent past. This is due to the decline of purchasing power of the consumers. Price analysis indicates that real prices of vegetables have increased over time. This means that prices of vegetables have gone up faster than the inflation rate. However, the price variation within the year has been somewhat curtailed, indicating that off-season cultivation has improved.
The external statistics show a rapid improvement of vegetable exports over the last two decades. Nevertheless, competition from other exporting countries, especially India, has now become a problem. As a result vegetable exports have dropped during the last two years.
ix

The survey data reveal that the educational level of the vegetable farmers remains at a higher level, suggesting that an incentive farming system could be developed. Similarly, farmers have long experience in vegetable farming. Then majority of farmers have only one vegetable plot. About 50% of vegetable plots are less than one acre in size. The owner himself grows vegetables in most cases and family labour is used extensively. Vegetable farming is the principal source of income for many vegetable farmers.
There are three methods of cultivation: (1) mono-cropping, (2) mixed-cropping, and (3) multi-cropping. The selection of the appropriate method varies from farmer to farmer and from location to location. The overall results show that single cropping is dominant (50%) followed by mixed cropping (31%). Farmers' preference to undertake single cropping is due to convenience (65%) and habits (30%), while risk minimization (45%) and maximum use of lands (34%) are the major two factors for adoption of mixed cropping. It was also observed that the majority of farmers follow crop rotation in order to increase land productivity and pest protection.
Seeds, fertilizer, agrochemicals, labour and credit are major inputs used by the vegetable farmer. Input market is dominated by the private sector. Transactions are mainly done on immediate cash payment basis. However, money lenders are not prominent in the credit market due to the accessibility to "Sanasa", Rural Development Banks and * output traders' who purchase vegetables from the farmer. In the case of labour, family labour is widely used.
The major production problems faced by farmers are high input cost, lack of finance, water availability, quality seeds and poor extension service.
The marketable surplus for vegetables is 90.62% on an average. The wastage at farm level is around 5% of the production. Farmers undertake some marketing functions such as cleaning, sorting, transporting and packing, but they do not pay proper attention to these activities. The private sector is handling the entire marketing of vegetables in the study area. Although farmers have options in selling vegetables, the village collector dominates at the farm level. The quantum of supply is the principal factor which influences price setting. The farmers' bargaining power is weak due to the absence of timely and reliable market information. Farmers receive price information from traders, which is not an independent source.
x

Fanners mainly complained about the low prices received by them, poor road facilities, difficulties and malpractices in selling.
Recommendations to develop the vegetable sector are presented in the final chapiter. Here, the need for a production plan in line with the market demand, improvement of research and extension, organization of fanners, development of infrastructure facilities and enhancement of market competition have been stressed.
xi

C H A P T E R O N E
Introduction 1.1 Background
Next to rice, the vegetable sub-sector is the most important in the agricultural sector. As with rice, vegetables are grown throughout the country and a large number of fanners are engaged in it. Most of the farmers in the hil l country derive their primary income from vegetable farming. Similarly, some of the paddy fields in urban areas are occupied by vegetables and this tendency is on the increase.
Vegetables are not only important for the farming community, but also for the consumer as well. An average consumer spends nearly 6% of his expenditure on vegetables (Consumer Finance Survey, 1986/87, Central Bank of Sri Lanka). Since vegetables account for 9% of the consumer basket of the Cost of Living Index (CPI), prices of vegetables affect the cost of living significantly. Vegetable consumption contributes to an increase in the nutritional level of the people, especially the poor, because vegetables are the cheapest source out of many of the elements required for human nutrition.
From the export point of view, this sub-sector has a vast potential. The total fruit and vegetable exports have increased from Rs. 29 million in 1979 to Rs. 945 million in 1995 with a peak of Rs 1099 in 1994. The export of processed fruits and vegetables has increased from Rs 24 million in 1979 to Rs 528 million in 1995.
12 Research Problem
In spite of vegetables being one of the most important sub-sectors in the Sri Lankan economy, its development has been relatively poor. The per capita availability of vegetables was 90.10 grams/day in 1991 , which is almost similar to the 1975 level of 90.23 grams/day. The situation is even worse when we examine the actual consumption. The per capita vegetable consumption in 1986/87 was
1

80.81 grams/day, a decline by over 5% from 85.45 grams/day in 1981/82. According to the Medical Research Institute recommendations, the per capita requirement of vegetables amounts to 156.69 grams/day. Thus it is visible that there is a big gap between the requirements for human nutrition and the availability, as well as the actual consumption.
This study attempts to examine problems and constraints hindering the development of the vegetable sector through an indepth analysis of the existing situation.
13 Objectives of the Study
The principal objective of the study is to describe and analyze the organization, operation and performance of the vegetable industry, with special reference to the farming sector. The specific objectives are:
1 . To examine the production characteristics of vegetable farming, 2. To ascertain marketing activities operated at farm level, 3. To identify and diagnose problems and constraints to the efficiency
as well as the productivity and profitability of vegetable farming, and
4. To make policy recommendations towards the development of the vegetable industry.
1.4 Methodology of the Study
This study is basically based on primary data collected from the two sample surveys; one from farmers and the other from market intermediaries. In addition, key personnel who are knowledgeable on the subject concerned were interviewed. Apart from the primary data, secondary data from the Department of Census and Statistics and the Department of Customs, and published records such as seminar papers, articles, monographs and research studies were gathered as supplementary information for the study.
In the case of farmers, the sample was selected in four stages. In stage one, districts were selected purposively taking into account the volume of production and the type of vegetables. Accordingly six districts were identified for the study. They are Nuwara E l i y a , Badul la, Kandy, Matale, Kurunegale and Anuradhapura. These districts contribute more than 50% to the total production in the country.
2

In stage two, major producing areas were selected through consultation with the district staff related to agriculture. The sample unit in this stage was the Agrarian Service Centre (ASC) and two were chosen from each district, except in Kandy where one A S C was selected because vegetable cultivation is spread only in a limited area in comparison to other districts.
In the third stage, one area consisting of at least ISO farm families, which grow vegetables, from each A S C were selected after discussing with the A S C officers.
In the final stage, farm families were chosen randomly from the each area selected. The sample size was originally fixed at 30 per village, but some families had to be left out at the time of editing the data. Information on sample is presented in Table 1 . 1 .
Selection of intermediaries was performed purposively, because random selection was not possible due to lack of information. Intermediaries at primary level, that is at farm level, were identified through the farmer survey and the following links were identified through them. The same procedure was applied for other steps as well.
Data were collected through personal interviews by a research team consisting of two Research Officers and five Research Assistants using a well structured questionnaire. The entire team was in the field during the time of the farm survey which was conducted from April to August in 1994.
1.5 Organization of the Report
This report consists of five chapters. The first Chapter is the introduction in which importance of the study area, the need for the study, and methodology adopted for the study are explained. A historical review of the vegetable sector with special reference to production, consumption, prices and external trade is discussed in Chapter two. The primary data collected through the survey are reviewed in Chapters three and four. The report ends with conclusions and recommendations which appear in Chapter five.
3

C H A P T E R T W O
Historical Review of the Vegetable Industry
This Chapter reviews the past performance of the vegetable sub-sector with special reference to production, consumption and prices. Production is an indicator to monitor progress of vegetable farming. A review of consumption shows the change in vegetable consumption. Price analysis indicates the market operation. Tune series data collected by the Department of Census and Statistics (production data) and the Central Bank of Sri Lanka (consumption data) and the Hector Kobbekaduwa Agrarian Research and Training Institute (price data) are used for this exercises.
2.1 Vegetable Production
Table 2 .1 shows the vegetable production by varieties for the period 1973-94. Vegetable production has increased from 118,574 mt in 1973 to 683,665 mt in 1984. Since then production shows a declining trend and thereafter it has never reached the 1984 level. Production in 1994 was 484,325 mt, which was the lowest level since 1983. This declining trend is due to the reduction of the extent under vegetable cultivation and the average yield.
The decline in the area under vegetables could be attributed to two major factors: (1) cultivation of other crops in the regular vegetable plots and (2) decreasing chena cultivation with large scale irrigation projects like Mahaweli. Selling of vegetables is risky due to their high perishability. Prices fluctuate signifi-candy even during the day. Similarly, the marketing system of vegetables is not efficient, creating a high marketing cost, which is the difference between the consumer price and the retail price. Consequently, farmers' share is below 40% of the consumer price. Due to these circumstances, vegetable farmers have shifted to other crops such as tobacco, sugar cane and big onions. Tobacco is the principal crop which occupies the traditional vegetable lands. This move is evident in the districts of Kandy, Matale, Kurunegala and Anuradhapura. Sugar cane cultivation
4

has reduced the vegetable extent in the Moneragala district where ash-plantain is gaining prominence.
Most of the low country vegetables are traditionally grown on shifting cultivation (chena) lands in the dry zone. Shifting cultivation is limited mainly due to two reasons: (1) government restrictions, and (2) transformation of these lands into irrigated lands in which paddy and high value crops like chillies are grown.
The data from the Department of Census and Statistics show that the average yield of most vegetables is on the decline, especially since mid-1980s, and some are stagnated. The average yield is mainly determined by quality of seeds, cultivation practices, and fertilizer application. Most of the farmers use their own seeds which are often inferior in quality. Imported seeds are very expensive. Incentives given for vegetable cultivation with the adoption of new technology and high levels of fertilizer application have been curtailed by low returns.
Vegetable Consumption
Information on vegetable consumption is available in the Consumer F i nance Surveys conducted by the Central Bank of Sri Lanka and such information is reviewed in this section.
During the period 1978/79 to 1986/87 three consumer surveys were conducted and the results reveal that the per capita vegetable consumption has declined slightly from 2969 to 2790.40 grams per month, but remains above the 1978/79 level of 2683.52 (Table 2.2). This decline was mainly due to a drop in the consumption of low country vegetables. With regard to demand for different vegetables, beans, brinjals, and potatoes have a higher demand than others. Only these three vegetables have a per capita consumption over of200 grams per month in the period concerned. It was found that the consumption of beans has gone up significantly by nearly 50% from 1978/79 to 1986/87. Due to this high demand, the Pettah traders have observed that the prices of other vegetables are determined by the availability of beans in the market. More stocks of beans lead to low prices for other vegetables and vice versa.
It was also observed that cabbage consumption has dropped to 173.10 grams in 1986/87 from 215.27 in 1978/79, which reflects a 20% decline. The declining trend appears to continue over time. One of the main reasons for the decline of consumption is high level of chemical application. Due to this low demand, cabbage has a marketing problem during the peak harvesting time.
5

It was found that the per capita vegetable consumption varies according to sectors such as urban, rural and estate. As shown in Table 2.3, the vegetable consumption is highest in the estate sector, followed by the urban sector. In the estate sector the most popular vegetables are beans, cabbage, brinjals and potatoes respectively, while leafy vegetables have a very low demand. The per capita consumption of leafy vegetables in the estate sector in 1986/87 amounted at 129.90 grams, where as the figure for the rural sector was 372.70 grams and 480.70 grams for the urban sector, recording the highest consumption of leafy vegetables. In the rural sector, the consumption of low country vegetables is highest, while in the urban sector upcountry vegetables are consumed mostly.
22 Prices
Prices are analyzed in two ways: seasonal variations and annual variations. Seasonal variations occur mainly due to seasonality of production and its relatively high perishability. The change in annual prices indicates a balance in demand and supply over time. The increase in real price, which is a nominal price deflected by the Consumer Price Index (CPI), shows that production is inadequate to meet the demand and vise versa. The retail prices in Colombo and suburbs collected by the Marketing and Food Policy Division of the Hector Kobbekaduwa Agrarian Research and Training Institute are used in this analysis.
The vegetable prices are relatively higher during two periods: May to July and November to December (Table 2.4). This directly links with the pattern of production. During these two periods, the production is low. A price decline after July takes place with the increased supply from Marassana and Hanguranketha areas. Similarly the price increase after October is due to the completion of the vegetable season in the Welimada area. After December, the price decline is mainly due to the arrival of chena vegetables from the Dry Zone and the stocks from Matale.
The amplitude of the seasonal price variation could be examined by working out the difference between the highest and lowest value of the index. The results are given in Table 2.5. Among the selected vegetables, tomatoes have the highest seasonal price difference, followed by beetroot and leeks. This indicates a greater instability with regard to supply. A study done by Gunawardana and Chandrasiri found that the amplitude of the seasonal price variation within the year was considerable, but comparison of figures in this study shows a considerable decline. It indicates stability in vegetable production than in the past. A l though it was believed that the so-called upcountry vegetables could be grown only in areas where they have been traditionally established, this notion has now
6

changed. There are various locations in the country where some of these vegetables could be grown. For instance, beetroot is grown at Sigiriya in Matale and at Madahapola in Kurunegala.
With regard to annual prices of vegetables, an upward trend in the nominal price could be seen for all the vegetables with a sharper rise since 1989 (Table 2.6). The sharp price increase was recorded in the years 1990 and 1994. The annual price increase during 1986 -95 was 13 to 1 5 % for many vegetables as shown in Table 2.7. A similar trend was observed for real price, that is nominal price deflated by the Consumer Price Index (Tables 2.8 and 2.9). The increasing trend in the real price reveals that vegetable prices have increased due to factors other than the increase in the general price level in the economy of Sri Lanka. The declined production appears to be a major contributing factor to the increase of vegetable prices.
23 Foreign Trade
Until late 1970s, the vegetables produced were essentially for domestic consumption and no imports were made except for very few vegetables such as cauli flower in small quantities. This situation changed with the introduction of the open economy where non traditional crops like vegetables also began to be exported. Since then the fruit and vegetable sector has been identified as an export potential area. The export earnings from this sector increased to Rs 1095 million in 1994 from Rs 29 million in 1979, an increase of 38 times within 1 6 years. Nevertheless the country exports only about one percent of the production.
Sri Lanka mainly exports vegetables to the Middle East countries and Maldives. The amount exported to the Middle East was 65% followed by Maldives with 2 2 % in 1995. The Middle East has a good market due to the Asian working population. Upcountry vegetables are mainly sent to the Maldives, while low country vegetables are sent to the Middle East countries. The major competitor for Sri Lanka is India for Maldives, and India, Thailand, Malaysia, China, Philippines, Egypt, Kenya for Jordan Saudi Arabia and Oman in Middle East.
The major problems faced by exporters are: (1) high cost of production, (2) absence of continuous supply, (3) poor quality, (4) high air fare and (5) high cost of export services. Due to these problems, they are unable to compete with other competitors, especially India. In Indi, the cost of production is low due to low wage rates for hired labour along with subsidies. There is a continuous supply and some are from big farms.
7

C H A P T E R T H R E E
Vegetable Farming Systems in the Study Area
This chapter commences with a review of the socio-economic conditions of the vegetable farmers in the study locations, because characteristics such as family size, educational level and occupational patterns are directly associated with cultivation practices. Having discussed these aspects, cultivation and production practices adopted by the sample farmers are explained.
3.1 Socio-Economic Conditions
The family size and the age distribution of the sample population are explained in Tables 3.1 and 3.2. The number of farm families in the sample was 281 and the total population was 1261 consisting of 671 males and 590 females. The average family size of the entire sample was 5 and only two districts, Baduila and Nuwara El iya had families of 6.
The labour force which ranges above 14 and below 65 years, was 67% of the sample population. There is no marked variance among the districts concerned. The highest percentage of 7 3 % was reported from Nuwara E l iya followed by Baduila with 7 2 % . The lowest was 67% from the Matale district. The labour force participation rate was 5 2 % for males which was a little higher than females.
Table 3.3 shows the educational level of the sample population. The literacy rate of the sample population was 98%, which is above the national level. Except for Baduila, where the literacy rate was 96%, all other districts studied had the figure as high as 99%. There was no marked difference in the literacy level between males and females: Female literacy rate was 97%, a mere 2 % below the males. The lowest literacy rate of 94% for females was found in the Baduila district. The educational level in the study areas appears to be quite high. Some 65% of the population had secondary education, while nearly 2 5 % was highly literate having qualifications equal to or above the G . C . E . Ordinary Level. However the
8

educational level in the districts of Kurunegala, Anuradhapura and Matale, where primary education receivers were above 40%, remained below in comparison to the others.
An attempt was made to examine the occupational pattern of the sample population. Results are given in Table 3.4. The number of respondents to this issue was 626, of which 395 or 63% reported agricultural operations as the major occupation, while 76% of those who reported secondary occupations were employed in agriculture. Government employees in the employed population was only 7% or 45 out of 626. The labourers who reported wage as the main income source both in agriculture and in other areas in the work force was insignificant; only 5 out of 626. This means that members of vegetable farm families might not have time to involve in such activities having spent considerable time in their own farm. Of the employed population of 626, some 298 or nearly 50% reported secondary occupations.
32 Vegetable Production
This section will focus on production practices, input use and farmers* problems in relation to production. Production is the most important area that should be examined in detail because all other activities like marketing are linked with it.
33 Production Practices
As shown in Table 3.5, the majority of farmers have experience in vegetable farming for more than 10 years. Nearly 45% of the farmers interviewed had experience in vegetable farming for 10 to 20 years. Nuwara E l iya farmers have much longer experience than others. Nearly 80% of Nuwara E l i ya farmers have been cultivating vegetables for over 10 years. However in the Matale and Kandy districts the situation differs; some 45% of the farmers have less than ten years of experience. Almost all the farmers mentioned that they grow vegetables mainly for sale. Only three farmers out of 281 said that they grow vegetables for own consumption.
Almost all the farmers in Kandapola and Meepilimana in Nuwara El iya district grow only vegetables in both Yala and Maha Season (Table 3.6). In Baduila district, the situation varies depending on the location. In other districts studied, the majority of farmers grow vegetables and other crops, mainly paddy, in Maha season, whereas in Yala the cultivation procedure differs from area to area.
An attempt was made to examine the importance of growing vegetables
9

as an income generating activity of the family. The results are presented in Table 3.7. It was found that 253 out of 281 or 90% of the sample farmers, mentioned that income gained from vegetable farming was the major source of income. Similar results were found in the districts as well in other study locations.
There are a number of vegetables that can be chosen by the farmers. Reasons given by the fanners in selecting crops for cultivation are given in Table 3.8. High price is the principal factor in crop selection (42%) followed by suitability of the location (31 %) and convenience to cultivate (13%). Farmers always responded to the current market price but not to the future price. Consequently there was a glut of certain vegetables when prices of such vegetables went up in the previous season and vice versa. The attitude in crop selection indicated that farmers are less market-oriented, which means they look for the market after production.
Table 3.9 provides information on the number of plots grown by a farmer. Nearly 55% of the sample farmers had only one vegetable plot both in Maha and Yala seasons. Just over 2 5 % of the farmers had two vegetable plots, while none of the farmers had more than five vegetable plots. The number of vegetable plots grown by a farmer does not vary much between Maha and Yala. The district-wise situation was somewhat different, but over 40% of the farmers in all the districts concerned had one plot. In the districts of Nuwara El iya and Kurunegala over 60% of farmers cultivated one plot in both seasons, while in Badulla about 35% of farmers had two plots. In Anuradhapura the number of farmers with three vegetable plots was nearly 2 5 % in Maha season, but the figure was only 4% in Yala. The reason is that chena cultivation exits in some parts of the Anuradhapura district. For instance, Wellaragama in the Mihintale Divisional Secretariat area, where 'chena' cultivation takes place, nearly 40% of the farmers grow vegetables in three plots in Maha.
It is well known that the majority of Sri Lankan farmers are small-holders. There is no exception for the vegetables. The study found that over 7 5 % of the vegetable plots were less than 1.5 acres, while about 50% of the plots were less than one acre (Table 3.10). There was not much difference among the districts, except in Kurunegala and Anuradhapura, where the majority of vegetable plots were larger, 1.5 acres in extent.
Table 3 .11 shows the ownership pattern of vegetable plots. Most of the vegetable plots belonged to the owner himself. About 56% in Maha and 62% in Yala vegetable plots were operated by the owners. There were 88 out of 388 veg-
10

etable plots or 2 3 % in Maha, which came under L D O lands, of which 66 plots were in the Anuradhapura District. The L D O lands in Anuradhapura were cultivated with vegetables during Maha season only. There were 66 vegetable plots which were under L D O out of 103 in Maha, whereas in Yala only one plot out of 35 belongs to the category of L D O . The reason was probably lack of water in L D O lands in Yala.
It was found that 90% of the vegetable plots are regularly occupied by vegetables. The change from vegetables to other crops is not a dominant factor. Nevertheless, the types of vegetables grown vary from time to time. The majority of farmers (238 out of 275 or 87%) follow the crop rotation system as shown in Table 3 .12 . The major reason stated was increased productivity of the land followed by pest protection. It is also identified that there are three methods of cultivation: (1) single cropping (one crop in one plot), (2) mixed cropping (two or more crops together in one plot), and (3) multi-cropping (two or more crops separately in one plot). The overall results show that single cropping is dominant (48%) followed by mixed cropping (31%). Table 3.13 gives more information on this aspect However, there is a marked variation among the districts as well as between locations within the district indicating that cultivation practices are location-specific. In the Anuradhapura District single cropping is the most important (60%) followed by the multi-cropping (32%), whereas in Nuwara E l iya mixed cropping is leading (50%) followed by single cropping (42%). When the location in a district is considered, the situation differs; mixed cropping is dominant (65%) in Kandapola and single cropping is prominent (50%) in Meepilimana in the same district of Nuwara El iya. Farmers' preference to undertake single cropping is due to convenience (65%) and habits (30%). The major reasons for adopting mixed cropping are risk minimization (45%) and maximum use of available land (34%).
Vegetable cultivation is mainly under rainfed conditions during the Maha season (Table 3.14). The study found that 173 vegetable plots out of 387 or 45% were rainfed, followed by 1 8 % under minor irrigation and 1 8 % with water pump irrigation, which is directly linked with rains. In Anuradhapura nearly 90% of the vegetable cultivation is under rainfed in Maha season. In Yala season the source of water supply varies depending on the locations. Yala vegetable cultivation in the districts of Badulla, Nuwara El iya, Kandy and Matale mainly takes place under rained and minor irrigation. In the Kurunegala district 40 out of 73 vegetable plots or 55% were cultivated with water pumps and 20% under agro-wells. In Anuradhapura, the use of agro-wells for vegetable cultivation is significant. Our investigations show that 25 plots out of 35 or 7 1 % were cultivated with vegetables using agro-wells.
1 1

3.4 Input Use
Seeds, fertilizer, agrochemicals, labour and credit are the major inputs required for vegetable cultivation. An attempt was made to ascertain the sources of input, type of payment and amounts used in respect of different inputs.
Seed farmers cannot produce seeds of most of the upcountry vegetables such as leeks, cabbage, beetroot and carrot. The study found that beans is the only upcountry vegetable where the majority of farmers (nearly 60%) use their own seeds (Table 3.15). Use of own seeds in tomato cultivation is only 1 5 % or 10 out of 66 farmers. Then majority of potato farmers use their own seeds for Yala cultivation. With regard to low country vegetables, the situation differs. The majority of farmers use own seeds. None of the farmers in the sample use purchased seed in the cultivation of pumpkin. Nevertheless, over 50% of farmers who grew ladies finger, bittergourd and luffa have used purchased seeds. Private traders are dominant in vegetable seed trading. Over 80 farmers who cultivated upcountry vegetables obtained seeds from the private traders. Both private and government outlets are equally important in selling low country vegetable seeds. There is no relationship between seed purchasing and vegetable selling by farmers. In other words, the seed seller and the vegetable purchaser are not the same in most cases. This is further proved by the finding that less than 1 0 % of farmers purchase seeds on credit (Tabls 3.16). If the purchase is made on credit, the farmer is bound to sell his produce to the trader from whom the purchase was made.
3.5 Fertilizer Use
Both chemical and organic fertilizer are applied in vegetable farming depending on the crop and locations. It was found that over 75% of the farmers applied both chemical and organic fertilizer in cultivation of upcountry vegetables such as potatoes, cabbage, carrot, leeks and beetroot, whereas over 80% farmers who grow low country vegetables such as luffa, ladies fingers, bittergourds and brinjal applied only chemical fertilizer (Table 3.17). Only four farmers who used only organic fertilizer were found in the field survey. The combined use of both chemical and organic fertilizer is prominent only in the Nuwara El iya district with 50% of such farmers in the sample. The balance is almost from Baduila (22%) and Kandy (19%). As for the seeds, the private sector plays a bigger role in fertilizer sale as well. The majority (83%) of the farmers purchase fertilizer from traders and only 1 1 % of the sample farmers go to the Agrarian Service Centre (ASC) for buying fertilizer. However, none of the farmers interviewed in the Nuwara El iya,
12

Baduila and Anuradhapura districts purchased fertilizer from the A S C . In the case of Kurunegala, the figure is only 2 % . Cash payment is mainly undertaken in purchasing fertilizer both chemical and organic (Table 3.19).
Only 1 1 farmers out of 281 reported that agrochemicals were not used. As shown in Table 3.20, over 90% of the farmers who applied agrochemicals obtained their requirements from the private trader, but only 1 0 % of farmers purchased from the trader to whom they sell vegetables. The number of farmers who go to the A S C to obtain chemicals is only 7 % and the majority of them are from the Matale and Kandy districts. Purchasing is made on cash. About 83% of the farmers in the sample reported that they purchase agrochemicals on cash. In none of the districts credit purchases were dominant. The highest percentage of 35% was observed in Matale district followed by Anuradhapura with 2 1 % .
3.6 Labour
Since vegetable is a labour intensive cultivation, family labour is not adequate in most cases. The survey results reveal that only 54 farmers out of 281 or 1 9 % used family labour solely in vegetable cultivation. Similarly only 16 farmers used hired labour alone. When operational activities are considered, family labour is dominant on all occasions except for land preparation and harvesting where much labour is required (Table 3.23).
3.7 Credit
Credit has been an important agricultural input in the face of high input prices, which increase at a higher rate than output prices. The survey results show that 218 farmers out of 281 or nearly 80% of the farmers borrow money for their cultivation. The principal lending sources are the Cooperative Banks (mainly Sanasa), State Banks (mainly Rural Development Bank) output traders who purchase vegetables, and relatives/friends (Table 3.24). The money lender does not play an important role in any of the study locations. In Baduila and Matale Districts the most important source is the output trader, while in Nuwara El iya and Anuradhapura districts, State Banks are prominent. In the Kurunegala District, the Cooperative banks are popular among the farmers. The main criteria considered by the farmer in obtaining loans are convenience followed by low interest. This is the main reason for Sanasa and Rural Development Bank being popular among the farmers.
13

3.8 Productivity
Productivity is a measurement of efficiency. Here land productivity (often called yield) of vegetables is examined. The average yield is mainly determined by weather, quality of seeds, and fertilizer use. A question was asked from farmers in regard to the variation of vegetable yields, minimum, maximum and average (mode). The results are presented in Table 3.25. As seen from the Table, there is a big variation in yield among the districts. Also yield fluctuations over the years are significant. For many vegetables, differences between the maximum and the average is severe. Farmers also have reported that yield is on a declining trend. It is also argued that the average yield of vegetables is considerably low compared to other countries. The principal reason might be the weather, because vegetables are grown under rainfed condition.
3.9 Production Problems reported by farmers
The total number of farmers who reported production problems is 179 out of 2 3 1 , which is nearly 80%. Although some problems such as damage by wild animals are location specific, five common problems were found as shown in Table 3.26. The major problems are;
1 . High input cost - Fanners mainly complained about high cost of agricultural equipments such as water pumps, and agro chemicals. They reported that manufacturers change prices several times in a year, especially of agro chemicals.
2. Lack of finance - Input prices increase at a higher rate than that of output, causing declined net return. As a result, financial difficulties have become a serious problem and access to credit is also a problem.
3. Lack of water - Since vegetables heavily depend on rains, water becomes a problem. Due to this farmers have to grow vegetables like brinjal which are drought resistant but fetch low price in the market.
4. Seed problems - Farmers complained about quality and non-availability.
5. Poor extension services - Fanners criticized about transferring K V S into Gramaniladari service. Because since then fanners had to depend on traders who always recommend items which brings high commission to them. Most fanners mentioned that they tend to use excess agro chemicals due to use of different brands; if one does not respond, another is applied.
14

C H A P T E R F O U R
Marketing System in the Study Area
The distribution surplus of vegetables from the producing areas to consuming areas is discussed in this chapter. It is well known that bulk of the surplus is moving to urban areas located far away from producing areas. As a result, a large number of intermediaries such as collectors, brokers, transporters, wholesalers and retailers are involved in the system and they perform various activities which are essential to operate the system.
4.1 Marketable surplus
This can be defined as the quantity available for sale. It is generally worked out by subtracting quantity retained for home consumption, seed, payments in kind and wastage from the harvested production. It was found that marketable surplus is as high as over 85% of the production for all the vegetables with an average of 9 1 % (Table 4.1).
4.2 Marketing channels
The marketing channels explain how vegetables move from producers to consumers. As shown in Table 4.2., there are various options available for the fanner to sell his vegetables. An attempt was made to identify the popular channels with the reasons, and results are summarized in the Table 4.2.
The most popular trader at farm level is the collector. The number of farmers who have given first preference to the collector is 174 out of 262 or 66%. There are two types of collectors: village collector and 'outside collector'. The former lives in the village and the latter comes from mainly a town situated in consuming areas. The village collector often sells to the 'outside collector' who in turn sells to retailers in the town. Transactions between the two parties take place on mutual understanding and purchasing on credit basis is usually practiced. The role of the village collector is to collect vegetables from the farmer to meet the
15

demand of the outside collector. Since the tendency of outside traders going to the producing areas by passing the terminal markets such as Colombo and Kandy has been on the increase after late 1970s. The number of collectors are growing. However the possibility to sell directly to the outside collector by the fanner is restricted by two factors. Firsdy, individual farmer cannot fulfill the requirements of outside collectors who need various vegetables in bulk form. Secondly, the village collector does not allow 'outside collector' to develop a relationship with the farmer in most cases. Therefore village collector is prominent at farm level. Farmers prefer him mainly due to three reasons: i) close market outlet (42%) ii) indebtness (22%) and iii) spot payments (12%).
The second most important mode of selling vegetables is on commissions basis. There are two commission markets, namely, Colombo and Kandy used by the farmers in the study areas. The commission system mainly operates based on mutual trust. Payments are made after sale. Price paid to the farmer is worked out by reducing a 1 0 % commission, unloading charges and transport cost from the selling price. Money is sent on the same day or later on request by cheques or through the lorry driver. It was found from the study that some farmers in the Welimada area prefer to get money after the entire crops is harvested.
Although the Kandy market is more closer to the farmers in the Nuwara El iya and Baduila districts than Colombo, they are used to send stocks to Colombo. This is due to doing business with them for a long period of time. A l l the farmers interviewed in the Kandy district have given first preference to the Kandy Commission Agents. The principal reason is being a closeness of the market. Some 5 2 % of the farmers interviewed in the Baduila district sell to the Colombo Commission Agents (Manning) mainly because of indebmess and easy credit facilities. Selling vegetables to the Pettah market on a commission basis is no longer important in the Nuwara El iya district. Only 1 8 % of the farmers send to Pettah. When questioned for reasons for not selling to Pettah traders, they said risk and uncertainty in price. The price paid to farmer is known only after effecting sale in Colombo trading.
The fair (Polo.) is also important in Baduila and Kurunegala Districts. The most popular fair in Baduila District is situated at Welimada. Nevertheless, farmers complained about hTegularity in weighing. Due to this only 1 2 farmers out of 52 gave first preference to the fair. In the Kurunegale Distric, fair and rural collector were equally important. The principal reason given to choose the fair is the high prices fetched.
16

None of the fanner in the sample sold vegetables to the government market outlets such as the Cooperatives and the C W E . Not a single farmers' organization operates in vegetable marketing. Also, Purchasing Centers introduced in the late 80s are inactive. Under these circumstances vegetable trade at farm level is entirely handled by the private sector.
4.3 Marketing Functions
Marketing functions include all the activities from harvesting to consumption. These activities can be grouped into three: 1) exchange functions i.e. mainly buying and selling 2) distribution functions i.e mainly transport and storage and 3) facilitating functions i.e mainly standardization, market research, market information, and marketing credit. In this section, marketing functions undertaken by farmers in the study area are reviewed.
Farmers undertake cleaning and sorting before selling. Our observations show that they do not give due attention to these aspects. For instance, over matured ladies finger and damaged brinjal are not sorted out and they are packed in the middle of the sack. Most of the retailers are aware of that and it tends to lower price. Vegetables are not graded at farm level or even at other levels. Most of the vegetables are packed with poli sacks, which contains usually 4 5 - 5 5 kgs. Wooden boxes are used to pack tomatoes, and snakegourd are wrapped in cadjan.
Most of the vegetable plots are away from the motorable roads and farmers have to bring vegetables to the nearest motarable roads, home or assembly points mainly on head using either family or hired labour. Few farmers use two wheel tractors depending on the loads and road condition. In sending vegetables tOiColombo/Kandy for sale on commission basis, farmers bring vegetables to the road and hand them over to the transport agent who takes vegetables to the market. The 'outside collector' comes with a lorry.
4.4 Price Formation
The economic theory says price is determined by demand and supply. Buyer of vegetables at farm level is the trader and his demand is derived from his customer; retailer or sub wholesaler, whose demand in turn depends on the consumer. In short, trader has a derived demand. Since consumption of vegetable does not vary in the short run, price is mainly determined by supply, which is seasonal. Vegetables cannot be stored except for potatoes. Consequently during the season,
17

buyers' market exists with excess supply. After harvesting farmer has to sell for whatever the price prevailed as vegetables are not stored. In a buyers market the price is low. Many farmers complained that a few collectors operate in a location and they determine the price. Such traders do not allow to develop a relationship between the farmer and the 'outside trader'.
In the Pettah market, the price is mainly determined by supply. Price varies daily depending on the supply. It is argued that there is a difference between the price received by farmer and the market price. Commission agents mentioned that their profits depend on sales. Therefore, they try to retain the farmers with them by paying a better price. Today farmers have options in selling either to Colombo/ Kandy or to the assemblers. From the farmers' point of view, they have to depend on the Commission agents due to indebtness even if they offer a lower price. Farmers received price information from traders and not from an independent source (Table 4.3).
4.5 Marketing Problems Reported by Farmers
Marketing is a major problem faced by the farmers. Problems related to marketing varies depending on the commodity group. For instance, the price fluctuation is a major problem for vegetables but not for rice. The major problems as shown inTable 4.4 are;
1 . Unreasonable price - Farmers argue that the price received by them is not adequate in comparison to input cost and cost of living.
2. Poor road facilities - This created high transport cost at farm level. Also it affects loss of vegetables and takes time to move stocks from farm level to other areas.
3. Malpractice in selling -Underweight, over reduction for pack weight, and unnecessary sorting are reported.
4. Difficulties in selling - This happens during the harvesting time for some vegetables like cabbage and, tomatoes. Also traders do not go to the remote areas for purchasing during the season.
5. Price fluctuation - Vegetables have a high risk in price due to its perishability. Prices change even within a day, significantly.
18

C H A P T E R F I V E
Conclusions and Recommendations
In this chapter, some conclusions are made based on the analysis of study findings. Since this study has covered most of the major producing areas and major vegetables, it could be reasonably assumed that conclusions drawn from this study applicable to the entire vegetable sector.
5.1 Conclusions
1 . Since mid 1980s vegetable production is on a decreasing trend. This is due to both drop in extent under cultivation and average yield. The declined extent is due to two major factors: 1) cultivation of other high value crops, such as tobacco, sugar cane, and big onions in the regular vegetable plots, and 2) decreasing chena cultivation with massive irrigation projects like Mahaweli. Use of inferior quality seeds, poor cultural practices, inadequate fertilizer use and low level of technology adoption have caused low productivity of vegetables.
2. Vegetable consumption has declined recently causing ill-effects to the nutritional level of the people. This may be due to decline in purchasing power of the consumers. This has been aggravated by high prices of vegetables. Both nominal and real prices of vegetables have gone up over the time.
3. Seasonal price variations have curtailed with the cultivation of vegetables under agro wells and water pumps. Marketing of vegetables is highly profitable during the period of May to July. Having realized that, majority of farmers who have an assurance of water, grow vegetables to harvest during this period.
4. Vegetable exports have increased tremendously, indicating its export po-
19
tential. Nevertheless, market competition appears to be amajor constraint with the arrival of new countries for vegetable exports. India has already captured some of the Sri Lankan export markets for vegetables.
5. Vegetable farm families are small in family size. However, their educational level remains at a higher level. Majority of them are involved in agricultural activities and principal income is derived from vegetable farming.
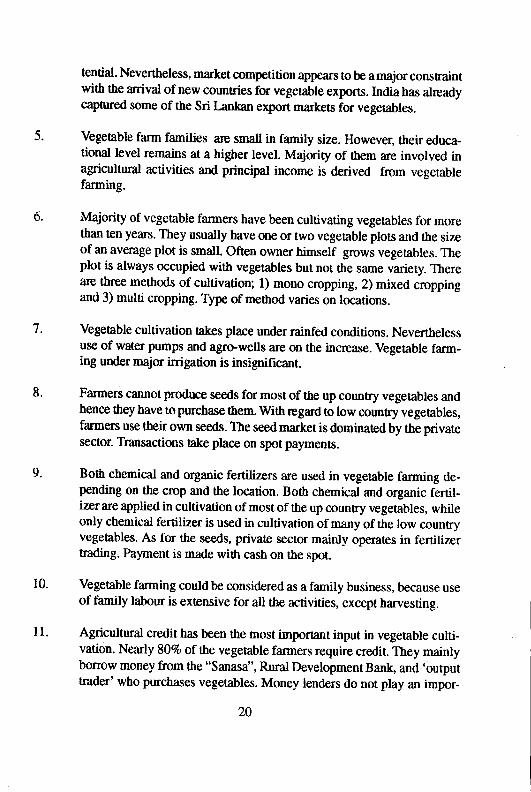
6. Majority of vegetable farmers have been cultivating vegetables for more than ten years. They usually have one or two vegetable plots and the size of an average plot is small. Often owner himself grows vegetables. The plot is always occupied with vegetables but not the same variety. There are three methods of cultivation; 1) mono cropping, 2) mixed cropping and 3) multi cropping. Type of method varies on locations.
7. Vegetable cultivation takes place under rainfed conditions. Nevertheless use of water pumps and agro-wells are on the increase. Vegetable farming under major irrigation is insignificant.
8. Farmers cannot produce seeds for most of the up country vegetables and hence they have to purchase them. With regard to low country vegetables, farmers use their own seeds. The seed market is dominated by the private sector. Transactions take place on spot payments.
9. Both chemical and organic fertilizers are used in vegetable farming depending on the crop and the location. Both chemical and organic fertilizer are applied in cultivation of most of the up country vegetables, while only chemical fertilizer is used in cultivation of many of the low country vegetables. As for the seeds, private sector mainly operates in fertilizer trading: Payment is made with cash on the spot.
10. Vegetable farming could be considered as a family business, because use of family labour is extensive for all the activities, except harvesting.
1 1 . Agricultural credit has been the most important input in vegetable cultivation. Nearly 80% of the vegetable farmers require credit. They mainly borrow money from the "Sanasa", Rural Development Bank, and 'output trader' who purchases vegetables. Money lenders do not play an impor-
20
tant role in lending. The main criteria considered by the farmer in obtaining loans is easiness followed by the low interest.
1 2 . Land productivity of vegetables varies considerably over the dme. Also, yield is on a declining trend. There are big variations in yield among the farmers as well as among the localities.
1 3 . High input cost, lack of finance, inadequacy of water, non availability of quality seeds and poor extension service are major production problems faced by vegetable farmers.
14. Marketable surplus is around 85% of the farm production. Although farmers have options in the selection of market outlets, village collector dominates the market at assembly level due to a number of reasons. Among them, being close to market oudet and indebtedness are prominent.
1 5 . Farmers undertake some marketing functions such as cleaning, sorting, packing and transporting, but they give meager attention to these activities. With regard to packing, poli sacks are widely used while wooden boxes are used to pack tomatoes. Facilitating functions such as standardization, market research, market information, and marketing credit have not been given due attention. As a result vegetable distribution system is unsatisfactory, and causes high marketing costs which is the wide difference between the consumer price and the farm price.
16. Vegetable price is mainly determined by the market supply. Hence, the price fluctuation is subject to the supply variation. However, traders have more influence in price formation than farmers. Farmer's bargaining power has been limited by lack of market information, indebtedness to the trader, and weak institutional power (unorganized farmers).
17 . Major marketing problems faced by farmers are: low prices along with high price fluctuation, poor road facilities, difficulties in selling and malpractices in selling.
5.2 Recommendations
Vegetables have been a political issue in the country due to its impact on cost of living and income of the farmers. Also the vegetable sub-sector has a vast
2 1

export potential. Under these circumstances, development of the vegetable sub-sector is inevitable in any government development plan. In any programme towards the development of the vegetable sector, actions should be taken to solve the farmers problems, because decisions to grow vegetables are taken by them. In this section, some recommendations are made for the consideration of policy formulation. In fact, farmers' views were taken into account in developing these recommendations. We asked from farmers the problems they have and solutions to them at the time of interview.
1. Attitudinal change of the vegetable farmers is a requirement in order to develop a commercial vegetable farming system. Farmers' perception is that government should be directiy involved in purchasing whatever they produce. Direct government intervention in marketing is a high cost to the society and even government cannot bear the cost. Therefor it is an urgent requirement to educate farmers on these issues and train them to become commercial farmers who think of profit before production decisions are taken.
2. Absence of production planning in line with the market demand is a major factor leading to most of the production and marketing problems. Since vegetables are perishable and there are no storage facilities (even if they are made are costly) production planning is imperative to ensure year round production and to avoid high price increases/decreases. Exporters also require continued supply in order to meet their requirements. In production planning, the first step is to work out the domestic and international demand for different vegetables on monthly basis. The second step is to estimate the extent necessary to meet the country requirement. The third would be to identify suitable locations through consultations with the technical staff. Finally divisional staff at the Agrarian Center have to prepare production plans in concurrence with the Farmer Organization. This development plan should include input needs, activities by time target and monitoring mechanisms.
3. In production planning, emphasize should be given to develop home gardens and market gardens. Development of home garden for vegetable farming ensures food security and healthy foods. Market gardens means cultivation of vegetables near principal cities (population centers) to cater to the city consumers. This will provide fresh vegetables to the users. It was observed that farmers in Colombo and Gampaha districts tend to do away with paddy farming due to high labour cost. Similarly they have
22

ability to purchase rice from the market. Possibilities should be explored to cultivate vegetables on these land through group farming. A group can be organized to take a land and cultivate vegetables with group labour.
Strengthening research and extension to reduce production cost is necessary, because the prices of most of the vegetables are exorbitant and beyond the reach of the common man. Also vegetable exporters tend to loose their markets due to high vegetable prices. Under the South Asian Preferential Trade Agreement (S APTA), imports will be liberalized. If it happens, cheaper vegetables would arrive at the market from India. The country is facing globalization so that the production efficiency has to be taken very seriously. In this regard, government allocation for research and development need to be increased.
Since vegetable farmers are small holders, they have to be organized to minimize their cost and increase returns. Although farmers organizations have been established, no participatory production and marketing of vegetables was observed. It is recommended to establish a 'People's Company' by organizing interested farmers. Such a company can provide agricultural inputs, such as fertilizer and agro chemicals at a price below the market through bulk purchasing, increasing accessibility to credit and obtaining maximum price possible for their produce through group marketing.
Improvement of support services in relation to the production is necessary to increase vegetable production. Extension system has to be revitalized as almost all the farmers stress the need of effective extension system. In this regard, a number of options are available. The first option is to train the "Govi Niyamaka" on extension and make available him for farmers. The second option is to provide extension services through media. Third would be provision of extension service through the Farmers' Organization. In addition to improvement of the extension system, provision of water for vegetable cultivation is an urgent need. This problem as well as solution are location specific. Therefore, Development Officer (DO) are the Agrarian Service Center should pay due attention to solve this problem. Provision of quality seeds at correct time is also needs due attention. Easy access to agricultural credit should be ensured. Vegetable farmers appreciate the services rendered the " S A N A S A " and Rural Development Bank.
23

As production improves, support services in relation to marketing are required to be improved. The condition of roads in vegetable producing areas appears to be the major constraint to marketing improvement programme for vegetables. Market accessibility is restricted due to the absence of proper link roads. The large buyers are discouraged to visit producing areas owing to unfriendly roads. Bad roads damage produce in transit and make it uneconomical resulting in too high transportation cost. Also market places, the networks of primary, assembly, wholesale and retail transaction points are critical components of marketing infrastructure. At such market outlets, lack of basic facilities like permanent huts, parking places, water supply, toilets, and electricity are evident. With regard to marketing support services, marketing research especially on post harvest activities, training and extension on marketing, market information and marketing credit need to be strengthened in order to enhance marketing efficiency of vegetable trading.
Since distribution cost of vegetables from producer to consumer is considerable, the ways and means to reduce the distribution cost has to be explored. There are some intermediaries like assemblers and brokers who perform small business and hence keep big margins. I f farmer organization could undertake their activities, the above mentioned intermediaries could be eliminated. Also it was observed that most retailers keep bigger margin due to small transactions. I f steps such as provision of marketing credit and bigger store facilities could be provided to expand their turnover, the unit margin will decrease. If intermediaries get abnormal profit, it could be reduced through provision of incentives to the newcomers to enter the vegetable marketing system. Rural youth could be involved in vegetable trading with the support of the government. The new marketing network through the farmer organizations could be developed with the youth from farm families. For instance, the youth from Gampaha district can link with the youth from Nuwara-Eliya in selling low country vegetables from Gampaha and up country vegetables from Nuwara El iya.
Market regulations need to be implemented effectively and new regulations should be imposed if necessary to avoid market malpractices such as underweight, marker entry barriers and illegal payments.
24

R E F E R E N C E
Apo (1989). Vegetable Production and Marketing in As ia and the Pacific. Asian Productivity Organization, Tokyo.
Central Bank of Sri Lanka (various issues), Consumer Finance Survey, Central Bank of Sri Lanka, Colombo.
Gunawardane P J . and Chandrasiri A (1980). Factors Influencing Vegetable Prices: A Study of the Vegetable Economy in Sri Lanka, Research Study No. 35, ARTT, Colombo.
Herath HJvI.E. (1985), Vegetable Production in Sri Lanka; Country Study, Consultancy Report, FAO, Rome.
Hettige S.T. and Senanayake S.M.P. (1992), Highland Vegetable Production and Marketing System, USATD, Colombo.
Rupasena L.P. (1992). Production and Price Trends of Selected Fruits and Veg etables: Paper presented at the Seminar on Macro Plan for Fruit Process ing Industry organized by the Ceylon National Chamber of Industry at H A R T I in October 1992.
(1993). Agricultural Marketing: Paper presented at the Symposium on Policy Issues in Agriculture organized by A R T I in December 1993.
(1994). Vegetable Production and Marketing: Paper submitted to the Ministry of Agriculture Development and Research in March 1994.
25

ANNEXES
Table 1.1 Study Location and Sample Size
District A S C Area Loction Sample Size
Baduila Ambagasduwa Kumarapattiya 24 Busdulla
Kumarapattiya
Kurundugolla Keppetipola Himbiliyagolla 30 Hewanakumbura
Himbiliyagolla
Uva- Ambewela Nuwara El iya Kandapola Kandapola 24 Nuwara E l iya Jayawardenapura
Kandapola 24
Meepilimana Blackfool Kurunegala Madahapola Morottha 24 Welipitiya
Madahapola
Kobbeigane Hathalawa 25 Assedduma Maulla Anuradhapura Mihintale Wellaragama 29 Katukeliyawa
Wellaragama
Ipalogama Dampelassagama 26 Ipalogama Punchikulama Matale Dambulla Puwakattawela 25 Yatawatta Nikagolla 26 Deewilla Kandy Thalatuoya Ethulgama 24 TOTAL 281
26

• 4 «
Table 2.1 - A Vegetable Production - Sri Lanka (M.T.)
t o
Year Beans Carrot Leeks Beetroot Knol- Cabbage Raddish Tomato
1973 1974 1975 1976 1977 Avg 1978 1979 1980 1981 1982 Ave % C h ;
10360 9409 9862
1 2 1 3 2 10538 10460 10882 18435 20632 18146 17493 17118
ange 64 1983 31687 1984 1985 1986 1987 Ave %Ch
36337 35567 36976 37333 35580
% Change 108 1988 37733 1989 36144 1990 35716 1991 35040 1992 35481 Ave 36023 % Change 1 1993 28028 1994 26158
Khol
1647 2087 2940 2635 1647 5014 7075 1031 1169 3015 2545 1031 5317 6421 2869 8661 3379 4 1 1 8 2869 7599 20893 3035 8232 3796 4561 3035 7174 17785 2035 8153 3466 3272 2035 6136 15491 2123 5660 3319 3426 2123 6248 13533 4020 2855 3992 2686 4020 7421 13063 6715 6741 9142 15080 6715 12939 24735 5814 6765 10477 13527 5814 22598 27984 3915 6 1 1 1 7 1 5 2 6667 3915 18603 26667 2741 5571 6928 6318 2741 17164 13333 4641 5609 7538 8856 4641 15745 21156
119 - 1 127 158 1 1 9 152 56 9424 14583 16328 9752 9424 21398 26109 8359 14180 13726 12907 8359 30012 28820
10210 12698 12322 10436 10210 28706 33864 11038 5727 13810 10807 11038 24619 32945 1 1 1 1 1 10756 14018 9270 1 1 1 1 1 18332 27059 10028 11589 14041 10634 10028 24613 29759
116 107 86 20 1 1 6 56 4 1 10337 10244 13998 9680 10337 16470 35182 11907 9558 1 3 3 1 5 9865 11907 1 7 4 1 2 33031 1 3 1 2 1 7913 11492 1 1 3 1 9 1 3 1 2 1 16539 34528 20601 10883 1 2 7 1 2 1 2 1 0 7 20601 18974 32234 25439 12506 14954 1 2 1 8 3 25439 18910 34708 16281 10221 13294 11031 16281 17661 33937
62 - 1 2 -5 4 62 -28 14 24621 15423 15371 12430 34021 20252 30932 23415 15590 14649 11986 34781 19929 31746

Table 2.1 - B Vegetable Production - Sri Lanka (M.T . )
Ladies- Brinjals Capsicum Red- Cucumber Bitter- Snake Ash- Ash- Total Fingers Pumpkin Gourd Gourd Plantain Pumpkin
10157 12473 ~ 11176 4176 2752 7458 32167 4810 118574 6711 19866 — 13463 4941 4474 8966 34758 3446 126563 9545 20646 — 41716 12902 12526 11505 54172 11601 234863 9334 30425 — 36089 11672 10020 14991 54093 9418 235792 9113 35191 — 30924 9842 9012 12996 53504 7334 219042 8972 23720 -- 26674 8707 7757 11183 45739 7322 186967
12867 31860 — 25060 11080 10037 13865 52681 6781 213170 22998 32964 — 42446 22349 11718 24832 96819 10591 365219 23843 42597 ~ 42794 24034 13717 22231 96734 9258 388819 22750 45462 — 55064 20566 13519 20662 107485 8157 384841 18733 37748 — 39763 17862 12703 17594 73874 8022 298588 20238 38126 — 41025 19178 12339 19837 85519 8562 330127
126 61 — 54 120 59 77 87 17 77 37549 74214 -- 82039 22808 22437 23923 81168 10543 493386 44311 87701 14077 131320 26486 21120 26368 164669 14913 683665 43706 90279 17030 94052 25692 21208 29831 190750 14786 681347 41402 82732 15923 101050 22865 19463 27244 167966 12996 638601 44554 74268 15253 94477 20427 19482 24232 166424 8297 606404 42304 81839 15571 100588 23656 20742 26320 154195 12307 620681
109 115 — 145 23 68 33 80 44 88 43320 80906 17590 139987 22854 21631 25920 146671 10624 653484 40245 73631 13967 81097 22065 20794 27483 128647 5952 557020 39969 69725 11024 87717 25436 19877 27788 109436 6655 541376 38799 65583 11965 64414 19087 20553 22311 95970 6081 507915 37949 62824 10469 65429 17502 22160 23074 84014 6688 509729 40056 70534 16254 87729 21389 21003 25315 112948 7200 553905
-5 -14 4 -13 -10 1 -4 -27 -41 -11 37856 62841 12595 60490 18312 21656 22355 81917 9267 508367 37653 62601 10713 58247 17838 20683 20828 69682 7826 484325
Statistics ' Source: Dept O f Census and Statistics.
i 6

Table 2.2 Per capita vegetable consumption(gms/Month) - A l l Island
Variety 1978/79 1981/82 1986/87
Beans 217.83 234.20 319.70
Carrot 44.30 41.70 66.40 Leeks 82.08 64.80 63.10 Beetroot 84.06 101.2C 103.10 Knol Khol N.A. 48.10 42.80 Raddish 51.97 67.10 49.70 Cabbage 215.27 192.70 173.10 Tomatoes 73.84 65.80 48.50 Ladies Finger 88.61 106.30 86.00 Brinjals 266.11 296.00 260.00 capsicum 35.22 46.20 50.50 Pumpking 132.91 202.70 194.30 Ash Pumpkin 9.09 13.40 6.00 Cucumber 23.86 29.90 30.80 Bitter Gourd 45.44 50.80 64.60 Snake Gourd 80.94 78.10 70.40 Drumstic 119.56 114.80 95.70 Luffa 72.99 78.50 66.40 Long Bean 134.62 156.60 131.50 Ash Plantain; 1 1 4 . 1 7 139.40 106.40 Other 132.34 153.30 70.50 Grand total 2025.21 2281.60 2099.50
Leafy vegetables Mukunuwenna 204.76 N.A. 154.60 Kankun 36.35 N.A. 28.70 Gotukola 44.30 N.A. 72.80 Kathuiumurunga 15.05 N.A. 24.50 Sarana 11.36 N.A. 10.00 Thampala 17.89 N.A. 12.40 Nivithi 22.44 N.A. 31.80 Cabbage Leaves 17.04 N.A. 17.50 Kohila 17.04 N.A. 20.70 Other 63.05 N.A. 83.20 Total 449.28 434.10 456.20
Potatoes 209.02 253.30 234.70 Total vegetables •
consumption 2683.51 2969.00 2790.40
Source: Various issues of consumer finance surveys Central Bank of Sri Lanka
29

Table 2.3 Vegetable consumptions by sectors (gms/Month) Varieties
Up country Beans Carrot Leeks Beetroot Knol Khol Raddish Cabbage Tomato Potato A L L
Low country Ladies Finger Brinjals capsicum Pumpking
u> Ash Pumpkin Q Cucumber
Bitter Gourd Snake Gourd Drumstic Luffa LongBeans AshTlantain A L L
Leafy vegetables Miikunuwenna Kankun Gotukola Kathurumurunga Sarana Thampala Nivithi Cabbage Leaves Kohila A L L
Grand Total
1978/1979 1981/1982 1986/1987 Urban Rural Estate Urban Rural Estate Urban Rural Estate
242.25 186.02 405.27 262.80 201.80 515.40 390.60 274.10 582.40 73.84 33.51 50.27 81.10 32.40 31.90 124.70 53.60 52.50 74.12 72.99 174.94 75.00 56.20 231.80 99.00 44.60 106.80 76.68 68.16 229.76 111.10 86.70 234.80 120.00 84.80 234.80
N.A. N.A. N.A. 23.50 47.70 125.10 31.40 42.30 73.00 34.36 59.64 37.49 38.80 74.40 68.40 35.60 54.50 40.90
185.17 192.84 472.58 199.90 161.70 520.60 173.70 147.80 406.90 54.24 74.41 119.28 55.70 68.00 69.60 40.90 49.50 56.20
235.72 198.52 221.52 293.60 243.60 245.70 229.00 222.40 221.10 976.38 886.09 1711.11 1141.50 972.50 2043.30 1244.90 973.60 1774.60
80.37 94.29 65.04 93.60 114.20 54.20 80.40 89.30 67.80 187.72 272.07 423.73 215.30 306.70 410.60 152.30 272.30 393.50 40.90 36.92 21.87 52.20 45.90 31.30 53.30 50.50 43.70 99.12 145.69 122.12 154.80 213.90 214.50 160.20 206.50 158.60
6.82 10.79 2.27 7.30 15.30 5.70 5.00 6.80 1.00 26.70 24.42 9.94 30.50 31.60 9.10 48.10 29.20 6.90 37.20 51.40 21.30 34.90 56.30 23.60 58.00 71.20 18.20 62.76 90.88 59.36 58.20 86.10 46.80 47.90 77.80 52.60 96.28 121.84 163.58 101.90 116.30 134.80 85.50 97.80 99.30 24.42 93.72 17.89 206.60 97.00 20.50 36.40 78.40 23.30 74.12 164.72 57.37 96.10 182.60 39.80 68.10 156.80 40.40 94.86 122.12 88.89 108.10 150.60 103.50 89.60 113.40 79.60
831.27 1228.86 1053.36 1159.50 1416.50 1094.40 884.80 1250.00 984.90
286.27 185.45 140.86 N.A. N.A. N.A. 241.10 144.20 54.20 69.30 28.40 7.38 N.A. N.A. N.A. 52.80 24.90 9.60 33.51 50.84 22.44 N.A. N.A. N.A. 66.40 79.70 23.80 21.87 13.92 5.54 N.A. N.A. N.A. 36.40 24.10 0.90 13.63 11.64 1.42 N.A. N.A. N.A. 16.60 9.30 1.60 19.88 19.28 3.69 N.A. N.A. N.A. 10.20 13.90 3.80 19.88 25.56 5.68 N.A. N.A. N.A. 29.80 34.30 12.50 10.51 17.61 28.40 N.A. N.A. N.A. 10.20 18.90 20.50 11.93 20.45 1.99 N.A. N.A. N.A. 17.20 23.40 3.00
486.78 373.15 217.41 451.90 457JO 190.30 480.70 372.70 129.90 2294.43 2488.10 2981.87 2752.90 2846.20 3328.00 2610.40 2596.30 2889.40
Source : Various issues of consumer finance surveys - Central Bank of Sri Lanka

Table 2A Seasonal price index - Vegetables Month Beans Carrot Leeks Beetroot Knolkhol Raddish Cabbage Tomatoes
5 year Seasonal 5 year Seasonal 5 year Seasonal 5 year Seasonal 5 year Seasonal 5 year Seasonal 5 year Seasonal 5 year Seasonal average price average price average price average price - - - -Rs/Kg index Rs/Kg index Rs/Kg index Rs/Kg index
price average price average once average price D ' r - " - - A ~ " - " ^ index Rs/Kg index
January 26.24 101 29.41 112 28.17 108 29.62 109 19.74 97 13.18 94 18.28 94 29.89 97 February 25.04 96 27.38 104 26.91 103 29.89 110 20.41 100 11.96 85 18.87 97 25.35 82
88 March 24.90 96 26.64 101 26.31 101 29.02 107 21.04 104 12.80 91 19.71 101 27.11 82 88
Apr i l May
24.52 94 26.16 99 26.80 103 26.29 97 20.44 101 13.47 96 20.04 103 28.05 91 Apr i l May 28.70 110 26.59 101 28.47 109 26.05 96 20.95 103 14.63 104 19.90 102 27.73 90 June 31.31 120 30.83 117 32.13 123 29.11 108 22.88 113 16.30 116 21.82 112 34.09 110 July 26.37 101 29.56 112 27.84 107 27.90 103 20.55 101 15.18 108 19.95 103 34.29 111 August 25.95 100 23.38 89 23.36 90 23.82 88 18.30 90 14.01 100 19.26 99 26.14 84 September 23.54 90 20.22 77 20.07 77 20.65 76 17.13 84 12.86 91 17.39 89 26.04 84 October 21.93 84 20.07 76 19.88 76 20.71 77 17.32 85 12.84 91 16.48 85 32.02 103 November 26.68 102 24.88 94 24.15 93 27.64 102 20.95 103 15.21 108 19.70 101 34.77 112 December 27.24 105 31.31 119 28.82 111 34.14 126 24.18 119 16.47 117 22.03 113 46.05 149 Year Average 26.04 100 26.37 100 26.08 100 27.07 100 20.33 100 14.08 100 19.45 100 30.96 100
Month Ladies Fingers 5 year Seasonal
average price Rs/Kg - J -index
Brinjals Capsicum Pumpking 5 year Seasonal 5 year Seasonal 5 year Seasonal
average price average price average price Rs/Kg index Rs/Kg index Rs/Kg index
Cucumber Bitter gourd Snake gourd Luffa 5 year Seasonal 5 year Seasonal 5 year Seasonal 5 year Seasonal
price average price average price n - s r L index Rs/Kg index
average price average Rs/Kg index Rs/Kg index Rs,
January 21.39 90 22.70 100 35.36 100 11.41 86 14.60 95 23.25 93 15.84 93 18.75 88 February 23.84 101 20.84 92 34.74 99 10.85 82 14.92 97 22.90 92 16.27 96 19.13 90 March 23.83 101 20.06 88 33.88 96 11.60 88 14.35 93 22.88 92 16.28 96 19.95 94 Apri l May
22.82 97 21.00 93 32.60 93 1X72 96 15.13 98 23.23 93 16.06 94 20.69 97 Apri l May 24.79 105 21.93 97 31.20 89 13.59 103 16.41 107 25.24 101 17.27 101 22.34 105 June 27.12 115 24.57 108 36.06 102 14.15 107 17.24 112 26.98 108 18.78 110 24.07 113 July 24.36 103 23.22 102 38.16 108 14.16 107 15.86 103 24.88 100 16.74 98 21.75 102 August 22.21 94 21.88 97 35.13 100 14.37 109 . 14.51 94 23.67 95 16.30 96 19.64 92 September 20.44 86 21.66 96 31.75 90 13.82 104 13.17 86 22.56 91 14.38 84 18.75 88 October 21.75 92 22.70 100 33.74 96 13.88 105 14.59 95 24.94 100 16.44 97 21.44 101 November 26.08 110 25.09 111 38.72 110 14.31 108 17.04 111 29.07 117 20.06 118 24.99 118 December 25.00 106 26.42 117 40.95 116 13.86 105 16.93 110 29.14 117 19.84 117 23.60 111 Year Average 23.64 100 22.67 100 35.19 100 13.23 100 15.40 100 24.90 100 17.02 100 21.26 100
Source : Marketing & Food Policy Division, ARTI

Table 2.5 Amplitude of seasonal price variance
Vegetables Upcountry
Index of Season Low High
Difference
Beans 84 (Oct.) 120 (June) 36 Carrot 89 (Sept.) 1 1 9 (Dec.) 30 Leeks 76 (Oct.) 123 (June) 47 Beetroot 76 (Sept.) 126 (Dec.) 50 Knolkhol 84 (Sept.) 119 (Dec.) 35 Radish 91 (SeptVOct.) 1 1 7 (Dec.) 26 Cabage 85 (Oct.) 1 1 3 (Dec.) 28 Tomato 84 (AugVSept.) 149 (Dec.) 65
Low country
Ladies Finger 86 (Sept.) 1 1 5 (June) 29 Brinjals 92 (Feb.) 1 1 7 (Dec.) 25 Capsicum 89 (May.) 1 1 6 (Dec.) 27 Pumpking 82 (Feb.) 109 (Aug.) 27 Cucumber 86 (Sept.) 1 1 2 (June) 26 Bitter Gourd 91 (Sept.) 1 1 7 (Nov./Dec.) 26 Snake Gourd 84 (Sept.) 118 (Nov.) 34 Luffa 88 (JanVSept.) 118 (Nov.) 30
Source : Marketing and Food Policy Division, H A R T I
32

Table 2.6 Annual average retail prices of vegetables (Rs/Kg) 1985 -1995
Variaty Year
1985 1986 1987 1988 1989 1990 1991 1992 1993 1994 1995
Beans (Butter) 9.87 11.65 12 .22 14.60 16.26 21.66 23.07 24.93 26.15 34.37 34.66
Beans(Green) 9.88 11.67 12 .22 14.60 16.29 21.66 22.87 24.89 26.15 34.34 34.68
Carrot 10.83 13.56 13.83 14.69 17.61 21.06 22.58 25.91 26.81 35.48 37.84
Leeks 10.53 12.88 12.37 13.57 15.08 20.87 22.66 24.03 28.35 34.48 35.27
Beetroot 10.74 12 .10 11.80 13.48 14.54 20.47 24.34 24.25 28.94 37.36 40.95
Knolkhol 6.94 8.48 8.55 9.77 11.46 15.78 18.29 19.51 2 1 . 3 1 26.74 29.18
Raddish 5.40 6.05 6.71 7.20 8.83 10.60 11.98 14.96 15.34 17.50 19.45
Cabbage 7.89 8.86 10.24 1 1 . 2 6 12.60 15.49 16.32 18.34 20.21 26.92 29.88
Tomatoes 11.80 14.78 15.40 16.85 21.95 25.99 29.46 36.13 4 2 . 1 1 47.20 47.58
Ladies Finger 10.55 10.66 10.79 13.05 14.78 19.94 21.26 23.32 24.86 29.04 28.50
Brinjal 8.16 9.48 9.53 1 1 . 5 1 14.43 18.68 19.61 2 2 . 1 2 24.49 28.46 27.16
Capsicum 12.49 13.81 13.68 16.84 21 .29 28.32 32.95 34.77 37.19 42.79 41.34

Table 2.7 Precentage change in vegetable price 1986 -1995
Variaty 1986 1987 1988 1989 1990
Year 1991 1992 1993 1994 1995 Ave. Change
per year
Beans (Butter) 18.03 4.89 19.48 11.37 33.21 6.51 8.06 4.89 31.43 0.84 13.87
Beans(Green) 18.12 4.71 19.48 11.58 32.97 5.59 8.83 5.06 31.32 0.99 13.86 Carrot 25.21 1.99 6.22 19.88 19.59 7.22 14.75 3.47 32.34 6.65 13.73 Leeks 22.32 -3.96 9.70 11.13 38.40 8.58 6.05 17.98 21.62 2.29 13.41 Beetroot 12.66 -2.48 14.24 7.86 40.78 18.91 -0.37 19.34 29.09 9.61 14.96 Knolkhol 22.19 0.83 14.27 17.30 37.70 15.91 6.67 9.23 25.48 9.12 15.87 Raddish 12.04 10.91 7.30 22.64 20.05 13.02 24.87 2.54 14.08 11.14 13.86 Cabbage 12.29 15.58 9.96 11.90 22.94 5.36 12.38 10.20 33.20 11.00 14.48 Tomato.. 25.25 4.19 9.42 30.27 18.41 13.35 22.64 16.55 12.09 0.81 15.30 Ladies Finger 1.04 1.22 20.95 13.26 34.91 6.62 9.69 6.60 16.81 -1.86 10.92 Brinjal 16.18 0.53 20.78 25.37 29.45 4.98 12.80 10.71 16.21 -4.57 13.24 Capsicum 10.57 -0.94 23.10 26.43 33.02 16.35 5.52 6.96 15.06 -3.39 13.27

« *
Table 2.8 Real price of vegetables (Rs/Kg)
Variaty 1985 1986 1987 1988
Year 1989 1990 1991 1992 1993 1994 1995
Beans 1.76 1.92 1.87 1.96 1.96 2.15 2.04 1.98 1.86 2.25 2 . 1 1 Carrot 1.93 2.24 2 . 1 2 1.97 2 . 1 2 2.09 2.00 2.06 1.90 2.32 2.08 Leeks 1.88 2 .13 1.89 1.82 1.82 2.07 2.00 1.91 2.01 2.26 2.30 Beetroot 1.91 2.00 1.81 1.81 1.75 2.03 2 .15 1.92 2.05 2.45 2 .14 Knolkhol 1.24 1.40 1.31 1.31 1.38 1.56 1.62 1.92 2.05 2 .51 2.49 Raddish 0.96 1.00 1.03 0.97 1.06 1.05 1.06 1.19 1.09 1 .15 1.77 Cabbage 1.41 1.46 1.57 1.51 1.52 1.54 1.44 1.46 1.43 1.76 1.18 Tomatoes 2 .10 2.44 2.36 2.26 2.54 2.58 2.60 2.87 2.99 3.09 1.82 Ladies Finger 1.88 1.76 1.65 1.75 1.78 1.98 1.88 1.85 1.77 1.90 2.89 Brinjal. 1.45 1.56 1.46 1.55 1.74 1.85 1.73 1.75 1.74 1.86 1.73 Capsicum 2.23 2.28 2.10 2.26 2.56 2.81 2.91 2.76 2.64 2.80 1.65 Pumpkin 1 . 1 1 1 .21 1.08 1.04 1.14 1.08 1 . 1 2 1 . 1 2 0.94 1.00 1.00 Cucumber 1 .13 1.23 1.26 0.90 1 .15 1.29 1 .21 1.25 1.16 1.20 1.00 Bitter Gourd 1.68 1.79 1.67 1.71 1.73 1.98 1.97 1.88 1.85 2 .13 1.23 Snake Gourd 1 .10 1.18 1 . 1 1 1.06 1.16 1.34 1.23 1.29 1.28 1.53 1.97 Drumstic 2.36 3.23 2.00 2 .15 2.32 2 .31 0.96 1.14 1.06 1.09 1.47 Luffa 1.59 1.60 1.49 1.44 1.56 1.68 1.63 1.69 1.59 1.76 2.33 Long Beans 1.36 1.50 1.45 1.46 1.52 1.62 1.58 1.59 1.51 1.63 1.80 Ash Plantain. 1 .51 1.73 2.01 1.94 1.88 2.07 2.16 2.31 2.35 2.22 1.62 Green Chi l l i . 2.94 2.88 2.85 3.37 3.57 3.59 3.67 3.20 3.18 3.62 2.01 Lime 3.67 4.78 4.99 4.22 3.41 4.38 5.10 5.17 2.83 4.84 3.39 Sweet Potato 0.90 1.13 1.19 1.09 1.16 1.16 1.34 1.21 1 .13 1.22 1.01 Manioc 0.70 0.69 0.76 0.67 0.73 0.69 0.66 0.77 0.74 0.78 1.01 Mukunuwenna 0.18 0.18 0.19 0.27 0.27 0.26 0.26 0.27 0.31 0.32 0.36 Kankun 0.17 0.18 0.18 0.22 0.21 0.20 0.22 0.22 0.23 0.25 0.32
Source : Marketing and Food Policy Division, H A R T I

Tahle 2.9 Percentage Change in Real Price of Vegetables Vegetable 1986 1987 1988 1989 1990 1991 1992 1993 1994 1995 Ave.cb.ange
per/year Beans 9.31 -2.63 4.82 -0.18 9.65 -5.06 -2.99 -6 .13 2 1 . 1 9 -6.32 2 .17 Carrot 15.95 -5.32 -6.81 7.44 -1.56 -4.43 3.01 -7.42 22.05 -10 .31 1.26 Leeks 13.27 -10.84 -3.76 -0.40 13.92 -3.22 -4.80 5.58 1 2 . 1 5 1.92 2.38 Beetroot 4.33 -9.47 0.22 -3.32 15.88 5.99 -10.56 6.80 19.04 -12.40 1.65 Knol Khol 13 .16 -6.40 0.25 5.13 13.34 3.32 19.03 6.80 22.03 -0.68 7.60 Raddish 3.75 2.96 -5.86 9.92 - 1 . 1 9 0.74 12.78 -8.78 5.13 54.95 7.44 Cabbage 3.99 7.29 -3.53 0.30 1.19 -6.09 0.88 -1.40 22.85 -32.90 -0.74 Tomato 15.99 -3.27 -4.01 12.34 1.29 1.04 10.10 4.30 3.35 - 4 1 . 2 1 -0.10 Ladies Finger -6.43 -6.04 6 .11 1.51 11.05 -4.96 -1 .53 -4.60 7.68 52.25 5.50 Brinjals 7.59 -6.68 5.96 12.37 6.56 -6.42 1.26 -0.92 7.16 -7.00 1.99 Capsicum 2.39 -8.04 8.00 13 .31 9.49 3.71 -5.27 -4.46 6.29 -41.07 -1.56 Pumpkin 8.96 -10.34 -3.97 9.06 -4.94 3.71 -0.20 -16 .41 6.97 -0.20 -0.70 Cucumber 8.65 2.43 -28.92 28.39 12.08 -6.40 3.66 -6.93 3.47 -16.83 -0.40 Bitter Gourd 6.88 -7.08 2.50 1.41 14.33 -0.68 -4.58 - 1 . 1 2 14.80 -42.31 -1.58 Snake Gourd 7.64 -6.79 -3.76 8.75 15.89 -7.96 4.30 -0.69 19.70 28.51 6.60 Drums tic 36.71 -38.16 7.93 7.52 -0.31 -58.59 19.31 -6.71 2.05 35.70 0.55 Luffa 0.82 -6.79 -3.44 8.61 7.40 -3.18 3.87 -5.84 10.89 32 .13 4.45 Long Beans 10.45 -3.60 0.63 4.43 6.49 -2.46 0.52 -5.19 8.51 10 .21 3.00 Ash Plantain 15.18 15.80 -3.44 -2.98 9.98 4.39 6.96 1.85 -5.82 -26.91 1.50 Green chil l i . -2.00 -1.00 18 .17 6.03 0.32 2.25 -12.82 -0.58 13.59 -44.53 -2.02 L ime 30.30 4.33 -15.34 -19.24 28.54 16.26 1.54 -45.24 70.80 -29.96 4.20 Sweet Potato 26.23 4.86 -8.43 6.45 -0.23 16.05 -9.46 -6.94 8.14 8.14 4.48 Manioc -1.03 8.97 - 1 1 . 3 8 9.07 -5.60 -4.06 15.82 -3.92 5.56 30.62 4.40 Mukunuwenna -0.13 3.80 41.94 2.24 -4.63 -0.35 5.35 13 .10 4.26 4.09 6.97 Kankun 1 . 1 1 2.37 21.93 -4.91 -3.02 7.40 -0.50 4.79 10.82 27.19 6.76
Source: Marketing and Food Policy Division, H A R T I

Table 3.1 Frequency Distribution of Fami ly Size
Family A l l sample Baduila Nuwara El iya Kurunegala Anuradhapura Matale Kandy Size No of cumu. No of cumu. No of cumu. No of cumu. No of cumu. No of cumu. No of cumu.
house house house house house house house house house house house house house house holds holds holds holds holds holds holds holds holds holds holds holds holds holds
1 1 1 0 0 0 0 1 1 0 0 0 0 0 0
2 13 14 1 1 1 1 5 6 2 2 2 2 2 2
3 37 5 1 8 9 8 9 6 1 2 5 7 6 8 4 6 4 79 130 1 1 20 13 22 16 28 14 2 1 2 1 29 4 10
5 65 195 1 2 32 1 1 33 10 38 1 7 38 10 39 5 1 5 6 50 245 1 2 44 10 43 6 44 10 48 6 45 6 2 1
7 23 268 6 50 4 47 5 49 4 52 2 47 2 23
8 5 273 2 52 1 48 0 49 1 53 1 48 0 23
9 4 277 1 53 0 48 0 49 0 53 2 50 1 24
10 2 279 0 53 1 49 0 49 1 54 0 50 0 24
> 1 0 2 281 0 53 1 50 0 49 0 54 1 5 1 0 24
Total 281 53 50 49 54 51 24
Source: Survey data

Table 3.2 Age and Sex Distribution of the Sample Population
Age All sample Badulla Nuwaraeliya Group M % F % T % M % F % T % M % F % T % <=6 62 9.24 55 9.32 117 9.28 10 7.46 19 14.07 29 10.78 10 7.46 6 4.96 16 6.27 6-14 137 20.42 108 18.31 245 19.43 21 15.67 15 11.11 36 13.38 24 17.91 22 18.18 46 18.04 15-24 131 19.52 135 22.88 266 21.09 30 22.39 39 28.89 69 25.65 29 21.64 33 27.27 62 24.31 25-34 132 19.67 113 19.15 245 19.43 28 20.90 21 15.56 49 18.22 27 20.15 25 20.66 52 20.39 35-44 88 13.11 94 15.93 182 14.43 13 9.70 18 13.33 31 11.52 19 14.18 18 14.88 37 14.51 45-54 66 9.84 49 8.31 115 9.12 13 9.70 14 10.37 27 10.04 14 10.45 10 8.26 24 9.41 55-64 31 4.62 22 3.73 53 4.20 13 9.70 5 3.70 18 6.69 5 3.73 6 4.96 11 4.31 >=65 24 3.58 14 2.37 38 3.01 6 4.48 4 2.96 10 3.72 6 4.48 1 0.83 7 2.75 Total 671 100 590 100 1261 100 134 100 135 100 26 100 134 100 121 100 255 100
Age Kurunegal a Anuradhapura Mat ale Group M % F % T % M % F % T % M % F % T % <=6 8 6.67 8 8.25 16 7.37 9 10.34 10 13.51 19 11.80 20 14.71 11 10.19 31 12.70 6-14 31 25.83 23 23.71 54 24.88 22 25.29 12 16.22 34 21.12 31 22.79 27 25.00 58 23.77 15-24 23 19.17 19 19.59 42 19.35 17 19.54 18 24.32 35 21.74 20 14.71 16 14.81 36 14.75 25-34 20 16.67 14 14.43 34 15.67 16 18.39 14 18.92 30 18.63 29 21.32 29 26.85 58 23.77 35-44 20 16.67 21 21.65 41 18.89 11 12.64 9 1Z16 20 12.42 18 13.24 16 14.81 34 13.93 45-54 14 11.67 7 7.22 21 9.68 7 8.05 9 12.16 16 9.94 10 7.35 5 4.63 15 6.15 55-64 0 0.00 3 3.09 3 1.38 4 4.60 1 1.35 5 3.11 6 4.41 2 1.85 8 3.28 >=65 4 3.33 2 2.06 6 2.76 1 1.15 1 1.35 2 1.24 2 1.47 2 1.85 4 1.64 Total 120 100 97 100 217 100 87 100 74 100 161 100 136 100 108 100 244 100
Age Group M % F
Kandy % T %
<=6 5 8.33 1 1.82 6 5.22 6-14 8 13.33 9 16.36 17 14.78 15-24 12 20.00 10 18.18 22 19.13 25-34 12 20.00 10 18.18 22 19.13 35-44 7 11.67 12 21.82 19 16.52 45-54 8 13.33 4 7.27 12 10.43 55-64 3 5.00 5 9.09 8 6.96 >=65 5 8.33 4 7.27 9 7.83 Total 60 100 55 100 115 100
M = Male, F = Female, T = Total Source : Survey data

Table 3.3 Educational Level of Sample Population
Level of education M %
All sample F % T % M
Baduila % ¥ % T % M
Nuwaraeliya % F % T %
No schooling but can lead 0 0.00 3 0.55 3 0.26 0 0.00 1 0.79 1 0.40 0 0.00 1 0.89 1 0.41 No schooling & cannot read 5 0.80 14 2.55 19 1.62 2 1.64 8 6.30 10 4.02 1 0.77 1 0.89 2 0.83 Primary grades (1-5) 209 33.60 173 31.57 382 32.65 36 29.51 37 29.13 73 29.32 24 18.46 21 18.75 45 18.60 Grade6-0 /L 269 43.25 224 40.88 493 42.14 45 36.89 39 30.71 84 33.73 61 46.92 53 47.32 114 47.11 OIL. Passed 81 13.02 91 16.61 172 14.70 22 18.03 26 20.47 48 19.28 28 21.54 25 22.32 53 21.90 A/L. Passed 40 6.43 36 6.57 76 6.50 9 7.38 14 11.02 23 9.24 12 9.23 9 8.04 21 8.68 Undergraduate 5 0.80 0 0.00 5 0.43 4 3.28 0 0.00 4 1.61 1 0.77 0 0.00 1 0.41 Graduate 6 0.96 3 0.55 9 0.77 2 1.64 1 0.79 3 1.20 2 1.54 1 0.89 3 1.24 Others 7 1.13 4 0.73 11 0.94 2 1.64 1 0.79 3 1.20 1 0.77 1 0.89 2 0.83 Total 622 100 548 100 1170 100 122 100 127 100 249 100 130 100 112 100 242 100
Level of education M
Kurunegala % F % T % M
Anuradhapura % F % T % M %
Matale F % T %
No schooling but can read 0 0.00 0 0.00 0 0.00 0 0.00 1 1.49 1 0.68 0 0.00 0 0.00 0 0.00 No schooling & cannot read 1 0.88 1 1.09 2 0.97 0 0.00 2 2.99 2 1.37 1 0.83 1 1.02 2 0.92 Primary grades (1-5) 46 40.35 38 41.30 84 40.78 36 45.57 25 37.31 61 41.78 55 45.83 40 40.82 95 43.58 Grade 6 - O/L 52 45.61 46 50.00 98 47.57 38 48.10 28 41.79 66 45.21 50 41.67 41 41.84 91 41.74 O/L. Passed 8 7.02 5 5.43 13 6.31 4 5.06 8 11.94 12 8.22 9 7.50 9 9.18 18 8.26 A/L. Passed 4 3.51 2 2.17 6 2.91 1 1.27 3 4.48 4 2.74 3 2.50 4 4.08 7 3.21 Undergraduate 0 0.00 0 0.00 0 0.00 0 0.00 0 0.00 0 0.00 0 0.00 0 0.00 0 0.00 Graduate 0 0.00 0 0.00 0 0.00 0 0.00 0 0.00 0 0.00 1 0.83 1 1.02 2 0.92 Others 3 2.63 0 0.00 3 1.46 0 0.00 0 0.00 0 0.00 1 0.83 2 2.04 3 1.38 Total 114 100 92 100 206 100 79 100 67 100 146 100 120 100 98 100 218 100
Level of education Kandy M % F % T %
No schooling but can read 0 0.00 0 0.00 0 0.00 No schooling & cannot read 0 0.00 1 1.85 1 0.92 Primary grades (1-5) 12 21.82 12 22.22 24 22.02 Grade 6 - OIL 23 41.82 17 31.48 40 36.70 OIL. Passed 10 18.18 18 33.33 28 25.69 A/L. Passed 9 16.36 6 11.11 15 13.76 Undergraduate 0 0.00 0 0.00 0 0.00 Graduate 1 1.82 0 0.00 1 0.92 Others 0 0.00 0 0.00 0 0.00 Total 55 100 54 100 109 100

Table 3.5 Experience in Vegetable Farming
Period A l l sample Baduila Nuwara E l iya Kurunegala A'pura Matale Kandy No. of years No. % No % No % No % No % No % No % 0-10 91 32.38 14 25.93 10 20.83 17 34.69 17 30.91 22 43.14 1 1 45.83 1 1 - 2 0 122 43.42 15 27.78 22 45.83 27 55.10 30 54.55 2 1 4 1 . 1 8 7 29.17 21 -30 37 1 3 . 1 7 8 14.81 8 16.67 5 10.20 5 9.09 7 13.73 4 16.67 31-40 22 7.83 11 20.37 6 12.50 0 0.00 3 5.45 0 0.00 2 8.33 41-50 7 2.49 4 7.41 2 4 .17 0 0.00 0 0.00 1 1.96 0 0.00 Over 50 2 0.71 2 3.70 0 0.00 0 0.00 0 0.00 0 0.00 0 0.00 Total 281 100 54 100 48 100 49 100 55 100 51 100 24 100
Source: Survey data
Table 3.6 Classification of Vegetable Farmers by Crops
Area Type of farmers % of sole veg. District Location Veg. only Veg. & others farmers
Maha Yala Maha Yala Maha Yala 5 22 19 2 20.83 91.67 18 29 1 2 1 60.00 96.67 23 24 1 0 95.83 100.00 24 24 0 0 100.00 100.00 0 18 24 6 0.00 75.00 4 18 2 1 7 16.00 72.00 6 1 1 23 18 20.69 37.93 1 4 25 22 3.85 15.38 8 1 1 17 14 32.00 44.00 0 20 26 6 0.00 76.92 3 5 2 1 19 12.50 20.83
92 186 189 95 32.74 66.19
Baduila
Nuwara El iya
Kurunegala
Anuradhapura
Matale
Kandy Total
Uva Paranagama Hewanakumbura Kandapola Meepilimana Madahapola Hathalawa Wellaragama Ipalogama Puwakattawela Yatawatta Ethulgama
Source: Survey data

Table 3.4 Occupational Pattern of the Sample Population
Occupation All sample Main % Sec. %
Agricultural operations 395 63.10 226 75.84 Agricultural labourer 4 0.64 23 7.72 Non agricultural labourer 1 0.16 1 0.34 Self employment 12 1.92 28 9.40 Government employment 41 6.55 4 1.34 Private sector 30 4.79 1 0.34 Others 143 22.84 15 5.03 Total 626 100 298 100
Occupation Badulla Nuwara Eliya Kurunegala Main % Sec. % Main % Sec. % Main % Sec. %
Agricultural operations' 96 66.67 48 82.76 69 60.53 45 73.77 71 66.36 43 87.76 Agricultural labourer 2 1.39 1 1.72 0 0.00 7 11.48 2 1.87 1 2.04 Non agricultural labourer 0 0.00 0 0.00 1 0.88 0 0.00 0 0.00 0 0.00 Self employment 0 0.00 3 5.17 7 6.14 7 11.48 2 1.87 4 8.16 Government employment 12 8.33 1 1.72 10 8.77 1 1.64 0 0.00 0 0.00 Private sector 7 4.86 1 1.72 8 7.02 0 0.00 1 0.93 0 0.00 Others 27 18.75 4 6.90 19 16.67 1 1.64 31 28.97 1 2.04 Total 144 100 58 100 114 100 61 100 107 100 49 100
Occupation Anuradhapura Matale Kandy Main % Sec. % Main % Sec. % Main % Sec %
Agricultural operations 48 64.00 29 67.44 80 68.97 45 69.23 31 44.29 16 72.73 Agricultural labourer 0 0.00 3 6.98 0 0.00 11 16.92 0 0.00 0 0.00 Non agricultural labourer 0 0.00 0 0.00 0 0.00 0 0.00 0 0.00 1 4.55 Self employment 0 0.00 5 11.63 2 1.72 6 9.23 1 1.43 3 13.64 Government employment 4 5.33 1 2.33 5 4.31 0 0.00 10 14.29 1 4.55 Private sector 8 10.67 0 0.00 2 1.72 0 0.00 4 5.71 0 0.00 Others 15 20.00 5 11.63 27 23.28 3 4.62 24 34.29 1 4.55 Total 75 100 43 100 116 100 65 100 70 100 22 100 Source: Survey data Sec.= Secondary occupation Main = Main occupation

Table 3.7 Importance of Vegetable Farming as an Income Source
District Main income
Secondary income
Total % of main income to the total
Baduila 5 1 3 54 94.44 Nuwara E l iya 40 8 48 83.33 Kurunegala 45 4 49 91.84 Anuradhapura 51 4 55 92.73 Matale 44 7 51 86.27 Kandy 22 2 24 91.67
Total 253 28 281 90.04
^ Source: Survey data to
Table 3.8 Factors Affecting the Selection of Crops
Reasons A l l sample Baduila Nuwara El iya Kurunegala A'pura Matale Kandy No. % No. % No. % No % No % No % No. %
Suitability 88 31 .32 1 7 31.48 30 62.50 13 26.53 16 29.09 9 17.65 3 12.50 Followed others 7 2.49 3 5.56 1 2.08 0 0.00 1 1.82 1 1.96 1 4.17 High price 1 1 7 41.64 2 1 38.89 9 18.75 25 51.02 20 36.36 24 47.06 18 75.00 Availability of seeds 5 1.78 3 5.56 0 0.00 1 2.04 0 0.00 1 1.96 0 0.00 Request from buyers 2 0.71 1 1.85 0 0.00 0 0.00 1 1.82 0 0.00 0 0.00 Easy to cultivate 36 12 .81 5 9.26 4 8.33 5 10.20 9 16.36 1 1 21 .57 2 8.33 Others 26 9.25 4 7.41 4 8.33 5 10.20 8 14.55 5 9.80 0 0.00 Total 281 100 54 100 48 100 49 100 55 100 51 100 24 100
Source: survey data

Table 3.9 Number of Vegetable Plots Grown by a Farmer
No. of plots Number of farmers A l l sample
Maha % Yala % 1 126 54.31 1 2 1 53.54 2 67 28.88 60 26.55 3 29 12.50 25 11.06 4 8 3.45 17 7.52 5 2 0.86 3 1.33 Over 5 0 0.00 0 0.00
Total 232 100 226 100
No. of plots
1 2 3 4 5
Over 5 Total
No. of plots
1 2 3 4 5
Over 5 Total
Badulla Number of farmers
Nuwaraeliya Kurunegala Maha % Yala % Maha % Yala % Maha % Yala %
20 40.00 14 28.00 23 63.89 2 1 65.62 28 75.68 33 68.75 18 36.00 17 34.00 8 22.22 6 18.75 7 18.92 9 18.75
8 16.00 14 28.00 4 1 1 . 1 1 4 12.50 1 2.70 2 4 .17 2 4.00 3 6.00 1 2.78 1 3 .12 1 2.70 4 8.33 2 4.00 2 4.00 0 0.00 0 0.00 0 0.00 0 0.00 0 0.00 0 0.00 0 0.00 0 0.00 0 0.00 0 0.00
50 100 50 100 36 100 32 100 37 100 48 100
Maha % Anuradhapura
Yala
Number of farmers Matale Kandy
22 15 13
3 0 0
53
4 1 . 5 1 28.30 24.53
5.66 0.00 0.00
100
16 9 1 0 0 0
26
61.54 34.62
3.85 0.00 0.00 0.00
100
Maha % Yala % Maha % Yala % 22 6 1 . 1 1 22 45.83 1 1 55.00 15 68.18 12 33.33 13 27.08 8 40.00 7 31.82
2 5.56 4 8.33 1 5.00 0 0.00 0 0.00 8 16.67 0 0.00 0 0.00 0 0.00 1 2.08 0 0.00 0 0.00 0 0.00 0 0.00 0 0.00 0 0.00
36 100 48 100 20 100 22 100
Source: Survey data

Table 3.10 F a r m Size
Size(acres) All sample Baduila Nuwara eliya Kurunegala Anuradhapura Matale Kandy No. % No. % No. % No. % No. % No. % No. %
0 - 0.250 11 4.12 0 0.00 7 18.92 1 2.70 0 0.00 2 5.56 1 5.00 0.250 - 0.500 33 14.16 10 20.00 6 16.22 3 8.11 2 4.45 7 19.44 5 25.00 0.500-0.750 54 23.18 15 30.00 9 24.32 6 16.22 2 4.45 12 33.33 10 50.00 0.750 - 1.000 18 7.73 2 4.00 7 18.92 1 2.70 4 8.91 2 5.56 2 10.00 1.000- 1.250 58 24.89 17 34.00 5 13.51 7 18.92 8.9 19.82 10 27.78 2 10.00 1.250- 1.500 4 1.72 2 4.00 1 2.70 0 0.00 1 2.23 0 0.00 0 0.00 1.500- 1.750 13 5.58 1 2.00 0 0.00 4 10.81 7 15.59 1 2.78 0 0.00 1.750-2.000 0 0.00 0 0.00 0 0.00 0 0.00 0 0.00 0 0.00 0 0.00
O V E R 2 42 18.03 3 6.00 2 5.41 15 40.54 20 44.54 2 5.56 0 0.00 T O T A L 233 100 50 100.00 37 100.00 37 100.00 44.9 100.00 36 100.00 20 100.00
Y A L A S E A S O N
Size(acres) All sample Baduila Nuwara eliya Kurunegala Anuradhapura Matale Kandy No. % No. % No. % No. % No. % No. % No. %
0 - 0.250 27 11.89 4 8.16 17 48.57 1 2.08 0 0.00 3 4.05 1 14.29 0.250 - 0.500 33 14.54 14 28.57 4 11.43 1 2.08 5 20.83 14 18.92 5 71.43 0.500 - 0.750 66 29.07 15 30.61 3 8.57 12 25.00 8 33.33 7 9.46 1 14.29 0.750- 1.000 18 7.93 4 8.16 5 14.29 0 0.00 2 8.33 10 13.51 0 0.00 1.000- 1.250 46 20.26 11 22.45 5 14.29 13 27.08 4 16.67 6 8.11 0 0.00 1.250 - 1.500 3 1.32 0 0.00 0 0.00 1 2.08 2 8.33 2 2.70 0 0.00 1.500- 1.750 10 4.41 1 2.04 0 0.00 4 8.33 1 4.17 1 1.35 0 0.00 1.750 - 2.000 0 0.00 0 0.00 0 0.00 0 0.00 0 0.00 2 2.70 0 0.00
O V E R 2 24 10.57 0 0.00 1 2.86 16 33.33 2 8.33 29 39.19 0 0.00 TOTAL 227 100 49 100.00 35 100.00 48 100.00 24 100.00 74 100.00 7 100.00
Source : Survey data
« #

Table 3.11 Ownership Pattern of Vegetable Plots
Type Maha Yala No. % No. %
Owner operator 218 56.19 223 61.60 Joint ownership 17 4.38 25 6.91 Lease 26 6.70 34 9.39 Tenant 22 5.67 40 11.05 Mortgage 1 0.26 2 0.55 LDO 88 22.68 21 5.80 Others 16 4.12 17 4.70 Total plots 388 100.00 362 100.00 MAHA SEASON
Type Badulla Nuwara Eliya Kurunegala Anuradhapura Matale Kandy No. % No. % No. % No. % No. % No, %
Owner operator 69 67.65 41 77.36 33 67.35 32 31.07 21 40,38 22 75.86 Joint ownership 11 10.78 1 1.89 0 0.00 1 0.97 3 5.77 1 3.45 Lease 6 5.88 9 16.98 2 4.08 2 1.94 5 9.62 2 6.90 Tenant 10 9.80 1 1.89 1 2.04 2 1.94 4 7.69 4 13.79 Mortgage 1 0.98 0 0.00 0 0.00 0 0.00 0 0.00 0 0.00 LDO 3 2.94 0 0.00 12 24.49 66 64.08 7 13.46 0 0.00 Others 2 1.96 1 1.89 1 2.04 0 0.00 12 23.08 0 0.00 Total plots 102 100.00 53 100.00 49 100.00 103 100.00 52 100.00 29 100.00 YALA SEASON
Type Badulla Nuwara Eliya Kurunegala Anuradhapura Matale Kandy No. % No- % No. % No, % No. % No. %
Owner operator 67 70.53 24 72.73 56 76.71 28 80.00 27 27.84 21 72.41 Joint ownership 9 9.47 0 0.00 0 0.00 3 8.57 12 12.37 1 3.45 Lease 5 5.26 7 21.21 3 4.11 3 8.57 12 12.37 4 13.79 Tenant 8 8.42 1 3.03 0 0.00 0 0.00 28 28.87 3 10.34 Mortgage 2 2.11 0 0.00 0 0.00 0 0.00 0 0.00 0 0.00 LDO 2 2.11 0 0.00 12 16.44 1 2.86 6 6.19 0 0.00 Others 2 2.11 1 3.03 2 2.74 0 0.00 12 12.37 0 0.00 Total plots 95 100.00 33 100.00 73 100.00 35 100.00 97 100.00 29 100.00 Source: Survey data

r~ a y s a
G
Table 3 .12 Rotation of Crops
fiespons A l l sample Baduila N'eliya Ku'gala A'pura Matale Kandy NO.O.F. % No.o.F. % No.oJ 1. % N0.0JF. % No.o.F. % No.o.F. % N0.0.F.
SYes 238 86.55 47 90.38 45 90.00 34 75.56 46 86.79 44 86.27 22 91.67 •No 37 13.45 5 9.62 5 10.00 1 1 24.44 7 13 .21 7 13.73 2 8.33 Total 275 100.00 52 100.00 50 100.00 45 100.00 53 100.00 51 100.00 24 100.00
Source: Survey data
Table 3 . 1 3 Pattern of Cultivation
Respons A l l sample Baduila N'eliya Ku'gala A'pura Matale Kandy
Mono-cropping 156 Mixed-
50.16 25 46.30 20 38.46 20 40.00 56 71.79 20 39.22 15 57.69
cropping 95 Multi-
30.55 20 37.04 27 51.92 18 36.00 4 5.13 15 29.41 1 1 42.31
cropping 60 Total 3 1 1
19.29 100.00
9 54
16.67 100.00
5 52
9.62 100.00
1 2 50
24.00 100.00
18 78
23.08 100.00
16 51
31.37 100.00
0 26
0.00 100.00
Source: survey data

9
Table 3.14 Source of Water
Type of water A l l sample Baduila N ' E l iya Ku'gala A'pura Matale Kandy supply No. % No. % No. % No. % No. % No. % No. %
Major irrigation 36 9.30 17 16.83 1 1.89 0 0.00 9 8.74 9 1 7 . 3 1 0 0.00 Minor irrigation 69 17.83 39 38.61 13 24.53 7 14.29 0 0.00 2 3.85 8 27.59 Rainfed 173 44.70 37 36.63 7 1 3 . 2 1 1 2 24.49 92 89.32 25 48.08 0 0.00 Water pump 69 17.83 7 6.93 24 45.28 22 44.90 0 0.00 16 30.77 0 0.00 Agro well 16 4.13 0 0.00 6 1 1 . 3 2 8 16.33 2 1.94 0 0.00 0 0.00 Others 24 6.20 1 0.99 2 3.77 0 0.00 0 0.00 0 0.00 2 1 72.41 Total 387 100 1 0 1 100.00 53 100.00 49 100.00 103 100.00 52 100.00 29 100.00 Y A L A S E A S O N
Number of plots Type of water A l l sample Baduila N* E l iya Ku'gala A'pura Matale Kandy
supply No. % No. % No. % No. % No. % No. % No. % Major irrigation 29 7.99 24 24.74 1 3.03 0 0.00 0 0.00 4 4 .17 0 0.00 Minor irrigation 70 19.28 39 40.21 6 18.18 2 2.74 2 5.71 1 1 11.46 10 34.48 Rainfed 100 27.55 23 23 .71 4 1 2 . 1 2 15 20.55 8 22.86 50 52.08 19 65.52 Water pump 92 25.34 3 3.09 18 54.55 40 54.79 0 0.00 3 1 32.29 0 0.00
Agro well 44 1 2 . 1 2 1 1.03 3 9.09 15 20.55 25 71.43 0 0.00 0 0.00 Others 28 7.71 7 7.22 1 3.03 1 1.37 0 0.00 0 0.00 0 0.00 Total 363 100 97 100.00 33 100.00 73 100.00 35 100.00 96 100.00 29 100.00
Source: Survey data
M A H A S E A S O N Number of plots

Table 3.15 Source of Seed Supply
Source Potatoes Beans Cabbage Carrot Leeks Raddish Tomatoes Beetroot Capsicum No. % No. % No. % No. % No. % No. % No. % No. % No. %
Own seeds 11 12.09 45 58.44 2 3.23 1 2.94 1 5.26 1 6.67 10 15.15 0 0.00 0 0.00 Purchased in the market 31 34.07 24 31.17 53 85.48 33 97.06 18 94.74 14 93.33 28 42.42 44 97.78 11 84.62 Dept. of AgriAAgrarian services 48 52.75 8 10.39 6 9.68 0 0.00 0 0.00 0 0.00 28 42.42 0 0.00 1 7.69 Purchased from a farmer on cash 0 0.00 0 0.00 1 1.61 0 0.00 0 0.00 0 0.00 0 0.00 1 2.22 1 7.69 Purchased from a farmer on credit 0 0.00 0 0.00 0 0.00 0 0.00 0 0.00 0 0.00 0 0.00 0 0.00 0 0.00 Exchange through farmer 1 1.10 0 0.00 0 0.00 0 0.00 0 0.00 0 0.00 0 0.00 0 0.00 0 0.00 Others 0 0.00 0 0.00 0 0.00 0 0.00 0 0.00 0 0.00 0 0.00 0 0.00 0 0.00 Total 91 100 77 100 62 100 34 100 19 100 15 100 66 100 45 100 13 100
oo Source Pumpkin Cucumber Luffa Long beans Ladies fingers Bitter gourd Brinjals G.chillies Snake gourd
No. % No. % No. % No. % No. % No. % No. % No. % No. %
Own seeds 28 100.00 6 66.67 20 47.62 21 84.00 9 18.00 11 39.29 43 89.58 23 54.76 16 66.67 Purchased in the market 0 0.00 2 22.22 9 21.43 1 4.00 19 38.00 3 10.71 2 4.17 12 28.57 5 20.83 Dept. of AgriAAgrarian services 0 0.00 1 11.11 11 26.19 3 12.00 21 42.00 13 46.43 2 4.17 7 16.67 2 8.33 Purchased from a farmer on cash 0 0.00 0 0.00 0 0.00 0 0.00 0 0.00 0 0.00 0 0.00 0 0.00 0 0.00 Purchased from a farmer on credit 0 0.00 0 0.00 0 0.00 0 0.00 0 0.00 0 0.00 0 0.00 0 0.00 0 0.00 Exchange through farmer 0 0.00 0 0.00 1 2.38 0 0.00 0 0.00 1 3.57 1 2.08 0 0.00 1 4.17 Others 0 0.00 0 0.00 1 2.38 0 0.00 1 2.00 0 0.00 0 0.00 0 0.00 0 0.00 Total 28 100 9 100 42 100 25 100 50 100 28 100 48 100 42 100 24 100
Source : Survey data
ft

Table 3.16 Type of Payment for Seeds
Crop On cash On credit Exchange Other Total No. % No. % No. % No. %
Potatoes 76 83.52 5 5.49 0 0.00 10 10.99 91 Beans 34 44.74 1 1.32 0 0.00 41 53.95 76 Cabbage 59 95.16 2 3.23 0 0.00 1 1.61 62 Carrot 32 94.12 2 5.88 0 0.00 0 0.00 34 Leeks 17 89.47 1 5.26 0 0.00 1 5.26 19 Tomatoes 55 83.33 1 1.52 0 0.00 10 15 .15 66 Beetroot 43 95.56 1 2.22 0 0.00 1 2.22 45 Luffa 2 1 50.00 1 2.38 1 2.38 19 45.24 42 Ladies fingers 42 84.00 1 2.00 0 0.00 7 14.00 50 Bitter gourd 16 57.14 0 0.00 0 0.00 1 2 42.86 28 Brinjals 5 10.42 0 0.00 1 2.08 42 87.50 48 Green chillies 1 7 40.48 3 7.14 0 0.00 22 52.38 42
Source: survey data
Table 3 .17 Fertil izer Use by Crops
Crop Chemical only Carbonic only Both Total No. % No. % No. %
Potatoes 23 26.14 0 0.00 65 73.86 88 Beans 40 54.05 1 1.35 33 44.59 74 Cabbage 18 31.03 1 1.72 39 67.24 58 Carrot 3 9.38 0 0.00 29 90.62 32 Leeks 2 11.76 0 0.00 15 88.24 17 Tomatoes 39 60.94 1 1.56 24 37.50 64 Beetroot 20 47.62 0 0.00 22 52.38 42 Luffa 18 85.71 1 4.76 2 9.52 2 1 Long beans 9 90.00 0 0.00 1 10.00 10 Ladies fingers 20 95.24 0 0.00 1 4.76 2 1 Bitter gourd 22 81.48 0 0.00 5 18.52 27 Brinjals 38 82.61 0 0.00 8 17.39 46 Green chillies 34 89.47 0 0.00 4 10.53 38 Capsicum 15 88.24. 0 0.00 2 11.76 17
Source-: Survey data
49

Table 3.18 Source of Supply of Fertilizer
(a) Chemical Fertilizer
Source All sample Baduila N* eliya K' gala A'pura Matale Kandy No.o.f. % No.o f. % No.oi. % No.o.f. % No.oX % No.o f. % No.o.f. %
Trader pur. crops 36 13-53 4 7.69 6 12.00 2 4.17 4 9.76 20 40.00 0 0.00 Other traders 186 69.9 2 47 90.38 44 88.00 39 81.25 33 80.49 11 22.00 12 48.00 A.S.C. 29 10.90 0 0.00 0 0.00 1 2.08 0 0.00 19 38.00 9 36.00 Other fanner 0 0.00 0 0.00 0 0.00 0 0.00 0 0.00 0 0.00 0 0.00 Others 15 5.64 1 1.92 0 0.00 6 1230 4 9.76 0 0.00 4 16.00 Total 266 100.00 52 100.00 50 100.00 48 100.00 41 100.00 50 100.00 25 100.00
(b). Organic Fertilizer
Source All sample Baduila N' eliya K' gala A'pura Matale Kandy No.o.f. % No.o.1. % No.o.f. % No.o.f. % No.o.f. % No.o.f. % No.o.f. %
Ownfer. 22 21.78 5 22.73 5 10.42 2 100.00 3 50.00 0 0.00 7 36.84 Bought 79 78.22 17 77.27 43 8938 0 0.00 3 50.00 4 100.00 12 63.16 Exchange 0 0.00 0 0.00 0 0.00 0 0.00 0 0.00 0 0.00 0 0.00 Total 101 100.00 22 100.00 48 100.00 2 100.00 6 100.00 4 100.00 19 100.00
Source: Survey data

(a) Chemical Fertilizer Table 3.19 Type of Payments for Fertilizer
Source All sample Badulla N' Eliya K' gala A'pura Matale Kandy No.o.f. % No.o.f. % No.oi. % No.o.f. % No.o.f. % No.o.f. % No.oi. %
On cash 220 82.71 45 86.54 45 90.00 45 93.75 37 90.24 28 56.00 20 80.00 On credit 46 17.29 7 13.46 5 10.00 3 6.25 4 9.76 22 44.00 5 20.00 Exchange 0 0.00 0 0.00 0 0.00 0 0.00 0 0.00 0 0.00 0 0.00 Total 266 100.00 52 1C0.00 50 100.00 48 100.00 41 100.00 50 100.00 25 100.00
(b) Organic Fertilizer
Type All sample Badulla N* Eliya K' gala A'pura Matale Kandy Type No.o.f. % No.o.f. % No.o.f. % No.o.f. % No.o.f. % No.o.f. % No.o.f. %
On cash 78 77.23 16 72.73 41 85.42 1 50.00 4 80.00 4 100.00 12 63.16 On credit 8 7.92 1 4.55 6 12.50 1 50.00 0 0.00 0 0.00 0 0.00 Exchange 0 0.00 0 0.00 0 0.00 0 0.00 0 0.00 0 0.00 0 0.00 Other 15 14.85 5 22.73 1 2.08 0 0.00 1 20.00 0 0.00 7 36.84 Total 101 100.00 22 100.00 48 100.00 2 100.00 5 100.00 4 100.00 19 100.00
Source : Survey data

Table 3.20 Source of Obtaining Agro Chemicals
Source
to
All sample Baduila Nuwara Eliya Kurunegala Anuradhapura Matale Kandy No. % No. % No. % No. % No. % No. % No. %
Trader purchase products 26 9.63 3 5.77 2 4.00 1 2.08 3 7.14 17 33.33 0 0.00 Other traders 221 81.85 48 92.31 48 96.00 44 91.67 37 88.10 22 43.14 20 80.00 Purchased by a farmer 1 0.37 0 0.00 0 0.00 0 0.00 0 0.00 1 1.96 0 0.00 Agrarian services centre 18 6.67 1 1.92 0 0.00 1 2.08 0 0.00 11 21.57 5 20.00 Burrowed from a farmer 1 0.37 0 0.00 0 0.00 0 0.00 1 2.38 0 0.00 0 0.00 Exchange 0 0.00 0 0.00 0 0.00 0 0.00 0 0.00 0 0.00 0 0.00 Other 3 1.11 0 0.00 0 0.00 2 4.17 1 2.38 0 0.00 0 0.00 Total 270 100.00 52 100.00 50 100.00 48 100.00 42 100.00 51 100.00 25 100.00
Source: : Survey data Table 3.21 Type of Payment for Agro Chemicals
Type All sample
No.oX % Baduila Nuwara Eliya Kurunegala Anuradhapura Matale
No.o.f. % No.o.f. % No.o.f. % No.o.f. % No.o.f. % Kandy
No.o.f. % On cash 225 83.33 45 84.91 43 86.00 47 95.92 33 78.57 33 64.71 24 96.00 On credit 45 16.67 8 15.09 7 14.00 2 4.08 9 21.43 18 35.29 1 4.00 Exchange 0 0.00 0 0.00 0 0.00 0 0.00 0 0.00 0 0.00 0 0.00 Total 270 100.00 53 100.00 50 100.00 49 100.00 42 100.00 51 100.00 25 100.00
source: Survey data

Table 3.22 Use of Labour
All sample Badulla N' eliya K' gala A'pura Matale Kandy % No.o.f. % No.o.f. %
i l l f f i On cash
225 83.33 45 84.91 43 86.00 47 95.92 33 78.57 33 64.71 24 96.00
On credit 45 16.67 8 15.09 7 14.00 2 4.08 9 21.43 18 35.29 1 4.00 Exchange 0 0.00 0 0.00 0 0.00 0 0.00 0 0.00 0 0.00 0 0.00
Total 270 100.00 53 100.00 50 100.00 49 100.00 42 100.00 51 100.00 25 100.00
Source : Survey data

Table 3.23 Labour Use by Operations
Operation A l l Sample Badulla N'Eliya K' gala A'pura Matale Kandy Operation FX. % H.L. % F.L.9I , H.L.% F.L. % H.L. % PL. % H.L.% > F.L. % H.L. % F.L .%H.L.% F.L. % H-L
Land preperation 43 57 41 59 35 65 52 48 51 49 41 59 31 69
Planting/ sowing 55 45 63 37 53 47 63 37 51 49 47 53 47 53 Fertilizing 73 27 82 18 55 45 77 23 75 25 67 33 87 13 Insecticide spray 81 19 82 18 80 20 80 20 85 15 75 25 88 12 Weeding 58 42 75 25 55 45 61 39 49 51 50 50 59 41 Maintanance 87 13 89 11 84 16 89 11 90 10 82 18 89 11 Harvesting 51 49 51 49 41 59 64 36 49 51 47 53 57 43 Others 75 25 78 22 69 31 80 20 84 16 71 29 62 38
Source: Survey data Table 3.24 Source of Credit
Source A l l sample Badulla N'eliya K' gala A'pura Matale Kandy No. % No. % No. % No. % No. % No. % No. %
Cooperative banks 26 11.93 3 6.38 1 2.63 15 40.54 1 2.63 1 2.22 5 38.46
Government banks 72 33.03 12 25.53 24 63.16 5 13.51 21 55.26 8 17.78 2 15.38 Money lender 10 4.59 4 8.51 3 7.89 0 0.00 1 2.63 2 4.44 0 0.00 Trader 56 25.69 17 36.17 2 5.26 8 21.62 2 5.26 26 57.78 1 . 7.69 Relations / Friends 45 20.64 10 21.28 6 15.79 7 18.92 12 31.58 7 15.56 3 23.08 Others 9 4.13 1 2.13 2 5.26 2 5.41 1 2.63 1 2.22 2 15.38 Total 218 100.00 47 100.00 38 100.00 37 100.00 38 100.00 45 100.00 13 100.00
Source : Survey data

Table 3.25 Yield Variation Over Time
Crop Districts Minimum Maximum Average Crop yield yield yield
Potatoes Baduila 1738.35 6265.15 3769.07
Nuwara El iya 2148 .11 9043.24 6485.74
Beans Baduila 1849.83 4422.00 3179.01 Kandy 1118.42 3494.15 2295.32
Cabbage Baduila 1583.07 10673.98 8173.98 Nuwara El iya 2683.33 7833.33 7083.33 Kandy 1061.32 4980.35 4689.12
Carrot Nuwara El iya 2337.21 8786.34 8197.67
Leeks Nuwara El iya 6574.34 17857.14 8775.51
Tomatoes Baduila 3661.91 9032.59 7403.26
Matale 1402.19 6923.36 6406.54
Kandy 653.32 4676.32 3177 .17
Beetroot Nuwara El iya 5950.78 18549.22 12227.98 Kurunegala 1851.20 12320.00 4688.00
Luffa Anuradhapura 1209.47 4071.58 1333.33 Long beans Kurunegala 488.28 2041.38 1468.97 Ladies fingers Anuradhapura 1501.07 5155.75 1109.51
Matale 795.86 4497.04 4644.97 Bitter gourd Matale 2976.19 7710 .15 7023.11 Brinjals Anuradhapura 1757.96 6471.15 5705.96
Snake gourd Kurunegala 6160.00 28000.00 16960.00 Matale 3250.00 11000.00 10200.00
Source: Survey data
Table 3.26 Production Problems Reported by Farmers
Problems No of farmers % * High input cost 165 92.18
Lack of financing 1 1 1 62.01 Lack of water 100 55.87 Difficulties in obtaining seeds 89 49.72 Poor extension service 62 34.64
* Percentage of the farmers who reported problems (179) Source: Survey data
55

Tab le 4.1 Marketable Surplus of Selected Vegetables
Crop Own Retained for Payments Wastage at Marketable consumption % seeds % in kind % farm level % surplus %
Potatoes 2 7 1 4 86 Beans 2 4 1 4 89 Cabbage 1 0 1 6 92 Tomatoes 2 1 1 8 88 Pumpkin 3 2 1 4 90 Beetroot 1 0 1 3 95 Luffa 1 1 1 5 92 Long beans 2 2 1 4 91 Ladies fingers 1 1 1 5 92 Bitter gourd 1 2 1 5 91 Brinjals 1 1 1 8 89 Green chillies 2 0 1 3 94 Snake gourd 1 2 1 6 90 Average 1.54 1.77 1.00 5.00 90.69
Source: Survey data

• t
Table 4.2 Marketing Outlets
Market outlet A l l sample Baduila Nuwaraeliya Kurunegala Anuradhapura Matale Kandy
No. % No. % No. % No. % No. % No. % No. %
Manning market 42 16.03 27 51.92 9 18.00 4 8.16 1 2.86 1 1.96 0 0.00
Kandy market 27 10.31 0 0.00 2 4.00 0 0.00 0 0.00 0 0.00 25 100.00
Rural collector 133 50.76 15 28.85 31 62.00 30 61.22 12 34.29 45 88.24 0 0.00
Outside collector 41 15.65 10 19.23 6 12.00 4 8.16 19 54.29 2 3.92 0 0.00
Village boutique 6 2.29 0 0.00 0 0.00 1 2.04 2 5.71 3 5.88 0 0.00
Purchasing centers 1 0.38 0 0.00 1 2.00 0 0.00 0 0.00 0 0.00 0 0.00
Cooperatives 0 0.00 0 0.00 0 0.00 0 0.00 0 0.00 0 0.00 0 0.00
Farmer organizations 0 0.00 0 0.00 0 0.00 0 0.00 0 0.00 0 0.00 0 0.00
Fairs 10 3.82 0 0.00 0 0.00 9 18.37 1 2.86 0 0.00 0 0.00
Trader (agreement) 2 0.76 0 0.00 1 2.00 1 2.04 0 0.00 0 0.00 0 0.00
Others 0 0.00 0 0.00 0 0.00 0 0.00 0 0.00 0 0.00 0 0.00
Total 262 100.00 52 100.00 50 100.00 49 100.00 35 100.00 51 100.00 25 100.00
Source : Survey data
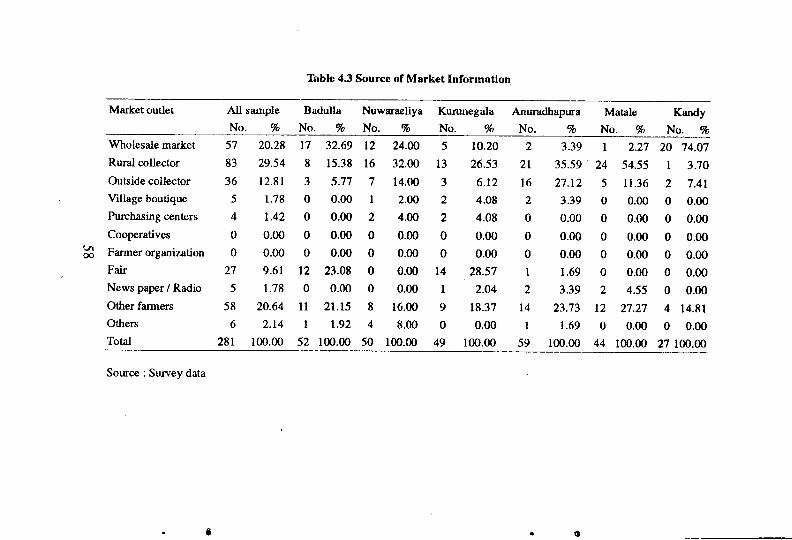
Table 43 Source of Market Information
Market outlet A l l sample Badulla Nuwaraeliya Kurunegala Anuradhapura Matale Kandy No. % No. % No. % No. % No. % No. % No. %
Wholesale market 57 20.28 17 32.69 12 24.00 5 10.20 2 3.39 1 2.27 20 74.07 Rural collector 83 29.54 8 15.38 16 32.00 13 26.53 21 35.59 24 54.55 1 3.70 Outside collector 36 12.81 3 5.77 7 14.00 3 6.12 16 27.12 5 11.36 2 7.41 Village boutique 5 1.78 0 0.00 1 2.00 2 4.08 2 3.39 0 0.00 0 0.00 Purchasing centers 4 1.42 0 0.00 2 4.00 2 4.08 0 0.00 0 0.00 0 0.00 Cooperatives 0 0.00 0 0.00 0 0.00 0 0.00 0 0.00 0 0.00 0 0.00 Fanner organization 0 0.00 0 0.00 0 0.00 0 0.00 0 0.00 0 0.00 0 0.00 Fair 27 9.61 12 23.08 0 0.00 14 28.57 1 1.69 0 0.00 0 0.00 News paper / Radio 5 1.78 0 0.00 0 0.00 1 2.04 2 3.39 2 4.55 0 0.00 Other farmers 58 20.64 11 21.15 8 16.00 9 18.37 14 23.73 12 27.27 4 14.81 Others 6 2.14 1 1.92 4 8.00 0 0.00 1 1.69 0 0.00 0 0.00 Total 281 100.00 52 100.00 50 100.00 49 100.00 59 100.00 44 100.00 27 100.00
Source : Survey data
6 • »

Table 4.4 Marketing Problems Reported by Farmers
Problems No. of farmers % *
Unreasonable price 141 78.77
Poor road facilities 90 50.28
Malpractices in purchasing 51 28.49
Dificulty in selling 47 26.26
Price fluctuation 47 26.26
* Percentage of the farmers who reported problems (179)
Source: Survey data
59

ANNEXURE ONE
STATEMENT OF FINANCE1NG
A. Original Allocation
Item 1993 Rs.
1994 Contractual Staff 0 120,00 Expendable Supplies 0 20,000 Travel and Subsistence 1000 323,750 Other 0 53,000 Contingencies 0 61,675 Total 1000 578,425
B. Revised Allocation for 1994
Item Rs, Contractual Staff 120,000 Expendable Supplies 14,000 Travel and Subsistence 296,625 Other 37,100 Contingencies 46,773
514,498
2 \ 8 9 8
60
. J