Embed Size (px)
Citation preview
Production and Marketing of Rice Seed and Institutional Constraints for Quality
Seed Distribution in Odisha
Dr Debdutt Behura
Department of Agribusiness Management Odisha University of Agriculture and Technology,
Bhubaneswar
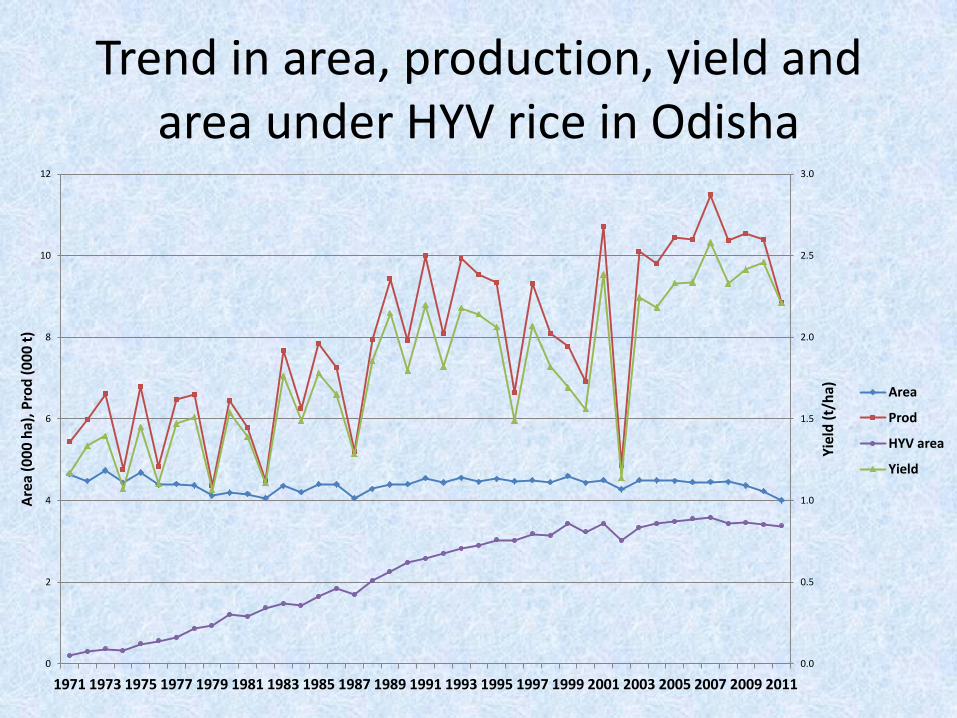
Trend in area, production, yield and area under HYV rice in Odisha
0.0
0.5
1.0
1.5
2.0
2.5
3.0
0
2
4
6
8
10
12
1971 1973 1975 1977 1979 1981 1983 1985 1987 1989 1991 1993 1995 1997 1999 2001 2003 2005 2007 2009 2011
Yie
ld (
t/h
a)
Are
a (0
00
ha)
, Pro
d (
00
0 t
)
Area
Prod
HYV area
Yield
Potential of Improved Seed • Intensive agriculture requires optimum levels of inputs
• Seed is the most important input, which determines the performance potential of a variety
• Improved high yielding varieties and high quality seeds help increase productivity
• Value added traits help reduction in losses due to pest & disease attacks and increases profitability
• Application of pesticides, nutrients, bioregulants etc. through seed treatments are more effective , precise and environment - friendly
• Production of commercial seed generates employment opportunities in rural areas
Why Focus on Quality Seed?
• Use of quality seed alone can increase productivity by 15 – 20 %
• In spite of more than 40 years of systematic progress made in the seed sector, there are significant gaps between the requirement and availability of quality rice seeds
• Huge inherent demand for quality rice seeds at affordable price
Objectives
• To study the seed replacement rate of rice in Odisha • To study the growth of rice seed production through
different sources in the state. • To analyze the dynamics of varietal turnover • To study the distribution and supply of rice seeds in Odisha
over the years. • To study the contribution of different seed producing and
marketing agencies in production and distribution of rice seeds in the state.
• To analyze the constraints in availability of quality rice seeds at the farm front
• To analyze the prospect of rice seed trade between Odisha and Bangladesh
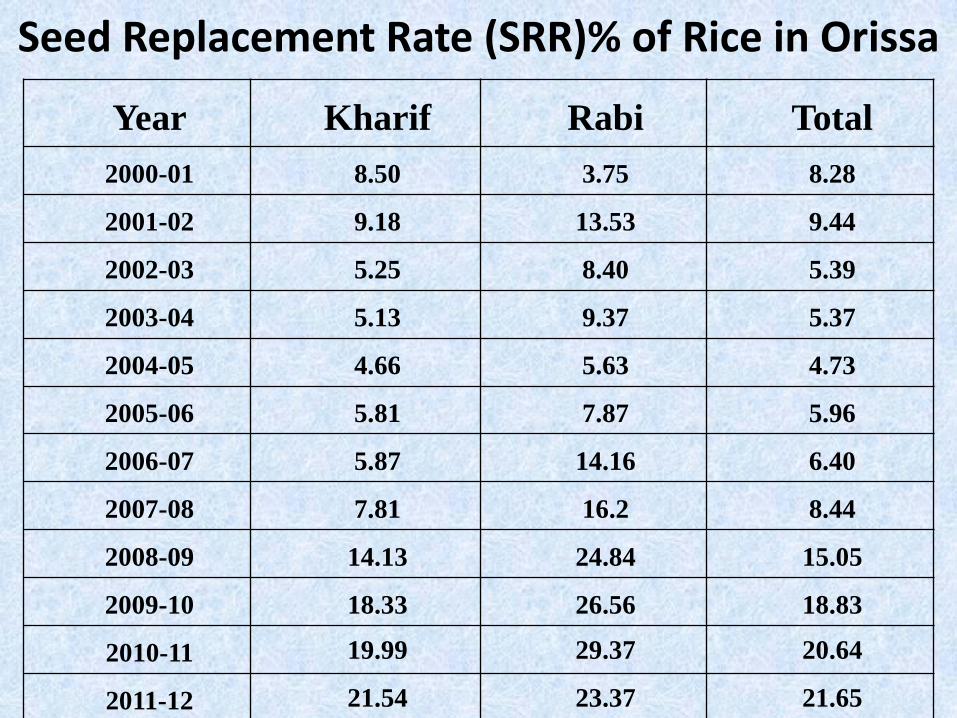
Seed Replacement Rate (SRR)% of Rice in Orissa
Year Kharif Rabi Total
2000-01 8.50 3.75 8.28
2001-02 9.18 13.53 9.44
2002-03 5.25 8.40 5.39
2003-04 5.13 9.37 5.37
2004-05 4.66 5.63 4.73
2005-06 5.81 7.87 5.96
2006-07 5.87 14.16 6.40
2007-08 7.81 16.2 8.44
2008-09 14.13 24.84 15.05
2009-10 18.33 26.56 18.83
2010-11 19.99 29.37 20.64
2011-12 21.54 23.37 21.65
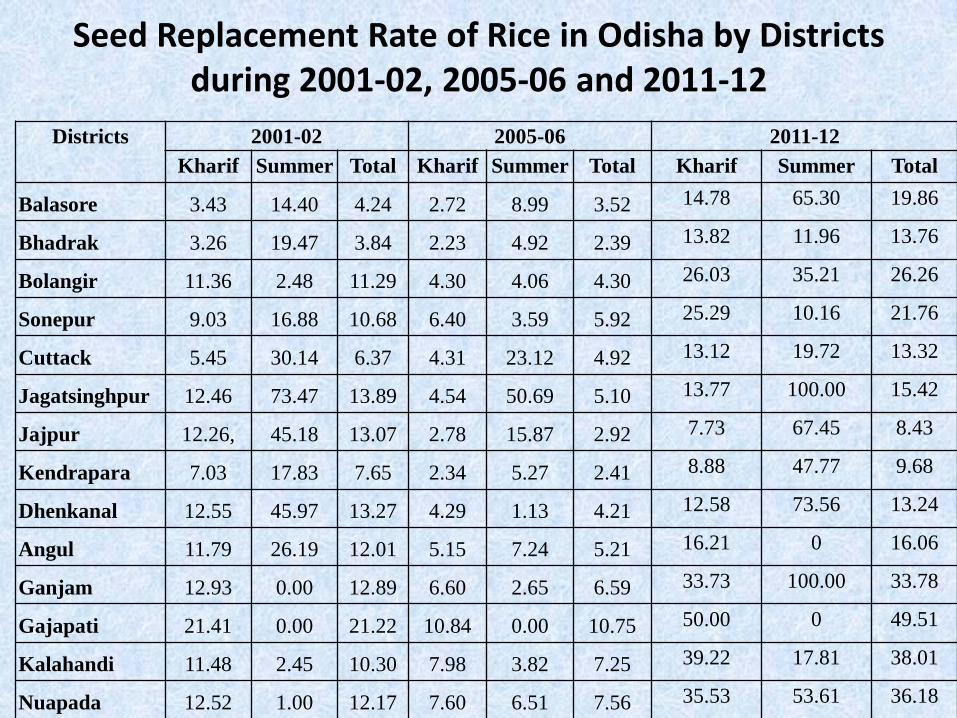
Seed Replacement Rate of Rice in Odisha by Districts during 2001-02, 2005-06 and 2011-12
Districts 2001-02 2005-06 2011-12
Kharif Summer Total Kharif Summer Total Kharif Summer Total
Balasore 3.43 14.40 4.24 2.72 8.99 3.52 14.78 65.30 19.86
Bhadrak 3.26 19.47 3.84 2.23 4.92 2.39 13.82 11.96 13.76
Bolangir 11.36 2.48 11.29 4.30 4.06 4.30 26.03 35.21 26.26
Sonepur 9.03 16.88 10.68 6.40 3.59 5.92 25.29 10.16 21.76
Cuttack 5.45 30.14 6.37 4.31 23.12 4.92 13.12 19.72 13.32
Jagatsinghpur 12.46 73.47 13.89 4.54 50.69 5.10 13.77 100.00 15.42
Jajpur 12.26, 45.18 13.07 2.78 15.87 2.92 7.73 67.45 8.43
Kendrapara 7.03 17.83 7.65 2.34 5.27 2.41 8.88 47.77 9.68
Dhenkanal 12.55 45.97 13.27 4.29 1.13 4.21 12.58 73.56 13.24
Angul 11.79 26.19 12.01 5.15 7.24 5.21 16.21 0 16.06
Ganjam 12.93 0.00 12.89 6.60 2.65 6.59 33.73 100.00 33.78
Gajapati 21.41 0.00 21.22 10.84 0.00 10.75 50.00 0 49.51
Kalahandi 11.48 2.45 10.30 7.98 3.82 7.25 39.22 17.81 38.01
Nuapada 12.52 1.00 12.17 7.60 6.51 7.56 35.53 53.61 36.18
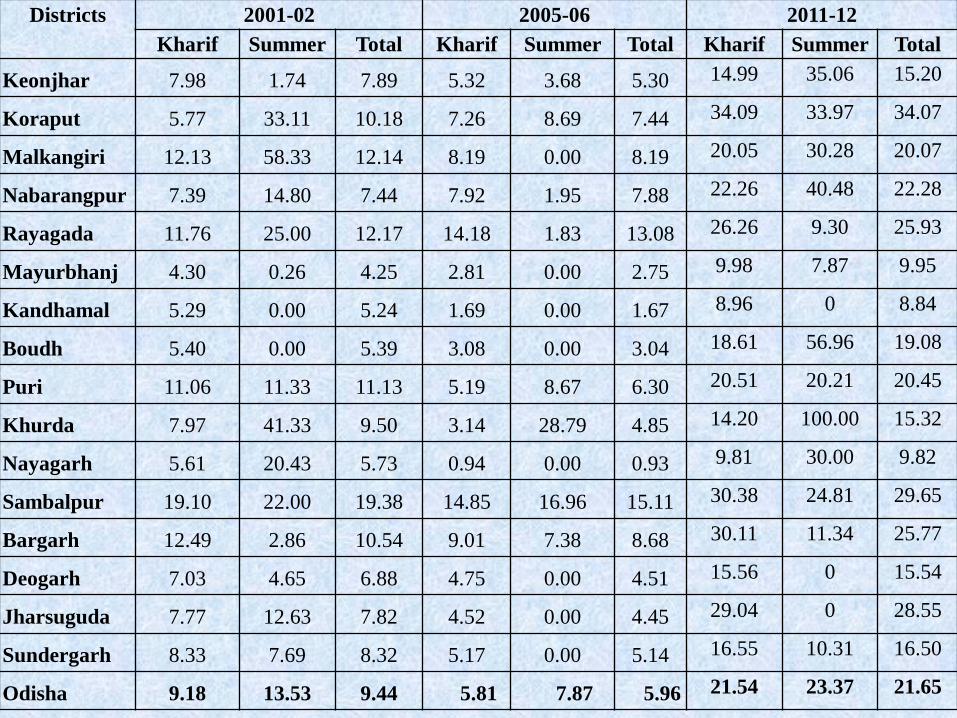
Districts 2001-02 2005-06 2011-12
Kharif Summer Total Kharif Summer Total Kharif Summer Total
Keonjhar 7.98 1.74 7.89 5.32 3.68 5.30 14.99 35.06 15.20
Koraput 5.77 33.11 10.18 7.26 8.69 7.44 34.09 33.97 34.07
Malkangiri 12.13 58.33 12.14 8.19 0.00 8.19 20.05 30.28 20.07
Nabarangpur 7.39 14.80 7.44 7.92 1.95 7.88 22.26 40.48 22.28
Rayagada 11.76 25.00 12.17 14.18 1.83 13.08 26.26 9.30 25.93
Mayurbhanj 4.30 0.26 4.25 2.81 0.00 2.75 9.98 7.87 9.95
Kandhamal 5.29 0.00 5.24 1.69 0.00 1.67 8.96 0 8.84
Boudh 5.40 0.00 5.39 3.08 0.00 3.04 18.61 56.96 19.08
Puri 11.06 11.33 11.13 5.19 8.67 6.30 20.51 20.21 20.45
Khurda 7.97 41.33 9.50 3.14 28.79 4.85 14.20 100.00 15.32
Nayagarh 5.61 20.43 5.73 0.94 0.00 0.93 9.81 30.00 9.82
Sambalpur 19.10 22.00 19.38 14.85 16.96 15.11 30.38 24.81 29.65
Bargarh 12.49 2.86 10.54 9.01 7.38 8.68 30.11 11.34 25.77
Deogarh 7.03 4.65 6.88 4.75 0.00 4.51 15.56 0 15.54
Jharsuguda 7.77 12.63 7.82 4.52 0.00 4.45 29.04 0 28.55
Sundergarh 8.33 7.69 8.32 5.17 0.00 5.14 16.55 10.31 16.50
Odisha 9.18 13.53 9.44 5.81 7.87 5.96 21.54 23.37 21.65
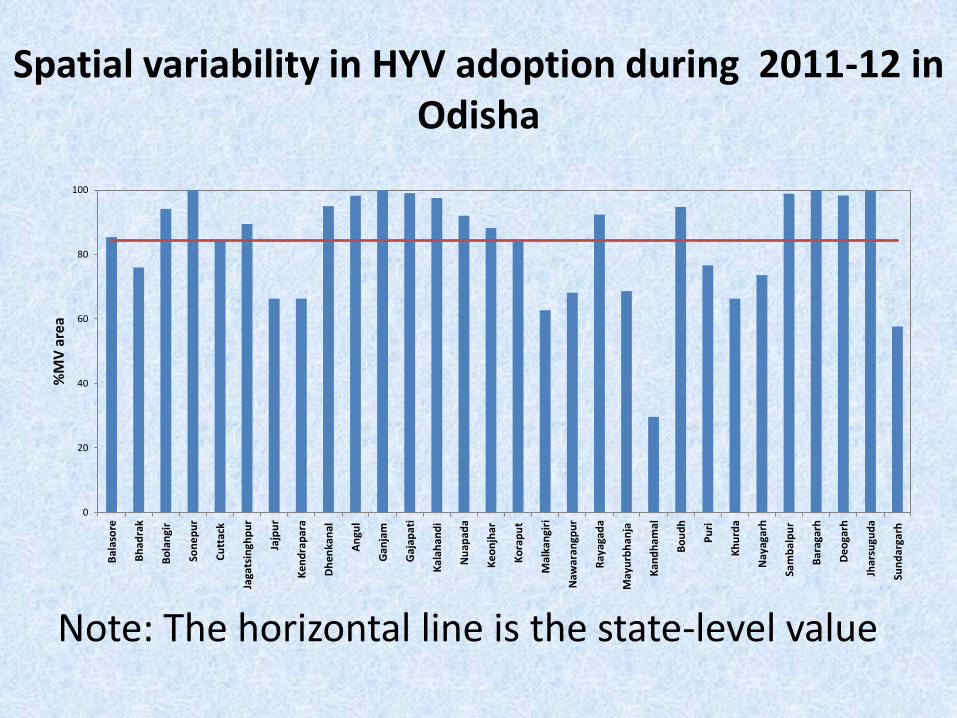
Spatial variability in HYV adoption during 2011-12 in Odisha
Note: The horizontal line is the state-level value
0
20
40
60
80
100
Bal
aso
re
Bh
adra
k
Bo
lan
gir
Son
ep
ur
Cu
ttac
k
Jaga
tsin
ghp
ur
Jajp
ur
Ke
nd
rap
ara
Dh
enka
nal
An
gul
Gan
jam
Gaj
apat
i
Kal
ah
and
i
Nu
apad
a
Ke
on
jhar
Ko
rap
ut
Mal
kan
giri
Naw
aran
gpu
r
Ray
agad
a
May
urb
han
ja
Kan
dh
amal
Bo
ud
h
Pu
ri
Kh
urd
a
Nay
agar
h
Sam
bal
pu
r
Bar
agar
h
De
oga
rh
Jhar
sugu
da
Sun
dar
garh
%M
V a
rea
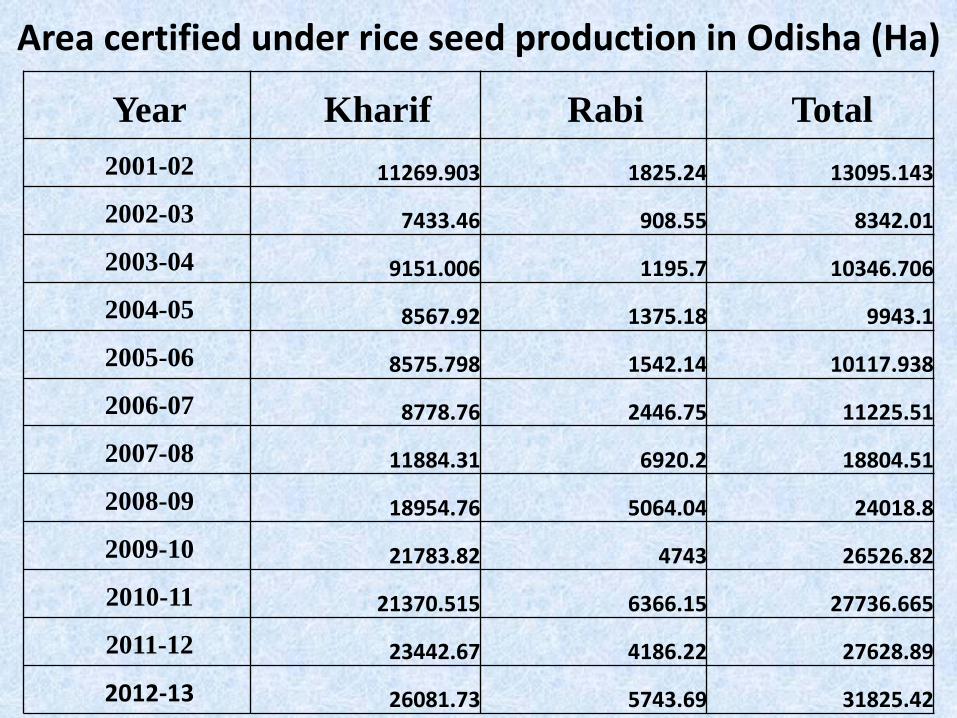
Area certified under rice seed production in Odisha (Ha)
Year Kharif Rabi Total
2001-02 11269.903 1825.24 13095.143
2002-03 7433.46 908.55 8342.01
2003-04 9151.006 1195.7 10346.706
2004-05 8567.92 1375.18 9943.1
2005-06 8575.798 1542.14 10117.938
2006-07 8778.76 2446.75 11225.51
2007-08 11884.31 6920.2 18804.51
2008-09 18954.76 5064.04 24018.8
2009-10 21783.82 4743 26526.82
2010-11 21370.515 6366.15 27736.665
2011-12 23442.67 4186.22 27628.89
2012-13 26081.73 5743.69 31825.42
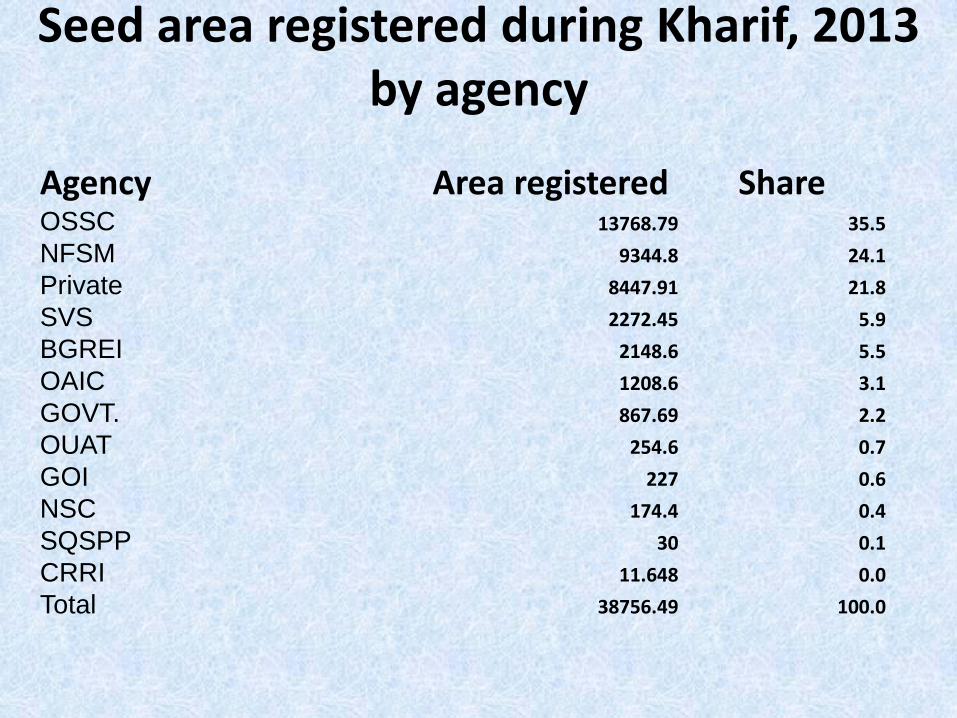
Seed area registered during Kharif, 2013 by agency
Agency Area registered Share OSSC 13768.79 35.5
NFSM 9344.8 24.1
Private 8447.91 21.8
SVS 2272.45 5.9
BGREI 2148.6 5.5
OAIC 1208.6 3.1
GOVT. 867.69 2.2
OUAT 254.6 0.7
GOI 227 0.6
NSC 174.4 0.4
SQSPP 30 0.1
CRRI 11.648 0.0
Total 38756.49 100.0
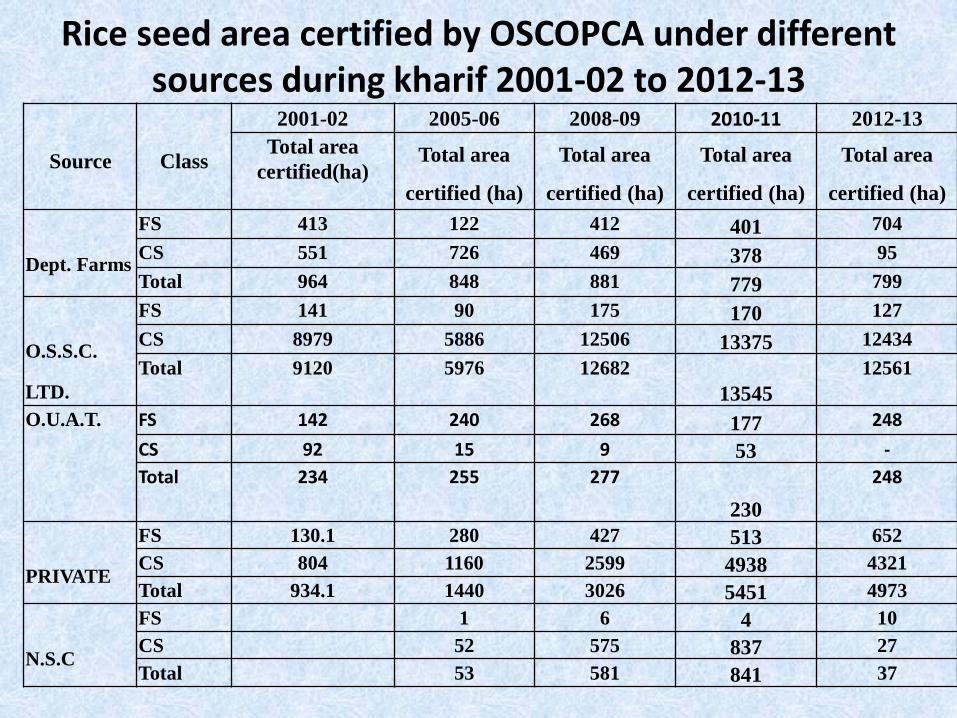
Rice seed area certified by OSCOPCA under different sources during kharif 2001-02 to 2012-13
Source
Class
2001-02 2005-06 2008-09 2010-11 2012-13
Total area
certified(ha) Total area
certified (ha)
Total area
certified (ha)
Total area
certified (ha)
Total area
certified (ha)
Dept. Farms
FS 413 122 412 401 704
CS 551 726 469 378 95
Total 964 848 881 779 799
O.S.S.C.
LTD.
FS 141 90 175 170 127
CS 8979 5886 12506 13375 12434
Total 9120 5976 12682
13545
12561
O.U.A.T. FS 142 240 268 177 248
CS 92 15 9 53 -
Total 234 255 277
230
248
PRIVATE
FS 130.1 280 427 513 652
CS 804 1160 2599 4938 4321
Total 934.1 1440 3026 5451 4973
N.S.C
FS 1 6 4 10
CS 52 575 837 27
Total 53 581 841 37

Source
Class
2001-02 2005-06 2008-09 2010-11 2012-13
Total area
certified(ha) Total area
certified (ha)
Total area
certified (ha)
Total area
certified (ha)
Total area
certified (ha)
SVS FS 0 0 673
CS 1492 503 3
Total 1492 503 676
OAIC FS 40
CS 95
Total 135 NFSM FS 167
CS 6662
Total 6829
BGREI FS -
CS 83
Total 83
NGO FS -
CS 28
Total 28
Total from all
sources
FS 830 734 1289 1284 2621
CS 10440 7842 17666 30423 23747
Total 11270 8576 18955 31707 26368
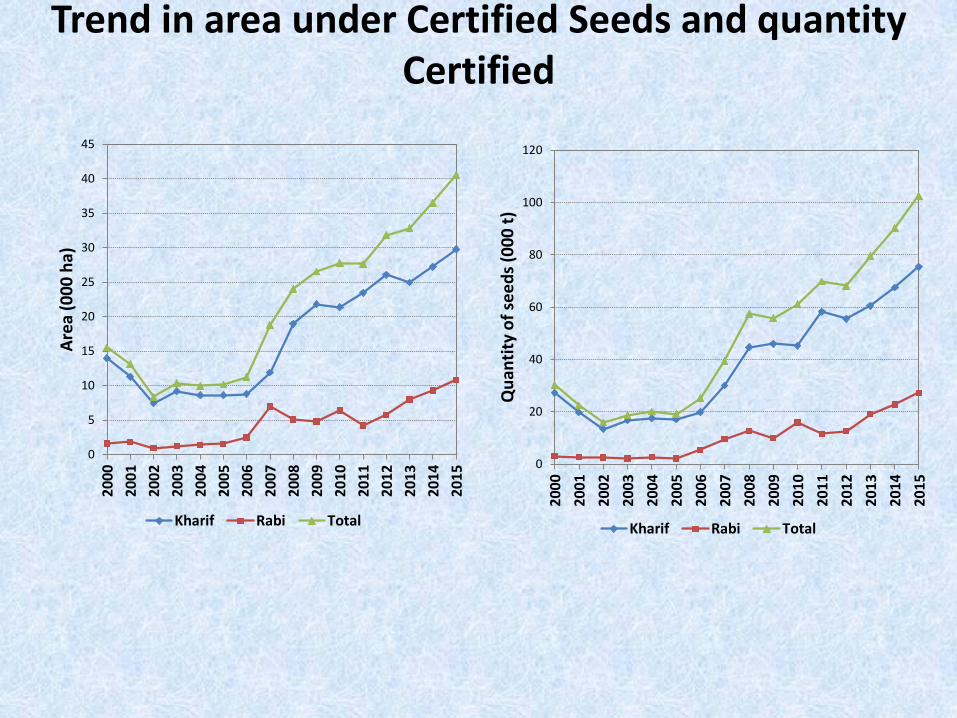
Trend in area under Certified Seeds and quantity Certified
0
5
10
15
20
25
30
35
40
45
20
00
20
01
20
02
20
03
20
04
20
05
20
06
20
07
20
08
20
09
20
10
20
11
20
12
20
13
20
14
20
15
Are
a (0
00
ha)
Kharif Rabi Total
0
20
40
60
80
100
120
20
00
20
01
20
02
20
03
20
04
20
05
20
06
20
07
20
08
20
09
20
10
20
11
20
12
20
13
20
14
20
15
Qu
anti
ty o
f se
ed
s (0
00
t)
Kharif Rabi Total
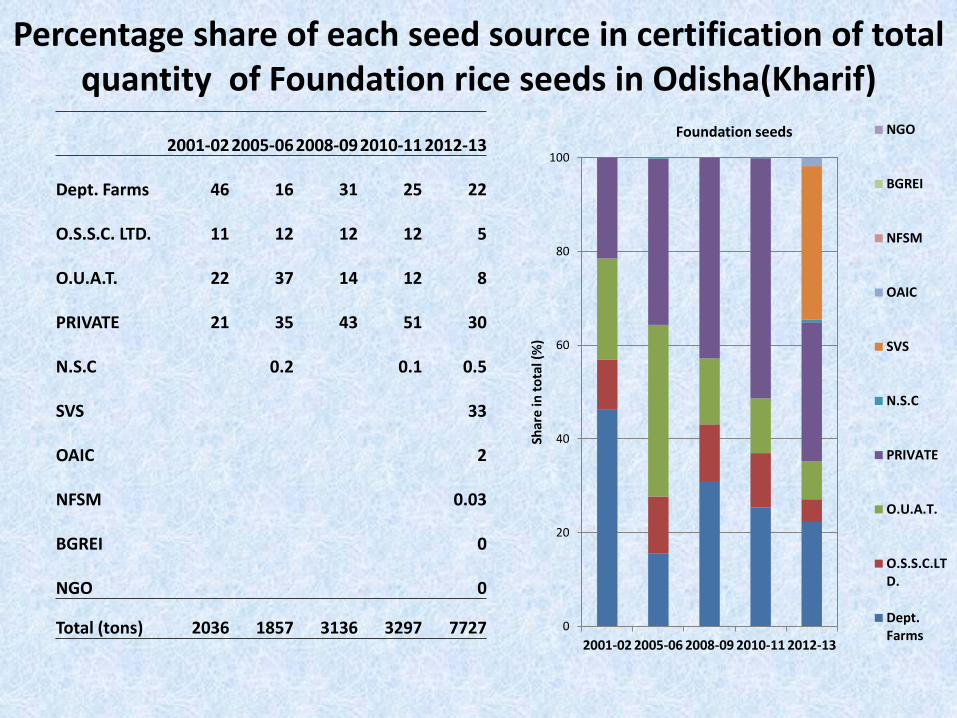
Percentage share of each seed source in certification of total quantity of Foundation rice seeds in Odisha(Kharif)
2001-02 2005-06 2008-09 2010-11 2012-13
Dept. Farms 46 16 31 25 22
O.S.S.C. LTD. 11 12 12 12 5
O.U.A.T. 22 37 14 12 8
PRIVATE 21 35 43 51 30
N.S.C 0.2 0.1 0.5
SVS 33
OAIC 2
NFSM 0.03
BGREI 0
NGO 0
Total (tons) 2036 1857 3136 3297 7727 0
20
40
60
80
100
2001-02 2005-06 2008-09 2010-11 2012-13
Shar
e in
to
tal (
%)
Foundation seeds NGO
BGREI
NFSM
OAIC
SVS
N.S.C
PRIVATE
O.U.A.T.
O.S.S.C.LTD.
Dept.Farms
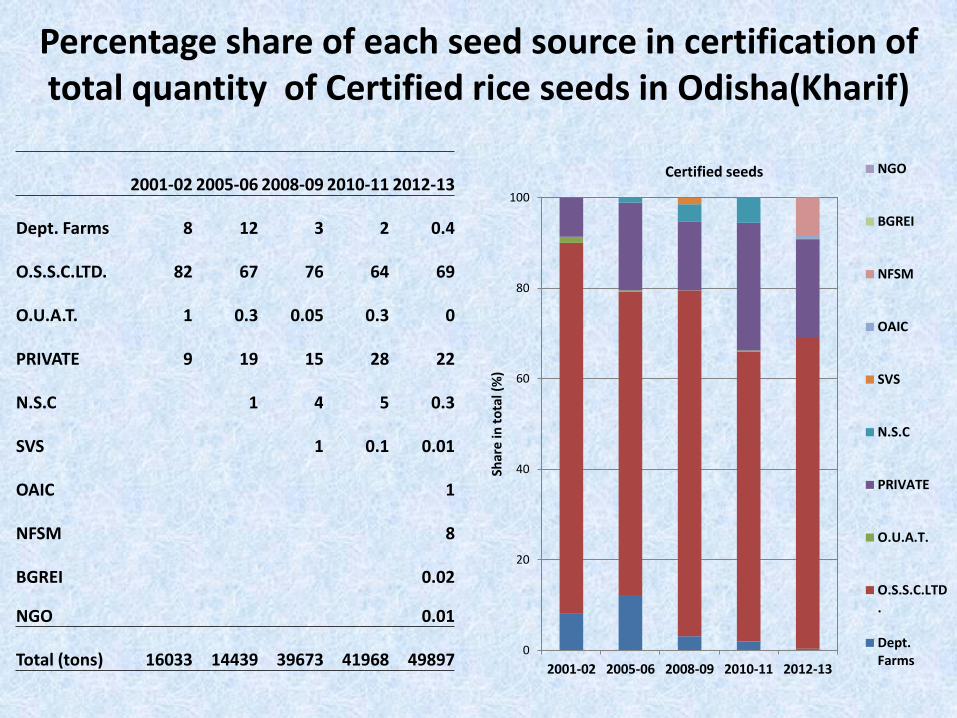
Percentage share of each seed source in certification of total quantity of Certified rice seeds in Odisha(Kharif)
2001-02 2005-06 2008-09 2010-11 2012-13
Dept. Farms 8 12 3 2 0.4
O.S.S.C.LTD. 82 67 76 64 69
O.U.A.T. 1 0.3 0.05 0.3 0
PRIVATE 9 19 15 28 22
N.S.C 1 4 5 0.3
SVS 1 0.1 0.01
OAIC 1
NFSM 8
BGREI 0.02
NGO 0.01
Total (tons) 16033 14439 39673 41968 49897 0
20
40
60
80
100
2001-02 2005-06 2008-09 2010-11 2012-13
Shar
e in
to
tal (
%)
Certified seeds NGO
BGREI
NFSM
OAIC
SVS
N.S.C
PRIVATE
O.U.A.T.
O.S.S.C.LTD.
Dept.Farms
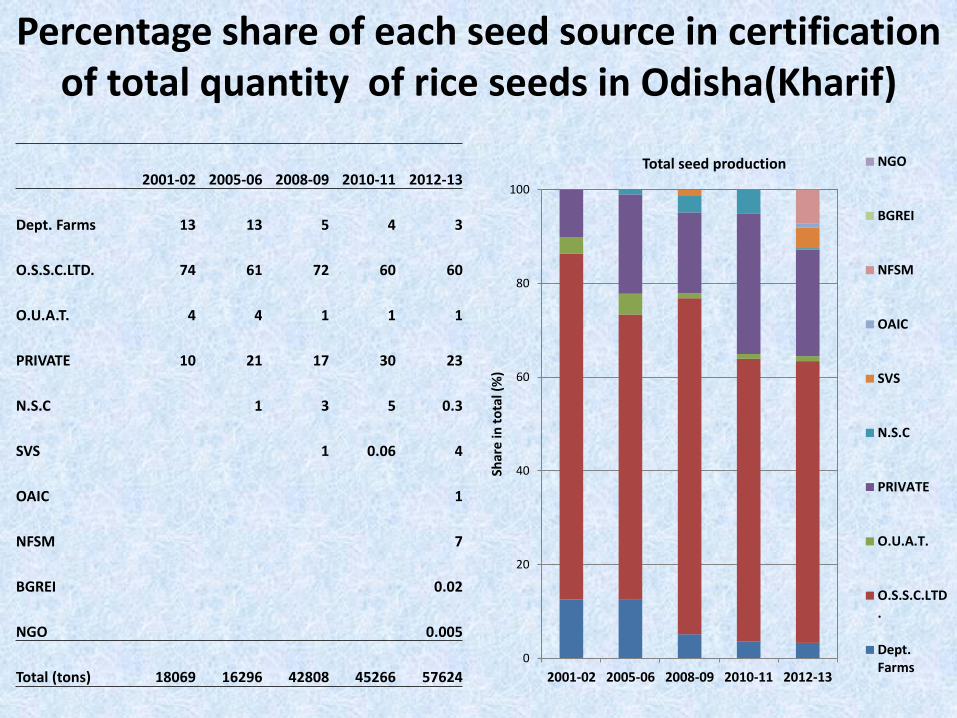
Percentage share of each seed source in certification of total quantity of rice seeds in Odisha(Kharif)
2001-02 2005-06 2008-09 2010-11 2012-13
Dept. Farms 13 13 5 4 3
O.S.S.C.LTD. 74 61 72 60 60
O.U.A.T. 4 4 1 1 1
PRIVATE 10 21 17 30 23
N.S.C 1 3 5 0.3
SVS 1 0.06 4
OAIC 1
NFSM 7
BGREI 0.02
NGO 0.005
Total (tons) 18069 16296 42808 45266 57624 0
20
40
60
80
100
2001-02 2005-06 2008-09 2010-11 2012-13
Shar
e in
to
tal (
%)
Total seed production NGO
BGREI
NFSM
OAIC
SVS
N.S.C
PRIVATE
O.U.A.T.
O.S.S.C.LTD.
Dept.Farms
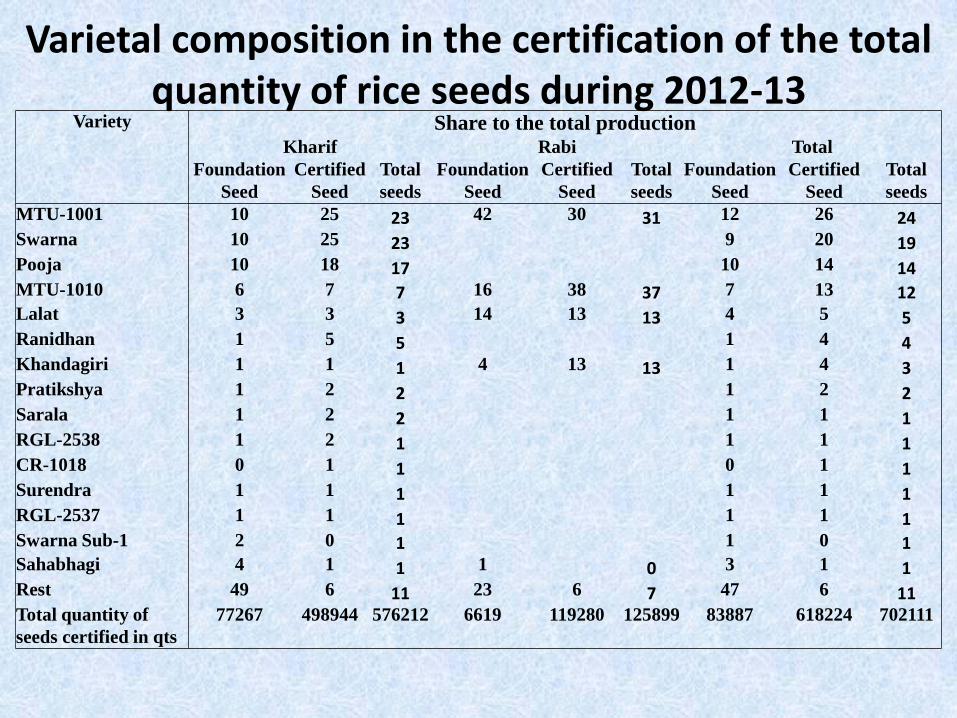
Varietal composition in the certification of the total quantity of rice seeds during 2012-13
Variety Share to the total production Kharif Rabi Total
Foundation
Seed
Certified
Seed
Total
seeds
Foundation
Seed
Certified
Seed
Total
seeds
Foundation
Seed
Certified
Seed
Total
seeds
MTU-1001 10 25 23 42 30 31 12 26 24 Swarna 10 25 23 9 20 19 Pooja 10 18 17 10 14 14 MTU-1010 6 7 7 16 38 37 7 13 12 Lalat 3 3 3 14 13 13 4 5 5 Ranidhan 1 5 5 1 4 4 Khandagiri 1 1 1 4 13 13 1 4 3 Pratikshya 1 2 2 1 2 2 Sarala 1 2 2 1 1 1 RGL-2538 1 2 1 1 1 1 CR-1018 0 1 1 0 1 1 Surendra 1 1 1 1 1 1 RGL-2537 1 1 1 1 1 1 Swarna Sub-1 2 0 1 1 0 1 Sahabhagi 4 1 1 1 0 3 1 1 Rest 49 6 11 23 6 7 47 6 11 Total quantity of
seeds certified in qts
77267 498944 576212 6619 119280 125899 83887 618224 702111
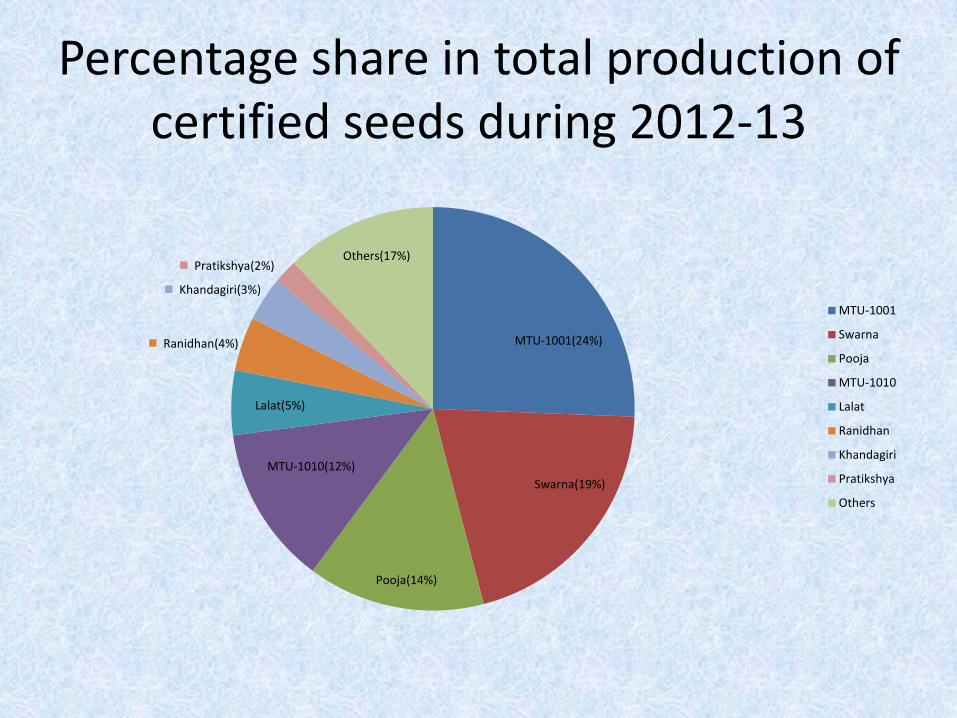
Percentage share in total production of certified seeds during 2012-13
MTU-1001(24%)
Swarna(19%)
Pooja(14%)
MTU-1010(12%)
Lalat(5%)
Ranidhan(4%)
Khandagiri(3%)
Pratikshya(2%) Others(17%)
MTU-1001
Swarna
Pooja
MTU-1010
Lalat
Ranidhan
Khandagiri
Pratikshya
Others

Percentage share in total seed supply/sold by major varieties during kharif season
Seed supply/sale by major varieties during kharif season.
Percentage share in total seed supply/sold
2001 2005 2010 2011 2013
MTU-1001 13 16 17 18 27
Swarna 33 31 33 32 22
Pooja 0 11 14 16 18
MTU-1010 0 0 6 8 8
Lalat 14 8 7 4 4
Khandagiri 5 3 4 2 3
CR-1018 5 4 2 2 1
Surendra 2 6 2 1 1
CR-1009 16 3 1 1 0
BPT-5204 5 4 1 7 1
Others 9 14 14 10 15
Total seed supplied/sold (Qtss) 241441 136095 471678 487221 512143
0
10
20
30
40
50
60
2001 2005 2010 2011 2013
Seed
su
pp
ly (
00
0 t
on
s)
Others
BPT-5204
CR-1009
Surendra
CR-1018
Khandagiri
Lalat
MTU-1010
Pooja
Swarna
MTU-1001
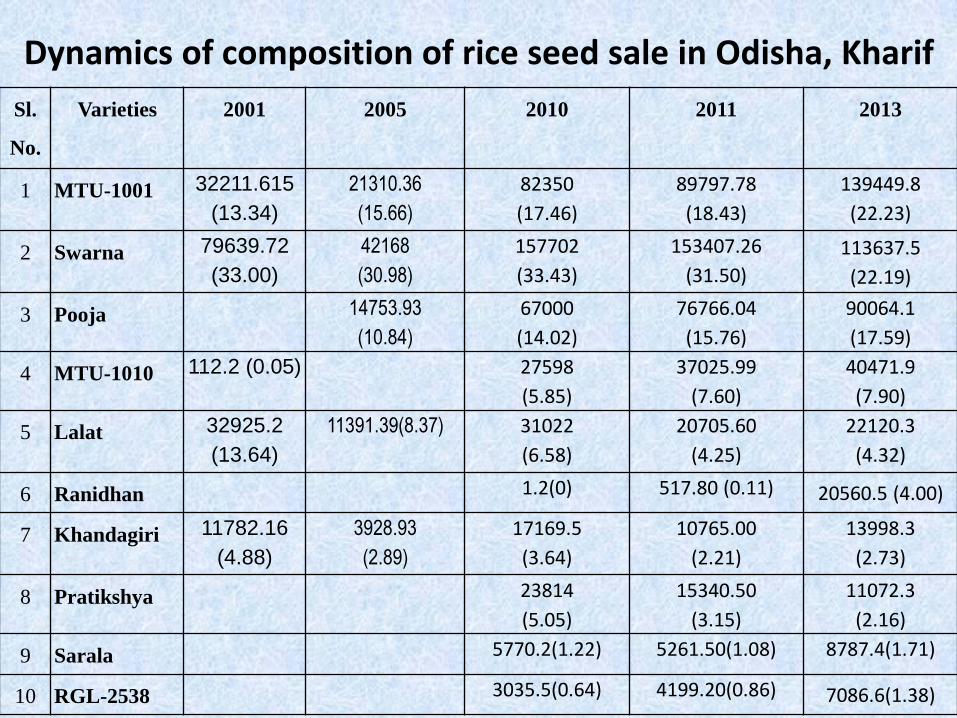
Dynamics of composition of rice seed sale in Odisha, Kharif
Sl.
No.
Varieties 2001 2005 2010 2011 2013
1 MTU-1001 32211.615
(13.34)
21310.36
(15.66)
82350
(17.46)
89797.78
(18.43)
139449.8
(22.23)
2 Swarna 79639.72
(33.00)
42168
(30.98)
157702
(33.43)
153407.26
(31.50)
113637.5
(22.19)
3 Pooja 14753.93
(10.84)
67000
(14.02)
76766.04
(15.76)
90064.1
(17.59)
4 MTU-1010 112.2 (0.05) 27598
(5.85)
37025.99
(7.60)
40471.9
(7.90)
5 Lalat 32925.2
(13.64)
11391.39(8.37) 31022
(6.58)
20705.60
(4.25)
22120.3
(4.32)
6 Ranidhan 1.2(0) 517.80 (0.11) 20560.5 (4.00)
7 Khandagiri 11782.16
(4.88)
3928.93
(2.89)
17169.5
(3.64)
10765.00
(2.21)
13998.3
(2.73)
8 Pratikshya 23814
(5.05)
15340.50
(3.15)
11072.3
(2.16)
9 Sarala 5770.2(1.22) 5261.50(1.08) 8787.4(1.71)
10 RGL-2538 3035.5(0.64) 4199.20(0.86) 7086.6(1.38)
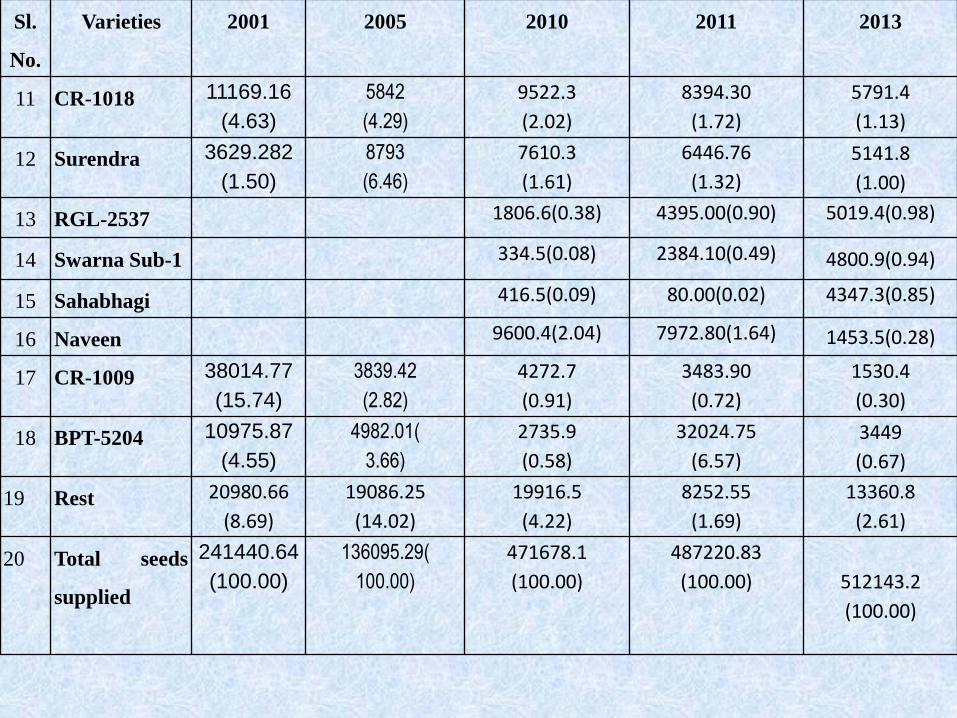
Sl.
No.
Varieties 2001 2005 2010 2011 2013
11 CR-1018 11169.16
(4.63)
5842
(4.29)
9522.3
(2.02)
8394.30
(1.72)
5791.4
(1.13)
12 Surendra 3629.282
(1.50)
8793
(6.46)
7610.3
(1.61)
6446.76
(1.32)
5141.8
(1.00)
13 RGL-2537 1806.6(0.38) 4395.00(0.90) 5019.4(0.98)
14 Swarna Sub-1 334.5(0.08) 2384.10(0.49) 4800.9(0.94)
15 Sahabhagi 416.5(0.09) 80.00(0.02) 4347.3(0.85)
16 Naveen 9600.4(2.04) 7972.80(1.64) 1453.5(0.28)
17 CR-1009 38014.77
(15.74)
3839.42
(2.82)
4272.7
(0.91)
3483.90
(0.72)
1530.4
(0.30)
18 BPT-5204 10975.87
(4.55)
4982.01(
3.66)
2735.9
(0.58)
32024.75
(6.57)
3449
(0.67)
19 Rest 20980.66
(8.69)
19086.25
(14.02)
19916.5
(4.22)
8252.55
(1.69)
13360.8
(2.61)
20 Total seeds
supplied
241440.64
(100.00)
136095.29(
100.00)
471678.1
(100.00)
487220.83
(100.00) 512143.2
(100.00)
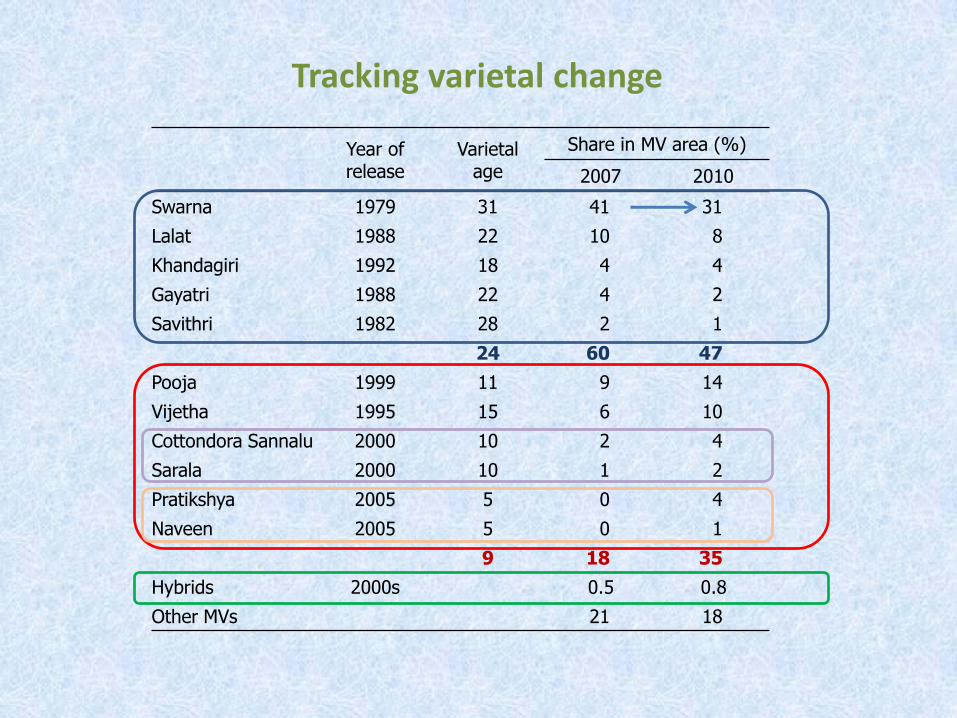
Year of release
Varietal age
Share in MV area (%)
2007 2010
Swarna 1979 31 41 31
Lalat 1988 22 10 8
Khandagiri 1992 18 4 4
Gayatri 1988 22 4 2
Savithri 1982 28 2 1
24 60 47
Pooja 1999 11 9 14
Vijetha 1995 15 6 10
Cottondora Sannalu 2000 10 2 4
Sarala 2000 10 1 2
Pratikshya 2005 5 0 4
Naveen 2005 5 0 1
9 18 35
Hybrids 2000s 0.5 0.8
Other MVs 21 18
Tracking varietal change
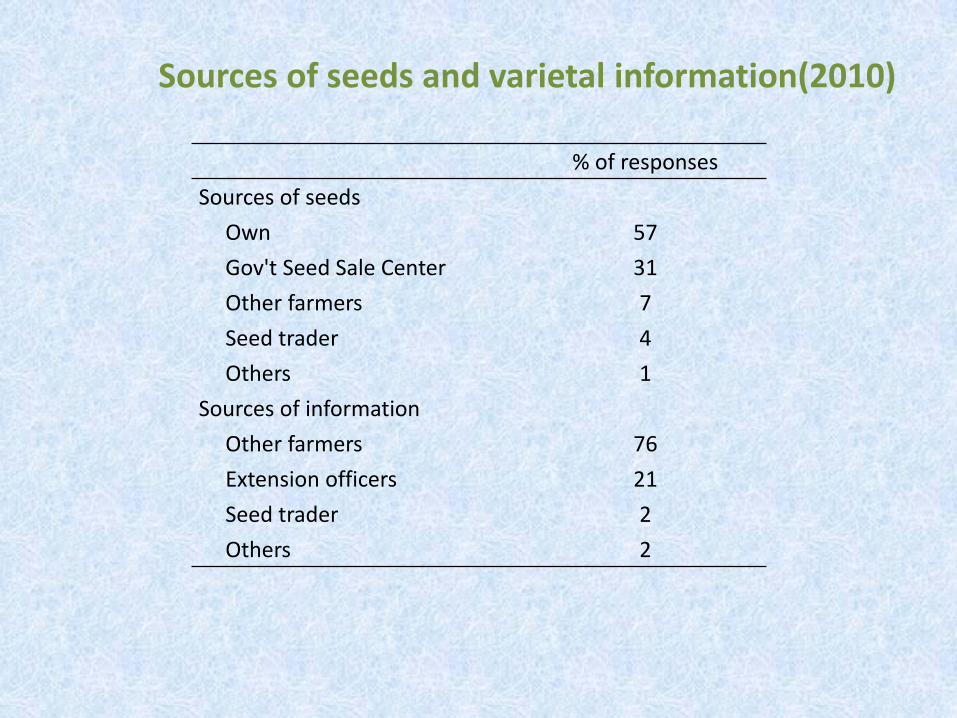
% of responses
Sources of seeds
Own 57
Gov't Seed Sale Center 31
Other farmers 7
Seed trader 4
Others 1
Sources of information
Other farmers 76
Extension officers 21
Seed trader 2
Others 2
Sources of seeds and varietal information(2010)
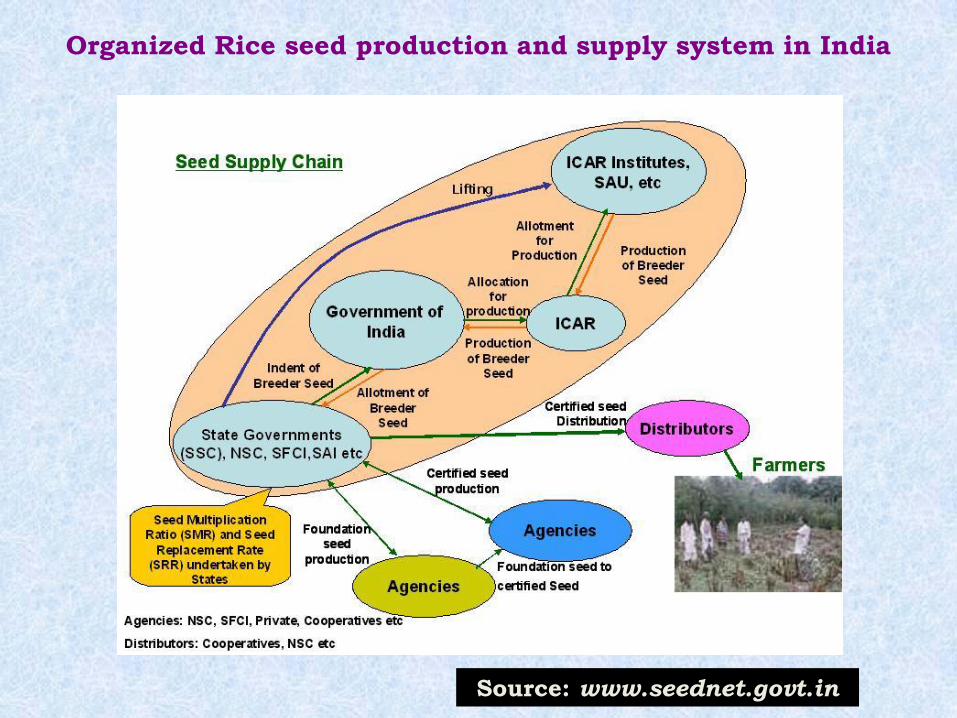
Organized Rice seed production and supply system in India
Source: www.seednet.govt.in
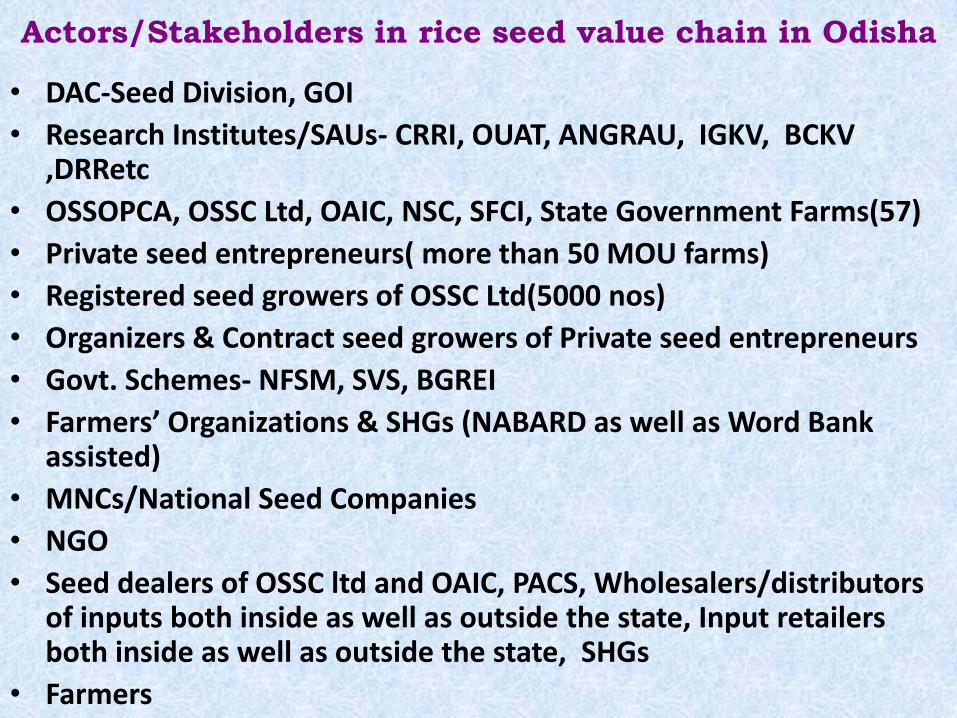
Actors/Stakeholders in rice seed value chain in Odisha
• DAC-Seed Division, GOI
• Research Institutes/SAUs- CRRI, OUAT, ANGRAU, IGKV, BCKV ,DRRetc
• OSSOPCA, OSSC Ltd, OAIC, NSC, SFCI, State Government Farms(57)
• Private seed entrepreneurs( more than 50 MOU farms)
• Registered seed growers of OSSC Ltd(5000 nos)
• Organizers & Contract seed growers of Private seed entrepreneurs
• Govt. Schemes- NFSM, SVS, BGREI
• Farmers’ Organizations & SHGs (NABARD as well as Word Bank assisted)
• MNCs/National Seed Companies
• NGO
• Seed dealers of OSSC ltd and OAIC, PACS, Wholesalers/distributors of inputs both inside as well as outside the state, Input retailers both inside as well as outside the state, SHGs
• Farmers
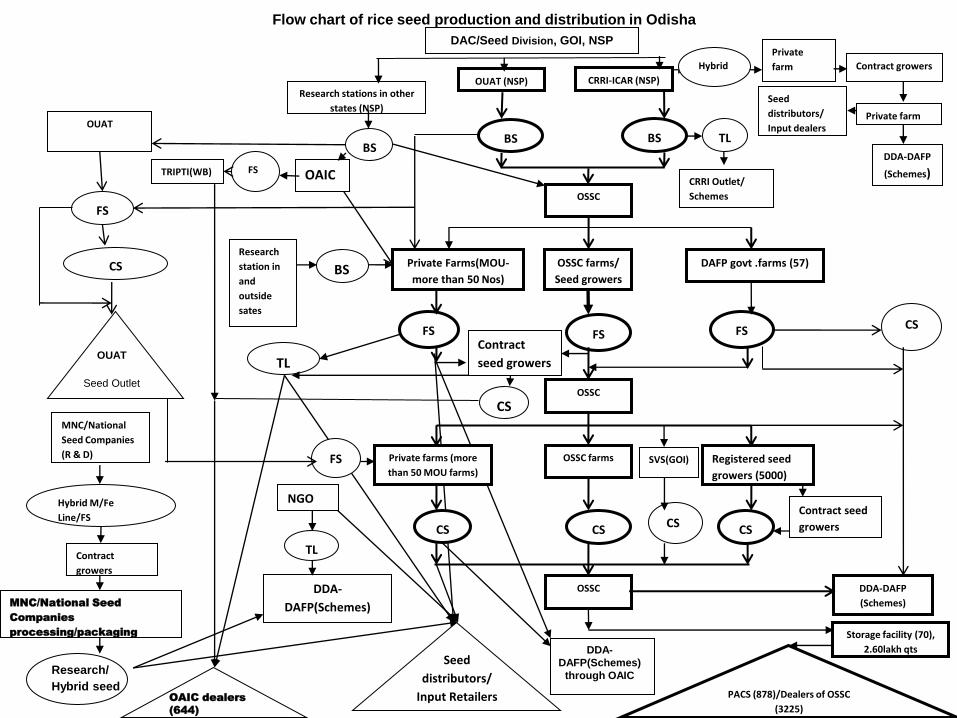
Contract
seed growers
CS
MNC/National
Seed Companies
(R & D)
Hybrid M/Fe
Line/FS
Contract
growers
MNC/National Seed
Companies
processing/packaging
TL
Research stations in other
states (NSP)
OUAT (NSP) CRRI-ICAR (NSP)
BS BS BS
OSSC
OSSC farms/
Seed growers
DAFP govt .farms (57)
Private Farms(MOU-
more than 50 Nos)
OUAT
TL
FS FS FS
FS
CS
OSSC
OSSC farms Registered seed
growers (5000)
Private farms (more
than 50 MOU farms)
CS CS CS
OSSC
CS
FS
DDA-DAFP
(Schemes)
Storage facility (70),
2.60lakh qts
PACS (878)/Dealers of OSSC
(3225)
Flow chart of rice seed production and distribution in Odisha
DAC/Seed Division, GOI, NSP
OAIC
Research
station in
and
outside
sates
BS
Contract seed
growers
NGO
TL
DDA-
DAFP(Schemes)
SVS(GOI)
CS
Hybrid
DDA-DAFP
(Schemes)
Private
farm Contract growers
Private farm
TRIPTI(WB) FS CRRI Outlet/
Schemes
Seed
distributors/
Input dealers
Seed
distributors/
Input Retailers
DDA-
DAFP(Schemes)
through OAIC
Research/
Hybrid seed
OUAT
Seed Outlet
OAIC dealers
(644)
SWOT Analysis of rice seed production and marketing in Odisha
STRENGTH •Suitable natural conditions for rice seed production
•Farming community has vast experience in rice production
•National and state strategy for increased seed production
•National and state strategy for enhanced SRR to increase rice productivity
through NFSM, RKVY and BGREI
•Research institutions catering to the need for delivering new improved rice
cultivars with both biotic and abiotic stress tolerance
•Increased provision of subsidies for rice seed production and marketing
•Improved legal framework (Increased adherence to IPR, seed regulations and
seed quality control)
•Presence of large number of rice seed growers both individual as well as private
seed entrepreneurs practicing contract seed farming.
•Increased PPP mode both in production and marketing of rice seed in the state
•High improved rice seed varietal diversity catering to different topography and
agro-climatic conditions
•Enhanced rice farmers awareness about role of quality rice seeds in increasing
productivity
•Enhanced and better government rice procurement policy through PACS and
mandis with increased involvement of large numbers of rice millers
WEAKNESSES
•Small farms with highly scattered and fragmented plots limiting the
use of improved technology in rice seed production
•Poor productivity
•High post harvest losses due to inclement weather and defective
infrastructure causing failure in germination and high rejection due
to ODV (other distinguished variety).
•Weak implementation strategy in rice seed production and suffers
many hindrances – timely availability of Breeder and Foundation
seeds to growers, timely availability of fertilizer and pesticides,
specific institution credit sanction to the seed growers, specific
insurance scheme for rice seed growers, timely processing, timely
payment of dues along with poor infrastructure in handling such a
high volume of rice seed production in the state.
•Seed quality control is not effectively ensured due to lack of logistics
and staff constraints
•Weak implementation strategy in rice seed marketing: Seed marketing
mainly rests with two public sector organization viz. OSSC and OAIC. OAIC
does not have any logistic arrangements to procure, process and market seeds
and mainly does through its seed entrepreneurs and dealer networks.
Whereas, OSSC though has its own infrastructure, is handicapped to market
seeds of its own due to poor staffing, inadequate storage and transportation
facilities and market rice seeds through its dealer networks and PACS. Due to
official apathy, many a times, OSSC is not able to timely market the seeds
through PACS. Also due to delayed arrival of seeds at the sale points as well as
due to lack of availability of desired variety, farmers resort to sow their own
harvested seed thereby limiting the use of quality seeds at the farm front.
•Financial support for facilitating rice seed industry in the state is still weak.
•Many of the stakeholders lack experience on rice seed production, seed
distribution and marketing
•Poor information flow related to timely availability of seeds and of desired
variety
•Ineffective market chain
•Lack of adequate infrastructure for bulk handling of rice seeds for quality
control and marketing including processing, transportation, storage and
distribution
OPPORTUNITIES
•Large number of experienced rice seed growers
•New seed entrepreneurs with increased private investment
•National and state promotional activities for increased rice seed production to
cater to increased availability of quality seeds for increasing rice production
•Enhanced collaborative activities in rice seed production and marketing with
private seed companies from outside the state, seed growers, SHGs (World Bank
assisted TRIPTI program), farmers’ club and association(NABARD assisted
program), research institutions, NGOs and by converging national and state
production programs like NFSM and BGREI.
•Increased access to rice seed trade between eastern Indian state and opportunities
for cross border trade between India and neighbouring countries of Bangladesh,
Mayanmar, Nepal etc due to large numbers of rice varieties being released in the
state catering to diverse agro-ecological situations.
•Increased involvement of SHGs, farmers’ association, dealers as well as seed
entrepreneurs in marketing of rice seed in the state.
•Yield gap reduction in rice seed due to adoption of new and improved agronomic
production technologies like SRI, line planting, use of rice transplanters, reaper,
etc
•State favourable policies for technology improvement and research
•State favourable policies for post harvest and processing technology and
commercial services
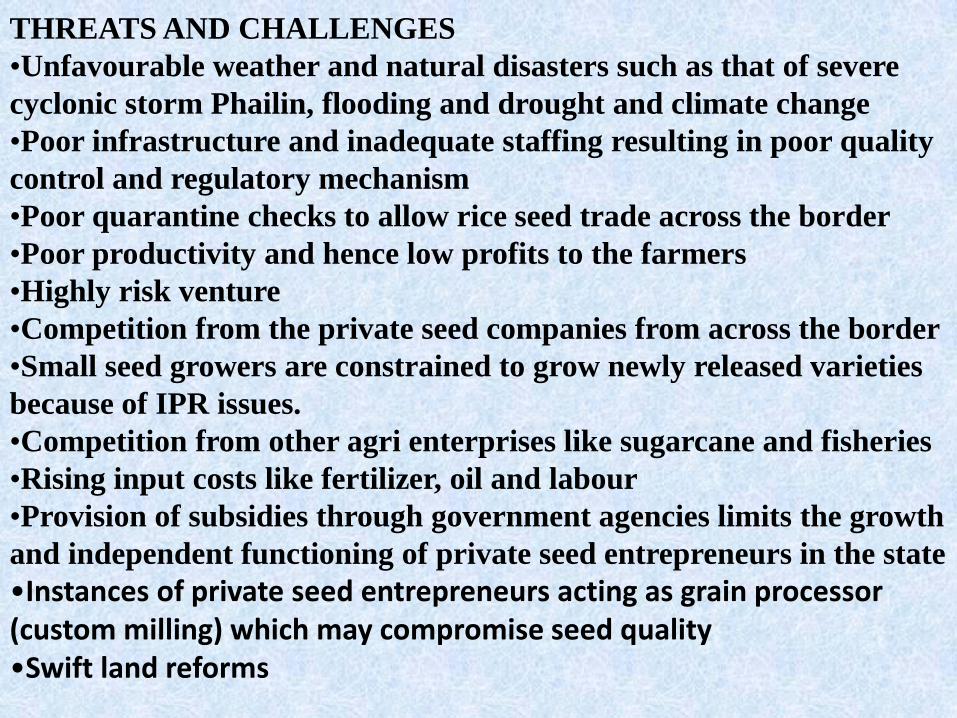
THREATS AND CHALLENGES
•Unfavourable weather and natural disasters such as that of severe
cyclonic storm Phailin, flooding and drought and climate change
•Poor infrastructure and inadequate staffing resulting in poor quality
control and regulatory mechanism
•Poor quarantine checks to allow rice seed trade across the border
•Poor productivity and hence low profits to the farmers
•Highly risk venture
•Competition from the private seed companies from across the border
•Small seed growers are constrained to grow newly released varieties
because of IPR issues.
•Competition from other agri enterprises like sugarcane and fisheries
•Rising input costs like fertilizer, oil and labour
•Provision of subsidies through government agencies limits the growth
and independent functioning of private seed entrepreneurs in the state
•Instances of private seed entrepreneurs acting as grain processor (custom milling) which may compromise seed quality •Swift land reforms
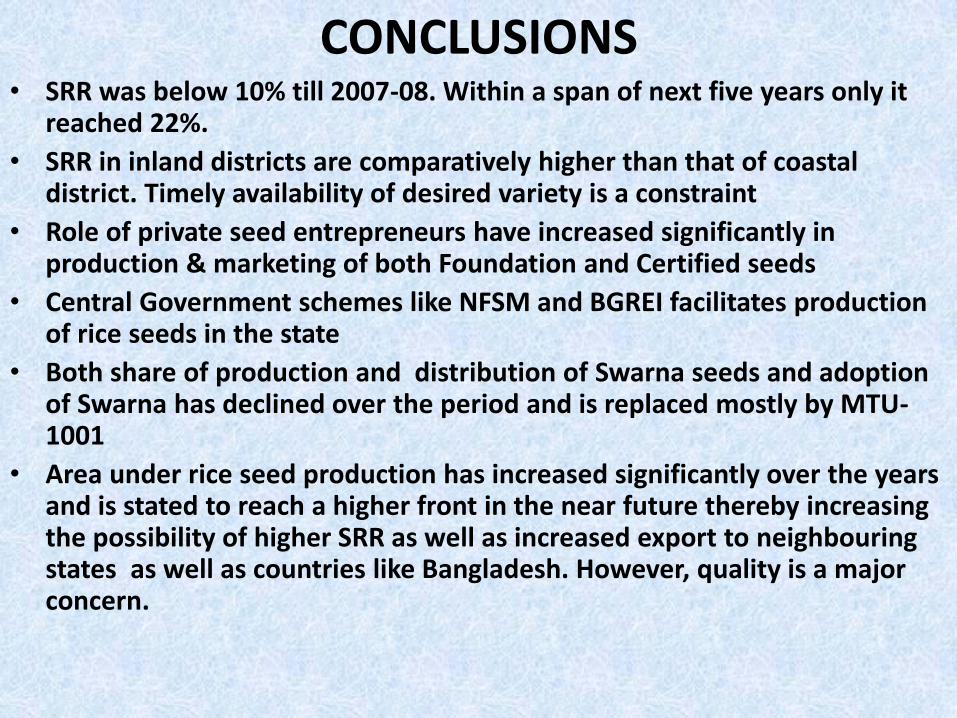
CONCLUSIONS • SRR was below 10% till 2007-08. Within a span of next five years only it
reached 22%.
• SRR in inland districts are comparatively higher than that of coastal district. Timely availability of desired variety is a constraint
• Role of private seed entrepreneurs have increased significantly in production & marketing of both Foundation and Certified seeds
• Central Government schemes like NFSM and BGREI facilitates production of rice seeds in the state
• Both share of production and distribution of Swarna seeds and adoption of Swarna has declined over the period and is replaced mostly by MTU-1001
• Area under rice seed production has increased significantly over the years and is stated to reach a higher front in the near future thereby increasing the possibility of higher SRR as well as increased export to neighbouring states as well as countries like Bangladesh. However, quality is a major concern.
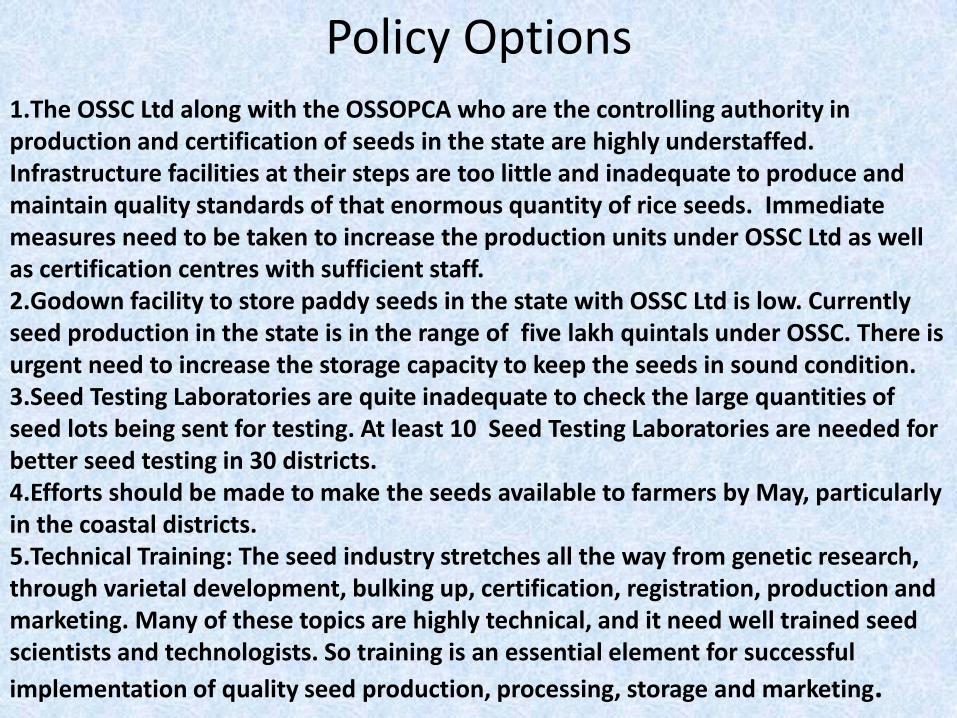
Policy Options 1.The OSSC Ltd along with the OSSOPCA who are the controlling authority in production and certification of seeds in the state are highly understaffed. Infrastructure facilities at their steps are too little and inadequate to produce and maintain quality standards of that enormous quantity of rice seeds. Immediate measures need to be taken to increase the production units under OSSC Ltd as well as certification centres with sufficient staff. 2.Godown facility to store paddy seeds in the state with OSSC Ltd is low. Currently seed production in the state is in the range of five lakh quintals under OSSC. There is urgent need to increase the storage capacity to keep the seeds in sound condition. 3.Seed Testing Laboratories are quite inadequate to check the large quantities of seed lots being sent for testing. At least 10 Seed Testing Laboratories are needed for better seed testing in 30 districts. 4.Efforts should be made to make the seeds available to farmers by May, particularly in the coastal districts. 5.Technical Training: The seed industry stretches all the way from genetic research, through varietal development, bulking up, certification, registration, production and marketing. Many of these topics are highly technical, and it need well trained seed scientists and technologists. So training is an essential element for successful
implementation of quality seed production, processing, storage and marketing.
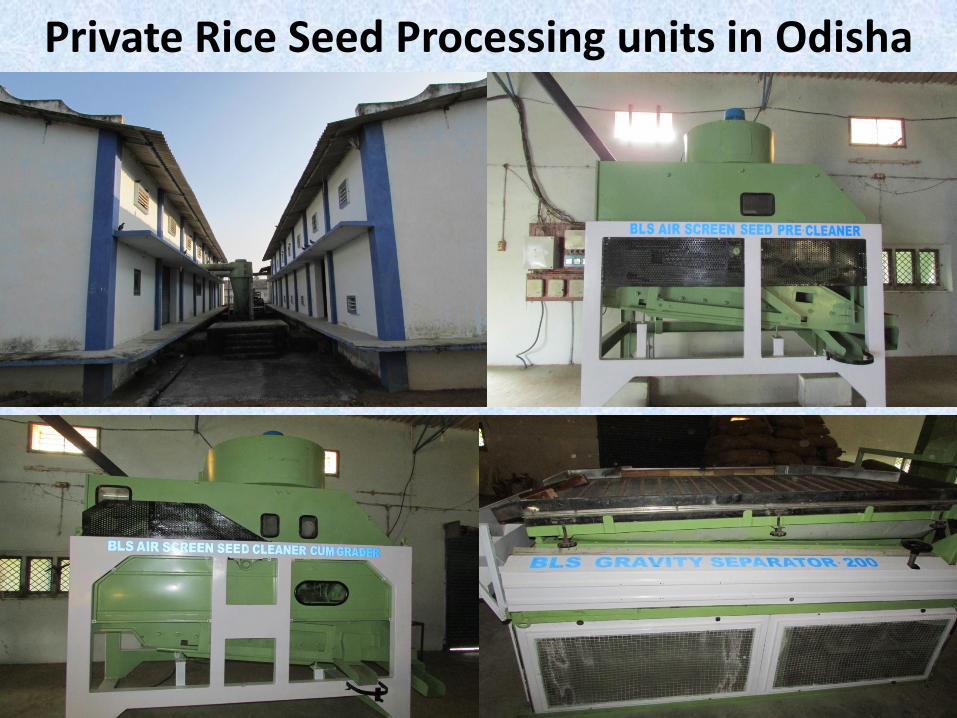
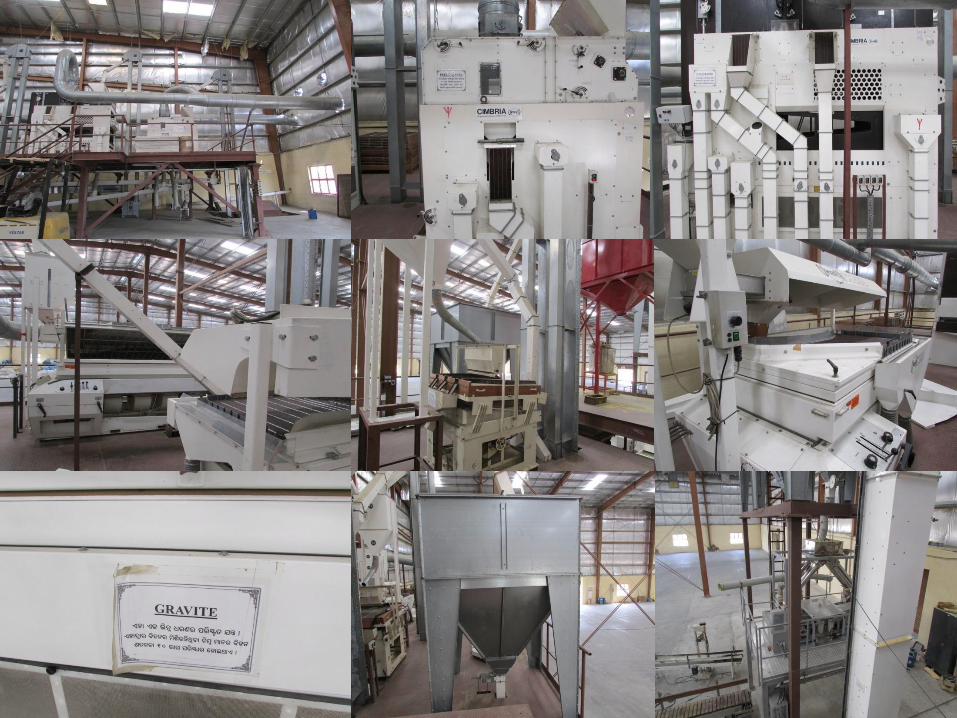
Private Rice Seed Processing units in Odisha

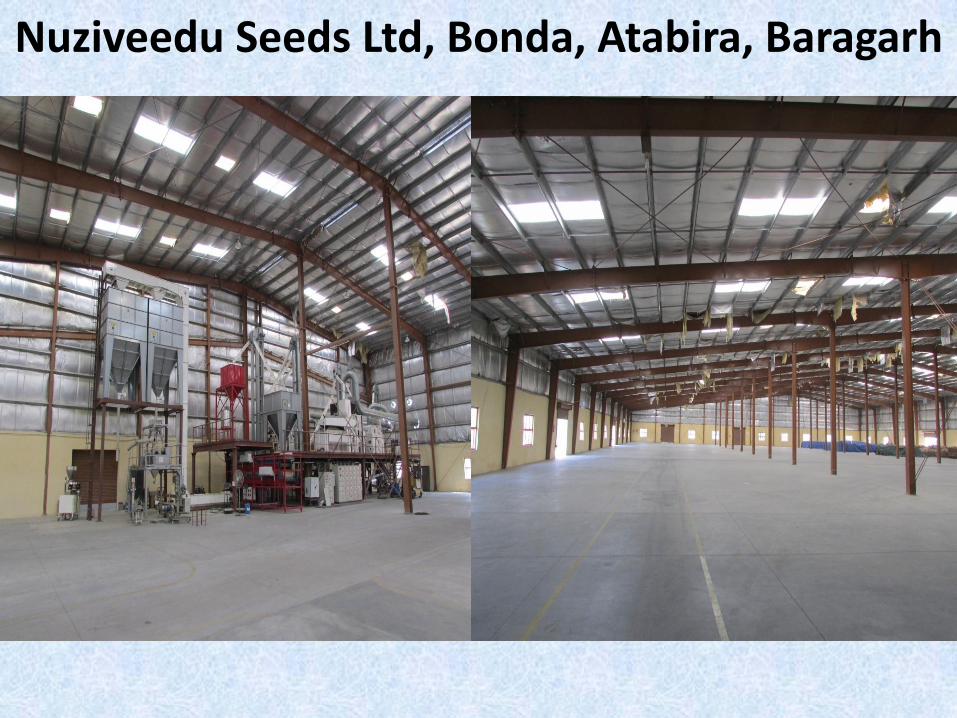
Nuziveedu Seeds Ltd, Bonda, Atabira, Baragarh
Thank you