Embed Size (px)
Citation preview

Production and Life

Textbook HW read p214-221Answer the following questions
1. Why is Detritus important ?
2. Explain Nutrient Regeneration?
3. How is primary production measured?
4. What types of bacteria perform nitrogen fixation?
5. What is a tertiary consumer?

Homework
• The Oceans Primary Productivity
• Study questions 1-14
• Page 4-13

Productivity Definitions

Primary Productivity
• The rate of carbon fixation under a square meter of sea surface in a unit of time
• Which means how much glucose is made in a set area during a set time.

What is Carbon Fixing Mean???
Carbon is “fixed” (built into an organic molecule) through the process of photosynthesis
Carbon is added to hydrogen and oxygen to produce C6H12O6 aka_ glucose

Photosynthesis
• Fixes carbon into glucose using the energy of sunlight
• 6CO2 + 6H2O + sunlight C6H12O6 + 6O2

Chemosynthesis
• Fixes carbon into glucose using energy from chemical compounds found at hydrothermal vents (especially hydrogen sulfide)
• Base of food chain that doesn’t require sunlight

Respiration
• The breakdown of glucose in the presence of oxygen to release Energy for life processes
• C6H12O6 + 6O2 6CO2 + 6H2O + energy
• Gross primary productivity – total primary production (carbon fixed)
• Net primary productivity – amount of primary production minus the amount used by respiration = amount available to support other trophic levels
Trophic level ------ a feeding level

Biomass and Standing Crop• Biomass = the organic matter that is
produced…Many times expressed as a weight
• Standing crop = the total amount of plant biomass present in a given volume of water at a given instant
• This helps us determine how much life can the area support –Remember Carrying Capacity?

Figure 14.1

Figure 14.4
Water column stability = less nutrients therefore less BIOMASS
Note: Plenty of solar energy little nutrients – tropical location

How to measure primary productivity

Plankton Net• A fine mesh net used to collect samples of
microscope Plankton
Make a Plankton Net – 20 points
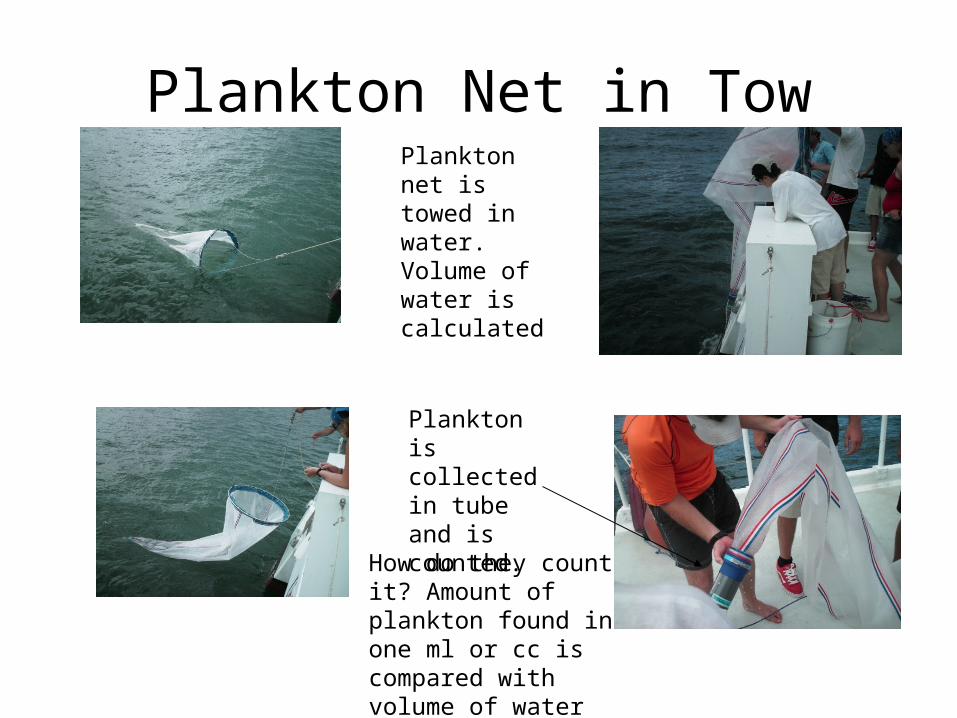
Plankton Net in TowPlankton net is towed in water. Volume of water is calculated
Plankton is collected in tube and is counted.
How do they count it? Amount of plankton found in one ml or cc is compared with volume of water

Measure standing crop
• 3 ways– Filtration of cells – plankton tow– Chlorophyll extraction– Chlorophyll fluorescence – satellite imagery
• Drawbacks– Patchy distribution

Satellite Imagery
One way to measure productivity
Measures chlorophyll concentration per square meter of sea surface
Only measures top meter of water
Limited because blue light penetrates 100 m.
That means ONLY1% of possible water column production is measured


Production is highest off of the land masses …WHY?

What time of year is this in NY?

Compensation depth
• Depth where the rate of respiration = the rate of photosynthesis
• Net productivity will be ZERO

Figure 14.8

Compensation depth decreases with phytoplankton growth
More Production!Result = reservoir of nutrients
below compensation depth

The area in the water column where production equals
consumption
Bio
mas
s
Sta
nding C
rop
Com
pensa
tion
depth
Photo
synth
esis
27.8%
0.0%
55.6%
16.7%
1. Biomass
2. Standing Crop
3. Compensation depth
4. Photosynthesis

The total amount of plant biomass present in a given volume of water
at a given instant
Bio
mas
s
Sta
nding C
rop
Com
pensa
tion
Depth
Wat
er C
olum
n Sta
bility
21.1%15.8%
0.0%
63.2%
1. Biomass
2. Standing Crop
3. Compensation Depth
4. Water Column Stability

More Productivity in the Nertic Zones is a result of
Nutri
ent R
unoff
More
Lig
ht
Les
s Bac
teria
Les
s Lig
ht
47.4%
15.8%
5.3%
31.6%
1. Nutrient Runoff
2. More Light
3. Less Bacteria
4. Less Light

At Compensation Depth Net Productivity will be
90%
10% 1%
0
5.3%
47.4%
15.8%
31.6%
1. 90%
2. 10%
3. 1%
4. 0

What percentage of water column productivity is measured in Satellite
Imaging
100% 99
% 1% 0%
5.3%0.0%
78.9%
15.8%
1. 100%
2. 99%
3. 1%
4. 0%

Carbon fixing results in the production of
Car
bon Dio
xide
Met
hane
Glu
cose
Nitr
ates
44.4%
0.0%
38.9%
16.7%
1. Carbon Dioxide
2. Methane
3. Glucose
4. Nitrates

Fastest Responders (in seconds)
3.89 Francesca Gonzales
5.09 Jane Newman
6.8 Shqiprie Dreshaj
9.93 Jessica Colantuono
10.25 Christian Caja
Factors that affect primary productivity
•Light
•Nutrient availability
•Water column stability
Nutrients are brought by
• Runoff (from land) OR• WITHIN THE WATER COLUMN THROUGH:
• Upwelling (bottom water wells up as surface water moves away)
• Overturn (denser sinks, less dense rises)• Mixing (wind stirs up water column)

How to access deep nutrient reservoir
• Overturn– But strong winds may mix plankton too deep
for photosynthesis
• Upwelling– Ekman spiral– Divergence zones


Nutrient cycling returns nutrients to the food chain

Nutrients
Nitrogen Amino acids
Proteins
Nitrate, nitrite, ammonia
Phosphate NRG molecules
Cell membrane
Nucleic acids
Phosphate
Silica Tests – e.g. diatoms
Silica dioxide
Iron Affects nutrient
uptake

Generalized cycle
Available Nutrients
Producers
Consumers
Decomposition

Nitrogen cycle (Again)
Bacteria heavily involved
Ammonia nitrite nitrate for use by producers
N2 fixed for use by producers
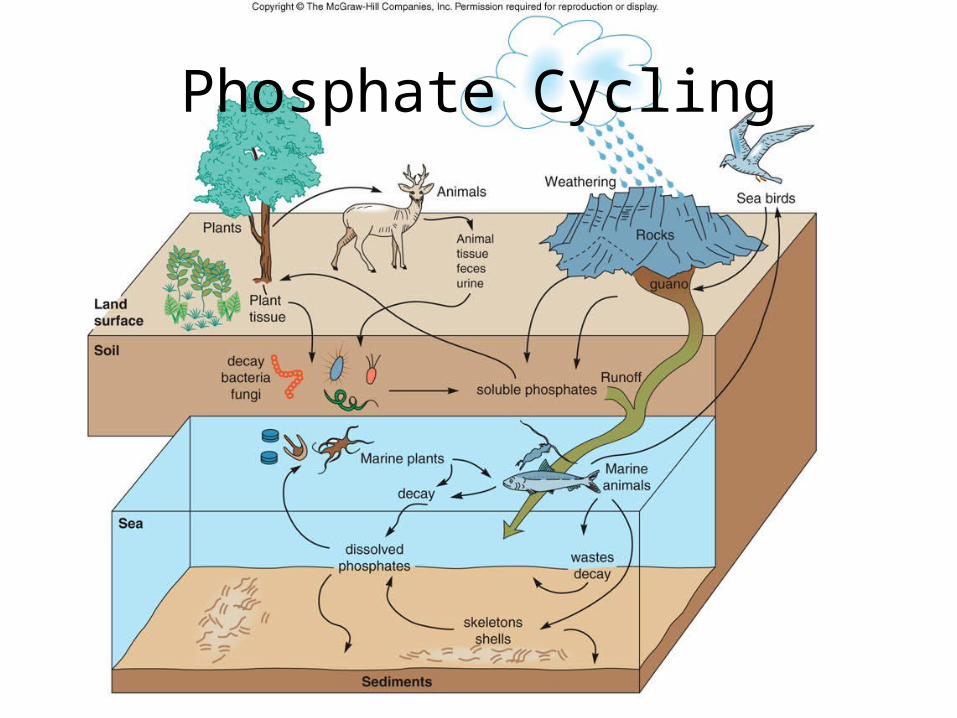
Phosphate Cycling

Nitrogen Cycling

Limiting Nutrient
The nutrient that runs out first and will limit growth
Usually Nitrogen “N”
N and P occur in similar concentrations, but producers need more N
In Our fish tanks no fish = no nitrates = no algae

Redfield Ratio
The elemental composition of marine organic matter (dead and living) is fairly constant. The ratios of carbon to nitrogen to phosphorus remaines the same from coastal (Neritic) to open ocean (Oceanic) regions.
C :N :P = 106 : 16: 1Carbon: Nitrogen : Phosphorus (This is molar ratio.)
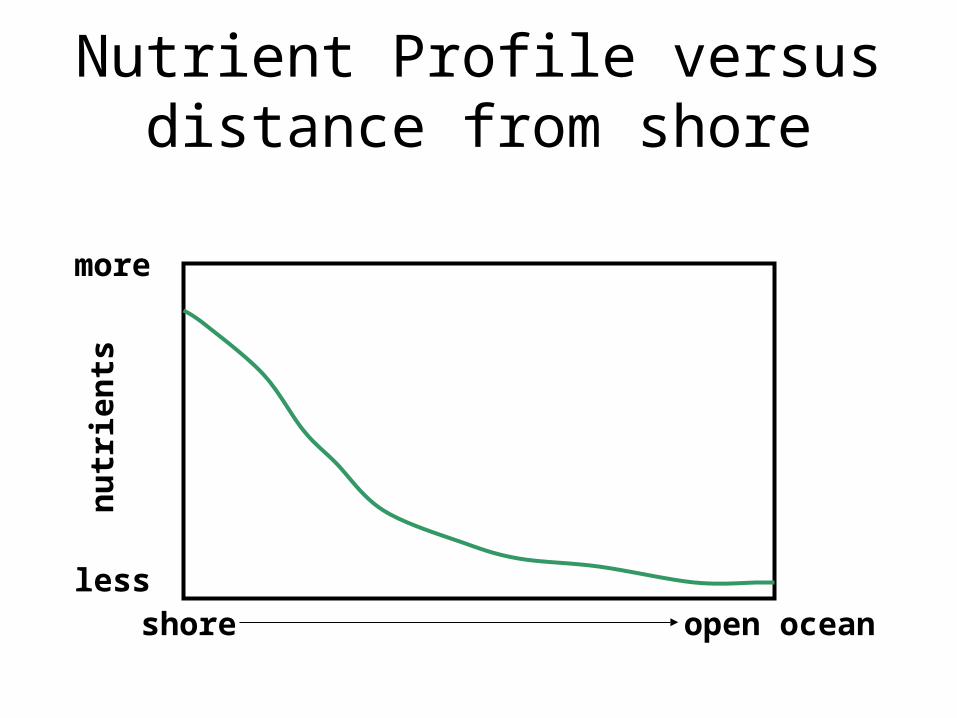
Nutrient Profile versus distance from shore
shore open ocean
more
less
nu
trie
nts

Nutrient Profile versus water depth
M
nutrients
Surface

Eutrophication
Excess nutrients (N and P) from fertilizers, sewage, etc., cause bloom in producers.
As nutrients are depleted, bloom dies all at once.
Massive decomposition depletes oxygen fish kills

Alive, healthy and Diverse
Dead- Algae covered
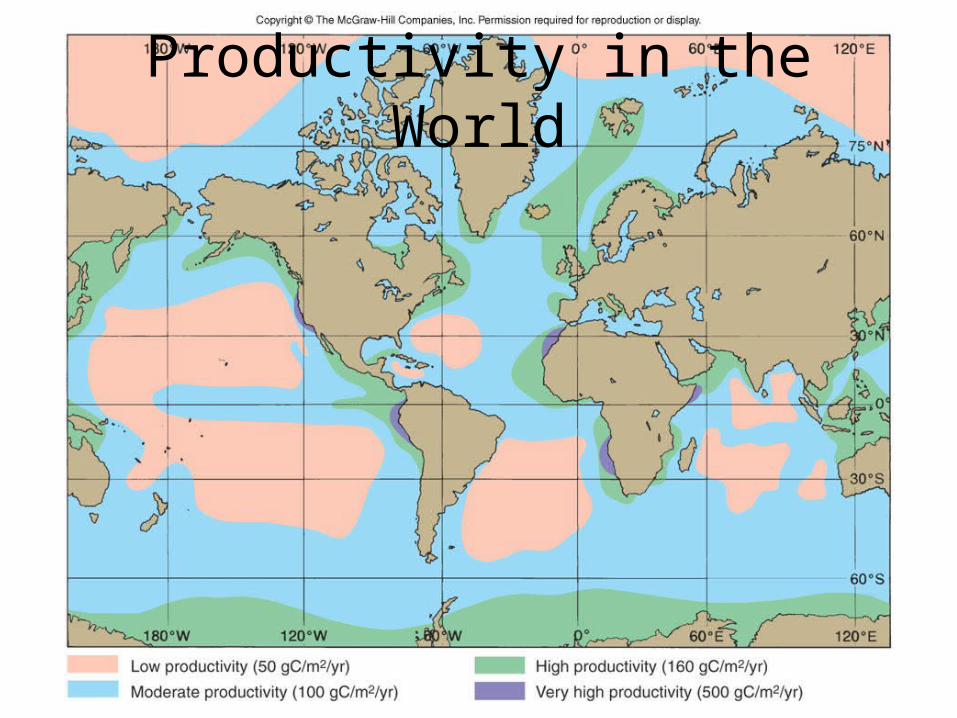
Productivity in the World

What controls productivity by latitude?
• Polar – light limits – 6 months of light or darkness
• Mid latitudes – light and nutrients limit as they vary over the year
• Tropics/ subtropics – nutrients limit

Figure 14.3
Peak points of both Nutrients and Solar energy = Peak Production

Figure 14.2

Figure 14.10

High latitudes (near poles)
• Very productive in summer
• Long day length in summer
• Weak, constant sun plus fresh water layer at surface plankton held above compensation depth

Figure 14.2

Middle latitudes
• Spring sun plus overturn from winter/spring storms/winds plus slightly stratified water column spring bloom
• Mid summer heat stratifies water column nutrient depletion
• Autumn sun weakens, stratification weakens, late summer storms replenish euphotic zone with nutrients
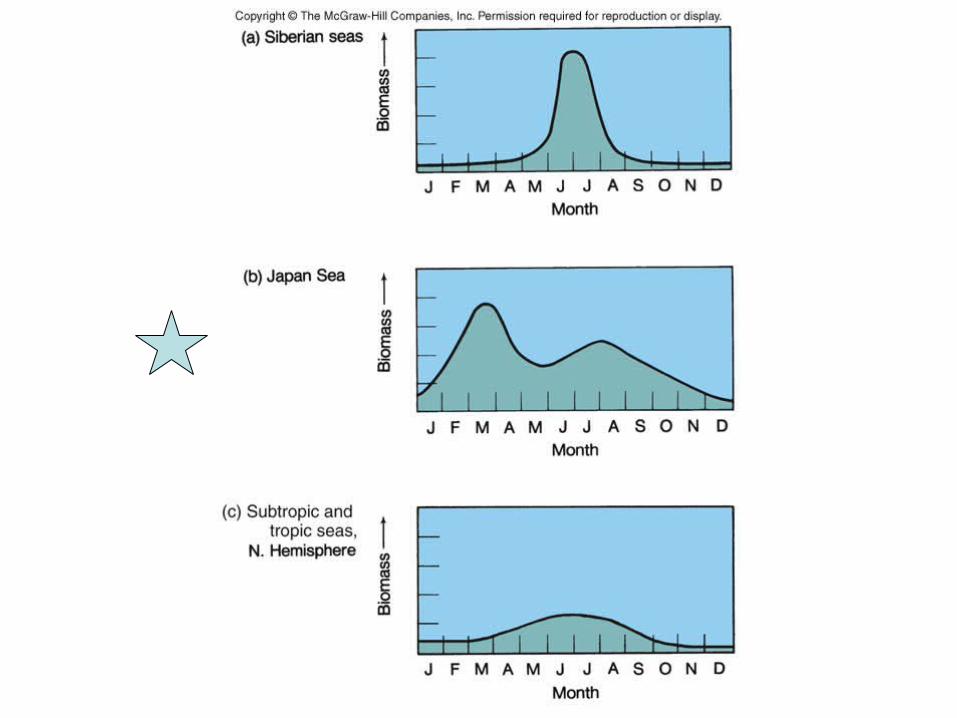
Figure 14.2

Mid Latitude Nutrient Light availability by season
Stratification of water column in summer

Low Latitudes(tropics / subtropics)
• Not very productive, except locally (productivity
reef based>phytoplankton based
• Consistent sun year round
• Upwelling and overturn not very common, and very localized

Figure 14.2

As you move from the Neritic to Oceanic Zones
Nutri
ents
Incr
ease
Nutri
ents
dec
reas
e
Nutri
ents
rem
ain
the.
..
0.0% 0.0%0.0%
1. Nutrients Increase
2. Nutrients decrease
3. Nutrients remain the same

The three elements in the Redfield ratio are
Car
bon Hyd
rogen
O...
Car
bon Hyd
rogen
an.
..
Car
bon Nitr
ogen a
n...
Car
bon Nitr
ogen a
n...
0.0% 0.0%0.0%0.0%
1. Carbon Hydrogen Oxygen
2. Carbon Hydrogen and Phosphorus
3. Carbon Nitrogen and Hydrogen
4. Carbon Nitrogen and Phosphorus

The nutrient which runs out first and will limit growth
Gro
wth N
utrien
t
Runni
ng N
utrien
t
Sta
ndard N
utrie
nt
Lim
iting N
utrie
nt
0.0% 0.0%0.0%0.0%
1. Growth Nutrient
2. Running Nutrient
3. Standard Nutrient
4. Limiting Nutrient

The limiting Nutrient for most primary producers is
Nitr
ogen
Phosp
horus
Iron
Car
bon
0.0% 0.0%0.0%0.0%
1. Nitrogen
2. Phosphorus
3. Iron
4. Carbon

Which is NOT a factor that would affect primary productivity
Lig
ht
Nutri
ents
Wat
er C
olum
n Sta
bility
Fis
h po
pulatio
n
0% 0%0%0%
1. Light
2. Nutrients
3. Water Column Stability
4. Fish population
Which factor most limits Polar productivity
0%
0%
0%
0% 1. Nutrients
2. Light
3. Water Column Stability
4. Temperature

Which factor limits productivity in the tropic regions?
Lig
ht
Wat
er S
tabili
ty
Nutri
ents
Tem
perat
ure
0% 0%0%0%
1. Light
2. Water Stability
3. Nutrients
4. Temperature

Fastest Responders (in seconds)
0 Participant 1
0 Participant 2
0 Participant 3
0 Participant 4
0 Participant 5
Marine Food Chain
• A review of the food chain, food web and food pyramid
• Review of flow of energy and related terms

Food chain terms
• Autotroph– Photoautotroph- makes food using light– Chemotroph – makes food using chemical compounds
• Heterotroph – gets energy from other organisms• Producer – makes its own food (Autotroph)• Consumer – consumes producers or other consumers• Herbivore- consumes plant matter• Carnivore – consumes meats

• Food chains and food webs show trophic (feeding) relationships between members of a community
• Arrows show flow of energy
Food or Prey Consumer

Food Chain

Food Web

More connections means more stability
Very important reason to maintain biodiversity
More food choices if one runs out the organism has others and a better
chance to survive
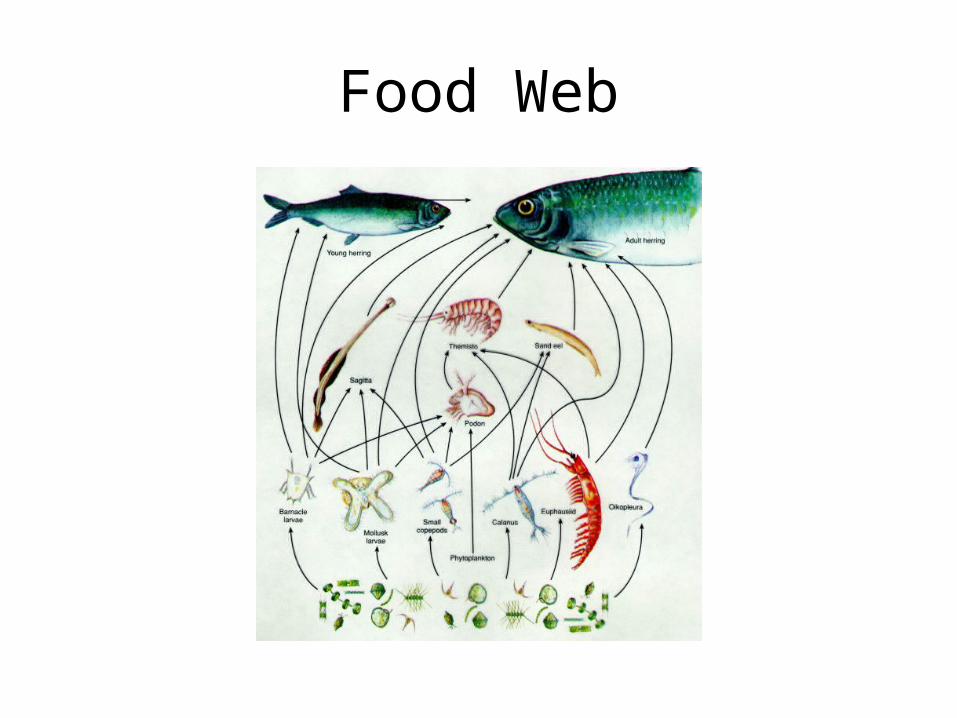
Food Web

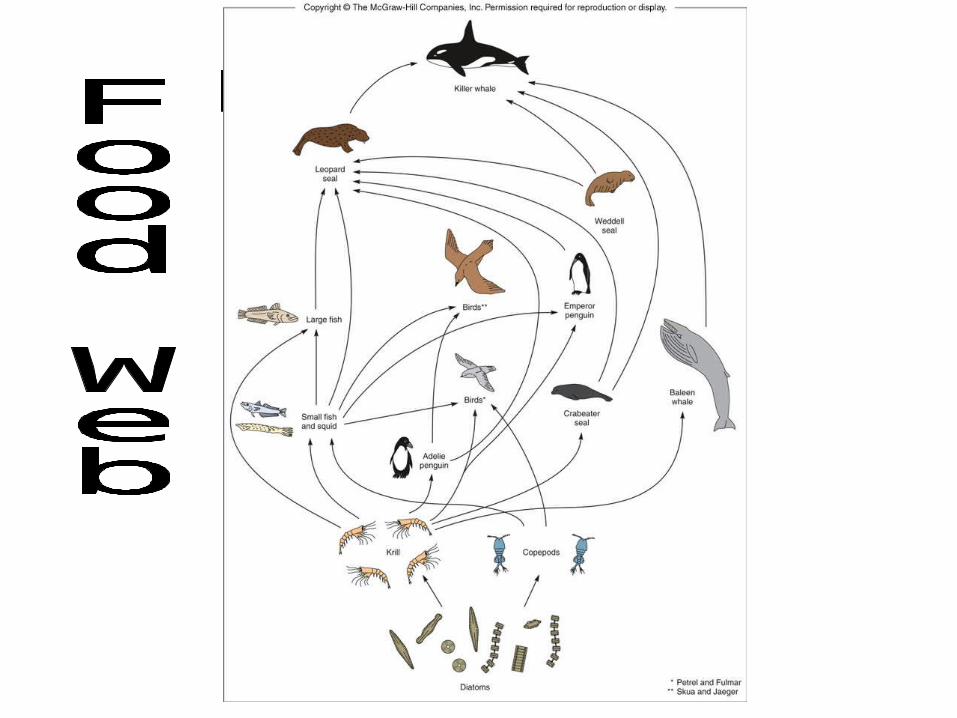
Figure 14 p.385

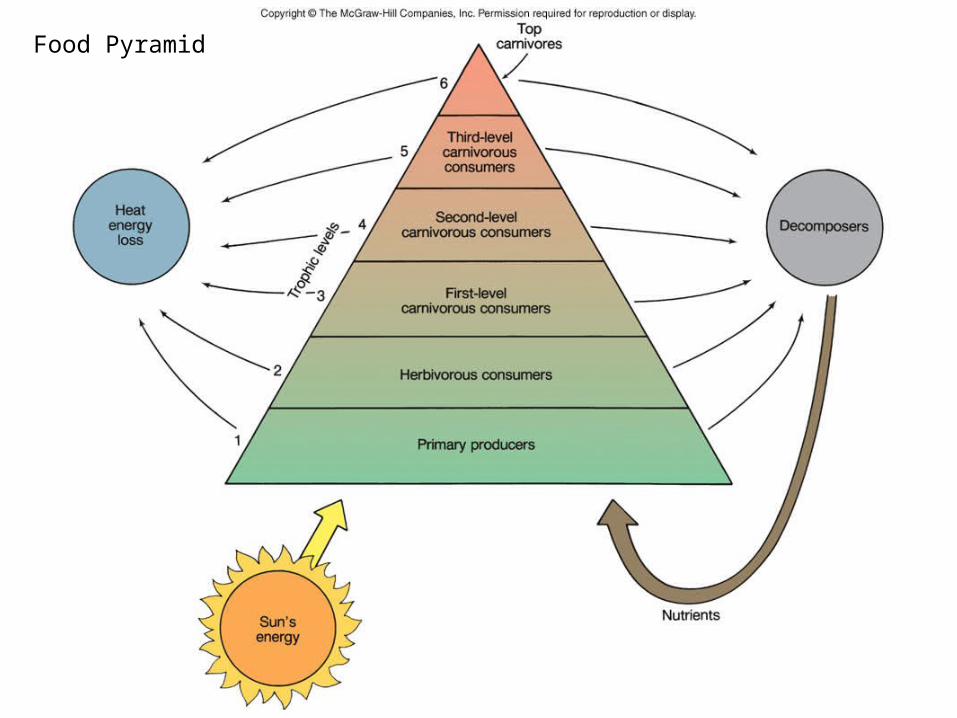
Food Pyramid

Pyramid of Numbers

Pyramid of Biomass
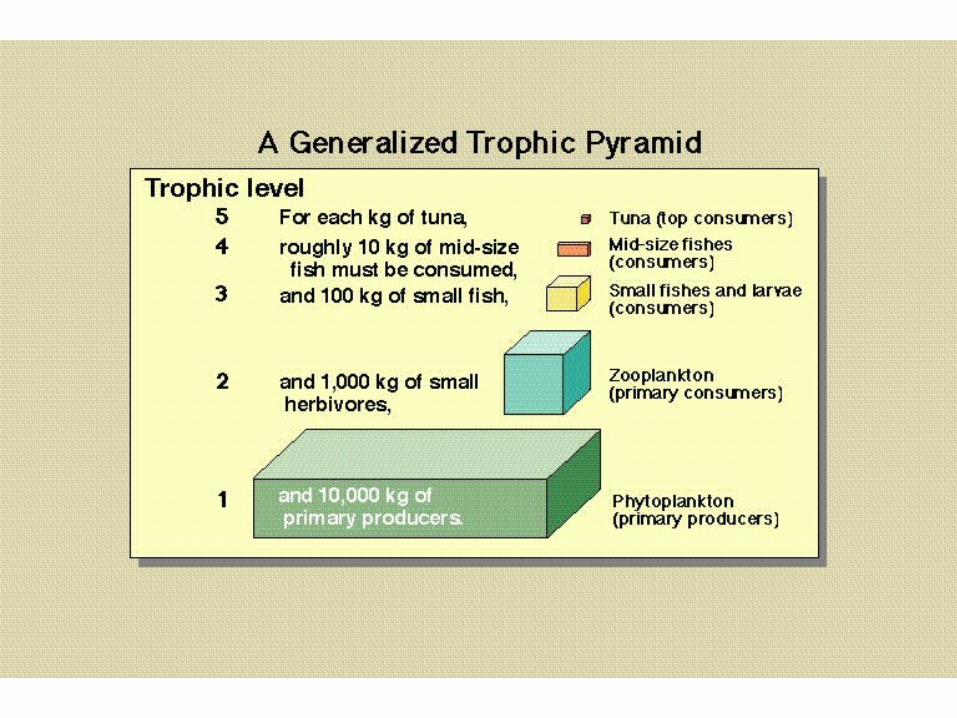

• The amount of energy transferred at each step in a food chain averages about 10% - less lost in very productive environments where little energy expended to get food

Figure 14.13