Embed Size (px)
Citation preview
International Journal Of Advancement In Engineering Technology, Management and Applied Science (IJAETMAS)
ISSN: 2349-3224 || www.ijaetmas.com || Volume 04 - Issue 04 || April-2017 || PP. 1-31
www.ijaetmas.com
PRODUCTION AND EVALUATION OF COOKIES FROM
WHOLE WHEAT AND DATE PALM FRUIT PULP AS SUGAR
SUBSTITUTE
Peter Ikechukwu,A. 1
; Okafor, D. C. 1
; Kabuo, N. O. 1
; Ibeabuchi, J.C. 1
; Odimegwu, E.
N. 1
; Alagbaoso, S. O. 1
Njideka, N.E. 1
and Mbah, R. N. 1
1Dept. of Food Science and Technology, Federal University of Technology, Owerri, P. M. B. 1526 Owerri, Imo
State, Nigeria
Abstract
Production and evaluation of cookies from whole wheat flour and date palm fruit pulp as sugar substitute was
studied. Whole wheat grains (WW) were cleaned and milled into flour. Date palm was cleaned, deseeded, dried
and milled into flour. Composite flour of whole wheat and date palm meal were formulated in the following
ratios: 90:10, 80:20, 70:30, 60:40, 50:50, which were used to produce cookies using refined wheat flour as
control (W), Functional properties and proximate analysis were carried out on the flour samples. Proximate
analysis, physical properties, microbial analysis and sensory evaluation of cookies were carried out. Data
obtained were statistically analyzed by ANOVA and mean separation by Fishers LSD. The use of date palm
fruit pulp as sugar substitute in cookie production improved the properties of the flours such as swelling index,
oil absorption capacity, pH and viscosity as they were comparable to the control (refined wheat flour -W-).
There were no significant difference in emulsion capacity, gelatinous temperature and bulk density of all the
flour samples. The proximate composition of the samples generally increased with increase in incorporation of
date palm pulp with the exception of carbohydrate and protein. The proximate composition of cookies increased
with increase in percentage palm pulp in the cookies and the samples were comparable to the control (W) except
in protein content where the control was very high. The physical properties of cookies produced from
composites were comparable to the control with the exception of break strength which decreased with increase
in date palm pulp incorporation. The organoleptic characteristics of WWDP3 (whole wheat – date palm in the
ratio of 70:30) was rated overall best in all the parameters tested. The incorporation of date palm pulp in cookies
should not be less than 30%. Cookies samples stored for six (6) weeks had microbial loads less than the
maximum count recommended in literature.
Keywords: Wheat Flour, Date Palm, Cookies, Proximate, Physical properties and Sensory
1.0 Introduction
Cookies are one of the best known quick snack products (Farheena et al.; 2015). Olaoye et al.; (2007)
described cookies as nutritive snacks produced from unpalatable dough that is transformed into appetizing
product through the application of heat in an oven. They are popular examples of bakery product of ready-to-eat
snack that possess several attractive features including wide consumption, more convenient with long shelf-life
and have the ability to serve as vehicles for important nutrient (Ajibola et al.; 2015). Cookies are chemically
leavened product (Hanan, 2013). Generally, the name cookies are used in the USA and biscuit is used in the
European countries (Sivasankar, 2002). Cookies and other bakery products have now become loved fast food
products for every age-group, because they are easy to carry about, tasty to eat, cholesterol-free, containing
digestive and dietary principles of vital importance and reasonably cheap (Farheena et al.; 2015). They can be
made from hard dough, hard sweet dough or soft dough. Examples of biscuits made from the above mentioned
types of flour include crackers, rich tea and short cake respectively (Kulkarni, 2007; Olaoye et al.; 2007;
Nwosu, 2013; Farheena et al.; 2015). Cookies are characterized by a formula high in sugar and shortening and
International Journal Of Advancement In Engineering Technology, Management and Applied Science (IJAETMAS)
ISSN: 2349-3224 || www.ijaetmas.com || Volume 04 - Issue 04 || April-2017 || PP. 1-31
www.ijaetmas.com
low in water. They differ from other baked foods like bread and cakes because they have low moisture content,
making them comparatively free from microbial spoilage and having long shelf (Hanan, 2013).
The main ingredients of cookies are wheat flour, fat (margarine) and sugar and water, while other
ingredients such as milk, salt, aerating agent, emulsifier, flavor and colour can be included. They can also be
enriched or fortified with other ingredients in order to meet specific nutritional or therapeutic needs of
consumers (Ajibola et al.; 2015). Flour used in making cookies is basically from wheat or composite flour
which forms the basic ingredients of bakery products including bread, rolls, cakes, cookies and other bakery
products (Giwa and Ikujenlola, 2010). However, the flours used in production of many bakery products are
bleached (or refined flours) which some researchers call ‗slow poison‘ (Erleen, 2011) owing to their associated
side effect on health on long time consumption. Some call them ―glue of the gut‖ (Erleen, 2011) and discourage
people from consuming them or reduce their intake of foods prepared from these flours because of the
associated health risk (Erleen, 2011). However, recent epidemiological studies have shown that the consumption
of whole wheat grains and whole wheat flour sometimes called graham flour and grain-based products is
associated with the reduced risk of oxidative stress related to chronic diseases and age related disorders, such as
cardiovascular diseases, carcinogenesis, type II diabetes and obesity (Lilei et al.; 2013). Most biscuits in the
market are made from bleached flour, however whole grain flours from whole Kernel grains conceal an array of
health benefits attributed to the presence of antioxidants such as vitamin C, vitamin E (tecopherols and
tocotrienols) and Carotenoids (Lilei et al.; 2013). Bleaching of flour leads to loss of minerals and vitamins and
causes the production of alloxan. Alloxan is used to induce diabetes in rats. Sugar is the second major ingredient
used in cookie production. Sugar has its own associated problem of inducing metabolic problems such as type II
diabetes, obesity etc hence it contains a whole lot of calories with no essential nutrients.
Date Palm fruit (Phoenix dactylifera L) locally called ‗debino‘ in Hausa language, from the family of
Arecaceae (Al-daihan Bhat, 2012) is a sweet edible fruit. The fruit is a drupe in which an outer fleshy part
consists of pulp and Pericarp surrounding a shell of hard endocarp with a seed inside (Farheena et al.; 2015).
Date fruit contains more than 70% sugar mainly glucose and fructose and therefore are high energy food sources
(Dada et al.;2012), thus making it an ideal replacement for sugar (sucrose) in the cookies recipe, which is also
of great nutritional benefit to diabetics and other metabolic health related patients. Besides, date fruit is rich in
fibre (Hamza et al.; 2014), very rich in antioxidant flavonoids such as beta-carotene, lutein and zeaxanthin.
They are also excellent source of iron, calcium, copper, magnesium, potassium, and minor source of vitamins A,
and B2 (Dada et al.; 2012; Farheena et al.; 2015).
Therefore, considering the nutritional constituents of whole wheat flour and date palm fruit as a
substitute for sugar, cookies baked with this combination will not only be an ideal snacks/food for diabetics and
other metabolic health related patients but will also become a good functional food of great nutritional benefit.
The objective of this paper is to produce cookies from the formulated recipe (whole wheat flour and substitution
of sugar with date palm fruit pulp at different ratios), evaluate the functional properties of the blends, proximate
composition, Physical properties, Sensory attributes and monitor the Storage stability (Shelf-life) of the cookies
produced, using qualitative and quantitative analysis techniques
International Journal Of Advancement In Engineering Technology, Management and Applied Science (IJAETMAS)
ISSN: 2349-3224 || www.ijaetmas.com || Volume 04 - Issue 04 || April-2017 || PP. 1-31
www.ijaetmas.com
2.0 Materials and Methods
2.1 Material Collection
The Date Palm Fruit (Dried date) was purchased at Ama-Hausa, Douglas, Owerri Imo State. Other ingredients
such as the whole wheat, milk, egg, salt, margarine (fat), baking powder, sugar were purchased at Eke-Ukwu
market, Owerri main market, Imo State.
2.2 Methods
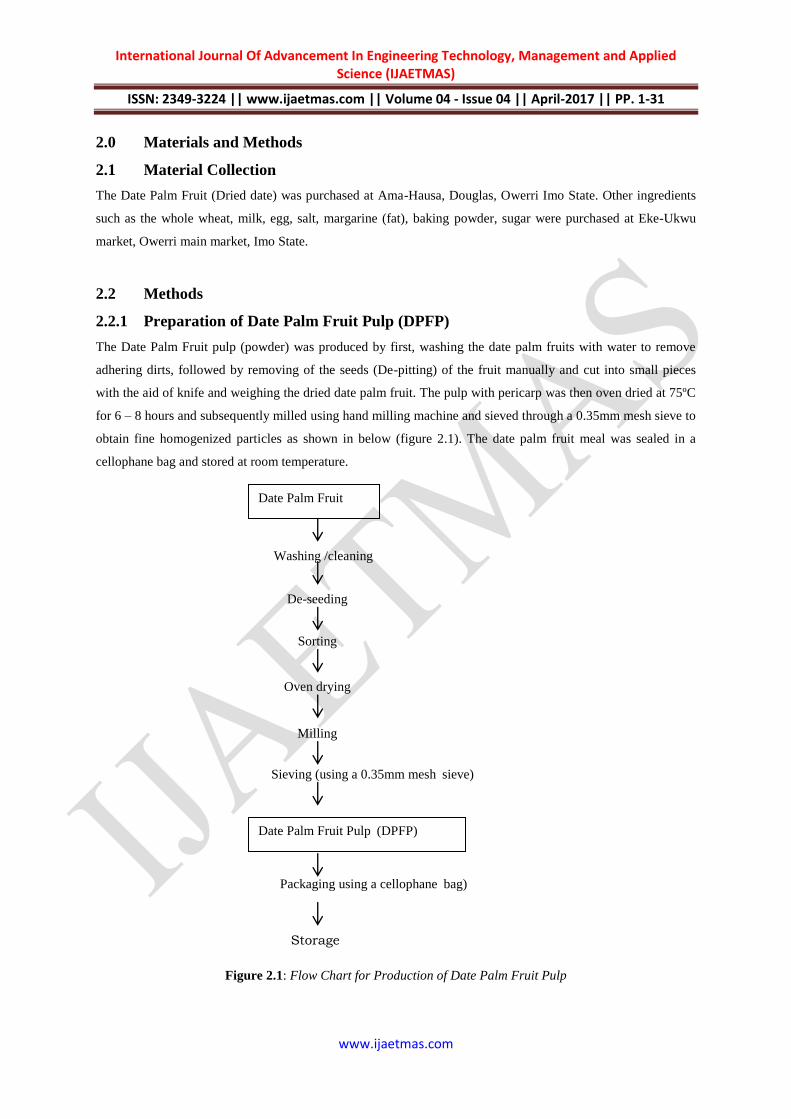
2.2.1 Preparation of Date Palm Fruit Pulp (DPFP)
The Date Palm Fruit pulp (powder) was produced by first, washing the date palm fruits with water to remove
adhering dirts, followed by removing of the seeds (De-pitting) of the fruit manually and cut into small pieces
with the aid of knife and weighing the dried date palm fruit. The pulp with pericarp was then oven dried at 75ºC
for 6 – 8 hours and subsequently milled using hand milling machine and sieved through a 0.35mm mesh sieve to
obtain fine homogenized particles as shown in below (figure 2.1). The date palm fruit meal was sealed in a
cellophane bag and stored at room temperature.
Figure 2.1: Flow Chart for Production of Date Palm Fruit Pulp
Date Palm Fruit
Washing /cleaning
De-seeding
Sorting
Oven drying
Milling
Sieving (using a 0.35mm mesh sieve)
Date Palm Fruit Pulp (DPFP)
Packaging using a cellophane bag)
Storage
International Journal Of Advancement In Engineering Technology, Management and Applied Science (IJAETMAS)
ISSN: 2349-3224 || www.ijaetmas.com || Volume 04 - Issue 04 || April-2017 || PP. 1-31
www.ijaetmas.com
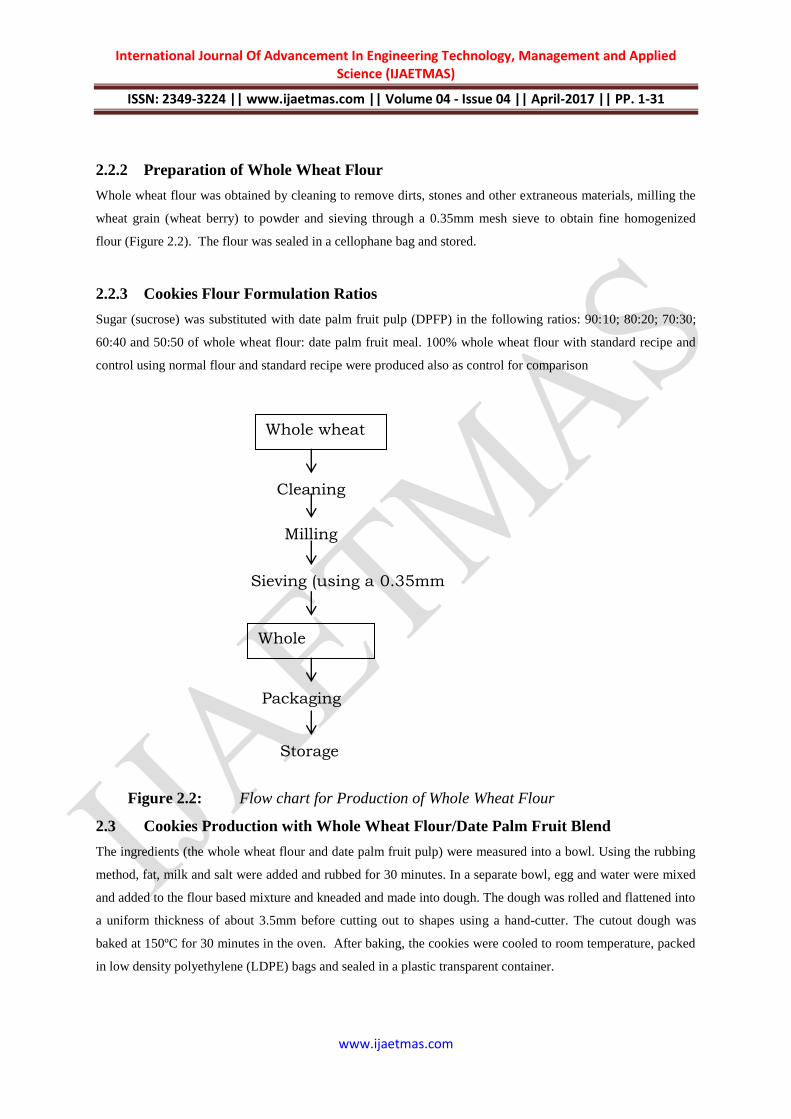
2.2.2 Preparation of Whole Wheat Flour
Whole wheat flour was obtained by cleaning to remove dirts, stones and other extraneous materials, milling the
wheat grain (wheat berry) to powder and sieving through a 0.35mm mesh sieve to obtain fine homogenized
flour (Figure 2.2). The flour was sealed in a cellophane bag and stored.
2.2.3 Cookies Flour Formulation Ratios
Sugar (sucrose) was substituted with date palm fruit pulp (DPFP) in the following ratios: 90:10; 80:20; 70:30;
60:40 and 50:50 of whole wheat flour: date palm fruit meal. 100% whole wheat flour with standard recipe and
control using normal flour and standard recipe were produced also as control for comparison
Figure 2.2: Flow chart for Production of Whole Wheat Flour
2.3 Cookies Production with Whole Wheat Flour/Date Palm Fruit Blend
The ingredients (the whole wheat flour and date palm fruit pulp) were measured into a bowl. Using the rubbing
method, fat, milk and salt were added and rubbed for 30 minutes. In a separate bowl, egg and water were mixed
and added to the flour based mixture and kneaded and made into dough. The dough was rolled and flattened into
a uniform thickness of about 3.5mm before cutting out to shapes using a hand-cutter. The cutout dough was
baked at 150ºC for 30 minutes in the oven. After baking, the cookies were cooled to room temperature, packed
in low density polyethylene (LDPE) bags and sealed in a plastic transparent container.
Whole wheat
wWheat
Kernel Cleaning
Milling
Sieving (using a 0.35mm
mesh sieve)
Whole
Wheat
Flour Packaging
Storage
International Journal Of Advancement In Engineering Technology, Management and Applied Science (IJAETMAS)
ISSN: 2349-3224 || www.ijaetmas.com || Volume 04 - Issue 04 || April-2017 || PP. 1-31
www.ijaetmas.com
2.4 Formulation / Blends Combination used for the Preparation Of The Cookies
Blend 1: Whole wheat flour (100%) with sugar added according to standard cookie recipe, for comparison.
Blend 2: Whole wheat flour (ww): Date palm fruit pulp (DP) 90:10 → WWDP1
Blend 3: Whole wheat flour (ww): Date palm fruit pulp (DP) 80:20 → WWDP2
Blend 4: Whole wheat flour (ww): Date palm fruit pulp (DP) 70:30 → WWDP3
Blend 5: Whole wheat flour (ww): Date palm fruit pulp (DP) 60:40 → WWDP4
Blend 6: Whole wheat flour (ww): Date palm fruit pulp (DP) 50:50 → WWDP5
Blend 7: Wheat flour (100%) with sugar added according to standard cookie recipe served as standard control.
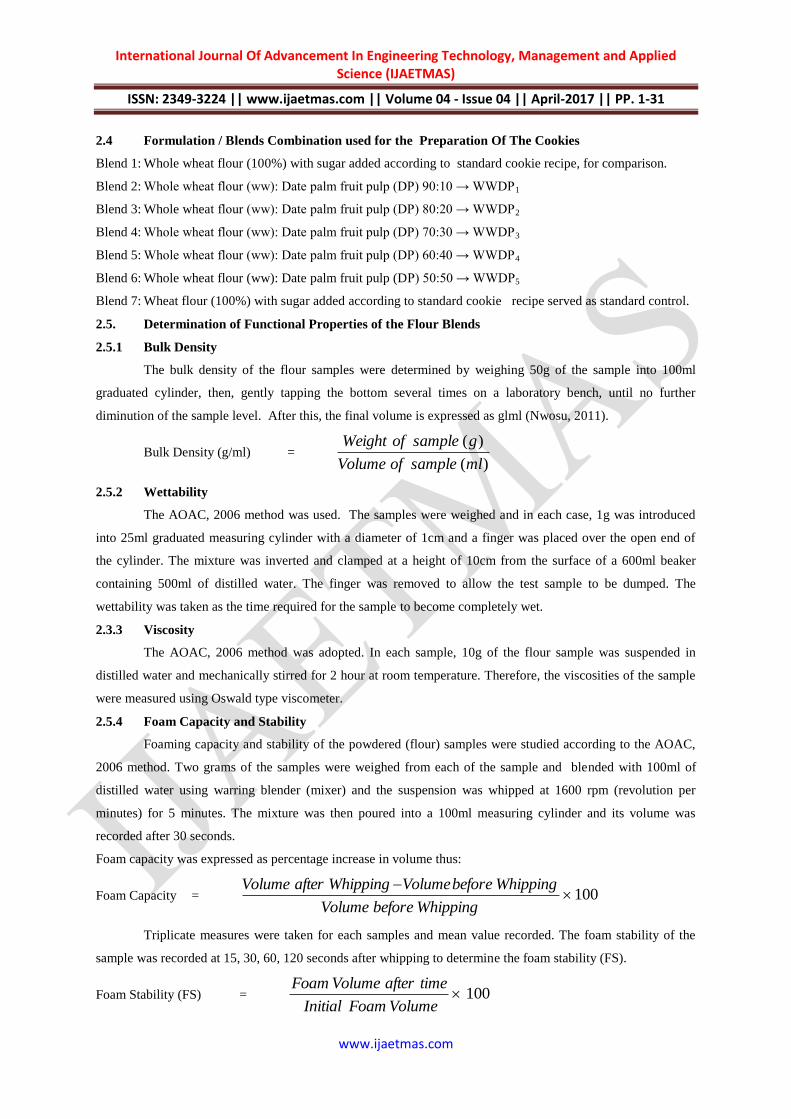
2.5. Determination of Functional Properties of the Flour Blends
2.5.1 Bulk Density
The bulk density of the flour samples were determined by weighing 50g of the sample into 100ml
graduated cylinder, then, gently tapping the bottom several times on a laboratory bench, until no further
diminution of the sample level. After this, the final volume is expressed as glml (Nwosu, 2011).
Bulk Density (g/ml) =
2.5.2 Wettability
The AOAC, 2006 method was used. The samples were weighed and in each case, 1g was introduced
into 25ml graduated measuring cylinder with a diameter of 1cm and a finger was placed over the open end of
the cylinder. The mixture was inverted and clamped at a height of 10cm from the surface of a 600ml beaker
containing 500ml of distilled water. The finger was removed to allow the test sample to be dumped. The
wettability was taken as the time required for the sample to become completely wet.
2.3.3 Viscosity
The AOAC, 2006 method was adopted. In each sample, 10g of the flour sample was suspended in
distilled water and mechanically stirred for 2 hour at room temperature. Therefore, the viscosities of the sample
were measured using Oswald type viscometer.
2.5.4 Foam Capacity and Stability
Foaming capacity and stability of the powdered (flour) samples were studied according to the AOAC,
2006 method. Two grams of the samples were weighed from each of the sample and blended with 100ml of
distilled water using warring blender (mixer) and the suspension was whipped at 1600 rpm (revolution per
minutes) for 5 minutes. The mixture was then poured into a 100ml measuring cylinder and its volume was
recorded after 30 seconds.
Foam capacity was expressed as percentage increase in volume thus:
Foam Capacity =
Triplicate measures were taken for each samples and mean value recorded. The foam stability of the
sample was recorded at 15, 30, 60, 120 seconds after whipping to determine the foam stability (FS).
Foam Stability (FS) =
)(
)(
mlsampleofVolume
gsampleofWeight
100
WhippingbeforeVolume
WhippingbeforeVolumeWhippingafterVolume
100VolumeFoamInitial
timeafterVolumeFoam
International Journal Of Advancement In Engineering Technology, Management and Applied Science (IJAETMAS)
ISSN: 2349-3224 || www.ijaetmas.com || Volume 04 - Issue 04 || April-2017 || PP. 1-31
www.ijaetmas.com
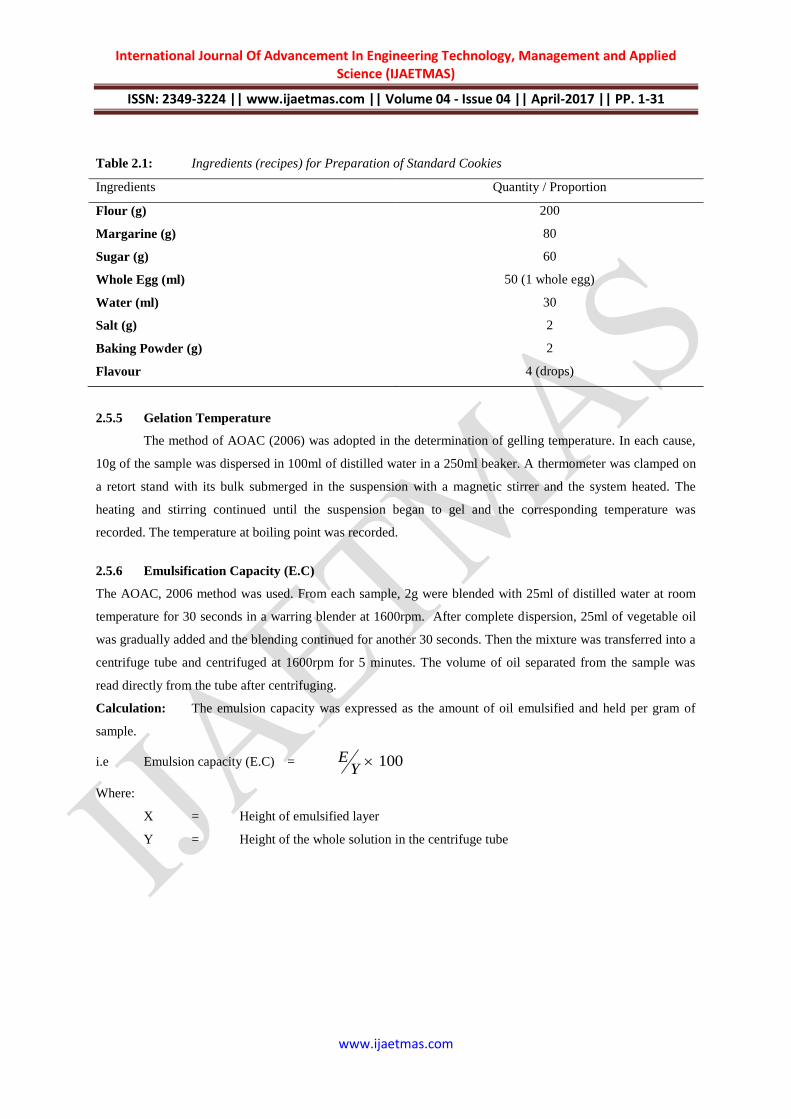
Table 2.1: Ingredients (recipes) for Preparation of Standard Cookies
Ingredients Quantity / Proportion
Flour (g) 200
Margarine (g) 80
Sugar (g) 60
Whole Egg (ml) 50 (1 whole egg)
Water (ml) 30
Salt (g) 2
Baking Powder (g) 2
Flavour 4 (drops)
2.5.5 Gelation Temperature
The method of AOAC (2006) was adopted in the determination of gelling temperature. In each cause,
10g of the sample was dispersed in 100ml of distilled water in a 250ml beaker. A thermometer was clamped on
a retort stand with its bulk submerged in the suspension with a magnetic stirrer and the system heated. The
heating and stirring continued until the suspension began to gel and the corresponding temperature was
recorded. The temperature at boiling point was recorded.
2.5.6 Emulsification Capacity (E.C)
The AOAC, 2006 method was used. From each sample, 2g were blended with 25ml of distilled water at room
temperature for 30 seconds in a warring blender at 1600rpm. After complete dispersion, 25ml of vegetable oil
was gradually added and the blending continued for another 30 seconds. Then the mixture was transferred into a
centrifuge tube and centrifuged at 1600rpm for 5 minutes. The volume of oil separated from the sample was
read directly from the tube after centrifuging.
Calculation: The emulsion capacity was expressed as the amount of oil emulsified and held per gram of
sample.
i.e Emulsion capacity (E.C) =
Where:
X = Height of emulsified layer
Y = Height of the whole solution in the centrifuge tube
100Y
E
International Journal Of Advancement In Engineering Technology, Management and Applied Science (IJAETMAS)
ISSN: 2349-3224 || www.ijaetmas.com || Volume 04 - Issue 04 || April-2017 || PP. 1-31
www.ijaetmas.com
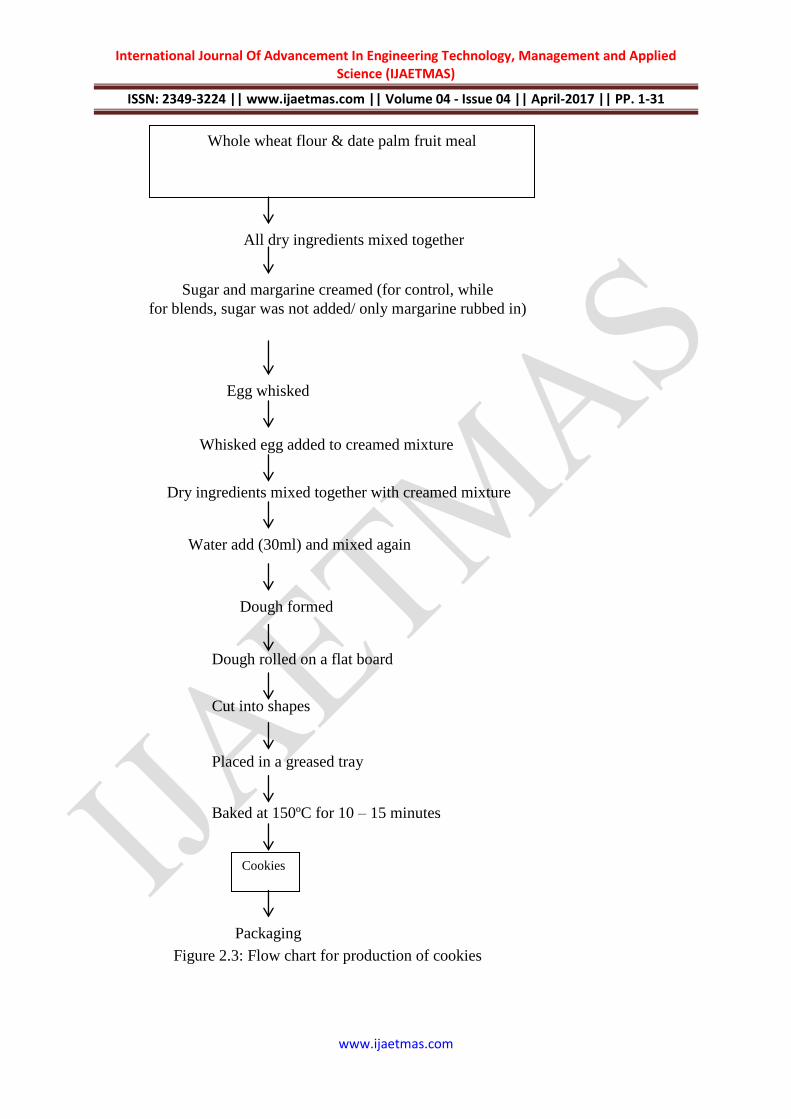
Whole wheat flour & date palm fruit meal
All dry ingredients mixed together
Sugar and margarine creamed (for control, while
for blends, sugar was not added/ only margarine rubbed in)
Egg whisked
Whisked egg added to creamed mixture
Dry ingredients mixed together with creamed mixture
Water add (30ml) and mixed again
Dough formed
Dough rolled on a flat board
Cut into shapes
Placed in a greased tray
Baked at 150ºC for 10 – 15 minutes
Cookies
Packaging
Figure 2.3: Flow chart for production of cookies
International Journal Of Advancement In Engineering Technology, Management and Applied Science (IJAETMAS)
ISSN: 2349-3224 || www.ijaetmas.com || Volume 04 - Issue 04 || April-2017 || PP. 1-31
www.ijaetmas.com
2.5.7 Gelatinization Temperature
Five grams of each sample was suspended in test tubes, heated in a boiling water bath with continuous
stirring, and 30 seconds after gelatinization was visually noticed, the temperature of the samples were taken as
the gelatinization temperature (Matthew et al., 2015).
.
2.5.8 Water / Oil Absorption Capacity
The AOAC, 2006 method was used, from each sample, one gram was weighed into a conical
graduated flask and 10ml of water or oil was added to the weighed sample. A warring whirl was used to mix the
sample for 30 seconds. The sample was allowed to stand at room temperature for 30 minutes and then
transferred to a graduated centrifuged tube and centrifuged at 5000rpm for 30 minutes. After wards, the mixed
sample was transferred from the graduated tube into a 10ml measuring cylinder to know the volume of the free
water or oil.
The absorption capacity was expressed as grams of oil or water absorbed per gram of sample.
Calculation: Water/Oil absorption capacity of the sample was calculated as:
Water/Oil Absorption Capacity =
Total Oil / Water absorbed – Free Oil/Water x Density of Oil/Water
.
2.5.9 Swelling Index Determination
Three grams of each of the sample was transferred into clean, graduated (50ml) cylinder and the volume noted.
Distilled water (30ml) was added to the flour sample, the cylinder was swirled and allowed to stand for 60
minutes while change in volume (swelling) was recorded every 15 minutes. The swelling power of the sample
was calculated as a multiple of the original volume as done by Ukpabi and Ndimele (2000).
2.5.10 pH Measurement
The pH values of the samples were determined by suspending 10g of each sample in 100ml of distilled
water in 250ml beaker. It was then thoroughly mixed and stirred and the pH was taken. This was triplicated and
the average calculated (Matthew et al., 2015).
2.6. Determination of the Proximate Composition of Cookies
2.6.1 Determination of Moisture Content
The moisture content was determined by weighing out 2g of the samples into a dry crucible of known
mass, charred into the oven at a temperature of 105ºC for 3 hours. The samples were cooled in a dessicator and
weighed using an electronic analytical balance. The whole process was repeated that is they were returned into
the oven for further drying, cooling and repeated weighing until a constant mass was obtained.
The difference in mass (weight of % moisture lost) was calculated as % moisture content =
10012
32
ww
ww
International Journal Of Advancement In Engineering Technology, Management and Applied Science (IJAETMAS)
ISSN: 2349-3224 || www.ijaetmas.com || Volume 04 - Issue 04 || April-2017 || PP. 1-31
www.ijaetmas.com
Where:
W1 = weight of empty crucible
W2 = weight of crucible + sample before drying
W3 = weight of crucible + sample after drying to constant mass.
2.6.2 Determination of Ash Content
Ash content was determined by furnace incineration, by weighing out two (2) grams of each of the
sample into a porcelain crucible of know mass, heated in moisture extraction oven (muffle furnace) at 550ºC for
3 hours until it completely ashed that is turned white and free of carbon. The sample were then removed from
the furnace, cooled in a dessicator to a room temperature and reweighed immediately. The weight of the ash
(residual ash) was then calculated as:
% Ash = …………………...3.2
Or
Where:
W1 = Weight of Empty crucible
W2 = Weight of crucible + Ash
2.6.3 Determination of Crude Fat Analysis
The solvent extraction method of AOAC (2000) was used. A soxhlet extraction unit was set-up with a
reflux condenser. A small round bottom flask was weighed after washing and drying and half filled with light
petroleum ether (boiling point 40 – 60ºC) and fixed into the unit. 2g of each of the samples were wrapped in
whatmann filter paper and gradually lowered into the thimble which was filled to the cleaned, dried and
weighed round bottom flask containing 120ml of N-hexane. Fat was extracted for 6 ours using the petroleum
ether and was recovered by distillation. After evaporating off of the solvent, the flask was dried in the oven at
105ºC, cooled in a desiccator and weighed in order to determined the amount of lipid extracted. By difference,
the mass of oil extracted was determined and thus expressed as
% Crude Fat =
2.6.4 Determination of Crude Protein Analysis
The microkjeldhal method, (N x 6. 25) as described by AOAC (2000) was used. The total Nitrogen
was determined using the conversion factor of 6.25. 2 g of the samples were boiled in 10ml of concentrated
H2SO4 in the presence of selenium catalyst (one table spoonful). Boiling was done under a fume cupboard until
a clear solution was formed. The digest was transferred into a volumetric flask containing a 100ml of distilled
water and 10ml of it was mixed with equal volumes of 45% NaOH solution and was poured into a kjeldhal
1
100
SampleOriginalofWeight
AshofWeight
10012
SampleofWeight
WW
100SampleofMass
FatofMass
International Journal Of Advancement In Engineering Technology, Management and Applied Science (IJAETMAS)
ISSN: 2349-3224 || www.ijaetmas.com || Volume 04 - Issue 04 || April-2017 || PP. 1-31
www.ijaetmas.com
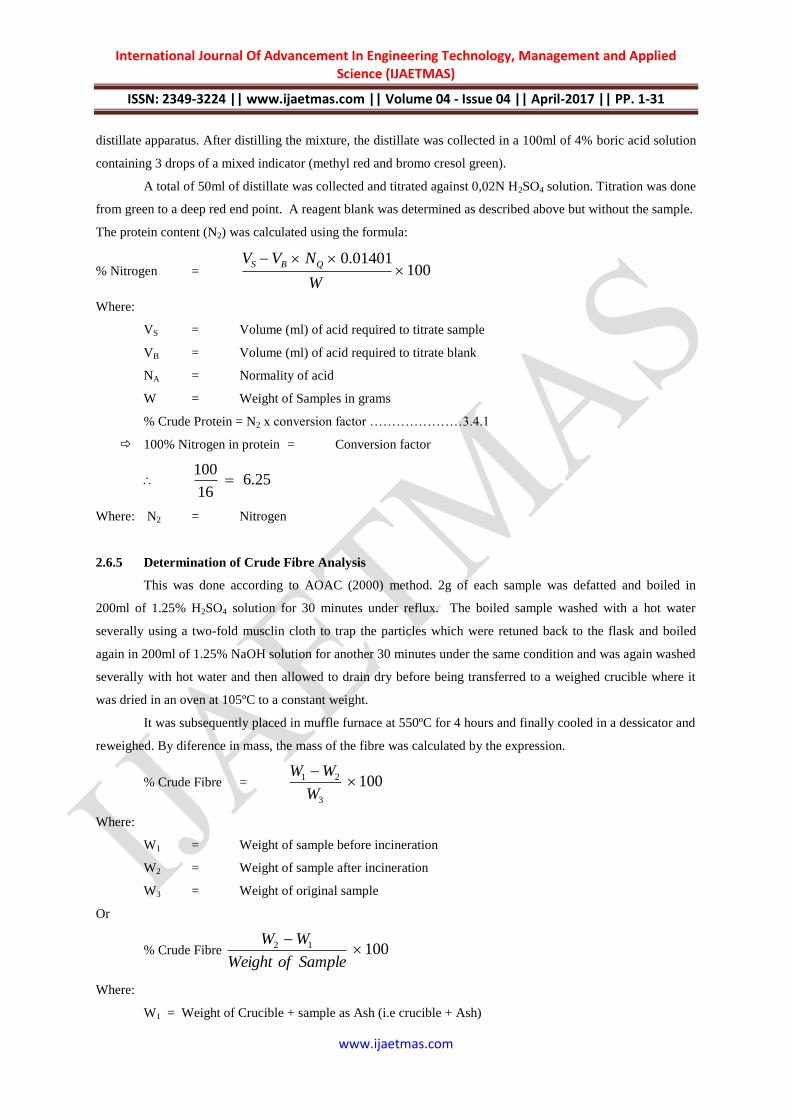
distillate apparatus. After distilling the mixture, the distillate was collected in a 100ml of 4% boric acid solution
containing 3 drops of a mixed indicator (methyl red and bromo cresol green).
A total of 50ml of distillate was collected and titrated against 0,02N H2SO4 solution. Titration was done
from green to a deep red end point. A reagent blank was determined as described above but without the sample.
The protein content (N2) was calculated using the formula:
% Nitrogen =
Where:
VS = Volume (ml) of acid required to titrate sample
VB = Volume (ml) of acid required to titrate blank
NA = Normality of acid
W = Weight of Samples in grams
% Crude Protein = N2 x conversion factor …………………3.4.1
100% Nitrogen in protein = Conversion factor
Where: N2 = Nitrogen
2.6.5 Determination of Crude Fibre Analysis
This was done according to AOAC (2000) method. 2g of each sample was defatted and boiled in
200ml of 1.25% H2SO4 solution for 30 minutes under reflux. The boiled sample washed with a hot water
severally using a two-fold musclin cloth to trap the particles which were retuned back to the flask and boiled
again in 200ml of 1.25% NaOH solution for another 30 minutes under the same condition and was again washed
severally with hot water and then allowed to drain dry before being transferred to a weighed crucible where it
was dried in an oven at 105ºC to a constant weight.
It was subsequently placed in muffle furnace at 550ºC for 4 hours and finally cooled in a dessicator and
reweighed. By diference in mass, the mass of the fibre was calculated by the expression.
% Crude Fibre =
Where:
W1 = Weight of sample before incineration
W2 = Weight of sample after incineration
W3 = Weight of original sample
Or
% Crude Fibre
Where:
W1 = Weight of Crucible + sample as Ash (i.e crucible + Ash)
10001401.0
W
NVV QBS
25.616
100
1003
21
W
WW
10012
SampleofWeight
WW
International Journal Of Advancement In Engineering Technology, Management and Applied Science (IJAETMAS)
ISSN: 2349-3224 || www.ijaetmas.com || Volume 04 - Issue 04 || April-2017 || PP. 1-31
www.ijaetmas.com
W2 = Weight of Crucible + Sample after boiling, washing & drying
2.6.6 Determination of Carbohydrate Content Analysis
The Nitrogen free method described by AOAC (2000) was used. The carbohydrate was calculated as
weight by difference between 100 and the summation of other proximate parameters as Nitrogen free extract
(NFE) percentage carbohydrate.
% Carbohydrate (NFE) = 100 - (M + P + F + A + F2)
Where
M = Moisture
P = Protein
F = Fat
A = Ash
F2 = Crude fibre
2.6.7 Determination of Caloric Value
The caloric value was calculated in kilo-calories per 100g (kcal/100g) by multiplying the crude fat,
protein and carbohydrate values by ―Atwater‖ factors of 37, 17 and 17 respectively.
2.6 Sensory Analysis
The organoleptic properties of the cookies including: Taste, Colour, Texture, Aroma and Overall
acceptability / acceptance
Were assessed by a 20 member panelists screened among staff and students, who were instructed
regarding the evaluation procedures in both written and verbal formats prior to the cookies evaluation. Each
panelist was given the cookie sample to taste and compare
Nine (9) point hedonic scale was used where 9 represented ―like extremely‖, 5 represented neither like
nor dislike and 1 represented dislike extremely.
2.7 Statistical Analysis: The sensory scores were subjected to the analysis of variance (ANOVA) using
Microsoft Excel Package 2007 and the treatment means separated using Fishers Less Significant difference
(LSD) test.
2.8 Evaluation of the Physical Properties of Cookies
2.8.1 Determination of Diameter and Weight of Cookies
The modified method according to Ayo et al., (2007) was used to determine the diameter and weight of cookie.
The weight of the baked cookies was determined by weighing each cookie unit on electronic weighing balance.
The cookie unit was randomly selected and weighed several times and the average taken. The cookie diameter
was determined by measuring each cookie unit randomly picked using a calibrated ruler, and the average taken.
2.8.2 Determination of Cookie Spread Ratio
International Journal Of Advancement In Engineering Technology, Management and Applied Science (IJAETMAS)
ISSN: 2349-3224 || www.ijaetmas.com || Volume 04 - Issue 04 || April-2017 || PP. 1-31
www.ijaetmas.com
The spread ratio was determined using the method of Giami et al., (2005).Three rows of well formed
cookies were made and the height measured. Also the same were arranged horizontally edge to edge and sum
diameter measured. The spread ratio was calculated as diameter per height (McWatters et al., 2003).
2.8.3 Determination of Thickness of Cookies
The method according to Mcwatters et al., (2003) was used. The thickness of cookies was measured by
placing six cookies on top of each other, followed by triplicate reading recorded by shiffling cookies. All the
measurements were done in three replicates of six cookies each and all the readings were divided by six to get
the value per cookie.
2.8.4 Breaking Strength
Breaking strength was determined using the method described by Okaka and Isieh (1990). A
representative sample of cookies from each formulation (of same average weight) was placed centrally between
two parallel wooden bars, with interval in between, so that the cookies can be placed balanced, objects of known
weights were then placed incrementally until the cookie fractured. The least weight that caused the breaking of
the cookie was regarded as the breaking strength of the cookie. Five representative samples were analyzed from
each formulation.
2.9 Evaluation of Microbial Stability of the Cookies
Consumers are increasingly demanding consistently high food quality, and have corresponding expectations
that such quality will be maintained at a high level during the period between purchase and consumption. These
expectations are a consequence not only of the primary requirement that the food should remain safe, but also of
the need to minimize unwanted changes in sensory quality. The quality needs are reflected in the labelling
requirements to which food manufacturers must conform. In general, microbiological changes are of primary
importance for shelf life of products, and chemical and sensory changes for medium to long life products; all the
three types of change can be important for short-to-medium life products. Shelf life is defined as the time during
which the food product remain safe, be certain to retain desired sensory, chemical, physical and microbiological
characteristics when stored under certain conditions.
2.9.1 Microbial Changes
Growth of a specific microorganism(s) during storage depends on several factors, the most important being the
initial microbial load at the time and start of storage, the physiochemical properties of the food, such as moisture
content, pH, presence of preservatives; the processing method used in the production of the food, and the
external environment of the food, such as the surrounding gas composition and storage temperature (Davis,
2014)
Pour plate method as described by Allen et al., 2004; Ray and Bhunia 2007 was used. One gram each
of the cookie sample was dissolved in 10ml of sterile peptone water and mixed thoroughly by swirling. This was
International Journal Of Advancement In Engineering Technology, Management and Applied Science (IJAETMAS)
ISSN: 2349-3224 || www.ijaetmas.com || Volume 04 - Issue 04 || April-2017 || PP. 1-31
www.ijaetmas.com
further diluted to obtain 10-2
and 10-3
concentration. Then 0.1ml dilution was transferred from each dilution
bottle into the corresponding plates and 15ml of sterile nutrient agar medium was poured and mixed thoroughly
with the inoculum by rocking the plate. The plates were incubated at 38°c for 24 hours after which the colonies
formed were counted and expressed as colony forming units per gram (cfu /g). A total viable count is achieved
when 30-300 colonies exist on a single plate (Davis, 2014).
2.9.2 Mold Count
The pour plate method as described by Goldman and Lorrence (2008) was used. The sample dilution
weighing 0.1ml was transferred from each dilution into corresponding plate and 15ml of sterile Sabourand
Dextrose Agar (SDA) medium was poured, and mixed thoroughly with the inoculum by rocking the plate. The
plates were incubated at ambient temperature for three days after which colonias formed were counted and
expressed as colony forming unit per grams (cfu/g) (Allen et al., 2004; Ray and Bhunia 2007).
3.0 Results and Discussion
3.1 Functional properties of Whole Wheat and Date Palm Pulp Flour Blends
The results of the functional properties of whole wheat – date palm pulp were presented in Table 3.1. Ezeama
(2012) defined functional properties of food as those physic –chemical properties or characteristics of food
components that determines the usefulness and success of ingredients in food systems.
3.1.1 Water Absorption Capacity
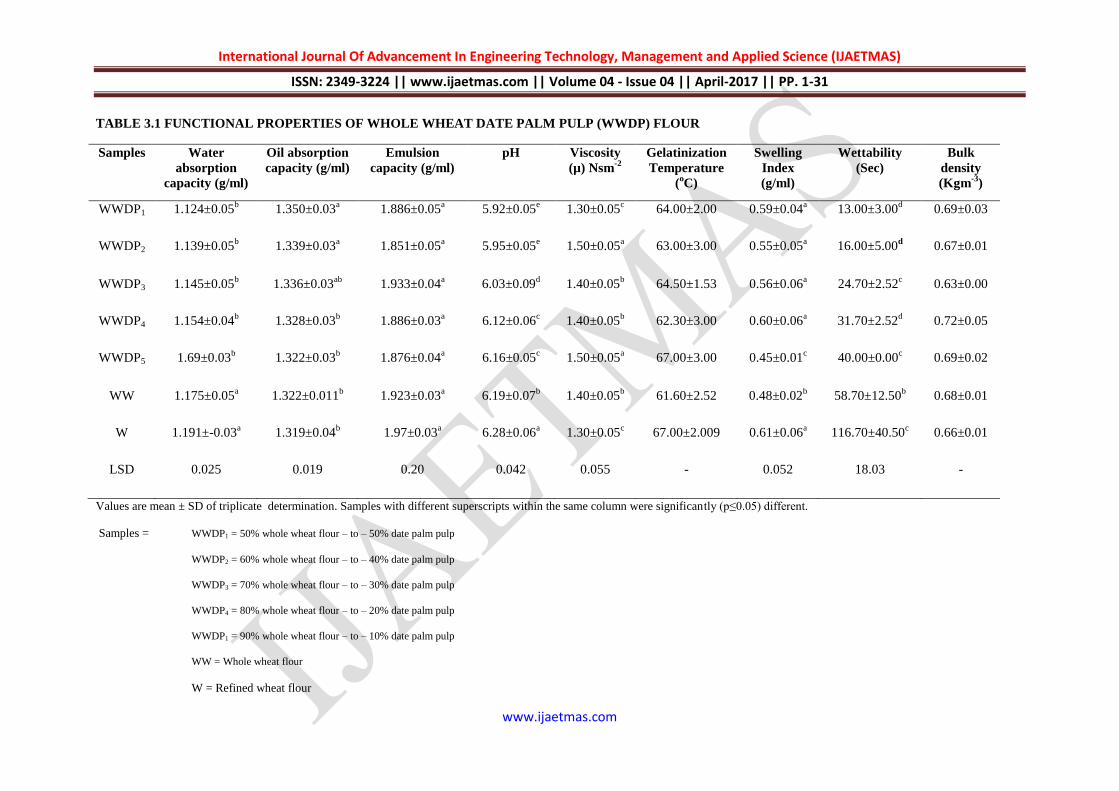
The water absorption capacity of whole wheat flour and date pulp blend ranged between 1.124g/ml to 1.91g/ml.
The water absorption capacity decreased from 1.91g/ml in refined wheat (W) to 1.124g/ml in 50% whole wheat
flour: 50% date palm pulp (WWDP1). Water absorption capacity decreased with increase in date palm pulp
substitution. The reduction in water absorption values observed and substitution with increased date palm pulp
could be due
International Journal Of Advancement In Engineering Technology, Management and Applied Science (IJAETMAS)
ISSN: 2349-3224 || www.ijaetmas.com || Volume 04 - Issue 04 || April-2017 || PP. 1-31
www.ijaetmas.com
TABLE 3.1 FUNCTIONAL PROPERTIES OF WHOLE WHEAT DATE PALM PULP (WWDP) FLOUR
Samples Water
absorption
capacity (g/ml)
Oil absorption
capacity (g/ml)
Emulsion
capacity (g/ml)
pH Viscosity
(µ) Nsm-2
Gelatinization
Temperature
(oC)
Swelling
Index
(g/ml)
Wettability
(Sec)
Bulk
density
(Kgm-3
)
WWDP1 1.124±0.05b
1.350±0.03a
1.886±0.05a
5.92±0.05e
1.30±0.05c
64.00±2.00
0.59±0.04a
13.00±3.00d
0.69±0.03
WWDP2 1.139±0.05b
1.339±0.03a
1.851±0.05a
5.95±0.05e
1.50±0.05a
63.00±3.00
0.55±0.05a
16.00±5.00d
0.67±0.01
WWDP3 1.145±0.05b
1.336±0.03ab
1.933±0.04a
6.03±0.09d
1.40±0.05b
64.50±1.53
0.56±0.06a
24.70±2.52c
0.63±0.00
WWDP4 1.154±0.04b
1.328±0.03b
1.886±0.03a
6.12±0.06c
1.40±0.05b
62.30±3.00
0.60±0.06a
31.70±2.52d
0.72±0.05
WWDP5 1.69±0.03b
1.322±0.03b
1.876±0.04a
6.16±0.05c
1.50±0.05a 67.00±3.00
0.45±0.01
c 40.00±0.00
c 0.69±0.02
WW 1.175±0.05a
1.322±0.011b
1.923±0.03a
6.19±0.07b
1.40±0.05b 61.60±2.52
0.48±0.02
b 58.70±12.50
b 0.68±0.01
W 1.191±-0.03a
1.319±0.04b
1.97±0.03a
6.28±0.06a 1.30±0.05
c 67.00±2.009
0.61±0.06
a 116.70±40.50
c 0.66±0.01
LSD 0.025 0.019 0.20 0.042 0.055 - 0.052 18.03 -
Values are mean ± SD of triplicate determination. Samples with different superscripts within the same column were significantly (p≤0.05) different.
Samples = WWDP1 = 50% whole wheat flour – to – 50% date palm pulp
WWDP2 = 60% whole wheat flour – to – 40% date palm pulp
WWDP3 = 70% whole wheat flour – to – 30% date palm pulp
WWDP4 = 80% whole wheat flour – to – 20% date palm pulp
WWDP1 = 90% whole wheat flour – to – 10% date palm pulp
WW = Whole wheat flour
W = Refined wheat flour
International Journal Of Advancement In Engineering Technology, Management and Applied Science (IJAETMAS)
ISSN: 2349-3224 || www.ijaetmas.com || Volume 04 - Issue 04 || April-2017 || PP. 1-31
www.ijaetmas.com
to the low protein content of the date palm (2.3 to 5.6% according to Abdel Moneim et al., 2012). Madu (2007)
stated that water absorption capacity enables bakers to add more water to dough and so improve handling
characteristics and maintain freshness of the baked products. Also water absorption capacity is the ability of
protein in a product to associate and retain water which increases water absorption capacity with increased
protein content (Madu, 2007). That is to say that the addition of date palm fruit to whole wheat flour increased
the sugar content and increased protein and significantly reduced the water absorption capacity of the different
flour ratios used in this work thereby making the dough handling very difficult. There were significant (P≤0.05)
differences in water absorption capacity values of the flour blends which could be attributed to the quantity of
the date palm fruit pulp in each sample.
3.1.2 Oil Absorption Capacity
The oil absorption capacity values for the samples increased from 1.319g/mlin W to 1.350g/ml in WWDP1.
This shows that the increase in substitution of date palm fruit pulp increased the oil absorption capacity of the
flours. There was no significant (P≤0.05) difference among WWDP1, WWDP2, and WWDP3 and also W, WW,
WWDP5, WWDP4, WWDP3 respectively (Table 4.1). It could be attributed that the higher the oil absorption
capacity of a flour sample, the better the cookie quality. Oil absorption capacity characteristic is required in
ground analogue, doughnut, pancakes, baked foods and soups. Absorption of oil by food products improves
mouth feel and flavor retention. Oil retention also improves the quality of cookies because oil contributes to the
soft texture of cookies (Jacob and Leelavathi, 2007).
3.1.3 Emulsion Capacity
The emulsion capacity of the samples ranged between 1.851g/ml to 1.971g/ml.. The addition of date palm pulp
had varied effects on emulsifying capacity of flour. Its effect on emulsifying capacity was highest when there
was 30% date pulp substitution in WWDP3. There was no significant (P≤0.05 ) difference between emulsion
capacity of all the flour samples(Table 4.1)
3.1.4 pH
The pH of the samples ranged from 5.91 to 6.28. The pH values decreased from 6.16 in WWDP5 to 5.92 in
WWDP1.This shows that the addition of more quantity of date palm pulp to whole wheat reduced the pH of the
flour. There were significant (P≤0.05) difference in pH of all the samples. Acidic products are more shelf stable
than non-acidic counter parts (Ikpeme et al., 2010). And all the samples were acidic and could shelf stable.
3.1.5 Viscosity
The viscosity of the samples ranged between 1.30Nsm-2
. in WWDP1 to 1.40Nsm-2
in W. There were no
significant difference in the viscosity of the following flour blends W and WWDP1, WWDP5, WWDP2 and
WW, WWDP3 and WWDP4 respectively (Table 3.1).
3.1.6 Gelatinization Temperature
International Journal Of Advancement In Engineering Technology, Management and Applied Science (IJAETMAS)
ISSN: 2349-3224 || www.ijaetmas.com || Volume 04 - Issue 04 || April-2017 || PP. 1-31
www.ijaetmas.com
The whole wheat flour had the least gelatinization temperature of (61OC) while the refined wheat flour had the
highest gelatinization temperature (67OC). Gelatinization temperature of WWDP1, WWDP2, WWDP3, WWDP4,
and WWDP5 were higher than that of whole wheat flour. This could mean that the substitution of date palm pulp
to flour increased the gelatinization temperature of the composite flours. There were no significant (P≤0.05)
differences in the gelatinization temperature of all the samples but W and WWDP5 have the similar
gelatinization temperatures (67.0OC).
3.1.7 Swelling Index
The refined wheat flour (W) had the highest swelling index value (0.61g/ml) though the whole wheat flour
(WW) had a lower swelling index value (0.48g/ml) but WWDP5 has the lowest value (0.45g/ml). There were
significant (P≤0.05) difference in the swelling index of some samples (Table 4.1). Sample W, WWDP1,
WWDP2, WWDP3, and WWDP4 were significantly (P≥0.05)similar but were significantly (P≤0.05) different
from WW and WWDP5.
3.1.8 Wettability
Wettability of the samples ranged from 13.00s in WWDP1 to 116.70s in WWDP2. The higher the incorporation
of date palm palm pulp in whole wheat flour, the lower the wettability o fthe composite flour samples. The
whole wheat flour (WW) and the refined flour (W) had higher wettability values (58.70s and116.70s) than the
substituted flours samples (Table 3.1). There were no significant (P≥0.05) difference in wettability of WWDP3,
WWDP4 and WWDP5, WWDP1, and WWDP2 respectively but there was significant (P≤0.05) difference between
these samples and the rest of the samples. Wettability values as observed in samples with high date palm pulp
proportion reduced the time for the flour to become completely wet (Mishra and Chandra, 2012).
3.1.9 Bulk Density
The bulk density of the samples was highest in WWDP5 (0.69kgm-3
) and lowest in WWDP3 (0.63kgm-3
). High
bulk density values were observed in sample incorporated with date palm fruit pulp with the exception of
WWDP3 (0.63kgm-3
). There was no significant (P≥0.05) difference in the bulk density of all the samples. Low
bulk density of flours has been reported to be useful for food formulation when used and such products have less
retrogradation and that bulk density is a measure of heaviness of a flour sample (Oladele and Aina, 2009).
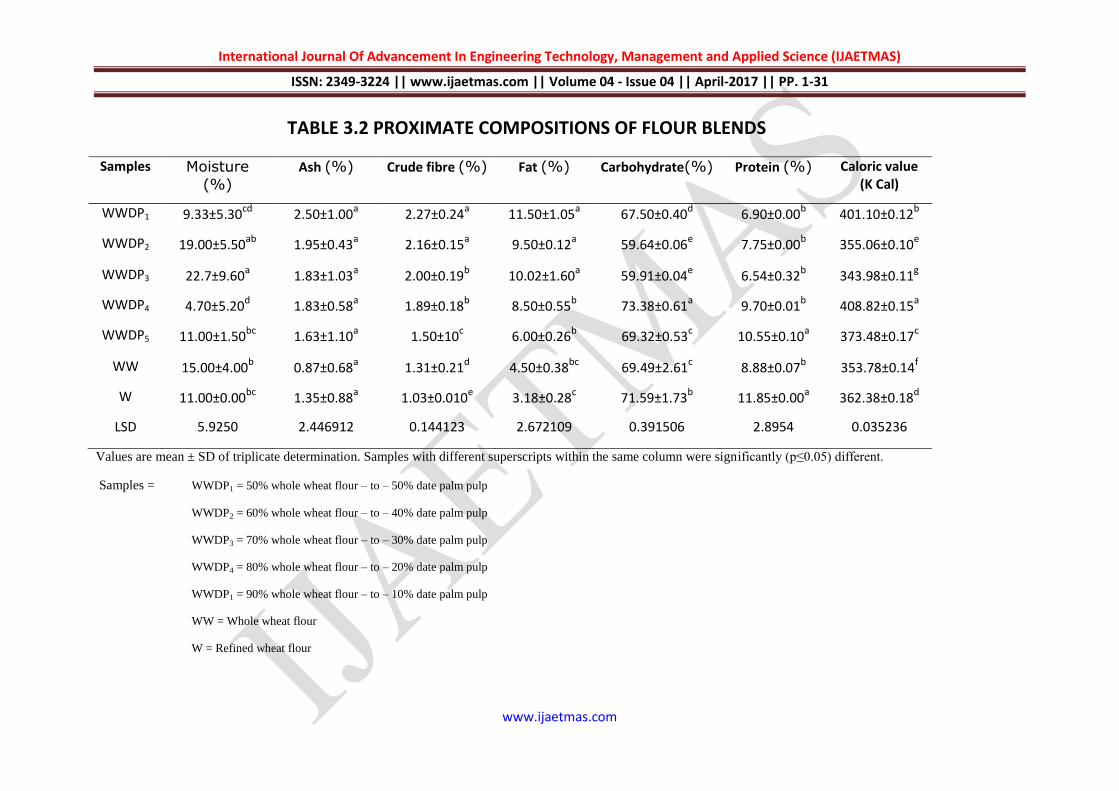
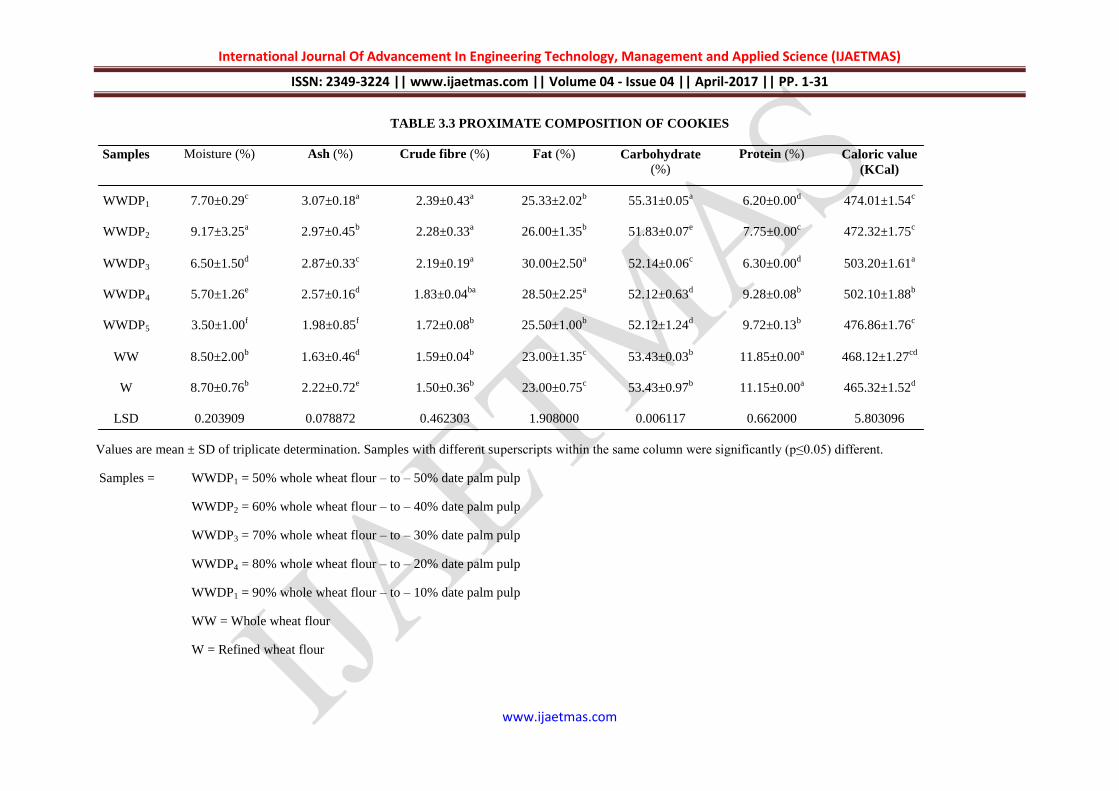
3.2 Proximate Composition of Flour Blends and Cookies
The proximate composition of flour blends and cookies are shown in Tables 3.2 and 3.3.
3.2.1 Moisture
The moisture contents of the flour blends ranged from 4.70% to 19.00%. The lowest moisture content was
from WWDP4 (4.70%) followed by WWDP1 (9.33%). Other flour samples had high moisture content (Table
3.2). There were no significant (P≥0.05) difference in WWDP2 and WWDP3; W, WW, WWDP2 and WWDP5;
W, WWDP5 and WWDP1and WWDP4 respectively. The reduction in moisture content in WWDP1 could be as a
International Journal Of Advancement In Engineering Technology, Management and Applied Science (IJAETMAS)
ISSN: 2349-3224 || www.ijaetmas.com || Volume 04 - Issue 04 || April-2017 || PP. 1-31
www.ijaetmas.com
result of a higher proportion of date palm pulp in WWDP1. This result is in line with the findings reported by
other researchers that high incorporation of date palm pulp binds water due to high sugar content, hence lower
moisture content. The moisture contents of the cookies (Table 3.3) ranged from 3.00% t 9.17%. The highest
value was observed in WWDP2 and the lowest value for WWDP5. There were significant (P≤ 0.05) difference in
the moisture contents of all the cookies made from the substituted samples. The control (W) and whole wheat
(WW) samples were significantly (P≥ 0.05) similar.
3.2.2 Ash
The ash content of the samples (Table 3.2) ranged from 0.87% to 1.95%; which shows the presence of some
minerals in the blends (Eneche, 1999). WWDP1. , WWDP2, WWDP3, WWDP4 and WWDP5 had ash content
values that were greater than those of whole of whole wheat flour(WW) and refined wheat flour (W). This
could be due to higher mineral content in date fruits. High mineral content has been reported to increase ash
content (Dada et al., 2012).
The results of ash contents of cookies (Table 3.3) ranged from 1.63% in whole wheat flour sample (WW) to
3.07% in WWDP1. The addition of date palm pulp in the recipe had increased the ash content of the cookies:
Date palm fruits according to Abdel Moneim et al., (2012) have appriciable high mineral content. The Whole
Wheat (WW) and refined wheat cookies (W) had low values (1.63% and 2.22%) of ash contents respectively.
3.2.3 Crude Fibre
The crude fibre content of the various flour blends (Table 3.2) ranged from 1.03% in (W) to 2.27% (WWDP1).
There were no significant difference(P≤ 0.05) in crude fibre content of the following.
International Journal Of Advancement In Engineering Technology, Management and Applied Science (IJAETMAS)
ISSN: 2349-3224 || www.ijaetmas.com || Volume 04 - Issue 04 || April-2017 || PP. 1-31
www.ijaetmas.com
TABLE 3.2 PROXIMATE COMPOSITIONS OF FLOUR BLENDS
Samples Moisture
(%)
Ash (%) Crude fibre (%) Fat (%) Carbohydrate(%) Protein (%) Caloric value (K Cal)
WWDP1 9.33±5.30cd 2.50±1.00
a 2.27±0.24a 11.50±1.05
a 67.50±0.40d 6.90±0.00
b 401.10±0.12b
WWDP2 19.00±5.50ab 1.95±0.43a 2.16±0.15a 9.50±0.12a 59.64±0.06e 7.75±0.00b 355.06±0.10e
WWDP3 22.7±9.60a 1.83±1.03
a 2.00±0.19b 10.02±1.60
a 59.91±0.04e 6.54±0.32
b 343.98±0.11g
WWDP4 4.70±5.20d 1.83±0.58
a 1.89±0.18b 8.50±0.55
b 73.38±0.61a 9.70±0.01
b 408.82±0.15a
WWDP5 11.00±1.50bc 1.63±1.10a 1.50±10c 6.00±0.26b 69.32±0.53c 10.55±0.10a 373.48±0.17c
WW 15.00±4.00b 0.87±0.68
a 1.31±0.21d 4.50±0.38
bc 69.49±2.61c 8.88±0.07
b 353.78±0.14f
W 11.00±0.00bc 1.35±0.88a 1.03±0.010e 3.18±0.28c 71.59±1.73b 11.85±0.00a 362.38±0.18d
LSD 5.9250 2.446912 0.144123 2.672109 0.391506 2.8954 0.035236
Values are mean ± SD of triplicate determination. Samples with different superscripts within the same column were significantly (p≤0.05) different.
Samples = WWDP1 = 50% whole wheat flour – to – 50% date palm pulp
WWDP2 = 60% whole wheat flour – to – 40% date palm pulp
WWDP3 = 70% whole wheat flour – to – 30% date palm pulp
WWDP4 = 80% whole wheat flour – to – 20% date palm pulp
WWDP1 = 90% whole wheat flour – to – 10% date palm pulp
WW = Whole wheat flour
W = Refined wheat flour
International Journal Of Advancement In Engineering Technology, Management and Applied Science (IJAETMAS)
ISSN: 2349-3224 || www.ijaetmas.com || Volume 04 - Issue 04 || April-2017 || PP. 1-31
www.ijaetmas.com
TABLE 3.3 PROXIMATE COMPOSITION OF COOKIES
Samples Moisture (%) Ash (%) Crude fibre (%) Fat (%) Carbohydrate
(%)
Protein (%) Caloric value
(KCal)
WWDP1 7.70±0.29c
3.07±0.18a
2.39±0.43a
25.33±2.02b
55.31±0.05a
6.20±0.00d
474.01±1.54c
WWDP2 9.17±3.25a
2.97±0.45b
2.28±0.33a
26.00±1.35b
51.83±0.07e
7.75±0.00c
472.32±1.75c
WWDP3 6.50±1.50d
2.87±0.33c
2.19±0.19a
30.00±2.50a
52.14±0.06c
6.30±0.00d
503.20±1.61a
WWDP4 5.70±1.26e 2.57±0.16
d 1.83±0.04
ba 28.50±2.25
a 52.12±0.63
d 9.28±0.08
b 502.10±1.88
b
WWDP5 3.50±1.00f
1.98±0.85f
1.72±0.08b
25.50±1.00b
52.12±1.24d
9.72±0.13b
476.86±1.76c
WW 8.50±2.00b
1.63±0.46d
1.59±0.04b
23.00±1.35c
53.43±0.03b
11.85±0.00a
468.12±1.27cd
W 8.70±0.76b
2.22±0.72e
1.50±0.36b
23.00±0.75c
53.43±0.97b
11.15±0.00a
465.32±1.52d
LSD 0.203909 0.078872 0.462303 1.908000 0.006117 0.662000 5.803096
Values are mean ± SD of triplicate determination. Samples with different superscripts within the same column were significantly (p≤0.05) different.
Samples = WWDP1 = 50% whole wheat flour – to – 50% date palm pulp
WWDP2 = 60% whole wheat flour – to – 40% date palm pulp
WWDP3 = 70% whole wheat flour – to – 30% date palm pulp
WWDP4 = 80% whole wheat flour – to – 20% date palm pulp
WWDP1 = 90% whole wheat flour – to – 10% date palm pulp
WW = Whole wheat flour
W = Refined wheat flour
International Journal Of Advancement In Engineering Technology, Management and Applied Science (IJAETMAS)
ISSN: 2349-3224 || www.ijaetmas.com || Volume 04 - Issue 04 || April-2017 || PP. 1-31
www.ijaetmas.com
Flour blends: WWDP1 and WWDP2 and WWDp3 and WWDP4 but they were significantly (P≤ 0.05) different
from the rest of the flour samples. Control (W) had the least crude fibre content which could be due to its
refined nature. Samples from date palm fruit composites had higher crude fiber content, which is in line with the
report by Ahmed (2005) who stated that date palm had crude fibre range of 6.4% to 11.5%.
The fibre content of the cookies ranged from 1.50% to 2.39% (Table 3.3). WWDP1 had the highest crude fibre
content. There were no significant (P≥ 0.05) in crude fiber content of WWDP1, WWDP2, WWDP3 and WWDP4;
and WWDP4, WWDP5, WW and W respectively.
Fibre aids in lowering blood cholesterol level and slows down the process of absorption of glucose, thereby
helping in keeping blood glucose level in control (Hamza et al., 2014). It also ensures smooth bowel movements
and thus helps in easy flushing out of waste products from the body, increase satiety and hence impacts some
degree of weight management (Mickelson et al., 2009). It is worthy of note in this study for its health
significance. And therefore means that the addition of date palm pulp in flour is of nutritional importance
especially to diabetic patients (Hamza et al, 2014).
3.2.4 Fat
The fat content of the blends (Table 3.2) ranged from 3.18% (W) to 11.50% (WWDP1). The percentage of fat in
the blends increased as more date palm pulp was added. Date palm fruit contains fat (0.2 – 0.5%) as stated by
Ahmed et al., (2005), and whole wheat (WW) has higher fat content than refined flour (W) hence the higher fat
content of WW and date palm fruit composites. There were significant (P≤ 0.05) differences between W and all
the composite flours.
The fat content of the cookies (Table 3.3) ranged from 23.00 in whole wheat flour (W) to 28.50% in WWDP4.
The fat contents of the cookies were observed to be high in the samples baked with date palm pulp substitution,
while the whole wheat flour (WW) and the refined flour (W) cookies had the lowest fat content. The fat
contents of W and WW were significantly (P≤ 0.05) different from all the samples containing date palm pulp.
This shows that the fortification of flour with date palm is a welcome development for the improvement of the
nutritional importance of cookies for children and other consumers within other age brackets.
3.2.5 Carbohydrate
As shown in Table 3.2, there were significant (P≤ 0.05) difference in all the carbohydrate contents of the flour
samples. The carbohydrate content in the blends ranged from 59.64% (WWDP3) to 73.38% (WWDP4). The
carbohydrate contents in al the blends were above 59%. The refined wheat flour (W) and the whole wheat flour
(WW) had higher carbohydrate contents than the substituted blends.
The carbohydrate contents of the cookies were generally high, and ranged from 51.83% (WWDP2) to 53.43%
(W) (Table 3.3) . Unlike crude fiber values, fat values and ash values, the highest value of carbohydrate
content was observed in refined wheat flour (W) and whole wheat flour (WW). The unsubstituted cookies were
made with sugar addition (as in normal recipe) which could be the reason for the high carbohydrate. Despite the
International Journal Of Advancement In Engineering Technology, Management and Applied Science (IJAETMAS)
ISSN: 2349-3224 || www.ijaetmas.com || Volume 04 - Issue 04 || April-2017 || PP. 1-31
www.ijaetmas.com
fact that the differences in the carbohydrate contents among the cookies samples were significant, the
percentage of carbohydrate was generally high in the various cookies that were contained with date palm.
3.2.6 Protein Content
The protein contents of the flour samples (Table 3.2) ranged from 6.54% to 11.85%. No significant (p≥0.05)
differences was observed among the following samples W and WWDP5;and WWDP1, WWDP2, WWDP3,
WWDP4 and WW respectively. Protein content was highest for (W) and lowest for WWDP3. The high protein
content in (W) could be because of its high gluten content. The reduction in protein content in flour blends and
whole wheat could be due to its high fibre content which could have a diluting effect on the protein content of
the flours. According to Adbel Monein (2012), date palm fruit has lower protein content (2.3-5.6%).
The protein contents of the cookies (Table 3.3) ranged from 6.20% to 11.15%. There were significant(P≤0.05)
difference among the samples. It is also worthy of note that the highest protein content was recorded in refined
wheat flour (W) and whole wheat flour (WW) which means that substitution reduced the protein content of the
samples. The lowest value (6.20%) was observed in WWDP1 .
3.2.7 Calorific Value
The calorific value for the samples (Table 3.2) ranged from 343.98KCal (WWDP3) to 408.82KCal (WWDP2).
The observed high calorific value in flour with date palm fruit pulp could be due to the fact that date palm fruit
contains sugar like fructose and dextrose (Dada et al., 2002).
The calorific values for the cookie samples ranged from 465.32kCal in (W) (whole wheat flour) to 503.20kCal
in WWDP3 (Table 3.3). The lowest calorific values were obtained from W and WW. The cookies containing
date palm fruit had higher calorific values as also stated above by Dada et al., (2002). The calorific values were
significantly (P≤0.05) different for all the cookies.
3.3 Organoleptic Properties of Cookies
The organoleptic properties of the cookies produced from the flour blends are shown in Table 3.4 .
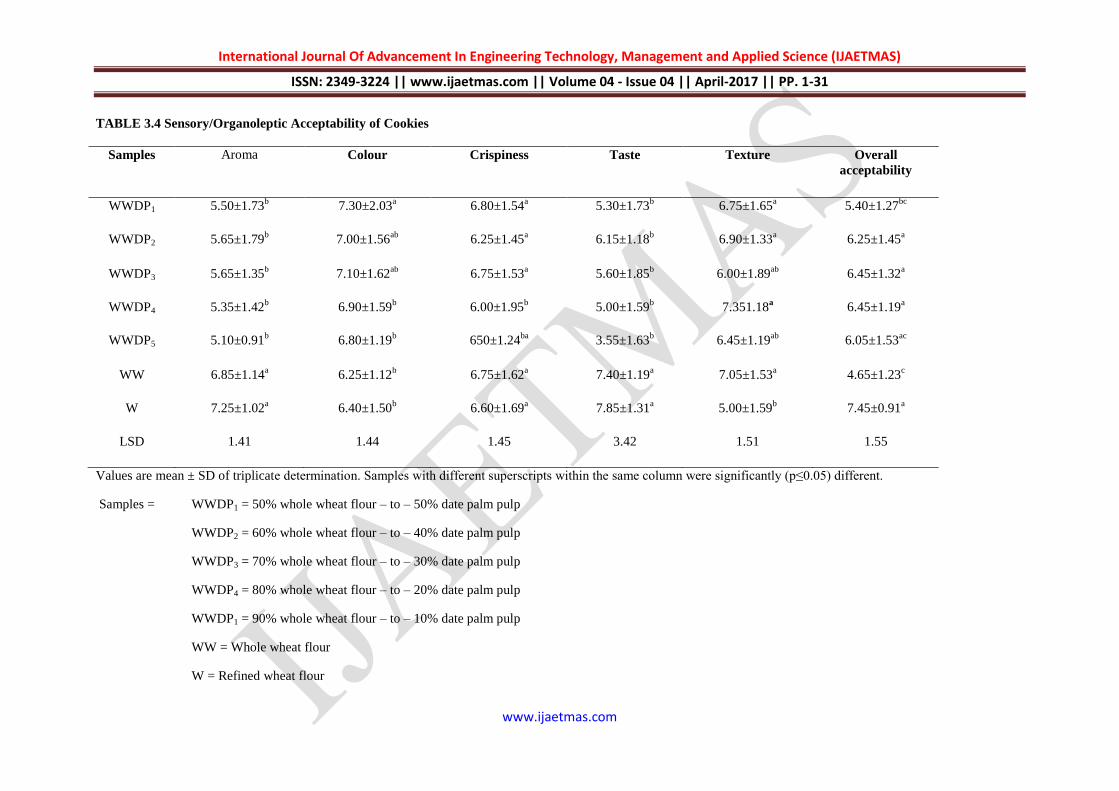
3.3.1 Aroma
The aroma of the cookies ranged from 5.10 to 7.25, that is the sample were neither liked nor disliked (score
approximately 5.0) or moderately liked ( score approximately 7.0). The results obtained showed that addition of
higher proportion increased the aroma. There was no significant (P≤0.05) difference in the aroma of the
composite samples but there was significant (P≤0.05) difference between the aroma of the composite samples
and the controls (WW and W). Based on Hedonic Scale the aroma value for the composite samples showed that
the consumers neither liked nor disliked the cookies produced from date palm pulp. This is likely because, the
cookie is a new product that the consumers were not used to. (Iwe, 2002).
3.3.2 Colour
International Journal Of Advancement In Engineering Technology, Management and Applied Science (IJAETMAS)
ISSN: 2349-3224 || www.ijaetmas.com || Volume 04 - Issue 04 || April-2017 || PP. 1-31
www.ijaetmas.com
The values of the colour of the cookies ranged from 6.25 (score approximately 6.0 – slightly liked) to 7.30
(score approximately 7.0 – moderately liked). The addition of higher date palm pulp in the Flour blends:
WWDP1 and WWDP2 and WWDp3 and WWDP4 but they were significantly (P≤ 0.05) different from the rest of
the flour samples. Control (W) had the least crude fibre content which could be due to its refined nature. Recipe
made the colour more acceptable by the panelists. Colour of cookies produced from date palm pulp substitution
were darker and more preferred by the panelists because they were all moderately liked (score approximately
7.0).The darker the colour of this cookies could be due to high carbohydrate content of date palm pulp (44% to
88%) which reacted with heat during baking, hence the cookies were more acceptable. Colour attribute is a
major criterion that affects the quality of the baked products. Colour is a very important parameter in judging
properly baked cookies that not only reflect the suitable raw materials used for the preparation but also provides
information about the formulation and quality of the product (Ikpeme et al., 2010).
3.3.3 Crispiness
The crispiness of the cookies were slightly liked to moderately liked. There was significant (P≤0.05) difference
in crispiness of all the cookie samples. The refined flour and the whole wheat flour (WW) were rated higher in
crispiness. The addition of date palm fruit to the recipe used in the production of cookies had varying effect on
the crispiness of the samples. The crispiness of WWDP1 was moderately liked (Score approximately 7.0) which
was rated best. Crispiness is a desired characteristic that makes customers subscribe to purchasing any cookie
(Lusas and Rooney 2001).
3.3.4 Taste
Significant (P≤0.05) differences were observed in the taste of cookies produced from date palm pulp substituted
samples and those of non –substituted samples (W and WW). Sample W was the best in terms of taste (very
much liked score approximately 8.0) and was significantly similar to WW samples (moderately liked).
International Journal Of Advancement In Engineering Technology, Management and Applied Science (IJAETMAS)
ISSN: 2349-3224 || www.ijaetmas.com || Volume 04 - Issue 04 || April-2017 || PP. 1-31
www.ijaetmas.com
TABLE 3.4 Sensory/Organoleptic Acceptability of Cookies
Samples Aroma Colour Crispiness Taste Texture Overall
acceptability
WWDP1 5.50±1.73b
7.30±2.03a
6.80±1.54a
5.30±1.73b
6.75±1.65a
5.40±1.27bc
WWDP2 5.65±1.79b
7.00±1.56ab
6.25±1.45a
6.15±1.18b
6.90±1.33a
6.25±1.45a
WWDP3 5.65±1.35b
7.10±1.62ab
6.75±1.53a
5.60±1.85b
6.00±1.89ab
6.45±1.32a
WWDP4 5.35±1.42b
6.90±1.59b
6.00±1.95b
5.00±1.59b
7.351.18a
6.45±1.19a
WWDP5 5.10±0.91b
6.80±1.19b
650±1.24ba
3.55±1.63b
6.45±1.19ab
6.05±1.53ac
WW 6.85±1.14a
6.25±1.12b
6.75±1.62a
7.40±1.19a
7.05±1.53a
4.65±1.23c
W 7.25±1.02a
6.40±1.50b
6.60±1.69a
7.85±1.31a
5.00±1.59b
7.45±0.91a
LSD 1.41 1.44 1.45 3.42 1.51 1.55
Values are mean ± SD of triplicate determination. Samples with different superscripts within the same column were significantly (p≤0.05) different.
Samples = WWDP1 = 50% whole wheat flour – to – 50% date palm pulp
WWDP2 = 60% whole wheat flour – to – 40% date palm pulp
WWDP3 = 70% whole wheat flour – to – 30% date palm pulp
WWDP4 = 80% whole wheat flour – to – 20% date palm pulp
WWDP1 = 90% whole wheat flour – to – 10% date palm pulp
WW = Whole wheat flour
W = Refined wheat flour
International Journal Of Advancement In Engineering Technology, Management and Applied Science (IJAETMAS)
ISSN: 2349-3224 || www.ijaetmas.com || Volume 04 - Issue 04 || April-2017 || PP. 1-31
www.ijaetmas.com
Samples produced from date palm pulp substitution were slightly liked (score approximately 6.0), neither liked
nor disliked (score approximately 5.0) and disliked slightly (score approximately 4.0) for WWDP5 (Table 3.4).
The lower rating for WWDP5 could be due to lower percentage date palm pulp which was used to sweeten the
cookies.
3.3.5 Texture
The texture of the cookies ranged from 5.00 (Neither liked nor disliked in the refined wheat flour (W) to 7.35
(moderately liked score approximately 7.0) in WWDP4. There was no significant (P≤0.05) difference between
the texture of sample WW and all the samples containing date palm pulp which were either moderately liked or
slightly liked according to the panelists.
3.3.6 General Acceptability
The general acceptability of all the cookies were rated neither liked nor disliked (score approximately 5.0) to
very much liked (score approximately 8.0). WWDP5 was rated lowest while W (which was the control) was the
highest. The general acceptability of the composite cookies ranged from neither liked nor disliked to slightly
liked. WWDP3 and WWDP4 were highly acceptable by panelists as they were moderately liked. Hence,
substitution of date palm pulp in cookies formulation should not be less than 20% and not more than 40%
respectively.
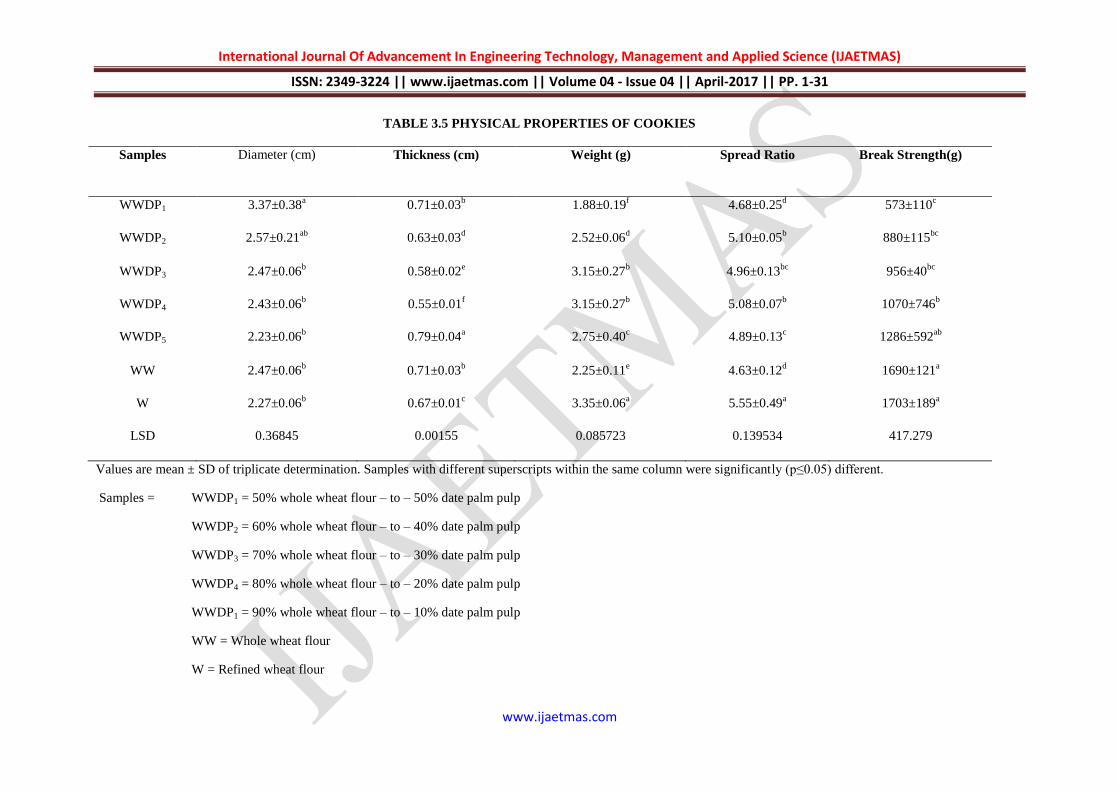
3. 4 Physical Properties of Cookies
3.4.1 Diameter
The diameter of the cookies ranged between 2.70cm to 3.37cm. The diameter of WWDP1 and WWDP2; and
WWDP2, WWDP3, WWDP5, WW and W samples were significantly (P≥0.05) similar. The diameter of cookies
obtained from the date palm pulp incorporation decreased from 3.37cm in WWDP1 to 2.23cm in WWDP5 with
decrease in percentage of date palm fruit in the recipe. Hence, the addition of date palm pulp in the recipe for
production of cookies affected the diameter of the cookies.
3.4.2 Thickness
The cookies thickness ranged from 0.55cm to 0.79cm. WWDP5 has the highest thickness and the least thickness
was recorded in WWDP4. The less thin the cookies the lesser its ability to withstand stress.
3.4.3 Weight
The weight of the cookies samples ranged between 1.88g to 3.35g. The 100% refined wheat flour (W) was
heaviest and bulkiest among the samples. This could be because the 100% wheat flour had more gluten which is
responsible for increased dough development and elasticity (Badifu, et al., 2005). The whole wheat (W) and
International Journal Of Advancement In Engineering Technology, Management and Applied Science (IJAETMAS)
ISSN: 2349-3224 || www.ijaetmas.com || Volume 04 - Issue 04 || April-2017 || PP. 1-31
www.ijaetmas.com
composite cookies had lower weights (approximately 2.0g – 3.0g). There was significant (P≤0.05) difference in
weights of all the samples with the exception of WWDP3 and WWDP4 which are similar.
3.4.4 Spread Ratio
The spread ratio was lowest (4.63) for whole wheat (WW) and highest (5.55) for refined wheat flour (W). The
spread ratio of some of the samples was significantly (P≤0.05) different (Table 3.5). Samples WWDP1 and WW;
WWDP2, WWDP3 and WWDP4 were significantly (P≥0.05) similar. Cookie spread represents a ratio of diameter
to thickness. Thus sugar affects diameter (sugar dissolution) and thickness (inhibiting gluten development).
Cookies having higher spread ratio are considered most desirable (Handa et al., 2012). Also, larger cookie
diameter and higher spread ratio are considered as the desirable quality attributes. Spread ratios of cookies
prepared with date palm fruit increased.
3.4.5 Break Strength
Control (W) samples had the highest break strength (1703g) followed by WW which had 1690g. The higher the
percentage of date palm in the cookies the lower the break strength. The various break strength values for
different samples were significantly (P≤0.05) different. Greater breaking strength indicates greater hardness of
cookies structure (Anis et al., 2014). Hardness of cookies is one of the major indices in the assessment of
cookies quality (Yee et al., 2014).
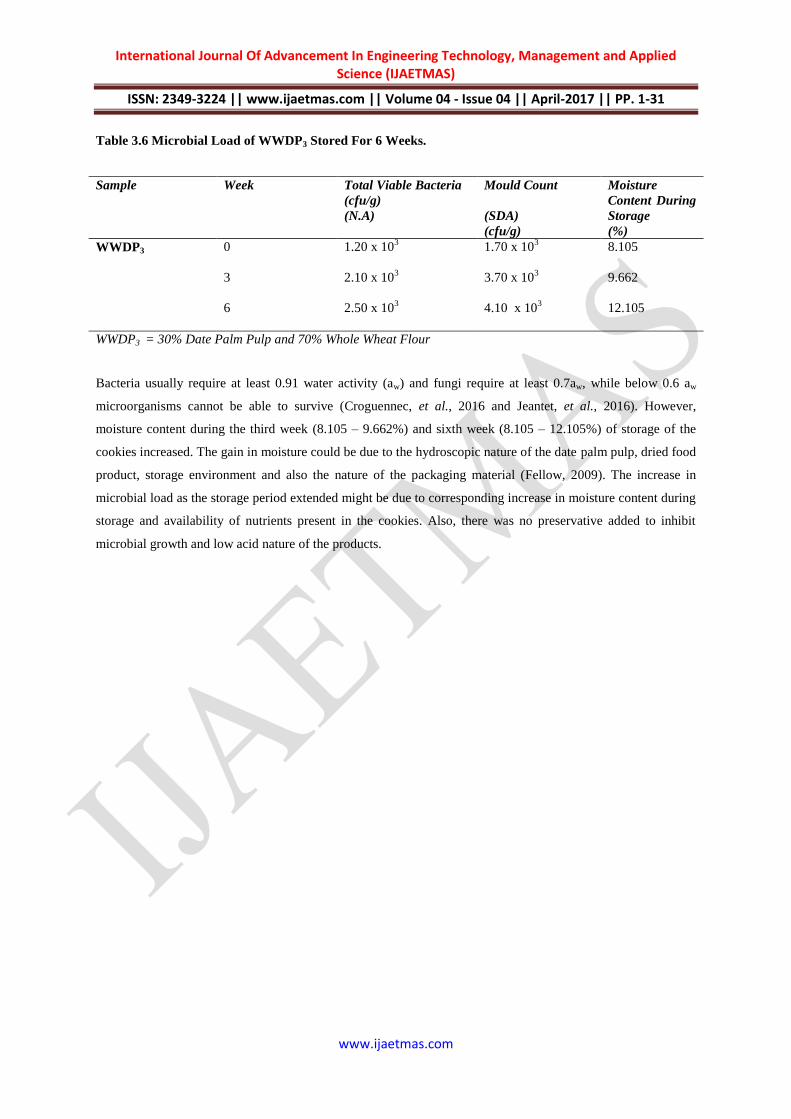
3.5 Shelf Stability of the Most Accepted Composite Cookie WWDP3 (70% Whole Wheat Flour: 30% Date
Palm Pulp)
Total microbial count reflects the condition in which the food was produced, stored or abused by handling and
can be used to predict the shelf life or keeping quality of the product. The spoilage of many foods may be due to
the total viable counts reached which is from 10 – 10 X 106 cfu/g in the product (Ray and Bhunia 2007).
The microbial load on Nutrient Agar (N.A) and Sabroud dextrose agar (SDA) were 1.20 X 10³cfu/g and 1.70 X
103 cfu/g respectively for the first day of the production of the cookies (Week 0), 2.10 X 10
3 cfu/g and 3.70 X
103 cfu/g respectively for the third week after the production of the cookies (Week 3) and 2.50 X 10
3 and 4.10 X
103 respectively for the sixth week after the production of the cookies. It was reported that the maximum
bacteria (aerobic) plate count for cookies is 5.30 X 10⁴ cfu/g and, 5.0 X 10
3cfu/g for mould counts (Allen et al.,
2004; Ray and Bhunia 2007). The results obtained for the various storage periods of the cookies especially after
six weeks was lower than the range recorded by Ray and Bhunia (2007). This implied that the cookies could be
stored for as a longer period if well stored.
International Journal Of Advancement In Engineering Technology, Management and Applied Science (IJAETMAS)
ISSN: 2349-3224 || www.ijaetmas.com || Volume 04 - Issue 04 || April-2017 || PP. 1-31
www.ijaetmas.com
Table 3.6 Microbial Load of WWDP3 Stored For 6 Weeks.
Sample Week Total Viable Bacteria
(cfu/g)
(N.A)
Mould Count
(SDA)
(cfu/g)
Moisture
Content During
Storage
(%)
WWDP3 0 1.20 x 10³
1.70 x 10³
8.105
3 2.10 x 10³
3.70 x 10³
9.662
6 2.50 x 10³
4.10 x 10³
12.105
WWDP3 = 30% Date Palm Pulp and 70% Whole Wheat Flour
Bacteria usually require at least 0.91 water activity (aw) and fungi require at least 0.7aw, while below 0.6 aw
microorganisms cannot be able to survive (Croguennec, et al., 2016 and Jeantet, et al., 2016). However,
moisture content during the third week (8.105 – 9.662%) and sixth week (8.105 – 12.105%) of storage of the
cookies increased. The gain in moisture could be due to the hydroscopic nature of the date palm pulp, dried food
product, storage environment and also the nature of the packaging material (Fellow, 2009). The increase in
microbial load as the storage period extended might be due to corresponding increase in moisture content during
storage and availability of nutrients present in the cookies. Also, there was no preservative added to inhibit
microbial growth and low acid nature of the products.
International Journal Of Advancement In Engineering Technology, Management and Applied Science (IJAETMAS)
ISSN: 2349-3224 || www.ijaetmas.com || Volume 04 - Issue 04 || April-2017 || PP. 1-31
www.ijaetmas.com
TABLE 3.5 PHYSICAL PROPERTIES OF COOKIES
Samples Diameter (cm) Thickness (cm) Weight (g) Spread Ratio Break Strength(g)
WWDP1 3.37±0.38a
0.71±0.03b
1.88±0.19f
4.68±0.25d
573±110c
WWDP2 2.57±0.21ab
0.63±0.03d
2.52±0.06d
5.10±0.05b
880±115bc
WWDP3 2.47±0.06b
0.58±0.02e
3.15±0.27b
4.96±0.13bc
956±40bc
WWDP4 2.43±0.06b
0.55±0.01f
3.15±0.27b
5.08±0.07b
1070±746b
WWDP5 2.23±0.06b
0.79±0.04a
2.75±0.40c
4.89±0.13c
1286±592ab
WW 2.47±0.06b
0.71±0.03b
2.25±0.11e
4.63±0.12d
1690±121a
W 2.27±0.06b
0.67±0.01c
3.35±0.06a
5.55±0.49a
1703±189a
LSD 0.36845 0.00155 0.085723 0.139534 417.279
Values are mean ± SD of triplicate determination. Samples with different superscripts within the same column were significantly (p≤0.05) different.
Samples = WWDP1 = 50% whole wheat flour – to – 50% date palm pulp
WWDP2 = 60% whole wheat flour – to – 40% date palm pulp
WWDP3 = 70% whole wheat flour – to – 30% date palm pulp
WWDP4 = 80% whole wheat flour – to – 20% date palm pulp
WWDP1 = 90% whole wheat flour – to – 10% date palm pulp
WW = Whole wheat flour
W = Refined wheat flour
International Journal Of Advancement In Engineering Technology, Management and Applied Science (IJAETMAS)
ISSN: 2349-3224 || www.ijaetmas.com || Volume 04 - Issue 04 || April-2017 || PP. 1-31
www.ijaetmas.com
4.0 Conclusion
The use of date palm fruit pulp as sugar substitute in cookie production improved the properties of the flours
such as swelling index, oil absorption capacity, pH, viscosity as they were comparable to the control (refined
wheat flour W). There were no significant difference in emulsion capacity, gelatinous temperature and bulk
density of all the flour samples. The proximate composition of the samples generally increased with increase in
incorporation of date palm pulp with the exception of carbohydrate and protein. The proximate composition of
cookies increased with increase in percentage palm pulp in the cookies and the samples were comparable to the
control (W) except in protein content where the control was very high. The physical properties of cookies
produced from composite were comparable to the control with the exception of break strength which decreased
with increase in date palm pulp incorporation. The organoleptic characteristics of WWDP3 was rated overall
best in all the parameters tested. The incorporation of date palm pulp in cookies should not be less than 30%.
Cookies samples stored for six (6) weeks had microbial loads less than the maximum count recommended in
literature. This has shown that date palm fruit could be used for substitution of sugar in production of quality
cookies and also as sweetener in other bakery products. I recommend that further work be undertaken to
improve the protein content of cookies made with wheat and date palm fruit composite flours.
REFERENCES
Abdel Moneim E. Sulieman, Itimad A. Abd Elhafise and Awad M. Abdelrahim (2012): comparative study of
five sudanose Date (Phoenix dactylifera L) fruit cultivars. Food and Nutrition Sciences (3) 1245-1251
Ahmed D, Agunbiade, S.O. and Ojezele, M.O. (2005). Quality Evaluation of Instant Breakfast Cereals
Fabricated from Maize Sorghum Soybean and African Yam Bean (Sphenostylis stenocarpa). World
Journal of Dairy and Food Science, 5(1): 67-72.
Ajibola F.C, Oyerinde O.V. and Adeniyan S. O. (2015). Physicochemical and antioxidant properties of whole
wheat biscuits incorporated with Moringa oleifera leaves and cocoa powder.Journal of scientific
research and report 7(3)195 - 206
Al-daihan S, Bhat R.S (2012).Antibacterial activities of extracts of leaf, seed and bark of Phoenix
dactylifera.Afr. J. Biotechol. 11(42):10021-10025.
Allen, M. J., Edberg, S. C., & Reasoner, D. J. (2004). Heterotrophic plate count bacteria—what is their
significance in drinking water?. International journal of food microbiology, 92(3), 265-274.
Anis Jauharah, M.; Wan Rosli. W.I and Daniel Robert, S. (2014). Physicochemical and Sensorial Evaluation of
Biscuit and Muffin Incorporated with Young corn powder. Sains Malaysiana 43(1): 45-52
AOAC (Association of Official Analytical Chemists) (2006). Official Methods of Analysis. 15th
edition.
(Gaithersborg.s.edn). AOAC press, Washington DC, USA.. pp. 78-90.
International Journal Of Advancement In Engineering Technology, Management and Applied Science (IJAETMAS)
ISSN: 2349-3224 || www.ijaetmas.com || Volume 04 - Issue 04 || April-2017 || PP. 1-31
www.ijaetmas.com
Ayo G.O;Ameh U.E;Alifah,O.N and Babatunde R.M (2007) Proximate compositions of biscuits produced from
wheat flour and maize bran composite flour fortified with carrot extract.Journal of Nutrition and food
sciences.5:395.
Badifu G.I.O; Chima C.E; Ajayi Y.I. and Ogori A. F. (2005). Influence of mango mesocarp flour supplement to
micronutrient, physical and organoleptic qualities of wheat-based bread. Nig. Food J. 23: 59 - 68.
Croguennec, T., Brule, G., and Schuck, P. (2016). Handbook of Food Science and Technology 1: Food
Alteration and Food Quality (Vol. 1). John Wiley & Sons.
Dada, M, Nwawe, C.N, Okere, R.A and Uwubanmwen, I.O (2012) Potentials of Date Palm Tree to the Nigerian
Economy. World Journal of Agricultural Sciences 8(3): 309-315.
Davis, C. (2014). Enumeration of probiotic strains: review of culture-dependent and alternative techniques to
quantify viable bacteria. Journal of microbiological methods, 103, 9-17.
Eneche, E.H. (2009). Biscuit-Making Potential of Millet/Pigeon Pea Flour Blends. Plant Foods for Human
Nutrition. Kluwer Academic Publishers Netherlands 54: 21-27.
Erleen Tilton, (2011).www.livingahealthylifestyle.com accessed 5th April,2016.posted on Tues 28 June,2011.
Ezeama J. (2012) Effects of Processing on Physical and Functional Properties of Groundnut (Arachis hypogea)
Flour. Electronic Journal of Environmental, Agricultural and Food Chemistry, 5(4): 1457-1491.
Farheena I., Avanish K. and Uzma A. (2015), Development and Quality Evaluation of Cookies Fortified With
Date Paste (Phoenix dactylifera L). international Journal of Science and Technology 3(4).
Fellows, P. J. (2009). Food processing technology: principles and practice. Elsevier.
Giami, S. Y., Achinewhu, S. C., & Ibaakee, C. (2005). The quality and sensory attributes of cookies
supplemented with fluted pumpkin (Telfairia occidentalis Hook) seed flour. International journal of
food science & technology, 40(6), 613-620.
.
Giwa, E.O. and Ikujenlola, A.V. (2010). Quality Characteristics of Biscuits Produced From Composite Flour of
Wheat and Quality Protein Maize. African Journal of Food Science and Technology, 1(5) 116-119.
Hamza, A.M, Agho Collins, Ado, S.G, Ikuenobe, C.E, Ataga, C.D and Odewal, J.O (2014). International
Journal of Plant and Soil Science. 3(3): 248-259.
Hanan, M.A, Al-Sayed (2013). Quality characteristics of cuntaloope seed on and cookies substituted with
ground foll fat and defatted seeds. Journal of Applied Science Research 9(1): 435-443.
Handa, C, Goomer and Siddhu, A, (2012). Physicochemical properties and sensory evaluation of
froctoligosaccharide enriched cookies. J. Food Sci. Tech, 49: 192-200.
International Journal Of Advancement In Engineering Technology, Management and Applied Science (IJAETMAS)
ISSN: 2349-3224 || www.ijaetmas.com || Volume 04 - Issue 04 || April-2017 || PP. 1-31
www.ijaetmas.com
Ikpeme C.A., Osuchukwu, N.C. and Oshieel L (2010). Functional and Sensory Properties of Wheat (Aestium
triticium) and Taro Flour (Colocasia esculenta) Composite Bread. African Journal of Food Science 4:
(5) 248-253.
Iwe, M.O. (2002). Handbook of Sensory Methods and Analysis. PROJOINT Communications Services Ltd,
Enugu, pp. 70-72.
Jacob, J., & Leelavathi, K. (2007). Effect of fat-type on cookie dough and cookie quality. Journal of food
Engineering, 79(1), 299-305.
Jeantet, R., Croguennec, T., Schuck, P., and Brulé, G. (Eds.). (2016). Handbook of Food Science and
Technology 1: Food Alteration and Food Quality. John Wiley & Sons.
Kulkarni, S.G: Vijayanand, P: Aksha, M: Reena, P and Ramana K.V.R (2008) Effect of dehydration on the
quality and storage stability of immature dates (Phoenix dactylifera). Food science Technology,
41:278-283.
Lilei Yu, Anne - Laure Nanguet and Trust Beta, (2013).Comparison of Antioxidant properties of refined and
whole wheat flour and bread.Antioxidants;2:370 - 383. www.mdpi.com/journal/antioxidants.
Lusas, E. W. and Rooney, L. W. (Eds.). (2001). Snack foods processing. CRC Press.
Madu H. (2007) Chemical Composition, Properties and Baking Potentials of African Breadfruit Kernel and
Wheat Flour Blends. Inernational Journal of Food Science and Technology, 39: 223-229.
Matthew J.T;Ndamitso ,M.M;Shaba,E.Y; Mohammed, S.S; Salihu,A.B; Abu,Y(2015).Determination of the
nutritive and anti-nutritive values of Pelophylax esculentus(Edible frog) found in Hanyan Gwari,
Minna Niger state, Nigeria.Adv.Red.4(6):412-420
McWatters, K. H., Ouedraogo, J. B., Resurreccion, A. V., Hung, Y. C., & Phillips, R. D. (2003). Physical and
sensory characteristics of sugar cookies containing mixtures of wheat, fonio (Digitaria exilis) and
cowpea (Vigna unguiculata) flours. International journal of food science & technology, 38(4), 403-
410.
Mishra, N. & Chandra, R. (2012). Development of functional biscuit from soy flour & rice bran. International
Journal of Agricultural and Food Science 2: 14-20.
Nwosu, J.N, (2013). ―Production and Evaluation of biscuits from blends of Bambara Groundnut and Wheat
Flour‖ International Journal of Food and Nutrition Science 2:
Okaka, J. C., & Isieh, M. I. (1990). Development and quality evaluation of cowpea-wheat biscuits. Nigerian
Food Journal, 8, 56-62.
International Journal Of Advancement In Engineering Technology, Management and Applied Science (IJAETMAS)
ISSN: 2349-3224 || www.ijaetmas.com || Volume 04 - Issue 04 || April-2017 || PP. 1-31
www.ijaetmas.com
Oladele, A.K. and Aina J.O. (2009) Chemical Composition and properties of flour produced from two varieties
of tigernut (Cyperns esculentus). African Journal of Biotechnology, 6 (1): 2473-2476.
Olaoye , O.A; Onilude, A .A and Idowu O. A. (2007) Quality characteristics of bread produced from composite
flour of wheat, Plantain and Soybean. African. J.Biotechnol.5:1102-1106
Ray, B., & Bhunia, A. (2007). Fundamental food microbiology. CRC press.
Sivasankar, B. (2002). Soft wheat products and processes. Practice hall of India Pvt.ltd. New Delhi.
Ukpabi, U.J. and Ndimele, C. (2000). Evaluation of the quality of Garri produced in Imo State Nigeria, Nig Fd
J. 8, 105-110
Yee, S.C. & Noraziah, A.A. 2009. Chemical and physical properties of muffin prepared from different levels of
mango (Mangifera indica) variety chokanan pulp flour. Working Paper. Malaysia: Universiti Sains
Malaysia.