Embed Size (px)
Citation preview
15
ANNUAL REPORT 2012
Production andEmployment
In 2012 the Peruvian economy grew 6.3 percent. This growth rate, which is lower than the one registered in 2011 (6.9 percent), but consistent with the economy’s potential long-term rate of growth (around 6.5 percent), is mainly explained by the dynamism of domestic demand, which grew 7.4 percent, and particularly by the dynamism of public investment and private investment (which grew 13.6 percent and 20.8 percent, respectively). In a context of international uncertainty, this was partially offset by lower net exports.
A deceleration of growth was observed in both the primary and non-primary sectors. The primary GDP grew 1.7 percent (versus 4.8 percent in 2011), while the non-primary GDP grew 7.1 percent (versus 7.2 percent the previous year). In the case of the former, the lower rate of growth is explained mainly by the decline of activity in the fishing sector, while in the case of the latter the lower rate of growth is explained by a slowdown of activity in all the sectors, with the exception of construction. It is worth pointing out that much of the decline registered in non-primary manufacturing is explained by the drop of textile production for the external market.
Moreover, in 2012 per capita production registered a growth rate of 5.1 percent.
GRAPH 1REAL GROSS DOMESTIC PRODUCT PER CAPITA
(Index 1960 = 100)
Source: INEI and BCRP.
0
50
100
150
200
250
1923
19
25
1927
19
29
1931
19
33
1935
19
37
1939
19
41
1943
19
45
1947
19
49
1951
19
53
1955
19
57
1959
19
61
1963
19
65
1967
19
69
1971
19
73
1975
19
77
1979
19
81
1983
19
85
1987
19
89
1991
19
93
1995
19
97
1999
20
01
2003
20
05
2007
20
09
2011
20
12
I.
16
CENTRAL RESERVE BANK OF PERU
1. Domestic Demand
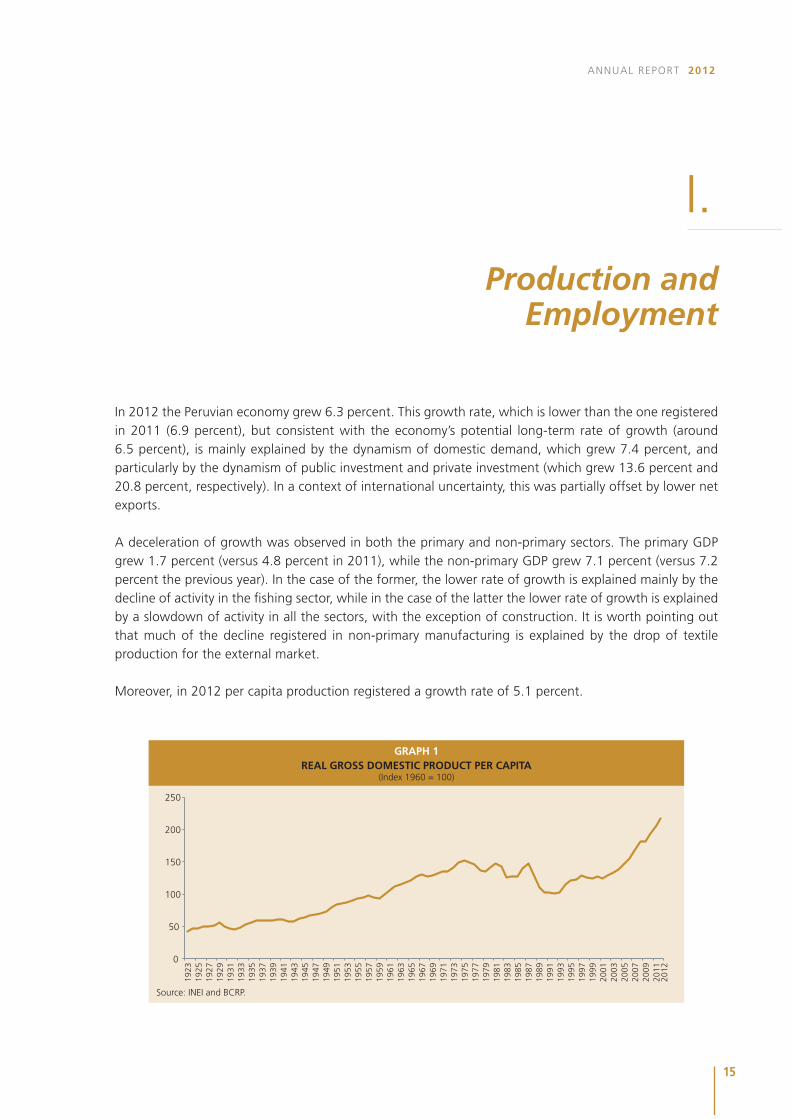
Showing a slightly higher growth rate than in 2011 (7.1 percent), domestic demand grew 7.4 percent in 2012. In terms of demand components, a moderation of growth was observed in private consumption, which declined from 6.4 percent in 2011 to 5.8 percent in 2012.
Private investment grew 13.6 percent –recording a higher rate than in the previous year (11.4 percent)–, mainly due to the dynamism of the construction sector which showed a remarkable recovery.
Public investment showed a significant growth compared to 2011, increasing from a drop of 18.0 percent to an increase of 20.8 percent due especially to the dynamism of investment expenditure in regional and local governments.
2010 2011 2012 Average2003-2012
Domestic Demand 13.1 7.1 7.4 7.2a. Private consumption 6.0 6.4 5.8 5.5b. Public consumption 9.7 6.1 10.5 7.3c. Gross domestic investment 23.1 4.8 14.9 12.4
- Private 22.1 11.4 13.6 12.1- Public 26.7 -18.0 20.8 13.9
d. Change of inventory(% of nominal GDP) 0.9 1.9 0.9 0.3
Exports 1.3 8.8 4.8 6.3Minus:Imports 24.0 9.8 10.4 9.8GDP 8.8 6.9 6.3 6.5Note:
Total public expenditure 15.9 -3.4 14.0 9.2
Source: INEI and BCRP.
TABLE 1GROSS DOMESTIC PRODUCT BY TYPE OF EXPENDITURE
(Real % change)
GRAPH 2GDP AND DOMESTIC DEMAND
(Real % change)
4.05.0
6.87.7
8.99.8
0.9
8.8
6.96.3
3.7 3.8
5.8
10.311.8 12.3
-2.8
13.1
7.1 7.4
2003 2004 2005 2006 2007 2008 2009 2010 2011 2012
GDP Domestic demand
Source: INEI and BCRP.
17
ANNUAL REPORT 2012
1.1. Private Consumption
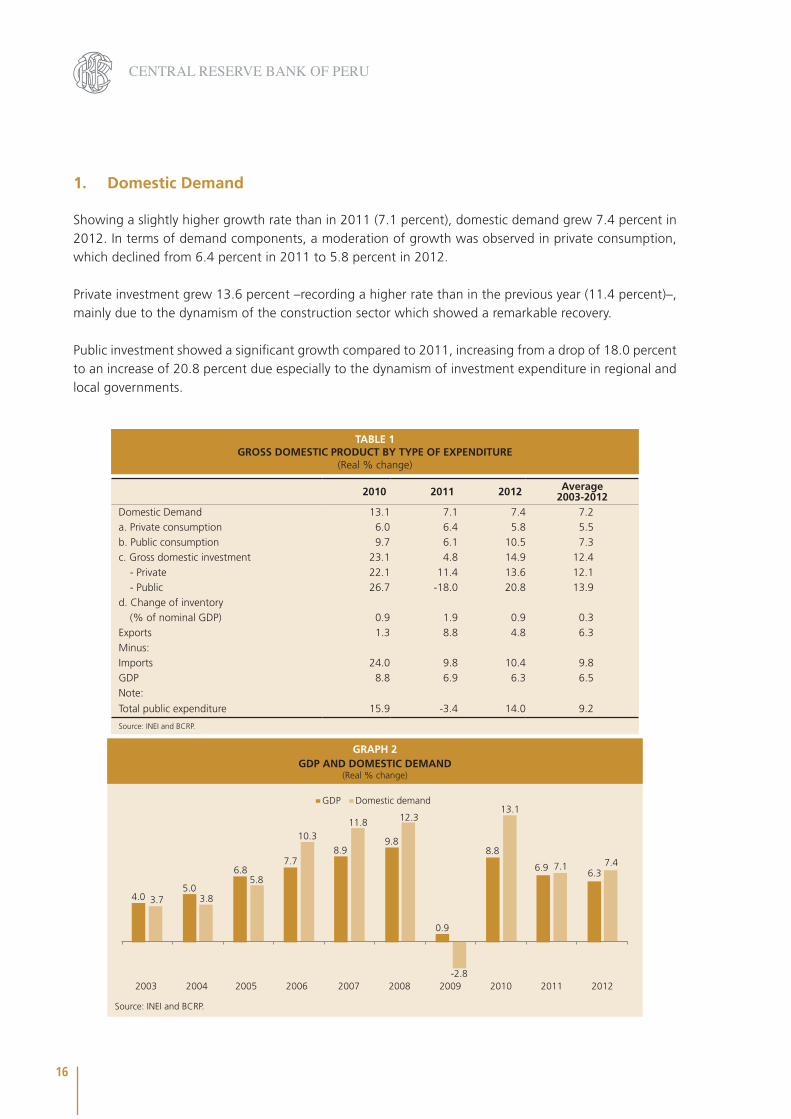
Showing a lower growth rate than in the previous year (6.4 percent), private consumption grew 5.8 percent in 2012. This moderation of growth in private consumption is consistent with the decline in the growth rates of the national disposable income (down from 7.2 percent in 2011 to 6.6 percent in 2012), urban employment (down from 5.4 to 4.0 percent in 2012), and consumer loans (down from 20.4 percent in December 2011 to 14.4 percent in December 2012). However, the pace of growth of private consumption remained stable at 5.8 percent since Q2-2012.
GRAPH 3PRIVATE CONSUMPTION
(Real % change)
Source: INEI and BCRP.
3.4 3.6
4.6
6.4
8.38.7
2.4
6.06.4
5.8
2003 2004 2005 2006 2007 2008 2009 2010 2011 2012
2010 2011 2012Average
2003-2012
Gross domestic product 8.8 6.9 6.3 6.5
Gross national product 2/ 7.6 6.1 8.2 6.0
Gross national income 3/ 10.8 7.4 6.8 6.7
National disposable income 4/ 10.5 7.2 6.6 6.7
1/ Preliminary data.2/ Excludes non-resident factor income from GDP.3/ Includes losses and gains due to changes in terms of trade.4/ Adds net transfers received by non residents to the gross national income.Source: INEI and BCRP.
TABLE 2NATIONAL DISPOSABLE INCOME 1/
(% change)
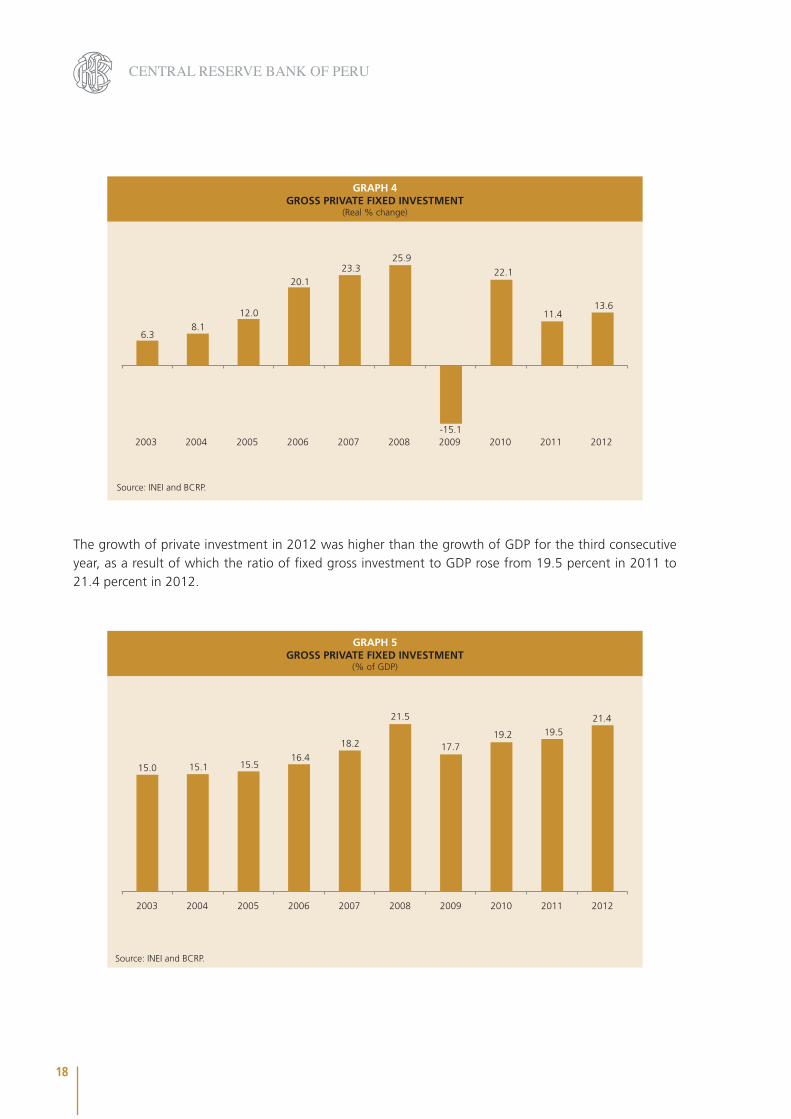
1.2 Private Investment
On the other hand, in 2012 private investment grew 13.6 percent. It should be pointed out that, except in 2009, private investment has been growing at two-digit rates since 2005 after having gone through an economic recovery based on the use of excess installed capacity in the previous years.
18
CENTRAL RESERVE BANK OF PERU
GRAPH 4GROSS PRIVATE FIXED INVESTMENT
(Real % change)
Source: INEI and BCRP.
6.38.1
12.0
20.123.3
25.9
-15.1
22.1
11.4 13.6
2003 2004 2005 2006 2007 2008 2009 2010 2011 2012
The growth of private investment in 2012 was higher than the growth of GDP for the third consecutive year, as a result of which the ratio of fixed gross investment to GDP rose from 19.5 percent in 2011 to 21.4 percent in 2012.
GRAPH 5GROSS PRIVATE FIXED INVESTMENT
(% of GDP)
Source: INEI and BCRP.
15.0 15.1 15.516.4
18.2
21.5
17.719.2 19.5
21.4
2003 2004 2005 2006 2007 2008 2009 2010 2011 2012
19
ANNUAL REPORT 2012
Significant investment was observed during the year in different sectors of the economy. Investments in the mining sector continued to be oriented to the development of new projects, as well as to the expansion and continuity of operations in existing projects. Chinalco Peru’s Toromocho project and Xstrata’s Las Bambas and Antapaccay projects are worth highlighting among the former, while Yanacocha, Antamina, and Cerro Verde stand out among the latter.
In the hydrocarbons sector, Pluspetrol Camisea continued with the expansion of the Malvinas and Pisco production plants, with an accumulated investment of US$ 32 million in the year. Furthermore, Pluspetrol Lot 56 invested about US$ 100 million in the construction of the pipeline connecting the area of Mipaya (Cusco) with the production plant and in the installation of compressors at the Pagoreni wells. These projects would be completed in Q1 and Q3 of 2013, respectively.
Investments worth pointing out in the manufacturing sector included the investment made by Gloria, which at December 2012 amounted to US$ 65 million. This investment was in part used to improve the production plant of Huachipa and the yogurt plant in Arequipa. On the other hand, La Pampilla reported investments for a total of US$ 10 million to develop the engineering details of the modernization of the refinery in order to adapt it to the new specifications of fuels, to complete the biological effluent treatment plant, to replace liquid fuels by natural gas, and to implement other minor maintenance operations. Quimpac also continued investing in the expansion of its plant in Callao and in the acquisition of equipment, with an investment of over US$ 80 million in the year.
In the energy sector, Enersur invested over US$ 30 million, of which a large part went to the thermal power plant of Chilca Uno to convert the plant which went into commercial operation in November 2012 into a combined cycle plant. On the other hand, Luz del Sur invested US$ 130 million, of which US$ 70 million was to improve the hydroelectric plant of Santa Teresa in Cusco.
Large real estate developments implemented during 2012 included the housing project “Ciudad Nueva” of Paz Centenario in Canta, Callao, as well as Graña y Montero’s housing projects “Los Parques de Carabayllo”, “Los Parques de El Agustino” and “Los Parques de Villa El Salvador” with a total of almost 3,000 apartments, and “Las Torres de Santa Clara” of Grupo Acuario with a total of 1,700 apartments.
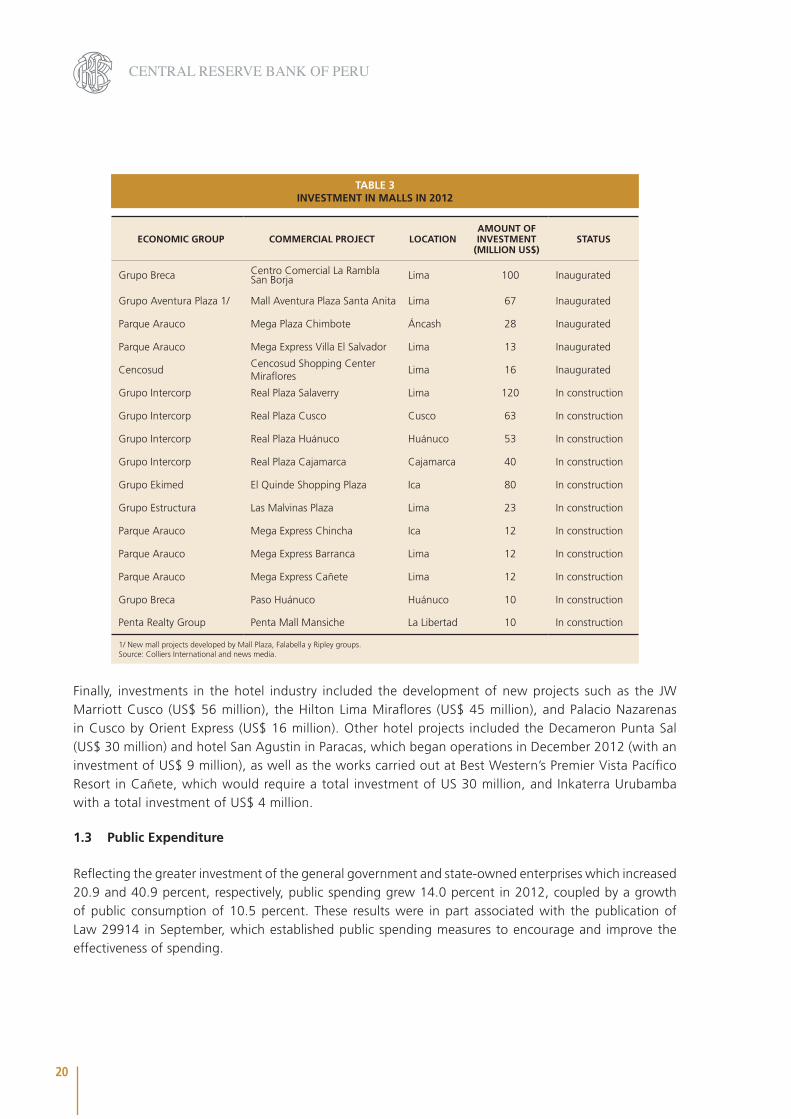
Five new shopping malls –four of which are located in Metropolitan Lima– opened during the year, including Centro Comercial La Rambla San Borja and Mall Aventura Plaza Santa Anita (with investments of US$ 100 million and US$ 67 million, respectively). In addition to this, investments were also made to expand the Jockey Plaza’s Boulevard, Plaza Norte at Independencia (Wong group), Real Plaza in Juliaca (Intercorp group), and Mall Aventura Plaza in Trujillo.
20
CENTRAL RESERVE BANK OF PERU
ECONOMIC GROUP COMMERCIAL PROJECT LOCATIONAMOUNT OF INVESTMENT
(MILLION US$)STATUS
Grupo Breca Centro Comercial La Rambla San Borja Lima 100 Inaugurated
Grupo Aventura Plaza 1/ Mall Aventura Plaza Santa Anita Lima 67 Inaugurated
Parque Arauco Mega Plaza Chimbote Áncash 28 Inaugurated
Parque Arauco Mega Express Villa El Salvador Lima 13 Inaugurated
CencosudCencosud Shopping Center Miraflores
Lima 16 Inaugurated
Grupo Intercorp Real Plaza Salaverry Lima 120 In construction
Grupo Intercorp Real Plaza Cusco Cusco 63 In construction
Grupo Intercorp Real Plaza Huánuco Huánuco 53 In construction
Grupo Intercorp Real Plaza Cajamarca Cajamarca 40 In construction
Grupo Ekimed El Quinde Shopping Plaza Ica 80 In construction
Grupo Estructura Las Malvinas Plaza Lima 23 In construction
Parque Arauco Mega Express Chincha Ica 12 In construction
Parque Arauco Mega Express Barranca Lima 12 In construction
Parque Arauco Mega Express Cañete Lima 12 In construction
Grupo Breca Paso Huánuco Huánuco 10 In construction
Penta Realty Group Penta Mall Mansiche La Libertad 10 In construction
1/ New mall projects developed by Mall Plaza, Falabella y Ripley groups. Source: Colliers International and news media.
TABLE 3INVESTMENT IN MALLS IN 2012
Finally, investments in the hotel industry included the development of new projects such as the JW Marriott Cusco (US$ 56 million), the Hilton Lima Miraflores (US$ 45 million), and Palacio Nazarenas in Cusco by Orient Express (US$ 16 million). Other hotel projects included the Decameron Punta Sal (US$ 30 million) and hotel San Agustin in Paracas, which began operations in December 2012 (with an investment of US$ 9 million), as well as the works carried out at Best Western’s Premier Vista Pacífico Resort in Cañete, which would require a total investment of US 30 million, and Inkaterra Urubamba with a total investment of US$ 4 million.
1.3 Public Expenditure
Reflecting the greater investment of the general government and state-owned enterprises which increased 20.9 and 40.9 percent, respectively, public spending grew 14.0 percent in 2012, coupled by a growth of public consumption of 10.5 percent. These results were in part associated with the publication of Law 29914 in September, which established public spending measures to encourage and improve the effectiveness of spending.
21
ANNUAL REPORT 2012
Increased current expenditure was registered in the following sectors:
Defense (real growth of 13 percent). Increased funding was allocated to this sector for interventions in areas of the Valley of the Apurimac, Ene and Mantaro rivers (VRAEM), and for training, border surveillance, and units maintenance actions.
repair.
infrastructure facilities, the National comprehensive cancer health care program, and to improve access to health care for cancer and rare diseases.
technical services and to pay for administrative service contracts (CAS).
SUNAT to meet the tax pressure goal and the implementation of new offices to serve taxpayers.
the higher costs associated with the implementation of the New Criminal Code.
the IV Censo Nacional Agropecuario and collecting information through the Sistema de Focalización de Hogares (SISFOH).
and vehicles.
and administrative service contracts (CAS), as well as due to increased spending at Autoridad Nacional del Agua, Servicio Nacional de Sanidad y Calidad Agroalimentaria (SENASA), and the Ministry of agriculture.
management of Programa de Apoyo al Hábitat Rural.
As for public investment, the sectors which recorded higher expenditure were:
Transport: Due to road concession projects, the Electric Train project, and road rehabilitation projects.
1.4 Exports and Imports
In a context of deceleration in the growth of world trade, exports of goods and services grew 4.8 percent in 2012 (versus 8.8 percent in 2011). A weak evolution of exports was observed during the year due to lower shipments of traditional exports (0.2 percent), such as coffee and gold, while the non-traditional exports grew 9.0 percent in terms of volume.
22
CENTRAL RESERVE BANK OF PERU
Imports grew 10.4 percent as a result of increased imports of consumer goods and non-financial services, which recorded growth rates of 19.4 and 13.7 percent, respectively.
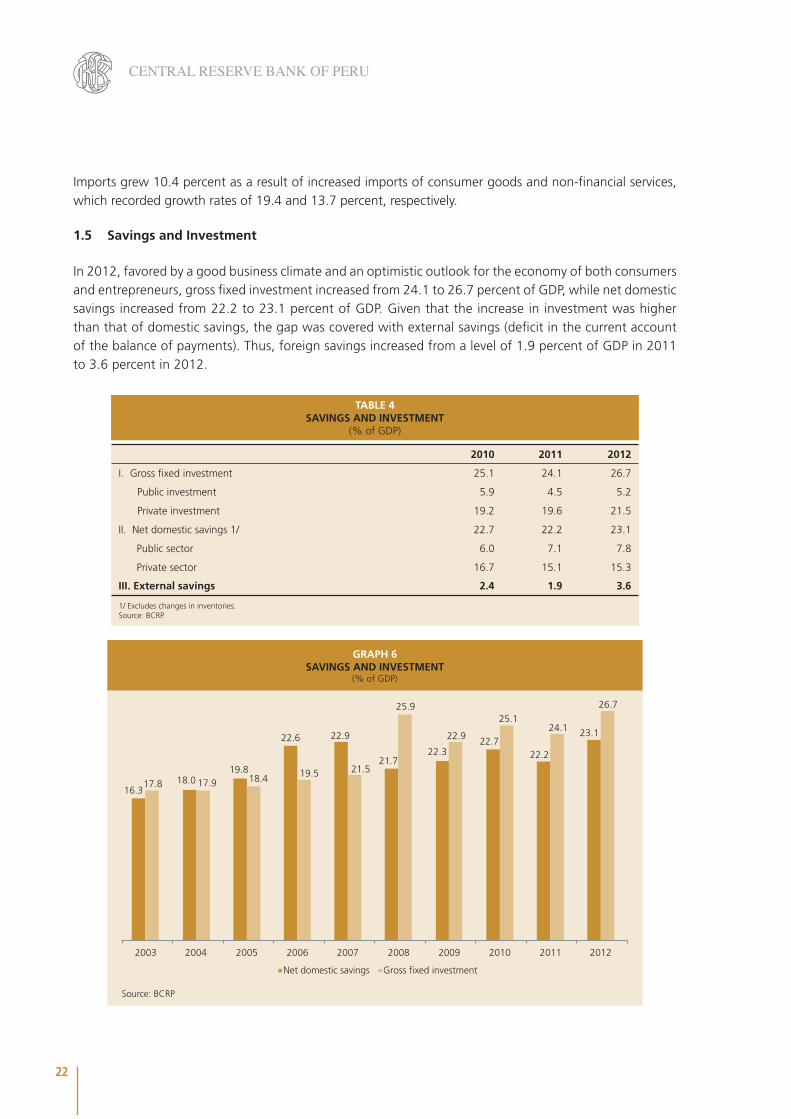
1.5 Savings and Investment
In 2012, favored by a good business climate and an optimistic outlook for the economy of both consumers and entrepreneurs, gross fixed investment increased from 24.1 to 26.7 percent of GDP, while net domestic savings increased from 22.2 to 23.1 percent of GDP. Given that the increase in investment was higher than that of domestic savings, the gap was covered with external savings (deficit in the current account of the balance of payments). Thus, foreign savings increased from a level of 1.9 percent of GDP in 2011 to 3.6 percent in 2012.
Source: BCRP
GRAPH 6SAVINGS AND INVESTMENT
(% of GDP)
16.318.0
19.8
22.6 22.9
21.722.3
22.722.2
23.1
17.8 17.9 18.4 19.5 21.5
25.9
22.9
25.124.1
26.7
2003 2004 2005 2006 2007 2008 2009 2010 2011 2012
Net domestic savings Gross fixed investment
2010 2011 2012
I. Gross fixed investment 25.1 24.1 26.7
Public investment 5.9 4.5 5.2
Private investment 19.2 19.6 21.5
II. Net domestic savings 1/ 22.7 22.2 23.1
Public sector 6.0 7.1 7.8
Private sector 16.7 15.1 15.3
III. External savings 2.4 1.9 3.6
1/ Excludes changes in inventories.Source: BCRP.
TABLE 4SAVINGS AND INVESTMENT
(% of GDP)
23
ANNUAL REPORT 2012
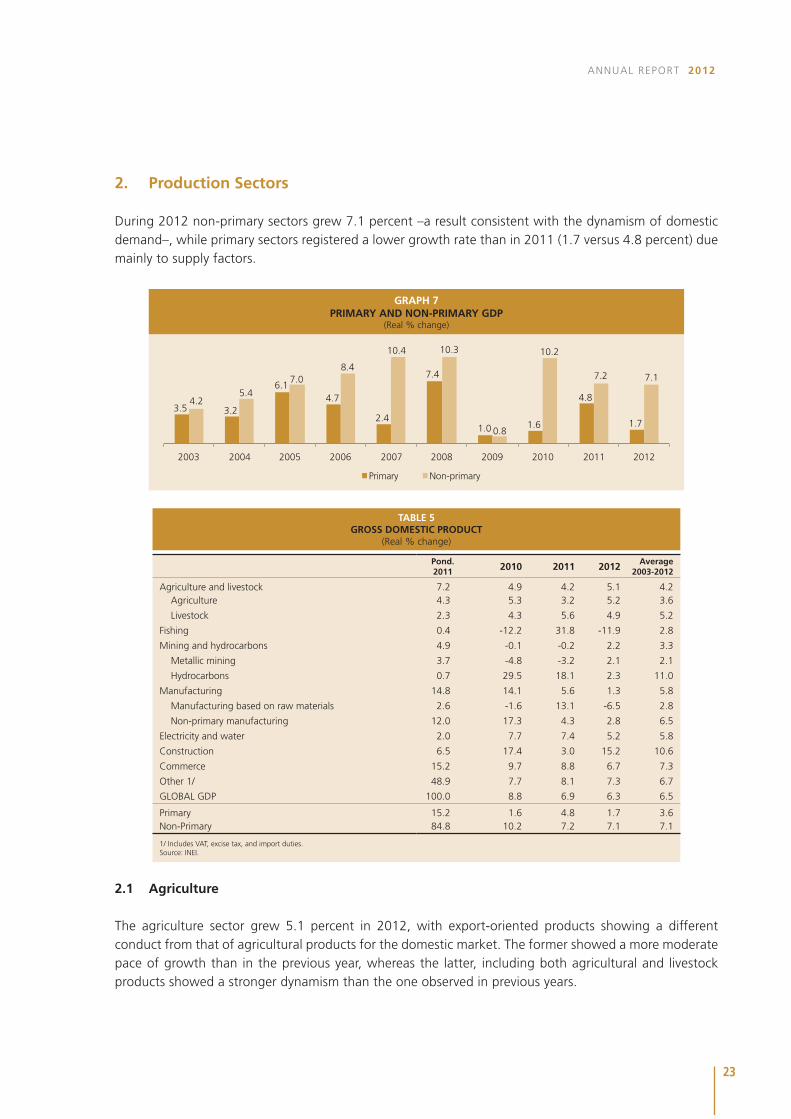
2. Production Sectors
During 2012 non-primary sectors grew 7.1 percent –a result consistent with the dynamism of domestic demand–, while primary sectors registered a lower growth rate than in 2011 (1.7 versus 4.8 percent) due mainly to supply factors.
GRAPH 7PRIMARY AND NON-PRIMARY GDP
(Real % change)
3.5 3.2
6.14.7
2.4
7.4
1.0 1.6
4.8
1.7
4.25.4
7.08.4
10.4 10.3
0.8
10.2
7.2 7.1
2003 2004 2005 2006 2007 2008 2009 2010 2011 2012
Primary Non-primary
Pond. 2011 2010 2011 2012 Average
2003-2012
Agriculture and livestock 7.2 4.9 4.2 5.1 4.2Agriculture 4.3 5.3 3.2 5.2 3.6
Livestock 2.3 4.3 5.6 4.9 5.2
Fishing 0.4 -12.2 31.8 -11.9 2.8
Mining and hydrocarbons 4.9 -0.1 -0.2 2.2 3.3
Metallic mining 3.7 -4.8 -3.2 2.1 2.1
Hydrocarbons 0.7 29.5 18.1 2.3 11.0
Manufacturing 14.8 14.1 5.6 1.3 5.8
Manufacturing based on raw materials 2.6 -1.6 13.1 -6.5 2.8
Non-primary manufacturing 12.0 17.3 4.3 2.8 6.5
Electricity and water 2.0 7.7 7.4 5.2 5.8
Construction 6.5 17.4 3.0 15.2 10.6
Commerce 15.2 9.7 8.8 6.7 7.3
Other 1/ 48.9 7.7 8.1 7.3 6.7
GLOBAL GDP 100.0 8.8 6.9 6.3 6.5
Primary 15.2 1.6 4.8 1.7 3.6Non-Primary 84.8 10.2 7.2 7.1 7.1
1/ Includes VAT, excise tax, and import duties.Source: INEI.
TABLE 5GROSS DOMESTIC PRODUCT
(Real % change)
2.1 Agriculture
The agriculture sector grew 5.1 percent in 2012, with export-oriented products showing a different conduct from that of agricultural products for the domestic market. The former showed a more moderate pace of growth than in the previous year, whereas the latter, including both agricultural and livestock products showed a stronger dynamism than the one observed in previous years.
24
CENTRAL RESERVE BANK OF PERU
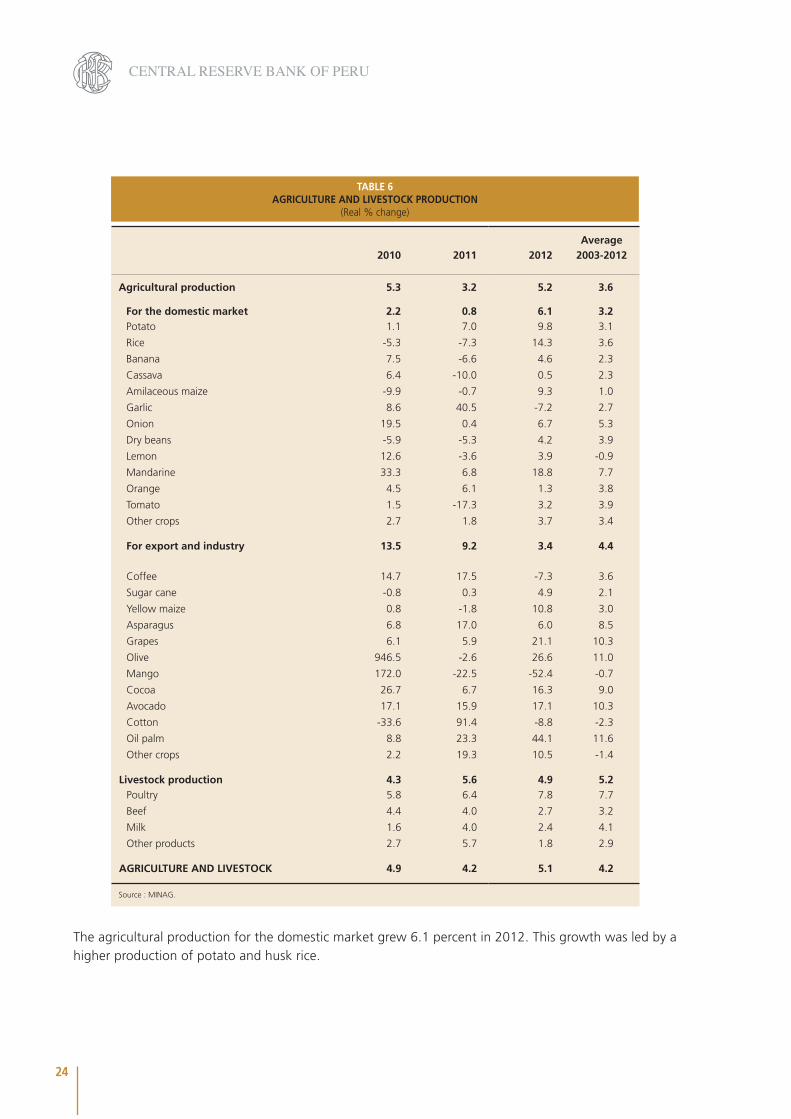
TABLE 6AGRICULTURE AND LIVESTOCK PRODUCTION
(Real % change)
Average2010 2011 2012 2003-2012
Agricultural production 5.3 3.2 5.2 3.6
For the domestic market 2.2 0.8 6.1 3.2Potato 1.1 7.0 9.8 3.1
Rice -5.3 -7.3 14.3 3.6
Banana 7.5 -6.6 4.6 2.3
Cassava 6.4 -10.0 0.5 2.3
Amilaceous maize -9.9 -0.7 9.3 1.0
Garlic 8.6 40.5 -7.2 2.7
Onion 19.5 0.4 6.7 5.3
Dry beans -5.9 -5.3 4.2 3.9
Lemon 12.6 -3.6 3.9 -0.9
Mandarine 33.3 6.8 18.8 7.7
Orange 4.5 6.1 1.3 3.8
Tomato 1.5 -17.3 3.2 3.9
Other crops 2.7 1.8 3.7 3.4
For export and industry 13.5 9.2 3.4 4.4
Coffee 14.7 17.5 -7.3 3.6
Sugar cane -0.8 0.3 4.9 2.1
Yellow maize 0.8 -1.8 10.8 3.0
Asparagus 6.8 17.0 6.0 8.5
Grapes 6.1 5.9 21.1 10.3
Olive 946.5 -2.6 26.6 11.0
Mango 172.0 -22.5 -52.4 -0.7
Cocoa 26.7 6.7 16.3 9.0
Avocado 17.1 15.9 17.1 10.3
Cotton -33.6 91.4 -8.8 -2.3
Oil palm 8.8 23.3 44.1 11.6
Other crops 2.2 19.3 10.5 -1.4
Livestock production 4.3 5.6 4.9 5.2Poultry 5.8 6.4 7.8 7.7
Beef 4.4 4.0 2.7 3.2
Milk 1.6 4.0 2.4 4.1
Other products 2.7 5.7 1.8 2.9
AGRICULTURE AND LIVESTOCK 4.9 4.2 5.1 4.2
Source : MINAG.
The agricultural production for the domestic market grew 6.1 percent in 2012. This growth was led by a higher production of potato and husk rice.
25
ANNUAL REPORT 2012
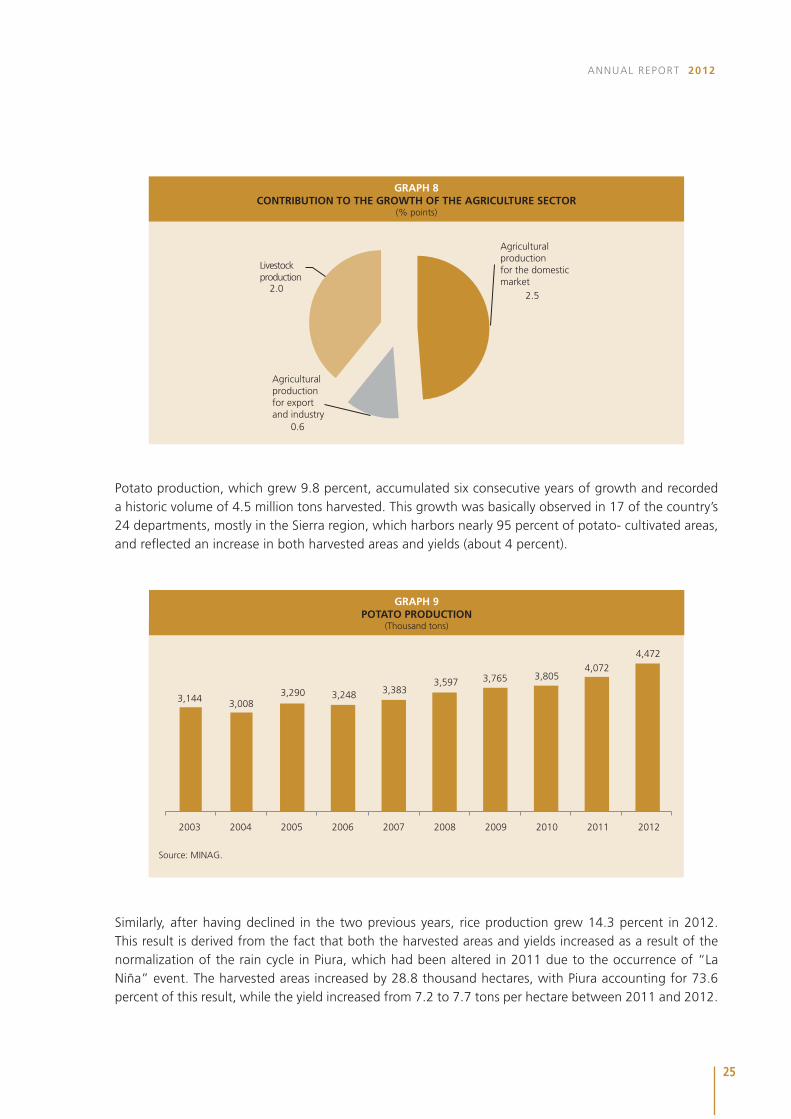
GRAPH 8CONTRIBUTION TO THE GROWTH OF THE AGRICULTURE SECTOR
(% points)
Agriculturalproductionfor the domesticmarket
2.5
Agriculturalproductionfor exportand industry
0.6
Livestockproduction
2.0
Potato production, which grew 9.8 percent, accumulated six consecutive years of growth and recorded a historic volume of 4.5 million tons harvested. This growth was basically observed in 17 of the country’s 24 departments, mostly in the Sierra region, which harbors nearly 95 percent of potato- cultivated areas, and reflected an increase in both harvested areas and yields (about 4 percent).
GRAPH 9POTATO PRODUCTION
(Thousand tons)
Source: MINAG.
3,144 3,0083,290 3,248 3,383
3,597 3,765 3,8054,072
4,472
2003 2004 2005 2006 2007 2008 2009 2010 2011 2012
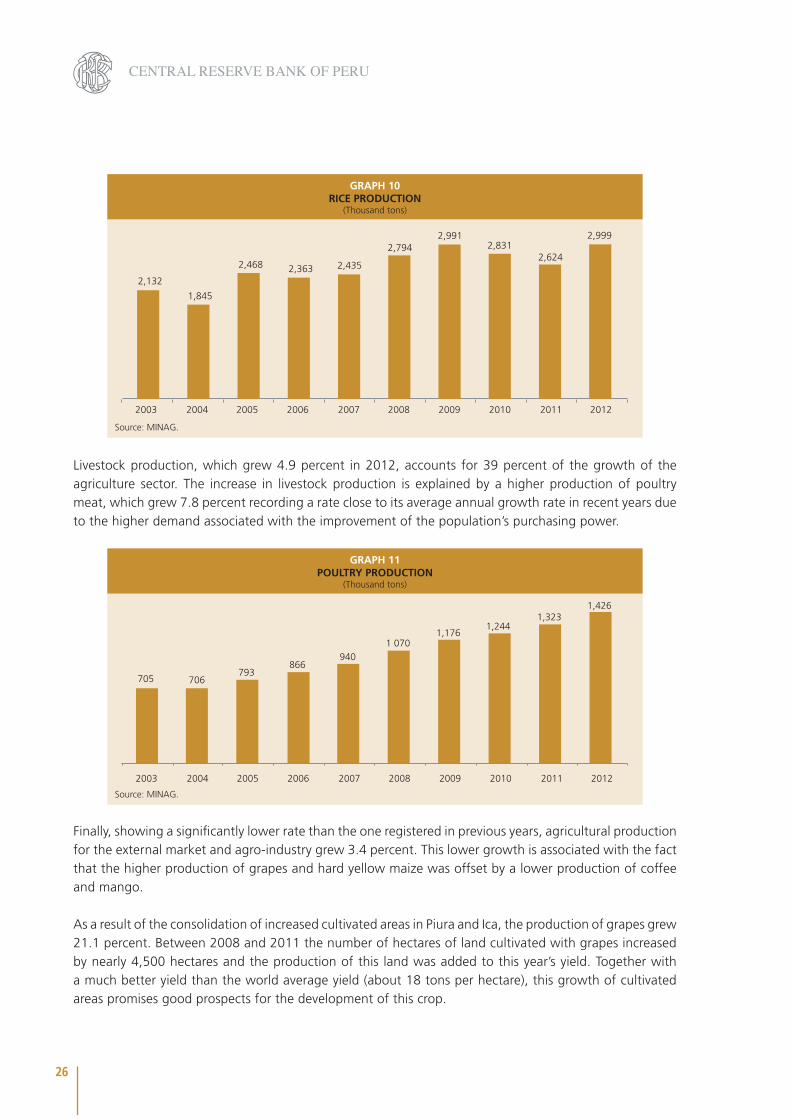
Similarly, after having declined in the two previous years, rice production grew 14.3 percent in 2012. This result is derived from the fact that both the harvested areas and yields increased as a result of the normalization of the rain cycle in Piura, which had been altered in 2011 due to the occurrence of “La Niña” event. The harvested areas increased by 28.8 thousand hectares, with Piura accounting for 73.6 percent of this result, while the yield increased from 7.2 to 7.7 tons per hectare between 2011 and 2012.
26
CENTRAL RESERVE BANK OF PERU
GRAPH 10RICE PRODUCTION
(Thousand tons)
Source: MINAG.
2,132
1,845
2,468 2,363 2,435
2,7942,991
2,8312,624
2,999
2003 2004 2005 2006 2007 2008 2009 2010 2011 2012
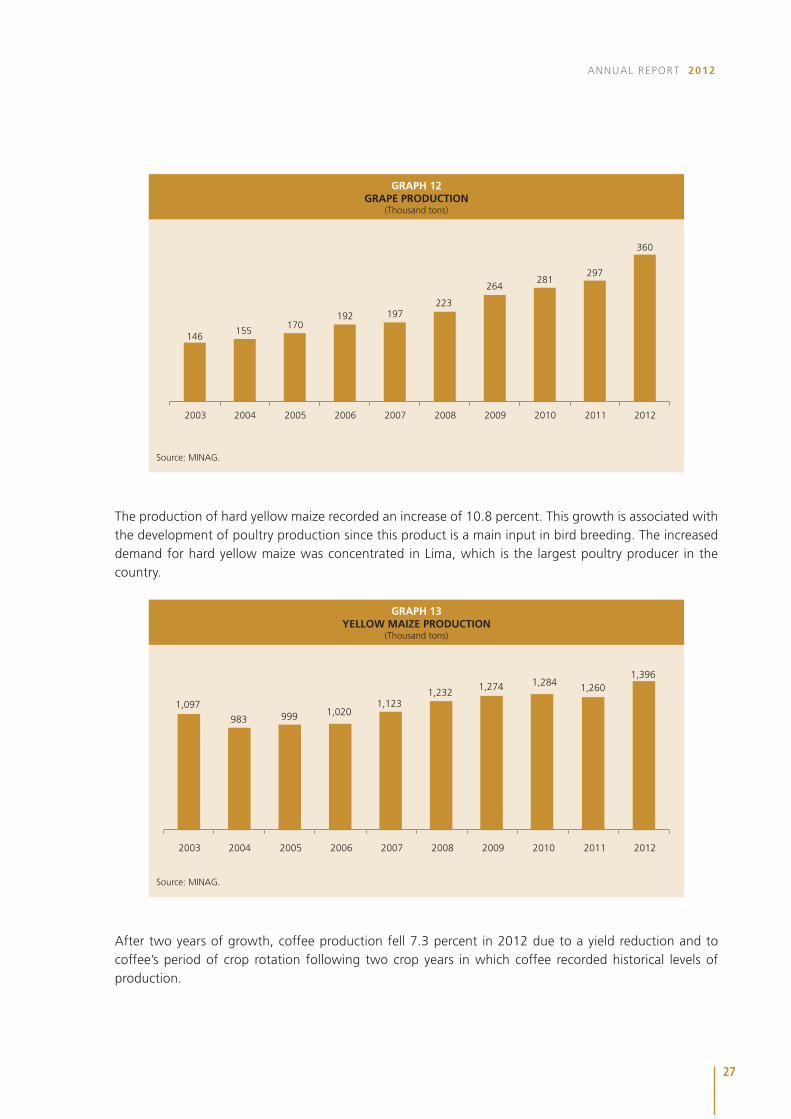
Livestock production, which grew 4.9 percent in 2012, accounts for 39 percent of the growth of the agriculture sector. The increase in livestock production is explained by a higher production of poultry meat, which grew 7.8 percent recording a rate close to its average annual growth rate in recent years due to the higher demand associated with the improvement of the population’s purchasing power.
GRAPH 11POULTRY PRODUCTION
(Thousand tons)
705 706793
866940
1 0701,176
1,2441,323
1,426
2003 2004 2005 2006 2007 2008 2009 2010 2011 2012
Source: MINAG.
Finally, showing a significantly lower rate than the one registered in previous years, agricultural production for the external market and agro-industry grew 3.4 percent. This lower growth is associated with the fact that the higher production of grapes and hard yellow maize was offset by a lower production of coffee and mango.
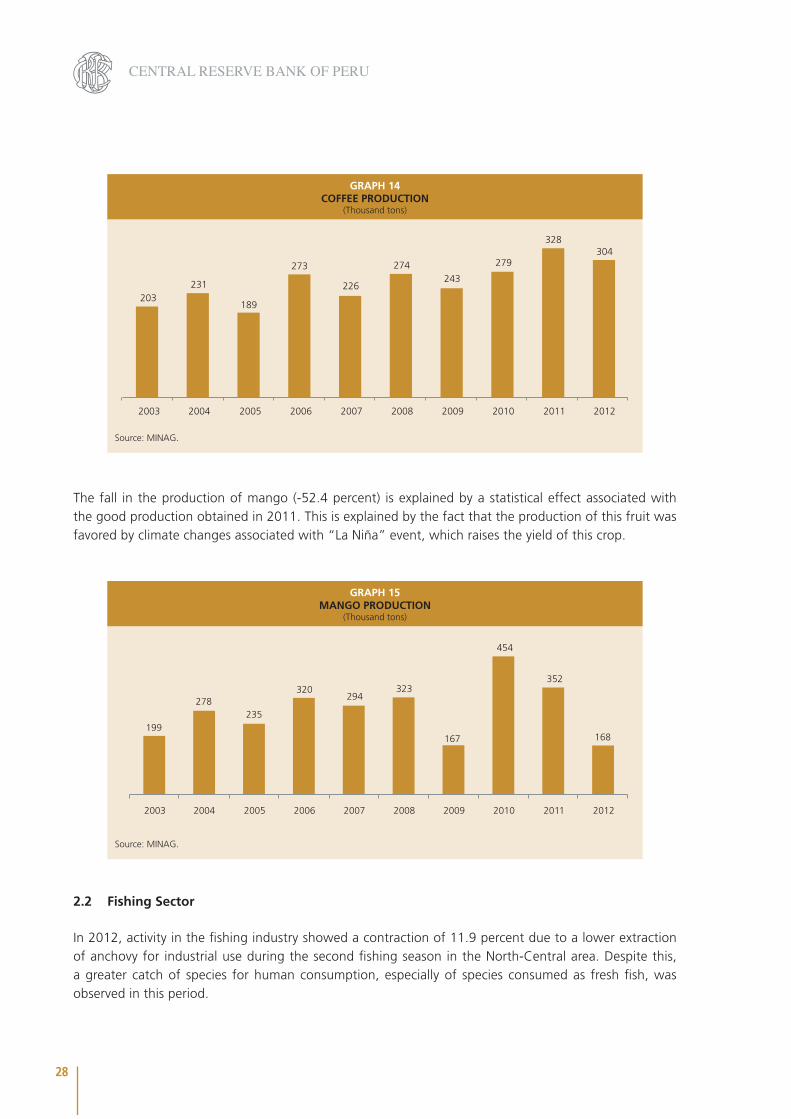
As a result of the consolidation of increased cultivated areas in Piura and Ica, the production of grapes grew 21.1 percent. Between 2008 and 2011 the number of hectares of land cultivated with grapes increased by nearly 4,500 hectares and the production of this land was added to this year’s yield. Together with a much better yield than the world average yield (about 18 tons per hectare), this growth of cultivated areas promises good prospects for the development of this crop.
27
ANNUAL REPORT 2012
GRAPH 12GRAPE PRODUCTION
(Thousand tons)
Source: MINAG.
146155
170192 197
223
264 281
297
360
2003 2004 2005 2006 2007 2008 2009 2010 2011 2012
The production of hard yellow maize recorded an increase of 10.8 percent. This growth is associated with the development of poultry production since this product is a main input in bird breeding. The increased demand for hard yellow maize was concentrated in Lima, which is the largest poultry producer in the country.
GRAPH 13YELLOW MAIZE PRODUCTION
(Thousand tons)
Source: MINAG.
1,097
983 999 1,0201,123
1,232 1,274 1,284 1,260
1,396
2003 2004 2005 2006 2007 2008 2009 2010 2011 2012
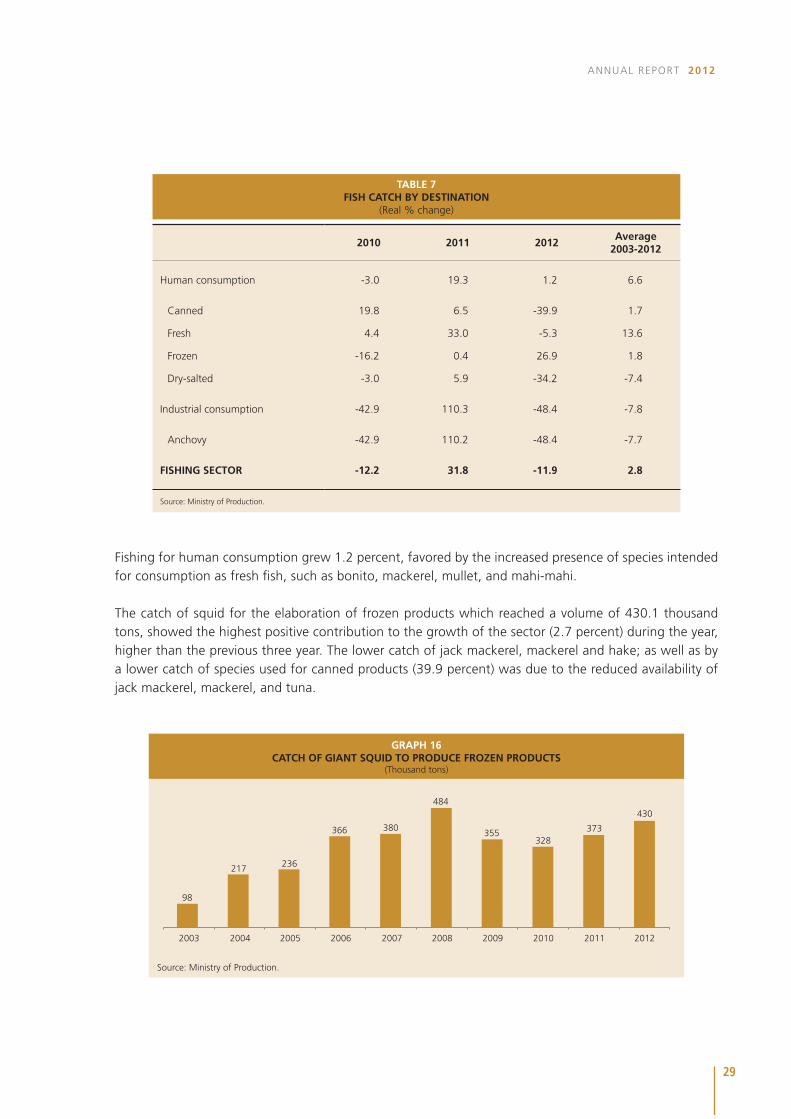
After two years of growth, coffee production fell 7.3 percent in 2012 due to a yield reduction and to coffee’s period of crop rotation following two crop years in which coffee recorded historical levels of production.
28
CENTRAL RESERVE BANK OF PERU
GRAPH 14COFFEE PRODUCTION
(Thousand tons)
Source: MINAG.
203231
189
273
226
274243
279
328304
2003 2004 2005 2006 2007 2008 2009 2010 2011 2012
The fall in the production of mango (-52.4 percent) is explained by a statistical effect associated with the good production obtained in 2011. This is explained by the fact that the production of this fruit was favored by climate changes associated with “La Niña” event, which raises the yield of this crop.
GRAPH 15MANGO PRODUCTION
(Thousand tons)
Source: MINAG.
199
278235
320 294
323
167
454
352
168
2003 2004 2005 2006 2007 2008 2009 2010 2011 2012
2.2 Fishing Sector
In 2012, activity in the fishing industry showed a contraction of 11.9 percent due to a lower extraction of anchovy for industrial use during the second fishing season in the North-Central area. Despite this, a greater catch of species for human consumption, especially of species consumed as fresh fish, was observed in this period.
29
ANNUAL REPORT 2012
2010 2011 2012Average
2003-2012
Human consumption -3.0 19.3 1.2 6.6
Canned 19.8 6.5 -39.9 1.7
Fresh 4.4 33.0 -5.3 13.6
Frozen -16.2 0.4 26.9 1.8
Dry-salted -3.0 5.9 -34.2 -7.4
Industrial consumption -42.9 110.3 -48.4 -7.8
Anchovy -42.9 110.2 -48.4 -7.7
FISHING SECTOR -12.2 31.8 -11.9 2.8
Source: Ministry of Production.
TABLE 7FISH CATCH BY DESTINATION
(Real % change)
Fishing for human consumption grew 1.2 percent, favored by the increased presence of species intended for consumption as fresh fish, such as bonito, mackerel, mullet, and mahi-mahi.
The catch of squid for the elaboration of frozen products which reached a volume of 430.1 thousand tons, showed the highest positive contribution to the growth of the sector (2.7 percent) during the year, higher than the previous three year. The lower catch of jack mackerel, mackerel and hake; as well as by a lower catch of species used for canned products (39.9 percent) was due to the reduced availability of jack mackerel, mackerel, and tuna.
GRAPH 16CATCH OF GIANT SQUID TO PRODUCE FROZEN PRODUCTS
(Thousand tons)
Source: Ministry of Production.
98
217 236
366 380
484
355328
373
430
2003 2004 2005 2006 2007 2008 2009 2010 2011 2012
30
CENTRAL RESERVE BANK OF PERU
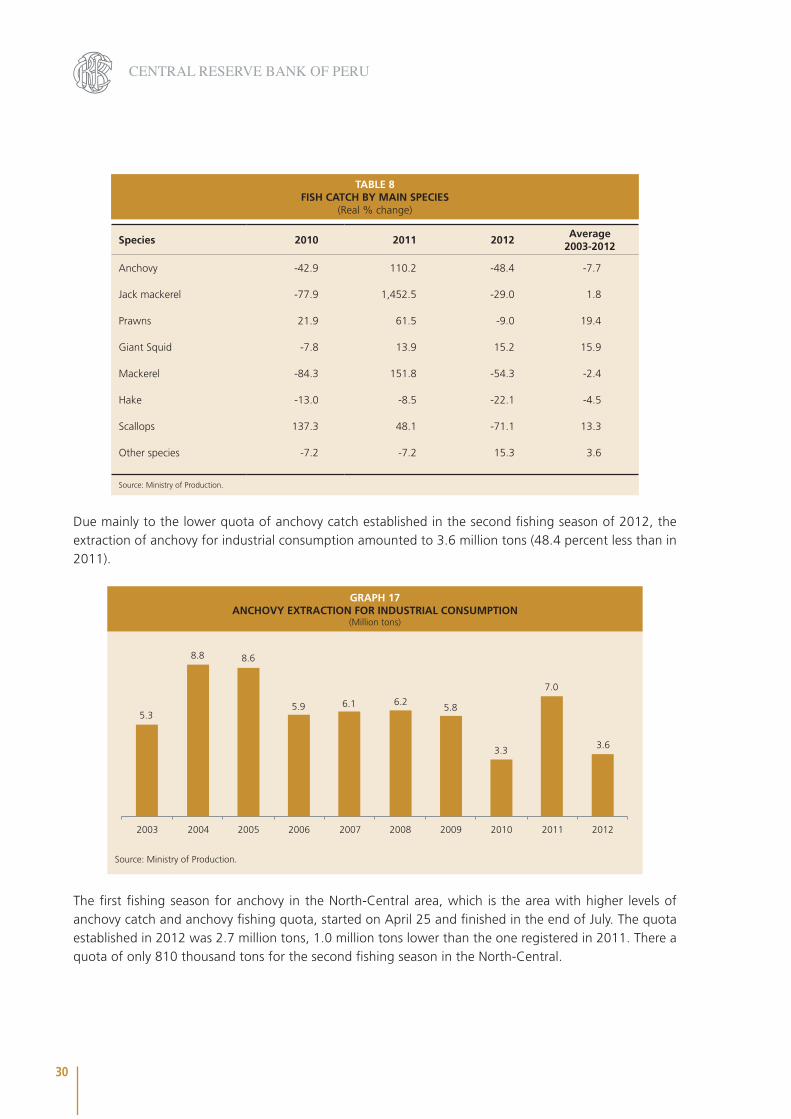
Species 2010 2011 2012Average
2003-2012
Anchovy -42.9 110.2 -48.4 -7.7
Jack mackerel -77.9 1,452.5 -29.0 1.8
Prawns 21.9 61.5 -9.0 19.4
Giant Squid -7.8 13.9 15.2 15.9
Mackerel -84.3 151.8 -54.3 -2.4
Hake -13.0 -8.5 -22.1 -4.5
Scallops 137.3 48.1 -71.1 13.3
Other species -7.2 -7.2 15.3 3.6
Source: Ministry of Production.
TABLE 8FISH CATCH BY MAIN SPECIES
(Real % change)
Due mainly to the lower quota of anchovy catch established in the second fishing season of 2012, the extraction of anchovy for industrial consumption amounted to 3.6 million tons (48.4 percent less than in 2011).
GRAPH 17ANCHOVY EXTRACTION FOR INDUSTRIAL CONSUMPTION
(Million tons)
Source: Ministry of Production.
5.3
8.8 8.6
5.9 6.1 6.25.8
3.3
7.0
3.6
2003 2004 2005 2006 2007 2008 2009 2010 2011 2012
The first fishing season for anchovy in the North-Central area, which is the area with higher levels of anchovy catch and anchovy fishing quota, started on April 25 and finished in the end of July. The quota established in 2012 was 2.7 million tons, 1.0 million tons lower than the one registered in 2011. There a quota of only 810 thousand tons for the second fishing season in the North-Central.
31
ANNUAL REPORT 2012
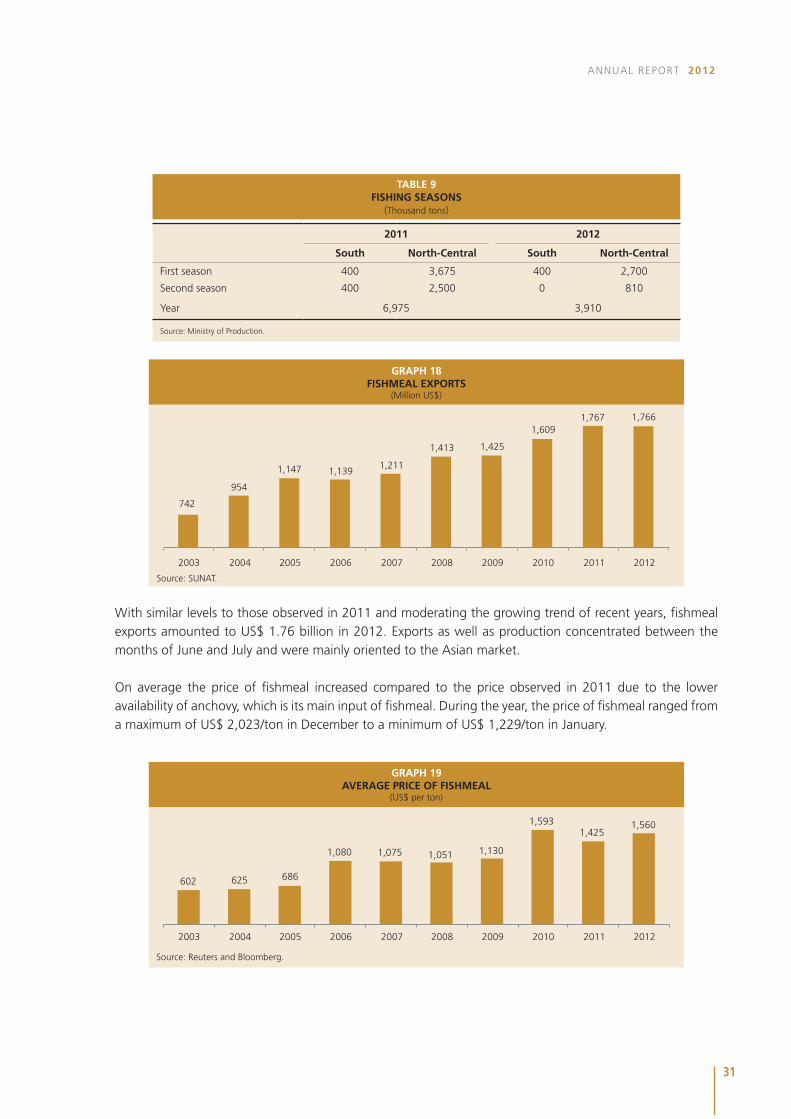
2011 2012
South North-Central South North-Central
First season 400 3,675 400 2,700
Second season 400 2,500 0 810
Year 6,975 3,910
Source: Ministry of Production.
TABLE 9FISHING SEASONS
(Thousand tons)
GRAPH 18FISHMEAL EXPORTS
(Million US$)
Source: SUNAT.
742
954
1,147 1,1391,211
1,413 1,425
1,6091,767 1,766
2003 2004 2005 2006 2007 2008 2009 2010 2011 2012
With similar levels to those observed in 2011 and moderating the growing trend of recent years, fishmeal exports amounted to US$ 1.76 billion in 2012. Exports as well as production concentrated between the months of June and July and were mainly oriented to the Asian market.
On average the price of fishmeal increased compared to the price observed in 2011 due to the lower availability of anchovy, which is its main input of fishmeal. During the year, the price of fishmeal ranged from a maximum of US$ 2,023/ton in December to a minimum of US$ 1,229/ton in January.
GRAPH 19AVERAGE PRICE OF FISHMEAL
(US$ per ton)
Source: Reuters and Bloomberg.
602 625 686
1,080 1,075 1,051 1,130
1,593 1,425
1,560
2003 2004 2005 2006 2007 2008 2009 2010 2011 2012
32
CENTRAL RESERVE BANK OF PERU
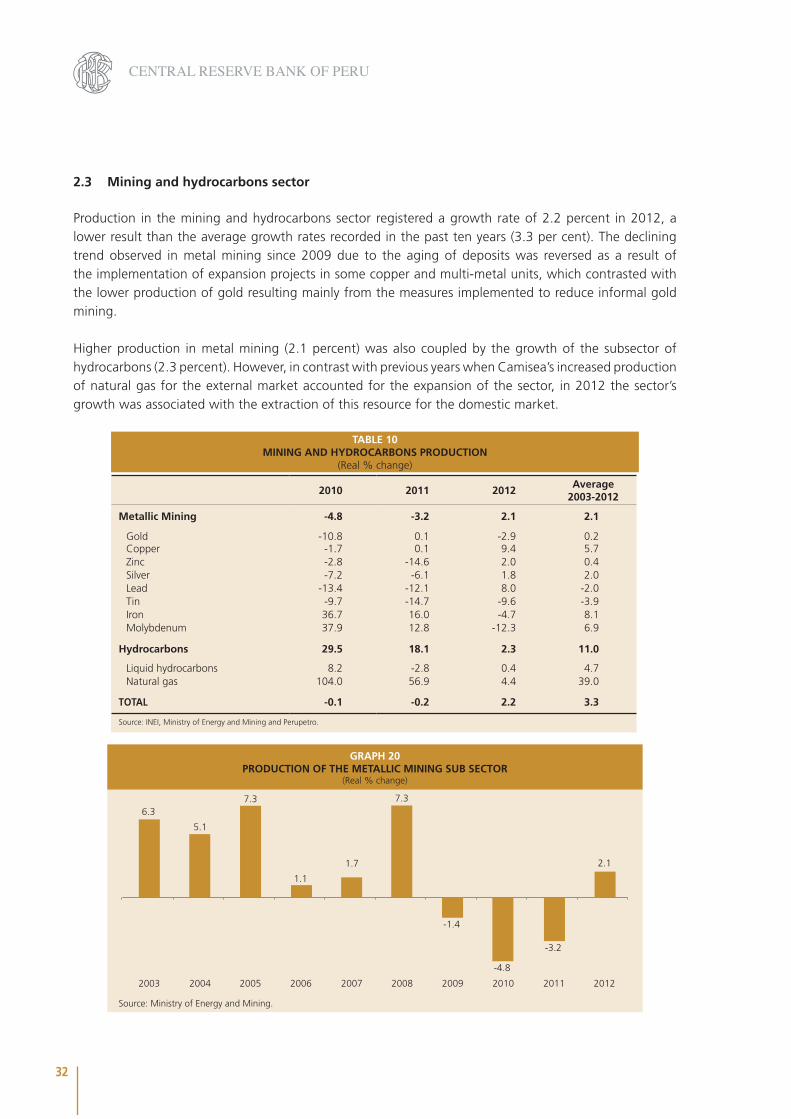
2.3 Mining and hydrocarbons sector
Production in the mining and hydrocarbons sector registered a growth rate of 2.2 percent in 2012, a lower result than the average growth rates recorded in the past ten years (3.3 per cent). The declining trend observed in metal mining since 2009 due to the aging of deposits was reversed as a result of the implementation of expansion projects in some copper and multi-metal units, which contrasted with the lower production of gold resulting mainly from the measures implemented to reduce informal gold mining.
Higher production in metal mining (2.1 percent) was also coupled by the growth of the subsector of hydrocarbons (2.3 percent). However, in contrast with previous years when Camisea’s increased production of natural gas for the external market accounted for the expansion of the sector, in 2012 the sector’s growth was associated with the extraction of this resource for the domestic market.
TABLE 10MINING AND HYDROCARBONS PRODUCTION
(Real % change)
2010 2011 2012Average
2003-2012
Metallic Mining -4.8 -3.2 2.1 2.1
Gold -10.8 0.1 -2.9 0.2Copper -1.7 0.1 9.4 5.7Zinc -2.8 -14.6 2.0 0.4Silver -7.2 -6.1 1.8 2.0Lead -13.4 -12.1 8.0 -2.0Tin -9.7 -14.7 -9.6 -3.9Iron 36.7 16.0 -4.7 8.1Molybdenum 37.9 12.8 -12.3 6.9
Hydrocarbons 29.5 18.1 2.3 11.0
Liquid hydrocarbons 8.2 -2.8 0.4 4.7Natural gas 104.0 56.9 4.4 39.0
TOTAL -0.1 -0.2 2.2 3.3
Source: INEI, Ministry of Energy and Mining and Perupetro.
GRAPH 20PRODUCTION OF THE METALLIC MINING SUB SECTOR
(Real % change)
Source: Ministry of Energy and Mining.
6.3
5.1
7.3
1.1
1.7
7.3
-1.4
-4.8
-3.2
2.1
2003 2004 2005 2006 2007 2008 2009 2010 2011 2012
33
ANNUAL REPORT 2012
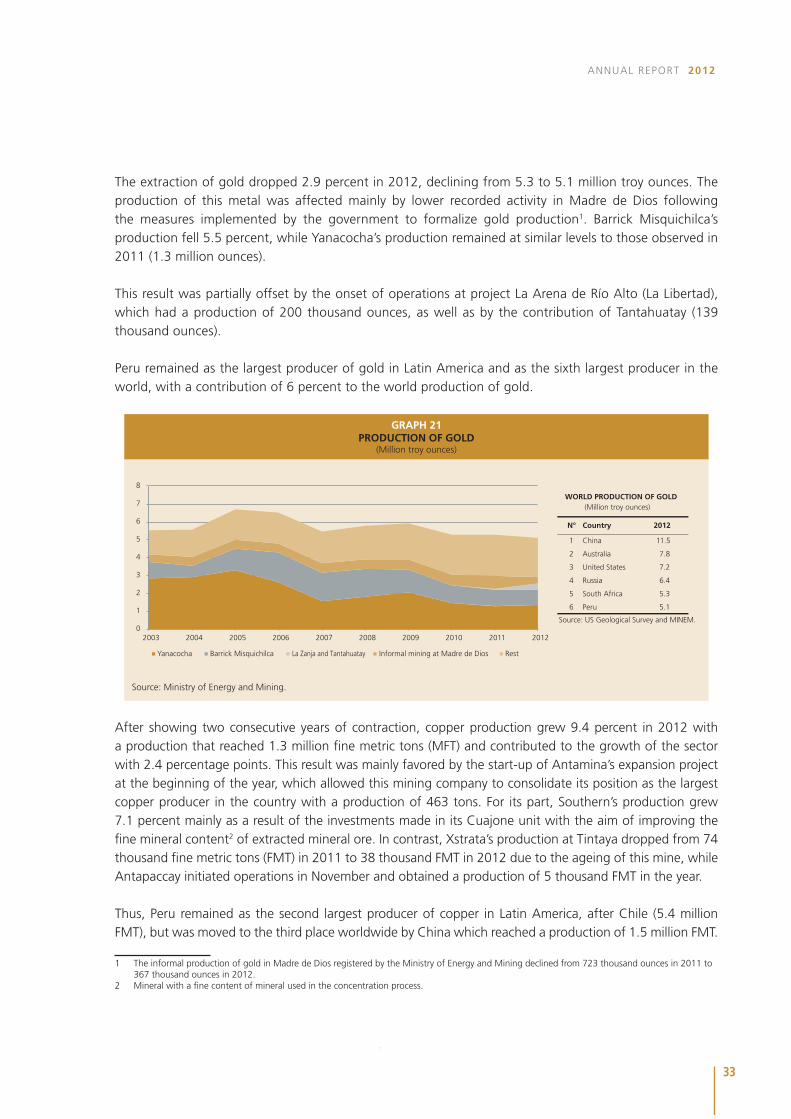
The extraction of gold dropped 2.9 percent in 2012, declining from 5.3 to 5.1 million troy ounces. The production of this metal was affected mainly by lower recorded activity in Madre de Dios following the measures implemented by the government to formalize gold production1. Barrick Misquichilca’s production fell 5.5 percent, while Yanacocha’s production remained at similar levels to those observed in 2011 (1.3 million ounces).
This result was partially offset by the onset of operations at project La Arena de Río Alto (La Libertad), which had a production of 200 thousand ounces, as well as by the contribution of Tantahuatay (139 thousand ounces).
Peru remained as the largest producer of gold in Latin America and as the sixth largest producer in the world, with a contribution of 6 percent to the world production of gold.
GRAPH 21PRODUCTION OF GOLD
(Million troy ounces)
Source: Ministry of Energy and Mining.
0
1
2
3
4
5
6
7
8
2003 2004 2005 2006 2007 2008 2009 2010 2011 2012
Rest Informal mining at Madre de Dios La Zanja and Tantahuatay Barrick Misquichilca Yanacocha
1 China
2 Australia
3 United States
4 Russia
5 South Africa
6 Peru
N° Country
11.5
7.8
7.2
6.4
5.3
5.1
Source: US Geological Survey and MINEM.
2012
WORLD PRODUCTION OF GOLD(Million troy ounces)
After showing two consecutive years of contraction, copper production grew 9.4 percent in 2012 with a production that reached 1.3 million fine metric tons (MFT) and contributed to the growth of the sector with 2.4 percentage points. This result was mainly favored by the start-up of Antamina’s expansion project at the beginning of the year, which allowed this mining company to consolidate its position as the largest copper producer in the country with a production of 463 tons. For its part, Southern’s production grew 7.1 percent mainly as a result of the investments made in its Cuajone unit with the aim of improving the fine mineral content2 of extracted mineral ore. In contrast, Xstrata’s production at Tintaya dropped from 74 thousand fine metric tons (FMT) in 2011 to 38 thousand FMT in 2012 due to the ageing of this mine, while Antapaccay initiated operations in November and obtained a production of 5 thousand FMT in the year.
Thus, Peru remained as the second largest producer of copper in Latin America, after Chile (5.4 million FMT), but was moved to the third place worldwide by China which reached a production of 1.5 million FMT.
1 The informal production of gold in Madre de Dios registered by the Ministry of Energy and Mining declined from 723 thousand ounces in 2011 to 367 thousand ounces in 2012.
2 Mineral with a fine content of mineral used in the concentration process.
34
CENTRAL RESERVE BANK OF PERU
GRAPH 22PRODUCTION OF COPPER
(Thousand fine metric tons)
Source: Ministry of Energy and Mining.
0
200
400
600
800
1,000
1,200
1,400
2003 2004 2005 2006 2007 2008 2009 2010 2011 2012
Rest Tintaya - Antapaccay Cerro Verde Southern Antamina
1 Chile
2 China
3 Peru
4 United States
5 Australia
6 Russia
5,370
1,500
1,299
1,150
970
720
N° Country
1/ Includes production of copper cathodes.
2012
WORLD PRODUCTION OF COPPER 1/
(Thousand tons)
Source: US Geological Survey and MINEM.
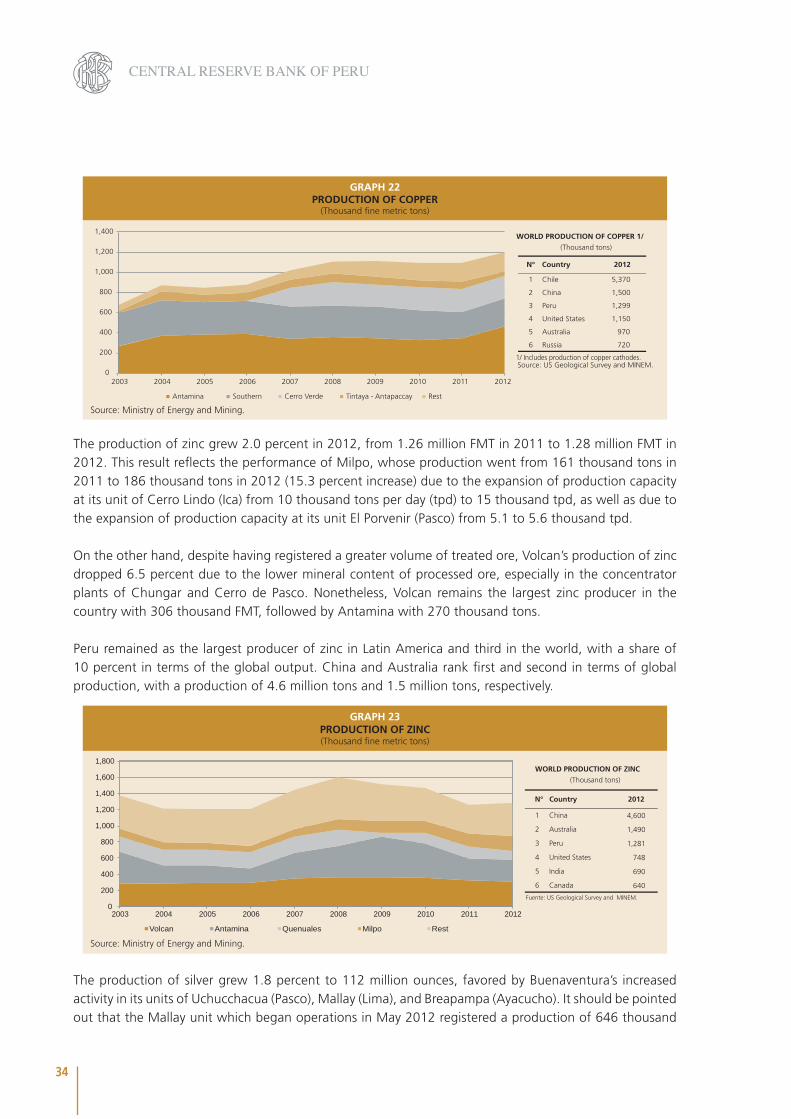
The production of zinc grew 2.0 percent in 2012, from 1.26 million FMT in 2011 to 1.28 million FMT in 2012. This result reflects the performance of Milpo, whose production went from 161 thousand tons in 2011 to 186 thousand tons in 2012 (15.3 percent increase) due to the expansion of production capacity at its unit of Cerro Lindo (Ica) from 10 thousand tons per day (tpd) to 15 thousand tpd, as well as due to the expansion of production capacity at its unit El Porvenir (Pasco) from 5.1 to 5.6 thousand tpd.
On the other hand, despite having registered a greater volume of treated ore, Volcan’s production of zinc dropped 6.5 percent due to the lower mineral content of processed ore, especially in the concentrator plants of Chungar and Cerro de Pasco. Nonetheless, Volcan remains the largest zinc producer in the country with 306 thousand FMT, followed by Antamina with 270 thousand tons.
Peru remained as the largest producer of zinc in Latin America and third in the world, with a share of 10 percent in terms of the global output. China and Australia rank first and second in terms of global production, with a production of 4.6 million tons and 1.5 million tons, respectively.
GRAPH 23PRODUCTION OF ZINC(Thousand fine metric tons)
Source: Ministry of Energy and Mining.
0
200
400
600
800
1,000
1,200
1,400
1,600
1,800
2003 2004 2005 2006 2007 2008 2009 2010 2011 2012
Rest Milpo Quenuales Antamina Volcan
1 China
2 Australia
3 Peru
4 United States
5 India
6 Canada
4,600
1,490
1,281
748
690
640
N° Country 2012
WORLD PRODUCTION OF ZINC(Thousand tons)
Fuente: US Geological Survey and MINEM.
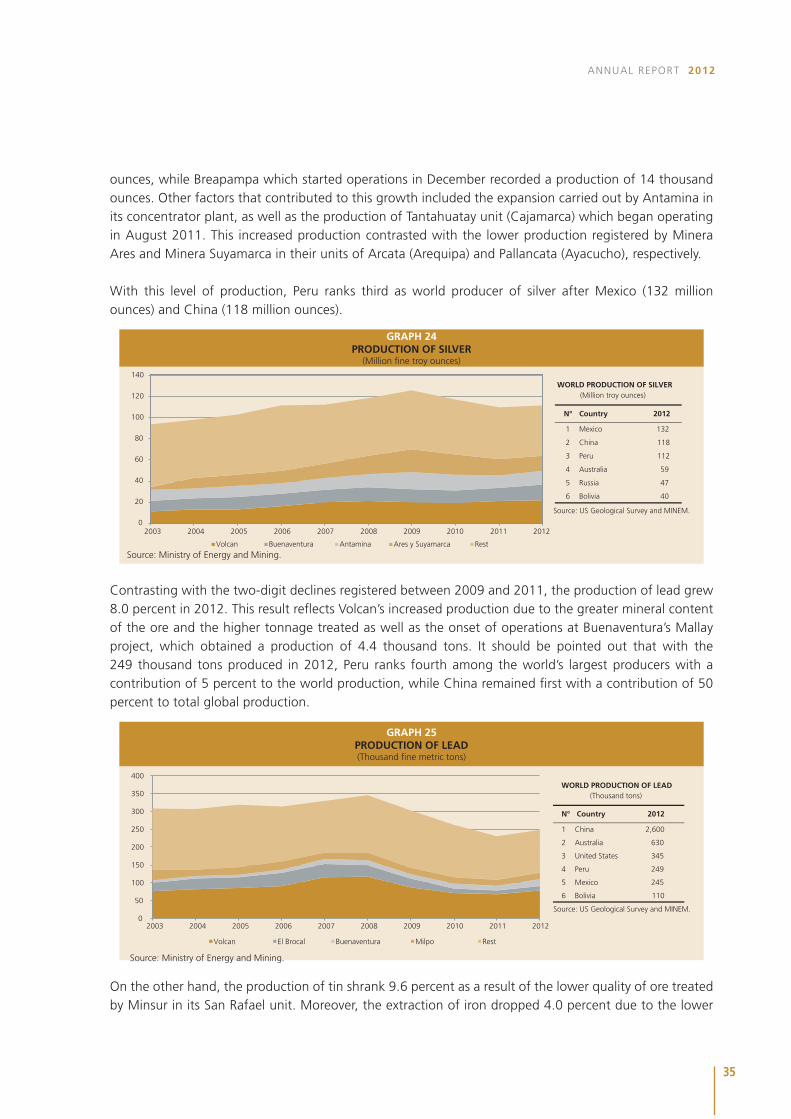
The production of silver grew 1.8 percent to 112 million ounces, favored by Buenaventura’s increased activity in its units of Uchucchacua (Pasco), Mallay (Lima), and Breapampa (Ayacucho). It should be pointed out that the Mallay unit which began operations in May 2012 registered a production of 646 thousand
35
ANNUAL REPORT 2012
ounces, while Breapampa which started operations in December recorded a production of 14 thousand ounces. Other factors that contributed to this growth included the expansion carried out by Antamina in its concentrator plant, as well as the production of Tantahuatay unit (Cajamarca) which began operating in August 2011. This increased production contrasted with the lower production registered by Minera Ares and Minera Suyamarca in their units of Arcata (Arequipa) and Pallancata (Ayacucho), respectively.
With this level of production, Peru ranks third as world producer of silver after Mexico (132 million ounces) and China (118 million ounces).
GRAPH 24PRODUCTION OF SILVER
(Million fine troy ounces)
Source: Ministry of Energy and Mining.
0
20
40
60
80
100
120
140
2003 2004 2005 2006 2007 2008 2009 2010 2011 2012
Rest Ares y Suyamarca Antamina Buenaventura Volcan
1 Mexico
2 China
3 Peru
4 Australia
5 Russia
6 Bolivia
132
118
112
59
47
40
N° Country 2012
WORLD PRODUCTION OF SILVER (Million troy ounces)
Source: US Geological Survey and MINEM.
Contrasting with the two-digit declines registered between 2009 and 2011, the production of lead grew 8.0 percent in 2012. This result reflects Volcan’s increased production due to the greater mineral content of the ore and the higher tonnage treated as well as the onset of operations at Buenaventura’s Mallay project, which obtained a production of 4.4 thousand tons. It should be pointed out that with the 249 thousand tons produced in 2012, Peru ranks fourth among the world’s largest producers with a contribution of 5 percent to the world production, while China remained first with a contribution of 50 percent to total global production.
GRAPH 25PRODUCTION OF LEAD(Thousand fine metric tons)
0
50
100
150
200
250
300
350
400
2003 2004 2005 2006 2007 2008 2009 2010 2011 2012
Rest Milpo Buenaventura El Brocal Volcan
2,600
630
345
249
245
110
1 China
2 Australia
3 United States
4 Peru
5 Mexico
6 Bolivia
N° Country
Source: US Geological Survey and MINEM.
2012
WORLD PRODUCTION OF LEAD (Thousand tons)
On the other hand, the production of tin shrank 9.6 percent as a result of the lower quality of ore treated by Minsur in its San Rafael unit. Moreover, the extraction of iron dropped 4.0 percent due to the lower
Source: Ministry of Energy and Mining.
36
CENTRAL RESERVE BANK OF PERU
activity of Shougang, while the production of molybdenum fell 12.3 percent as a result of the lower content of this metal in ores processed by Southern and Cerro Verde.
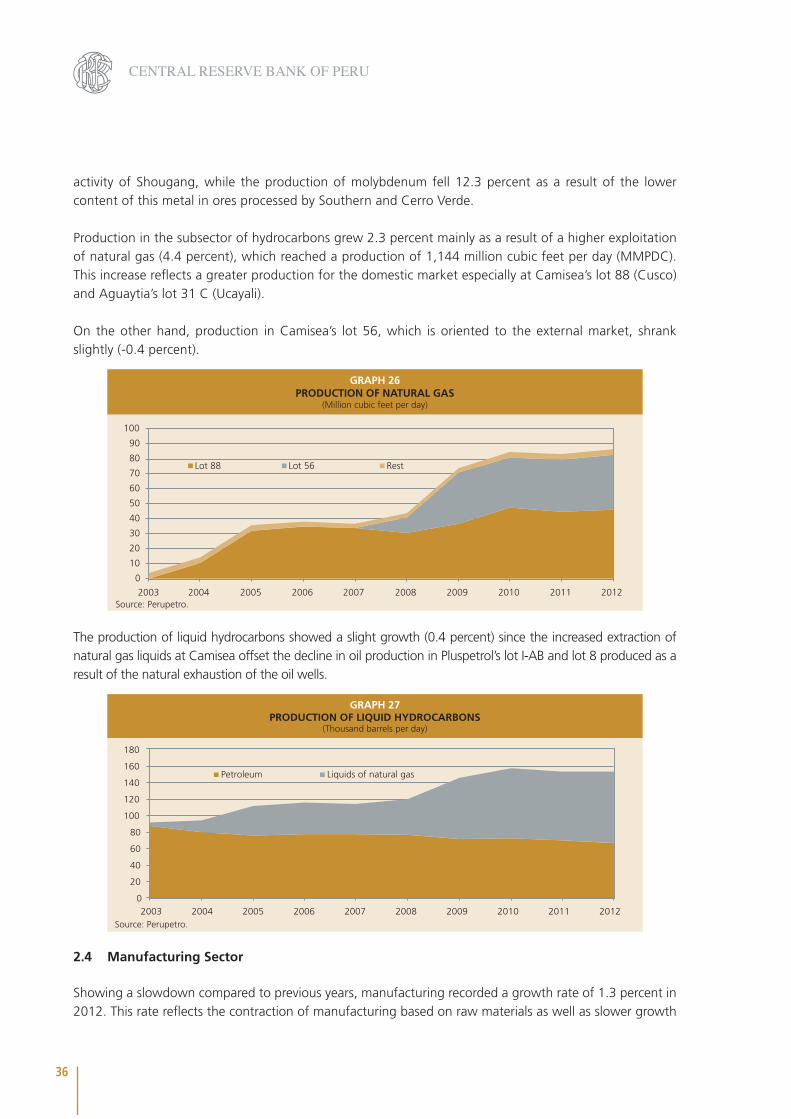
Production in the subsector of hydrocarbons grew 2.3 percent mainly as a result of a higher exploitation of natural gas (4.4 percent), which reached a production of 1,144 million cubic feet per day (MMPDC). This increase reflects a greater production for the domestic market especially at Camisea’s lot 88 (Cusco) and Aguaytia’s lot 31 C (Ucayali).
On the other hand, production in Camisea’s lot 56, which is oriented to the external market, shrank slightly (-0.4 percent).
GRAPH 26PRODUCTION OF NATURAL GAS
(Million cubic feet per day)
Source: Perupetro.
0
10
20
30
40
50
60
70
80
90
100
2003 2004 2005 2006 2007 2008 2009 2010 2011 2012
Rest Lot 56 Lot 88
The production of liquid hydrocarbons showed a slight growth (0.4 percent) since the increased extraction of natural gas liquids at Camisea offset the decline in oil production in Pluspetrol’s lot I-AB and lot 8 produced as a result of the natural exhaustion of the oil wells.
GRAPH 27PRODUCTION OF LIQUID HYDROCARBONS
(Thousand barrels per day)
Source: Perupetro.
0
20
40
60
80
100
120
140
160
180
2003 2004 2005 2006 2007 2008 2009 2010 2011 2012
Liquids of natural gas Petroleum
2.4 Manufacturing Sector
Showing a slowdown compared to previous years, manufacturing recorded a growth rate of 1.3 percent in 2012. This rate reflects the contraction of manufacturing based on raw materials as well as slower growth
37
ANNUAL REPORT 2012
in non-primary manufacturing. The lower dynamism of this subsector can be explained by lower external demand associated with the global economic slowdown and with the deceleration of private consumption, in part offset by the dynamism observed in branches associated with construction given the significant upturn shown by this sector.
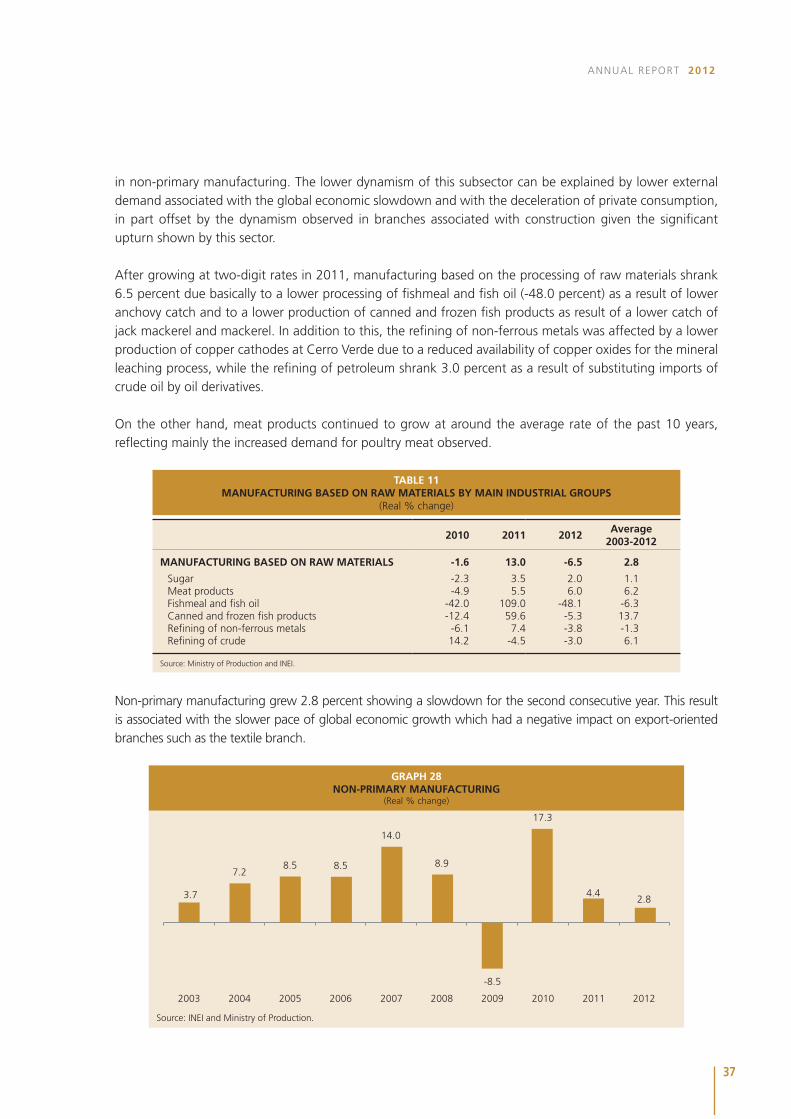
After growing at two-digit rates in 2011, manufacturing based on the processing of raw materials shrank 6.5 percent due basically to a lower processing of fishmeal and fish oil (-48.0 percent) as a result of lower anchovy catch and to a lower production of canned and frozen fish products as result of a lower catch of jack mackerel and mackerel. In addition to this, the refining of non-ferrous metals was affected by a lower production of copper cathodes at Cerro Verde due to a reduced availability of copper oxides for the mineral leaching process, while the refining of petroleum shrank 3.0 percent as a result of substituting imports of crude oil by oil derivatives. On the other hand, meat products continued to grow at around the average rate of the past 10 years, reflecting mainly the increased demand for poultry meat observed.
TABLE 11MANUFACTURING BASED ON RAW MATERIALS BY MAIN INDUSTRIAL GROUPS
(Real % change)
2010 2011 2012Average
2003-2012
MANUFACTURING BASED ON RAW MATERIALS -1.6 13.0 -6.5 2.8
Sugar -2.3 3.5 2.0 1.1Meat products -4.9 5.5 6.0 6.2Fishmeal and fish oil -42.0 109.0 -48.1 -6.3Canned and frozen fish products -12.4 59.6 -5.3 13.7Refining of non-ferrous metals -6.1 7.4 -3.8 -1.3Refining of crude 14.2 -4.5 -3.0 6.1
Source: Ministry of Production and INEI.
Non-primary manufacturing grew 2.8 percent showing a slowdown for the second consecutive year. This result is associated with the slower pace of global economic growth which had a negative impact on export-oriented branches such as the textile branch.
GRAPH 28NON-PRIMARY MANUFACTURING
(Real % change)
Source: INEI and Ministry of Production.
3.7
7.2 8.5 8.5
14.0
8.9
-8.5
17.3
4.4 2.8
2003 2004 2005 2006 2007 2008 2009 2010 2011 2012
38
CENTRAL RESERVE BANK OF PERU
TABLE 12GROWTH OF NON-PRIMARY MANUFACTURING DUE TO DOMESTIC DEMAND
(%)
2010 2011 2012Average
2003-2012
Mass consumer products 15.1 3.0 0.9 5.0Dairy products 13.1 3.6 6.7 8.1Oils and fats 15.2 -2.2 7.5 1.9Miscellaneous food products 13.2 5.6 12.7 4.3Beer and malt 6.2 4.6 3.7 5.0Soft drinks 7.1 7.8 4.1 8.7Clothing 57.0 12.0 -13.2 6.3Wood and furniture 15.8 2.3 5.8 2.8Other paper and cardboard items 21.7 1.6 4.5 -3.0Toiletries and cleaning products 6.9 5.8 0.8 6.4Pharmaceutical products -8.0 5.3 4.4 13.9Miscellaneous items 3.0 -10.9 -3.1 8.0
Inputs 18.4 10.3 5.9 7.5Paper and cardboard 18.1 13.5 0.2 5.6Paper and cardboard containers 19.4 8.5 2.4 2.3Publishing and printing 15.6 10.6 -0.1 3.5Basic chemicals 12.5 4.8 -0.1 6.7Explosives, chemical, and natural scents 17.3 15.6 27.6 8.1Rubber 21.9 8.4 -4.0 8.3Plastic 19.1 4.1 -0.9 5.9Glass 29.6 21.9 9.7 10.5
Materials for construction 16.5 2.0 11.0 10.7Paints, varnishes and lacquers 5.3 9.9 -0.3 9.8Cement 14.0 2.2 15.9 9.2Construction materials 22.3 -0.6 9.9 12.8Abrasive products 23.9 11.1 2.2 6.9
Capital goods 20.9 6.2 9.5 8.4Iron and steel industry 3.3 -4.6 6.0 4.1Metal products 30.2 8.9 5.2 10.2Machinery and equipment 5.7 62.3 11.7 2.9Electric machinery 19.1 -4.4 28.6 6.4Transport equipment 28.2 7.9 13.3 17.2
Goods for external markets 14.5 3.7 -6.5 3.7Canned food, chocolate, and alcoholic beverages 10.1 11.3 -3.0 11.6
Synthetic fibers 7.4 -0.8 -16.4 0.0Yarns, fabrics, and finished garments 22.0 5.6 -7.7 0.0Knitted garments 14.9 -9.1 -10.1 0.3
TOTAL NON-PRIMARY MANUFACTURING 17.3 4.4 2.8 6.5
Source: Ministry of Production.
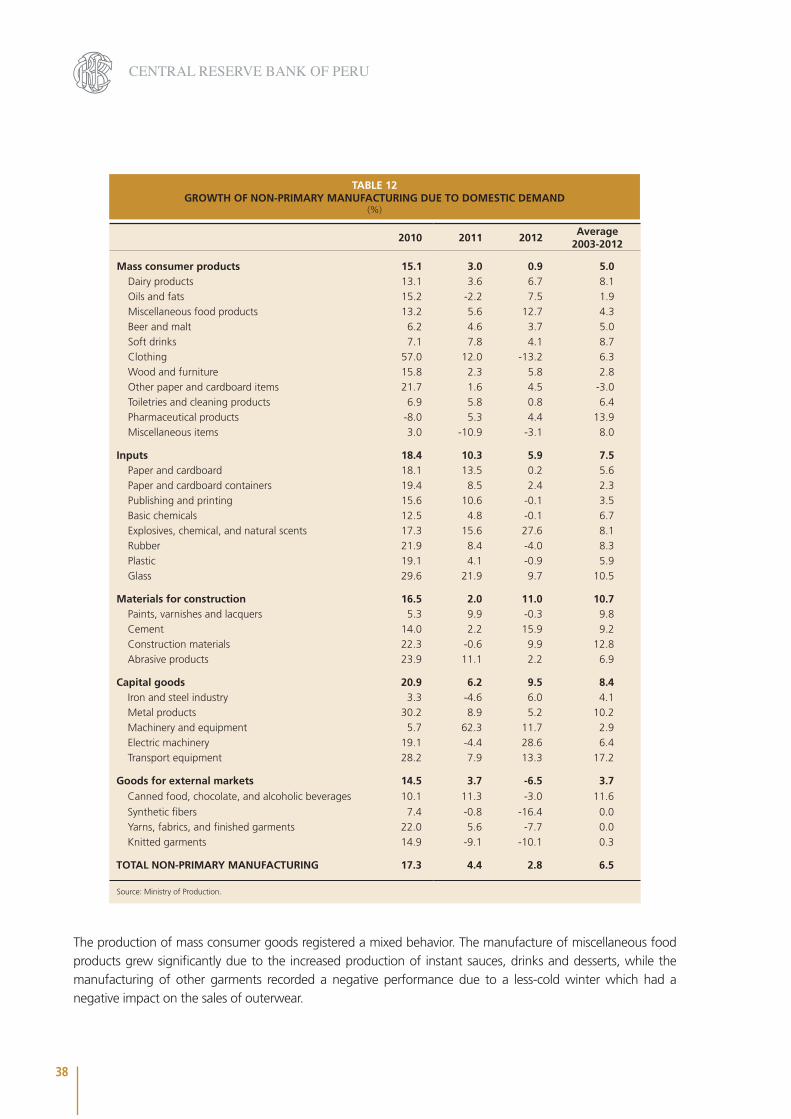
The production of mass consumer goods registered a mixed behavior. The manufacture of miscellaneous food products grew significantly due to the increased production of instant sauces, drinks and desserts, while the manufacturing of other garments recorded a negative performance due to a less-cold winter which had a negative impact on the sales of outerwear.
39
ANNUAL REPORT 2012
The production of inputs grew 5.9 percent, led by the production of explosives, glass, and chemical and natural essences. The increased production of explosives was associated with an increased demand of the mining sector, while the increase in the production of glass is explained by the high growth of construction and the higher demand for beer containers.
Moreover, construction-oriented branches showed a growth rate of 11.0 percent, which is consistent with the dynamism observed in the execution of public and private works.
The capital goods industry showed an expansion of 9.5 percent due to the increased production of electrical machinery, especially electrical distribution boards and insulated cables, and machinery and equipment associated with a higher demand in the mining sector, and of transport equipment due to the increased production of accessories and spare parts.
Finally, the external market-oriented production dropped 6.5 percent mainly as a result of a lower demand for textile products in Europe and the United States associated with weak growth in these economies.
2.5 Construction
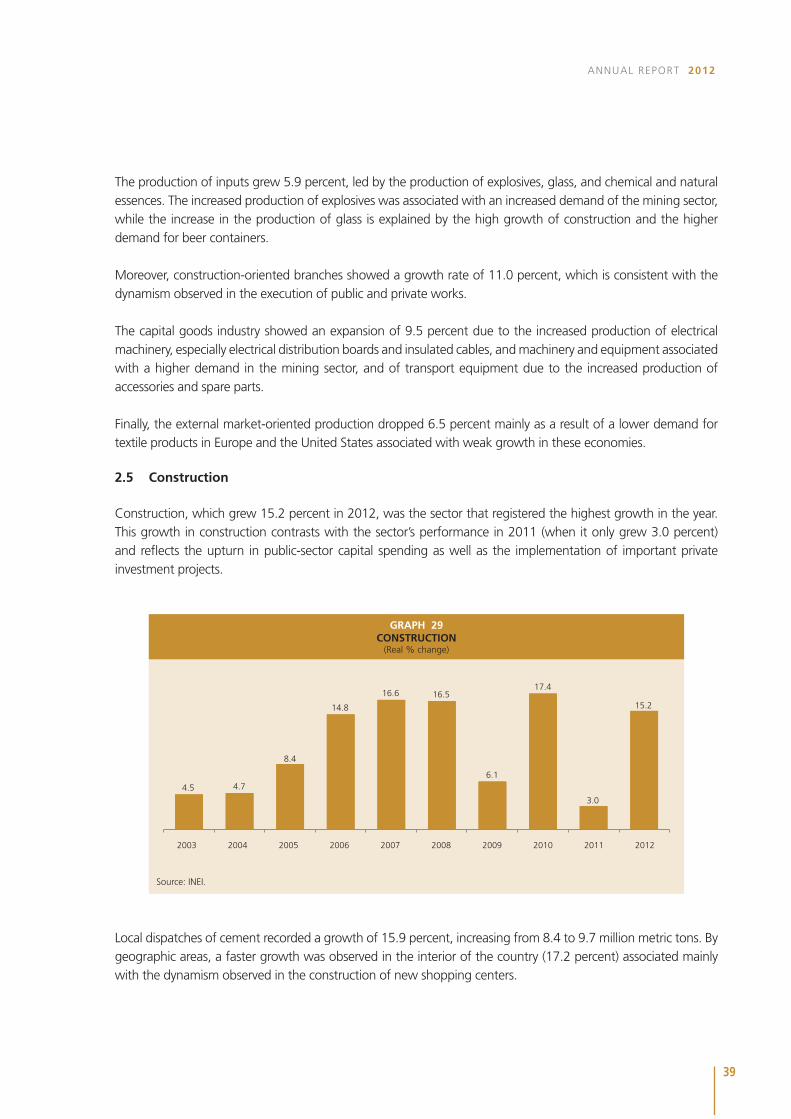
Construction, which grew 15.2 percent in 2012, was the sector that registered the highest growth in the year. This growth in construction contrasts with the sector’s performance in 2011 (when it only grew 3.0 percent) and reflects the upturn in public-sector capital spending as well as the implementation of important private investment projects.
GRAPH 29CONSTRUCTION
(Real % change)
Source: INEI.
4.5 4.7
8.4
14.8
16.6 16.5
6.1
17.4
3.0
15.2
2003 2004 2005 2006 2007 2008 2009 2010 2011 2012
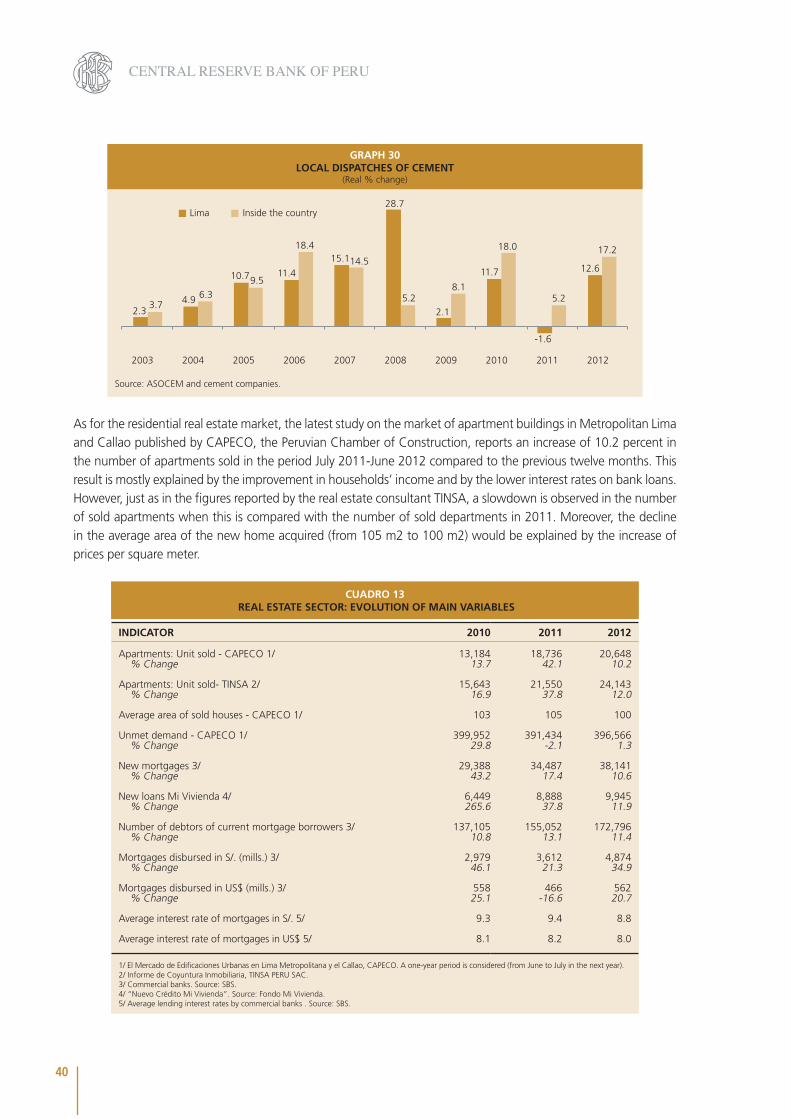
Local dispatches of cement recorded a growth of 15.9 percent, increasing from 8.4 to 9.7 million metric tons. By geographic areas, a faster growth was observed in the interior of the country (17.2 percent) associated mainly with the dynamism observed in the construction of new shopping centers.
40
CENTRAL RESERVE BANK OF PERU
GRAPH 30LOCAL DISPATCHES OF CEMENT
(Real % change)
Source: ASOCEM and cement companies.
2.3 4.9
10.7 11.4
15.1
28.7
2.1
11.7
-1.6
12.6
3.7 6.3
9.5
18.4
14.5
5.2 8.1
18.0
5.2
17.2
2003 2004 2005 2006 2007 2008 2009 2010 2011 2012
Lima Inside the country
As for the residential real estate market, the latest study on the market of apartment buildings in Metropolitan Lima and Callao published by CAPECO, the Peruvian Chamber of Construction, reports an increase of 10.2 percent in the number of apartments sold in the period July 2011-June 2012 compared to the previous twelve months. This result is mostly explained by the improvement in households’ income and by the lower interest rates on bank loans. However, just as in the figures reported by the real estate consultant TINSA, a slowdown is observed in the number of sold apartments when this is compared with the number of sold departments in 2011. Moreover, the decline in the average area of the new home acquired (from 105 m2 to 100 m2) would be explained by the increase of prices per square meter.
CUADRO 13 REAL ESTATE SECTOR: EVOLUTION OF MAIN VARIABLES
INDICATOR 2010 2011 2012
Apartments: Unit sold - CAPECO 1/ 13,184 18,736 20,648% Change 13.7 42.1 10.2
Apartments: Unit sold- TINSA 2/ 15,643 21,550 24,143% Change 16.9 37.8 12.0
Average area of sold houses - CAPECO 1/ 103 105 100
Unmet demand - CAPECO 1/ 399,952 391,434 396,566% Change 29.8 -2.1 1.3
New mortgages 3/ 29,388 34,487 38,141% Change 43.2 17.4 10.6
New loans Mi Vivienda 4/ 6,449 8,888 9,945% Change 265.6 37.8 11.9
Number of debtors of current mortgage borrowers 3/ 137,105 155,052 172,796% Change 10.8 13.1 11.4
Mortgages disbursed in S/. (mills.) 3/ 2,979 3,612 4,874% Change 46.1 21.3 34.9
Mortgages disbursed in US$ (mills.) 3/ 558 466 562% Change 25.1 -16.6 20.7
Average interest rate of mortgages in S/. 5/ 9.3 9.4 8.8
Average interest rate of mortgages in US$ 5/ 8.1 8.2 8.0
1/ El Mercado de Edificaciones Urbanas en Lima Metropolitana y el Callao, CAPECO. A one-year period is considered (from June to July in the next year).2/ Informe de Coyuntura Inmobiliaria, TINSA PERU SAC. 3/ Commercial banks. Source: SBS. 4/ “Nuevo Crédito Mi Vivienda”. Source: Fondo Mi Vivienda. 5/ Average lending interest rates by commercial banks . Source: SBS.
41
ANNUAL REPORT 2012
As regards credit for this segment, new mortgage loans grew 10.6 percent, while the new placements of the housing program Mi Vivienda grew 11.9 percent. An increase was also observed in borrowers of mortgage loans in force (up from 155 thousand in 2011 to 173 thousand in 2012).
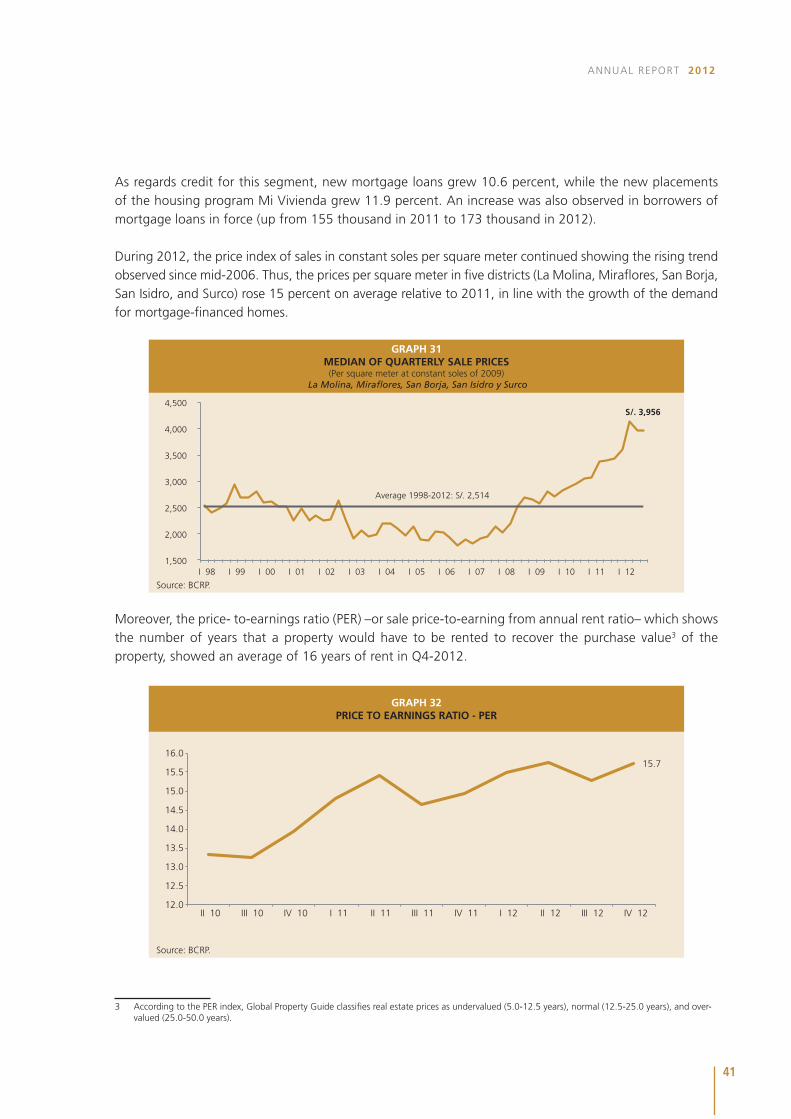
During 2012, the price index of sales in constant soles per square meter continued showing the rising trend observed since mid-2006. Thus, the prices per square meter in five districts (La Molina, Miraflores, San Borja, San Isidro, and Surco) rose 15 percent on average relative to 2011, in line with the growth of the demand for mortgage-financed homes.
GRAPH 31MEDIAN OF QUARTERLY SALE PRICES(Per square meter at constant soles of 2009)
La Molina, Miraflores, San Borja, San Isidro y Surco
Source: BCRP.
S/. 3,956
1,500
2,000
2,500
3,000
3,500
4,000
4,500
I 98 I 99 I 00 I 01 I 02 I 03 I 04 I 05 I 06 I 07 I 08 I 09 I 10 I 11 I 12
Average 1998-2012: S/. 2,514
Moreover, the price- to-earnings ratio (PER) –or sale price-to-earning from annual rent ratio– which shows the number of years that a property would have to be rented to recover the purchase value3 of the property, showed an average of 16 years of rent in Q4-2012.
GRAPH 32PRICE TO EARNINGS RATIO - PER
Source: BCRP.
15.7
12.0
12.5
13.0
13.5
14.0
14.5
15.0
15.5
16.0
II 10 III 10 IV 10 I 11 II 11 III 11 IV 11 I 12 II 12 III 12 IV 12
3 According to the PER index, Global Property Guide classifies real estate prices as undervalued (5.0-12.5 years), normal (12.5-25.0 years), and over-valued (25.0-50.0 years).
42
CENTRAL RESERVE BANK OF PERU
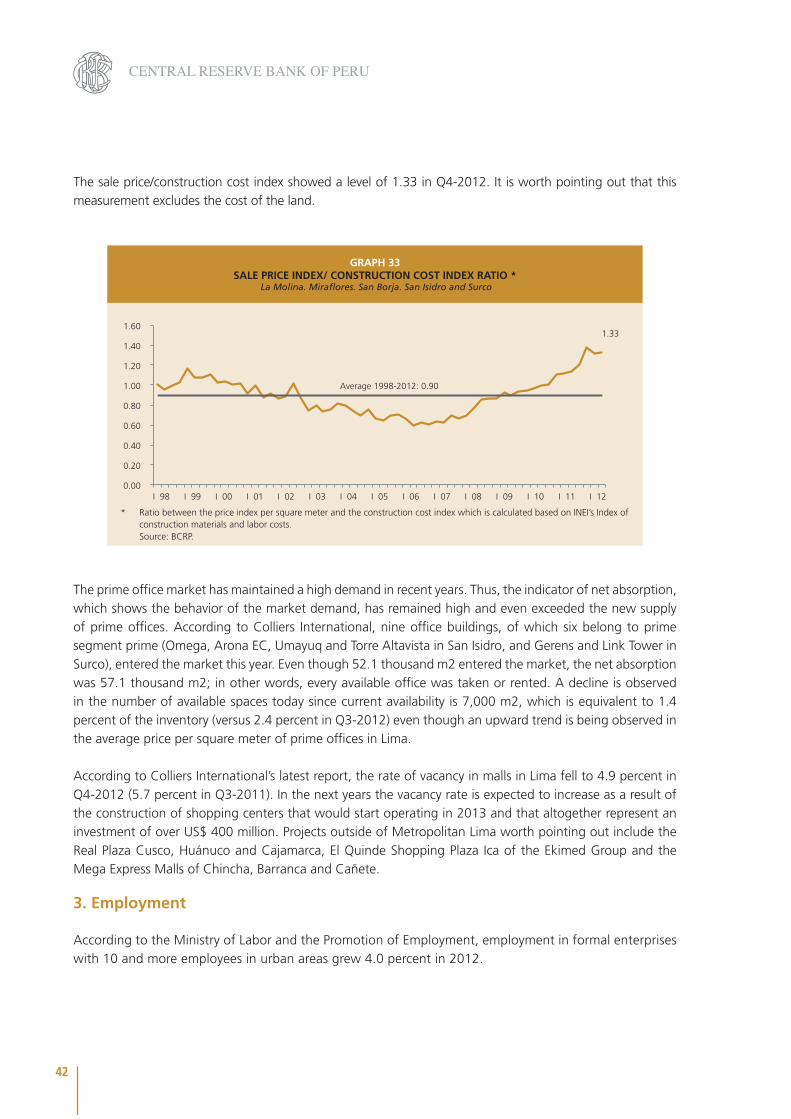
The sale price/construction cost index showed a level of 1.33 in Q4-2012. It is worth pointing out that this measurement excludes the cost of the land.
GRAPH 33SALE PRICE INDEX/ CONSTRUCTION COST INDEX RATIO *
La Molina. Miraflores. San Borja. San Isidro and Surco
Source: BCRP.
1.33
0.00
0.20
0.40
0.60
0.80
1.00
1.20
1.40
1.60
I 98 I 99 I 00 I 01 I 02 I 03 I 04 I 05 I 06 I 07 I 08 I 09 I 10 I 11 I 12
Average 1998-2012: 0.90
* Ratio between the price index per square meter and the construction cost index which is calculated based on INEI’s Index of construction materials and labor costs.
The prime office market has maintained a high demand in recent years. Thus, the indicator of net absorption, which shows the behavior of the market demand, has remained high and even exceeded the new supply of prime offices. According to Colliers International, nine office buildings, of which six belong to prime segment prime (Omega, Arona EC, Umayuq and Torre Altavista in San Isidro, and Gerens and Link Tower in Surco), entered the market this year. Even though 52.1 thousand m2 entered the market, the net absorption was 57.1 thousand m2; in other words, every available office was taken or rented. A decline is observed in the number of available spaces today since current availability is 7,000 m2, which is equivalent to 1.4 percent of the inventory (versus 2.4 percent in Q3-2012) even though an upward trend is being observed in the average price per square meter of prime offices in Lima.
According to Colliers International’s latest report, the rate of vacancy in malls in Lima fell to 4.9 percent in Q4-2012 (5.7 percent in Q3-2011). In the next years the vacancy rate is expected to increase as a result of the construction of shopping centers that would start operating in 2013 and that altogether represent an investment of over US$ 400 million. Projects outside of Metropolitan Lima worth pointing out include the Real Plaza Cusco, Huánuco and Cajamarca, El Quinde Shopping Plaza Ica of the Ekimed Group and the Mega Express Malls of Chincha, Barranca and Cañete.
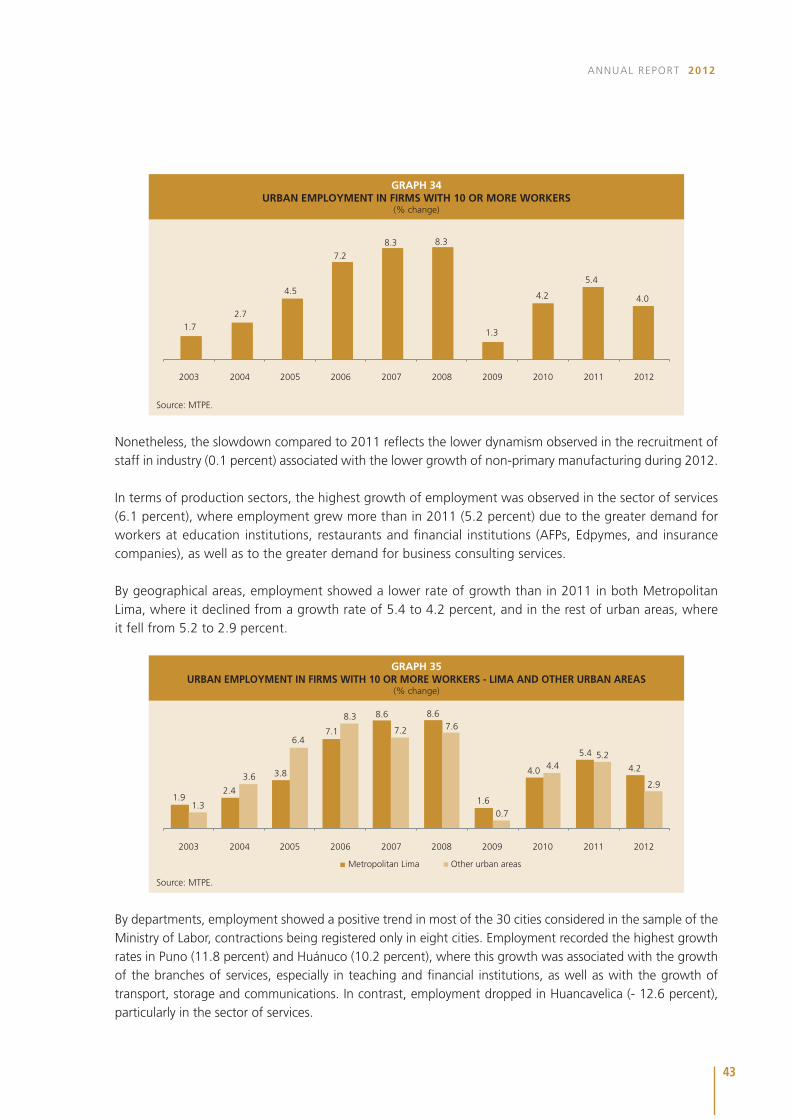
3. Employment
According to the Ministry of Labor and the Promotion of Employment, employment in formal enterprises with 10 and more employees in urban areas grew 4.0 percent in 2012.
43
ANNUAL REPORT 2012
GRAPH 34URBAN EMPLOYMENT IN FIRMS WITH 10 OR MORE WORKERS
(% change)
Source: MTPE.
1.7 2.7
4.5
7.2
8.3 8.3
1.3
4.2
5.4
4.0
2003 2004 2005 2006 2007 2008 2009 2010 2011 2012
Nonetheless, the slowdown compared to 2011 reflects the lower dynamism observed in the recruitment of staff in industry (0.1 percent) associated with the lower growth of non-primary manufacturing during 2012.
In terms of production sectors, the highest growth of employment was observed in the sector of services (6.1 percent), where employment grew more than in 2011 (5.2 percent) due to the greater demand for workers at education institutions, restaurants and financial institutions (AFPs, Edpymes, and insurance companies), as well as to the greater demand for business consulting services.
By geographical areas, employment showed a lower rate of growth than in 2011 in both Metropolitan Lima, where it declined from a growth rate of 5.4 to 4.2 percent, and in the rest of urban areas, where it fell from 5.2 to 2.9 percent.
GRAPH 35URBAN EMPLOYMENT IN FIRMS WITH 10 OR MORE WORKERS - LIMA AND OTHER URBAN AREAS
(% change)
Source: MTPE.
1.9 2.4
3.8
7.1
8.6 8.6
1.6
4.0
5.4
4.2
1.3
3.6
6.4
8.3
7.2 7.6
0.7
4.4 5.2
2.9
2003 2004 2005 2006 2007 2008 2009 2010 2011 2012
Metropolitan Lima Other urban areas
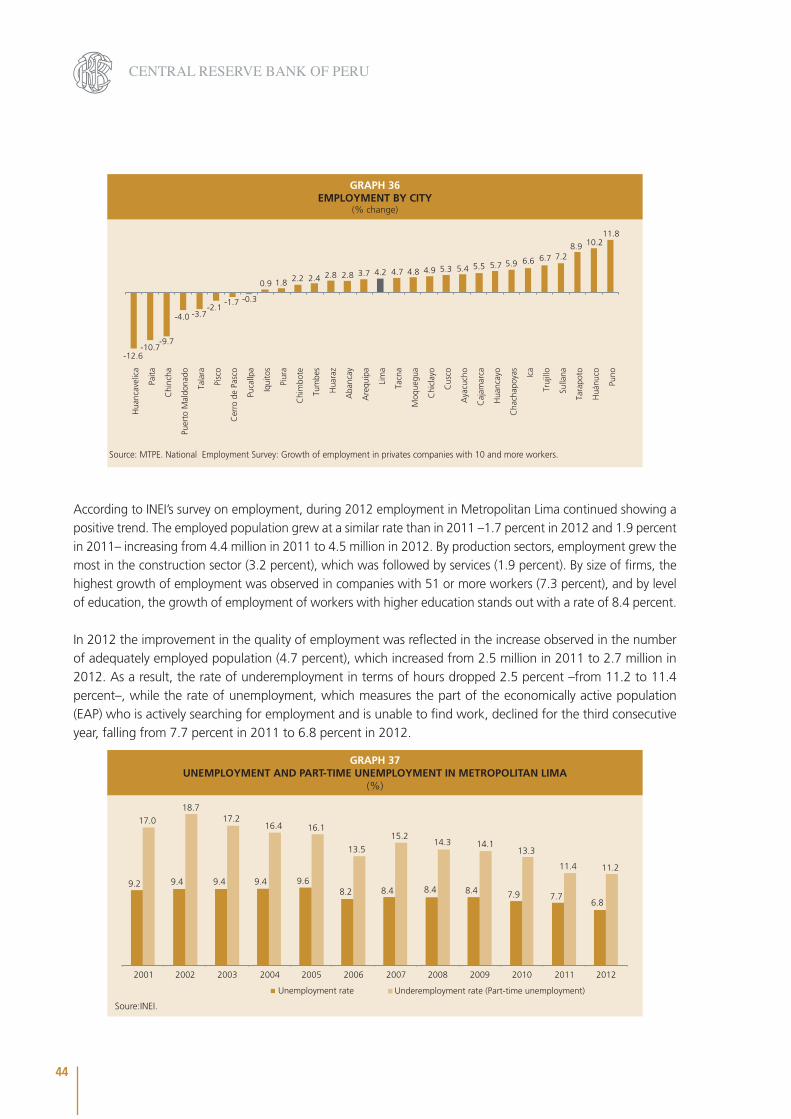
By departments, employment showed a positive trend in most of the 30 cities considered in the sample of the Ministry of Labor, contractions being registered only in eight cities. Employment recorded the highest growth rates in Puno (11.8 percent) and Huánuco (10.2 percent), where this growth was associated with the growth of the branches of services, especially in teaching and financial institutions, as well as with the growth of transport, storage and communications. In contrast, employment dropped in Huancavelica (- 12.6 percent), particularly in the sector of services.
44
CENTRAL RESERVE BANK OF PERU
GRAPH 36EMPLOYMENT BY CITY
(% change)
Source: MTPE. National Employment Survey: Growth of employment in privates companies with 10 and more workers.
-12.6 -10.7
-9.7
-4.0 -3.7 -2.1
-1.7 -0.3
0.9 1.8 2.2 2.4 2.8 2.8 3.7 4.2 4.7 4.8 4.9 5.3 5.4 5.5 5.7 5.9 6.6 6.7 7.2 8.9 10.2
11.8
Hua
ncav
elic
a
Paita
Chi
ncha
Puer
to M
aldo
nado
Tala
ra
Pisc
o
Cer
ro d
e Pa
sco
Puca
llpa
Iqui
tos
Piur
a
Tum
bes
Hua
raz
Chi
mbo
te
Aba
ncay
Are
quip
a
Lim
a
Moq
uegu
a
Cha
chap
oyas
Tacn
a
Chi
clay
o
Cus
co
Aya
cuch
o
Sulla
na
Hua
ncay
o
Caj
amar
ca Ica
Truj
illo
Tara
poto
Huá
nuco
Puno
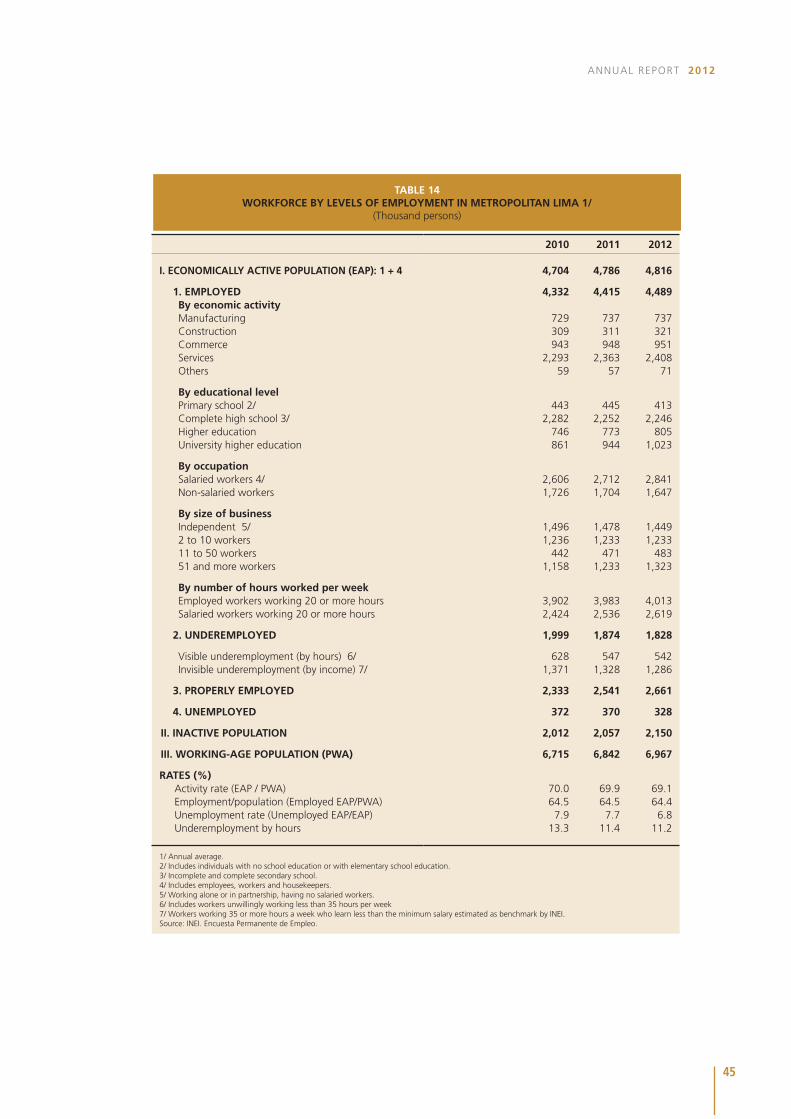
According to INEI’s survey on employment, during 2012 employment in Metropolitan Lima continued showing a positive trend. The employed population grew at a similar rate than in 2011 –1.7 percent in 2012 and 1.9 percent in 2011– increasing from 4.4 million in 2011 to 4.5 million in 2012. By production sectors, employment grew the most in the construction sector (3.2 percent), which was followed by services (1.9 percent). By size of firms, the highest growth of employment was observed in companies with 51 or more workers (7.3 percent), and by level of education, the growth of employment of workers with higher education stands out with a rate of 8.4 percent.
In 2012 the improvement in the quality of employment was reflected in the increase observed in the number of adequately employed population (4.7 percent), which increased from 2.5 million in 2011 to 2.7 million in 2012. As a result, the rate of underemployment in terms of hours dropped 2.5 percent –from 11.2 to 11.4 percent–, while the rate of unemployment, which measures the part of the economically active population (EAP) who is actively searching for employment and is unable to find work, declined for the third consecutive year, falling from 7.7 percent in 2011 to 6.8 percent in 2012.
GRAPH 37UNEMPLOYMENT AND PART-TIME UNEMPLOYMENT IN METROPOLITAN LIMA
(%)
Soure:INEI.
9.2 9.4 9.4 9.4 9.6 8.2 8.4 8.4 8.4 7.9 7.7
6.8
17.0
18.7 17.2
16.4 16.1
13.5
15.2 14.3 14.1
13.3
11.4 11.2
2001 2002 2003 2004 2005 2006 2007 2008 2009 2010 2011 2012
Unemployment rate Underemployment rate (Part-time unemployment)
45
ANNUAL REPORT 2012
2010 2011 2012
I. ECONOMICALLY ACTIVE POPULATION (EAP): 1 + 4 4,704 4,786 4,816
1. EMPLOYED 4,332 4,415 4,489By economic activityManufacturing 729 737 737Construction 309 311 321Commerce 943 948 951Services 2,293 2,363 2,408Others 59 57 71
By educational levelPrimary school 2/ 443 445 413Complete high school 3/ 2,282 2,252 2,246Higher education 746 773 805University higher education 861 944 1,023
By occupationSalaried workers 4/ 2,606 2,712 2,841Non-salaried workers 1,726 1,704 1,647
By size of businessIndependent 5/ 1,496 1,478 1,4492 to 10 workers 1,236 1,233 1,23311 to 50 workers 442 471 48351 and more workers 1,158 1,233 1,323
By number of hours worked per weekEmployed workers working 20 or more hours 3,902 3,983 4,013Salaried workers working 20 or more hours 2,424 2,536 2,619
2. UNDEREMPLOYED 1,999 1,874 1,828
Visible underemployment (by hours) 6/ 628 547 542Invisible underemployment (by income) 7/ 1,371 1,328 1,286
3. PROPERLY EMPLOYED 2,333 2,541 2,661
4. UNEMPLOYED 372 370 328
II. INACTIVE POPULATION 2,012 2,057 2,150
III. WORKING-AGE POPULATION (PWA) 6,715 6,842 6,967
RATES (%) Activity rate (EAP / PWA) 70.0 69.9 69.1Employment/population (Employed EAP/PWA) 64.5 64.5 64.4Unemployment rate (Unemployed EAP/EAP) 7.9 7.7 6.8Underemployment by hours 13.3 11.4 11.2
1/ Annual average. 2/ Includes individuals with no school education or with elementary school education. 3/ Incomplete and complete secondary school. 4/ Includes employees, workers and housekeepers. 5/ Working alone or in partnership, having no salaried workers. 6/ Includes workers unwillingly working less than 35 hours per week 7/ Workers working 35 or more hours a week who learn less than the minimum salary estimated as benchmark by INEI. Source: INEI. Encuesta Permanente de Empleo.
TABLE 14WORKFORCE BY LEVELS OF EMPLOYMENT IN METROPOLITAN LIMA 1/
(Thousand persons)
46
CENTRAL RESERVE BANK OF PERU
BOX 1
INCIDENCE OF TOTAL POVERTY 20114
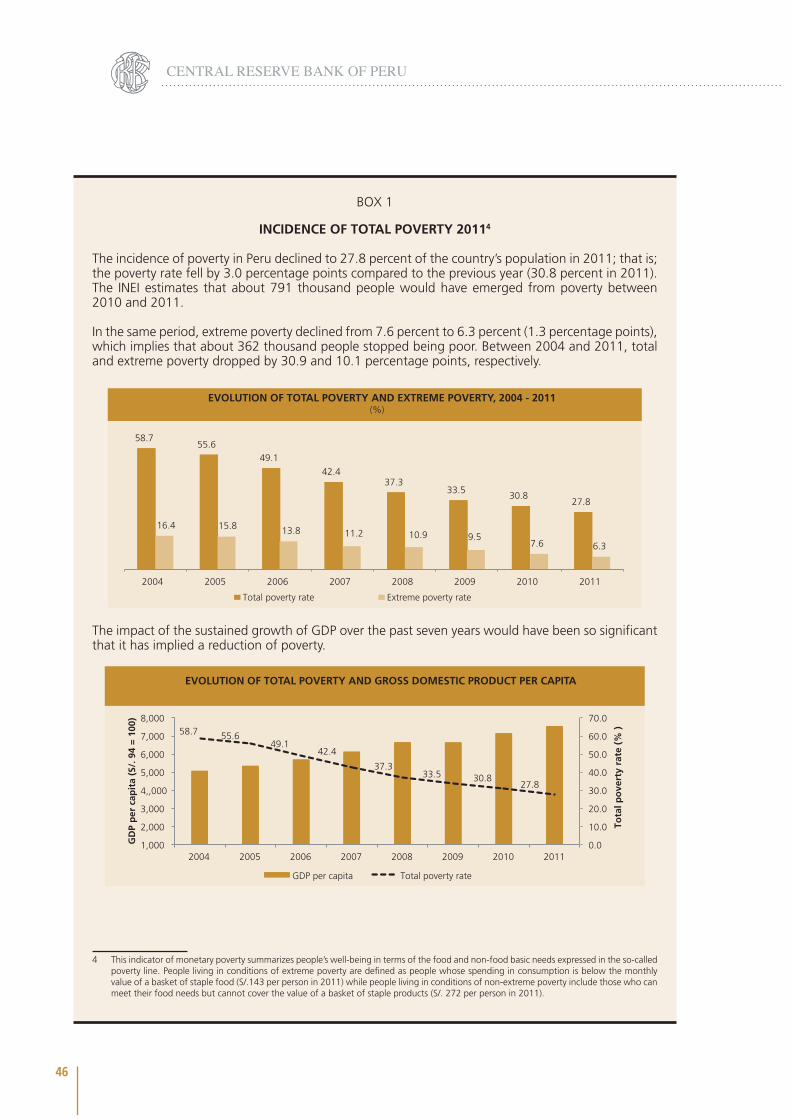
The incidence of poverty in Peru declined to 27.8 percent of the country’s population in 2011; that is; the poverty rate fell by 3.0 percentage points compared to the previous year (30.8 percent in 2011). The INEI estimates that about 791 thousand people would have emerged from poverty between 2010 and 2011.
In the same period, extreme poverty declined from 7.6 percent to 6.3 percent (1.3 percentage points), which implies that about 362 thousand people stopped being poor. Between 2004 and 2011, total and extreme poverty dropped by 30.9 and 10.1 percentage points, respectively.
(%)EVOLUTION OF TOTAL POVERTY AND EXTREME POVERTY, 2004 - 2011
58.7 55.6
49.1 42.4
37.3 33.5
30.8 27.8
16.4 15.8 13.8 11.2 10.9 9.5 7.6 6.3
2004 2005 2006 2007 2008 2009 2010 2011
Total poverty rate Extreme poverty rate
The impact of the sustained growth of GDP over the past seven years would have been so significant that it has implied a reduction of poverty.
EVOLUTION OF TOTAL POVERTY AND GROSS DOMESTIC PRODUCT PER CAPITA
58.7 55.6 49.1
42.4
37.3 33.5 30.8
27.8
0.0
10.0
20.0
30.0
40.0
50.0
60.0
70.0
1,000
2,000
3,000
4,,000
5,000
6,000
7,000
8,000
2004 2005 2006 2007 2008 2009 2010 2011
Tota
l po
vert
y ra
te (
% )
GD
P p
er c
apit
a (S
/. 9
4 =
100
)
GDP per capita Total poverty rate
4 This indicator of monetary poverty summarizes people’s well-being in terms of the food and non-food basic needs expressed in the so-called poverty line. People living in conditions of extreme poverty are defined as people whose spending in consumption is below the monthly value of a basket of staple food (S/.143 per person in 2011) while people living in conditions of non-extreme poverty include those who can meet their food needs but cannot cover the value of a basket of staple products (S/. 272 per person in 2011).
47
ANNUAL REPORT 2012
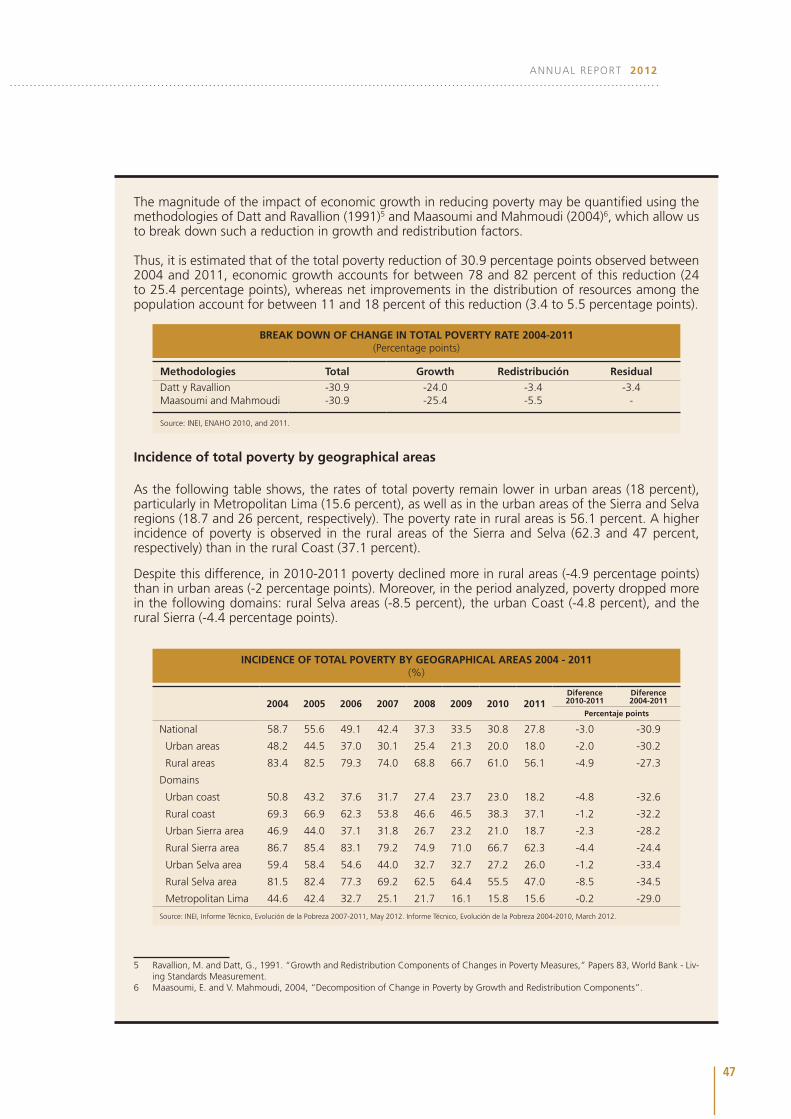
The magnitude of the impact of economic growth in reducing poverty may be quantified using the methodologies of Datt and Ravallion (1991)5 and Maasoumi and Mahmoudi (2004)6, which allow us to break down such a reduction in growth and redistribution factors.
Thus, it is estimated that of the total poverty reduction of 30.9 percentage points observed between 2004 and 2011, economic growth accounts for between 78 and 82 percent of this reduction (24 to 25.4 percentage points), whereas net improvements in the distribution of resources among the population account for between 11 and 18 percent of this reduction (3.4 to 5.5 percentage points).
Methodologies Total Growth Redistribución Residual
Datt y Ravallion -30.9 -24.0 -3.4 -3.4Maasoumi and Mahmoudi -30.9 -25.4 -5.5 -
Source: INEI, ENAHO 2010, and 2011.
BREAK DOWN OF CHANGE IN TOTAL POVERTY RATE 2004-2011(Percentage points)
Incidence of total poverty by geographical areas
As the following table shows, the rates of total poverty remain lower in urban areas (18 percent), particularly in Metropolitan Lima (15.6 percent), as well as in the urban areas of the Sierra and Selva regions (18.7 and 26 percent, respectively). The poverty rate in rural areas is 56.1 percent. A higher incidence of poverty is observed in the rural areas of the Sierra and Selva (62.3 and 47 percent, respectively) than in the rural Coast (37.1 percent).
Despite this difference, in 2010-2011 poverty declined more in rural areas (-4.9 percentage points) than in urban areas (-2 percentage points). Moreover, in the period analyzed, poverty dropped more in the following domains: rural Selva areas (-8.5 percent), the urban Coast (-4.8 percent), and the rural Sierra (-4.4 percentage points).
2004 2005 2006 2007 2008 2009 2010 2011Diference2010-2011
Diference2004-2011
Percentaje points
National 58.7 55.6 49.1 42.4 37.3 33.5 30.8 27.8 -3.0 -30.9
Urban areas 48.2 44.5 37.0 30.1 25.4 21.3 20.0 18.0 -2.0 -30.2
Rural areas 83.4 82.5 79.3 74.0 68.8 66.7 61.0 56.1 -4.9 -27.3
Domains
Urban coast 50.8 43.2 37.6 31.7 27.4 23.7 23.0 18.2 -4.8 -32.6
Rural coast 69.3 66.9 62.3 53.8 46.6 46.5 38.3 37.1 -1.2 -32.2
Urban Sierra area 46.9 44.0 37.1 31.8 26.7 23.2 21.0 18.7 -2.3 -28.2
Rural Sierra area 86.7 85.4 83.1 79.2 74.9 71.0 66.7 62.3 -4.4 -24.4
Urban Selva area 59.4 58.4 54.6 44.0 32.7 32.7 27.2 26.0 -1.2 -33.4
Rural Selva area 81.5 82.4 77.3 69.2 62.5 64.4 55.5 47.0 -8.5 -34.5
Metropolitan Lima 44.6 42.4 32.7 25.1 21.7 16.1 15.8 15.6 -0.2 -29.0
Source: INEI, Informe Técnico, Evolución de la Pobreza 2007-2011, May 2012. Informe Técnico, Evolución de la Pobreza 2004-2010, March 2012.
INCIDENCE OF TOTAL POVERTY BY GEOGRAPHICAL AREAS 2004 - 2011(%)
5 Ravallion, M. and Datt, G., 1991. “Growth and Redistribution Components of Changes in Poverty Measures,” Papers 83, World Bank - Liv-ing Standards Measurement.
6 Maasoumi, E. and V. Mahmoudi, 2004, “Decomposition of Change in Poverty by Growth and Redistribution Components”.
48
CENTRAL RESERVE BANK OF PERU
Incidence of total poverty by department
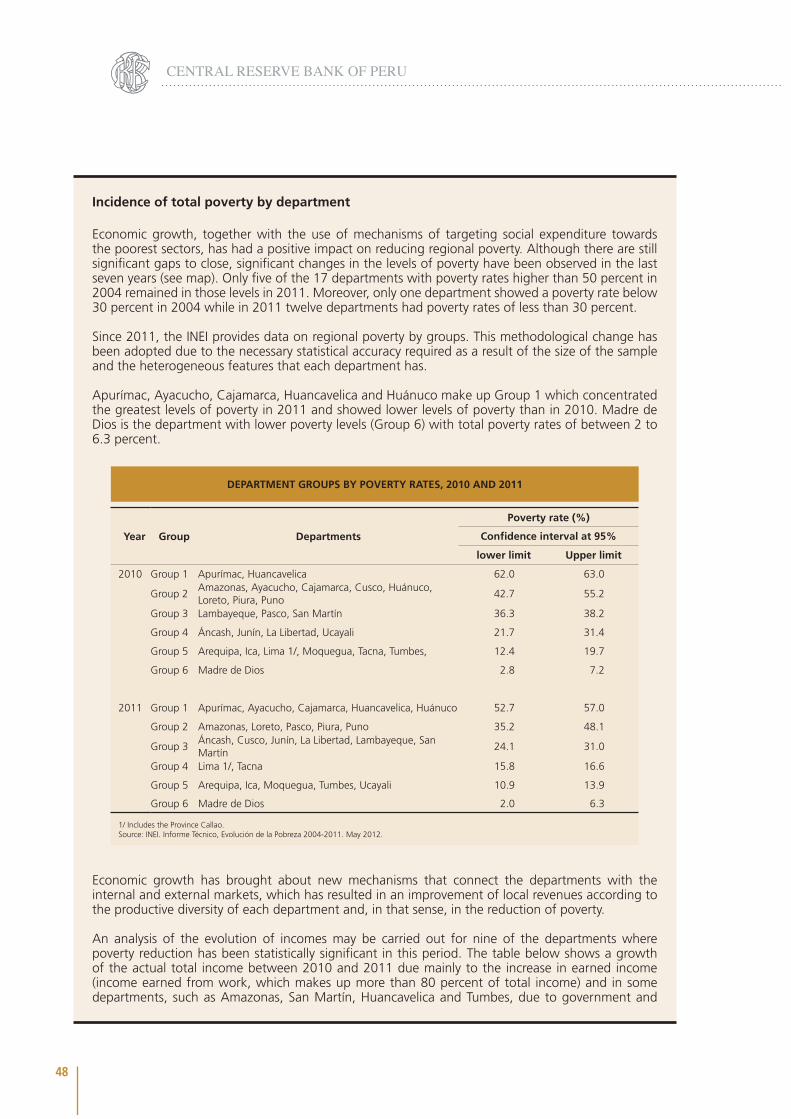
Economic growth, together with the use of mechanisms of targeting social expenditure towards the poorest sectors, has had a positive impact on reducing regional poverty. Although there are still significant gaps to close, significant changes in the levels of poverty have been observed in the last seven years (see map). Only five of the 17 departments with poverty rates higher than 50 percent in 2004 remained in those levels in 2011. Moreover, only one department showed a poverty rate below 30 percent in 2004 while in 2011 twelve departments had poverty rates of less than 30 percent.
Since 2011, the INEI provides data on regional poverty by groups. This methodological change has been adopted due to the necessary statistical accuracy required as a result of the size of the sample and the heterogeneous features that each department has.
Apurímac, Ayacucho, Cajamarca, Huancavelica and Huánuco make up Group 1 which concentrated the greatest levels of poverty in 2011 and showed lower levels of poverty than in 2010. Madre de Dios is the department with lower poverty levels (Group 6) with total poverty rates of between 2 to 6.3 percent.
Year Group Departments
Poverty rate (%)
Confidence interval at 95%
lower limit Upper limit
2010 Group 1 Apurímac, Huancavelica 62.0 63.0
Group 2Amazonas, Ayacucho, Cajamarca, Cusco, Huánuco, Loreto, Piura, Puno
42.7 55.2
Group 3 Lambayeque, Pasco, San Martín 36.3 38.2
Group 4 Áncash, Junín, La Libertad, Ucayali 21.7 31.4
Group 5 Arequipa, Ica, Lima 1/, Moquegua, Tacna, Tumbes, 12.4 19.7
Group 6 Madre de Dios 2.8 7.2
2011 Group 1 Apurímac, Ayacucho, Cajamarca, Huancavelica, Huánuco 52.7 57.0
Group 2 Amazonas, Loreto, Pasco, Piura, Puno 35.2 48.1
Group 3Áncash, Cusco, Junín, La Libertad, Lambayeque, San Martín
24.1 31.0
Group 4 Lima 1/, Tacna 15.8 16.6
Group 5 Arequipa, Ica, Moquegua, Tumbes, Ucayali 10.9 13.9
Group 6 Madre de Dios 2.0 6.3
1/ Includes the Province Callao. Source: INEI. Informe Técnico, Evolución de la Pobreza 2004-2011. May 2012.
DEPARTMENT GROUPS BY POVERTY RATES, 2010 AND 2011
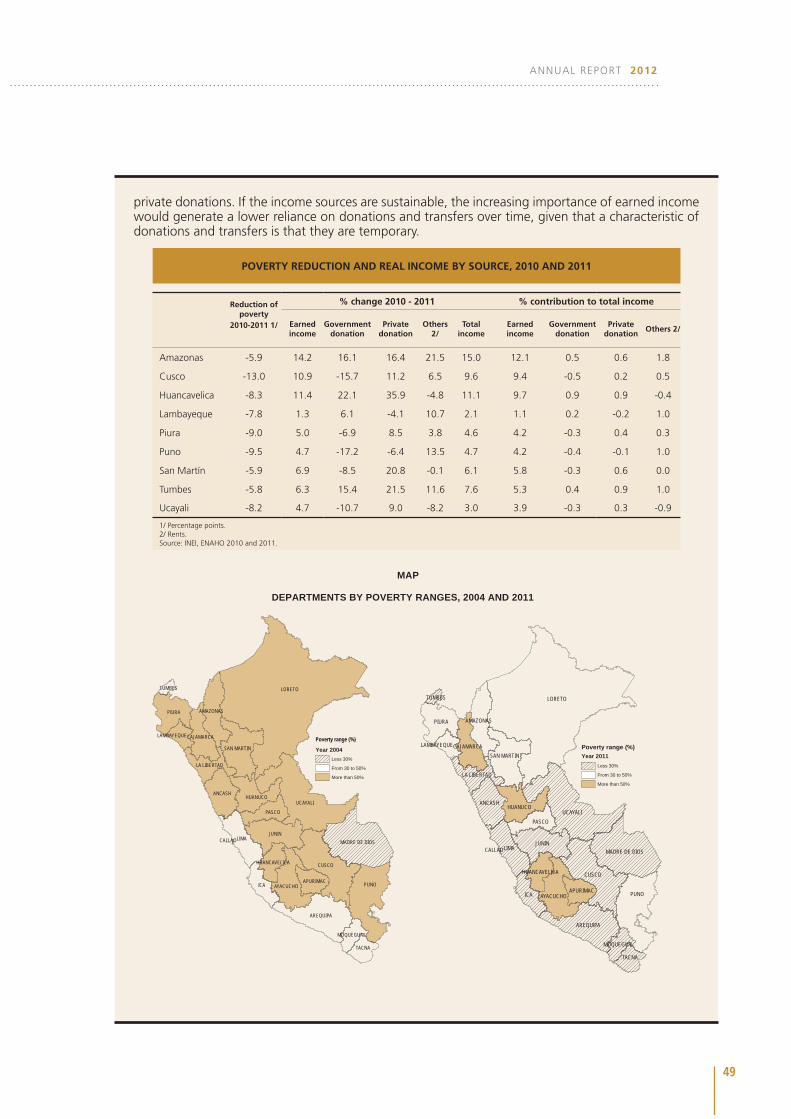
Economic growth has brought about new mechanisms that connect the departments with the internal and external markets, which has resulted in an improvement of local revenues according to the productive diversity of each department and, in that sense, in the reduction of poverty.
An analysis of the evolution of incomes may be carried out for nine of the departments where poverty reduction has been statistically significant in this period. The table below shows a growth of the actual total income between 2010 and 2011 due mainly to the increase in earned income (income earned from work, which makes up more than 80 percent of total income) and in some departments, such as Amazonas, San Martín, Huancavelica and Tumbes, due to government and
49
ANNUAL REPORT 2012
private donations. If the income sources are sustainable, the increasing importance of earned income would generate a lower reliance on donations and transfers over time, given that a characteristic of donations and transfers is that they are temporary.
POVERTY REDUCTION AND REAL INCOME BY SOURCE, 2010 AND 2011
Reduction of poverty
2010-2011 1/
% change 2010 - 2011 % contribution to total income
Earnedincome
Government donation
Private donation
Others 2/
Total income
Earnedincome
Government donation
Private donation
Others 2/
Amazonas -5.9 14.2 16.1 16.4 21.5 15.0 12.1 0.5 0.6 1.8
Cusco -13.0 10.9 -15.7 11.2 6.5 9.6 9.4 -0.5 0.2 0.5
Huancavelica -8.3 11.4 22.1 35.9 -4.8 11.1 9.7 0.9 0.9 -0.4
Lambayeque -7.8 1.3 6.1 -4.1 10.7 2.1 1.1 0.2 -0.2 1.0
Piura -9.0 5.0 -6.9 8.5 3.8 4.6 4.2 -0.3 0.4 0.3
Puno -9.5 4.7 -17.2 -6.4 13.5 4.7 4.2 -0.4 -0.1 1.0
San Martín -5.9 6.9 -8.5 20.8 -0.1 6.1 5.8 -0.3 0.6 0.0
Tumbes -5.8 6.3 15.4 21.5 11.6 7.6 5.3 0.4 0.9 1.0
Ucayali -8.2 4.7 -10.7 9.0 -8.2 3.0 3.9 -0.3 0.3 -0.9
1/ Percentage points.2/ Rents.Source: INEI, ENAHO 2010 and 2011.
MAP
DEPARTMENTS BY POVERTY RANGES, 2004 AND 2011
LORETO
UCAYALI
PUNO
CUSCO
LIMAJUNIN
ICA
AREQUIPA
PIURA
MADRE DE DIOS
ANCASH
SAN MARTIN
AYACUCHO
HUANUCO
PASCO
TACNA
APURIMAC
AMAZONAS
CAJAMARCA
LA LIBERTAD
HUANCAVELICA
MOQUEGUA
LAMBAYEQUE
TUMBES
CALLAO
Poverty range (%)
Year 2004Less 30%
From 30 to 50%
More than 50%
LORETO
UCAYALI
PUNO
CUSCO
LIMAJUNIN
ICA
AREQUIPA
PIURA
MADRE DE DIOS
ANCASH
SAN MARTIN
AYACUCHO
HUANUCO
PASCO
TACNA
APURIMAC
AMAZONAS
CAJAMARCA
LA LIBERTAD
HUANCAVELICA
MOQUEGUA
LAMBAYEQUE
TUMBES
CALLAO
Poverty range (%)Year 2011
Less 30%
From 30 to 50%
More than 50%
50
CENTRAL RESERVE BANK OF PERU
BOX 2
LIVING CONDITIONS IN PERU
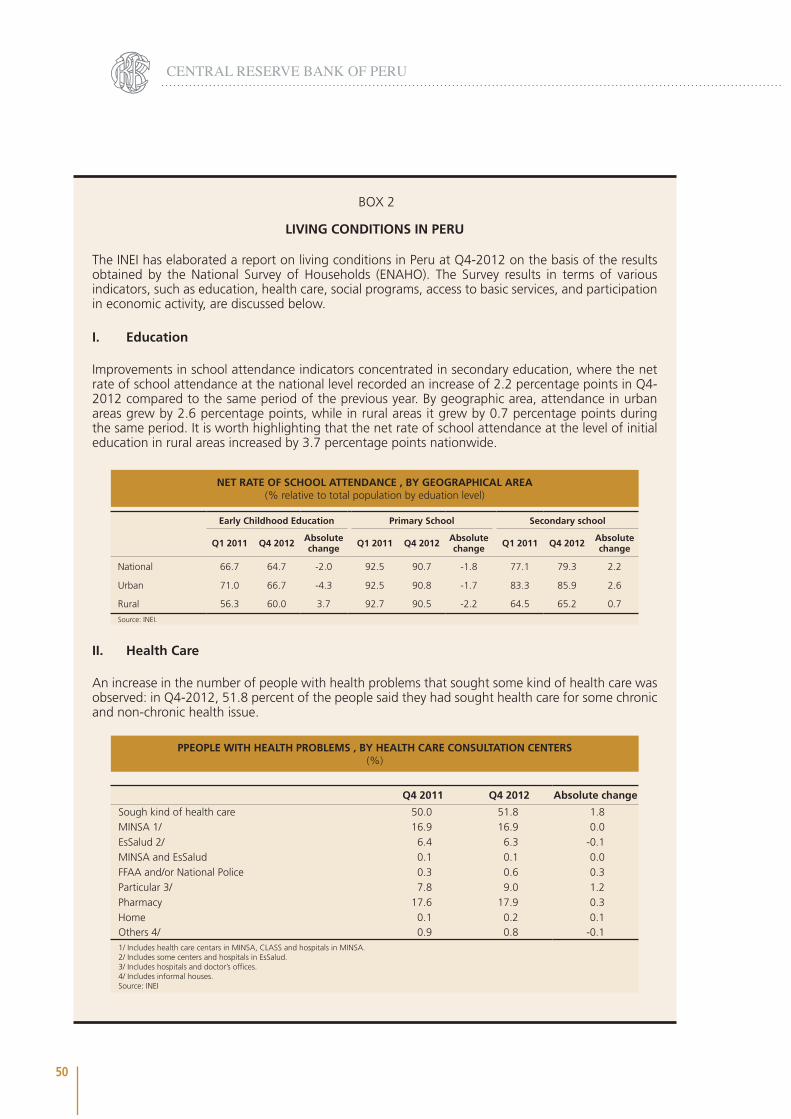
The INEI has elaborated a report on living conditions in Peru at Q4-2012 on the basis of the results obtained by the National Survey of Households (ENAHO). The Survey results in terms of various indicators, such as education, health care, social programs, access to basic services, and participation in economic activity, are discussed below.
I. Education
Improvements in school attendance indicators concentrated in secondary education, where the net rate of school attendance at the national level recorded an increase of 2.2 percentage points in Q4-2012 compared to the same period of the previous year. By geographic area, attendance in urban areas grew by 2.6 percentage points, while in rural areas it grew by 0.7 percentage points during the same period. It is worth highlighting that the net rate of school attendance at the level of initial education in rural areas increased by 3.7 percentage points nationwide.
Early Childhood Education Primary School Secondary school
Q1 2011 Q4 2012 Absolute change Q1 2011 Q4 2012 Absolute
change Q1 2011 Q4 2012 Absolute change
National 66.7 64.7 -2.0 92.5 90.7 -1.8 77.1 79.3 2.2
Urban 71.0 66.7 -4.3 92.5 90.8 -1.7 83.3 85.9 2.6
Rural 56.3 60.0 3.7 92.7 90.5 -2.2 64.5 65.2 0.7
Source: INEI.
NET RATE OF SCHOOL ATTENDANCE , BY GEOGRAPHICAL AREA(% relative to total population by eduation level)
II. Health Care
An increase in the number of people with health problems that sought some kind of health care was observed: in Q4-2012, 51.8 percent of the people said they had sought health care for some chronic and non-chronic health issue.
Q4 2011 Q4 2012 Absolute change
Sough kind of health care 50.0 51.8 1.8MINSA 1/ 16.9 16.9 0.0EsSalud 2/ 6.4 6.3 -0.1MINSA and EsSalud 0.1 0.1 0.0FFAA and/or National Police 0.3 0.6 0.3Particular 3/ 7.8 9.0 1.2Pharmacy 17.6 17.9 0.3Home 0.1 0.2 0.1Others 4/ 0.9 0.8 -0.11/ Includes health care centars in MINSA, CLASS and hospitals in MINSA. 2/ Includes some centers and hospitals in EsSalud.3/ Includes hospitals and doctor’s offices.4/ Includes informal houses.Source: INEI
PPEOPLE WITH HEALTH PROBLEMS , BY HEALTH CARE CONSULTATION CENTERS (%)
51
ANNUAL REPORT 2012
The most important health care consultation centers continued to be drug stores and the establishments of the Ministry of Health (16.9 percent), even though consultations in private centers (hospitals and doctors’ offices) increased by 1.2 percent to 9 percent.
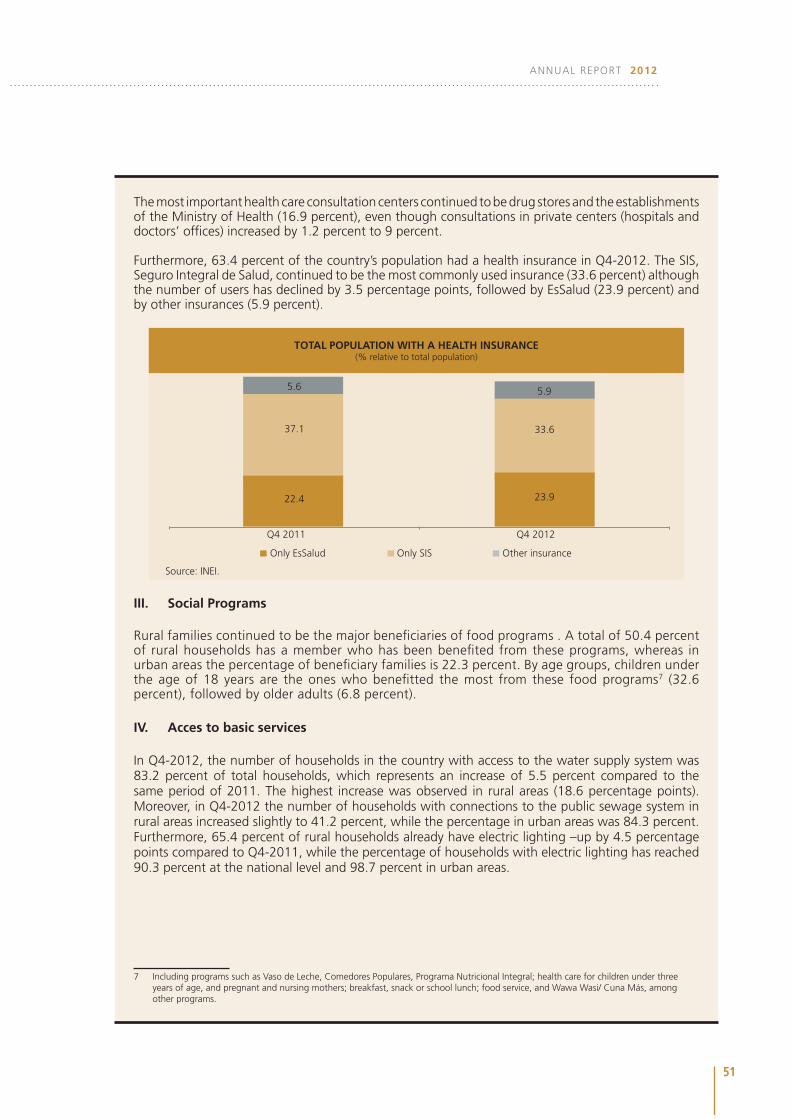
Furthermore, 63.4 percent of the country’s population had a health insurance in Q4-2012. The SIS, Seguro Integral de Salud, continued to be the most commonly used insurance (33.6 percent) although the number of users has declined by 3.5 percentage points, followed by EsSalud (23.9 percent) and by other insurances (5.9 percent).
TOTAL POPULATION WITH A HEALTH INSURANCE (% relative to total population)
Q4 2011 Q4 2012
Only EsSalud Only SIS Other insurance
Source: INEI.
22.4
37.1
5.6
23.9
33.6
5.9
III. Social Programs
Rural families continued to be the major beneficiaries of food programs . A total of 50.4 percent of rural households has a member who has been benefited from these programs, whereas in urban areas the percentage of beneficiary families is 22.3 percent. By age groups, children under the age of 18 years are the ones who benefitted the most from these food programs7 (32.6 percent), followed by older adults (6.8 percent).
IV. Acces to basic services
In Q4-2012, the number of households in the country with access to the water supply system was 83.2 percent of total households, which represents an increase of 5.5 percent compared to the same period of 2011. The highest increase was observed in rural areas (18.6 percentage points). Moreover, in Q4-2012 the number of households with connections to the public sewage system in rural areas increased slightly to 41.2 percent, while the percentage in urban areas was 84.3 percent. Furthermore, 65.4 percent of rural households already have electric lighting –up by 4.5 percentage points compared to Q4-2011, while the percentage of households with electric lighting has reached 90.3 percent at the national level and 98.7 percent in urban areas.
7 Including programs such as Vaso de Leche, Comedores Populares, Programa Nutricional Integral; health care for children under three years of age, and pregnant and nursing mothers; breakfast, snack or school lunch; food service, and Wawa Wasi/ Cuna Más, among other programs.
52
CENTRAL RESERVE BANK OF PERU
V. Participation in Economic Activity
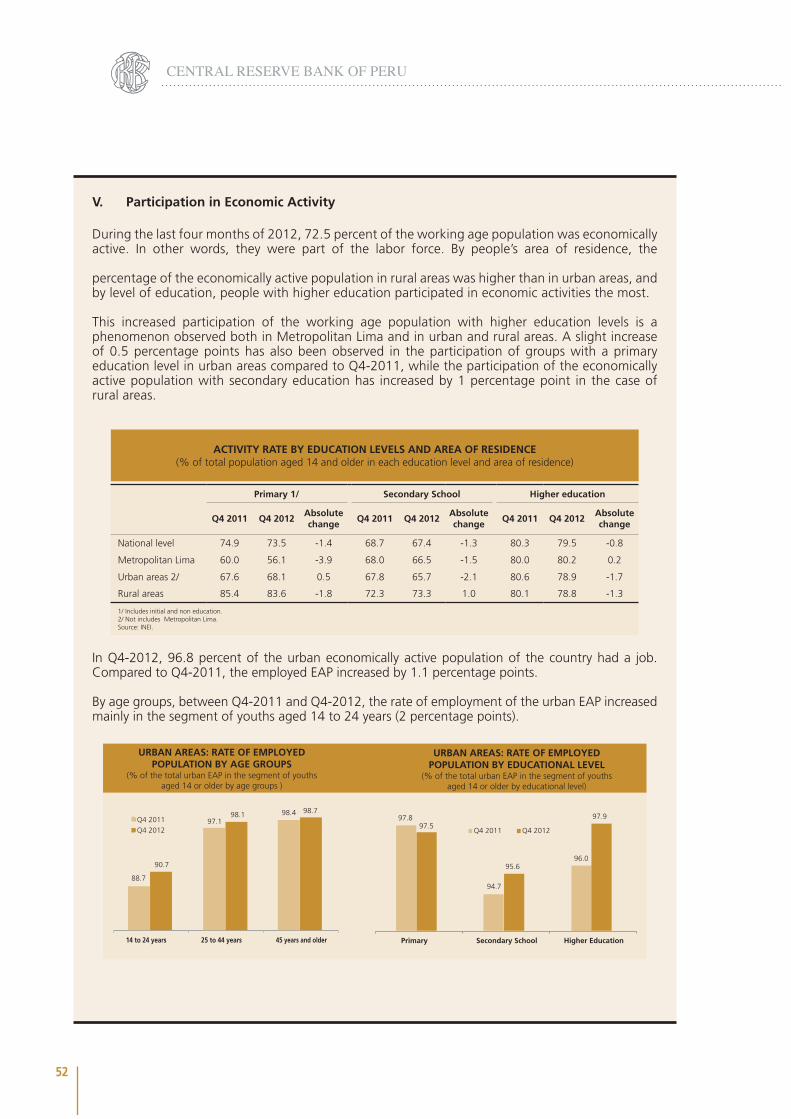
During the last four months of 2012, 72.5 percent of the working age population was economically active. In other words, they were part of the labor force. By people’s area of residence, the
percentage of the economically active population in rural areas was higher than in urban areas, and by level of education, people with higher education participated in economic activities the most.
This increased participation of the working age population with higher education levels is a phenomenon observed both in Metropolitan Lima and in urban and rural areas. A slight increase of 0.5 percentage points has also been observed in the participation of groups with a primary education level in urban areas compared to Q4-2011, while the participation of the economically active population with secondary education has increased by 1 percentage point in the case of rural areas.
Primary 1/ Secondary School Higher education
Q4 2011 Q4 2012Absolute change
Q4 2011 Q4 2012Absolute change
Q4 2011 Q4 2012Absolute change
National level 74.9 73.5 -1.4 68.7 67.4 -1.3 80.3 79.5 -0.8
Metropolitan Lima 60.0 56.1 -3.9 68.0 66.5 -1.5 80.0 80.2 0.2
Urban areas 2/ 67.6 68.1 0.5 67.8 65.7 -2.1 80.6 78.9 -1.7
Rural areas 85.4 83.6 -1.8 72.3 73.3 1.0 80.1 78.8 -1.3
1/ Includes initial and non education.2/ Not includes Metropolitan Lima.Source: INEI.
ACTIVITY RATE BY EDUCATION LEVELS AND AREA OF RESIDENCE(% of total population aged 14 and older in each education level and area of residence)
In Q4-2012, 96.8 percent of the urban economically active population of the country had a job. Compared to Q4-2011, the employed EAP increased by 1.1 percentage points.
By age groups, between Q4-2011 and Q4-2012, the rate of employment of the urban EAP increased mainly in the segment of youths aged 14 to 24 years (2 percentage points).
88.7
97.1 98.4
90.7
98.1 98.7
14 to 24 years 25 to 44 years 45 years and older
Q4 2011 Q4 2012
97.8
94.7
96.0
97.5
95.6
97.9
Primary Secondary School Higher Education
Q4 2011 Q4 2012
(% of the total urban EAP in the segment of youths aged 14 or older by age groups )
URBAN AREAS: RATE OF EMPLOYED POPULATION BY AGE GROUPS
(% of the total urban EAP in the segment of youths aged 14 or older by educational level)
URBAN AREAS: RATE OF EMPLOYED POPULATION BY EDUCATIONAL LEVEL
53
ANNUAL REPORT 2012
By educational level, the EAP with higher education increased by 1.9 percentage points while the EAP with secondary education increased 0.9 percentage points.
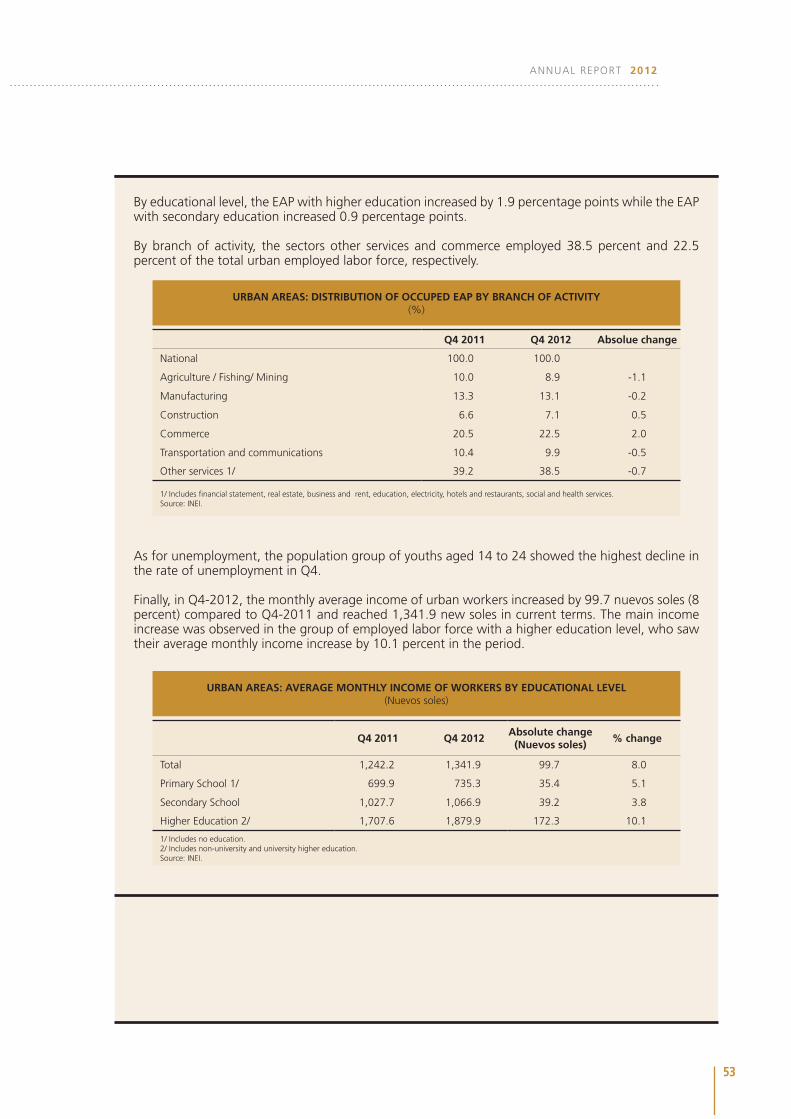
By branch of activity, the sectors other services and commerce employed 38.5 percent and 22.5 percent of the total urban employed labor force, respectively.
Q4 2011 Q4 2012 Absolue change
National 100.0 100.0
Agriculture / Fishing/ Mining 10.0 8.9 -1.1
Manufacturing 13.3 13.1 -0.2
Construction 6.6 7.1 0.5
Commerce 20.5 22.5 2.0
Transportation and communications 10.4 9.9 -0.5
Other services 1/ 39.2 38.5 -0.7
1/ Includes financial statement, real estate, business and rent, education, electricity, hotels and restaurants, social and health services.Source: INEI.
URBAN AREAS: DISTRIBUTION OF OCCUPED EAP BY BRANCH OF ACTIVITY(%)
As for unemployment, the population group of youths aged 14 to 24 showed the highest decline in the rate of unemployment in Q4.
Finally, in Q4-2012, the monthly average income of urban workers increased by 99.7 nuevos soles (8 percent) compared to Q4-2011 and reached 1,341.9 new soles in current terms. The main income increase was observed in the group of employed labor force with a higher education level, who saw their average monthly income increase by 10.1 percent in the period.
Q4 2011 Q4 2012Absolute change (Nuevos soles)
% change
Total 1,242.2 1,341.9 99.7 8.0
Primary School 1/ 699.9 735.3 35.4 5.1
Secondary School 1,027.7 1,066.9 39.2 3.8
Higher Education 2/ 1,707.6 1,879.9 172.3 10.1
1/ Includes no education.2/ Includes non-university and university higher education.Source: INEI.
URBAN AREAS: AVERAGE MONTHLY INCOME OF WORKERS BY EDUCATIONAL LEVEL(Nuevos soles)