Embed Size (px)
Citation preview
www.fao.org/economic/RMM [email protected]
VOLUME XXI ISSUE No. 1
April 2018
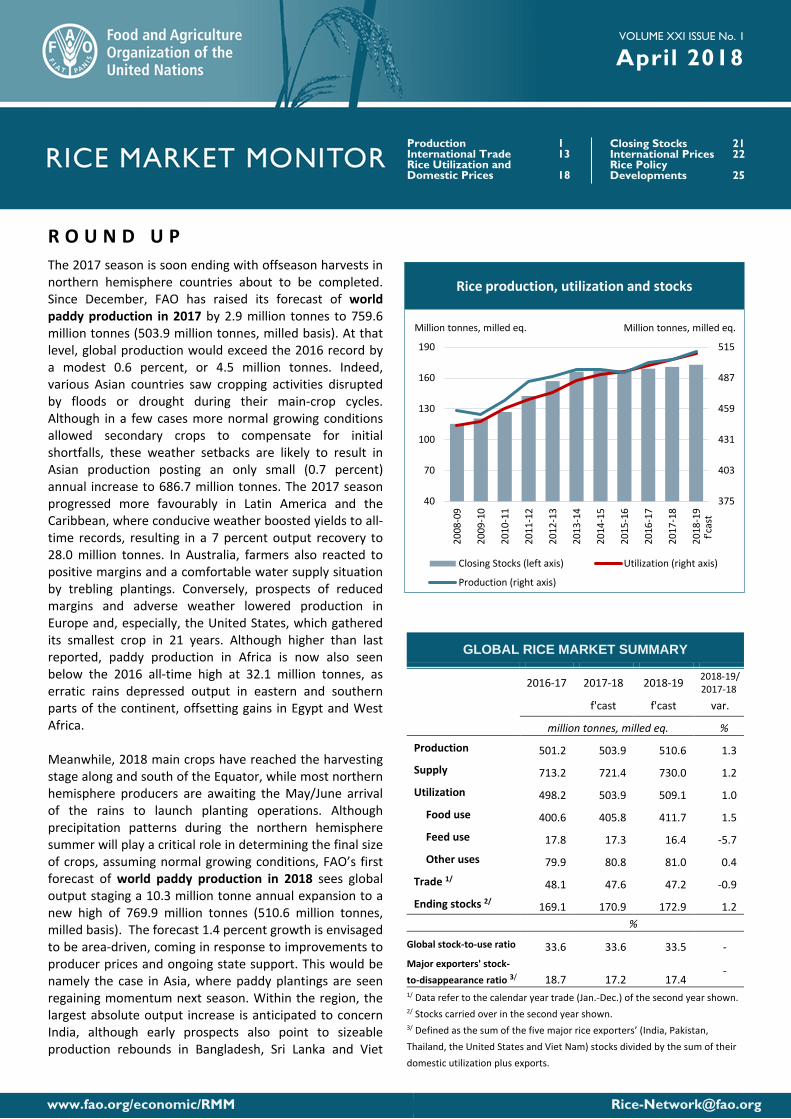
R O U N D U P The 2017 season is soon ending with offseason harvests in northern hemisphere countries about to be completed. Since December, FAO has raised its forecast of world paddy production in 2017 by 2.9 million tonnes to 759.6 million tonnes (503.9 million tonnes, milled basis). At that level, global production would exceed the 2016 record by a modest 0.6 percent, or 4.5 million tonnes. Indeed, various Asian countries saw cropping activities disrupted by floods or drought during their main-crop cycles. Although in a few cases more normal growing conditions allowed secondary crops to compensate for initial shortfalls, these weather setbacks are likely to result in Asian production posting an only small (0.7 percent) annual increase to 686.7 million tonnes. The 2017 season progressed more favourably in Latin America and the Caribbean, where conducive weather boosted yields to all-time records, resulting in a 7 percent output recovery to 28.0 million tonnes. In Australia, farmers also reacted to positive margins and a comfortable water supply situation by trebling plantings. Conversely, prospects of reduced margins and adverse weather lowered production in Europe and, especially, the United States, which gathered its smallest crop in 21 years. Although higher than last reported, paddy production in Africa is now also seen below the 2016 all-time high at 32.1 million tonnes, as erratic rains depressed output in eastern and southern parts of the continent, offsetting gains in Egypt and West Africa. Meanwhile, 2018 main crops have reached the harvesting stage along and south of the Equator, while most northern hemisphere producers are awaiting the May/June arrival of the rains to launch planting operations. Although precipitation patterns during the northern hemisphere summer will play a critical role in determining the final size of crops, assuming normal growing conditions, FAO’s first forecast of world paddy production in 2018 sees global output staging a 10.3 million tonne annual expansion to a new high of 769.9 million tonnes (510.6 million tonnes, milled basis). The forecast 1.4 percent growth is envisaged to be area-driven, coming in response to improvements to producer prices and ongoing state support. This would be namely the case in Asia, where paddy plantings are seen regaining momentum next season. Within the region, the largest absolute output increase is anticipated to concern India, although early prospects also point to sizeable production rebounds in Bangladesh, Sri Lanka and Viet
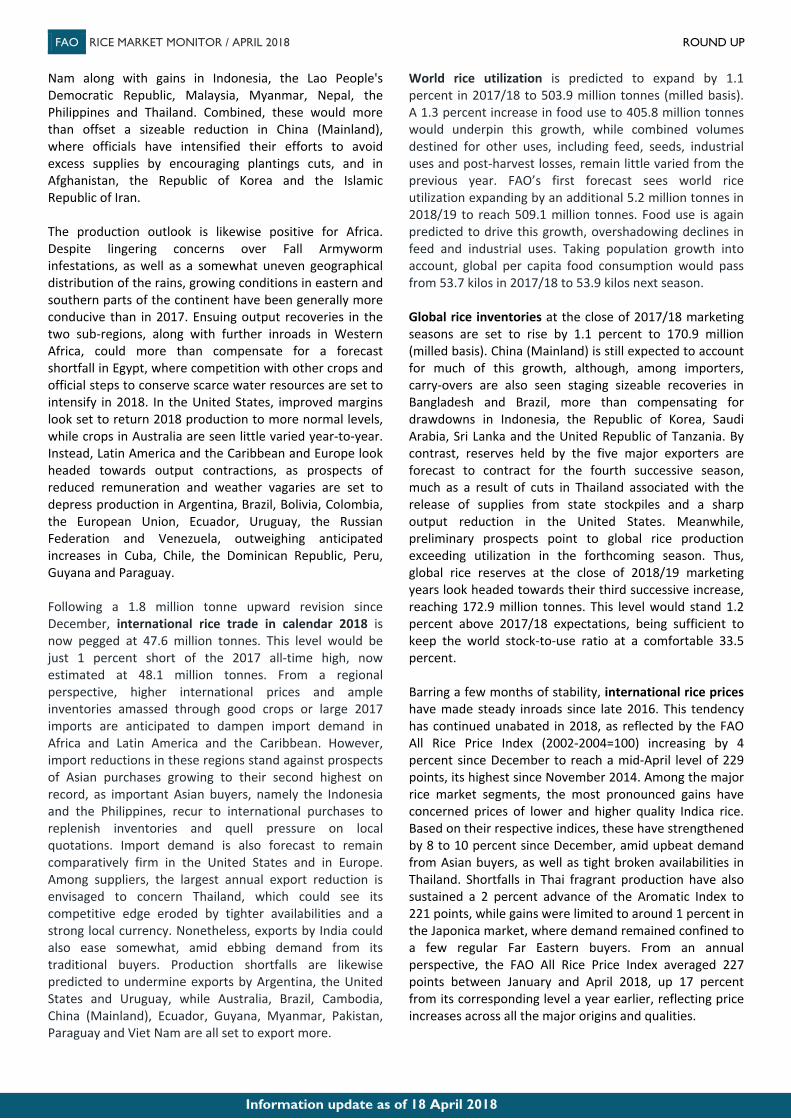
GLOBAL RICE MARKET SUMMARY
2016-17 2017-18 2018-19 2018-19/ 2017-18
f'cast f'cast var.
million tonnes, milled eq. %
Production 501.2 503.9 510.6 1.3
Supply 713.2 721.4 730.0 1.2
Utilization 498.2 503.9 509.1 1.0
Food use 400.6 405.8 411.7 1.5
Feed use 17.8 17.3 16.4 -5.7
Other uses 79.9 80.8 81.0 0.4
Trade 1/ 48.1 47.6 47.2 -0.9
Ending stocks 2/ 169.1 170.9 172.9 1.2 %
Global stock-to-use ratio 33.6 33.6 33.5 - Major exporters' stock-to-disappearance ratio 3/ 18.7 17.2 17.4
-
1/ Data refer to the calendar year trade (Jan.-Dec.) of the second year shown. 2/ Stocks carried over in the second year shown.
3/ Defined as the sum of the five major rice exporters’ (India, Pakistan, Thailand, the United States and Viet Nam) stocks divided by the sum of their domestic utilization plus exports.
Production 1 International Trade 13 Rice Utilization and Domestic Prices 18
Closing Stocks 21 International Prices 22 Rice Policy Developments 25
375
403
431
459
487
515
40
70
100
130
160
190
2008
-09
2009
-10
2010
-11
2011
-12
2012
-13
2013
-14
2014
-15
2015
-16
2016
-17
2017
-18
2018
-19
Closing Stocks (left axis) Utilization (right axis)
Production (right axis)
Million tonnes, milled eq.Million tonnes, milled eq.
f'cas
t
Rice production, utilization and stocks
FAO RICE MARKET MONITOR / APRIL 2018 ROUND UP
Information update as of 18 April 2018
Nam along with gains in Indonesia, the Lao People's Democratic Republic, Malaysia, Myanmar, Nepal, the Philippines and Thailand. Combined, these would more than offset a sizeable reduction in China (Mainland), where officials have intensified their efforts to avoid excess supplies by encouraging plantings cuts, and in Afghanistan, the Republic of Korea and the Islamic Republic of Iran. The production outlook is likewise positive for Africa. Despite lingering concerns over Fall Armyworm infestations, as well as a somewhat uneven geographical distribution of the rains, growing conditions in eastern and southern parts of the continent have been generally more conducive than in 2017. Ensuing output recoveries in the two sub-regions, along with further inroads in Western Africa, could more than compensate for a forecast shortfall in Egypt, where competition with other crops and official steps to conserve scarce water resources are set to intensify in 2018. In the United States, improved margins look set to return 2018 production to more normal levels, while crops in Australia are seen little varied year-to-year. Instead, Latin America and the Caribbean and Europe look headed towards output contractions, as prospects of reduced remuneration and weather vagaries are set to depress production in Argentina, Brazil, Bolivia, Colombia, the European Union, Ecuador, Uruguay, the Russian Federation and Venezuela, outweighing anticipated increases in Cuba, Chile, the Dominican Republic, Peru, Guyana and Paraguay. Following a 1.8 million tonne upward revision since December, international rice trade in calendar 2018 is now pegged at 47.6 million tonnes. This level would be just 1 percent short of the 2017 all-time high, now estimated at 48.1 million tonnes. From a regional perspective, higher international prices and ample inventories amassed through good crops or large 2017 imports are anticipated to dampen import demand in Africa and Latin America and the Caribbean. However, import reductions in these regions stand against prospects of Asian purchases growing to their second highest on record, as important Asian buyers, namely the Indonesia and the Philippines, recur to international purchases to replenish inventories and quell pressure on local quotations. Import demand is also forecast to remain comparatively firm in the United States and in Europe. Among suppliers, the largest annual export reduction is envisaged to concern Thailand, which could see its competitive edge eroded by tighter availabilities and a strong local currency. Nonetheless, exports by India could also ease somewhat, amid ebbing demand from its traditional buyers. Production shortfalls are likewise predicted to undermine exports by Argentina, the United States and Uruguay, while Australia, Brazil, Cambodia, China (Mainland), Ecuador, Guyana, Myanmar, Pakistan, Paraguay and Viet Nam are all set to export more.
World rice utilization is predicted to expand by 1.1 percent in 2017/18 to 503.9 million tonnes (milled basis). A 1.3 percent increase in food use to 405.8 million tonnes would underpin this growth, while combined volumes destined for other uses, including feed, seeds, industrial uses and post-harvest losses, remain little varied from the previous year. FAO’s first forecast sees world rice utilization expanding by an additional 5.2 million tonnes in 2018/19 to reach 509.1 million tonnes. Food use is again predicted to drive this growth, overshadowing declines in feed and industrial uses. Taking population growth into account, global per capita food consumption would pass from 53.7 kilos in 2017/18 to 53.9 kilos next season. Global rice inventories at the close of 2017/18 marketing seasons are set to rise by 1.1 percent to 170.9 million (milled basis). China (Mainland) is still expected to account for much of this growth, although, among importers, carry-overs are also seen staging sizeable recoveries in Bangladesh and Brazil, more than compensating for drawdowns in Indonesia, the Republic of Korea, Saudi Arabia, Sri Lanka and the United Republic of Tanzania. By contrast, reserves held by the five major exporters are forecast to contract for the fourth successive season, much as a result of cuts in Thailand associated with the release of supplies from state stockpiles and a sharp output reduction in the United States. Meanwhile, preliminary prospects point to global rice production exceeding utilization in the forthcoming season. Thus, global rice reserves at the close of 2018/19 marketing years look headed towards their third successive increase, reaching 172.9 million tonnes. This level would stand 1.2 percent above 2017/18 expectations, being sufficient to keep the world stock-to-use ratio at a comfortable 33.5 percent. Barring a few months of stability, international rice prices have made steady inroads since late 2016. This tendency has continued unabated in 2018, as reflected by the FAO All Rice Price Index (2002-2004=100) increasing by 4 percent since December to reach a mid-April level of 229 points, its highest since November 2014. Among the major rice market segments, the most pronounced gains have concerned prices of lower and higher quality Indica rice. Based on their respective indices, these have strengthened by 8 to 10 percent since December, amid upbeat demand from Asian buyers, as well as tight broken availabilities in Thailand. Shortfalls in Thai fragrant production have also sustained a 2 percent advance of the Aromatic Index to 221 points, while gains were limited to around 1 percent in the Japonica market, where demand remained confined to a few regular Far Eastern buyers. From an annual perspective, the FAO All Rice Price Index averaged 227 points between January and April 2018, up 17 percent from its corresponding level a year earlier, reflecting price increases across all the major origins and qualities.
FAO RICE MARKET MONITOR / APRIL 2018 PRODUCTION
1
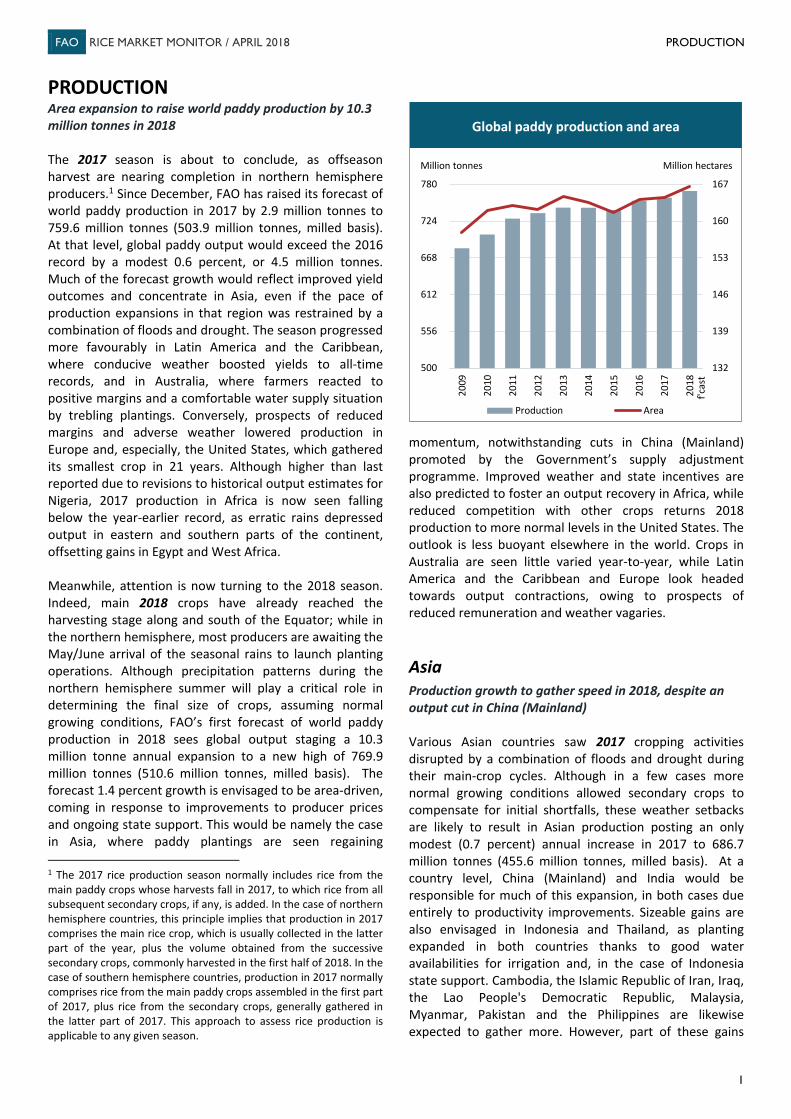
PRODUCTION Area expansion to raise world paddy production by 10.3 million tonnes in 2018 The 2017 season is about to conclude, as offseason harvest are nearing completion in northern hemisphere producers.1 Since December, FAO has raised its forecast of world paddy production in 2017 by 2.9 million tonnes to 759.6 million tonnes (503.9 million tonnes, milled basis). At that level, global paddy output would exceed the 2016 record by a modest 0.6 percent, or 4.5 million tonnes. Much of the forecast growth would reflect improved yield outcomes and concentrate in Asia, even if the pace of production expansions in that region was restrained by a combination of floods and drought. The season progressed more favourably in Latin America and the Caribbean, where conducive weather boosted yields to all-time records, and in Australia, where farmers reacted to positive margins and a comfortable water supply situation by trebling plantings. Conversely, prospects of reduced margins and adverse weather lowered production in Europe and, especially, the United States, which gathered its smallest crop in 21 years. Although higher than last reported due to revisions to historical output estimates for Nigeria, 2017 production in Africa is now seen falling below the year-earlier record, as erratic rains depressed output in eastern and southern parts of the continent, offsetting gains in Egypt and West Africa. Meanwhile, attention is now turning to the 2018 season. Indeed, main 2018 crops have already reached the harvesting stage along and south of the Equator; while in the northern hemisphere, most producers are awaiting the May/June arrival of the seasonal rains to launch planting operations. Although precipitation patterns during the northern hemisphere summer will play a critical role in determining the final size of crops, assuming normal growing conditions, FAO’s first forecast of world paddy production in 2018 sees global output staging a 10.3 million tonne annual expansion to a new high of 769.9 million tonnes (510.6 million tonnes, milled basis). The forecast 1.4 percent growth is envisaged to be area-driven, coming in response to improvements to producer prices and ongoing state support. This would be namely the case in Asia, where paddy plantings are seen regaining 1 The 2017 rice production season normally includes rice from the main paddy crops whose harvests fall in 2017, to which rice from all subsequent secondary crops, if any, is added. In the case of northern hemisphere countries, this principle implies that production in 2017 comprises the main rice crop, which is usually collected in the latter part of the year, plus the volume obtained from the successive secondary crops, commonly harvested in the first half of 2018. In the case of southern hemisphere countries, production in 2017 normally comprises rice from the main paddy crops assembled in the first part of 2017, plus rice from the secondary crops, generally gathered in the latter part of 2017. This approach to assess rice production is applicable to any given season.
momentum, notwithstanding cuts in China (Mainland) promoted by the Government’s supply adjustment programme. Improved weather and state incentives are also predicted to foster an output recovery in Africa, while reduced competition with other crops returns 2018 production to more normal levels in the United States. The outlook is less buoyant elsewhere in the world. Crops in Australia are seen little varied year-to-year, while Latin America and the Caribbean and Europe look headed towards output contractions, owing to prospects of reduced remuneration and weather vagaries. Asia Production growth to gather speed in 2018, despite an output cut in China (Mainland) Various Asian countries saw 2017 cropping activities disrupted by a combination of floods and drought during their main-crop cycles. Although in a few cases more normal growing conditions allowed secondary crops to compensate for initial shortfalls, these weather setbacks are likely to result in Asian production posting an only modest (0.7 percent) annual increase in 2017 to 686.7 million tonnes (455.6 million tonnes, milled basis). At a country level, China (Mainland) and India would be responsible for much of this expansion, in both cases due entirely to productivity improvements. Sizeable gains are also envisaged in Indonesia and Thailand, as planting expanded in both countries thanks to good water availabilities for irrigation and, in the case of Indonesia state support. Cambodia, the Islamic Republic of Iran, Iraq, the Lao People's Democratic Republic, Malaysia, Myanmar, Pakistan and the Philippines are likewise expected to gather more. However, part of these gains
132
139
146
153
160
167
500
556
612
668
724
780
2009
2010
2011
2012
2013
2014
2015
2016
2017
2018
Production Area
Production et superficie mondiales de riz paddy
Million tonnes
Global paddy production and area
Million hectares
f'cas
t
FAO RICE MARKET MONITOR / APRIL 2018 PRODUCTION
2
would be outweighed by sharp contractions in Bangladesh and Sri Lanka, where crops were marred by adverse weather. Although less pronounced than previously envisaged, output also declined in Nepal and the Democratic People’s Republic of Korea, along with Afghanistan, Japan, the Republic of Korea, Turkey and Viet Nam.
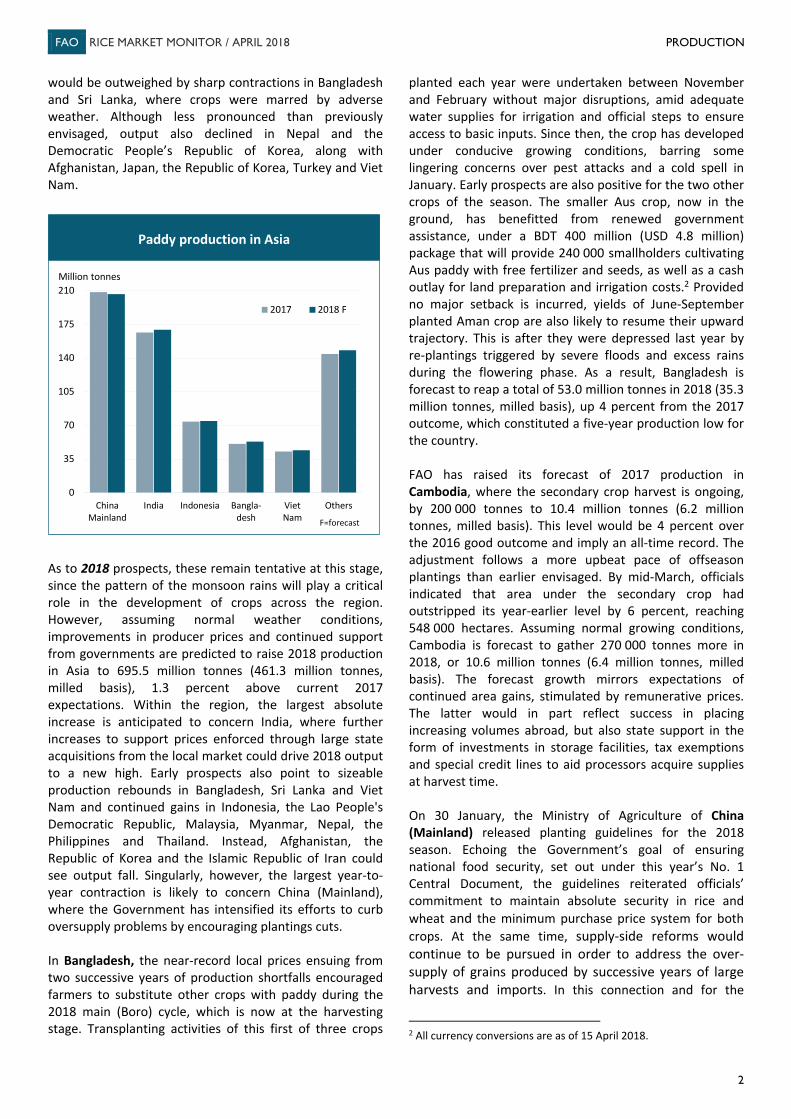
As to 2018 prospects, these remain tentative at this stage, since the pattern of the monsoon rains will play a critical role in the development of crops across the region. However, assuming normal weather conditions, improvements in producer prices and continued support from governments are predicted to raise 2018 production in Asia to 695.5 million tonnes (461.3 million tonnes, milled basis), 1.3 percent above current 2017 expectations. Within the region, the largest absolute increase is anticipated to concern India, where further increases to support prices enforced through large state acquisitions from the local market could drive 2018 output to a new high. Early prospects also point to sizeable production rebounds in Bangladesh, Sri Lanka and Viet Nam and continued gains in Indonesia, the Lao People's Democratic Republic, Malaysia, Myanmar, Nepal, the Philippines and Thailand. Instead, Afghanistan, the Republic of Korea and the Islamic Republic of Iran could see output fall. Singularly, however, the largest year-to-year contraction is likely to concern China (Mainland), where the Government has intensified its efforts to curb oversupply problems by encouraging plantings cuts. In Bangladesh, the near-record local prices ensuing from two successive years of production shortfalls encouraged farmers to substitute other crops with paddy during the 2018 main (Boro) cycle, which is now at the harvesting stage. Transplanting activities of this first of three crops
planted each year were undertaken between November and February without major disruptions, amid adequate water supplies for irrigation and official steps to ensure access to basic inputs. Since then, the crop has developed under conducive growing conditions, barring some lingering concerns over pest attacks and a cold spell in January. Early prospects are also positive for the two other crops of the season. The smaller Aus crop, now in the ground, has benefitted from renewed government assistance, under a BDT 400 million (USD 4.8 million) package that will provide 240 000 smallholders cultivating Aus paddy with free fertilizer and seeds, as well as a cash outlay for land preparation and irrigation costs.2 Provided no major setback is incurred, yields of June-September planted Aman crop are also likely to resume their upward trajectory. This is after they were depressed last year by re-plantings triggered by severe floods and excess rains during the flowering phase. As a result, Bangladesh is forecast to reap a total of 53.0 million tonnes in 2018 (35.3 million tonnes, milled basis), up 4 percent from the 2017 outcome, which constituted a five-year production low for the country. FAO has raised its forecast of 2017 production in Cambodia, where the secondary crop harvest is ongoing, by 200 000 tonnes to 10.4 million tonnes (6.2 million tonnes, milled basis). This level would be 4 percent over the 2016 good outcome and imply an all-time record. The adjustment follows a more upbeat pace of offseason plantings than earlier envisaged. By mid-March, officials indicated that area under the secondary crop had outstripped its year-earlier level by 6 percent, reaching 548 000 hectares. Assuming normal growing conditions, Cambodia is forecast to gather 270 000 tonnes more in 2018, or 10.6 million tonnes (6.4 million tonnes, milled basis). The forecast growth mirrors expectations of continued area gains, stimulated by remunerative prices. The latter would in part reflect success in placing increasing volumes abroad, but also state support in the form of investments in storage facilities, tax exemptions and special credit lines to aid processors acquire supplies at harvest time. On 30 January, the Ministry of Agriculture of China (Mainland) released planting guidelines for the 2018 season. Echoing the Government’s goal of ensuring national food security, set out under this year’s No. 1 Central Document, the guidelines reiterated officials’ commitment to maintain absolute security in rice and wheat and the minimum purchase price system for both crops. At the same time, supply-side reforms would continue to be pursued in order to address the over-supply of grains produced by successive years of large harvests and imports. In this connection and for the
2 All currency conversions are as of 15 April 2018.
0
35
70
105
140
175
210
ChinaMainland
India Indonesia Bangla-desh
VietNam
Others
2017 2018 F
Million tonnes
Paddy production in Asia
F=forecast
FAO RICE MARKET MONITOR / APRIL 2018 PRODUCTION
3
purpose of stabilising aggregate wheat and paddy plantings at 800 million mu (53.3 million hectares), the Government would target to reduce 2018 area under paddy by over 10 million mu (0.67 million hectares). Most of this reduction would concern low-yielding Japonica paddy in the north-eastern region and double-season Indica paddy in the Long river valley. In line with these guidelines, on 9 February, the National Development and Reform Commission (NDRC) announced that minimum purchase prices for paddy would be cut by 7 to 14 percent during the 2018 season to CNY 120-130 per 50 kilos (USD 382-414 per tonne). This compares to the 1-3 percent reduction in purchasing prices approved last year. These policy directives come in the wake of a record 2017 paddy harvest in China (Mainland), which defied expectations of area cuts ensuing from reductions in support prices. Instead, paddy remained a lucrative production choice, in particular for farmers in north-eastern Japonica producing provinces that were in parallel affected by reforms in the maize sector. The latter drive saw government maize purchases suspended already in 2016. Whilst the continuation of the state’s procurement system for paddy is likely to continue rendering rice a safe production choice for many farmers, prospects of producers in north-eastern provinces continuing to substitute maize with paddy in 2018 are tempered by a recovery in Chinese maize quotations, especially as it is these very same provinces that are being targeted with this year’s more severe cut to Japonica support prices. This is while Indica paddies in southern provinces of China continue to face heightened competition with imports, particularly the lower-quality supplies harvested during the early crop cycle. Nonetheless, part of the expected area losses for 2018 could be offset by continued productivity gains, considering that the area adjustment program targets marginal, low-yielding lands in particular, but also that, in the absence of major weather disruptions,
improved growing practices and higher yielding varieties have led to steady yield gains. As a result, production of China (Mainland) is tentatively forecast to amount to 206.3 million tonnes (141.3 million tonnes, milled basis) in 2018, down from an officially reported level of 208.6 million tonnes (142.9 million tonnes, milled basis) for 2017. On 27 February 2018, the Government of India released its Second Advanced Estimates of production during the 2017 season, pegging total Indian output at an all-time high of 166.5 million tonnes (111.0 million tonnes, milled basis). This level would stand 1.2 percent above the final estimate for the 2016 season and some 2.3 million tonnes above previous FAO expectations. Although the 2017 monsoon brought generally normal precipitation levels over India, as a whole, the distribution of the rains was somewhat mixed across time and India’s major geographical regions. Indicative of this pattern, the Government’s February outlook sees shortfalls in northern and central areas of the country, where a combination of floods and precipitation deficits lowered Kharif crop output, more than compensated by greater Kharif and Rabi production from southern states. This would be namely the case of Tamil Nadu, which is expected to account for much of India’s output expansion this season. Indeed, this season’s northeast monsoon rains have been more conducive, if compared to the severe shortfalls experienced last season that caused 2016 output in that state to slump by 65 percent to 2.4 million tonnes (milled basis). Looking further ahead, April forecasts by the India Meteorological Department indicate that the 2018 southwest monsoon is likely to bring normal rains over India, as a whole. Cumulative precipitation in the June-September period is expected at 97 percent of the long-period average (±5% error), up from the 95 percent of normal received in 2017 and in line with the 2016
115
120
125
130
135
140
Mar-14 Mar-15 Mar-16 Mar-17 Mar-18
Ntl. avg.Govt. purchase price
Early Indica (CNY per 50 kg)
120
125
130
135
140
145
Mar-14 Mar-15 Mar-16 Mar-17 Mar-18
Late/intermediate Indica (CNY per 50 kg)
125
133
141
149
157
165
Mar-14 Mar-15 Mar-16 Mar-17 Mar-18
Japonica (CNY per 50 kg)
China (Mainland): Average paddy prices and Government procurement prices*
______________
Sources: Ministry of Agriculture and Rural Affairs of the People's Republic of China and National Development and Reform Commission (NDRC).* Changes in Government procurement prices are depicted as per their date of announcement.
FAO RICE MARKET MONITOR / APRIL 2018 PRODUCTION
4
monsoon range. Even if much is still likely to depend on the temporal and geographical distribution of the rains, the prediction bodes well for the 2018 season, as Kharif crop plantings and yields are highly influenced by the performance of the monsoon, which also determines water availability for the irrigated Rabi crop. On the policy front, February Government commitments that would have minimum support prices (MSPs) for all Kharif crops set at least at 1.5 times their cost of production have raised expectations of more pronounced increases to 2018 producer support prices. For comparison, between 2015 and 2017, India’s Commission for Agricultural Costs and Prices set MSPs for paddy between 38.2 and 44.5 percent above its costs of production. The February initiative forms part of the 2018 budgetary allocations and is aligned to the Government’s target of doubling farmer incomes by 2022. The 2018 budget announcements also call for officials to study a mechanism that would ensure farmers receive adequate retribution, in case prices fall below prescribed MSP’s, further to boosting credit allocations, taking steps to enhance small scale and marginal farmers’ access to markets and investment in agro-processing. Efforts to shore up productivity levels also continue under the National Food Security Mission and the Bringing Green Revolution to Eastern India scheme. A March move also renewed subsidies on urea until 2020, keeping the maximum retail prices of the fertilizer at INR 5 360 (USD 82) per tonne for the next two seasons. In view of these incentives and assuming no major setback is incurred, production in India is forecast to rise by an additional 1.8 percent in 2018, to reach an all-time high of 169.5 million tonnes (113.0 million tonnes, milled basis). FAO estimates of the 2017 harvest in Indonesia, concluded in December, have been lowered by 330 000 tonnes to 73.9 million tonnes (46.3 million tonnes, milled basis). The adjustment mirrors downgraded estimates of offseason crop coverage, as well as official indications of less buoyant yield outcomes. The latter would come as a result of pest attacks in Java, where productivity levels are comparatively higher and where excellent yield results were recorded over the past two seasons. Despite the revision, 2017 production in Indonesia is still assessed to have posted a 2 percent annual increase, owing to area gains in the main-crop cycle promoted by state support, as well as abundant rains. As to prospects for 2018, Indonesia’s main-crop, now at the harvest stage, has developed under generally normal precipitation patterns and adequate water availabilities for irrigation, even if persistent precipitation deficits in West Java and Sumatra have dampened expectations of main-crop output expanding beyond last year’s good outcome. Still, scope exists for offseason harvests to recover, as provided growing conditions remain normal, a reduced incidence of pest attacks and increases in paddy prices could promote both area and yield gains in this cycle. As such, FAO
anticipates Indonesia will gather 74.5 million tonnes (46.7 million tonnes, milled basis) in 2018, representing a 1 percent yield-driven annual increase. In the Republic of Korea, officials estimate that 2017 output fell to its lowest since 1980, or 5.3 million tonnes (3.97 million tonnes, milled basis). The 6 percent annual contraction followed area cuts instigated by unattractive prices and the state’s area diversion programme, which were compounded by yield depressions from cloudy and warm summer conditions. Area under rice has declined uninterruptedly in the Republic of Korea since 2001, partly in response to Government incentives geared at balancing the local market, in view of steady reductions in domestic rice consumption. Anticipating this consumption trend to continue in 2018, in January, Korean authorities announced that they would encourage an accelerated rate of area conversions next season. The aim would be to reduce rice acreage by an additional 50 000 hectares to a total of 705 000 hectares. For the purpose, farmers accepting to cultivate other crops would receive an average of KRW 3.4 million (USD 3 172) per hectare. However, producer interest in the programme has been reportedly tempered by the strong rebound in local prices that ensued from the diminished 2017 harvest. Indicative of this trend, the producer price index for rice of the Bank of Korea (2010=100) was reported to stand 32 percent above year-earlier levels in March at a 40-month high of 127.7 points. On the productivity front, more normal growing conditions and increased usage of high yielding varieties could also allow average yields to regain some ground over the year. On these bases, FAO sees 2018 output in the Republic of Korea declining by 2 percent year-on-year to 5.2 million tonnes (3.9 million tonnes, milled basis). Favorable growing conditions, combined with attractive prices and state input assistance are estimated to have raised 2017 production in Pakistan to an all-time record of 11.1 million tonnes (7.4 million tonnes, milled basis). FAO anticipates production in Pakistan to outdo this level by 1 percent in 2018, reaching 11.3 million tonnes (7.5 million tonnes, milled basis). The forecast growth mirrors expectations that export-led increases in local quotations, together with state input support, will continue rendering paddy an attractive production choice relative to competing crops, whilst increased usage of improved seed varieties, namely hybrids, is also likely to translate into additional yield increases. Prospects for the season are only somewhat dampened by uncertainties regarding the water supply situation, given official forecast forewarning that below average snowfall could keep storage levels in major reservoirs constrained.
FAO RICE MARKET MONITOR / APRIL 2018 PRODUCTION
5
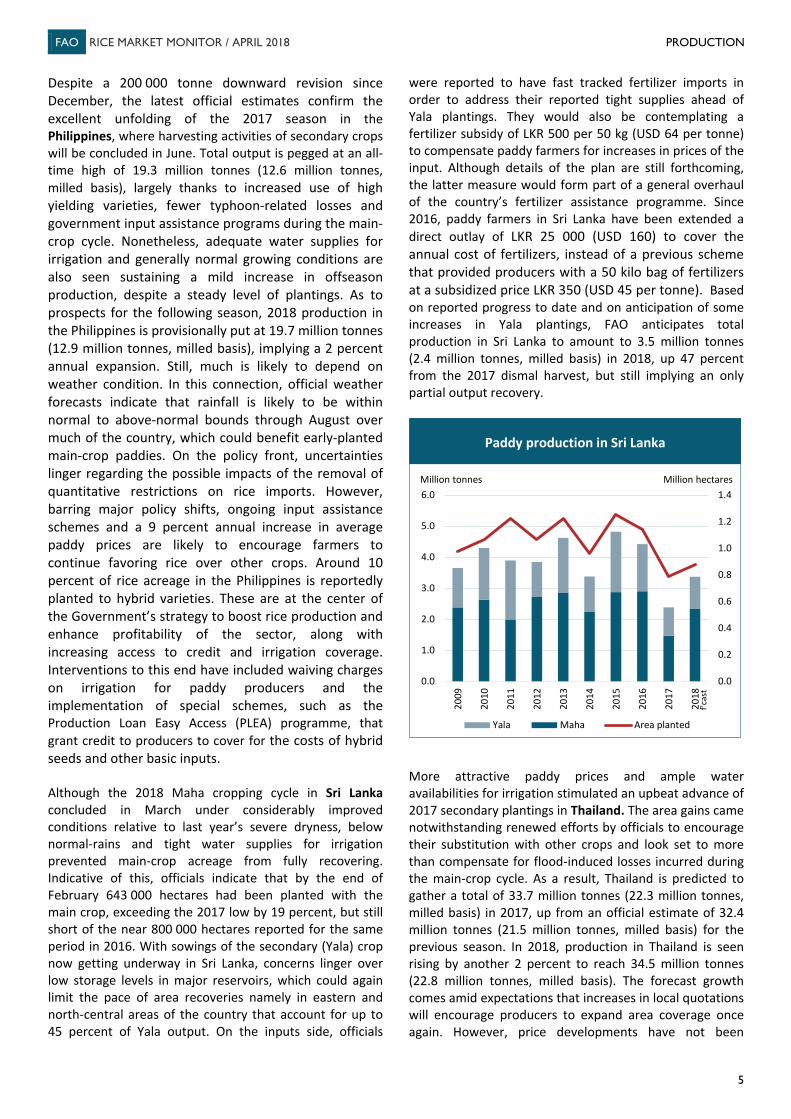
Despite a 200 000 tonne downward revision since December, the latest official estimates confirm the excellent unfolding of the 2017 season in the Philippines, where harvesting activities of secondary crops will be concluded in June. Total output is pegged at an all-time high of 19.3 million tonnes (12.6 million tonnes, milled basis), largely thanks to increased use of high yielding varieties, fewer typhoon-related losses and government input assistance programs during the main-crop cycle. Nonetheless, adequate water supplies for irrigation and generally normal growing conditions are also seen sustaining a mild increase in offseason production, despite a steady level of plantings. As to prospects for the following season, 2018 production in the Philippines is provisionally put at 19.7 million tonnes (12.9 million tonnes, milled basis), implying a 2 percent annual expansion. Still, much is likely to depend on weather condition. In this connection, official weather forecasts indicate that rainfall is likely to be within normal to above-normal bounds through August over much of the country, which could benefit early-planted main-crop paddies. On the policy front, uncertainties linger regarding the possible impacts of the removal of quantitative restrictions on rice imports. However, barring major policy shifts, ongoing input assistance schemes and a 9 percent annual increase in average paddy prices are likely to encourage farmers to continue favoring rice over other crops. Around 10 percent of rice acreage in the Philippines is reportedly planted to hybrid varieties. These are at the center of the Government’s strategy to boost rice production and enhance profitability of the sector, along with increasing access to credit and irrigation coverage. Interventions to this end have included waiving charges on irrigation for paddy producers and the implementation of special schemes, such as the Production Loan Easy Access (PLEA) programme, that grant credit to producers to cover for the costs of hybrid seeds and other basic inputs. Although the 2018 Maha cropping cycle in Sri Lanka concluded in March under considerably improved conditions relative to last year’s severe dryness, below normal-rains and tight water supplies for irrigation prevented main-crop acreage from fully recovering. Indicative of this, officials indicate that by the end of February 643 000 hectares had been planted with the main crop, exceeding the 2017 low by 19 percent, but still short of the near 800 000 hectares reported for the same period in 2016. With sowings of the secondary (Yala) crop now getting underway in Sri Lanka, concerns linger over low storage levels in major reservoirs, which could again limit the pace of area recoveries namely in eastern and north-central areas of the country that account for up to 45 percent of Yala output. On the inputs side, officials
were reported to have fast tracked fertilizer imports in order to address their reported tight supplies ahead of Yala plantings. They would also be contemplating a fertilizer subsidy of LKR 500 per 50 kg (USD 64 per tonne) to compensate paddy farmers for increases in prices of the input. Although details of the plan are still forthcoming, the latter measure would form part of a general overhaul of the country’s fertilizer assistance programme. Since 2016, paddy farmers in Sri Lanka have been extended a direct outlay of LKR 25 000 (USD 160) to cover the annual cost of fertilizers, instead of a previous scheme that provided producers with a 50 kilo bag of fertilizers at a subsidized price LKR 350 (USD 45 per tonne). Based on reported progress to date and on anticipation of some increases in Yala plantings, FAO anticipates total production in Sri Lanka to amount to 3.5 million tonnes (2.4 million tonnes, milled basis) in 2018, up 47 percent from the 2017 dismal harvest, but still implying an only partial output recovery.
More attractive paddy prices and ample water availabilities for irrigation stimulated an upbeat advance of 2017 secondary plantings in Thailand. The area gains came notwithstanding renewed efforts by officials to encourage their substitution with other crops and look set to more than compensate for flood-induced losses incurred during the main-crop cycle. As a result, Thailand is predicted to gather a total of 33.7 million tonnes (22.3 million tonnes, milled basis) in 2017, up from an official estimate of 32.4 million tonnes (21.5 million tonnes, milled basis) for the previous season. In 2018, production in Thailand is seen rising by another 2 percent to reach 34.5 million tonnes (22.8 million tonnes, milled basis). The forecast growth comes amid expectations that increases in local quotations will encourage producers to expand area coverage once again. However, price developments have not been
0.0
0.2
0.4
0.6
0.8
1.0
1.2
1.4
0.0
1.0
2.0
3.0
4.0
5.0
6.0
2009
2010
2011
2012
2013
2014
2015
2016
2017
2018
Yala Maha Area planted
Paddy production in Sri Lanka
Million hectaresMillion tonnes
f'cas
t
FAO RICE MARKET MONITOR / APRIL 2018 PRODUCTION
6
consistent across the various segments, which will likely carry implications for the varietal make-up of Thai production in 2018. Indeed, gains have mostly concerned fragrant varieties, which bore the brunt of flood-related losses in 2017 further to having been reportedly displaced by glutinous rice. By March, prices of Hom Mali paddy were reported at THB 15 106 (USD 482) per tonne, their highest since October 2013 and 63 percent over year-earlier levels. Quotations of non-glutinous paddy have been far more stable, while prices of glutinous varieties incurred an 11 percent year-on-year drop to THB 9 569 (USD 305) per tonne. On the water front, as of mid-April, storage levels in major reservoirs in northern areas were reported to stand at 51-59 percent of capacity, up from 44-47 percent on the corresponding period of 2017. The comfortable water supply situation, combined with normal to above normal precipitation through June, as foreshadowed by weather forecast, should ensure a smooth start to main-crop plantings in May. After seeing 2016 output depressed to a five-year low by El Niño-induced adverse weather, 2017 production in Viet Nam was again impaired by storms, pest attacks and lingering salinity problems. Based on official assessments released in January, 42.8 million tonnes (27.8 million tonnes, milled basis) were gathered in 2017, down 0.7 percent from an officially revised estimate for 2016. Harvesting activities of the 2018 winter-spring crop, the first of three crops cultivated each year, are well advanced in Viet Nam. According to authorities, area under the main crop remained largely unvaried this season at 3.1 million hectares. Based on industry assessments, the main producing provinces of the Mekong Delta would have changed the varietal structure of winter-spring plantings this season, in line with a Government strategy to move Viet Nam’s rice export sector progressively away from lower grade Indica rice towards higher valued varieties. Over 30 percent of winter-spring acreage in the Delta would have been dedicated to aromatic rice this season. The increase would have come at the expense of glutinous rice, which would account for nearly 10 percent of winter-spring acreage, as well as lower grade Indica varieties, such as IR50404. Meanwhile, yield expectations for the winter-spring crop are boosted by conducive weather, despite some initial sowing delays in the south caused by a slow recession of floodwaters and in the north due to storm-related holdbacks experienced in 2017. The Delta, which normally accounts for over 80 percent of summer-autumn production, has also seen plantings of the second crop advance speedily, thanks to attractive prices and adequate water availabilities. Accordingly and provided growing conditions remain normal for the remainder of the season, Viet Nam is forecast to see aggregate production recover by 3 percent in 2018 to 44.2 million tonnes (28.7 million tonnes, milled basis).
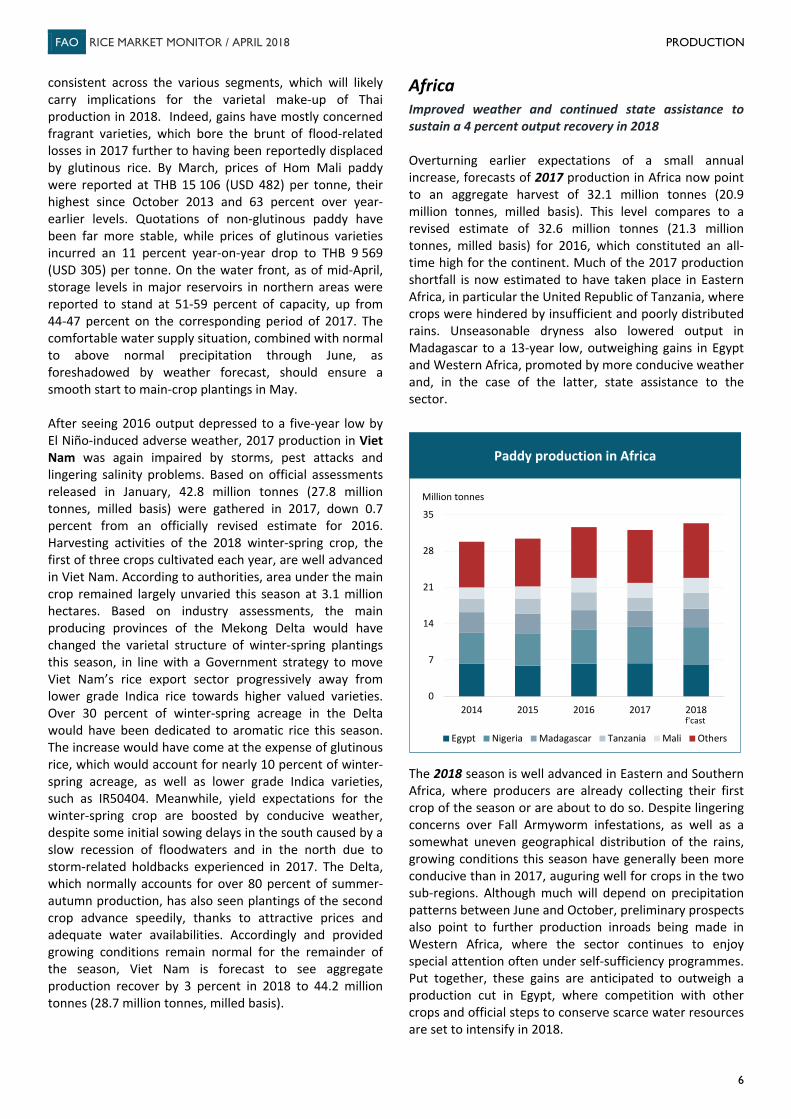
Africa Improved weather and continued state assistance to sustain a 4 percent output recovery in 2018 Overturning earlier expectations of a small annual increase, forecasts of 2017 production in Africa now point to an aggregate harvest of 32.1 million tonnes (20.9 million tonnes, milled basis). This level compares to a revised estimate of 32.6 million tonnes (21.3 million tonnes, milled basis) for 2016, which constituted an all-time high for the continent. Much of the 2017 production shortfall is now estimated to have taken place in Eastern Africa, in particular the United Republic of Tanzania, where crops were hindered by insufficient and poorly distributed rains. Unseasonable dryness also lowered output in Madagascar to a 13-year low, outweighing gains in Egypt and Western Africa, promoted by more conducive weather and, in the case of the latter, state assistance to the sector.
The 2018 season is well advanced in Eastern and Southern Africa, where producers are already collecting their first crop of the season or are about to do so. Despite lingering concerns over Fall Armyworm infestations, as well as a somewhat uneven geographical distribution of the rains, growing conditions this season have generally been more conducive than in 2017, auguring well for crops in the two sub-regions. Although much will depend on precipitation patterns between June and October, preliminary prospects also point to further production inroads being made in Western Africa, where the sector continues to enjoy special attention often under self-sufficiency programmes. Put together, these gains are anticipated to outweigh a production cut in Egypt, where competition with other crops and official steps to conserve scarce water resources are set to intensify in 2018.
0
7
14
21
28
35
2014 2015 2016 2017 2018
Egypt Nigeria Madagascar Tanzania Mali Others
Million tonnes
f'cast
Paddy production in Africa
FAO RICE MARKET MONITOR / APRIL 2018 PRODUCTION
7
In Northern Africa, although some areas were diverted to cotton, 2017 rice acreage in Egypt continued to exceed official limits set to preserve water, due to the crop’s profitability and its use in the delta to contain salinity problems. In response, the Government announced in January that it would cut the ceiling on rice cultivation for the 2018 season by one third to 724 000 feddans (304 000 hectares).3 The notice was accompanied by warnings that would have the EGP 8 000 (USD 453) per hectare fine for paddies outside of allotted areas enforced vigorously over the season. Although these announcements have reportedly triggered an increase in local rice quotations, they are likely to encourage more producers to shift away from rice cultivation, since they come in the context of more attractive cotton margins, ongoing restrictions on rice exports and hefty inventories resulting from two seasons of production gains and consumers’ substitution of rice for cheaper alternatives. As a result, 2018 output in Egypt is seen in the order of 6.1 million tonnes, implying a 4 percent year-on-year reduction.
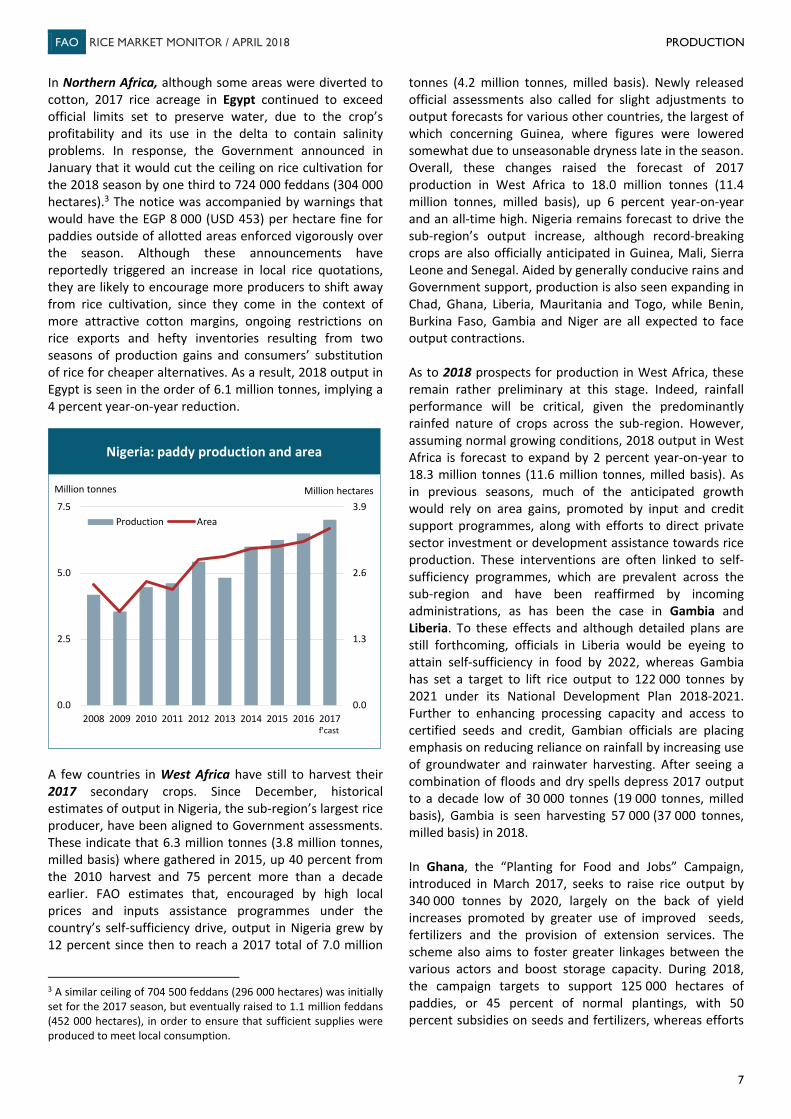
A few countries in West Africa have still to harvest their 2017 secondary crops. Since December, historical estimates of output in Nigeria, the sub-region’s largest rice producer, have been aligned to Government assessments. These indicate that 6.3 million tonnes (3.8 million tonnes, milled basis) where gathered in 2015, up 40 percent from the 2010 harvest and 75 percent more than a decade earlier. FAO estimates that, encouraged by high local prices and inputs assistance programmes under the country’s self-sufficiency drive, output in Nigeria grew by 12 percent since then to reach a 2017 total of 7.0 million
3 A similar ceiling of 704 500 feddans (296 000 hectares) was initially set for the 2017 season, but eventually raised to 1.1 million feddans (452 000 hectares), in order to ensure that sufficient supplies were produced to meet local consumption.
tonnes (4.2 million tonnes, milled basis). Newly released official assessments also called for slight adjustments to output forecasts for various other countries, the largest of which concerning Guinea, where figures were lowered somewhat due to unseasonable dryness late in the season. Overall, these changes raised the forecast of 2017 production in West Africa to 18.0 million tonnes (11.4 million tonnes, milled basis), up 6 percent year-on-year and an all-time high. Nigeria remains forecast to drive the sub-region’s output increase, although record-breaking crops are also officially anticipated in Guinea, Mali, Sierra Leone and Senegal. Aided by generally conducive rains and Government support, production is also seen expanding in Chad, Ghana, Liberia, Mauritania and Togo, while Benin, Burkina Faso, Gambia and Niger are all expected to face output contractions. As to 2018 prospects for production in West Africa, these remain rather preliminary at this stage. Indeed, rainfall performance will be critical, given the predominantly rainfed nature of crops across the sub-region. However, assuming normal growing conditions, 2018 output in West Africa is forecast to expand by 2 percent year-on-year to 18.3 million tonnes (11.6 million tonnes, milled basis). As in previous seasons, much of the anticipated growth would rely on area gains, promoted by input and credit support programmes, along with efforts to direct private sector investment or development assistance towards rice production. These interventions are often linked to self-sufficiency programmes, which are prevalent across the sub-region and have been reaffirmed by incoming administrations, as has been the case in Gambia and Liberia. To these effects and although detailed plans are still forthcoming, officials in Liberia would be eyeing to attain self-sufficiency in food by 2022, whereas Gambia has set a target to lift rice output to 122 000 tonnes by 2021 under its National Development Plan 2018-2021. Further to enhancing processing capacity and access to certified seeds and credit, Gambian officials are placing emphasis on reducing reliance on rainfall by increasing use of groundwater and rainwater harvesting. After seeing a combination of floods and dry spells depress 2017 output to a decade low of 30 000 tonnes (19 000 tonnes, milled basis), Gambia is seen harvesting 57 000 (37 000 tonnes, milled basis) in 2018. In Ghana, the “Planting for Food and Jobs” Campaign, introduced in March 2017, seeks to raise rice output by 340 000 tonnes by 2020, largely on the back of yield increases promoted by greater use of improved seeds, fertilizers and the provision of extension services. The scheme also aims to foster greater linkages between the various actors and boost storage capacity. During 2018, the campaign targets to support 125 000 hectares of paddies, or 45 percent of normal plantings, with 50 percent subsidies on seeds and fertilizers, whereas efforts
0.0
1.3
2.6
3.9
0.0
2.5
5.0
7.5
2008 2009 2010 2011 2012 2013 2014 2015 2016 2017
Production Area
Million tonnes Million hectares
Nigeria: paddy production and area
f'cast
FAO RICE MARKET MONITOR / APRIL 2018 PRODUCTION
8
to expand irrigation coverage are ongoing under the “One village, One dam” scheme. Aided by such interventions, 2018 output in Ghana is projected to reach 790 000 tonnes (474 000 tonnes, milled basis), up 9 percent from 2017 and an all-time record. In the case of Guinea, attractive local quotations and input assistance schemes are seen raising output to 2.2 million tonnes (1.5 million tonnes, milled basis), whereas Nigeria may harvest 7.2 million tonnes (4.3 million tonnes, milled basis) in 2018, up 3 percent year-on-year. Although the 2017 good harvest has weighed on Nigerian prices somewhat, these remain well over pre-2016 levels, which is likely to encourage producers to continue expanding acreage. Meanwhile, Nigerian production in roads in recent years are being locally accredited to input and credit assistance schemes under the 2011-launched Agricultural Transformation Agenda, which was followed in late 2015 by the Anchor Borrower’s Programme (ABP). Since its inception, the ABP is reported to have directed NGN 55 billion (USD 152 million) to implement out-grower schemes and avail small-scale farmers with training, extension services and credit at subsidised rates. The ABP now covers 32 states across the country and seven commodities other than rice. Under the Presidential Fertilizer Initiative, officials also aim to enhance local production of fertilizers, to avail farmers with the input at a subsidised rate of NGN 5 500 per 50 kg bag (USD 305 per tonne). Among other producers in the sub-region, prospects are also favourable for Chad, Cote d’Ivoire, Senegal, Sierra Leone, and Togo. Output is also seen recovering in Benin, Burkina Faso, Guinea Bissau and Niger, provided growing conditions return to normal and, in the case of Burkina Faso, that the pests and grain-eating birds attacks experienced in 2017 are contained. Instead, 2018 production is forecast to decline by 1 percent in Mauritania to 231 000 (139 000 tonnes, milled basis), depressed by sector indebtedness and related constraints in accessing credit. In Mali, a forecast 2 percent annual reduction to 2.9 million tonnes (1.9 million tonnes, milled basis), hinges on expectations of yields returning to more normal levels, compared to the record of 3.8 tonnes per hectare officially reported for 2017. Part of these reductions could however be offset by area increases, should lands fallowed in 2017 due to erratic rains and reduced river flows return to cultivation. In Mali’s Office du Niger, which targets to produce 1.1 million tonnes of paddy in 2018, area gains would be aided by ongoing improvements in draining infrastructure and irrigation coverage. This is even if concerns linger in the scheme over civil insecurity linked to the presence of armed groups in central parts of the country.
In Eastern Africa, estimates of 2017 production in the United Republic of Tanzania have been aligned to preliminary Government estimates showing a sharper production reduction than previously envisaged. On the whole, 2.5 million tonnes (1.6 million tonnes, milled basis) are reported to have been gathered in 2017, down nearly 1.0 million tonnes from the 2016 all-time high and a four-year low. Crops in Tanzania were negatively impacted by irregular rains in 2017. As to 2018 progress, barring some northeastern and coastal producing states, much of the country has received timely and abundant rains since the October start of cropping activities. Some concerns however linger regarding pest attacks. Although estimates of rice-specific losses are not readily available, Tanzania stands among the countries hit by fall armyworms, which have spread across much of sub-Saharan Africa, since been first detected in 2016. Local reports also suggest that rodents have also posed challenges this season. Assuming no major disruptions occur and considering weather forecasts of normal or above normal rains through the May start of harvesting activities, Tanzania is anticipated to gather 3.1 million tonnes (2.0 million tonnes, milled basis) in 2018, implying a 630 000 tonne annual recovery. In February, the Government of Kenya announced that it aimed to achieve self-sufficiency in rice by boosting output to 400 000 tonnes by 2022, under its “Big Four” economic agenda. Interventions to this end would include bringing idle land into cultivation of rice and three other crops under public-private partnerships, expanding irrigation coverage and access to basic inputs and credit. With rice anticipated to remain an attractive production choice, notwithstanding some pressure on local quotations following the end of the 2017 harvest, Kenya is forecast to produce 11 percent more than in 2017, or 150 000 tonnes (98 000 tonnes, milled basis). Production prospects are also favorable for Burundi and Rwanda, even if in the latter reported rainfall anomalies in eastern producing provinces may entail a slowdown in growth relative to previous seasons. Main crops have reached the harvesting stage across Southern Africa, where a total of 4.2 million tonnes (2.8 million tonnes, milled basis) are predicted to be gathered in 2018, up 12 percent year-on-year. To a large extent, the increase mirrors expectations that timely and conducive rains in the main rice-producing northern and central areas of Madagascar, will sustain a 14 percent production recovery in the country to 3.6 million tonnes (2.4 million tonnes, milled basis). At that level, output in Madagascar would however still fall short of the 2016 outcome, considering that important south-eastern producing provinces were beset by poor performing rains since the October start of cropping activities and damages caused by the early January strike of cyclone Ava. Last year’s severe output reduction is also likely to have posed general constraints in seed availabilities for plantings.
FAO RICE MARKET MONITOR / APRIL 2018 PRODUCTION
9
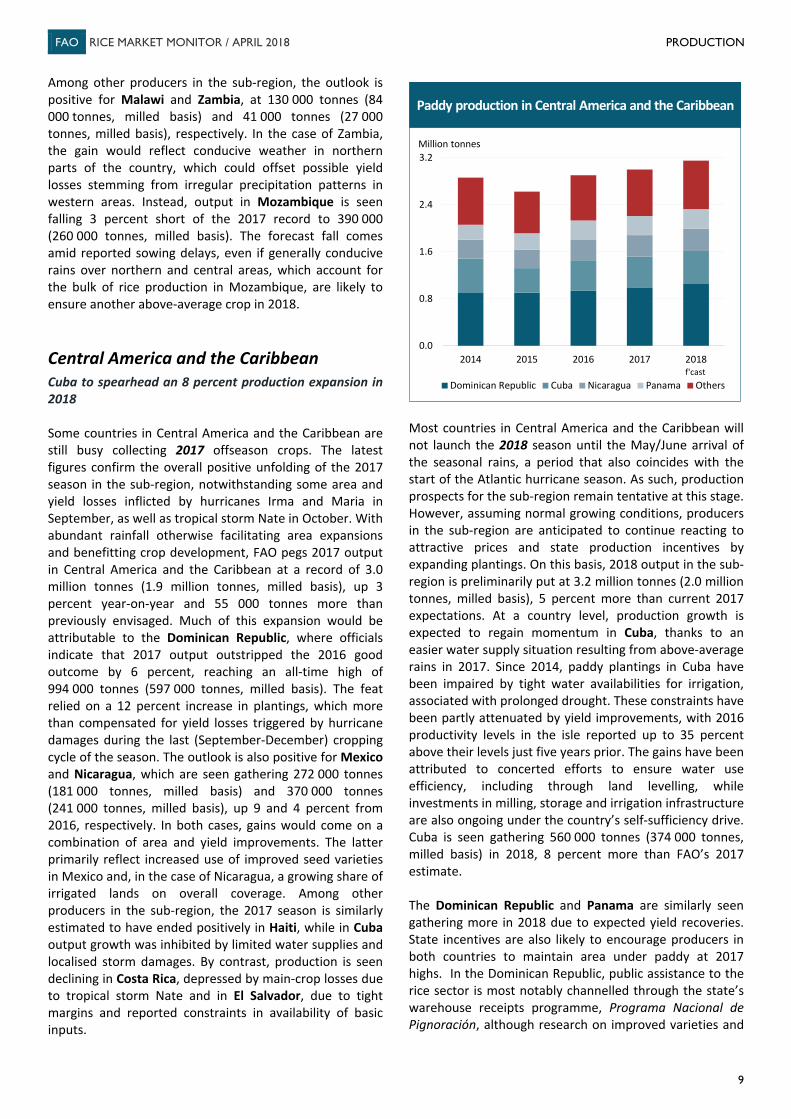
Among other producers in the sub-region, the outlook is positive for Malawi and Zambia, at 130 000 tonnes (84 000 tonnes, milled basis) and 41 000 tonnes (27 000 tonnes, milled basis), respectively. In the case of Zambia, the gain would reflect conducive weather in northern parts of the country, which could offset possible yield losses stemming from irregular precipitation patterns in western areas. Instead, output in Mozambique is seen falling 3 percent short of the 2017 record to 390 000 (260 000 tonnes, milled basis). The forecast fall comes amid reported sowing delays, even if generally conducive rains over northern and central areas, which account for the bulk of rice production in Mozambique, are likely to ensure another above-average crop in 2018. Central America and the Caribbean Cuba to spearhead an 8 percent production expansion in 2018 Some countries in Central America and the Caribbean are still busy collecting 2017 offseason crops. The latest figures confirm the overall positive unfolding of the 2017 season in the sub-region, notwithstanding some area and yield losses inflicted by hurricanes Irma and Maria in September, as well as tropical storm Nate in October. With abundant rainfall otherwise facilitating area expansions and benefitting crop development, FAO pegs 2017 output in Central America and the Caribbean at a record of 3.0 million tonnes (1.9 million tonnes, milled basis), up 3 percent year-on-year and 55 000 tonnes more than previously envisaged. Much of this expansion would be attributable to the Dominican Republic, where officials indicate that 2017 output outstripped the 2016 good outcome by 6 percent, reaching an all-time high of 994 000 tonnes (597 000 tonnes, milled basis). The feat relied on a 12 percent increase in plantings, which more than compensated for yield losses triggered by hurricane damages during the last (September-December) cropping cycle of the season. The outlook is also positive for Mexico and Nicaragua, which are seen gathering 272 000 tonnes (181 000 tonnes, milled basis) and 370 000 tonnes (241 000 tonnes, milled basis), up 9 and 4 percent from 2016, respectively. In both cases, gains would come on a combination of area and yield improvements. The latter primarily reflect increased use of improved seed varieties in Mexico and, in the case of Nicaragua, a growing share of irrigated lands on overall coverage. Among other producers in the sub-region, the 2017 season is similarly estimated to have ended positively in Haiti, while in Cuba output growth was inhibited by limited water supplies and localised storm damages. By contrast, production is seen declining in Costa Rica, depressed by main-crop losses due to tropical storm Nate and in El Salvador, due to tight margins and reported constraints in availability of basic inputs.
Most countries in Central America and the Caribbean will not launch the 2018 season until the May/June arrival of the seasonal rains, a period that also coincides with the start of the Atlantic hurricane season. As such, production prospects for the sub-region remain tentative at this stage. However, assuming normal growing conditions, producers in the sub-region are anticipated to continue reacting to attractive prices and state production incentives by expanding plantings. On this basis, 2018 output in the sub-region is preliminarily put at 3.2 million tonnes (2.0 million tonnes, milled basis), 5 percent more than current 2017 expectations. At a country level, production growth is expected to regain momentum in Cuba, thanks to an easier water supply situation resulting from above-average rains in 2017. Since 2014, paddy plantings in Cuba have been impaired by tight water availabilities for irrigation, associated with prolonged drought. These constraints have been partly attenuated by yield improvements, with 2016 productivity levels in the isle reported up to 35 percent above their levels just five years prior. The gains have been attributed to concerted efforts to ensure water use efficiency, including through land levelling, while investments in milling, storage and irrigation infrastructure are also ongoing under the country’s self-sufficiency drive. Cuba is seen gathering 560 000 tonnes (374 000 tonnes, milled basis) in 2018, 8 percent more than FAO’s 2017 estimate. The Dominican Republic and Panama are similarly seen gathering more in 2018 due to expected yield recoveries. State incentives are also likely to encourage producers in both countries to maintain area under paddy at 2017 highs. In the Dominican Republic, public assistance to the rice sector is most notably channelled through the state’s warehouse receipts programme, Programa Nacional de Pignoración, although research on improved varieties and
0.0
0.8
1.6
2.4
3.2
2014 2015 2016 2017 2018
Dominican Republic Cuba Nicaragua Panama Others
Million tonnes
Paddy production in Central America and the Caribbean
f'cast
FAO RICE MARKET MONITOR / APRIL 2018 PRODUCTION
10
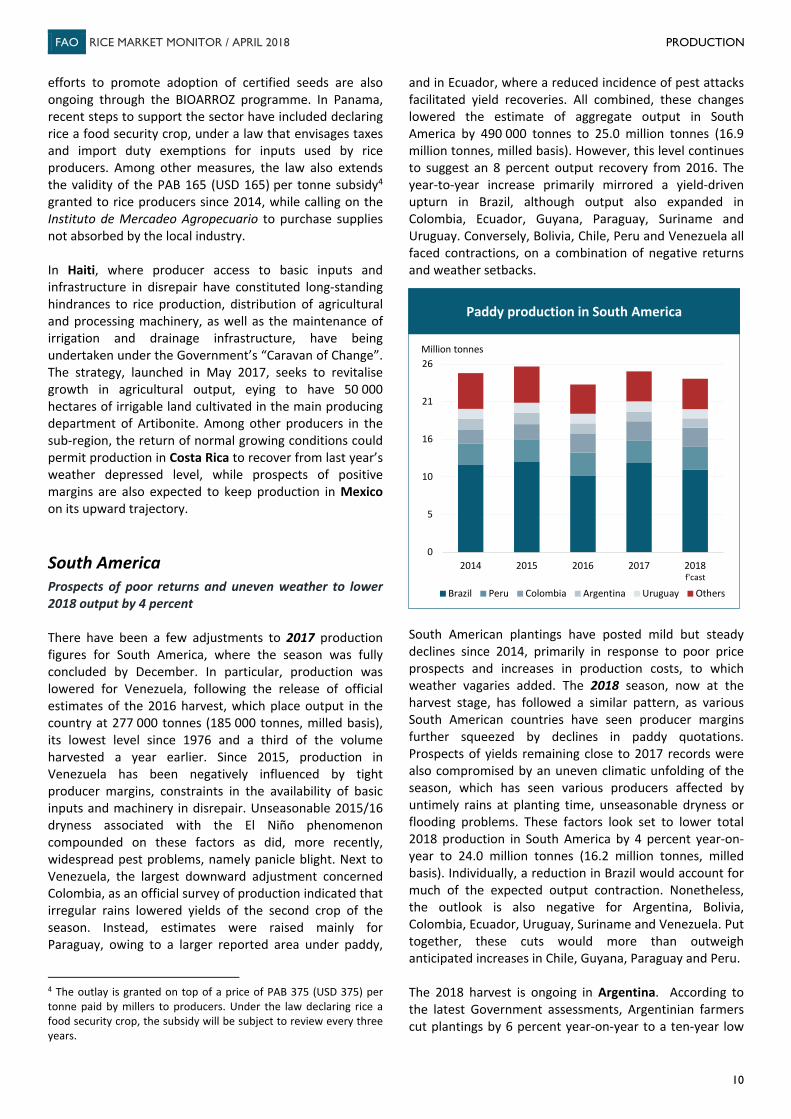
efforts to promote adoption of certified seeds are also ongoing through the BIOARROZ programme. In Panama, recent steps to support the sector have included declaring rice a food security crop, under a law that envisages taxes and import duty exemptions for inputs used by rice producers. Among other measures, the law also extends the validity of the PAB 165 (USD 165) per tonne subsidy4 granted to rice producers since 2014, while calling on the Instituto de Mercadeo Agropecuario to purchase supplies not absorbed by the local industry. In Haiti, where producer access to basic inputs and infrastructure in disrepair have constituted long-standing hindrances to rice production, distribution of agricultural and processing machinery, as well as the maintenance of irrigation and drainage infrastructure, have being undertaken under the Government’s “Caravan of Change”. The strategy, launched in May 2017, seeks to revitalise growth in agricultural output, eying to have 50 000 hectares of irrigable land cultivated in the main producing department of Artibonite. Among other producers in the sub-region, the return of normal growing conditions could permit production in Costa Rica to recover from last year’s weather depressed level, while prospects of positive margins are also expected to keep production in Mexico on its upward trajectory. South America Prospects of poor returns and uneven weather to lower 2018 output by 4 percent There have been a few adjustments to 2017 production figures for South America, where the season was fully concluded by December. In particular, production was lowered for Venezuela, following the release of official estimates of the 2016 harvest, which place output in the country at 277 000 tonnes (185 000 tonnes, milled basis), its lowest level since 1976 and a third of the volume harvested a year earlier. Since 2015, production in Venezuela has been negatively influenced by tight producer margins, constraints in the availability of basic inputs and machinery in disrepair. Unseasonable 2015/16 dryness associated with the El Niño phenomenon compounded on these factors as did, more recently, widespread pest problems, namely panicle blight. Next to Venezuela, the largest downward adjustment concerned Colombia, as an official survey of production indicated that irregular rains lowered yields of the second crop of the season. Instead, estimates were raised mainly for Paraguay, owing to a larger reported area under paddy,
4 The outlay is granted on top of a price of PAB 375 (USD 375) per tonne paid by millers to producers. Under the law declaring rice a food security crop, the subsidy will be subject to review every three years.
and in Ecuador, where a reduced incidence of pest attacks facilitated yield recoveries. All combined, these changes lowered the estimate of aggregate output in South America by 490 000 tonnes to 25.0 million tonnes (16.9 million tonnes, milled basis). However, this level continues to suggest an 8 percent output recovery from 2016. The year-to-year increase primarily mirrored a yield-driven upturn in Brazil, although output also expanded in Colombia, Ecuador, Guyana, Paraguay, Suriname and Uruguay. Conversely, Bolivia, Chile, Peru and Venezuela all faced contractions, on a combination of negative returns and weather setbacks.
South American plantings have posted mild but steady declines since 2014, primarily in response to poor price prospects and increases in production costs, to which weather vagaries added. The 2018 season, now at the harvest stage, has followed a similar pattern, as various South American countries have seen producer margins further squeezed by declines in paddy quotations. Prospects of yields remaining close to 2017 records were also compromised by an uneven climatic unfolding of the season, which has seen various producers affected by untimely rains at planting time, unseasonable dryness or flooding problems. These factors look set to lower total 2018 production in South America by 4 percent year-on-year to 24.0 million tonnes (16.2 million tonnes, milled basis). Individually, a reduction in Brazil would account for much of the expected output contraction. Nonetheless, the outlook is also negative for Argentina, Bolivia, Colombia, Ecuador, Uruguay, Suriname and Venezuela. Put together, these cuts would more than outweigh anticipated increases in Chile, Guyana, Paraguay and Peru. The 2018 harvest is ongoing in Argentina. According to the latest Government assessments, Argentinian farmers cut plantings by 6 percent year-on-year to a ten-year low
0
5
10
16
21
26
2014 2015 2016 2017 2018
Brazil Peru Colombia Argentina Uruguay Others
Million tonnes
f'cast
Paddy production in South America
FAO RICE MARKET MONITOR / APRIL 2018 PRODUCTION
11
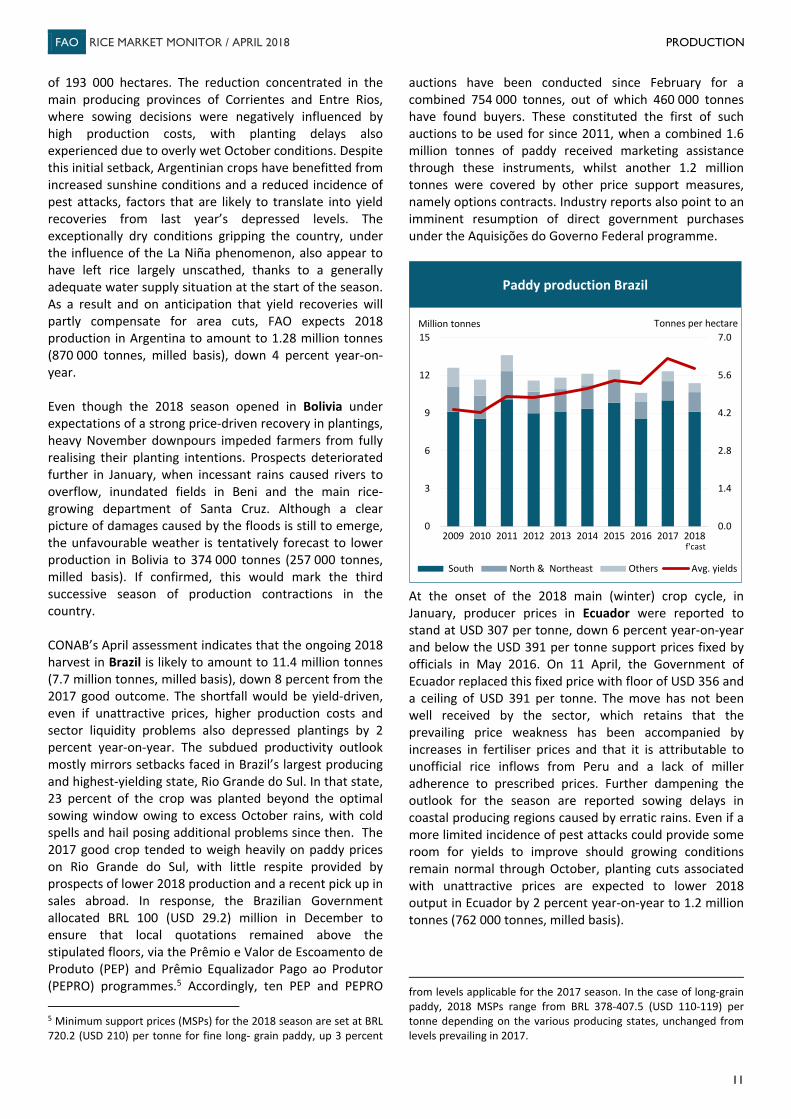
of 193 000 hectares. The reduction concentrated in the main producing provinces of Corrientes and Entre Rios, where sowing decisions were negatively influenced by high production costs, with planting delays also experienced due to overly wet October conditions. Despite this initial setback, Argentinian crops have benefitted from increased sunshine conditions and a reduced incidence of pest attacks, factors that are likely to translate into yield recoveries from last year’s depressed levels. The exceptionally dry conditions gripping the country, under the influence of the La Niña phenomenon, also appear to have left rice largely unscathed, thanks to a generally adequate water supply situation at the start of the season. As a result and on anticipation that yield recoveries will partly compensate for area cuts, FAO expects 2018 production in Argentina to amount to 1.28 million tonnes (870 000 tonnes, milled basis), down 4 percent year-on-year. Even though the 2018 season opened in Bolivia under expectations of a strong price-driven recovery in plantings, heavy November downpours impeded farmers from fully realising their planting intentions. Prospects deteriorated further in January, when incessant rains caused rivers to overflow, inundated fields in Beni and the main rice-growing department of Santa Cruz. Although a clear picture of damages caused by the floods is still to emerge, the unfavourable weather is tentatively forecast to lower production in Bolivia to 374 000 tonnes (257 000 tonnes, milled basis). If confirmed, this would mark the third successive season of production contractions in the country. CONAB’s April assessment indicates that the ongoing 2018 harvest in Brazil is likely to amount to 11.4 million tonnes (7.7 million tonnes, milled basis), down 8 percent from the 2017 good outcome. The shortfall would be yield-driven, even if unattractive prices, higher production costs and sector liquidity problems also depressed plantings by 2 percent year-on-year. The subdued productivity outlook mostly mirrors setbacks faced in Brazil’s largest producing and highest-yielding state, Rio Grande do Sul. In that state, 23 percent of the crop was planted beyond the optimal sowing window owing to excess October rains, with cold spells and hail posing additional problems since then. The 2017 good crop tended to weigh heavily on paddy prices on Rio Grande do Sul, with little respite provided by prospects of lower 2018 production and a recent pick up in sales abroad. In response, the Brazilian Government allocated BRL 100 (USD 29.2) million in December to ensure that local quotations remained above the stipulated floors, via the Prêmio e Valor de Escoamento de Produto (PEP) and Prêmio Equalizador Pago ao Produtor (PEPRO) programmes.5 Accordingly, ten PEP and PEPRO 5 Minimum support prices (MSPs) for the 2018 season are set at BRL 720.2 (USD 210) per tonne for fine long- grain paddy, up 3 percent
auctions have been conducted since February for a combined 754 000 tonnes, out of which 460 000 tonnes have found buyers. These constituted the first of such auctions to be used for since 2011, when a combined 1.6 million tonnes of paddy received marketing assistance through these instruments, whilst another 1.2 million tonnes were covered by other price support measures, namely options contracts. Industry reports also point to an imminent resumption of direct government purchases under the Aquisições do Governo Federal programme.
At the onset of the 2018 main (winter) crop cycle, in January, producer prices in Ecuador were reported to stand at USD 307 per tonne, down 6 percent year-on-year and below the USD 391 per tonne support prices fixed by officials in May 2016. On 11 April, the Government of Ecuador replaced this fixed price with floor of USD 356 and a ceiling of USD 391 per tonne. The move has not been well received by the sector, which retains that the prevailing price weakness has been accompanied by increases in fertiliser prices and that it is attributable to unofficial rice inflows from Peru and a lack of miller adherence to prescribed prices. Further dampening the outlook for the season are reported sowing delays in coastal producing regions caused by erratic rains. Even if a more limited incidence of pest attacks could provide some room for yields to improve should growing conditions remain normal through October, planting cuts associated with unattractive prices are expected to lower 2018 output in Ecuador by 2 percent year-on-year to 1.2 million tonnes (762 000 tonnes, milled basis).
from levels applicable for the 2017 season. In the case of long-grain paddy, 2018 MSPs range from BRL 378-407.5 (USD 110-119) per tonne depending on the various producing states, unchanged from levels prevailing in 2017.
0.0
1.4
2.8
4.2
5.6
7.0
0
3
6
9
12
15
2009 2010 2011 2012 2013 2014 2015 2016 2017 2018
South North & Northeast Others Avg. yields
Million tonnes
Paddy production Brazil
f'cast
Tonnes per hectare
FAO RICE MARKET MONITOR / APRIL 2018 PRODUCTION
12
A favourable 2017 export performance provided a boost to Guyana’s export-oriented rice sector, setting the stage for a favourable 2018 spring-crop cycle, which has just ended. The season progressed generally well from a climate perspective, with somewhat dry weather during the first quarter of the year and pest attacks not reported to have posed major problems. As a result and assuming growing conditions remain normal for the remainder of the season, FAO anticipates Guyana will gather 985 000 tonnes (640 000 tonnes, milled basis) in 2018, implying a 2 percent annual increase and the second highest on record. FAO has upgraded its estimates of 2017 production in Paraguay, following the release of December government assessments. These point to continued area gains sustaining an 8 percent production expansion in 2017 to an all-time high of 927 000 tonnes (649 000 tonnes, milled basis). The increase would be notwithstanding earlier concerns of production losses induced by excess rains and ensuing floods. FAO anticipates Paraguay will outdo this production level in 2018, reaping 990 000 tonnes (693 000 tonnes, milled basis). The positive outlook mirrors expectations that a good export pace in 2017, combined with credit assistance programmes for small and medium size producers and investments in milling infrastructure, will translate into further area expansions. Growing conditions have also been generally beneficial, barring some rain-induced planting delays. After seeing 2017 output depressed by flooding problems and tight water availabilities of irrigation, Peru is forecast to see output recovery by 4 percent in 2018 to 3.2 million tonnes (2.2 million tonnes, milled basis). The forecast hinges on expectations of yield recoveries and fewer area losses, even if much will depend on weather conditions in the months ahead. On the area front, even though planting progress has been strong to date, the outlook for the remainder of the season is clouded by uncertainties regarding the water supply situation. These would particularly concern the main-producing province of Piura, where plantings have already trailed behind year-earlier levels and where forecasts indicate rainfall could remain below average levels through May. Peru’s rice sector has also expressed growing discontent over competition with imports, particularly those originated in Asia. In response, officials announced in December that they would allocate PEN 50 (USD 15) million to promote greater usage of improved seed varieties, as well as passing amendments to specific duties levied on rice imports applied under the price band mechanism. The production outlook is negative for Uruguay, where the 2018 harvest is ongoing. FAO anticipates the country will gather 1.28 million tonnes (896 000 tonnes, milled basis) this season, down 130 000 tonnes year-on-year. Much like
various countries in the southern cone, growing conditions in Uruguay have been sub-par this season. The excess rains that delayed plantings in October were followed by good conducive sunshine and warm conditions lasting into February, when cool temperatures set in. Although these factors are anticipated to lower yields from the records attained in 2017, much of Uruguay’s expected production contraction in 2018 would be area driven, coming in response to prospects of negative returns due to constraining fuel and energy costs and sector indebtedness. Such constraints prompted the Government to approve a 15 percent reduction in energy charges on irrigation and processing in January, as well as a one-year refund on value added taxes applied on fuel. North America, Europe and Oceania Early 2018 prospects point to steady-to-lower Japonica acreage in the United States, the EU and Australia In North America, the USDA has made only marginal adjustments to 2017 production estimates for the United States since December. Depressed by price-driven area cuts and weather setbacks, output in the country is put 20 percent below the 2016 figure, at a 21-year low of 8.1 million tonnes (5.7 million tonnes, milled basis). Plantings activities of 2018 crops are already ongoing in the United States. According to the March-released Prospective Plantings survey, US producers intend to sow 1.1 million hectares in 2018, up 9 percent year-on-year. The upturn would be consistent with prospects of reduced competition with other crops following a recovery in local quotations, even if somewhat surprisingly short/medium grain plantings are seen remaining close to the 2016 depressed level. The subdued outlook comes amid an expected 4 percent cut in medium-grain area in California, the country’s largest Japonica producing state, which likely reflects grower apprehensions about water supplies at the time of the survey that have since eased. Based on these survey results and on official expectations that normal growing conditions will keep yield on an upward trend, 2018 production in the United States is preliminarily pegged at 9.2 million tonnes (6.5 million tonnes, milled basis), up 14 percent year-on-year and an overall average outcome. All rice-producing countries in the European Union are estimated to have closed the 2017 season with smaller harvests, with the exception of France, Greece and Romania, where yield improvements promoted mild production increases. Cuts were mostly imputable to prospects of reduced remuneration, although tight water availabilities in Portugal and yield reductions in Italy and Spain also contributed to the contraction. A total of 2.9 million tonnes (1.7 million tonnes, milled basis) are estimated to have been gathered by the block in 2017,
FAO RICE MARKET MONITOR / APRIL 2018 INTERNATIONAL TRADE
13
down 3 percent year-on-year. The production outlook for the 2018 season in the European Union is also downcast, tentatively pointing to a further 2 percent reduction to 2.8 million tonnes (1.7 million tonnes, milled basis). Looking at the block’s major producers, prospects are most subdued for Italy, where early industry indications point to a likely 5 percent annual reduction in acreage to 217 000 hectares. The retrenchment would namely concern traditional varieties, such as Arborio and Carnaroli, whose prices have remained under pressure by successive years of production increases following a shift away from Indica varieties. Early prospects for Spain and Portugal were also initially clouded by lingering water constraints, owing to prolonged dryness lasting into February. However, above average rains have since eased their water supply situation, which, combined with more normal temperatures and a reduced incidence of pests, could sustain some production recoveries in both countries. In Oceania, ABARES has maintained its estimate of 2018 plantings in Australia at 80 000 hectares. This level would stand just 2 000 hectares short of the 2017 level, as prospects of positive returns would have encouraged producers to continue favouring rice, notwithstanding lower water allocations and heightened competition with cotton. Since being planted, Australia’s 2018 crop, which is now being gathered, has also benefitted from conducive growing conditions. ABARES expects that these factors will result in a 2018 harvest of 800 000 tonnes (534 000 tonnes, milled basis), which is just 9 000 tonnes below the 2017 good outcome.
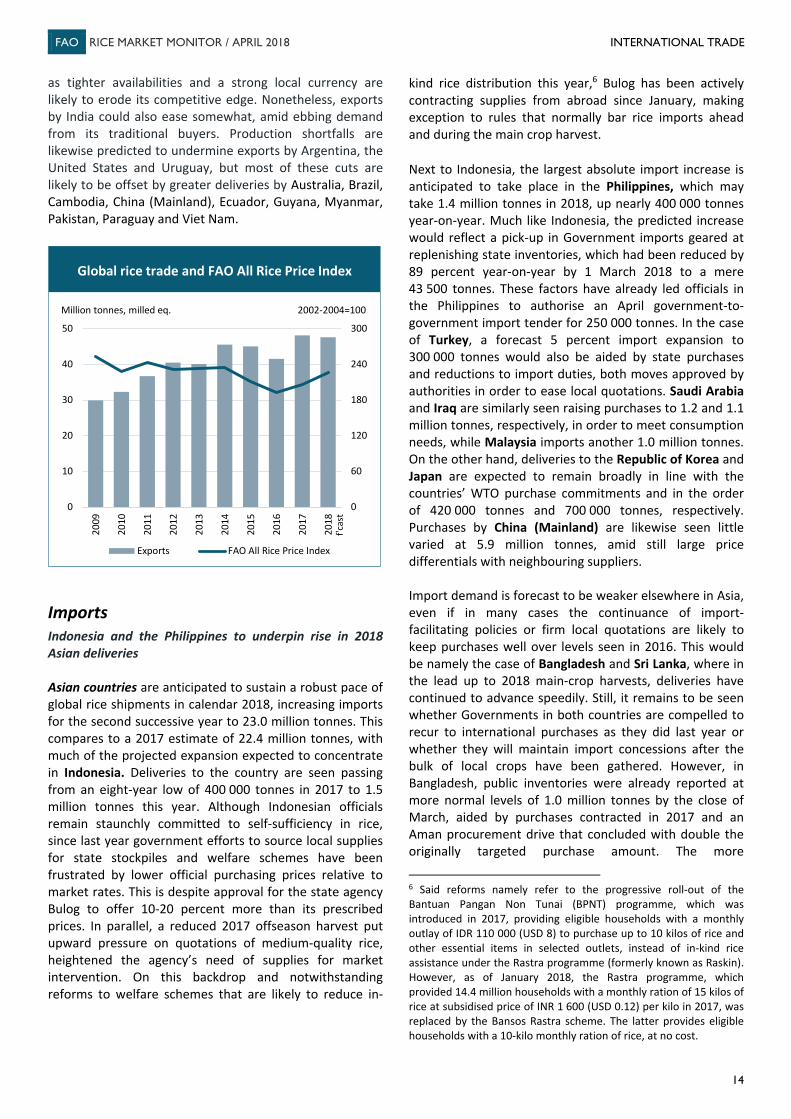
INTERNATIONAL TRADE Trade in 2018 to trail closely behind year-earlier record FAO has upgraded its forecast of world rice deliveries in calendar 2018 by 1.9 million tonnes since December. The revision primarily stems from higher expected imports by Bangladesh and Indonesia, largely the reflection of active purchases conducted by both countries in the first quarter of the year. Expectations of greater purchases of paddy across borders also raised import forecasts for Viet Nam, while deliveries to Iraq, Nepal, the Philippines and Saudi Arabia were paired down, following the release of consolidated 2017 trade figures for these countries. On the supply side, these adjustments were primarily met by raising export forecasts for India, consistent with the improved crop prospects for the country. Nonetheless, export expectations were also raised for Brazil, Cambodia and Myanmar, more than compensating for cuts in Thailand and the United States. Based on these adjustments, global rice deliveries in calendar 2018 are now anticipated to amount to 47.6 million tonnes (milled basis). This level would be just shy of the 2017 all-time record, now estimated at 48.1 million tonnes. The predicted 0.5 million tonne annual reduction would concentrate in Africa and Latin America and the Caribbean, where higher international prices and ample inventories amassed through good crops or large 2017 imports are anticipated to dampen demand over the year. However, import reductions in these regions stand against prospects of Asian purchases growing to their second highest on record, as important Asian buyers continue recurring to international purchases to replenish inventories and quell pressure on local quotations. Import demand is also forecast to remain comparatively firm in the United States and in Europe. Among suppliers, the largest annual export cut is envisaged to concern Thailand,
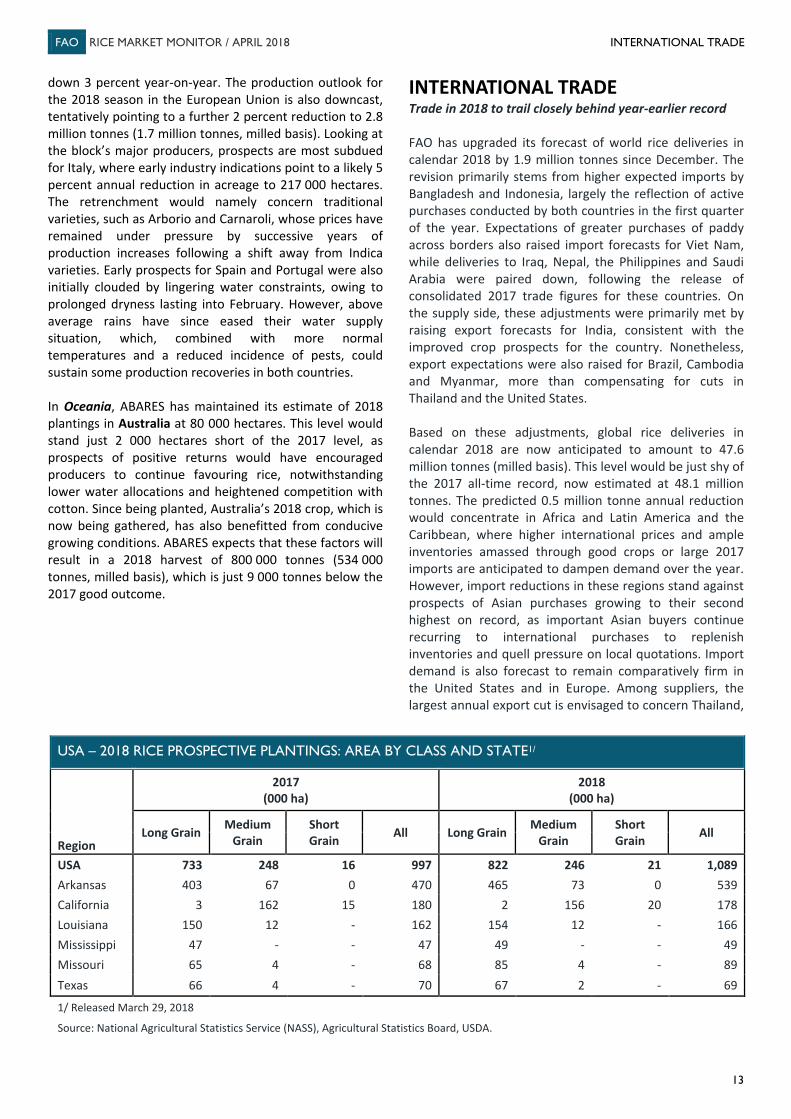
USA – 2018 RICE PROSPECTIVE PLANTINGS: AREA BY CLASS AND STATE1/
Region
2017 (000 ha)
2018 (000 ha)
Long Grain Medium Grain
Short Grain All Long Grain Medium
Grain Short Grain All
USA 733 248 16 997 822 246 21 1,089 Arkansas 403 67 0 470 465 73 0 539 California 3 162 15 180 2 156 20 178 Louisiana 150 12 - 162 154 12 - 166 Mississippi 47 - - 47 49 - - 49 Missouri 65 4 - 68 85 4 - 89 Texas 66 4 - 70 67 2 - 69
1/ Released March 29, 2018
Source: National Agricultural Statistics Service (NASS), Agricultural Statistics Board, USDA.
FAO RICE MARKET MONITOR / APRIL 2018 INTERNATIONAL TRADE
14
as tighter availabilities and a strong local currency are likely to erode its competitive edge. Nonetheless, exports by India could also ease somewhat, amid ebbing demand from its traditional buyers. Production shortfalls are likewise predicted to undermine exports by Argentina, the United States and Uruguay, but most of these cuts are likely to be offset by greater deliveries by Australia, Brazil, Cambodia, China (Mainland), Ecuador, Guyana, Myanmar, Pakistan, Paraguay and Viet Nam.
Imports Indonesia and the Philippines to underpin rise in 2018 Asian deliveries Asian countries are anticipated to sustain a robust pace of global rice shipments in calendar 2018, increasing imports for the second successive year to 23.0 million tonnes. This compares to a 2017 estimate of 22.4 million tonnes, with much of the projected expansion expected to concentrate in Indonesia. Deliveries to the country are seen passing from an eight-year low of 400 000 tonnes in 2017 to 1.5 million tonnes this year. Although Indonesian officials remain staunchly committed to self-sufficiency in rice, since last year government efforts to source local supplies for state stockpiles and welfare schemes have been frustrated by lower official purchasing prices relative to market rates. This is despite approval for the state agency Bulog to offer 10-20 percent more than its prescribed prices. In parallel, a reduced 2017 offseason harvest put upward pressure on quotations of medium-quality rice, heightened the agency’s need of supplies for market intervention. On this backdrop and notwithstanding reforms to welfare schemes that are likely to reduce in-
kind rice distribution this year,6 Bulog has been actively contracting supplies from abroad since January, making exception to rules that normally bar rice imports ahead and during the main crop harvest. Next to Indonesia, the largest absolute import increase is anticipated to take place in the Philippines, which may take 1.4 million tonnes in 2018, up nearly 400 000 tonnes year-on-year. Much like Indonesia, the predicted increase would reflect a pick-up in Government imports geared at replenishing state inventories, which had been reduced by 89 percent year-on-year by 1 March 2018 to a mere 43 500 tonnes. These factors have already led officials in the Philippines to authorise an April government-to-government import tender for 250 000 tonnes. In the case of Turkey, a forecast 5 percent import expansion to 300 000 tonnes would also be aided by state purchases and reductions to import duties, both moves approved by authorities in order to ease local quotations. Saudi Arabia and Iraq are similarly seen raising purchases to 1.2 and 1.1 million tonnes, respectively, in order to meet consumption needs, while Malaysia imports another 1.0 million tonnes. On the other hand, deliveries to the Republic of Korea and Japan are expected to remain broadly in line with the countries’ WTO purchase commitments and in the order of 420 000 tonnes and 700 000 tonnes, respectively. Purchases by China (Mainland) are likewise seen little varied at 5.9 million tonnes, amid still large price differentials with neighbouring suppliers. Import demand is forecast to be weaker elsewhere in Asia, even if in many cases the continuance of import-facilitating policies or firm local quotations are likely to keep purchases well over levels seen in 2016. This would be namely the case of Bangladesh and Sri Lanka, where in the lead up to 2018 main-crop harvests, deliveries have continued to advance speedily. Still, it remains to be seen whether Governments in both countries are compelled to recur to international purchases as they did last year or whether they will maintain import concessions after the bulk of local crops have been gathered. However, in Bangladesh, public inventories were already reported at more normal levels of 1.0 million tonnes by the close of March, aided by purchases contracted in 2017 and an Aman procurement drive that concluded with double the originally targeted purchase amount. The more
6 Said reforms namely refer to the progressive roll-out of the Bantuan Pangan Non Tunai (BPNT) programme, which was introduced in 2017, providing eligible households with a monthly outlay of IDR 110 000 (USD 8) to purchase up to 10 kilos of rice and other essential items in selected outlets, instead of in-kind rice assistance under the Rastra programme (formerly known as Raskin). However, as of January 2018, the Rastra programme, which provided 14.4 million households with a monthly ration of 15 kilos of rice at subsidised price of INR 1 600 (USD 0.12) per kilo in 2017, was replaced by the Bansos Rastra scheme. The latter provides eligible households with a 10-kilo monthly ration of rice, at no cost.
0
60
120
180
240
300
0
10
20
30
40
50
2009
2010
2011
2012
2013
2014
2015
2016
2017
2018
Exports FAO All Rice Price Index
Global rice trade and FAO All Rice Price Index
2002-2004=100Million tonnes, milled eq.
f'cas
t
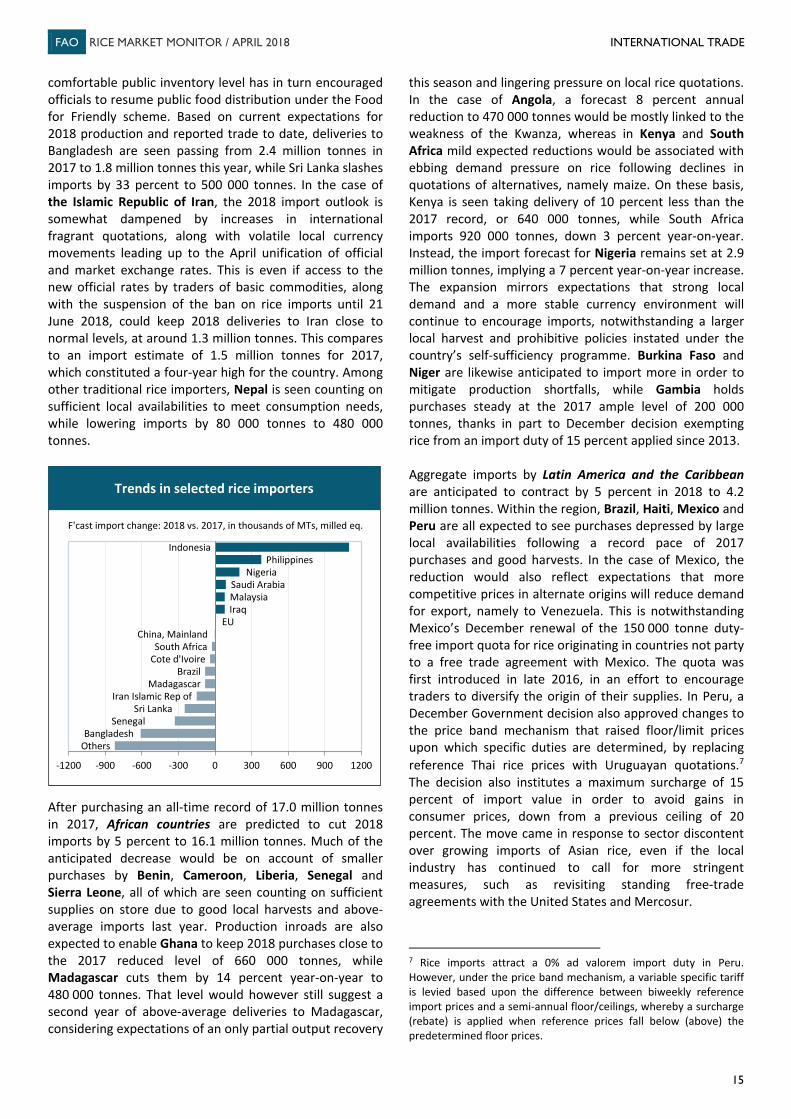
FAO RICE MARKET MONITOR / APRIL 2018 INTERNATIONAL TRADE
15
comfortable public inventory level has in turn encouraged officials to resume public food distribution under the Food for Friendly scheme. Based on current expectations for 2018 production and reported trade to date, deliveries to Bangladesh are seen passing from 2.4 million tonnes in 2017 to 1.8 million tonnes this year, while Sri Lanka slashes imports by 33 percent to 500 000 tonnes. In the case of the Islamic Republic of Iran, the 2018 import outlook is somewhat dampened by increases in international fragrant quotations, along with volatile local currency movements leading up to the April unification of official and market exchange rates. This is even if access to the new official rates by traders of basic commodities, along with the suspension of the ban on rice imports until 21 June 2018, could keep 2018 deliveries to Iran close to normal levels, at around 1.3 million tonnes. This compares to an import estimate of 1.5 million tonnes for 2017, which constituted a four-year high for the country. Among other traditional rice importers, Nepal is seen counting on sufficient local availabilities to meet consumption needs, while lowering imports by 80 000 tonnes to 480 000 tonnes.
After purchasing an all-time record of 17.0 million tonnes in 2017, African countries are predicted to cut 2018 imports by 5 percent to 16.1 million tonnes. Much of the anticipated decrease would be on account of smaller purchases by Benin, Cameroon, Liberia, Senegal and Sierra Leone, all of which are seen counting on sufficient supplies on store due to good local harvests and above-average imports last year. Production inroads are also expected to enable Ghana to keep 2018 purchases close to the 2017 reduced level of 660 000 tonnes, while Madagascar cuts them by 14 percent year-on-year to 480 000 tonnes. That level would however still suggest a second year of above-average deliveries to Madagascar, considering expectations of an only partial output recovery
this season and lingering pressure on local rice quotations. In the case of Angola, a forecast 8 percent annual reduction to 470 000 tonnes would be mostly linked to the weakness of the Kwanza, whereas in Kenya and South Africa mild expected reductions would be associated with ebbing demand pressure on rice following declines in quotations of alternatives, namely maize. On these basis, Kenya is seen taking delivery of 10 percent less than the 2017 record, or 640 000 tonnes, while South Africa imports 920 000 tonnes, down 3 percent year-on-year. Instead, the import forecast for Nigeria remains set at 2.9 million tonnes, implying a 7 percent year-on-year increase. The expansion mirrors expectations that strong local demand and a more stable currency environment will continue to encourage imports, notwithstanding a larger local harvest and prohibitive policies instated under the country’s self-sufficiency programme. Burkina Faso and Niger are likewise anticipated to import more in order to mitigate production shortfalls, while Gambia holds purchases steady at the 2017 ample level of 200 000 tonnes, thanks in part to December decision exempting rice from an import duty of 15 percent applied since 2013. Aggregate imports by Latin America and the Caribbean are anticipated to contract by 5 percent in 2018 to 4.2 million tonnes. Within the region, Brazil, Haiti, Mexico and Peru are all expected to see purchases depressed by large local availabilities following a record pace of 2017 purchases and good harvests. In the case of Mexico, the reduction would also reflect expectations that more competitive prices in alternate origins will reduce demand for export, namely to Venezuela. This is notwithstanding Mexico’s December renewal of the 150 000 tonne duty-free import quota for rice originating in countries not party to a free trade agreement with Mexico. The quota was first introduced in late 2016, in an effort to encourage traders to diversify the origin of their supplies. In Peru, a December Government decision also approved changes to the price band mechanism that raised floor/limit prices upon which specific duties are determined, by replacing reference Thai rice prices with Uruguayan quotations.7 The decision also institutes a maximum surcharge of 15 percent of import value in order to avoid gains in consumer prices, down from a previous ceiling of 20 percent. The move came in response to sector discontent over growing imports of Asian rice, even if the local industry has continued to call for more stringent measures, such as revisiting standing free-trade agreements with the United States and Mercosur.
7 Rice imports attract a 0% ad valorem import duty in Peru. However, under the price band mechanism, a variable specific tariff is levied based upon the difference between biweekly reference import prices and a semi-annual floor/ceilings, whereby a surcharge (rebate) is applied when reference prices fall below (above) the predetermined floor prices.
OthersBangladesh
SenegalSri Lanka
Iran Islamic Rep ofMadagascar
BrazilCote d'IvoireSouth Africa
China, Mainland EU
IraqMalaysiaSaudi Arabia
NigeriaPhilippines
Indonesia
-1200 -900 -600 -300 0 300 600 900 1200
YOY change in imports
F'cast import change: 2018 vs. 2017, in thousands of MTs, milled eq.
Trends in selected rice importers
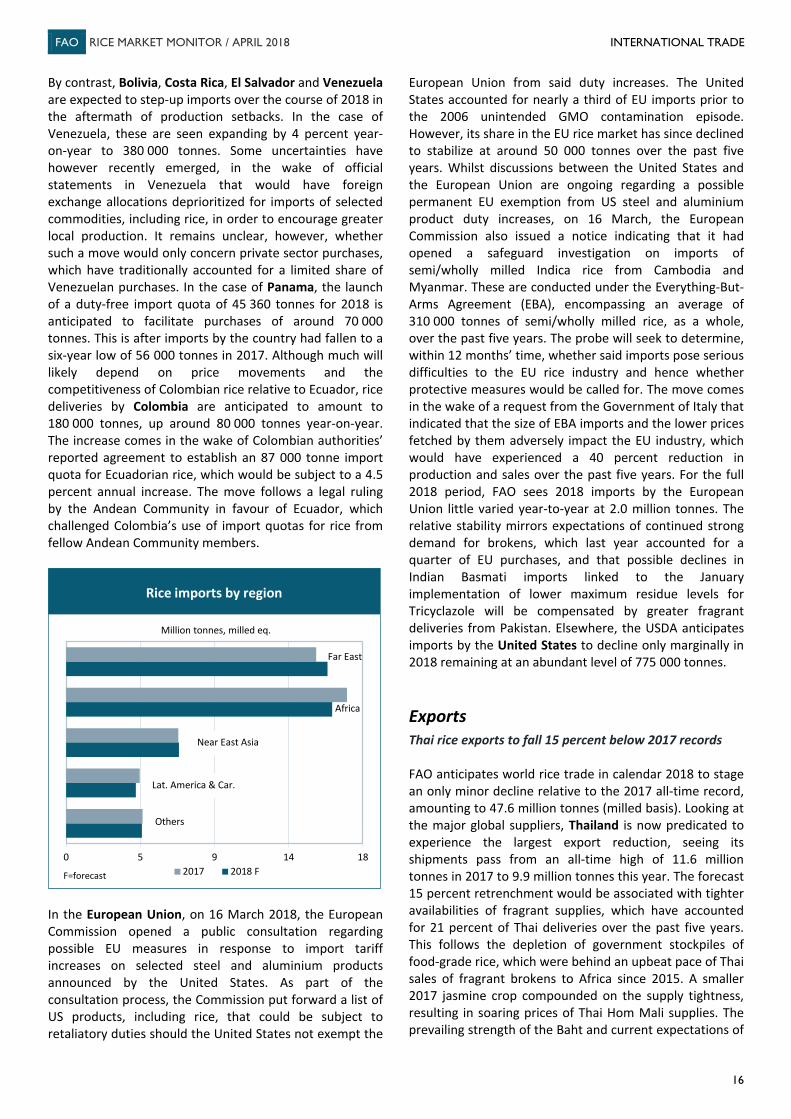
FAO RICE MARKET MONITOR / APRIL 2018 INTERNATIONAL TRADE
16
By contrast, Bolivia, Costa Rica, El Salvador and Venezuela are expected to step-up imports over the course of 2018 in the aftermath of production setbacks. In the case of Venezuela, these are seen expanding by 4 percent year-on-year to 380 000 tonnes. Some uncertainties have however recently emerged, in the wake of official statements in Venezuela that would have foreign exchange allocations deprioritized for imports of selected commodities, including rice, in order to encourage greater local production. It remains unclear, however, whether such a move would only concern private sector purchases, which have traditionally accounted for a limited share of Venezuelan purchases. In the case of Panama, the launch of a duty-free import quota of 45 360 tonnes for 2018 is anticipated to facilitate purchases of around 70 000 tonnes. This is after imports by the country had fallen to a six-year low of 56 000 tonnes in 2017. Although much will likely depend on price movements and the competitiveness of Colombian rice relative to Ecuador, rice deliveries by Colombia are anticipated to amount to 180 000 tonnes, up around 80 000 tonnes year-on-year. The increase comes in the wake of Colombian authorities’ reported agreement to establish an 87 000 tonne import quota for Ecuadorian rice, which would be subject to a 4.5 percent annual increase. The move follows a legal ruling by the Andean Community in favour of Ecuador, which challenged Colombia’s use of import quotas for rice from fellow Andean Community members.
In the European Union, on 16 March 2018, the European Commission opened a public consultation regarding possible EU measures in response to import tariff increases on selected steel and aluminium products announced by the United States. As part of the consultation process, the Commission put forward a list of US products, including rice, that could be subject to retaliatory duties should the United States not exempt the
European Union from said duty increases. The United States accounted for nearly a third of EU imports prior to the 2006 unintended GMO contamination episode. However, its share in the EU rice market has since declined to stabilize at around 50 000 tonnes over the past five years. Whilst discussions between the United States and the European Union are ongoing regarding a possible permanent EU exemption from US steel and aluminium product duty increases, on 16 March, the European Commission also issued a notice indicating that it had opened a safeguard investigation on imports of semi/wholly milled Indica rice from Cambodia and Myanmar. These are conducted under the Everything-But-Arms Agreement (EBA), encompassing an average of 310 000 tonnes of semi/wholly milled rice, as a whole, over the past five years. The probe will seek to determine, within 12 months’ time, whether said imports pose serious difficulties to the EU rice industry and hence whether protective measures would be called for. The move comes in the wake of a request from the Government of Italy that indicated that the size of EBA imports and the lower prices fetched by them adversely impact the EU industry, which would have experienced a 40 percent reduction in production and sales over the past five years. For the full 2018 period, FAO sees 2018 imports by the European Union little varied year-to-year at 2.0 million tonnes. The relative stability mirrors expectations of continued strong demand for brokens, which last year accounted for a quarter of EU purchases, and that possible declines in Indian Basmati imports linked to the January implementation of lower maximum residue levels for Tricyclazole will be compensated by greater fragrant deliveries from Pakistan. Elsewhere, the USDA anticipates imports by the United States to decline only marginally in 2018 remaining at an abundant level of 775 000 tonnes. Exports Thai rice exports to fall 15 percent below 2017 records FAO anticipates world rice trade in calendar 2018 to stage an only minor decline relative to the 2017 all-time record, amounting to 47.6 million tonnes (milled basis). Looking at the major global suppliers, Thailand is now predicated to experience the largest export reduction, seeing its shipments pass from an all-time high of 11.6 million tonnes in 2017 to 9.9 million tonnes this year. The forecast 15 percent retrenchment would be associated with tighter availabilities of fragrant supplies, which have accounted for 21 percent of Thai deliveries over the past five years. This follows the depletion of government stockpiles of food-grade rice, which were behind an upbeat pace of Thai sales of fragrant brokens to Africa since 2015. A smaller 2017 jasmine crop compounded on the supply tightness, resulting in soaring prices of Thai Hom Mali supplies. The prevailing strength of the Baht and current expectations of
Far East
Others
0 5 9 14 182017 2018 F
Million tonnes, milled eq.
Rice imports by region
Lat. America & Car.
Near East Asia
Africa
F=forecast
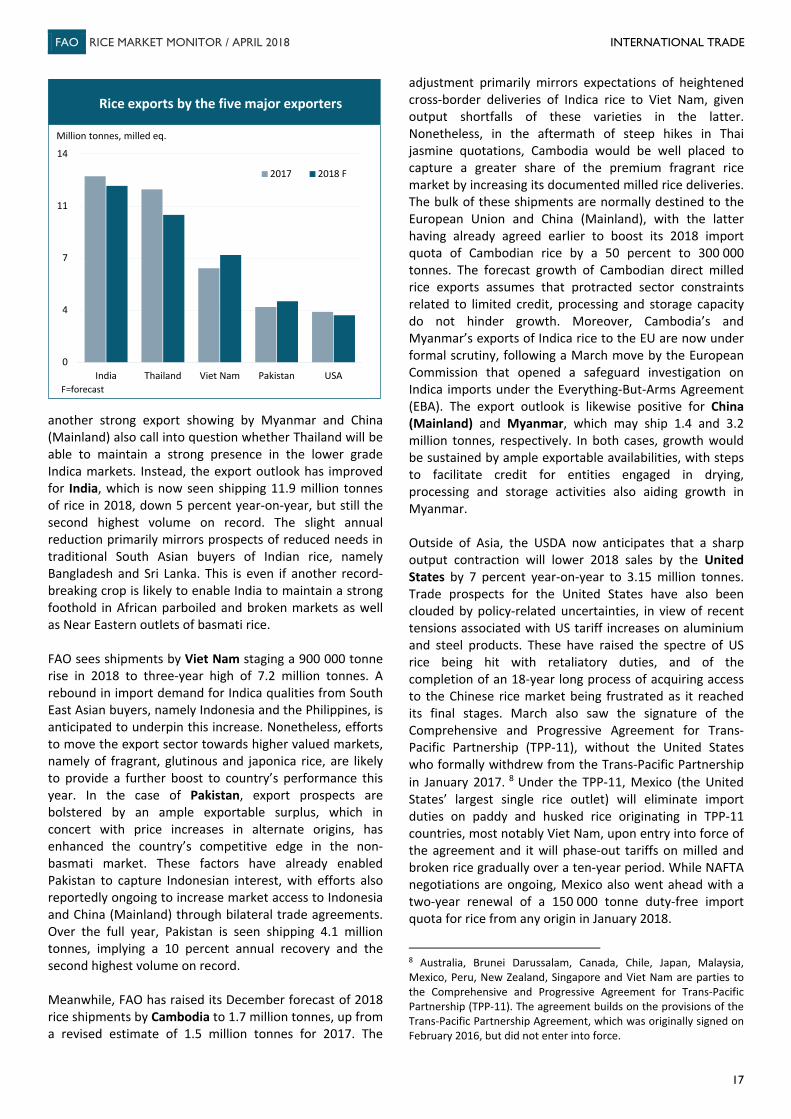
FAO RICE MARKET MONITOR / APRIL 2018 INTERNATIONAL TRADE
17
another strong export showing by Myanmar and China (Mainland) also call into question whether Thailand will be able to maintain a strong presence in the lower grade Indica markets. Instead, the export outlook has improved for India, which is now seen shipping 11.9 million tonnes of rice in 2018, down 5 percent year-on-year, but still the second highest volume on record. The slight annual reduction primarily mirrors prospects of reduced needs in traditional South Asian buyers of Indian rice, namely Bangladesh and Sri Lanka. This is even if another record-breaking crop is likely to enable India to maintain a strong foothold in African parboiled and broken markets as well as Near Eastern outlets of basmati rice. FAO sees shipments by Viet Nam staging a 900 000 tonne rise in 2018 to three-year high of 7.2 million tonnes. A rebound in import demand for Indica qualities from South East Asian buyers, namely Indonesia and the Philippines, is anticipated to underpin this increase. Nonetheless, efforts to move the export sector towards higher valued markets, namely of fragrant, glutinous and japonica rice, are likely to provide a further boost to country’s performance this year. In the case of Pakistan, export prospects are bolstered by an ample exportable surplus, which in concert with price increases in alternate origins, has enhanced the country’s competitive edge in the non-basmati market. These factors have already enabled Pakistan to capture Indonesian interest, with efforts also reportedly ongoing to increase market access to Indonesia and China (Mainland) through bilateral trade agreements. Over the full year, Pakistan is seen shipping 4.1 million tonnes, implying a 10 percent annual recovery and the second highest volume on record. Meanwhile, FAO has raised its December forecast of 2018 rice shipments by Cambodia to 1.7 million tonnes, up from a revised estimate of 1.5 million tonnes for 2017. The
adjustment primarily mirrors expectations of heightened cross-border deliveries of Indica rice to Viet Nam, given output shortfalls of these varieties in the latter. Nonetheless, in the aftermath of steep hikes in Thai jasmine quotations, Cambodia would be well placed to capture a greater share of the premium fragrant rice market by increasing its documented milled rice deliveries. The bulk of these shipments are normally destined to the European Union and China (Mainland), with the latter having already agreed earlier to boost its 2018 import quota of Cambodian rice by a 50 percent to 300 000 tonnes. The forecast growth of Cambodian direct milled rice exports assumes that protracted sector constraints related to limited credit, processing and storage capacity do not hinder growth. Moreover, Cambodia’s and Myanmar’s exports of Indica rice to the EU are now under formal scrutiny, following a March move by the European Commission that opened a safeguard investigation on Indica imports under the Everything-But-Arms Agreement (EBA). The export outlook is likewise positive for China (Mainland) and Myanmar, which may ship 1.4 and 3.2 million tonnes, respectively. In both cases, growth would be sustained by ample exportable availabilities, with steps to facilitate credit for entities engaged in drying, processing and storage activities also aiding growth in Myanmar. Outside of Asia, the USDA now anticipates that a sharp output contraction will lower 2018 sales by the United States by 7 percent year-on-year to 3.15 million tonnes. Trade prospects for the United States have also been clouded by policy-related uncertainties, in view of recent tensions associated with US tariff increases on aluminium and steel products. These have raised the spectre of US rice being hit with retaliatory duties, and of the completion of an 18-year long process of acquiring access to the Chinese rice market being frustrated as it reached its final stages. March also saw the signature of the Comprehensive and Progressive Agreement for Trans-Pacific Partnership (TPP-11), without the United States who formally withdrew from the Trans-Pacific Partnership in January 2017. 8 Under the TPP-11, Mexico (the United States’ largest single rice outlet) will eliminate import duties on paddy and husked rice originating in TPP-11 countries, most notably Viet Nam, upon entry into force of the agreement and it will phase-out tariffs on milled and broken rice gradually over a ten-year period. While NAFTA negotiations are ongoing, Mexico also went ahead with a two-year renewal of a 150 000 tonne duty-free import quota for rice from any origin in January 2018.
8 Australia, Brunei Darussalam, Canada, Chile, Japan, Malaysia, Mexico, Peru, New Zealand, Singapore and Viet Nam are parties to the Comprehensive and Progressive Agreement for Trans-Pacific Partnership (TPP-11). The agreement builds on the provisions of the Trans-Pacific Partnership Agreement, which was originally signed on February 2016, but did not enter into force.
0
4
7
11
14
India Thailand Viet Nam Pakistan USA
2017 2018 F
Million tonnes, milled eq.
Rice exports by the five major exporters
F=forecast
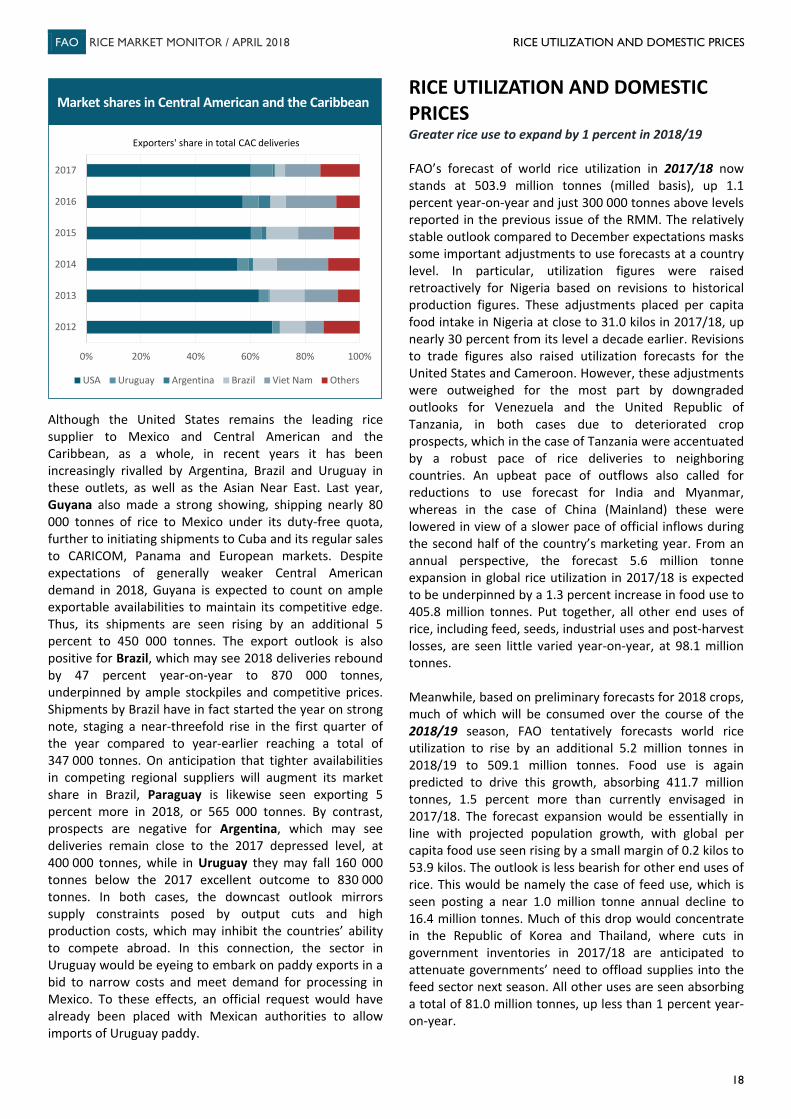
FAO RICE MARKET MONITOR / APRIL 2018 RICE UTILIZATION AND DOMESTIC PRICES
18
Although the United States remains the leading rice supplier to Mexico and Central American and the Caribbean, as a whole, in recent years it has been increasingly rivalled by Argentina, Brazil and Uruguay in these outlets, as well as the Asian Near East. Last year, Guyana also made a strong showing, shipping nearly 80 000 tonnes of rice to Mexico under its duty-free quota, further to initiating shipments to Cuba and its regular sales to CARICOM, Panama and European markets. Despite expectations of generally weaker Central American demand in 2018, Guyana is expected to count on ample exportable availabilities to maintain its competitive edge. Thus, its shipments are seen rising by an additional 5 percent to 450 000 tonnes. The export outlook is also positive for Brazil, which may see 2018 deliveries rebound by 47 percent year-on-year to 870 000 tonnes, underpinned by ample stockpiles and competitive prices. Shipments by Brazil have in fact started the year on strong note, staging a near-threefold rise in the first quarter of the year compared to year-earlier reaching a total of 347 000 tonnes. On anticipation that tighter availabilities in competing regional suppliers will augment its market share in Brazil, Paraguay is likewise seen exporting 5 percent more in 2018, or 565 000 tonnes. By contrast, prospects are negative for Argentina, which may see deliveries remain close to the 2017 depressed level, at 400 000 tonnes, while in Uruguay they may fall 160 000 tonnes below the 2017 excellent outcome to 830 000 tonnes. In both cases, the downcast outlook mirrors supply constraints posed by output cuts and high production costs, which may inhibit the countries’ ability to compete abroad. In this connection, the sector in Uruguay would be eyeing to embark on paddy exports in a bid to narrow costs and meet demand for processing in Mexico. To these effects, an official request would have already been placed with Mexican authorities to allow imports of Uruguay paddy.
RICE UTILIZATION AND DOMESTIC PRICES Greater rice use to expand by 1 percent in 2018/19 FAO’s forecast of world rice utilization in 2017/18 now stands at 503.9 million tonnes (milled basis), up 1.1 percent year-on-year and just 300 000 tonnes above levels reported in the previous issue of the RMM. The relatively stable outlook compared to December expectations masks some important adjustments to use forecasts at a country level. In particular, utilization figures were raised retroactively for Nigeria based on revisions to historical production figures. These adjustments placed per capita food intake in Nigeria at close to 31.0 kilos in 2017/18, up nearly 30 percent from its level a decade earlier. Revisions to trade figures also raised utilization forecasts for the United States and Cameroon. However, these adjustments were outweighed for the most part by downgraded outlooks for Venezuela and the United Republic of Tanzania, in both cases due to deteriorated crop prospects, which in the case of Tanzania were accentuated by a robust pace of rice deliveries to neighboring countries. An upbeat pace of outflows also called for reductions to use forecast for India and Myanmar, whereas in the case of China (Mainland) these were lowered in view of a slower pace of official inflows during the second half of the country’s marketing year. From an annual perspective, the forecast 5.6 million tonne expansion in global rice utilization in 2017/18 is expected to be underpinned by a 1.3 percent increase in food use to 405.8 million tonnes. Put together, all other end uses of rice, including feed, seeds, industrial uses and post-harvest losses, are seen little varied year-on-year, at 98.1 million tonnes. Meanwhile, based on preliminary forecasts for 2018 crops, much of which will be consumed over the course of the 2018/19 season, FAO tentatively forecasts world rice utilization to rise by an additional 5.2 million tonnes in 2018/19 to 509.1 million tonnes. Food use is again predicted to drive this growth, absorbing 411.7 million tonnes, 1.5 percent more than currently envisaged in 2017/18. The forecast expansion would be essentially in line with projected population growth, with global per capita food use seen rising by a small margin of 0.2 kilos to 53.9 kilos. The outlook is less bearish for other end uses of rice. This would be namely the case of feed use, which is seen posting a near 1.0 million tonne annual decline to 16.4 million tonnes. Much of this drop would concentrate in the Republic of Korea and Thailand, where cuts in government inventories in 2017/18 are anticipated to attenuate governments’ need to offload supplies into the feed sector next season. All other uses are seen absorbing a total of 81.0 million tonnes, up less than 1 percent year-on-year.
0% 20% 40% 60% 80% 100%
2012
2013
2014
2015
2016
2017
USA Uruguay Argentina Brazil Viet Nam Others
Market shares in Central American and the Caribbean
Exporters' share in total CAC deliveries
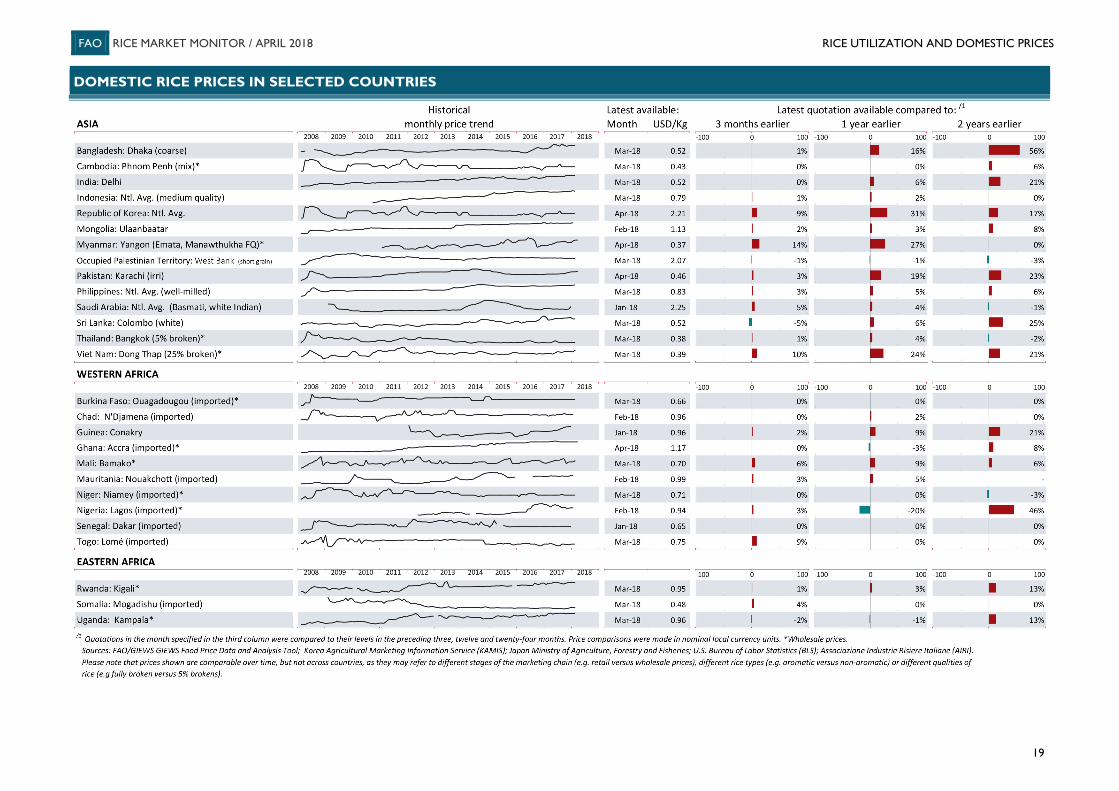
FAO RICE MARKET MONITOR / APRIL 2018 RICE UTILIZATION AND DOMESTIC PRICES
19
DOMESTIC RICE PRICES IN SELECTED COUNTRIES
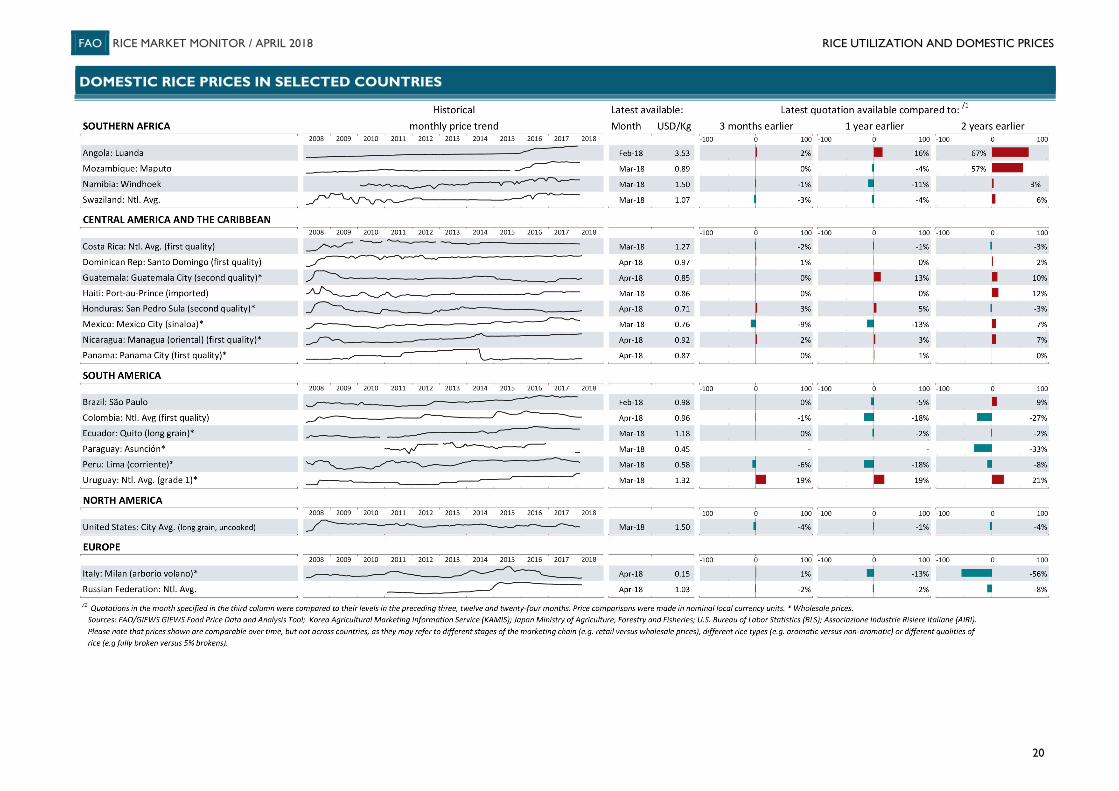
FAO RICE MARKET MONITOR / APRIL 2018 RICE UTILIZATION AND DOMESTIC PRICES
20
DOMESTIC RICE PRICES IN SELECTED COUNTRIES
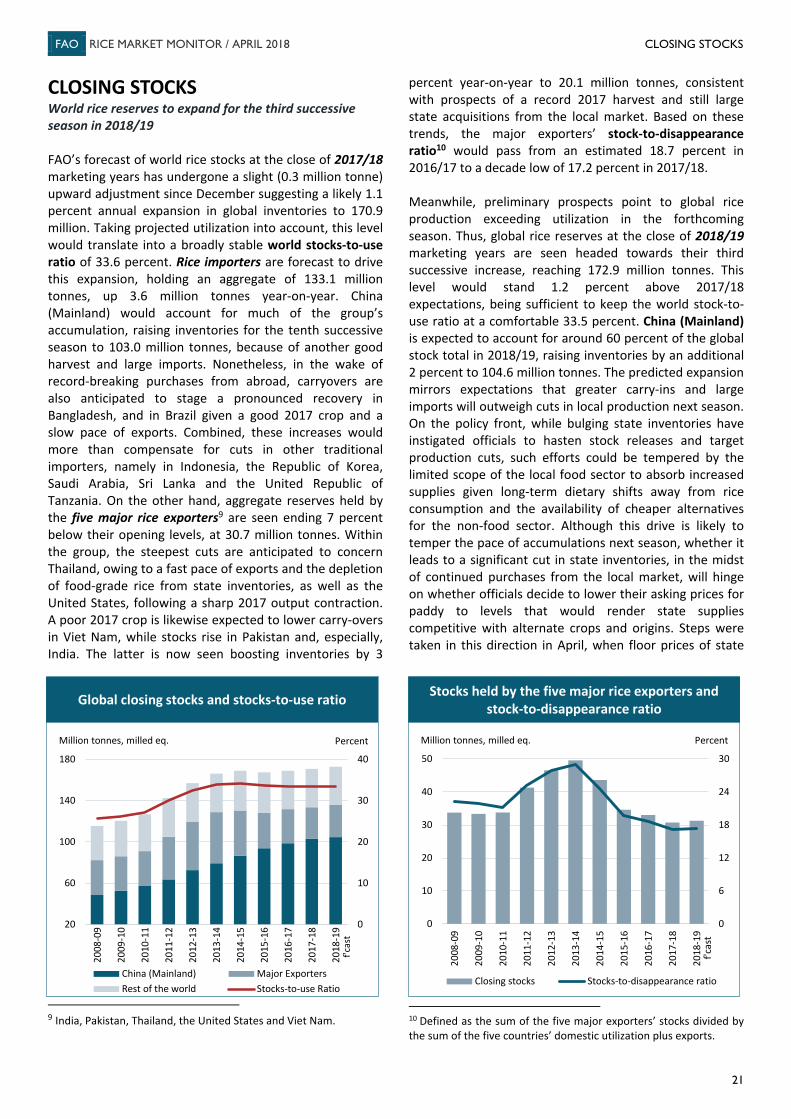
FAO RICE MARKET MONITOR / APRIL 2018 CLOSING STOCKS
21
0
10
20
30
40
20
60
100
140
180
2008
-09
2009
-10
2010
-11
2011
-12
2012
-13
2013
-14
2014
-15
2015
-16
2016
-17
2017
-18
2018
-19
China (Mainland) Major ExportersRest of the world Stocks-to-use Ratio
Percent
f'cas
t
Global closing stocks and stocks-to-use ratio
Million tonnes, milled eq.
Global closing stocks and stocks-to-use ratio
0
6
12
18
24
30
0
10
20
30
40
50
2008
-09
2009
-10
2010
-11
2011
-12
2012
-13
2013
-14
2014
-15
2015
-16
2016
-17
2017
-18
2018
-19
Closing stocks Stocks-to-disappearance ratio
Million tonnes, milled eq. Percent
f'cas
tStocks held by the five major rice exporters and
stock-to-disappearance ratio
CLOSING STOCKS World rice reserves to expand for the third successive season in 2018/19 FAO’s forecast of world rice stocks at the close of 2017/18 marketing years has undergone a slight (0.3 million tonne) upward adjustment since December suggesting a likely 1.1 percent annual expansion in global inventories to 170.9 million. Taking projected utilization into account, this level would translate into a broadly stable world stocks-to-use ratio of 33.6 percent. Rice importers are forecast to drive this expansion, holding an aggregate of 133.1 million tonnes, up 3.6 million tonnes year-on-year. China (Mainland) would account for much of the group’s accumulation, raising inventories for the tenth successive season to 103.0 million tonnes, because of another good harvest and large imports. Nonetheless, in the wake of record-breaking purchases from abroad, carryovers are also anticipated to stage a pronounced recovery in Bangladesh, and in Brazil given a good 2017 crop and a slow pace of exports. Combined, these increases would more than compensate for cuts in other traditional importers, namely in Indonesia, the Republic of Korea, Saudi Arabia, Sri Lanka and the United Republic of Tanzania. On the other hand, aggregate reserves held by the five major rice exporters9 are seen ending 7 percent below their opening levels, at 30.7 million tonnes. Within the group, the steepest cuts are anticipated to concern Thailand, owing to a fast pace of exports and the depletion of food-grade rice from state inventories, as well as the United States, following a sharp 2017 output contraction. A poor 2017 crop is likewise expected to lower carry-overs in Viet Nam, while stocks rise in Pakistan and, especially, India. The latter is now seen boosting inventories by 3
9 India, Pakistan, Thailand, the United States and Viet Nam.
percent year-on-year to 20.1 million tonnes, consistent with prospects of a record 2017 harvest and still large state acquisitions from the local market. Based on these trends, the major exporters’ stock-to-disappearance ratio10 would pass from an estimated 18.7 percent in 2016/17 to a decade low of 17.2 percent in 2017/18. Meanwhile, preliminary prospects point to global rice production exceeding utilization in the forthcoming season. Thus, global rice reserves at the close of 2018/19 marketing years are seen headed towards their third successive increase, reaching 172.9 million tonnes. This level would stand 1.2 percent above 2017/18 expectations, being sufficient to keep the world stock-to-use ratio at a comfortable 33.5 percent. China (Mainland) is expected to account for around 60 percent of the global stock total in 2018/19, raising inventories by an additional 2 percent to 104.6 million tonnes. The predicted expansion mirrors expectations that greater carry-ins and large imports will outweigh cuts in local production next season. On the policy front, while bulging state inventories have instigated officials to hasten stock releases and target production cuts, such efforts could be tempered by the limited scope of the local food sector to absorb increased supplies given long-term dietary shifts away from rice consumption and the availability of cheaper alternatives for the non-food sector. Although this drive is likely to temper the pace of accumulations next season, whether it leads to a significant cut in state inventories, in the midst of continued purchases from the local market, will hinge on whether officials decide to lower their asking prices for paddy to levels that would render state supplies competitive with alternate crops and origins. Steps were taken in this direction in April, when floor prices of state
10 Defined as the sum of the five major exporters’ stocks divided by the sum of the five countries’ domestic utilization plus exports.
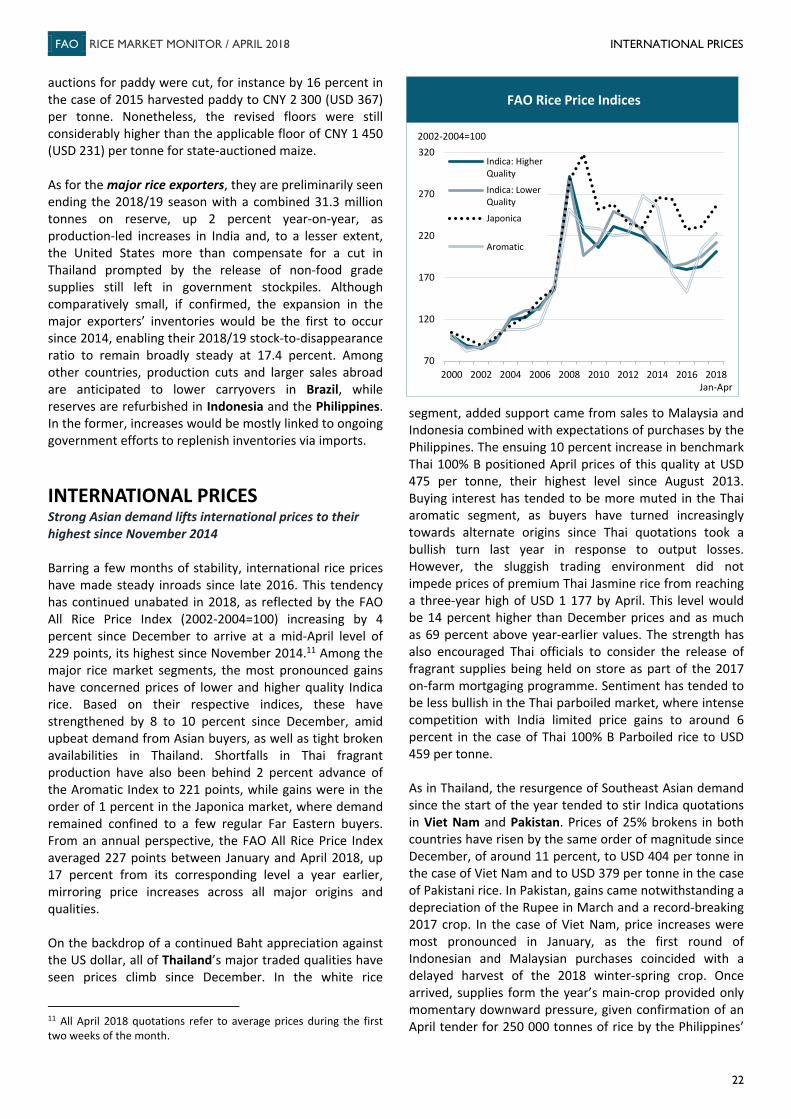
FAO RICE MARKET MONITOR / APRIL 2018 INTERNATIONAL PRICES
22
auctions for paddy were cut, for instance by 16 percent in the case of 2015 harvested paddy to CNY 2 300 (USD 367) per tonne. Nonetheless, the revised floors were still considerably higher than the applicable floor of CNY 1 450 (USD 231) per tonne for state-auctioned maize. As for the major rice exporters, they are preliminarily seen ending the 2018/19 season with a combined 31.3 million tonnes on reserve, up 2 percent year-on-year, as production-led increases in India and, to a lesser extent, the United States more than compensate for a cut in Thailand prompted by the release of non-food grade supplies still left in government stockpiles. Although comparatively small, if confirmed, the expansion in the major exporters’ inventories would be the first to occur since 2014, enabling their 2018/19 stock-to-disappearance ratio to remain broadly steady at 17.4 percent. Among other countries, production cuts and larger sales abroad are anticipated to lower carryovers in Brazil, while reserves are refurbished in Indonesia and the Philippines. In the former, increases would be mostly linked to ongoing government efforts to replenish inventories via imports.
INTERNATIONAL PRICES Strong Asian demand lifts international prices to their highest since November 2014 Barring a few months of stability, international rice prices have made steady inroads since late 2016. This tendency has continued unabated in 2018, as reflected by the FAO All Rice Price Index (2002-2004=100) increasing by 4 percent since December to arrive at a mid-April level of 229 points, its highest since November 2014.11 Among the major rice market segments, the most pronounced gains have concerned prices of lower and higher quality Indica rice. Based on their respective indices, these have strengthened by 8 to 10 percent since December, amid upbeat demand from Asian buyers, as well as tight broken availabilities in Thailand. Shortfalls in Thai fragrant production have also been behind 2 percent advance of the Aromatic Index to 221 points, while gains were in the order of 1 percent in the Japonica market, where demand remained confined to a few regular Far Eastern buyers. From an annual perspective, the FAO All Rice Price Index averaged 227 points between January and April 2018, up 17 percent from its corresponding level a year earlier, mirroring price increases across all major origins and qualities. On the backdrop of a continued Baht appreciation against the US dollar, all of Thailand’s major traded qualities have seen prices climb since December. In the white rice
11 All April 2018 quotations refer to average prices during the first two weeks of the month.
segment, added support came from sales to Malaysia and Indonesia combined with expectations of purchases by the Philippines. The ensuing 10 percent increase in benchmark Thai 100% B positioned April prices of this quality at USD 475 per tonne, their highest level since August 2013. Buying interest has tended to be more muted in the Thai aromatic segment, as buyers have turned increasingly towards alternate origins since Thai quotations took a bullish turn last year in response to output losses. However, the sluggish trading environment did not impede prices of premium Thai Jasmine rice from reaching a three-year high of USD 1 177 by April. This level would be 14 percent higher than December prices and as much as 69 percent above year-earlier values. The strength has also encouraged Thai officials to consider the release of fragrant supplies being held on store as part of the 2017 on-farm mortgaging programme. Sentiment has tended to be less bullish in the Thai parboiled market, where intense competition with India limited price gains to around 6 percent in the case of Thai 100% B Parboiled rice to USD 459 per tonne. As in Thailand, the resurgence of Southeast Asian demand since the start of the year tended to stir Indica quotations in Viet Nam and Pakistan. Prices of 25% brokens in both countries have risen by the same order of magnitude since December, of around 11 percent, to USD 404 per tonne in the case of Viet Nam and to USD 379 per tonne in the case of Pakistani rice. In Pakistan, gains came notwithstanding a depreciation of the Rupee in March and a record-breaking 2017 crop. In the case of Viet Nam, price increases were most pronounced in January, as the first round of Indonesian and Malaysian purchases coincided with a delayed harvest of the 2018 winter-spring crop. Once arrived, supplies form the year’s main-crop provided only momentary downward pressure, given confirmation of an April tender for 250 000 tonnes of rice by the Philippines’
70
120
170
220
270
320
2000 2002 2004 2006 2008 2010 2012 2014 2016 2018
Indica: HigherQuality
Indica: LowerQuality
Japonica
Aromatic
FAO Rice Price Indices
2002-2004=100
Jan-Apr
FAO RICE MARKET MONITOR / APRIL 2018 INTERNATIONAL PRICES
23
350
450
550
650
Apr-16 Aug-16 Dec-16 Apr-17 Aug-17 Dec-17 Apr-18
US 2/4%Thai 100% BArgentina 5%Brazil 5%Uruguay 5%
USD per tonne
Export prices of higher quality Indica riceExport prices of higher quality Indica rice
300
350
400
450
Apr-16 Aug-16 Dec-16 Apr-17 Aug-17 Dec-17 Apr-18
Thai 25% India 25%Viet 25% Pak 25%
USD per tonne
Export prices of 25% broken rice
National Food Authority. Local reports also suggest that winter-spring output of the Indica varieties used to meet demand from these Southeast Asian buyers, namely IR50404, declined this year as producers in the Mekong Delta moved to cultivate higher-valued varieties, namely of fragrant rice. Price increases have tended to be less pronounced in India, as support provided by a robust pace of Government procurement of 2017 Kharif crops and continued sales to Bangladesh and Sri Lanka was partly offset by expectations of a bumper Rabi harvest and slight depreciation of the Rupee. In April, Indian 25% brokens traded at USD 385 per tonne, up 4 percent from December prices and 10 percent above levels in April 2017. In the aromatic segment, Indian Pusa Basmati registered a similar increase, primarily sustained by the sales to the Islamic Republic of Iran. In the United States, fresh sales were mostly confined to regular Latin American outlets. Nonetheless, tight availabilities following a sharply reduced 2017 crop raised quotations of US N.2 4% long-grain rice by an additional 5 percent since December to USD 542 per tonne. Notwithstanding expectations of generally smaller 2018 crops, sentiment tended to be bearish elsewhere in the Americas, amplifying the gap between US prices and those of South American origins. The sharpest price reduction took place in Brazil. Export quotations of 5% brokens in the country shed 8 percent of their December value to arrive at USD 460 per tonne, weighed by high carry-overs ahead of the 2018 harvest and currency movements. In Uruguay, sales to Iraq, Venezuela and Peru limited price cuts to around 1 percent, while in Argentina a 3 percent reduction in quotations of 5% broken rice came in the wake of a Peso depreciation, which added to pressure exerted by quiet trading activity.
FAO Rice Price Indices
All Japonica AromaticHigherquality
Lowerquality
2002-2004 = 1002014 235 207 201 266 2552015 211 184 184 263 1762016 194 180 187 228 1532017 206 183 195 232 204
2017 April 198 174 191 216 208May 202 181 193 218 209June 209 194 204 224 205July 210 188 204 231 208August 212 186 200 241 209September 212 188 197 238 215October 216 188 195 250 216November 219 191 196 256 213December 220 192 197 254 216
2018 January 224 200 207 254 219February 227 200 211 257 227March 227 199 212 258 226April* 229 207 216 258 221
2017 Jan.-Apr. 194 173 189 216 1892018 Jan.-Apr. 227 202 212 257 223% Change 16.8 16.8 12.0 18.7 17.9
Source: FAO
* Two weeks only.
Indica
N.B. - The FAO Rice Price Index is based on 16 rice export quotations. "Quality" isdefined by the percentage of broken kernels, with higher (lower) quality referringto rice with less (equal to or more) than 20 percent brokens. The Sub-Index forAromatic Rice follows movements in prices of Basmati and Fragrant rice.
FAO RICE MARKET MONITOR / APRIL 2018 INTERNATIONAL PRICES
24
EXPORT PRICES FOR RICE
Thai White
100% B Second grade
Thai Parboiled
100%
U.S. Long Grain
#2, 4%
Thai 5%
Viet 5%
Uru 5% 1/
India 25%
Pak 25%
Thai 25%
Viet 25%
Thai A1
Super 2/
U.S. California Medium
Grain #1, 4%
Pak Basmati
3/
Thai Fragrant
4/
(US $/tonne, f.o.b.) 2013
534 530 628 518 391 598 402 371 504 363 483 692 1 372 1 180
2014
435 435 571 423 410 599 377 366 382 377 322 1 007 1 324 1 150 2015
395 392 490 386 353 541 337 318 373 334 327 857 849 1 008
2016
407 410 438 396 347 473 333 327 385 332 348 651 795 768 2017
415 421 456 398 372 499 361 350 384 351 334 673 1 131 843
2017
April 394 393 405 380 342 491 350 355 369 329 332 578 1 204 697 May 430 431 418 415 352 485 360 367 394 332 322 590 1 214 717 June 469 479 445 454 405 495 375 373 427 378 337 627 1 205 799 July 432 442 454 417 397 502 379 367 399 375 337 675 1 195 851 August 410 416 491 394 389 502 374 346 382 372 339 706 1 125 949 September 414 426 516 399 380 504 373 344 385 357 337 717 1 100 1 064 October 411 429 516 394 390 500 363 339 379 365 328 795 1 169 986 November 424 428 516 399 392 509 366 343 383 363 330 830 1 155 952 December 432 434 518 407 386 506 371 341 392 364 338 838 1 136 1 030 2018
January 462 458 526 436 413 503 384 358 416 391 352 860 1 087 1 100 February 463 454 537 436 419 500 390 357 419 398 363 885 1 095 1 169 March 453 439 539 427 415 500 385 362 415 394 376 896 1 072 1 174 April* 475 459 542 448 424 500 385 379 433 404 382 900 1 050 1 177 2017 Jan.-Apr. 389 390 399 374 344 495 344 344 366 327 337 575 1 070 691 2018 Jan.-Apr. 463 452 536 437 418 501 386 364 421 397 368 885 1 076 1 155 % Change 19.1 15.9 34.3 16.9 21.6 1.1 12.1 5.8 15.1 21.2 9.4 53.9 0.6 67.1 Sources: Livericeindex.com, Thai Department of Foreign Trade (DFT) and other public sources.
1/ Long grain white rice, fob fcl. 2/ White broken rice. 3/ Basmati ordinary up to May 2011. Super kernel white basmati 2% from June 2011 onwards. 4/ Hom Mali rice, grade A.
... = unquoted * Two weeks only.
FAO RICE MARKET MONITOR / APRIL 2018 RICE POLICY DEVELOPMENTS
25
RICE POLICY DEVELOPMENTS 12
Area Date Policy Instrument Description Azerbaijan Feb-18 Sector policy
framework, production target
Approved the State programme for rice production development 2018-2025, under which it would encourage greater local production of rice to reduce reliance on imports. The programme aims to nearly double area under paddy in eight years to 10 000 hectares, in order to raise output from 15 900 tonnes in 2017 to 40 000 tonnes in 2025. Interventions eyed to achieve this end would include the promotion of improved seed varieties, enhancing technical assistance, processing capacity, research and development, as well as infrastructural improvements.
Bangladesh Jan-18 Government procurement, purchasing prices
Raised the 2017 Aman procurement target by 150 000 tonnes to 450 000 tonnes.
Bangladesh Feb-18 Government procurement, purchasing prices
Revised the 2017 Aman procurement target for the second time since January 2018, setting it at 600 000 tonnes, twice the level foreseen in November 2017. The procurement drive ran from 3 December 2017 to 7 March 2018, offering BDT 39 per kg (USD 469 per tonne) of Aman rice purchased.
Bangladesh Feb-18 Production support
Announced that it would allocate BDT 400 million (USD 4.8 million) to support 240 000 small and medium scale farmers cultivating Aus rice, by providing them with free fertilizer and seeds, as well as a cash outlay for land preparation and irrigation costs.
Bangladesh Apr-18 Government procurement, purchasing prices
Announced that it intended to purchase 150 000 tonnes of paddy, 800 000 tonnes of parboiled rice and 100 000 tonnes of white rice from the 2018 Boro harvest. The procurement drive would run from 2 May until 31 August 2018, offering BDT 26 per kg of paddy (USD 313 per tonne), BDT 38 per kg of parboiled rice (USD 457 per tonne) and BDT 37 per kg of white rice (USD 445 per tonne).
Bolivia Apr-18 Government procurement, purchasing prices
Announced that the state enterprise, EMAPA, would offer USD 65 per 200 kg fanega (USD 325 per tonne) it bought from producers in 2018. EMAPA targets to purchase 50 000 tonnes of paddy from the 2018 harvest.
Brazil Dec-17 Production support
Authorised a fund of BRL 100 (USD 29.2) million to conduct Prêmio e Valor de Escoamento de Produto (PEP) and Prêmio Equalizador Pago ao Produtor (PEPRO) for rice.
China (Mainland) Jan-18 Production support
Released planting guidelines for the 2018 season, reiterating the Government’s commitment to maintain absolute security in rice and wheat, while pursuing supply-side reforms to address the grain over-supply situation. The document reaffirms official plans to maintain the minimum support price (MSP) mechanism for paddy and wheat, targeting to stabilise the total area planted to the two crops at 800 million mu (53.3 million hectares). In the case of rice, the guidelines target to reduce area planted to paddy by over 10 million mu (0.67 million hectares) in 2018, mostly comprising low-yielding Japonica acreage in the north-eastern region and double-season Indica paddies in the Long river valley. Among other provisions, the document calls for the promotion of 'green' agriculture
12 The full collection of rice policies, starting in January 2011, is available at: http://www.fao.org/economic/est/est commodities/commodity policy archive/en/?groupANDcommodity=rice
FAO RICE MARKET MONITOR / APRIL 2018 RICE POLICY DEVELOPMENTS
26
Area Date Policy Instrument Description by increasing fertilizer and pesticide efficiency, crop quality improvements and agricultural mechanisation, as well as enhancing the regulatory system.
China (Mainland) Feb-18 Support prices Lowered government procurement prices for paddy for the 2018 season. According to the decision, procurement prices would be reduced by 7.7 percent for early Indica paddy to CNY 120 per 50 kilo (USD 382 per tonne), by 7.4 percent in the case of late/intermediate Indica paddy to CNY 126 per 50 kilo (USD 402 per tonne), and by 13.3 percent for Japonica paddy to CNY 130 per 50 kilo (USD 414 per tonne).
China (Mainland) Dec-17 Stock release Sold 46 542 tonnes of paddy from state reserves, out of a total of 291 953 tonnes offered through an auction held on 15 December 2017.
China (Mainland) Dec-17 Stock release Offered 507 799 tonnes of paddy from state reserves through an auction held on 20 December 2017. The auction closed without a sale.
China (Mainland) Dec-17 Stock release Put 358 844 tonnes of paddy from state reserves for auction on 22 December 2017, of which 56 387 tonnes of paddy were sold.
China (Mainland) Dec-17 Stock release Offered 506 245 tonnes of paddy from state reserves through an auction held on 27 December 2017. The auction closed without any sales.
China (Mainland) Dec-17 Stock release Found buyers for 81 286 tonnes of paddy from state reserves, after offering 242 537 tonnes of paddy in an auction held on 29 December 2017.
China (Mainland) Jan-18 Stock release Put 507 499 tonnes of paddy from state reserves for auction on 3 January 2018. The auction closed without a sale. China (Mainland) Jan-18 Stock release Sold 77 441 tonnes of paddy from state reserves, out of a total of 296 091 tonnes offered through an auction held on
5 January 2018. China (Mainland) Jan-18 Stock release Offered 504 442 tonnes of paddy from state reserves through an auction held on 10 January 2018. The auction
closed without any sales. China (Mainland) Jan-18 Stock release Found buyers for 46 913 tonnes of paddy from state reserves, after offering 161 251 tonnes of paddy in an auction
held on 12 January 2018. China (Mainland) Jan-18 Stock release Put 507 821 tonnes of paddy from state reserves for auction on 16 January 2018. The auction closed without a sale. China (Mainland) Jan-18 Stock release Sold 94 403 tonnes of paddy from state reserves through an auction held on 19 January 2018. The total offered
volume was 345 526 tonnes. China (Mainland) Jan-18 Stock release Offered 504 869 tonnes of paddy from state reserves through an auction held on 23 January 2018. The auction
closed without a sale. China (Mainland) Jan-18 Stock release Sold 46 407 tonnes of paddy from state reserves, after offering 251 123 tonnes of paddy in a tender held on 26
January 2018. China (Mainland) Jan-18 Stock release Put 501 571 tonnes of paddy from state reserves for auction on 30 January 2018. The auction closed without a sale. China (Mainland) Feb-18 Stock release Found buyers for 15 810 tonnes of paddy from state reserves, after offering 206 992 tonnes of paddy in an auction
held on 2 February 2018. China (Mainland) Feb-18 Stock release Offered 503 138 tonnes of paddy from state reserves through an auction held on 6 February 2018. The auction
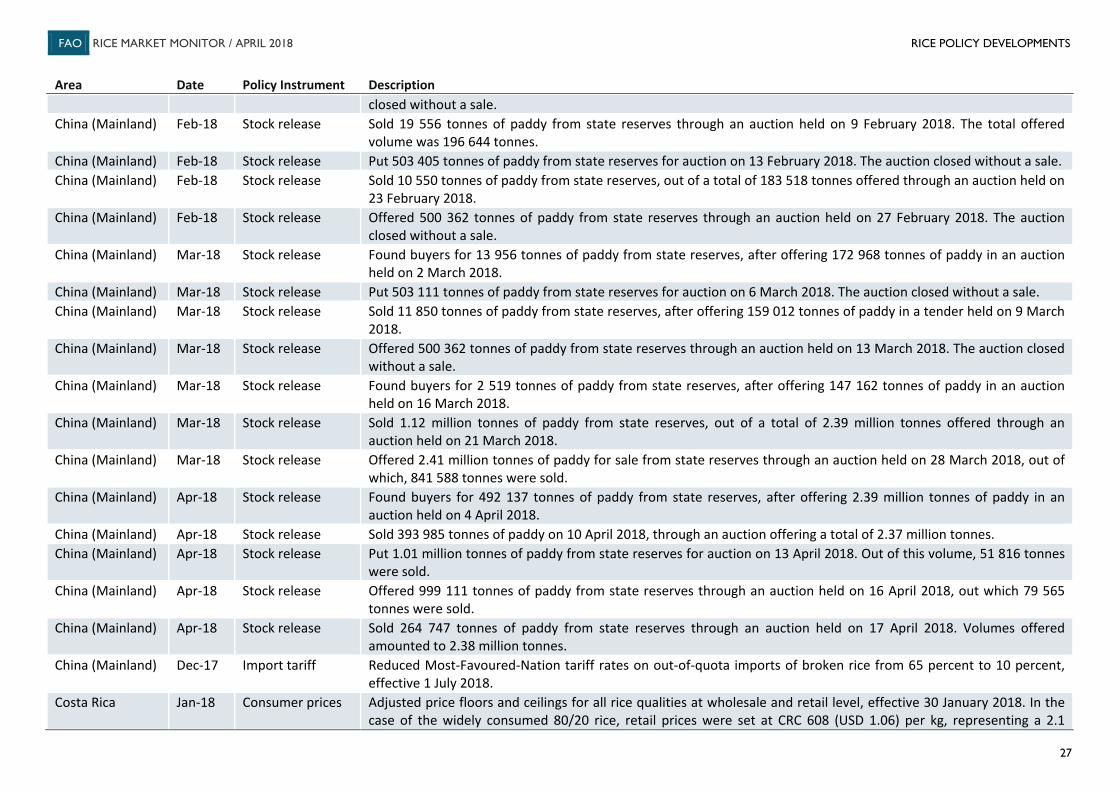
FAO RICE MARKET MONITOR / APRIL 2018 RICE POLICY DEVELOPMENTS
27
Area Date Policy Instrument Description closed without a sale.
China (Mainland) Feb-18 Stock release Sold 19 556 tonnes of paddy from state reserves through an auction held on 9 February 2018. The total offered volume was 196 644 tonnes.
China (Mainland) Feb-18 Stock release Put 503 405 tonnes of paddy from state reserves for auction on 13 February 2018. The auction closed without a sale. China (Mainland) Feb-18 Stock release Sold 10 550 tonnes of paddy from state reserves, out of a total of 183 518 tonnes offered through an auction held on
23 February 2018. China (Mainland) Feb-18 Stock release Offered 500 362 tonnes of paddy from state reserves through an auction held on 27 February 2018. The auction
closed without a sale. China (Mainland) Mar-18 Stock release Found buyers for 13 956 tonnes of paddy from state reserves, after offering 172 968 tonnes of paddy in an auction
held on 2 March 2018. China (Mainland) Mar-18 Stock release Put 503 111 tonnes of paddy from state reserves for auction on 6 March 2018. The auction closed without a sale. China (Mainland) Mar-18 Stock release Sold 11 850 tonnes of paddy from state reserves, after offering 159 012 tonnes of paddy in a tender held on 9 March
2018. China (Mainland) Mar-18 Stock release Offered 500 362 tonnes of paddy from state reserves through an auction held on 13 March 2018. The auction closed
without a sale. China (Mainland) Mar-18 Stock release Found buyers for 2 519 tonnes of paddy from state reserves, after offering 147 162 tonnes of paddy in an auction
held on 16 March 2018. China (Mainland) Mar-18 Stock release Sold 1.12 million tonnes of paddy from state reserves, out of a total of 2.39 million tonnes offered through an
auction held on 21 March 2018. China (Mainland) Mar-18 Stock release Offered 2.41 million tonnes of paddy for sale from state reserves through an auction held on 28 March 2018, out of
which, 841 588 tonnes were sold. China (Mainland) Apr-18 Stock release Found buyers for 492 137 tonnes of paddy from state reserves, after offering 2.39 million tonnes of paddy in an
auction held on 4 April 2018. China (Mainland) Apr-18 Stock release Sold 393 985 tonnes of paddy on 10 April 2018, through an auction offering a total of 2.37 million tonnes. China (Mainland) Apr-18 Stock release Put 1.01 million tonnes of paddy from state reserves for auction on 13 April 2018. Out of this volume, 51 816 tonnes
were sold. China (Mainland) Apr-18 Stock release Offered 999 111 tonnes of paddy from state reserves through an auction held on 16 April 2018, out which 79 565
tonnes were sold. China (Mainland) Apr-18 Stock release Sold 264 747 tonnes of paddy from state reserves through an auction held on 17 April 2018. Volumes offered
amounted to 2.38 million tonnes. China (Mainland) Dec-17 Import tariff Reduced Most-Favoured-Nation tariff rates on out-of-quota imports of broken rice from 65 percent to 10 percent,
effective 1 July 2018. Costa Rica Jan-18 Consumer prices Adjusted price floors and ceilings for all rice qualities at wholesale and retail level, effective 30 January 2018. In the
case of the widely consumed 80/20 rice, retail prices were set at CRC 608 (USD 1.06) per kg, representing a 2.1
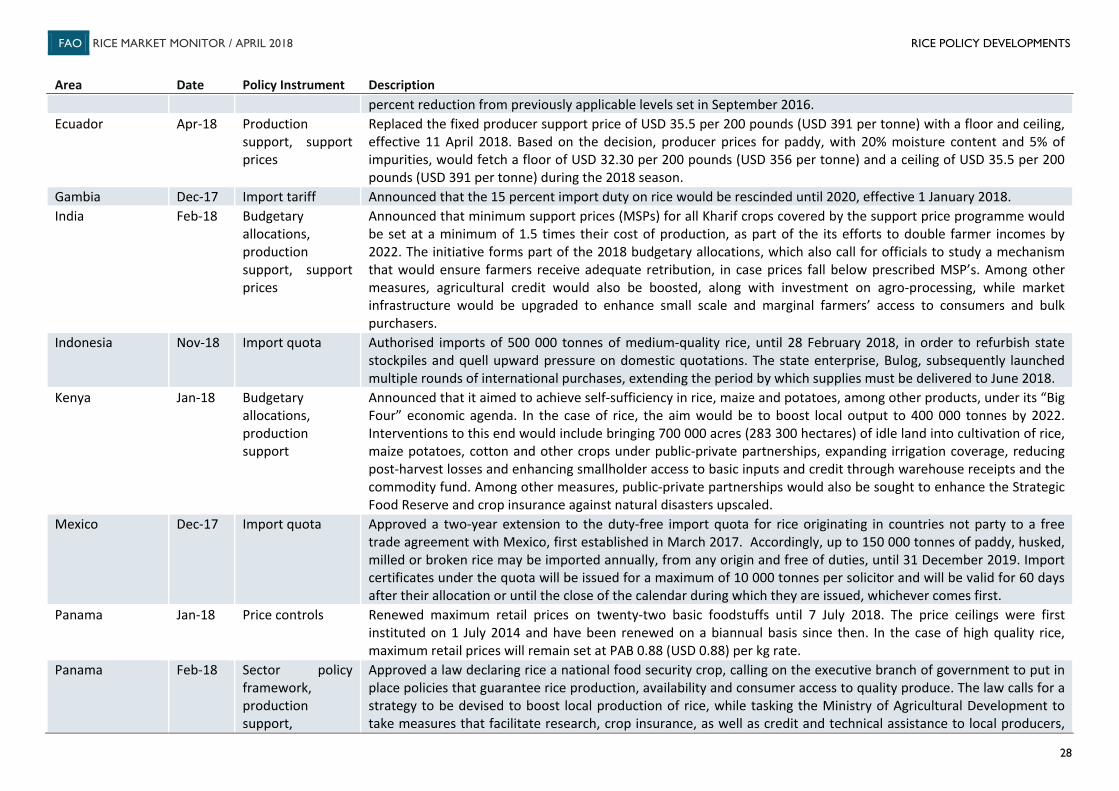
FAO RICE MARKET MONITOR / APRIL 2018 RICE POLICY DEVELOPMENTS
28
Area Date Policy Instrument Description percent reduction from previously applicable levels set in September 2016.
Ecuador Apr-18 Production support, support prices
Replaced the fixed producer support price of USD 35.5 per 200 pounds (USD 391 per tonne) with a floor and ceiling, effective 11 April 2018. Based on the decision, producer prices for paddy, with 20% moisture content and 5% of impurities, would fetch a floor of USD 32.30 per 200 pounds (USD 356 per tonne) and a ceiling of USD 35.5 per 200 pounds (USD 391 per tonne) during the 2018 season.
Gambia Dec-17 Import tariff Announced that the 15 percent import duty on rice would be rescinded until 2020, effective 1 January 2018. India Feb-18 Budgetary
allocations, production support, support prices
Announced that minimum support prices (MSPs) for all Kharif crops covered by the support price programme would be set at a minimum of 1.5 times their cost of production, as part of the its efforts to double farmer incomes by 2022. The initiative forms part of the 2018 budgetary allocations, which also call for officials to study a mechanism that would ensure farmers receive adequate retribution, in case prices fall below prescribed MSP’s. Among other measures, agricultural credit would also be boosted, along with investment on agro-processing, while market infrastructure would be upgraded to enhance small scale and marginal farmers’ access to consumers and bulk purchasers.
Indonesia Nov-18 Import quota Authorised imports of 500 000 tonnes of medium-quality rice, until 28 February 2018, in order to refurbish state stockpiles and quell upward pressure on domestic quotations. The state enterprise, Bulog, subsequently launched multiple rounds of international purchases, extending the period by which supplies must be delivered to June 2018.
Kenya Jan-18 Budgetary allocations, production support
Announced that it aimed to achieve self-sufficiency in rice, maize and potatoes, among other products, under its “Big Four” economic agenda. In the case of rice, the aim would be to boost local output to 400 000 tonnes by 2022. Interventions to this end would include bringing 700 000 acres (283 300 hectares) of idle land into cultivation of rice, maize potatoes, cotton and other crops under public-private partnerships, expanding irrigation coverage, reducing post-harvest losses and enhancing smallholder access to basic inputs and credit through warehouse receipts and the commodity fund. Among other measures, public-private partnerships would also be sought to enhance the Strategic Food Reserve and crop insurance against natural disasters upscaled.
Mexico Dec-17 Import quota Approved a two-year extension to the duty-free import quota for rice originating in countries not party to a free trade agreement with Mexico, first established in March 2017. Accordingly, up to 150 000 tonnes of paddy, husked, milled or broken rice may be imported annually, from any origin and free of duties, until 31 December 2019. Import certificates under the quota will be issued for a maximum of 10 000 tonnes per solicitor and will be valid for 60 days after their allocation or until the close of the calendar during which they are issued, whichever comes first.
Panama Jan-18 Price controls Renewed maximum retail prices on twenty-two basic foodstuffs until 7 July 2018. The price ceilings were first instituted on 1 July 2014 and have been renewed on a biannual basis since then. In the case of high quality rice, maximum retail prices will remain set at PAB 0.88 (USD 0.88) per kg rate.
Panama Feb-18 Sector policy framework, production support,
Approved a law declaring rice a national food security crop, calling on the executive branch of government to put in place policies that guarantee rice production, availability and consumer access to quality produce. The law calls for a strategy to be devised to boost local production of rice, while tasking the Ministry of Agricultural Development to take measures that facilitate research, crop insurance, as well as credit and technical assistance to local producers,
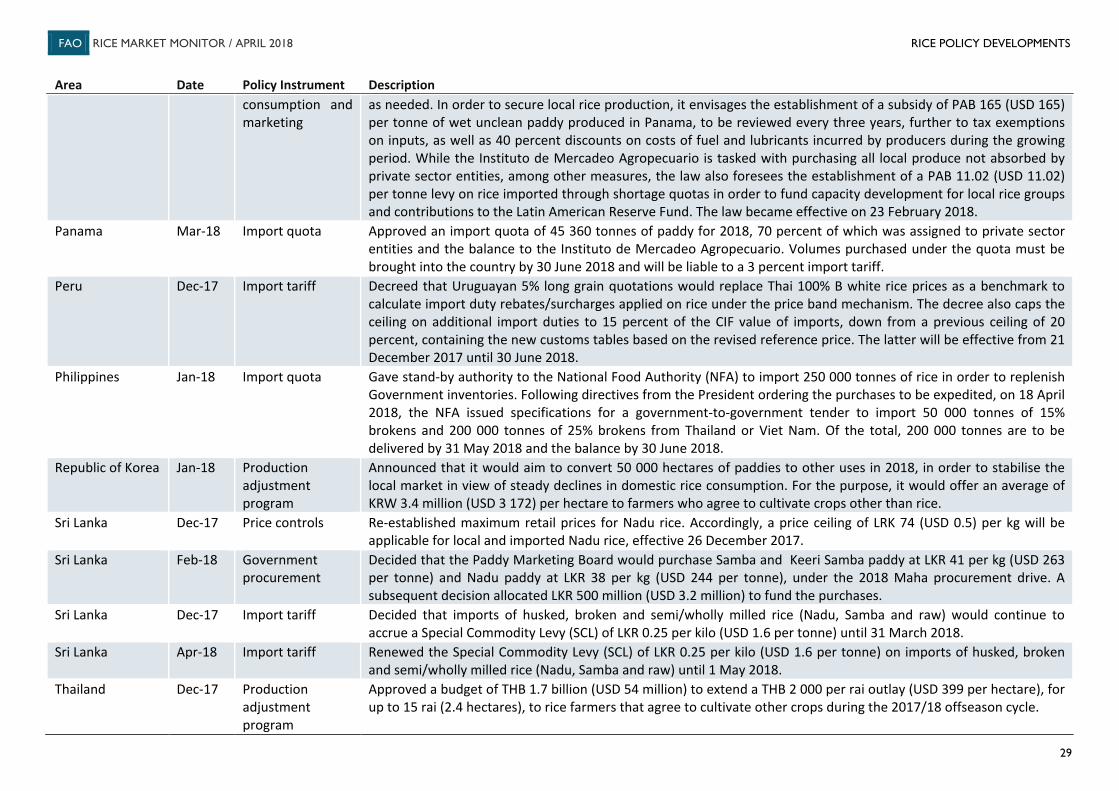
FAO RICE MARKET MONITOR / APRIL 2018 RICE POLICY DEVELOPMENTS
29
Area Date Policy Instrument Description consumption and marketing
as needed. In order to secure local rice production, it envisages the establishment of a subsidy of PAB 165 (USD 165) per tonne of wet unclean paddy produced in Panama, to be reviewed every three years, further to tax exemptions on inputs, as well as 40 percent discounts on costs of fuel and lubricants incurred by producers during the growing period. While the Instituto de Mercadeo Agropecuario is tasked with purchasing all local produce not absorbed by private sector entities, among other measures, the law also foresees the establishment of a PAB 11.02 (USD 11.02) per tonne levy on rice imported through shortage quotas in order to fund capacity development for local rice groups and contributions to the Latin American Reserve Fund. The law became effective on 23 February 2018.
Panama Mar-18 Import quota Approved an import quota of 45 360 tonnes of paddy for 2018, 70 percent of which was assigned to private sector entities and the balance to the Instituto de Mercadeo Agropecuario. Volumes purchased under the quota must be brought into the country by 30 June 2018 and will be liable to a 3 percent import tariff.
Peru Dec-17 Import tariff Decreed that Uruguayan 5% long grain quotations would replace Thai 100% B white rice prices as a benchmark to calculate import duty rebates/surcharges applied on rice under the price band mechanism. The decree also caps the ceiling on additional import duties to 15 percent of the CIF value of imports, down from a previous ceiling of 20 percent, containing the new customs tables based on the revised reference price. The latter will be effective from 21 December 2017 until 30 June 2018.
Philippines Jan-18 Import quota Gave stand-by authority to the National Food Authority (NFA) to import 250 000 tonnes of rice in order to replenish Government inventories. Following directives from the President ordering the purchases to be expedited, on 18 April 2018, the NFA issued specifications for a government-to-government tender to import 50 000 tonnes of 15% brokens and 200 000 tonnes of 25% brokens from Thailand or Viet Nam. Of the total, 200 000 tonnes are to be delivered by 31 May 2018 and the balance by 30 June 2018.
Republic of Korea Jan-18 Production adjustment program
Announced that it would aim to convert 50 000 hectares of paddies to other uses in 2018, in order to stabilise the local market in view of steady declines in domestic rice consumption. For the purpose, it would offer an average of KRW 3.4 million (USD 3 172) per hectare to farmers who agree to cultivate crops other than rice.
Sri Lanka Dec-17 Price controls Re-established maximum retail prices for Nadu rice. Accordingly, a price ceiling of LRK 74 (USD 0.5) per kg will be applicable for local and imported Nadu rice, effective 26 December 2017.
Sri Lanka Feb-18 Government procurement
Decided that the Paddy Marketing Board would purchase Samba and Keeri Samba paddy at LKR 41 per kg (USD 263 per tonne) and Nadu paddy at LKR 38 per kg (USD 244 per tonne), under the 2018 Maha procurement drive. A subsequent decision allocated LKR 500 million (USD 3.2 million) to fund the purchases.
Sri Lanka Dec-17 Import tariff Decided that imports of husked, broken and semi/wholly milled rice (Nadu, Samba and raw) would continue to accrue a Special Commodity Levy (SCL) of LKR 0.25 per kilo (USD 1.6 per tonne) until 31 March 2018.
Sri Lanka Apr-18 Import tariff Renewed the Special Commodity Levy (SCL) of LKR 0.25 per kilo (USD 1.6 per tonne) on imports of husked, broken and semi/wholly milled rice (Nadu, Samba and raw) until 1 May 2018.
Thailand Dec-17 Production adjustment program
Approved a budget of THB 1.7 billion (USD 54 million) to extend a THB 2 000 per rai outlay (USD 399 per hectare), for up to 15 rai (2.4 hectares), to rice farmers that agree to cultivate other crops during the 2017/18 offseason cycle.
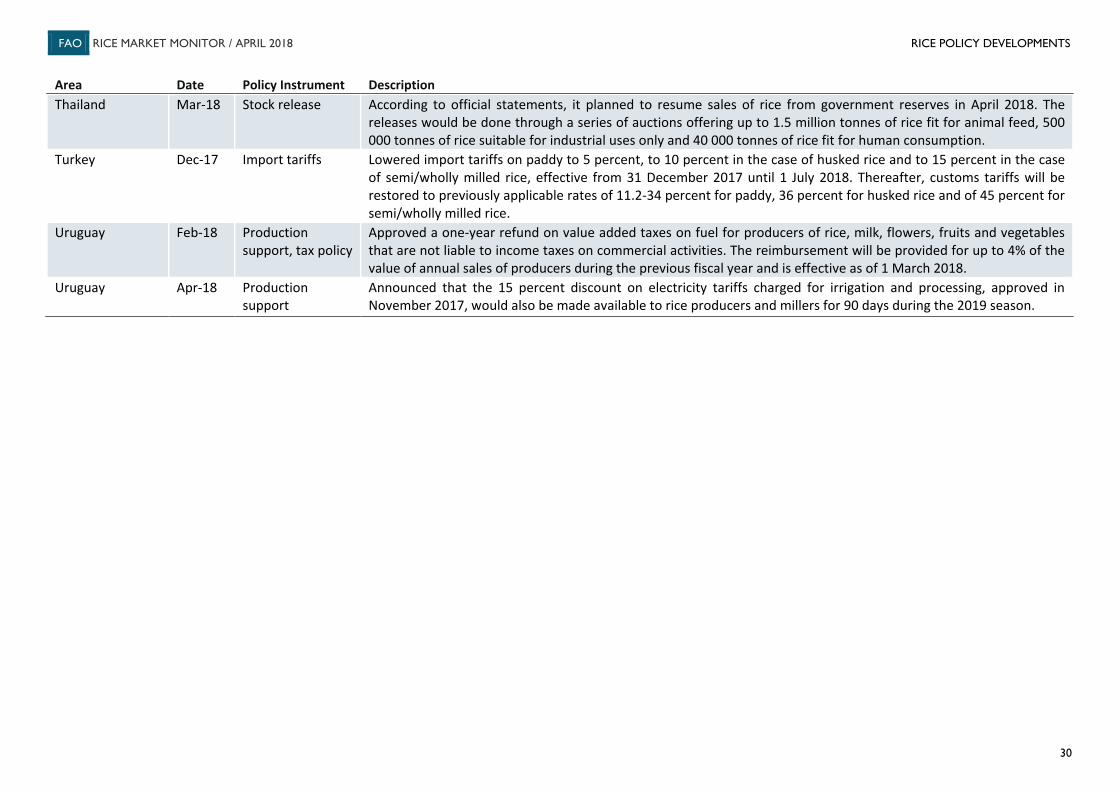
FAO RICE MARKET MONITOR / APRIL 2018 RICE POLICY DEVELOPMENTS
30
Area Date Policy Instrument Description Thailand Mar-18 Stock release According to official statements, it planned to resume sales of rice from government reserves in April 2018. The
releases would be done through a series of auctions offering up to 1.5 million tonnes of rice fit for animal feed, 500 000 tonnes of rice suitable for industrial uses only and 40 000 tonnes of rice fit for human consumption.
Turkey Dec-17 Import tariffs Lowered import tariffs on paddy to 5 percent, to 10 percent in the case of husked rice and to 15 percent in the case of semi/wholly milled rice, effective from 31 December 2017 until 1 July 2018. Thereafter, customs tariffs will be restored to previously applicable rates of 11.2-34 percent for paddy, 36 percent for husked rice and of 45 percent for semi/wholly milled rice.
Uruguay Feb-18 Production support, tax policy
Approved a one-year refund on value added taxes on fuel for producers of rice, milk, flowers, fruits and vegetables that are not liable to income taxes on commercial activities. The reimbursement will be provided for up to 4% of the value of annual sales of producers during the previous fiscal year and is effective as of 1 March 2018.
Uruguay Apr-18 Production support
Announced that the 15 percent discount on electricity tariffs charged for irrigation and processing, approved in November 2017, would also be made available to rice producers and millers for 90 days during the 2019 season.
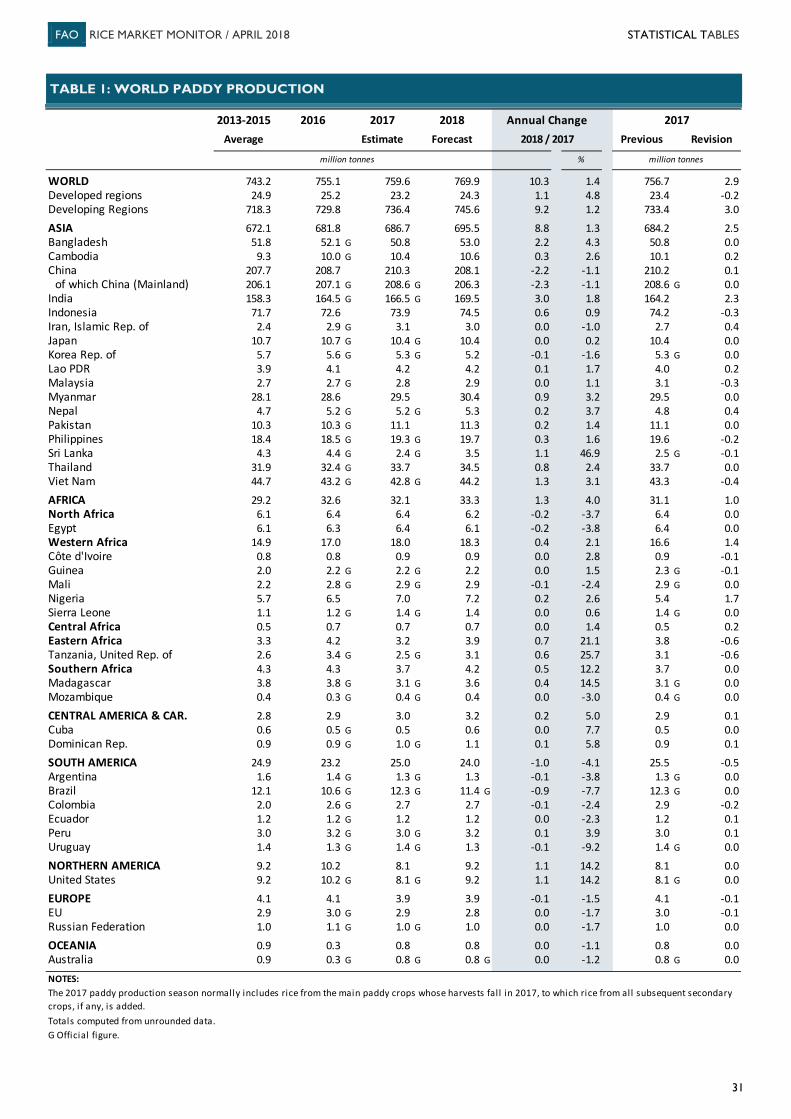
FAO RICE MARKET MONITOR / APRIL 2018 STATISTICAL TABLES
31
2013-2015 2016 2017 2018 Annual Change 2017Average Estimate Forecast 2018 / 2017 Previous Revision
million tonnes % million tonnes
WORLD 743.2 755.1 759.6 769.9 10.3 1.4 756.7 2.9Developed regions 24.9 25.2 23.2 24.3 1.1 4.8 23.4 -0.2Developing Regions 718.3 729.8 736.4 745.6 9.2 1.2 733.4 3.0
ASIA 672.1 681.8 686.7 695.5 8.8 1.3 684.2 2.5Bangladesh 51.8 52.1 G 50.8 53.0 2.2 4.3 50.8 0.0Cambodia 9.3 10.0 G 10.4 10.6 0.3 2.6 10.1 0.2China 207.7 208.7 210.3 208.1 -2.2 -1.1 210.2 0.1
of which China (Mainland) 206.1 207.1 G 208.6 G 206.3 -2.3 -1.1 208.6 G 0.0India 158.3 164.5 G 166.5 G 169.5 3.0 1.8 164.2 2.3Indonesia 71.7 72.6 73.9 74.5 0.6 0.9 74.2 -0.3Iran, Islamic Rep. of 2.4 2.9 G 3.1 3.0 0.0 -1.0 2.7 0.4Japan 10.7 10.7 G 10.4 G 10.4 0.0 0.2 10.4 0.0Korea Rep. of 5.7 5.6 G 5.3 G 5.2 -0.1 -1.6 5.3 G 0.0Lao PDR 3.9 4.1 4.2 4.2 0.1 1.7 4.0 0.2Malaysia 2.7 2.7 G 2.8 2.9 0.0 1.1 3.1 -0.3Myanmar 28.1 28.6 29.5 30.4 0.9 3.2 29.5 0.0Nepal 4.7 5.2 G 5.2 G 5.3 0.2 3.7 4.8 0.4Pakistan 10.3 10.3 G 11.1 11.3 0.2 1.4 11.1 0.0Philippines 18.4 18.5 G 19.3 G 19.7 0.3 1.6 19.6 -0.2Sri Lanka 4.3 4.4 G 2.4 G 3.5 1.1 46.9 2.5 G -0.1Thailand 31.9 32.4 G 33.7 34.5 0.8 2.4 33.7 0.0Viet Nam 44.7 43.2 G 42.8 G 44.2 1.3 3.1 43.3 -0.4
AFRICA 29.2 32.6 32.1 33.3 1.3 4.0 31.1 1.0North Africa 6.1 6.4 6.4 6.2 -0.2 -3.7 6.4 0.0Egypt 6.1 6.3 6.4 6.1 -0.2 -3.8 6.4 0.0Western Africa 14.9 17.0 18.0 18.3 0.4 2.1 16.6 1.4Côte d'Ivoire 0.8 0.8 0.9 0.9 0.0 2.8 0.9 -0.1Guinea 2.0 2.2 G 2.2 G 2.2 0.0 1.5 2.3 G -0.1Mali 2.2 2.8 G 2.9 G 2.9 -0.1 -2.4 2.9 G 0.0Nigeria 5.7 6.5 7.0 7.2 0.2 2.6 5.4 1.7Sierra Leone 1.1 1.2 G 1.4 G 1.4 0.0 0.6 1.4 G 0.0Central Africa 0.5 0.7 0.7 0.7 0.0 1.4 0.5 0.2Eastern Africa 3.3 4.2 3.2 3.9 0.7 21.1 3.8 -0.6Tanzania, United Rep. of 2.6 3.4 G 2.5 G 3.1 0.6 25.7 3.1 -0.6Southern Africa 4.3 4.3 3.7 4.2 0.5 12.2 3.7 0.0Madagascar 3.8 3.8 G 3.1 G 3.6 0.4 14.5 3.1 G 0.0Mozambique 0.4 0.3 G 0.4 G 0.4 0.0 -3.0 0.4 G 0.0
CENTRAL AMERICA & CAR. 2.8 2.9 3.0 3.2 0.2 5.0 2.9 0.1Cuba 0.6 0.5 G 0.5 0.6 0.0 7.7 0.5 0.0Dominican Rep. 0.9 0.9 G 1.0 G 1.1 0.1 5.8 0.9 0.1
SOUTH AMERICA 24.9 23.2 25.0 24.0 -1.0 -4.1 25.5 -0.5Argentina 1.6 1.4 G 1.3 G 1.3 -0.1 -3.8 1.3 G 0.0Brazil 12.1 10.6 G 12.3 G 11.4 G -0.9 -7.7 12.3 G 0.0Colombia 2.0 2.6 G 2.7 2.7 -0.1 -2.4 2.9 -0.2Ecuador 1.2 1.2 G 1.2 1.2 0.0 -2.3 1.2 0.1Peru 3.0 3.2 G 3.0 G 3.2 0.1 3.9 3.0 0.1Uruguay 1.4 1.3 G 1.4 G 1.3 -0.1 -9.2 1.4 G 0.0
NORTHERN AMERICA 9.2 10.2 8.1 9.2 1.1 14.2 8.1 0.0United States 9.2 10.2 G 8.1 G 9.2 1.1 14.2 8.1 G 0.0
EUROPE 4.1 4.1 3.9 3.9 -0.1 -1.5 4.1 -0.1EU 2.9 3.0 G 2.9 2.8 0.0 -1.7 3.0 -0.1Russian Federation 1.0 1.1 G 1.0 G 1.0 0.0 -1.7 1.0 0.0
OCEANIA 0.9 0.3 0.8 0.8 0.0 -1.1 0.8 0.0Australia 0.9 0.3 G 0.8 G 0.8 G 0.0 -1.2 0.8 G 0.0
NOTES:
Totals computed from unrounded data.G Official figure.
The 2017 paddy production season normally includes rice from the main paddy crops whose harvests fall in 2017, to which rice from all subsequent secondary crops, if any, is added.
TABLE 1: WORLD PADDY PRODUCTION
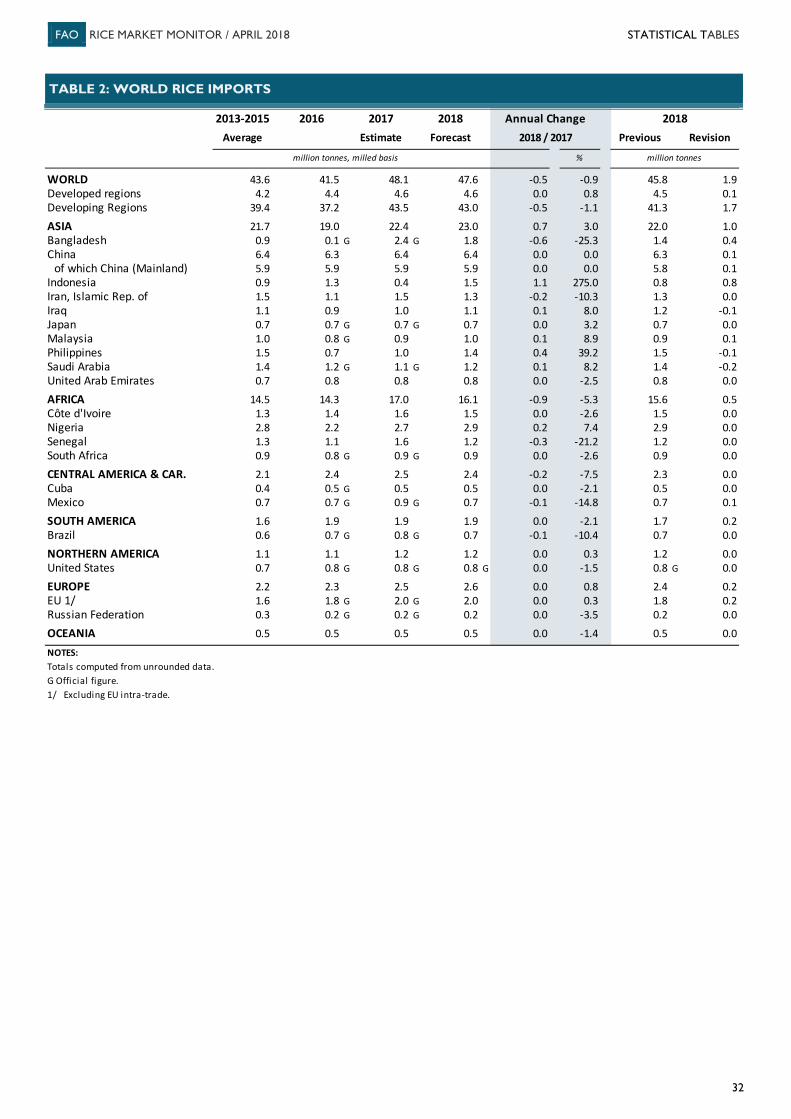
FAO RICE MARKET MONITOR / APRIL 2018 STATISTICAL TABLES
32
2013-2015 2016 2017 2018 Annual Change 2018Average Estimate Forecast 2018 / 2017 Previous Revision
million tonnes, milled basis % million tonnes
WORLD 43.6 41.5 48.1 47.6 -0.5 -0.9 45.8 1.9Developed regions 4.2 4.4 4.6 4.6 0.0 0.8 4.5 0.1Developing Regions 39.4 37.2 43.5 43.0 -0.5 -1.1 41.3 1.7
ASIA 21.7 19.0 22.4 23.0 0.7 3.0 22.0 1.0Bangladesh 0.9 0.1 G 2.4 G 1.8 -0.6 -25.3 1.4 0.4China 6.4 6.3 6.4 6.4 0.0 0.0 6.3 0.1
of which China (Mainland) 5.9 5.9 5.9 5.9 0.0 0.0 5.8 0.1Indonesia 0.9 1.3 0.4 1.5 1.1 275.0 0.8 0.8Iran, Islamic Rep. of 1.5 1.1 1.5 1.3 -0.2 -10.3 1.3 0.0Iraq 1.1 0.9 1.0 1.1 0.1 8.0 1.2 -0.1Japan 0.7 0.7 G 0.7 G 0.7 0.0 3.2 0.7 0.0Malaysia 1.0 0.8 G 0.9 1.0 0.1 8.9 0.9 0.1Philippines 1.5 0.7 1.0 1.4 0.4 39.2 1.5 -0.1Saudi Arabia 1.4 1.2 G 1.1 G 1.2 0.1 8.2 1.4 -0.2United Arab Emirates 0.7 0.8 0.8 0.8 0.0 -2.5 0.8 0.0
AFRICA 14.5 14.3 17.0 16.1 -0.9 -5.3 15.6 0.5Côte d'Ivoire 1.3 1.4 1.6 1.5 0.0 -2.6 1.5 0.0Nigeria 2.8 2.2 2.7 2.9 0.2 7.4 2.9 0.0Senegal 1.3 1.1 1.6 1.2 -0.3 -21.2 1.2 0.0South Africa 0.9 0.8 G 0.9 G 0.9 0.0 -2.6 0.9 0.0
CENTRAL AMERICA & CAR. 2.1 2.4 2.5 2.4 -0.2 -7.5 2.3 0.0Cuba 0.4 0.5 G 0.5 0.5 0.0 -2.1 0.5 0.0Mexico 0.7 0.7 G 0.9 G 0.7 -0.1 -14.8 0.7 0.1
SOUTH AMERICA 1.6 1.9 1.9 1.9 0.0 -2.1 1.7 0.2Brazil 0.6 0.7 G 0.8 G 0.7 -0.1 -10.4 0.7 0.0
NORTHERN AMERICA 1.1 1.1 1.2 1.2 0.0 0.3 1.2 0.0United States 0.7 0.8 G 0.8 G 0.8 G 0.0 -1.5 0.8 G 0.0
EUROPE 2.2 2.3 2.5 2.6 0.0 0.8 2.4 0.2EU 1/ 1.6 1.8 G 2.0 G 2.0 0.0 0.3 1.8 0.2Russian Federation 0.3 0.2 G 0.2 G 0.2 0.0 -3.5 0.2 0.0
OCEANIA 0.5 0.5 0.5 0.5 0.0 -1.4 0.5 0.0
NOTES:Totals computed from unrounded data.G Official figure.1/ Excluding EU intra-trade.
TABLE 2: WORLD RICE IMPORTS
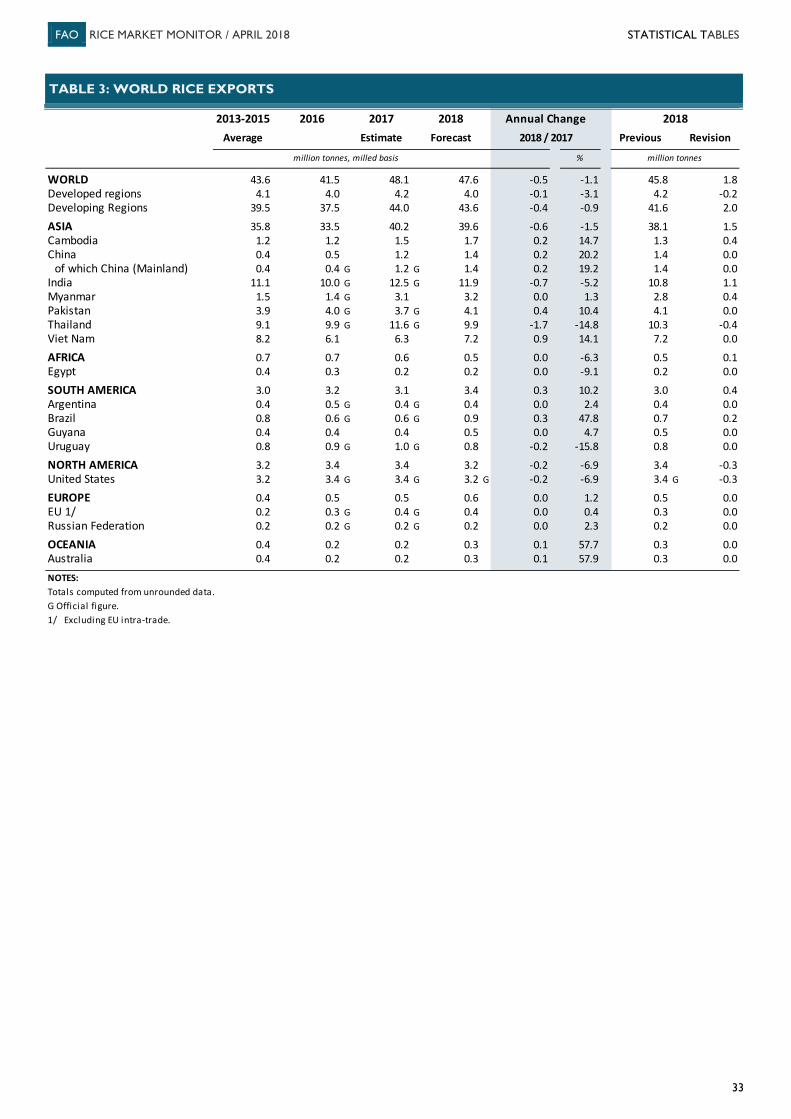
FAO RICE MARKET MONITOR / APRIL 2018 STATISTICAL TABLES
33
2013-2015 2016 2017 2018 Annual Change 2018Average Estimate Forecast 2018 / 2017 Previous Revision
million tonnes, milled basis % million tonnes
WORLD 43.6 41.5 48.1 47.6 -0.5 -1.1 45.8 1.8Developed regions 4.1 4.0 4.2 4.0 -0.1 -3.1 4.2 -0.2Developing Regions 39.5 37.5 44.0 43.6 -0.4 -0.9 41.6 2.0
ASIA 35.8 33.5 40.2 39.6 -0.6 -1.5 38.1 1.5Cambodia 1.2 1.2 1.5 1.7 0.2 14.7 1.3 0.4China 0.4 0.5 1.2 1.4 0.2 20.2 1.4 0.0
of which China (Mainland) 0.4 0.4 G 1.2 G 1.4 0.2 19.2 1.4 0.0India 11.1 10.0 G 12.5 G 11.9 -0.7 -5.2 10.8 1.1Myanmar 1.5 1.4 G 3.1 3.2 0.0 1.3 2.8 0.4Pakistan 3.9 4.0 G 3.7 G 4.1 0.4 10.4 4.1 0.0Thailand 9.1 9.9 G 11.6 G 9.9 -1.7 -14.8 10.3 -0.4Viet Nam 8.2 6.1 6.3 7.2 0.9 14.1 7.2 0.0
AFRICA 0.7 0.7 0.6 0.5 0.0 -6.3 0.5 0.1Egypt 0.4 0.3 0.2 0.2 0.0 -9.1 0.2 0.0
SOUTH AMERICA 3.0 3.2 3.1 3.4 0.3 10.2 3.0 0.4Argentina 0.4 0.5 G 0.4 G 0.4 0.0 2.4 0.4 0.0Brazil 0.8 0.6 G 0.6 G 0.9 0.3 47.8 0.7 0.2Guyana 0.4 0.4 0.4 0.5 0.0 4.7 0.5 0.0Uruguay 0.8 0.9 G 1.0 G 0.8 -0.2 -15.8 0.8 0.0
NORTH AMERICA 3.2 3.4 3.4 3.2 -0.2 -6.9 3.4 -0.3United States 3.2 3.4 G 3.4 G 3.2 G -0.2 -6.9 3.4 G -0.3
EUROPE 0.4 0.5 0.5 0.6 0.0 1.2 0.5 0.0EU 1/ 0.2 0.3 G 0.4 G 0.4 0.0 0.4 0.3 0.0Russian Federation 0.2 0.2 G 0.2 G 0.2 0.0 2.3 0.2 0.0
OCEANIA 0.4 0.2 0.2 0.3 0.1 57.7 0.3 0.0Australia 0.4 0.2 0.2 0.3 0.1 57.9 0.3 0.0
NOTES:Totals computed from unrounded data.G Official figure.1/ Excluding EU intra-trade.
TABLE 3: WORLD RICE EXPORTS
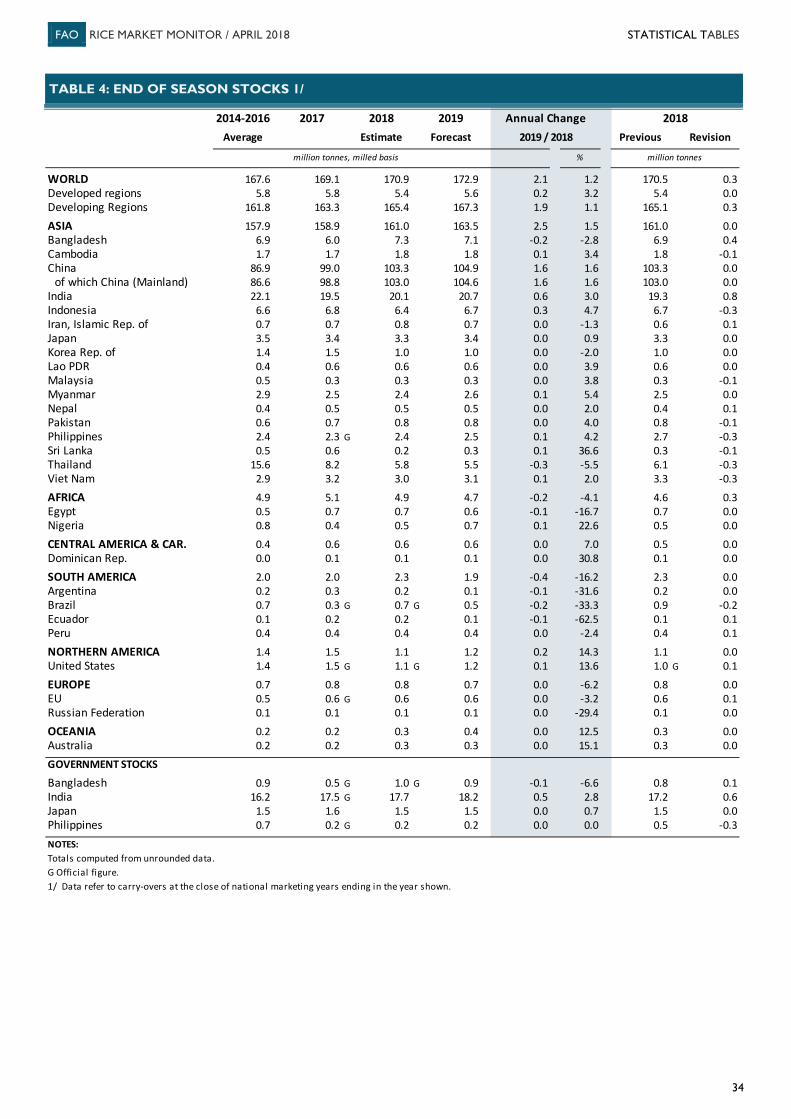
FAO RICE MARKET MONITOR / APRIL 2018 STATISTICAL TABLES
34
2014-2016 2017 2018 2019 Annual Change 2018Average Estimate Forecast 2019 / 2018 Previous Revision
million tonnes, milled basis % million tonnes
WORLD 167.6 169.1 170.9 172.9 2.1 1.2 170.5 0.3Developed regions 5.8 5.8 5.4 5.6 0.2 3.2 5.4 0.0Developing Regions 161.8 163.3 165.4 167.3 1.9 1.1 165.1 0.3
ASIA 157.9 158.9 161.0 163.5 2.5 1.5 161.0 0.0Bangladesh 6.9 6.0 7.3 7.1 -0.2 -2.8 6.9 0.4Cambodia 1.7 1.7 1.8 1.8 0.1 3.4 1.8 -0.1China 86.9 99.0 103.3 104.9 1.6 1.6 103.3 0.0
of which China (Mainland) 86.6 98.8 103.0 104.6 1.6 1.6 103.0 0.0India 22.1 19.5 20.1 20.7 0.6 3.0 19.3 0.8Indonesia 6.6 6.8 6.4 6.7 0.3 4.7 6.7 -0.3Iran, Islamic Rep. of 0.7 0.7 0.8 0.7 0.0 -1.3 0.6 0.1Japan 3.5 3.4 3.3 3.4 0.0 0.9 3.3 0.0Korea Rep. of 1.4 1.5 1.0 1.0 0.0 -2.0 1.0 0.0Lao PDR 0.4 0.6 0.6 0.6 0.0 3.9 0.6 0.0Malaysia 0.5 0.3 0.3 0.3 0.0 3.8 0.3 -0.1Myanmar 2.9 2.5 2.4 2.6 0.1 5.4 2.5 0.0Nepal 0.4 0.5 0.5 0.5 0.0 2.0 0.4 0.1Pakistan 0.6 0.7 0.8 0.8 0.0 4.0 0.8 -0.1Philippines 2.4 2.3 G 2.4 2.5 0.1 4.2 2.7 -0.3Sri Lanka 0.5 0.6 0.2 0.3 0.1 36.6 0.3 -0.1Thailand 15.6 8.2 5.8 5.5 -0.3 -5.5 6.1 -0.3Viet Nam 2.9 3.2 3.0 3.1 0.1 2.0 3.3 -0.3
AFRICA 4.9 5.1 4.9 4.7 -0.2 -4.1 4.6 0.3Egypt 0.5 0.7 0.7 0.6 -0.1 -16.7 0.7 0.0Nigeria 0.8 0.4 0.5 0.7 0.1 22.6 0.5 0.0
CENTRAL AMERICA & CAR. 0.4 0.6 0.6 0.6 0.0 7.0 0.5 0.0Dominican Rep. 0.0 0.1 0.1 0.1 0.0 30.8 0.1 0.0
SOUTH AMERICA 2.0 2.0 2.3 1.9 -0.4 -16.2 2.3 0.0Argentina 0.2 0.3 0.2 0.1 -0.1 -31.6 0.2 0.0Brazil 0.7 0.3 G 0.7 G 0.5 -0.2 -33.3 0.9 -0.2Ecuador 0.1 0.2 0.2 0.1 -0.1 -62.5 0.1 0.1Peru 0.4 0.4 0.4 0.4 0.0 -2.4 0.4 0.1
NORTHERN AMERICA 1.4 1.5 1.1 1.2 0.2 14.3 1.1 0.0United States 1.4 1.5 G 1.1 G 1.2 0.1 13.6 1.0 G 0.1
EUROPE 0.7 0.8 0.8 0.7 0.0 -6.2 0.8 0.0EU 0.5 0.6 G 0.6 0.6 0.0 -3.2 0.6 0.1Russian Federation 0.1 0.1 0.1 0.1 0.0 -29.4 0.1 0.0
OCEANIA 0.2 0.2 0.3 0.4 0.0 12.5 0.3 0.0Australia 0.2 0.2 0.3 0.3 0.0 15.1 0.3 0.0
GOVERNMENT STOCKS
Bangladesh 0.9 0.5 G 1.0 G 0.9 -0.1 -6.6 0.8 0.1India 16.2 17.5 G 17.7 18.2 0.5 2.8 17.2 0.6Japan 1.5 1.6 1.5 1.5 0.0 0.7 1.5 0.0Philippines 0.7 0.2 G 0.2 0.2 0.0 0.0 0.5 -0.3
NOTES:Totals computed from unrounded data.G Official figure.1/ Data refer to carry-overs at the close of national marketing years ending in the year shown.
TABLE 4: END OF SEASON STOCKS 1/
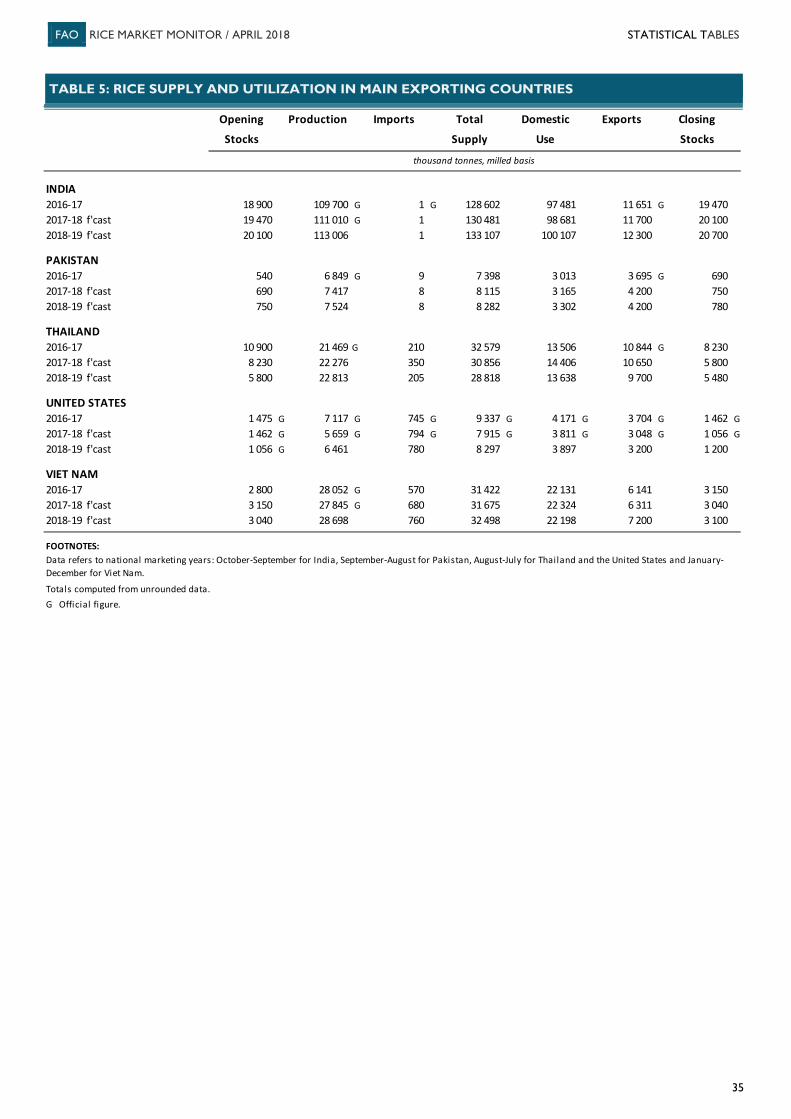
FAO RICE MARKET MONITOR / APRIL 2018 STATISTICAL TABLES
35
Opening Production Imports Total Domestic Exports Closing
Stocks Supply Use Stocks
thousand tonnes, milled basis
INDIA2016-17 18 900 109 700 G 1 G 128 602 97 481 11 651 G 19 4702017-18 f'cast 19 470 111 010 G 1 130 481 98 681 11 700 20 1002018-19 f'cast 20 100 113 006 1 133 107 100 107 12 300 20 700
PAKISTAN 2016-17 540 6 849 G 9 7 398 3 013 3 695 G 6902017-18 f'cast 690 7 417 8 8 115 3 165 4 200 7502018-19 f'cast 750 7 524 8 8 282 3 302 4 200 780
THAILAND2016-17 10 900 21 469 G 210 32 579 13 506 10 844 G 8 2302017-18 f'cast 8 230 22 276 350 30 856 14 406 10 650 5 8002018-19 f'cast 5 800 22 813 205 28 818 13 638 9 700 5 480
UNITED STATES2016-17 1 475 G 7 117 G 745 G 9 337 G 4 171 G 3 704 G 1 462 G2017-18 f'cast 1 462 G 5 659 G 794 G 7 915 G 3 811 G 3 048 G 1 056 G2018-19 f'cast 1 056 G 6 461 780 8 297 3 897 3 200 1 200
VIET NAM2016-17 2 800 28 052 G 570 31 422 22 131 6 141 3 1502017-18 f'cast 3 150 27 845 G 680 31 675 22 324 6 311 3 0402018-19 f'cast 3 040 28 698 760 32 498 22 198 7 200 3 100
FOOTNOTES:
Totals computed from unrounded data.G Official figure.
Data refers to national marketing years: October-September for India, September-August for Pakistan, August-July for Thailand and the United States and January-December for Viet Nam.
TABLE 5: RICE SUPPLY AND UTILIZATION IN MAIN EXPORTING COUNTRIES
5 7
The FAO Rice Market Monitor (RMM) provides an analysis of the most recent developments in the global rice market, including a short-term outlook. Current and previous issues of the RMM can be consulted at: http://www.fao.org/economic/RMM. Monthly updates of selected rice export prices are available on the FAO Rice Price Update at: www.fao.org/economic/est/publications/rice-publications/the-fao-rice-price-update/en/. A collection of major rice policy developments starting in January 2011 is available at: http://www.fao.org/economic/est/est-commodities/commodity-policy-archive/en/?groupANDcommodity=rice. To subscribe to the FAO Rice Price Update and the FAO Rice Market Monitor, please send an e-mail to [email protected] with "subscribe" in the subject line. Use of material subject to credit given to source: FAO Rice Market Monitor Trade and Markets Division Food and Agriculture Organization of the United Nations
I9243EN/1/04.18 © FAO, 2018