Embed Size (px)
Citation preview
Pertanika J. Soc. Sci. & Hum. 24 (S): 155 - 168 (2016)
ISSN: 0128-7702 © Universiti Putra Malaysia Press
SOCIAL SCIENCES & HUMANITIESJournal homepage: http://www.pertanika.upm.edu.my/
Article history:Received: 19 November 2015Accepted: 04 May 2016
ARTICLE INFO
E-mail addresses: [email protected] (Sanny, L., Novita, Scherly),[email protected] (Novela, S.)* Corresponding author
Product Quality Development Analysis with Six Sigma Method: Case of SME Tofu Production in Indonesia
Sanny, L.*, Novita, Scherly and Novela, S. Department of Management, School of Business Management, Bina Nusantara University, Palmerah West Jakarta 11480, Indonesia
ABSTRACT
For Small and Medium Enterprises (SME), quality is one of the factors that determine the success of their products in competition, especially in this era of globalisation. This study was conducted on small and medium companies that produce various products made from soybeans. The problem faced by the company is located in the production process, especially regarding the quality of its products. The purpose of this research is to investigate types of disability and the factors that cause disability issues in the production process. Data are analysed using the six sigma method, which aims to identify and decrease factors that cause disability. Six sigma claims that focussing on reduction of variation will solve process and business problems. By using a set of statistical tools to understand the fluctuation of the process, management can begin to predict the expected outcomes of that process that do not fulfil the standard and texture, caused by human factors, raw materials, production methods, machinery and equipment. The results of this analysis are expected to contribute to the company in order to be able to increase the quality of production so the company is able to grow and compete effectively in the market
Keywords: Analysis, quality, six sigma
INTRODUCTION
Indonesia is a member of the ASEAN (Association of Southeast Asian Nations) Economic Community, which leads to free trade between ASEAN countries. The 10 ASEAN countries are the Philippines, Thailand, Singapore, Brunei Darussalam, Vietnam, Laos, Cambodia, Malaysia,
Sanny, L., Novita, Scherly and Novela, S.
156 Pertanika J. Soc. Sci. & Hum. 24 (S): 159 - 168 (2016)
Myanmar and Indonesia. the ASEAN Economic Community is a competitive market, in which companies must compete not only with local companies but also with companies from the ASEAN region; this means that they need to create products that can fulfil the minimum quality requirements assigned to all ASEAN members. Indonesia normally uses the SNI (Standar Nasional Indonesia) as its national standard as a reference for products throughout the country. Products that cannot meet the minimum quality requirements will face many difficulties competing with similar companies in the country as well as with ASEAN companies.
Besides the technical requirements, the quality of the products themselves need to be considered. Quality is one of the factors that determine the success of a product in penetrating the market, in addition to other major factors such as price and service. Today, consumers everywhere demand high-quality products. A quality product will meet great competitiveness and its chances of being accepted by high society are very high. Quality is also one of the benchmarks for a company’s success because the quality of a product greatly influences corporate image, productivity, profits and liability. Quality is not solely the responsibility of production departments but must be accepted as the most significant objective of a company by every one of its departments.
Quality control no longer belongs to the production department only, but is also carried out by all the company’s operations from selection of raw materials suppliers
up to the delivery process and after-sales service. A production system can be said to be effective if it can carry out production activities that can meet consumer demands at minimum cost. Production activity meant here is activity involving the use of raw materials limited in terms of both quality and quantity.
To ensure the quality of management, a system must be established on a set of procedures, documents, practices and standards for management systems that aim to ensure the suitability of the process and product to the particular needs or requirements of customers . Needs or requirements are determined by the customer and the organisation. Management system quality defines how organisations implement quality management practices consistently to meet the needs of the customer and the market.
A variety of factors affect customer satisfaction and demand for a product. A company needs to know what consumers want and then be able to match that requirement with a suitable product to achieve customer satisfaction. In addition, the product needs to comply with the relevant laws and regulations of the country and show timeliness of delivery. All of this must be achievable at reasonable cost. These are some of the important characteristics of a successful business, especially in Indonesia.
The index ranking of Doing Business 2014 published by the World Bank in September 2014 placed Indonesia in the position of 120. This rank reflects the difficulty of establishing a new company
Product Quality Development Analysis
157Pertanika J. Soc. Sci. & Hum. 24 (S): 159 - 168 (2016)
or of playing an active role in business in Indonesia. These conditions require entrepreneurs and business analysts to think hard about addressing the negative impacts that could arise in the future in order to be able to overcome the various problems that occur and yet emerge as winners in the increasingly complex and competitive business world.
If thoroughly analysed, the core of business competition lies in how companies can create products that are cheaper, better, faster and in accordance with the needs and desires of consumers. The progress and development of the times have changed the way consumers think about selecting a desired product. This not only applies to large industries, but also to small and medium industries.
One of the small and medium industries with very rapid growth is the food industry, especially that specialising in Indonesian traditional food. One of the special products produced by the local industry that is very popular in Indonesia is tofu. Tofu is the most wanted special Indonesian food product, especially on Java Island. Tofu is not only consumed by the lower and middle classes, but also by the upper class. However, since the issue of formalin in tofu was raised, tofu entrepreneurs have been challenged to prove that they can produce natural tofu products free of preservatives and in line with customer expectations.
The soybean cake (tempe) and tofu industries were income earners for 285,000 workers and earned about Rp.700,000,000 per year at one time, according to the
Chairman of Gakoptindo (Association Producers Cooperation of ‘Tahu Tempe’ Indonesian), Ayip Syarifudin (Hahn et al., 2000). Recently there were 177 KOPTI (Cooperation Producers of ‘Tahu Tempe’ Indonesian), which spread in 18 provinces with a total of 115,000 tofu and soybean cake producers and 1,000,000 workers. The total amount of soybean to produce this quantity of soybean products is 132,000 tonnes per month.
In the production process, the producers find difficulties in processing the products effectively and efficiently. Waste generated is high, signalling that process cost is inefficient. The inefficient processing cost arises because of the loss of production capacity, which is caused by the failure of the production process, leading to over-production.
In addition, the most frequent problem experienced by companies is difficulty in obtaining high quality soybean. Soybean production in Indonesia cannot meet the high demanda of companies that use soybean as its main raw material mainly because the price of soybean is unstable as it depends on the imports. This, of course, has a significant effect on the price of tofu and soybean cake.
This study focussed on solving problems that occur in the production process, finding the cause of damage to the product, which leads to inefficiency, because defective or rejected products cannot be sold to customers. This research analysed how to reduce failure in the production process so that companies can improve the quality of their products and reduce the cost they
Sanny, L., Novita, Scherly and Novela, S.
158 Pertanika J. Soc. Sci. & Hum. 24 (S): 159 - 168 (2016)
spend on defective products. This research is significant as it studied ways to minimise defects and problems in production.
THEORETICAL BACKGROUND
Six sigma is defined as the most appropriate method of business process improvement. It aims to find and reduce the factors that cause defects and errors, reduce cycle time and operating costs, increase productivity, better meet the needs of customers, reach higher asset utilisation and gain returns on investment in terms of both production and services.
The six sigma approach is customer-driven (Aboelmaged, 2010). For the business or manufacturing process, the six sigma capability is a metric that indicates how well the process is being performed (Harry & Schroeder, 2000). Six sigma is a quality approach to Total Quality Management (TQM). Generally, quality control systems such as TQM only emphasise on continuous improvement based on self awareness of management (Ansari et al., 2013). Thus, the system does not give any right solutions for any steps that should be done to increase quality dramatically to the failure rate of 0 (zero defect) (Cagnazzo & Taticchi, 2011). Six sigma is a method developed by Motorola that aims to reduce the variability in the main characteristics of quality product at very low levels (Hsieh et al., 2007). Because of its success in quality management through the development of the six sigma concept, Motorola was awarded the Malcolm Bridge Quality Award in 1988, and this concept was later adopted by many
other large companies around the world (Parast & Jones, 2011).
Six sigma has been defined as a management strategy for improving product and process quality (Gakoptindo, 2014). It is also a statistical term used to measure process variations and eliminate defects (Harrison, 2006). Six sigma focusses on how to increase each of the four basic factors i.e. quality, productivity, cost and profitability (Russell & Bernard, 2003). The core of the six sigma methodology level is DMAIC, which stands for define, measure, analsze, improve and control.
Six sigma uses metric measurements, which is a way to measure the specific character that can be verified, either numerically (e.g. percentage of disability) or qualitative (level of satisfaction) (Hammer, 2002). Metric measurement provides information on performance and gives the opportunity to managers to evaluate performance and decision making, identifies opportunities to make improvements and creates performance standards for employees, customers, suppliers and other interested parties (Downing & Bryan, 2010). Six sigma defines quality performance as defects per million opportunities (DPMO).
RESEARCH METHODOLOGY
This study used the descriptive research method based on field observation. This type of research yields data that can describe the kind of factors that can turn out to be obstacles for companies in their natural conditions without any involvement or any changes to their original conditions. This
Product Quality Development Analysis
159Pertanika J. Soc. Sci. & Hum. 24 (S): 159 - 168 (2016)
method is used to see what kind of obstacles the company faces that could hinder them from achieving maximum product quality and capacity.
The method used in this study was observation, where researchers conducted observations directly of the tofu production process to find out what factors caused the problems that occurred. To determine this, the researchers conducted a direct observation of the unit of analysis consisting of the production process, production equipment or machinery and raw materials as well as the human factor involved in the production process.
This research was done through cross-section, meaning that researchers used existing data so as not to take a long time to obtain the data required for this study (Sekaran & Roger, 2013). The research was conducted during the months of September, 2014 to January, 2015. The author used two data sources as data collection strategy, which were the primary data and secondary data sources. The primary data were obtained directly through interviews and observations, while secondary data was obtained from other sources besides the object of the research (Sekaran & Roger, 2013). Nevertheless, the secondary data complemented the primary data and could support this research. It consisted of several literature studies.
The method used was based on the principles contained in the six sigma method. This method was used to anticipate the occurrence of disability or defect by using steps that were scalable and
structured. On the basis of existing data, continuous improvement can be done with the six sigma methodology, which includes defining, measuring, analysing, improving and controlling (DMAIC).
Define
The define phase aimed to identify the products or processes that would be fixed and to determine what kind of resources would be needed in the implementation of the project. At this stage, a checklist was used as a tool to make it easier to determine what type of defect occurs and the number of defects that might occur. The main purpose of the checklist was to ensure that the data were collected carefully and accurately by the operating personnel to control the process and also for decision-making (Herjanto, 2008, p. 422).
Afterwards, the researchers used a Pareto diagram to determine the sequence from greatest to smallest types of defect and their occurrence frequency so that the company could focus on the most dominant types of defect that occurred in its production process. The arrangement helped the researchers to determine the importance or the priority of the event categories. The causes or events were examined to determine the main problems in the process (Nasution, 2005).
Measure
The measure phase was aimed at discovering the Critical to Quality (CTQ) of a product or process that the researchers wanted
Sanny, L., Novita, Scherly and Novela, S.
160 Pertanika J. Soc. Sci. & Hum. 24 (S): 159 - 168 (2016)
to fix. It was also aimed at collecting basic information (baseline information) regarding a product or process and at setting improvement targets to be achieved. The following were the steps performed at this stage of measurement:
1) Analysis of P control charts (P-chart)
The P-chart used for the attribute quality control, which is an essential aspect of production, did not conform to the standards established by the company in the production phase. The diagrams was done using the following steps:
a) Population sampling for P-chart analysis
b) Examination of the characteristics by ca lcu la t ing the mean or control line (CL). Control line was the average of a defective product divided by the number of observation time.
Mean formula:
Note: CL = p = mean of defect proportion
Np = number of defect
n = total sample (total production)
c) To determine the control limits of the supervision, UCL (upper control
limit) and LCL (lower control limit) were set according to this formula:
Note: UCL = upper control limit
LCL = lower control limit
p = mean of defect proportion
n = total sample (total production)
2) To analyse the level of sigma and the company defect for millions of opportunities
Analyse
In the analyse phase, management tried to understand why there were deviations and sought the reasons that led to such deviations. A tool used at this stage was the causal diagram that used to identify and organise the causes that might occur from a specific effect, after which the root cause was established.
Improve
Improvement stage is the stage to generate ideas, design, improve implementation and validate repair. The repair phase was carried out by measuring the level of damage that occurred in the production process, after which improvement recommendations were made and analysing was done, followed by corrective action.
CL = p = � np �n
or number of defect actual product
c) To determine the control limits of the supervision, UCL (upper control limit) and LCL (lower control limit) were set according to this formula:
𝑈𝑈𝑈𝑈𝑈𝑈 = 𝑝𝑝 + 3 !(!!!)!
𝐿𝐿𝐿𝐿𝐿𝐿 = 𝑝𝑝 − 3 !(!!!)!
Product Quality Development Analysis
161Pertanika J. Soc. Sci. & Hum. 24 (S): 159 - 168 (2016)
Control
Control was the last stage in the six sigma approach, where the process was organised, product improvement was carried out and ongoing performance monitoring was done. At this stage the manager ensured a new level of performance in standard conditions, which were then documented and published as useful corrective measures for the subsequent repair process.
USING THE TEMPLATE
The method used was based on the principles contained in the six sigma method. This method was used to anticipate the occurrence of disability or defects according to steps that were scalable and structured. Based on the existing data, continuous improvement could be done using the six sigma DMAIC method. The DMAIC method involved the following steps.
1) Define
Define was the stage of defining the quality problem and determining the defect priorities that often occurred on the tofu product. At this stage, the defects that occurred in the final result of the production processes were
defined and the factors that cause the defect were also identified.
Problems in the production process can be easily defined using the checklist to know what kind of defects had occurred and the number of defective products generated on each type of error.
Based on the observations that had been made, there were four kinds of defects that occurred in the company: thickness of the tofu was not the standard thickness (thin), the tofu fell apart (poor texture), water content was excessive and the tofu colour was dull.
Based on production research conducted from October to December 2014, there were four types of tofu defects that occurred in the company: Tofu thickness was not up to the required standards, as observed in 979 trays of tofu; Tofu with falling apart texture was observed in 717 trays of tofu; Excessive water content was observed as the defect in 80 trays of tofu; and Tofu with dull colour was observed in 50 trays of tofu. The average of defective trays over the three-month period was 57.079 trays as illustrated in Table 1 below:
Table 1 Accumulation Data of Defect Product (2014 Sept-Dec)
No MonthDefect type
Total defect (TraysThickness not
up to standardFall apart texture
Excessive water content
Dull colour
1 October 399 173 35 25 6322 November 295 268 27 18 6083 December 285 276 18 7 586Total (Trays) 979 717 80 50 1826
Sanny, L., Novita, Scherly and Novela, S.
162 Pertanika J. Soc. Sci. & Hum. 24 (S): 159 - 168 (2016)
Table 2 Amount of Defect Product Data (2014 Sept-Dec)
Type of defect Defect amount (Trays)
Defect percentage (%)
Cumulative percentage (%)
Thickness not up to standard (thin) 979 53.6 53.6Fall apart texture 717 39.3 92.9Excessive water content 80 4.4 97.3Dull colour 50 2.7 100Total 1,826 100Source: The results of processing the data, 2015
Figure 1: Defect type Pareto diagram
20
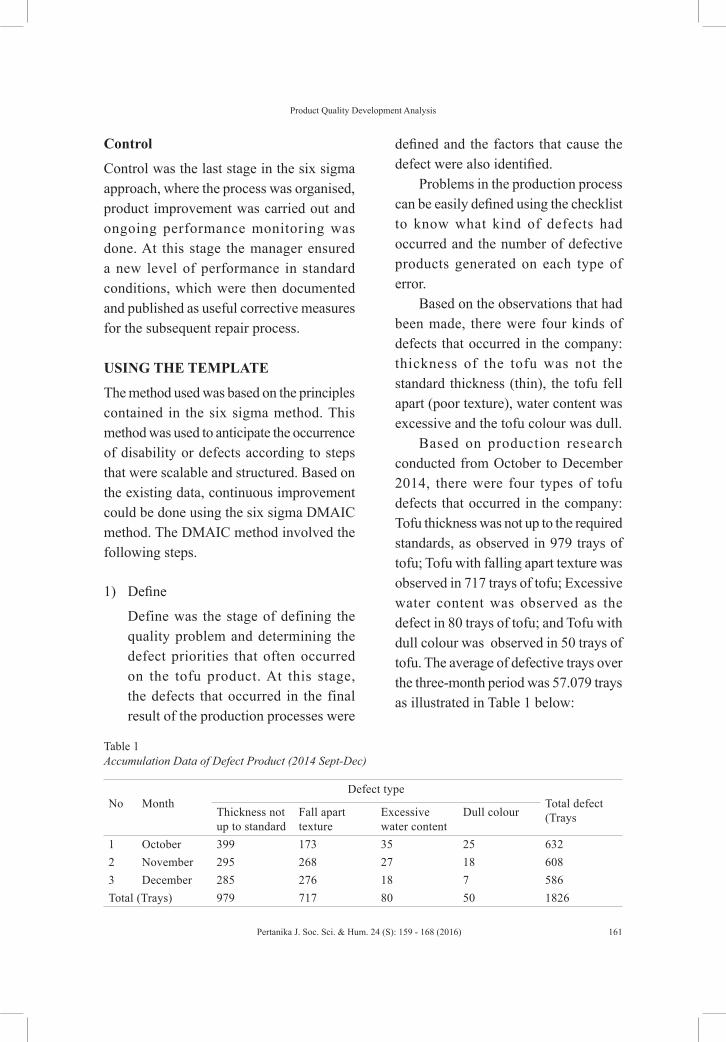
The defects that occurred in the production process can be described using a Pareto diagram using Minitab application version 17 as given below:
Figure 1 above shows that the defect that affected the largest amount of tofu, which occurred in the tofu production process during the months of October to December 2014 was thickness that did not comply with the required standard of thickness (thin); there were as many as 979 trays or 53.6% of the total that showed this defect while the type of defect that affected the least number of trays was dull colour of tofu and in the months of October to December 2014,
50 trays or 2.7 % of the total production of tofu was defective.
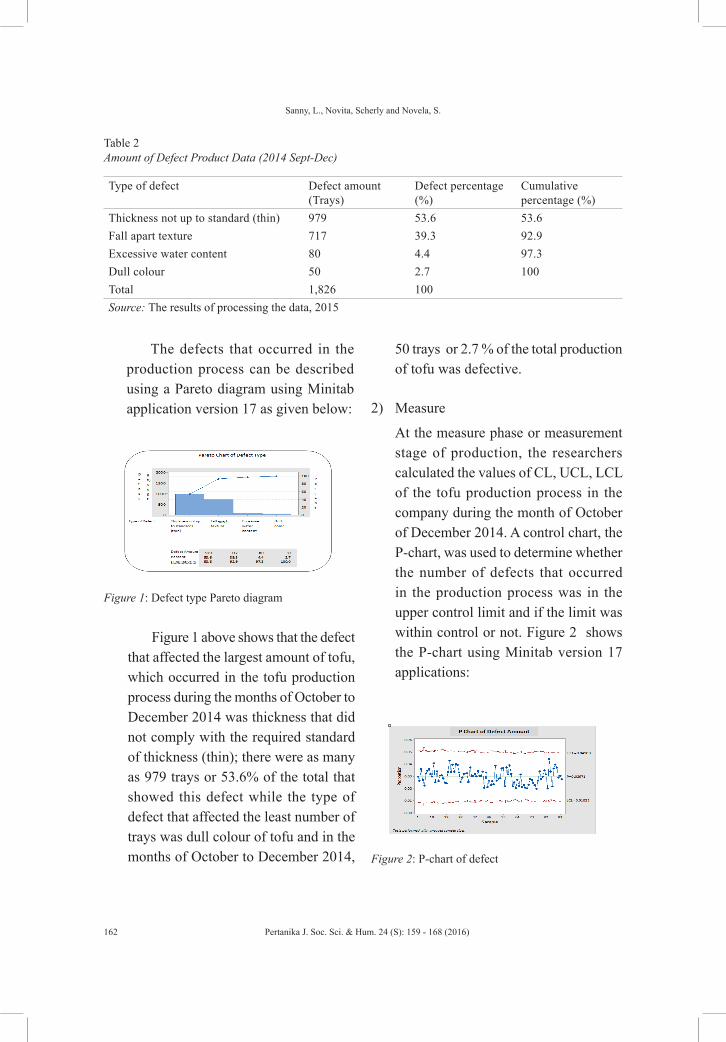
2) Measure
At the measure phase or measurement stage of production, the researchers calculated the values of CL, UCL, LCL of the tofu production process in the company during the month of October of December 2014. A control chart, the P-chart, was used to determine whether the number of defects that occurred in the production process was in the upper control limit and if the limit was within control or not. Figure 2 shows the P-chart using Minitab version 17 applications:
Figure 2: P-chart of defect
20
Product Quality Development Analysis
163Pertanika J. Soc. Sci. & Hum. 24 (S): 159 - 168 (2016)
From Figure 2, it can be concluded that the number of defects that occurred in the production process during the months of October to December 2014 was in the Upper Control Limit (UCL) or within the Lower Control Limit (LCL); therefore, production in this period could be said to be stable.
T h e D e f e c t p e r M i l l i o n Opportunities (DPMO) and sigma value showed that in the months of October to December 2014, the company had a sigma value of an average of 3,393 with a defect probability of 29.764 trays per one million trays produced.
However, when corporate profit was analysed, it turned out that the company had suffered losses due to the loss of profit opportunities, with an average of 29.9% from the profits that would have been accrued in the absence of defect issues.
This scale of loss was was certainly detrimental to the company. If the problem is not addressed immediately, the company will continue to lose opportunities to earn greater profits.
3) Analyse
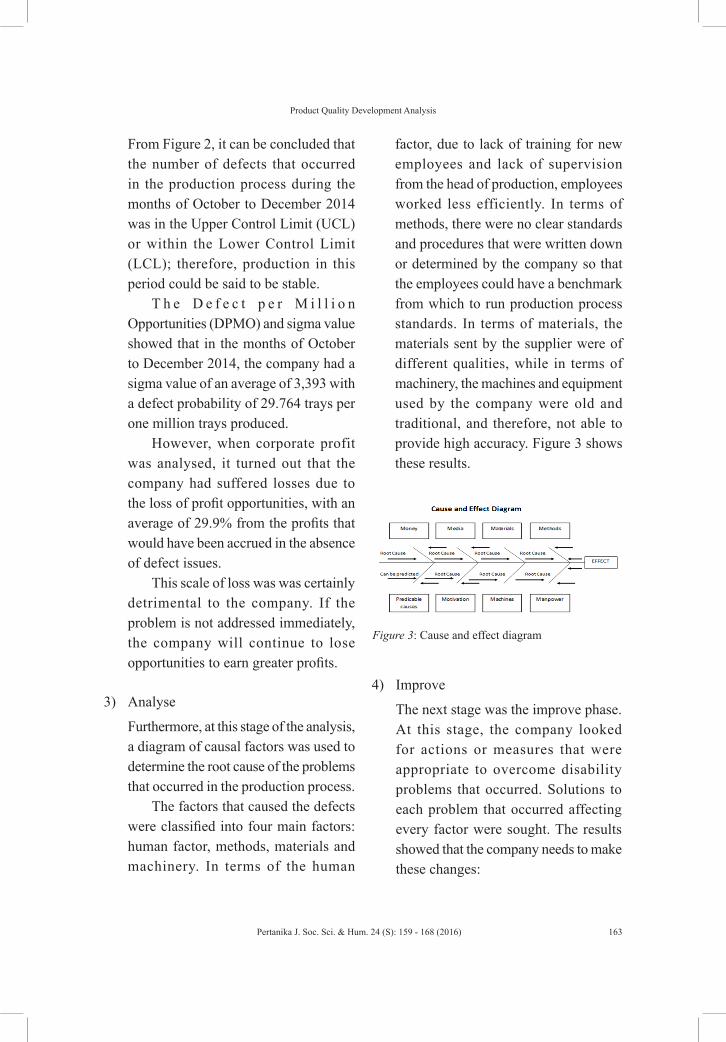
Furthermore, at this stage of the analysis, a diagram of causal factors was used to determine the root cause of the problems that occurred in the production process.
The factors that caused the defects were classified into four main factors: human factor, methods, materials and machinery. In terms of the human
factor, due to lack of training for new employees and lack of supervision from the head of production, employees worked less efficiently. In terms of methods, there were no clear standards and procedures that were written down or determined by the company so that the employees could have a benchmark from which to run production process standards. In terms of materials, the materials sent by the supplier were of different qualities, while in terms of machinery, the machines and equipment used by the company were old and traditional, and therefore, not able to provide high accuracy. Figure 3 shows these results.
Figure 3: Cause and effect diagram
4) Improve
The next stage was the improve phase. At this stage, the company looked for actions or measures that were appropriate to overcome disability problems that occurred. Solutions to each problem that occurred affecting every factor were sought. The results showed that the company needs to make these changes:
Sanny, L., Novita, Scherly and Novela, S.
164 Pertanika J. Soc. Sci. & Hum. 24 (S): 159 - 168 (2016)
Conduct regular training, especially for new employees to make them more proficient in the production process so that small errors that can lead to disability issues can be minimised.
Conduct closer scrutiny using rigorous oversight of the production process at the company so that employees are productive and conscientious.
• Conduct briefings or evaluation at the beginning and at the end of the production process to determine what problems occurred during the production process so that they can be solved quickly.
• Establish clear standards so that work during the production process runs smoothly and is more targetted.
• To strictly check raw material quality delivered by suppliers.
• Perform scheduled maintenance and purchase of new equipment such as tools to support the production process.
5) Control
The last stage was the control phase, where the company documented and disseminated what action to take to achieve disability issues of 0% (zero defect). This was done to prevent the recurrence of problems. Below are ideas of how to prevent the recurrence of the same problems:• To str ict ly control both raw
materials or employee behaviour that is involved in the production
process to make sure that product quality is good
• To perform regular maintenance and repair of machinery and equipment used in the production process
• To ensure that production division employees write down the number of defective products and the types of defect that occur every day and report them to the chief of production.
• To conduct br ief ings a t the beginning of each production process and evaluate it at the end of the production process in order to minimise the possibility of having the same mistake recur too frequently.
• To produce a report each month that includes a graph that compares production volume with the number of defective products for easy evaluation and resolution of the dominant type of defect.
CONCLUSIONS AND RECOMMENDATIONS
Several conclusions can be made from this study, as given below.1) Based on the analysis using the cause
and effect diagram, some of the main causes of defects in the tofu production process were:
a. Human factor b. Method factor c. Material or raw material factor d. Machinery and equipment factor
Product Quality Development Analysis
165Pertanika J. Soc. Sci. & Hum. 24 (S): 159 - 168 (2016)
The research showed that the most influential factors affecting defects in tofu production were the human and method factors.
2) Analysis and implementation of the six sigma method showed that:
a. Several defects were obvious: Tofu thickness was not up to standard (thin), tofu texture was poor (falling apart), there was excessive water content and the tofu colour was dull. Defective trays from September to December 2014 numbered as many as 1,826.
b. The Pareto diagram showed two predominant types of defect: Tofu thickness was not up to standard (thin) defect (53.62%) and the tofu texture fell apart (39.27%).
c. Based on the data analysis using the Defect per Million Opportunities at the measurement stage, the company was shown to have an average sigma level of 3.393 with a defect possibility of 29,764 trays in one million trays.
3) Recommendations given after this study are:
a. Strictly control both raw materials and employee behaviour to ensure that product quality was better.
b. Perform regular maintenance and repair of the machinery and
equipment used in the production process.
c. Employees from the production division must write down the number of defective products and the type of defects that occur every day and report the results to the chief of production.
d. Conduct briefings at the beginning of each production process and evaluate it at the end of the production process to minimise repeats.
e. Prepare a report that compares the volume of production each month and which also shows the number of defective products each month using graphs for easy evaluation and resolution of the dominant types of defect.
The author also advises that, among other actions, the company should use the six sigma method DMAIC to determine the types of defect that often occur in the production process and the factors that cause this type of defect in order to reduce the number of defects or even achieve a zero defect production process for the generation of maximum profit.
The research also revealed that the defects were caused by the human factor, method factor, materials factor and machinery and equipment factor. It is, therefore, necessary for the company to put
Sanny, L., Novita, Scherly and Novela, S.
166 Pertanika J. Soc. Sci. & Hum. 24 (S): 159 - 168 (2016)
in the effort to resolve the related problems. Efforts to this end that can be undertaken by the company include:
a. Strictly control both raw materials and employee behaviour to ensure that product quality was better.
b. Perform regular maintenance and repair of the machinery and equipment used in the production process.
c. Employees from the production division must write down the number of defective products and the type of defects that occur every day and report the results to the chief of production.
d. Conduct briefings at the beginning of each production process and evaluate it at the end of the production process to minimise repeats.
e. Prepare a report that compares the volume of production each month and which also shows the number of defective products each month using graphs for easy evaluation and resolution of the dominant types of defect.
These proposals will require the company to invest time and money into training new employees and repairing equipment and machines. The company may even have to purchase new equipment to better support its production process. Such measures will provide sustainable benefits to the company
as well as minimise the occurrence of defects in production. These efforts can ensure that the company does not miss out on opportunities of winning maximum profit. Moreover, if such action is done, the company can produce products of better quality so that consumers feel satisfied. This can create customer loyalty for the company.
REFERENCESAboelmaged, M. G. (2010). Six sigma quality: A
structured review and implication for future research (pp. 1–35). Emerald Group Publishing, Limited. Retrieved October 9, 2014, from proquest.com
Ansari, A., Lookwood, D., Modarress, B., & Nino, J. (2013). Application of six-sigma in finance: A case study. Journal of Case Research in Business and Economics, 13(2), 1–14.
Cagnazzo, L., & Taticchi, P. (2011). Six sigma: A literature review analysis. Recent Advances in E-Activities. Information Security and Privacy Journal, 23(1), 29–34.
Downing, C. G., & Bryan, A. M. (2010). Optimization of operational techniques using six sigma principles (pp. 1–7). In Proceedings of the 2010 Industrial Engineering Research Conference, Cancun, Mexico. Retrieved October 9, 2014 from proquest.com
Gakoptindo. (2014). Kondisi industri tahu tempe di Indonesia. Gabungan Koperasi Produsen Tahu Tempe Indonesia (Unpublished article).
Hahn, J., Doganaksoy, N., & Hoerl, R., (2000). The evolution of six sigma. Quality Engineering, 12(3), 317–326.
Hammer, M. (2002). Process management and the future of six sigma. Sloan Management Review, 43(2), 26–32.
Product Quality Development Analysis
167Pertanika J. Soc. Sci. & Hum. 24 (S): 159 - 168 (2016)
Harrison, J. (2006). Six Sigma vs. lean manufacturing: Which is right for your company? Foundry Management & Technology, 13(7), 31–32.
Harry, J., & Schroeder, R., (2000). Six sigma: The breakthrough management strategy revolutionizing the world’s top corporations. New York: Doubleday.
Herjanto, E. (2008). Manajemen Operasi (3th Ed.). Jakarta: Grasindo.
Hsieh, C., Lin, B., & Manduca, B. (2007). Information technology and six sigma implementation. Journal of Computer Information Systems, 47(4), 1–10.
Nasution, M. (2005). Total quality management. Jakarta: PT Gramedia Pustaka Utama.
Parast, M. M., & Jones, E. C. (2011). A relationship between six sigma and Malcolm Bridge quality award (pp. 1–7). Institute of Industrial Engineers, University of Nebraska-Lincoln. Retrieved October 9, 2014 from proquest.com
Russell, S. R., & Bernard W. T., III. (2003). Operation management (4th ed.). New Jersey: Pearson Education, Inc.
Sekaran, U., & Roger, B. (2013). Research methods for business: A skill-building approach (6th ed.). UK, Chichester: John Wiley & Sons, Ltd.