Embed Size (px)
Citation preview

Product Development Flow:
A Queueing Perspective
Ehsan Vasheghani Farahani
A Thesis
In
The Department of
Mechanical and Industrial Engineering
Presented in Partial Fulfillment of the Requirements
For the Degree of Master of Mechanical and Industrial Engineering
Concordia University
Montréal, Québec
May 2014
© Ehsan Vasheghani Farahani
Concordia Univeristy
School of Graduate Studies
This is to certify that the thesis prepared
By: Ehsan Vasheghani Farahani
Etitled: Product Development Flow:
A Queueing Perspective
and submitted in partial fulfillment of the requirements for the degree of
Master of Mechanical and Industrial Engineering
Comply with the regulation of this university and meets the accepted standards with
respect to originality and quality.
Signed bythe final examining committee:
Chair
Dr. Ali Akgunduz
Examiner
Dr. Gerard J. Gouw
Examiner
Dr. Andrea Schiffauerova
Supervisor
Dr. Nadia Bhuiyan
Approved by
Chair of Department or Graduate Program Director
20
Christopher Trueman, PhD., Interim Dean
Faculty of Mechanical and Industrial Engineering

Abstract
Product Development Flow: A Queueing Perspective
Ehsan Vasheghani Farahani
In today’s global marketplace, companies have become aware of the need for
agility in the development of new products to survive or in the best case to continue the
endless competition. In order to stay competitive, companies are adopting various
approaches to maintain a high level of performance in all enterprise domains and deliver
value to their customers. With much success in production environments, lean principles
have also been found to be applicable in other areas of the enterprise, including product
development (PD).
The research reported in this thesis addresses the goal of continuous improvement of flow
in PD. While the lean philosophy has been implemented successfully in manufacturing,
the context of PD lacks application of such concepts.To tackle the information flow
problem, practitioners of lean in manufacturing have established the “one piece flow”
logic where the size of the lot of goods moving from one process to the next is intented to
be closer to one. However, information as the moving piece in PD is not as visible as in
manufacturing. Therefore, the “one piece flow” concept is difficult, if not impossible, to
achieve in PD.
A smooth and steady flow of value delivery among processes results in several
improvements, such as a reduction in lead time, intellectual work in process (IWIP),
rework, and so on. The current research is mainly focused on achieving flow in PD by
making a bridge among lean principles, queueing theory and operations research.
Information flow is translated into entities of a simple priority queuing system that
monitors the flow rate of jobs among servers, or PD team members. The reverse flow of
jobs from downstream processes represents rework which due to its nature has a higher
priority than those of regular tasks. Since rework flow updates information and
assumptions within a process, preemptive queuing policies are studied. Two types of
waste through the value stream, namely queue waiting time and outdated information
processing time (lost effort), have been quantified accordingly. The wastes, along with
the throughput, have been optimized using a multi-objective non-linear model regarding
the flow rates among engineers.
Results show higher rework generation in downstream processes increases the congestion
(the main barrier to flow) in the system, which leads to increase in the overall lead time.
Finally, in addition to a plausible approach to maintain flow, a criterion to improve
decision making for value stream managers has been presented.

Acknowledgments
All praise be to God.
I would like to thank my thesis supervisor, Dr. Nadia Bhuiyan. Apart from the
financial support, I have learnt a lot from her. Dr. Bhuiyan’s wisdom, knowledge
and commitment to the highest standards inspired and motivated me during my
studies.
I must express my gratitude to my parents Baba Ata and Maman Manizheh; the
ones who taught me the meaning of life. Without their love I would have never felt
strong enough to pursue my goals, even though said goals have kept me far away
from them.
I am also indebted to my brother Iman and my friend, Dr. Shahin Vakilinia who
provided me with valuable advice for this research.
Finally, I would like to thank Dr. Vincent Thomson for his insightful comments
during the modeling of the research problem.

Table of Contents
1 Introduction...............................................................................................1
2 Literature Review .....................................................................................6
2.1 Lean Thinking ....................................................................................6
2.2 Product Development ......................................................................10
2.3 Lean Product Development .............................................................14
2.4 Overview of Queues ........................................................................27
3 The Model ...............................................................................................31
3.1 Problem Statement ...........................................................................31
3.2 Description, Scope and Methodology..............................................32
4 Optimization ...........................................................................................41
4.1 Measures of interest .........................................................................41
4.2 Numerical Example and Analysis....................................................44
4.3 Flow Maintenance............................................................................49
4.4 Decision making approach...............................................................51
5 Conclusions and Future Work ................................................................57
6 Appendix I – Queueing Formulation ......................................................60
6.1 Appendix I-M/G/1 Preemptive Repeat ............................................60
6.2 Appendix II-Optimimization Results ..............................................63
7 References...............................................................................................66

List of Figures
Figure 1: Congestion in Upstream.......................................................................... 34
Figure 2: Design process value-stream .................................................................. 39
Figure 3: Conceptual Model of PD Flow ............................................................... 40
Figure 4: Rework intensity and Backlog (IWIP) trend .......................................... 45
Figure 5: Rework intensity and Lost effort trend ................................................... 46
Figure 6: Rework Intensity ..................................................................................... 47
Figure 7: Simulation CA (01), Backlog Versus Throughput ................................. 48
Figure 8: Simulation CA (02), Backlog Versus Throughput ................................. 49
Figure 9: Normalized Sensitivity Trends ............................................................... 54
vii
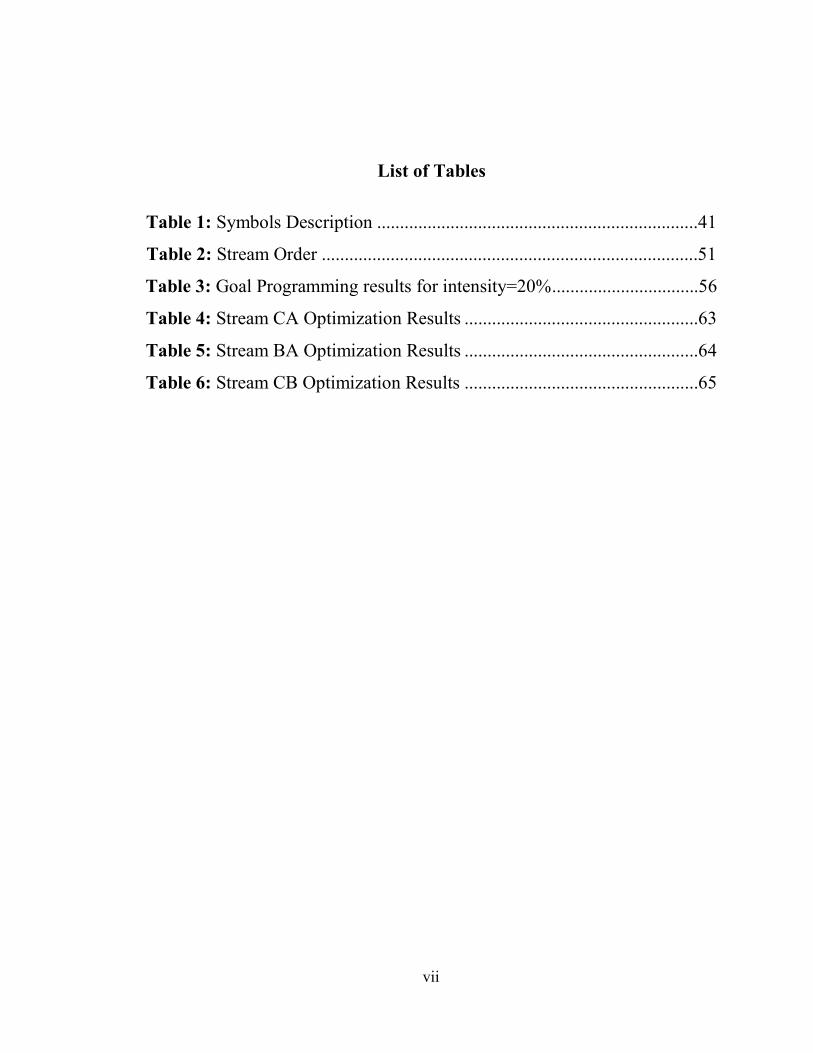
List of Tables
Table 1: Symbols Description ......................................................................41
Table 2: Stream Order ..................................................................................51
Table 3: Goal Programming results for intensity=20%................................56
Table 4: Stream CA Optimization Results ...................................................63
Table 5: Stream BA Optimization Results ...................................................64
Table 6: Stream CB Optimization Results ...................................................65
1
1 Introduction
With the success of the lean philosophy in manufacturing, researchers have tried
to apply the same techniques to a PD context. “Lean” is the term originally coined by
Krafcik (1998) through the research at the MIT International Motor Vehicle Program
(IMVP) and that subsequently led to the genesis of the term “lean production” to
differentiate between the Toyota production system and the mass production system
(Womack et al., 1990). Lean manufacturing consists of a set of principles that are
customer focused and knowledge driven, and strives to eliminate waste and create value,
dynamically and continuously (Browning, 2000).
Since the beginning, pioneers of lean production noticed that lean was not just
applicable to the manufacturing realm. In fact it is a holistic course of thought and a
management system that was in contrast to the traditional mass production rationale.
Hence, along with manufacturing, domains such as supplier management, product
development, customer management and policy focusing processes for the whole
enterprise are believed to have potential to benefit from the lean philosophy (Holweg,
2007).
Our interest focuses on product development as it is broadly accepted that the
development of new products is of increasing importance to profitability, prosperity and
organizational competitiveness in diverse industries such as the pharmaceutical,
automotive, food and nutrition, IT and software development and finally aerospace
sectors. In fact, PD reflects a company’s competitiveness by showing its ability to create
knowledge (Leiponen, 2006).

2
In 2008, the Canadian manufacturing sector invested approximately 39 billion dollars in
product design, research and development (PDR&D) to enhance the link between ideas
and concepts to the creation of new and improved products (Industry Canada, 2010a). As
the competition has intensified, the most common response by Canadian manufacturers is
manoeuvring on price through the implementation of the state of the art cost reduction
strategies. According to the same report (Industry Canada, 2010b) reliance on PD and
product extensions varies by industry in Canada. For instance, electronics manufacturers
focus more on PD and speed to market to meet fast market pace and short product
lifecycle, whereas the aerospace industry converges all the efforts on product extension
(new features, higher quality, and lower cost) due to the high risk and complexity of PD
and long product life cycle in areas such as advanced aircraft structures (fuselage and
wing components, horizontal and vertical stabilizers, and sub-assemblies), avionic
systems, and critical engine systems and components.
Lean applications to PD activities are generally more recent. One of the prime
ideas of lean is “flow”. The smooth flowing delivery of value brings about many other
improvements as a consequence. Thus, achievement of flow in PD has been of great
interest for many years. The design and development of a product is a complex process
involving many resources and different varieties of skills. It is essential to manage both
efficiency and effectiveness of the whole process in order to improve productivity and
quality of design which eventually leads to high quality products. Aside from
manufacturing, the goal of “better, faster, cheaper” has triggered movements to reduce
development cycles which is believed to have significant effects on life-cycle profits.
Design jobs always involve dealing with numerous tangible and intangible

3
followed by qualitative and quantitative constraints and customer needs (Oppenheim,
2004). Phrases like fuzzy front-end (Smith and Reinertsen, 1991) and start in the dark
(Wheelwright and Clark, 1994) stem from the uncertainty coupled with new product
development (NPD) processes which are essential to take an idea, translate it to a very
well defined concept, develop it and launch it to marketplace. Companies care about their
productivity and metrics such as lead time more than ever before. Almost every company
attempts to measure its PD efforts using various metrics. Interestingly PD practitioners
often find metrics unpleasant and sometimes far away from the reality. One reason could
be the evaluation of activities that do not indicate the effectiveness of PD or a meaningful
trend of how processes operate (e.g. hours spent working on a project or the number of
changes to a design). Another aspect is the reliability of the data collected to calculate the
metric which we believe stems from the absence of flow. We only can rely on metrics
that reflect a process in which flow is present. In other words, in the absence of flow,
metrics do not exhibit a credible trend on what is going on in the process.
Inefficiencies in processes (e.g. finding errors too late) have become a barrier to
reach target productivity levels while customer needs are becoming more and more
complex every day. Although estimation of design effort plays an important role, absence
of flow in PD activities could be considered as another primary factor that amplifies
uncertainty and increases project cost and development cycle time. Unfortunately,
companies monitor process outcomes rather than causes and end up with the same poor
results they have always faced. Falling behind the planned schedule due to flow related
issues could result in irreversible failures to introduce new products and thus competitors
take the control of the market. So, in order for PD processes to be effective- which is

4
critical to the company’s success- continuous monitoring and review of flow within
processes is indispensable.
Some believe a design job is inherently an art and hence deals with creativity and
innovation (Oppenheim, 2004).This is why a standard operation procedure (SOP) is
meaningless in the PD context. So, the problem is to determine the right level of detail on
how things should work and manage the flow. Production attributes are more tangible
than that of flow in processes. There are several established methods to control
production flow and associated wastes. However, what is often missed is a set of actions
to identify and monitor waste in PD activities. One of the main reasons is invisibility of
information as the material being processed.
Hence, as a contribution to the emerging mindset of applying queueing techniques
as a means to identify hidden waste in PD, we propose a model to meet the need for
managing flow in PD processes. Inspiring from the lean philosophy literature, we intend
to identify and quantify non-value added portion of the total flow time of the information
(in the form of jobs residing in an open queueing network) within a PD generic 3-phase
value stream. To manage the flow in an optimal manner, we study a multi-objective
non-linear model, followed by simulation to validate the findings. Finally, two methods
to help managers to better deal with flow related issues will be discussed.
The structure of the dissertation will be as follows. First, an introduction to the
research context is presented. Then, we review the literature divided into four sections
namely lean thinking, product development, lean product development and overview of
queues. Follewed by that, we present the structure of the model by discussing the
research problem and determining the scope of the current study. In the fourth chapter,

5
we provide the details regarding the optimization model and explain our findings. Finally,
we discuss our approach to address the flow in PD and propose our percieved venues of
improvement for future research.

6
2 Literature Review
2.1 Lean Thinking
The notion behind what is called “lean thinking” can be linked to numerous
sources, including famous industrialists such as Henry Ford and management thinkers
such as Edward Deming. Of particular interest is the manufacturing model originally
developed in Toyota’s post World War II manufacturing operations (known as the Toyota
Production System) under the supervision of its chief engineer, Taiichi Ohno (Liker,
1997).
It is interesting to note that the idea of this type of production and its successor
“Lean Manufacturing” was based on observations of customer purchase patterns. While
reading about descriptions of American supermarkets, Ohno envisioned supermarkets for
the model he was trying to design for the factory. A customer in the supermarket takes
only the exact amount of products he needs from the shelf and then the store workers
replenish the shelves with only enough new products to fill up the shelves’ space. Ohno
noticed that this also works in the production environment, since a work center that
needed parts would go to an inventory space for a particular part and take only the
quantity that is needed. Then, the inventory area will be restocked by the work center that
produced the parts, with only enough product to replace the inventory that had been
withdrawn. This model is believed to produce the necessary items, in the necessary
quantities at the necessary time.
According to the pioneers of lean, five principles were put forward as a
framework to be used by an organization to implement lean thinking (Womack and
Jones, 2003). An essential and initial assumption is to recognize that only a small portion

7
of the total time and effort to produce a product adds value from the end customer
perspective. These five principles are:
1. Specifying value: It typically begins with the identification of customers
or stakeholders of a process. Understanding customers’ needs in terms of a meaningful
and a specific outcome (i.e. product or service) is a critical starting point for any lean
initiative. Above all, the value can only be defined by the ultimate customer.
2. Identify the value stream: This step helps to visualize the end-to-end
process composed of several operations, tasks or activities within an organization which
may or may not add value. The value stream is described as a set of actions currently
required to bring the product through the main flows essential to every product.
According to the literature (Womack and Jones, 2003), such flows include critical
management tasks done in any business (problem-solving task, information management
task and physical transformation task). Others limit the aforementioned flow to the
production flow and the design flow (Rother and Shook, 2003).
In this context, activities are categorized into three different levels:
(a) Value added - creates value unambiguously;
(b) Non-value Added - necessary or unavoidable due to the current
conditions and constraints governing the process;
(c) Unnecessary non-value added - can be eliminated immediately.
3. Make the flow continuous: After the identification of wastes along the
value stream, all other activities are required to be harmonized in order for the inputs and
outputs of processes to flow with no interruption. In other words, the end objective of
flow thinking is to totally eliminate all obstructions in the entire production (or value

8
creation) process. Therefore, existing organizations or infrastructure in which the value
stream operates should not be a barrier to flow. Researchers from MIT believe it is best
achieved through removing old-fashioned functional organizations and replacing them
with integrated product teams organized along the value stream (Murman et al., 2002).
4. Let the customer pull value: Since in the lean philosophy the term
“customer” includes not only the external clients but also succeeding processes as
internal customers, pull can be categorized into two levels:
(a) Among processes - None of the upstream processes in the value
stream produces a good before it is actually required by the subsequent downstream
processes. The production is determined according to the actual demand of the customers.
In other words, nothing is made until it is needed.
(b) Among the company and external clients - the pull is similar to the
“build-to-order” manufacturing model. Thus, goods are not manufactured to stock but to
fulfill actual clients’ demand.
5. Pursue perfection: With continuous interaction of the previous
principles, value flows faster and exposes more and more layers of hidden waste. The
final and a particular feature of any lean organization is a drastic reduction of the lead
time to deliver the value to the customer. Hence, achieving excellence is easier and the
whole system heads towards the theoretical end point of perfection.
How these rules are implemented requires a thinking process by every team
member and will depend on complexity of the projects and tasks. For this reason, it is
critical to systematically coordinate all required enterprise activities to the end customers’
needs, so that all of the non-value added activities can be aimed for through a step by step

9
elimination process.
Reducing inventory, removing unnecessary steps, and eliminating other forms of
waste surely clears the path to continuous improvement. However, there is a risk of a
misunderstanding and putting emphasis on the wrong idea: cutting costs. On top of that,
lean is often seen as a code word for eliminating (unnecessary) jobs. This is why some
authors discuss why waste elimination must always serve a larger purpose: “it must be
oriented towards value creation”. Accordingly, they propose a new definition of lean
transformation: “Becoming lean is a process of eliminating waste with the goal of
creating value” (Murman et al., 2002).
One unique feature of any lean system is the ability to identify waste. In fact,
waste is categorized into seven general types:
1. Overproduction
2. Inventory
3. Movement (motion)
4. Waiting time
5. Over Processing
6. Rework
7. Transportation
Waste categories are developed in relation to the manufacturing context, but they
can be adapted for design operations or administrative operations.

10
2.2 Product Development
An enterprise usually has several value streams which can be distinguished based
on their outputs and deliverable(s) to their customer(s). For instance, the main objective
of a value stream in a production realm is to create a physical change in the goods
(value). Also, there is a large number of processes within a company concentrating on the
generation and transfer of information. Product development activities form numerous
value streams within an enterprise to exchange and convert various types of information
with the goal of creating a clear link among market needs and design activities. PD
includes a large number of topics and challenges in an enterprise, such as strategic
formation, deployment, resource allocation, and coordinated collaboration among people
of different professions and systematic planning, monitoring, and control.
Nowadays typical PD mindsets within organizations are ineffectively adapted
with respect to creating value. Product development interactions usually aim to meet
technical requirements/specifications, reduce risks (both cost-wise and technique-wise),
and maintain a safe margin from the deadlines through a strict system in which
procedures involve numerous interviews, meetings, reviews and decision making steps.
Such a system, though, has severe limitations that can lead to misalignment. This is why
many PD departments in companies react/adapt slowly and are therefore vulnerable to
needs that derive from a change. PD has been defined from several perspectives:
1. Wheelwright and Clark (1992): the effective organization and
management (of activities) that enable an organization to bring successful products to
market, with short development times and low development costs.
2. Browning and Eppinger (2002): engineering development of knowledge

11
about the product, or as a process of uncertainty elimination about the product.
3. Loch and Kavadias (2007): The activities of the firm that lead to a
stream of new or changed product market offerings over time. This includes the
generation of opportunities, their selection and transformation into artifacts
(manufactured products) and activities (services) offered to customers, and the
institutionalization of improvements in the NPD activities themselves.
4. Ulrich and Eppinger (2012): The set of activities beginning with the
perception of a market opportunity and ending in the production, sale, and delivery of a
product.
The common element among the above definitions is the “attempt” in the form of
various activities to bring a successful product to the market. Thus, the significance of the
relation between NPD and a company’s success has motivated researchers to study PD
from several perspectives with the hope of obtaining better solutions to “what, how and
when” work should be done to ensure lower cost, development lead time and efficient use
of resources. Some researchers have suggested a structure for PD processes from
technical and marketing perspectives.
Ulrich and Eppinger (2012) presented a generic development process with five
stages (Concept development, System-level design, Detail design, Testing and
refinement, Production ramp-up).
Other authors Tzokas et al. (2004) have stated that the pursuit of success in NPD
necessitates management to navigate complex processes. In their study, the development
steps of NPD includes the generation of new product ideas, the development of an initial
product concept, an assessment of its business attractiveness, the actual development of

12
the product, testing it within the market, and finally the actual launch of the product in the
marketplace.
The concurrent engineering (CE) literature highlighted the underlying managerial
convolution, the necessity of coordination and integrated decision making. CE became
popular for its ability to reduce time to market and project costs, while increasing quality
by overlapping and/or executing tasks in parallel. Applying CE techniques to PD has
revealed that process structure and activity schedule depend on the level of activity
overlapping.
According to such findings, in concurrent PD process models complete overlapping is
sub-optimal and uncertainty may wear away the benefits gained from concurrency
(AitSahlia et al., 1995).
Simultaneous execution of dependent tasks in PD may drastically influence the
total amount of rework. Lin et al. (2012) addressed the trade-offs in concurrent processes,
developed analytical models to determine the optimal priority ordering of initial
development tasks and associated rework, and the optimal overlapping duration.
Considering the learning effects, they showed that initial development must be prior to
rework. Then, based on the general assumption of non-negative upstream evolution and
the definition of maximum concurrency, they proved that the total development cost (i.e.
rework cost and opportunity cost of time) is convex with regard to the overlapping
duration, and so the optimal overlapping duration can be determined through a binary
search. In addition, they investigated the pareto-optimal overlapping strategies for the
cases where budget is given or the time to market is predetermined.
Eppinger’s research brings to light the fact that product design and development

13
depends on reviewing assumptions and updating or adjusting them according to the needs
until the whole design solutions converge, and thus the process is inherently iterative and
not sequential (Eppinger, 2001). High iteration and concurrency levels of PD activities
may generate work for each other as soon as they execute it, therefore causing instability,
termed “design oscillations” (Mihm et al., 2003). In addition, according to Bhuiyan et al.
(2004), increased informal changes of information in upstream processes (termed “churn”
-due to participation of a downstream representative in upstream activities) will decrease
the amount of rework done later in downstream processes. Studies related to design churn
effect and oscillations provide strategies for achieving stability for a diverging process or
speeding up a slowly converging process. These strategies include improving the
bottleneck cycle time (major source of slow convergence) and delaying responses to
changes from highly dynamic activities (Yassine et al., 2003).
In other studies, based upon graph theory and design structure matrix (DSM),
Tsung Tsung et al. (2010) developed a systematic planning solution to optimize NPD
flow from an informational structure perspective. The planning of workflow was divided
into two phases namely activity identification and activity planning. According to the
authors, the mapping from design structure matrix to hierarchical workflow graph can be
automatically realized, and that greatly improves the efficiency of workflow.
Regarding the practices which help redeem development troubles, Griffin and
Somermeyer (2007) have divided strategic tools into two categories:
1. Strategic tools for improving NPD performance aross the firm
2. Strategic tools for improving NPD project performance
Then, they introduced a set of tools that span from application at the project level to

14
application at the business unit and firm level. They believe such tools are more powerful
when implemented at strategic levels of the business firm. These tools generally are
insightful to managing and protecting intellectual capital in the NPD realm, promote
creativity, motivation, teamwork and high performance in NPD teams. At the project
level, some tools must be used prior to project initiation, (i.e those for choosing the
strategy, forming the team and project planning). Whereas tools for increasing learning
during or after the project, and the ones for measuring the outcomes are suggested to be
implemented later on.
2.3 Lean Product Development
Lean product and process development (Lean PPD) is a rising school of thought
wherein “lean thinking” is applied in the engineering design and development phase of
the product life cycle. Several development realms ranging from food, pharmaceutical,
automotive, software and aerospace industries have focused on implementing
value-based approaches in their projects. But still many practitioners state that difficulties
in managing PD activities in an efficient way still remain challenging.
During PD projects, staff are often overburdened with too many tasks, some of which
include over-engineering a component and non-value added activities. As a result, PD
projects deviate from the plan, and also learning does not fully occur from a project to
another as previous information is hard to retrieve (organizational learning is often
overwhelmed due to over the wall thinking patterns within the companies). Compounding
this, the full PD process model is not fully grasped by engineers.
Hence, one of the main objectives of lean product development (LPD) is to create a
“recipe” through establishing an efficient, successful and advantageous product value

15
stream.
Value in PD can be described as a set of requirements in the form of capabilities
provided to a customer at the right time at an appropriate price, as defined in each phase
by the customer (Womack and Jones, 2003).
Analogous to lean manufacturing, sources of waste have been studied by many authors in
LPD. Accordingly categories of waste have been classified as follows (Oehmen and
Rebentisch, 2010):
1. Over production
2. Over processing of information
3. Miscommunication of information
4. Stockpiling of information
5. Generating defective information
6. Correcting information
7. Waiting of people
8. Unnecessary movement of people
It is important to treat waste in PD in terms of information. From this perspective, such
wastes occur when information is generated, processed and exchanged without adding
any value regarding the fulfillment of customer requirements (Siyam et al., 2012a).
Holmdahl argues that waste elimination and removal requires much effort in PD
due to the fact that the cause and effect relation is visible first afterwards. He explains the
waste categories make sense if they are referring to the use of resources with no value
creation (Holmdahl, 2010).
Based on research by Siyam and others (2012b) the techniques to apply lean principles to

16
PD are not very well established, and thus instead of following a clear guideline as in
lean manufacturing, wehere, admittedly, it is more straightforward to do so, practitioners
are learning by doing (or learning from their mistakes). They add that the effect of value
methods on waste types is not studied at all due to the structure of LPD literature that
either tries to define value in PD or attempts to develop value methods or in other cases is
dedicated to exploring waste types and their causes and effects.
Henceforth, they used a Domain Mapping Matrix (DMM) to find the relationship
between value methods and waste types in order to develop an improvement guideline
(Siyam et al., 2012b).
Waste identification and elimination have become equivalent to the lean
philosophy. Browning (2003) believes too much focus on value added activities results in
failure to address wastes related to the structure of the process. He clarifies that even if an
activity is entirely value added it might be unable to produce the expected output if it
receives inappropriate inputs.
The classification of activities as value added, necessary non-value added and pure waste
depends on the level of detail at which the activities are planned. It could be inferred that
in total, all processes create value. However, as they are studied in more detail, waste
reveals itself.
Recently, researchers have focused their studies on managerial factors that
enhance the elimination of waste in NPD. They discuss how employees training shapes
lean-specific knowledge and commitment among all of a project team members (e.g. lean
thinking principles, waste detection and analysis, work standardisation). They further
explain that this is gained through coaching in lean management. Due to the fact that

17
knowledge of waste elimination is contingent and therefore cannot be fully acquired by
training, the practice of coaching is inevitable (Anja and Stormer, 2012).
The current gap among the generally expected lean outcomes and current state of
PD processes within companies has motivated researchers to find out the deficiencies of
lean implementation projects in PD. Some authors discussed that principles and tools are
essential to every project but not sufficient to improve NPD processes. In fact, they
believe a lean culture must be institutionalized in the organization. That means the
awareness, familiarity and practice with lean PD principles and tools should be gained by
each individual participating in the projects (Kerga et al., 2011).
Furthermore, others argue that certain road maps are needed to know how to
apply and integrate the “lean philosophy” in daily company activities and how to put lean
PD principles in practice. To answer these two questions, they form a 5 step methodology
that reflects lean thinking fifth principle through progressive improvement actions. The 5
steps could be shrank into 3 macro-activities namely Waste Analysis, Map-it Process and
Change Implementation (Rossi et al., 2012).
The Lean Advancement Initiative (LAI) at the Massachusetts Institute of
Technology (MIT) recently developed the second version of LESAT (LAI Enterprise
Self-Assessment Tool) tool-a structured framework to assist practitioners in the enterprise
transformation process- in which PD falls under “lifecycle processes” category -processes
responsible for the product from conception through post-delivery support (Nightingale et
al., 2012). Each section of the tool contains diagnostic questions, lean practices, five
capability levels, and lean indicators by which current state and desired future state of
processes could be determined.
18
The goal of LESAT is to prioritize the practices that are both achievable and have a high
payoff towards leanness of the enterprise. Although LESAT is utilized at for lean
transformation at enterprise level, it brings about flow mechanisms that facilitates quick
feedbacks and hence more efficient continued lean improvement efforts in all lifecycle
processes including PD.
Some researchers (Gudem et al., 2013) have attempted to redefine the functional
product value calculation in LPD. Their approach integrates emotional customer value
with the traditional model (i.e minimizing operating costs and reducing time to market).
Interestingly, their findings show a less-than-perfect coordination between end customer
needs and product offerings sometimes increases customer satisfaction. In addition, how
customers realize value depends on their experience which might be at variance with
current needs. They also discuss the fact that complete understanding of customer-defined
value does not guarantee the ability to meet that value.
Special emphasis on improving value delivery is needed in PD. Most
commitments are made at early points in the value stream; if early efforts require rework
later on, the implications for ultimate value delivery can be substantial. Within the
enterprise value streams, it is arguably PD that, more than any other part, requires
effective use of human capital. Much of this takes place in the form of interactions
between individuals or groups of individuals. These interactions tend to be nonlinear and
are often unstructured. They’re also hard to see. This fact challenges defining LPD. In
manufacturing, through a GEMBA walk one can identify inventory buffers and the parts
that need repair or rework. This can not happen in PD and therefore, translating the
concepts from lean manufacturing to lean product development is demanding in its
19
nature.
Unlike the design deliverables (e.g. drawings), which can be inspected to analyze
whether they meet a set of predetermined requirements, it is nearly impossible to map the
streams in which intellectual capital is actually used to develop those deliverables.
However, monitoring information exchanges can help to identify sources of waste (and
possibly a detailed root cause analysis) and to point to where information can be
transferred more efficiently such as documents or meetings and where higher bandwidth
is needed.
According to research comparing Amercian and Japanese auto companies done by
Clark and Fujimoto (1991), between 1983 and 1987 in the United States and Europe, on
average, the Japanese producers enjoyed a two-to-one advantage in terms of total
engineering effort required and a savings of one-third in total product development time.
American companies had followed over-the-wall thinking process and thus had organized
PD teams and functions into silos causing a poor flow of information among them.
Information was pushed from concept to production. Thus, each function would need
rework or manipulating the design elements from their perspective.
What was remarkable about these findings was that LPD methods simultaneously
reduced the effort and time involved in manufacturing.
During the past decade, several studies have directly focused on the
implementation of lean principles in PD. Oppenheim (2004) targets flow and develops a
framework to improve Leanness and flow of information in PD projects. He suggests that
the key to success for the proposed framework in achieving flow is to follow the
conceptual steps of lean manufacturing transformation (i.e. planning and parsing the total
20
work content into small tasks of equal duration with specified outcome, quality, effort
and cycle time). The effort in the proposed framework is started by a value proposition
and value stream mapping, which includes detailed planning and ends with releasing a
predetermined set of deliverables. He suggests short intervals (one week) as Takt time.
Tasks defined earlier in value stream mapping phase are done concurrently and outputs of
each set of tasks are reviewed, discussed and analyzed on a proposed Takt time basis
through an integrative event.
Moreover, Oppenheim believes design is inherently an art dealing with a large
number of quantitative and qualitative constraints and thus mathematical tools such as
queueing theory and Petri-nets have at most a limited usage in a PD context. This is in
contrast to findings of Morgan and Liker (2006) that queueing theory principles have a
significant role in detecting and revealing root causes of waste in PD. Also, such tools
may give insights about optimized utilization of workforce to prevent overutilization.
Reinertsen (2009) introduces a new mindset about the flow problem in NPD
projects. He discusses the waste in PD and proposes a general framework to measure the
hidden inventory in PD projects. His book gives valuable insights on how to make use of
queueing theory to tackle the problem of flow in the field. His approach through the
whole book is to minimize the cost of job queues. He tries to show that higher WIP will
lead to higher delay cost. Hereafter, we consider jobs as set of activities by which
systems are engineered, or, generally, by which products and services are designed,
developed and tested. Note that the terms “job” and “task” are used interchangeably.
Andrezak (2010), product development director of Mobile International GmbH in
Germany has recently discussed drawbacks and issues related to higher WIP levels. His

21
solution to avoid job congestion in PD context is making use of a well-known tool in JIT
concept to create pull within the system: Kanban. His experience in applying Kanban in
PD and the way he monitored and managed the workflow in two companies (i.e.
mobile.de and e-bay) led to the conclusion that putting a limit on the number of design
tasks being processed at any given time in the system decreases the risk of producing
waste (that is producing what does not meet customer needs). Hence lead time reduction
is significant. By putting a limit on WIP, total number of the tasks in the system is
limited; so the probability of producing waste is decreased. This also will lead to ease of
rework as there is no pile of WIP and the source of problems are found immediately.
In a manufacturing context, Kanban has become a popular approach to achieve
the flow in western academic and industrial societies. Although many studies have
concluded that Kanban systems significantly improve operational performance, it could
also be inferred that some of these improvements are due to organizational changes than
the implementation of Kanban itself (Krieg, 2005). Krieg discusses that a company needs
to determine optimal or near-optimal system configuration (i.e. average fill rate and
average inventory level) in order to be able to better achieve benefits of a Kanban system.
Research at Metis Design (MIT) (McManus et al., 2005) revealed that
engineering work packages were idle 62 percent of the time, stacked in job queues. This
finding motivated researchers to find a better strategy to deal with engineering projects.
Authors suggest implementing lean engineering and discuss that it is a three-part
approach: creating the right products, effective lifecycle and enterprise integration and
using efficient engineering processes. Results indicated several benefits received through
application of lean techniques to aerospace development projects (e.g. 50 percent

22
cycle-time reduction, 80 percent reduction in maximum staffing levels). Also, a more
recent research focused on load leveling (one of the key notions in lean oriented projects)
and proposed a lean engineering logistics performance model that tends to reduce lead
time and waste while improving customer and shareholder value. Therefore, variables
such as number of design jobs, engineers, weeks spent on a job, demand for a job,
priority of a job and capacity of engineers have been applied to form an integer
optimization model that helps decision makers to better allocate resources in order to
increase the overall throughput of the system (Beauregard et al., 2008).
The same researchers, developed the notion of leanness measurement by
comparing lean engineering measures of interest (e.g. Touch days, Non touch days,
Average Touch time Ratio, number of nodes, Total wasted hours, Throughput and etc.)
during post-certification versus pre-certification tasks for the design of aerospace parts.
They defined engineering tasks value dimensions namely business, societal and
environmental and consider them as a basis for measuring value index of a job. Along
with budget, the proposed value index has been measured to analyze results of a full
factorial DOE in which throughput and realized value were response variables.
Furthermore, they conducted the second full factorial DOE considering factors such as
degree of focus on a task, phase, concurrency level and mean of the charged hour
distribution. Their findings showed that for a finite number of servers, more workload on
the system results longer time to finish smaller task sizes as a result of lower focus. Also,
higher lead time was mainly caused by higher levels of task switching. In addition they
obtained a convex relationship between task size and lead time and a decreasing trend
between waste and job size and low concurrency (Beauregard et al., 2011).
23
In another study by Nepal et al. (2011), the design structure matrix (DSM) and the cause
and effect matrix have been integrated in order to form a lean transformation framework
for analysis of the underlying complexity of a PD system, and facilitating determination
of the root causes of wasteful reworks. The study suggests several strategies to transform
the current PD process into a lean process which is believed to reduce PD cycle time by
32 percent.
The literature on PD is broad, ranging from marketing and engineering design
activities to strategic initiatives of an organization dealing with various levels of
enterprise operation management and behavioral aspects. Browning and Ramasesh
(2007) categorized purposes for PD process modeling as PD project visualization,
planning, execution and control and finally project development.
Within the past decade, PD literature has been influenced, aligned to and directed
by a steady perception of the need for increased effectiveness and efficiency, the two
critical elements of PD project development efforts. Therefore, lean manufacturing
concepts have undoubtedly been a backbone or underlying motivation of a stream of
studies in PD, which led to the articulation of the two, forming lean product development.
In a nutshell, a detailed value stream mapping approach was proposed by
McManus (2005) following Oppenheim’s introduction of flow for PD programs
including low risk small projects (Oppenheim, 2004). Later on, Rebentisch and McManus
(2007) published a tutorial on Lean PD. Reinertsen (2009) discussed a new perspective of
PD projects pertaining to flow, development costs and insights from queueing theory.
Oehman and Rebenstish (2010) studied waste and risk management. Later, Oppenheim
(2011) reported on an application of lean concepts to systems engineering and more

24
specifically shed light on its connection with lean PD. A year later, Oehmen et al. (2012)
published a guideline of lean enablers for managing of engineering programs. Of
particular interest, they discussed top ten themes of challenges in managing engineering
programs and suggested approaches such as agile development, capability maturity
model and earned value management as complementary to performance improvement of
such programs.
Recently, the impact of motivation on lean enablers namely clear project objectives,
customer requirements, continuous improvement and cross-functional teams has been
studied. The main finding suggests that the voice of the customer is a key to success of
any LPD project, due to better understanding of customer needs across the development
team. The same research also includes a purposive and brief discussion of approaches to
continuous improvement within PD organizations and their effects when applied to
knowledge work (Ringen and Holskog, 2013).
In addition, continuous improvement efforts and studies in the field of PD are
likely to be directed towards knowledge transfer fields. Concept of LPD and knowledge
management have been recently linked through a framework inspired by SECI
(socialization, externalization, combination and internalization) model of knowledge
transfer. Researchers emphasized on ability of knowledge transfer in achieving PD
general aims of better, faster and cheaper and concluded that complementary to improved
focus on focus on explicit and tacit knowledge of the organization, LPD principles and
approaches help improve knowledge transfer in product development (Lindlöf et al.,
2013).
As noted by León and Farris (2011), lack of a holistic agreement on what exactly

25
forms LPD, causes serious challenges for organizations to establish effective LPD
systems. They suggest techniques and methodologies aiming to improve LPD processes
need to be developed considering both conceptual and empirical aspects, so that results of
the study would be commensurate with real world LPD settings.
The review of the relevant strands of literature in this chapter indicates the need for more
quantitative models regarding the application of lean in PD. A recent web-based survey
(Kirner et al., 2013) conducted in industry, gave insight about the current status of
information flow assessment, particularly from a value-waste perspective. Results
indicated almost 55% of the 55 participant companies do not assess value or waste of
information. Only 29% of the participants assess waste by frequently monitoring metrics
namely cost, time, quality, risk and so on, while others have established their own
measurement. Interestingly, participants have expressed the need to the following topics:
1. Further analysis of waste causes
2. Reshaping lean principles for a better application in PD
3. Further analysis of waste types
4. Determining the impact of methods on the occurrence of waste
5. Categorizing and weighting value
6. Development of lean modeling tools and measurements
As the literature continues to grow with newly emerging streams of research such
as study of nature of PD process (Felekoglu and Maier, 2013) and its relation with
interactions occurred such as top management involvement (Felekoglu and Moultrie,
2014), dealing with deviation during PD project execution (Munthe et al., 2014) and
emphasizing the interconnections of sustainability and PD (Gmelin and Seuring, 2014),
26
the need to overcome uncertainty by elimination of barriers to flow through a holistic
methodology still remains a prime challenge.
Lean is not the only solution to achieving excellence in PD. Nevertheless, it is the
one that encourages a holistic approach with regards to value creation. It is critical to be
aware that the ideas of lean in manufacturing have to be translated one-to-one
commensurate with the context in order to be applicable to PD processes In fact, the
principles of lean cannot be applied directly to PD as they are done in manufacturing, the
processes are too different. They need to be adapted to PD. Otherwise the approach will
not be fully beneficial. PD projects, without doubt, are prone to uncertainty (not always
in the form of lack of knowledge about the customer requirements, but in the form of
information hiding or “churn”) due to communications required along the involved value
streams.
This justifies the need to study the behavior of information exchange patterns with
the aim to reduce the barriers to communication across the teams. Such patterns have to
be developed according to the project governance methods that PD teams follow for a
particular project. Once the optimal communication pattern with regard to lean principles
is established, the expected outcome is to have useful information, in the right place at
the right time.
Motivation for this research stems from the need to achieve flow in PD, and the
following two sources within the literature:
1. Oppenheim’s work pertaining to enablement of flow of value within PD projects.
2. Insights obtained from Reinertsen’s and Andrezak’s works related to flow
problem in product development projects.
27
Accordingly, the objectives of the research have been determined as:
1. Quantifying waste in LPD.
2. Finding a mechanism to maintain the level of performance measures of an LPD
value stream close to its optimal level.
Markov chains and queueing theory analyze the delay of work packages in
telecommunication systems and are powerful means to study behavior of wide range of
systems in terms of performance evaluation. We believe queueing theory facilitates
quantification of PD work performance metrics and elements. Hence, we intended to base
our research on application of readily available models in queueing theory in PD. More
specifically, priority queueing model has been chosen as it provides flexibility to quantify
waste according to the assumptions we made. Also, the assumption of preemptive priority
amongst PD tasks has been absent from majority of the works available in the literature
(Smith and Eppinger, 1997; Ahmadi and Wang, 1999). In the following section, a brief
overview of queues is provided.
2.4 Overview of Queues
Queueing models or waiting models study situations in which individuals or a
set of people enter a system and join a queue(s). We are familiar with queues in our daily
life. Going to a doctor,, a bank, or a bus stop are simple examples that we encounter
every day. A queueing system is usually formed when entities or people arrive/enter and
require/ask for a service from parts of the system. The former is called “Arrivals” and the
latter “Server/Service center”. Also, most of the time a line is formed when arrivals enter
the system and wait to receive service. Interestingly, it has been observed that both
arrivals and service durations follow statistical distributions.

28
Kendall’s notation (Kendall and Buckland, 1957) has become the standard to
label and classify queues. A queue is labeled by A/B/C/K/N/D which corresponds to the
following:
• A: Describes the arrival process.
• B: Service time distribution.
• C: Shows the number of servers in the system and can be any integer equal
or larger than 1.
• K: Indicates the upper bound of the queue length. If this argument is
missing, then, by default, the queue capacity is infinity.
• N: Shows the population of the system or the maximum number of jobs
that can arrive in the queue. If this argument is missing then, by default, the system
population is infinity.
• D: Shows the queueing discipline. If this argument is missing, then, by
default, the queueing discipline is FIFO (first in- first out).
The discipline represents the order or pattern in which customers are served in the
queue. In general customers entering a queue are served based on FIFO discipline unless
otherwise specified (e.g. LIFO-last in first out, SIRO-serve in random order, priority
based). In reality queues often serve different classes of customers each having different
priority levels. In terms of discipline, sometimes servers follow a particular service
pattern depending on differences in customer priorities. Two major types of priority
service disciplines are Preemptive and Non-preemptive policy.
Based on preemptive policy, a server is allowed to stop the current service to
lower priority customers when customers of higher priority enter the system. In such
29
conditions, lower priority customers who are preempted won’t be served until higher
priority customers’ queues are emptied. Normally, each class of priority is served on a
FIFO basis. In Non-preemptive policy, higher priority customers cannot preempt lower
priority ones. Thus, the ongoing service is not interrupted, higher priority customers join
the front of the queue and once the ongoing service is finished, higher priority customers
start receiving service.
Bhat (2008) categorizes preemptive discipline into two subcategories namely
preemptive resume and preemptive repeat. Indeed, the second alternative is furthermore
divided into two subgroups of “identical” and “different” based on the service time
needed to resume the service. Under the first discipline, the same sample realization is
used while in the second one, it differs from the one originally chosen. Similarly, Hayes
and Ganesh Babu (2004) discussed that in preemptive non-resume discipline, there is a
loss of work in the system. They also mention that system performance measures such as
delay time in the system and number in the queue will be the same in both policies (i.e.
resume and the non-resume) if the server service time is characterized by exponential
distribution due to its memoryless feature. Otherwise, under the same loading condition,
performance measures are greater in preemptive repeat policy.Imposing priorities on
queues changes the order in which customers are served. As a result, the average waiting
time for customers (jobs or tasks) of each priority class is different. The mean waiting
time in the system, regardless of queueing discipline, is determined by “Little’s Law”
(Little and Graves, 2008). In the presence of preemption, the average waiting time in the
system for jobs of higher priority is less than that of lower priority jobs while the total
average remains the same.

30
������′� ���: � = � × � (1)
The current research attempts to study the application of queueing concepts such as
preemptive disciplines and task delays in the system and conduct an evaluation of value
stream performance using insights obtained from queueing theory notions discussed in
this section.

31
3 The Model
3.1 Problem Statement
Engineering projects mostly depend on straining limited resources and usually
this delays the so called revenue generating achievement of the project. Falling behind
the forecasts and targeted schedules make it more likely that the marketplace will change
and prevent the company from obtaining the revenue it had anticipated before. These
changes can vary from economic crisis or competitive maneuvers of industrial opponents
such as the early release of products that potentially can replace yours. All these
conditions worsen when the engineering department’s business processes lack a robust
structure, and are not efficient or very well followed. In such a context, managers have to
constantly decide where to allocate overburdened engineers, and which in crisis targets to
ignore in order to reduce the workload. Situation becomes more and more complex when
human error and consequently feedback cycles are introduced to the process. Usually
under such circumstances, process performance degrades drastically and the symptoms
occurred are common among similar project contexts. Of our interest, one such
engineering project context is PD, in which firefighting syndrome reveals itself with the
following symptoms (Bohn and Jaikumar, 2000):
• Too many problems and lack of time to resolve the issues.
• Incomplete initiatives and solutions to the rising problems.
• Recurring and cascading problems
• Urgency supersedes importance.
• Preemption of a problem solving effort by a more urgent one.
• Performance drop.
32
Continual switching among tasks, incomplete solutions, and recurring problems
as a result of managerial pressure initiated by a backlog of work is self amplifying.
Firefighting cannot be fully avoided, but can be controlled through proper monitoring of
the process deliverables and performance by project managers. Here, we propose a
solution based on queueing theory basics which gives product managers insights on how
to monitor and optimize the leanness of their product development value streams.
3.2 Description, Scope and Methodology
In PD projects, jobs (determined in the planning phase as the elements of the
work breakdown structure, WBS) are ideally designed in a way that task durations are
almost the same. Therefore, we can consider jobs as being the customers entering the
system. Arrivals in queueing systems are equivalent to “job release” events in PD.
Hereafter, the two terms are used interchangeably.
Also, the study is more suitable for the situation where there is low to modest task
interdependence amongst engineering jobs; which tends to be according to airflow in a
gas turbine engine (intake to exhaust) upstream to downstream. Indeed, the current study
fits the small scope PD projects where complexity of the product is commensurate with
high legacy knowledge in the organization.
Rework is an inherent part of any design job and PD is not an exception. In
general, feedback as an event that may trigger rework can be considered as the
consequence of uncertainty. Epema et al. (1996) defines feedback in queueing systems as
the consequence of scheduling/discipline policies or as a characteristic of nature of
workload in which feedback occurrs when the completion of a job in a server (i.e.
process) causes generation of new jobs in other servers.
33
Here, we categorize jobs into two groups namely “Regular jobs” and “Rework jobs”.
Rework jobs are the result of various types of feedback along the value stream through
the time. Our assumption is that when an engineer finishes a regular task, the information
produced is shared among all the successor team members (i.e. teams or engineers). Later
on (i.e. after a random period of time), when successor engineers use that information to
perform and finish a task, due to low quality outputs or results, a new rework task is
generated. Accordingly, the recipient of the rework task (i.e. destination) should give
more priority to rework jobs in comparison with regular tasks, as the information
gained/generated by doing rework is needed to process regular jobs in the future. This
also applies to rework jobs as some are of higher priority than others. Thus, we assume
engineers process all jobs according to the preemptive discipline as it better depicts
reality. Also, we assume that when a rework job with higher priority than the ongoing job
is released to an engineer, operation on the ongoing job is terminated and the rework job
is processed immediately. This is due to the nature of the design job and the fact that the
information generated as a result of preemption is valuable to continuation of successor
jobs and consequently, uncertainty (the risk of creating what downstream processes do
not need) in the value stream is reduced.
Normally, when queues with higher priorities are emptied, service on the paused task
could be continued from the point it was stopped. However, we consider the case where
the rework requires the paused task to be re-done (all the work already done on an
interrupted task prior to preemption is lost) as is often the case.
For better understanding of the model, here we briefly discuss an example.
Suppose there are three engineers working in tandem in a design process namely A, B

34
and C. Given the fact that rework jobs coming from later in value stream are of higher
priority (preemptive policy), the incoming rework rate from engineer B (type 2 jobs) and
the release rate of regular tasks remain constant, increase in rework generated later in the
process (by engineer C, indicated by Type 1 Jobs) will increase the congestion in
engineer A’s job queue as depicted in Figure 1.
Figure 1: Congestion in Upstream engineer job queue- Type1 and Type 2 jobs are the incoming reworks
from engineers C and B with priorities 1 and 2 respectively and Type3 jobs are the regular jobs released
according to WBS with priority 3. Engineer A’s processing rate is 100 jobs/month.
One interpretation could be that increase in rework will lead to an exponential growth of
jobs in the system. The example above brings into the question how rework as an
inherent part of PD should be incorporated into system and monitored in order to prevent
congestion.
The proposed model assumes engineers operate according to M/G/1 preemptive
priority discipline under the supervision of a value stream manager. Furthermore, output
of design tasks are shared with value stream members via a commonly used database or
data repository and the need for rework activities are communicated among members

35
freely in random time intervals. The value stream manager (i.e. a competent section chief
engineer) releases regular tasks to engineers according to WBS and project progress.
Here, the elements of value stream include supermarket (temporary queue of jobs) and
process nodes (servers). Also, we limit the scale to the case in which each process node
represents an engineer; hereafter, the terms engineer, process and server are used
interchangeably. The number of jobs waiting in supermarkets is determined by Little’s
law.
The value stream manager’s role is not only task release or prioritization. In fact,
tasks should be released in a way that minimizes the cost of hidden PD inventory within
the value stream (Reinertsen, 2009).
Regarding optimization, Stidham (2009) studies the optimization of various
queueing systems. In particular, he investigates optimal arrival rates of different classes
of customers in a preemptive queue and classifies optimal arrival rates into four
categories:
• Individually optimal (customer viewpoint-net utility): From this perspective, the
customer (the decision maker) is concerned with its own net utility and wishes to
maximize it. Henceforth, the customer will join the system if the value received from
joining is greater than the admission fee to the system.
• Socially optimal (System Operator-aggregate net utility): Under this category,
the decision maker (who represents the collective of all custmers) considers a reward for
each customer that enters the system and gets served. Hence, the optimization objective
(Social welfare) is to maximize the expected net benefit received per unit of time by the
collective of all customers.

36
• Facility optimal (System Operator-profit): In this category, the goal is to
determine a toll such that revenue of the facility is maximized.
• Class optimal: From this viewpoint, manager of each class of customer wishes
to maximize the net benefit received per unit of time from each class of customers.
In our model, the decision maker is the value stream manager (or section chief of
the PD team), who is concerned with optimal states of the system according to a
pre-determined set of performance measures.
Although we do not explicitly consider any rewards for the jobs released to engineers, the
value stream optimal state falls under the second category mentioned above since the
decision maker represents collective of all types of jobs along the value stream
(customers) and the net benefit is believed to be implicitly improved due to the nature of
performance measures of interest optimized. From a lean perspective, it is always better
to eliminate non-value added activities rather than minimizing costs.
So, our goal is to find the near optimal configuration (performance measures) of the
design process to manage both regular and rework activities more efficiently and thus
achieve flow by preventing congestion in the process through elimination of NVAT.
The value stream illustrated in Figure 2 includes three tandem engineers and a set
of pre-determined information flow routes among them. NVAT is composed of two parts.
The first one according to lean principles is sum of IWIP residing in queues and is
calculated directly by multiplying number of the jobs waiting in queues by average
waiting time in the queue of the priority class to which they belong (The value stream is
studied in the steady state).
The second part refers to over processing of defective information or outdated

37
information; another type of waste defined by lean principles (Oehmen and Rebentisch,
2010). This also could be regarded as lost effort or effort loss.
A preliminary observation of NVAT values as rework flow rates vary within the
system indicates the earlier rework jobs are identified and done in the process, the less
non-value added time is observed in the system.
This is due to preemptions that occur through the whole process. This observation brings
into question what combination of rework rates among processes would lead to the least
non-value added time in order to maintain flow in the process.
Hence, our goal is to minimize non-value added time and lost effort described by flow
rates among engineers.
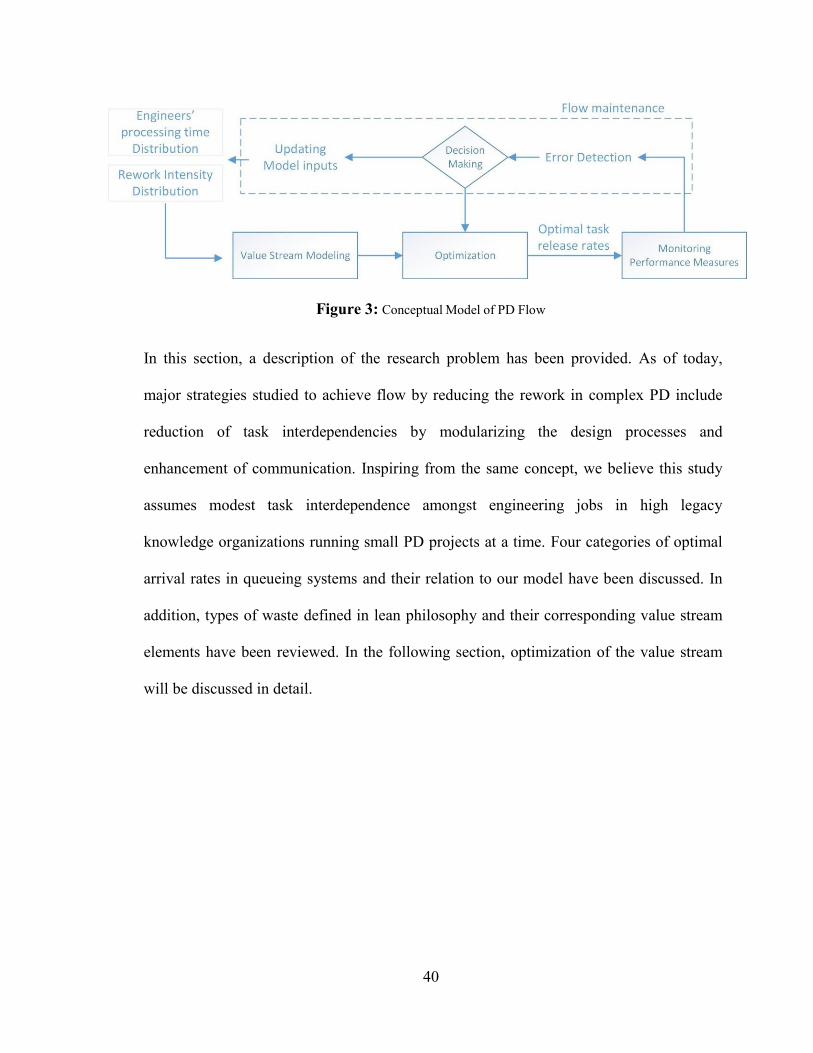
A brief depiction of the road map to achieve flow in PD is shown in Figure 3. Our
approach to tackle flow problem includes three steps. In the first step, current value
stream is mapped along with identification of value stram parameters such as “engineers
processing time distribution” and “rework intensity distribution”. Also, performance
measures and non-value added time have to be determined and identified respectively. In
the second step, performance measures are translated into entities of a queueing system
according to the observed value stream communication patterns and an optimization
model is structured. Optimal flow (or task release) rates are then obtained optimizing the
determined performance measures within the value stream; performance measures are
then updated and monitored to make sure system is operating near its optimal
performance. Once observations indicate system’s deviation from its optimal measures,
the value stream manager has to maintain system’s optimality by making a decision as to
whether intervene in task releases and find another optimal solution or to update the

38
entire model. In the following chapters, further details on how to quantify the
performance measures, conduct optimization, maintain the flow and decision making
approach will be discussed.

� ������� � ���������� � �
+ ∑ ∑ �
Figure 2: Design process value-stream detailed by queueing performance measures
Total Non-value Added time = ∑ ∑ � (�,�)
× � (�,�)
(�,�)
� ������� � ���������� ��
× ��(�,�)
Value Added time = 1
𝜇�
+ 1
𝜇�
+ 1
���
39
40
Figure 3: Conceptual Model of PD Flow
In this section, a description of the research problem has been provided. As of today,
major strategies studied to achieve flow by reducing the rework in complex PD include
reduction of task interdependencies by modularizing the design processes and
enhancement of communication. Inspiring from the same concept, we believe this study
assumes modest task interdependence amongst engineering jobs in high legacy
knowledge organizations running small PD projects at a time. Four categories of optimal
arrival rates in queueing systems and their relation to our model have been discussed. In
addition, types of waste defined in lean philosophy and their corresponding value stream
elements have been reviewed. In the following section, optimization of the value stream
will be discussed in detail.
41
�
�
IWIP= ∑ ∑ � �
�
�
�
4 Optimization
As mentioned earlier, the primary interest of the current research is to propose an
approach to determine near optimal operative measures of a PD process by achieving
flow. The details of nonlinear optimization model are given below.
4.1 Measures of interest
In practice, waiting time in a queue neither reduces uncertainty nor creates
useful information. This is known as pure “Muda” or waste in lean. So, the first metric
we need to monitor is the total amount of wasted time (or amount of work residing) in a
queue, which can also be referred to as “Stockpiling of information”. This is obtained by
multiplying the number of jobs waiting in a queue � (�,�)
(see Table 1) by average
waiting time in the queue � (�,�)
of the priority class they to which they belong.
(�,�)
� ������� � ���������� �
× � (�,�)
(2)
Table 1: Symbols Description
Symbol Description
��� Regular tasks release rate to server j
𝝎� Gross occupancy of priority class i jobs
𝑩�(�,�) Average backward recurrence time in engineer j’s priority class i jobs (�,�) Average number of preemptions occurred in engineer j’s priority class i jobs
��
��(�,�) Priority class i queue waiting time in engineer j’s queue
(�,�) Average number of class i jobs waiting in engineer j’s queue �
�(�,�) Engineer’s processing rate (can vary among i engineers and j job classes) ��� Rework intensity from engineer i to engineer j
The second measure of interest is associated with the lost effort occurred while
switching among activities. In PD this can be described as processing of defective or

42
���� ������� = ∑ ∑ �
outdated information (necessary NVAT); another type of waste defined by lean
principles. This is because all the work done prior to interruption of a low priority activity
is lost and the job needs to be restarted with new/updated information. It is calculated by
multiplying expected number of preemptions occurred by expected backward recurrence
time (i.e. the elapsed time since a job is started by an engineer) (Conway et al., 2012).
(�,�) � ������� � ���������� ��
× ��
(�,�)
(3)
The third metric, measures throughput of the value stream which is the rate at which the
value stream is achieving its objective (e.g. milestones). This can be described by the sum
of task release rates of the lowest priority tasks (i.e. the tasks released according to the
W.B.S of the project; Regular tasks).
�ℎ����ℎ��� = ∑ℎ �������
��������� �����
(4)
The total occupancy (i.e. utilization) of each individual engineer should be determined
with respect to the lost effort (i.e. failed service attempts). Thus, the gross utilization of
engineer i, i (includes all service attempts of jobs) is taken into consideration.
Lower limit i ( ) Upper limit (5) Priorities
As mentioned before, we assume that each engineer can generate rework jobs in random
time intervals within the value stream. An error occurred in value stream is attributed
with three characteristics namely location, originator and intensity.
Location is the process (i.e. engineer) along the value stream that receives the request for
rework activities due to:
1. detection of an error or mistake in design activities.

43
2. being a plausible candidate to request for uncertainty related issue
resolution/clarification.

44
Originator is the process:
1. in which an error or mistake in design activities is detected.
2. an issue or problem due to uncertainty is encountered.
Furthermore, intensity is the degree or quality of being intense associated with the
error/issue according to originator’s perception of it. We assume the rework generation
rate is proportional to the total task release rate to the originator and more specifically
depends on the intensity of the need for rework. Here, P(ij) denotes the intensity of the
rework generated from engineer ‘i’ to engineer ‘j’. In addition, engineers give higher
(preemptive) priority to the reworks generated by downstream colleagues as is the case in
the case of firefighting.
The next step is to form a nonlinear optimization model and find an optimal
solution. The objective function, can be any of the three measures of interest indicated
above based on the decision makers’ interest. As an example, we chose throughput as the
objective function and solved the optimization problem detailed as follows:
C
Max Z = Oi
i = A
(6)
Subject to:
L j
i ( ) U j
j A, B, C
and i priority classes in server j
(7)
priority class
CA = CAB = CABC
CB = CBC
BA =
BAB
CA = PCA (CABC CBC CC OC )
(8)
(9)
(10)
(11)

45
BA = PBA (CAB CB BAB OB )
AA = PAA (OA )
BB = PBB (OB )
CB = PCB (CABC CBC CC OC )
CC = PCC (OC )
0 ; for task release rates in all streams
(12)
(13)
(14)
(15)
(16)
(17)
Equation 7, ensures the processes (i.e. engineers) along the value stream are utilized
within the targeted boundaries and in fact, they are not overburdened. In addition,
Equations 8, 9 and 10 explain how rework streams are structured and make sure the open
network of streams remain stable by monitoring the rates rework activities flow among
processes. Also, Equations 11 to 16 refer to the rate at which rework activities are
generated within the system.
4.2 Numerical Example and Analysis
According to the findings of the previous section, our attempt is to find a solution for task
arrival rates to the value stream in order to maintain flow in the whole process with an
acceptable performance level from value stream’s manager view point. Hence, in
addition to a plausible level of throughput, our goal is to minimize non-value added time
and lost effort described by flow rates among engineers. In this section, we provide a
numerical example. We assumed:
� (�,�) = 20 ����� ��� ����(��� � ∈ {�, �, �} ��� � ∈ {�������� �������

46
�� ������� �}).

47
Also, lower and upper bound of each process gross occupancy (i.e. gross utilization) in
equation 7 are 0.65 and 0.85 respectively. The results for maximization of throughput are
as follows.
Figure 4: Rework intensity (%) and Backlog (IWIP) trend
While maximizing throughput, with the increase in rework intensity of each
stream, IWIP increases drastically. As illustrated in Figure 4, for rework intensities of
less than almost 33 percent, the later rework is generated, the sooner churn appears in
value stream and consequently backlog of work accumulates (for rework intensities over
70% in streams CA, CB, and BA, the problem will be infeasible). In such cases, the value
stream manager should identify the stream in which flow is switching into churn and
causing higher levels of backlog. A plausible method to find an efficient order of
checking streams is proposed later on. Once the source of error has been found, an A3
process needs to be conducted to prevent similar events in the future. Also, in some
cases, there is a chance to maintain the flow and reduce the backlog by applying a
temporary strategy of reducing the regular task release rate (i.e. workload) of the rework
originator -the one that brings up an issue and generates rework for others- which is
process C in this example. This helps to reduce the intensity factor by letting the rework

46
originator focus on rework jobs and resolving the ongoning issues. Since the goal is to
maintain a high level of throughput at the same time, the value stream manager
intervention should not be limited to workload reduction of the rework originator.
Therefore, the remaining capacity of the value stream, which are processes’ A and B
regular task streams in this example, should be utilized equally more (Please refer to table
3 in the appendix).
Figure 5: Rework intensity (%) and Lost effort trend
As demonstrated in Figure 5, gradual increase in rework intensity also decreases
value creating efforts. The speed at which efforts are lost within the value stream is
generally quicker when the originator is located further in downstream due to the
preemptions occurred during the firefighting situation the value stream manager and
engineers encountered (for rework intensities over 70% in streams CA, CB, and BA, the
problem will be infeasible). The temporary solution applied by value stream manager to
maintain the flow, also helps to reduce the lost effort, as the high priority reworks are
controlled over a short period of time. Thus, the average number of preemptions
decreases for both regular activities and lower priority rework jobs through the whole
value stream.

47
Figure 6: Throughput vs. Rework Intensity (%)
From another perspective, as demonstrated in Figure 6, the growth in rework intensity
causes a strictly descending pattern in throughput trend. Also, the pace at which
throughput drops when rework flows in the CA stream is noticeable (for rework
intensities over 70% in streams CA, CB, and BA, the problem will be infeasible).
The figure also shows the same pattern when churn is internal for all processes when
processing rates are equal. Hence, the throughput level of all the related streams (i.e. AA,
BB and CC) are overlapping. The same trend exists for BA and CB streams. The only
difference between streams CB and BA is that for higher levels of rework intensity, CB
can affect both upstream engineers while BA stream only targets process A. Of
importance is the point at which the slope of throughput diagram changes slightly; where
the value stream manager can intervene and control the throughput reduction pace by
equally shifting the workload to available capacity in upstream engineers. Note that a
point with similar characteristics exists for CB and BA streams as well.

48
Figure 7: Simulation CA (01), Backlog Versus Throughput
In order to validate the findings, a discrete event simulation model has been
developed. The main events considered for simulation of the value stream are arrival of
the tasks to the value stream, preemption by higher priority arriving tasks and departure
of a task from the value stream. At each round, simulation was performed for 10,000
tasks and the warm up period results have been excluded from the analysis. Simulation
completion criteria was the departure of the 10,000th task from the value stream. Optimal
solutions to the optimization problem discussed in the numerical example section were
the inputs of simulation. Results were collected at the end of each round and performance
metrics were updated accordingly. The simulation also validated the trend as depicted in
Figure 7 and Figure 8.
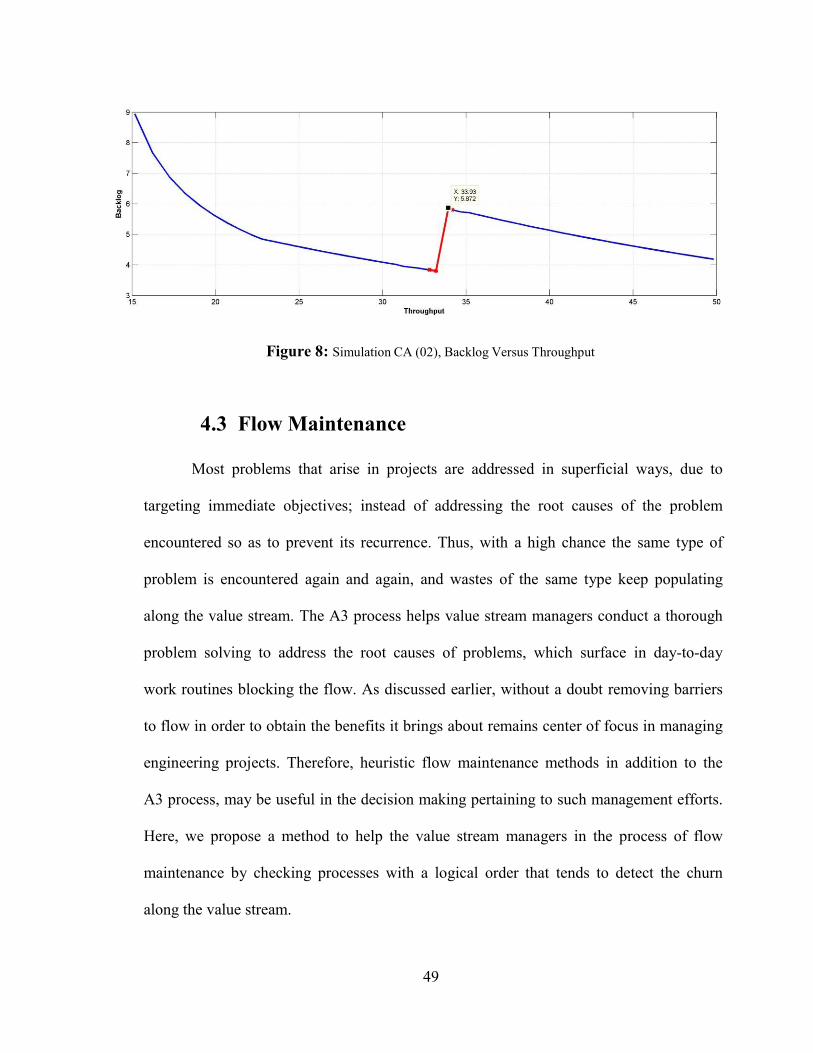
49
Figure 8: Simulation CA (02), Backlog Versus Throughput
4.3 Flow Maintenance
Most problems that arise in projects are addressed in superficial ways, due to
targeting immediate objectives; instead of addressing the root causes of the problem
encountered so as to prevent its recurrence. Thus, with a high chance the same type of
problem is encountered again and again, and wastes of the same type keep populating
along the value stream. The A3 process helps value stream managers conduct a thorough
problem solving to address the root causes of problems, which surface in day-to-day
work routines blocking the flow. As discussed earlier, without a doubt removing barriers
to flow in order to obtain the benefits it brings about remains center of focus in managing
engineering projects. Therefore, heuristic flow maintenance methods in addition to the
A3 process, may be useful in the decision making pertaining to such management efforts.
Here, we propose a method to help the value stream managers in the process of flow
maintenance by checking processes with a logical order that tends to detect the churn
along the value stream.
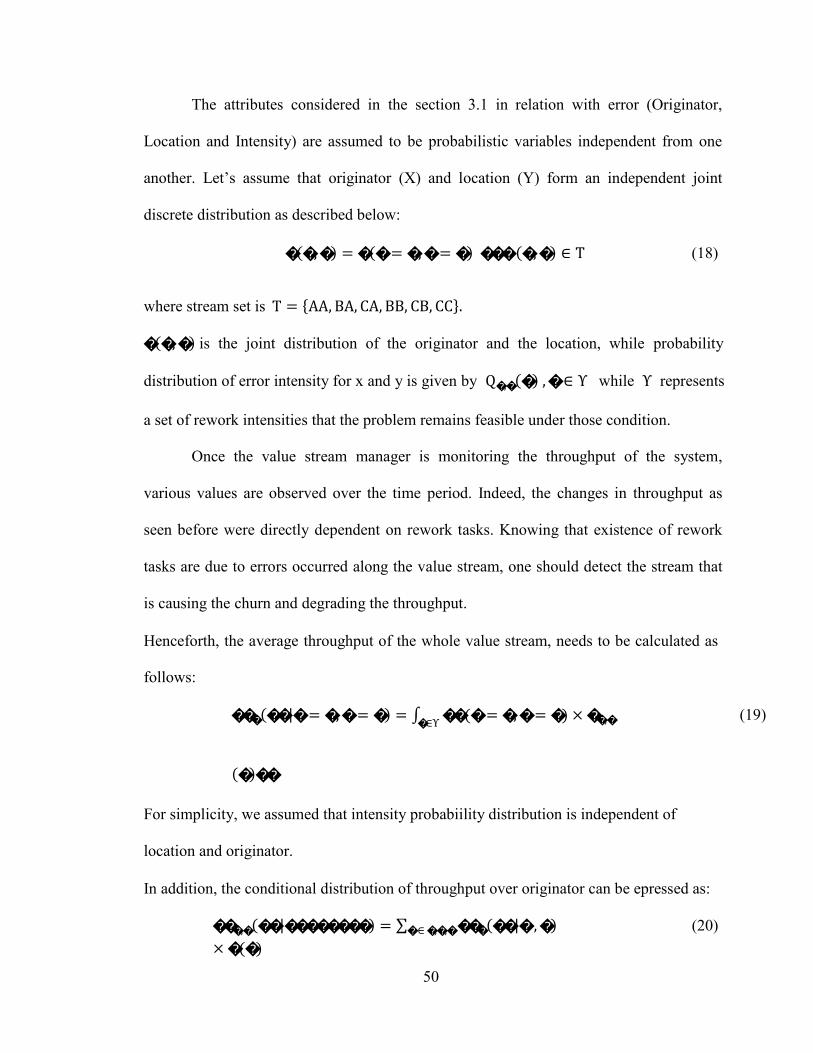
50
The attributes considered in the section 3.1 in relation with error (Originator,
Location and Intensity) are assumed to be probabilistic variables independent from one
another. Let’s assume that originator (X) and location (Y) form an independent joint
discrete distribution as described below:
�(�, �) = �(� = �, � = �) ��� (�, �) ∈ Τ (18)
where stream set is Τ = {AA, BA, CA, BB, CB, CC}.
�(�, �) is the joint distribution of the originator and the location, while probability
distribution of error intensity for x and y is given by Q�,� (�) , � ∈ Υ while Υ represents
a set of rework intensities that the problem remains feasible under those condition.
Once the value stream manager is monitoring the throughput of the system,
various values are observed over the time period. Indeed, the changes in throughput as
seen before were directly dependent on rework tasks. Knowing that existence of rework
tasks are due to errors occurred along the value stream, one should detect the stream that
is causing the churn and degrading the throughput.
Henceforth, the average throughput of the whole value stream, needs to be calculated as
follows:
��� (��|� = �, � = �) = ∫�∈Υ ��(� = �, � = �) × ��,�
(�)��
(19)
For simplicity, we assumed that intensity probabiility distribution is independent of
location and originator.
In addition, the conditional distribution of throughput over originator can be epressed as:
���,� (��|��������) = ∑� ∈ �,�,� ��� (��|� , �)
× �(�)
(20)

51
Assuming a uniform distribution for all distributions in this example, Table 2 briefly
indicates the order in which value stream manager should check the streams according to

52
the average throughput that is expected to result as a single error occurs within each
stream. For instance if on average, the observed level of throughput is 35, it can be
inferred that the A3 process can be done more efficiently if the processes are checked in
the following order: A-B-C.
Table 2: Stream Order
Stream E(Throughput |Originator, Location) E(Throughput | Location)
AA 44.41136 38.60
BA 38.09809
CA 33.33016
BB
44.46142
41.33 CB 38.20018
CC
44.41136
44.41
4.4 Decision making approach
In the case of single objective optimization, we took the flow maintenance
approach to maintain optimality of throughput solely. Although the method helped to
prioritize streams for investigation of the error and keep the flow while intensity increases,
optimality of the other two objective functions was not guaranteed. Usually, decision
makers are interested in collective optimality of the objective functions. To capture this
goal, several multi-objective optimization methods are readily available in operations
research literature amongst which lexicographic and goal programming are quite popular
due to modeling flexibility.

53
Earlier versions of the current study utilized lexicographic optimization method
that was based on sequential selection and optimization of objective functions. The
optimization sequence is subject to the decision maker’s interest. After optimization of the
first objective in the first step, the optimal level of the first objective function is added to
the problem constraints. The second objective is optimized with the new feasible region
accordingly. This process continues until all objective functions are optimized. From our
perspective, the disadvantage of this method is the feasibility of the problem that depends
on the sequence objective functions are selected. In addition, complexity order of the
algorithm and resources required to solve the problem grows rapidly due to concavity of
the feasible region because objective functions added to the constraints are not in linear
form and therefore shape of feasible region changes (for instance using Matlab, Genetic
algorithm run time grew in the second and the third step; GAMS NLP solvers such as
CONOPT and BARON also were used and in our study found to be quicker comparing
with Genetic Algorithm).
Presently, we took another approach to better optimize the problem using FminCon
solver in Matlab. As discussed earlier, we proposed three metrics as objective functions
namely throughput, backlog and lost effort. In general, performance metrics are of
different importance to a decision maker. Accordingly, considering the single error
assumption and the fact that errors are random in terms of location and intensity over the
time, we use an approach to assign weights to the previously mentioned objectives to assist
decision makers in multi-objective optimization methods such as Goal programming.
Often decision making is impacted by numerous qualitative and quantitative
factors. The idea here is to use variance of each performance metric as a determinant factor
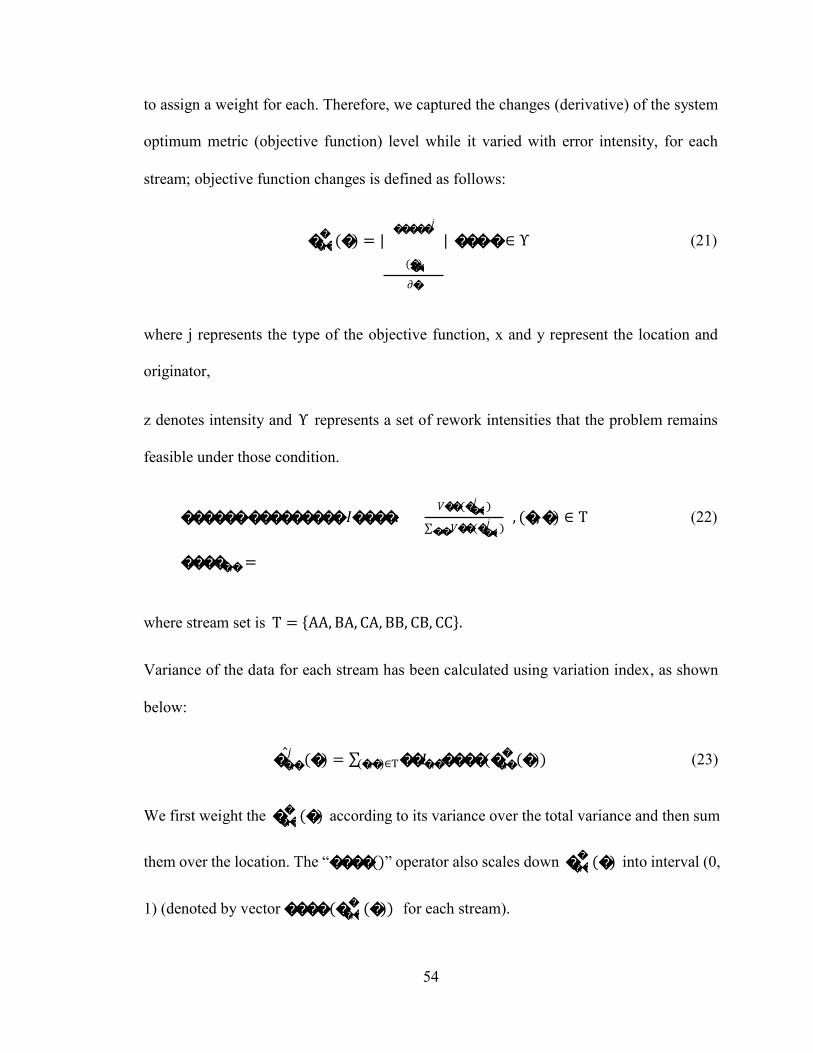
54
�,�
�,�
�,�
�,�
�,�
�,�
�,�
to assign a weight for each. Therefore, we captured the changes (derivative) of the system
optimum metric (objective function) level while it varied with error intensity, for each
stream; objective function changes is defined as follows:
� �
(�) = | �����
𝑗
(�)
𝜕�
| ��� � ∈ Υ (21)
where j represents the type of the objective function, x and y represent the location and
originator,
z denotes intensity and Υ represents a set of rework intensities that the problem remains
feasible under those condition.
������ ��������� 𝐼����:
�����,� =
𝑉��(� 𝑗
)
∑�,� 𝑉��(� 𝑗
) , (�, �) ∈ Τ (22)
where stream set is Τ = {AA, BA, CA, BB, CB, CC}.
Variance of the data for each stream has been calculated using variation index, as shown
below:
𝑗
(�) = ∑ ��𝐼 ����(�
� (�)) (23)
��,� (�,�)∈Τ �,� �,�
We first weight the � � (�) according to its variance over the total variance and then sum
them over the location. The “����()” operator also scales down � �
(�) into interval (0,
1) (denoted by vector ���� (� � (�)) for each stream).

55
The total normalized variation or sensitivity of the metric to intensity of rework, is the
weighted sum of variation of streams, given by:

56
� �,�
𝑗 𝑇
(�)
∀ � ∈ Υ: ������ � �������� ��������� (�����������) = ∑ ��,� ∫ ∑𝑇 �
𝑗 (�)��
(24)
The metric relative variation (or sensitivity) for throughput, backlog and lost effort are
illustrated in Figure 9.
Figure 9: Relative Sensitivity Trends
Here, throughput sensitivity varies as intensity level changes. As depicted, with the
increase in intensity in the feasible region, throughput sensitivity decreases whereas
backlog and lost effort sensitivities are low to a certain point, after which they grow
abruptly higher.
In our study, throughput sensitivity decreases until the point where intensity is almost 60.
Although after this point throughput remains sensitive, increase in sensitivity of the two
other metrics causes instability and congestion in the system. Therefore, after this point the
weights assigned to the metrics for decision making particularly related to the identified
wastes should be higher. In fact, the same analogy applies to the weights assigned to

57
1
� 2
� 3
�
∑
backlog and lost effort as backlog sensitivity exceeds lost effort after intensity level equals
65.
Next, we use goal-programming approach to optimize the three metrics simultaneously
taking the following two steps:
Step 1. Solve the problems P1, P2, and P3 (corresponding to the metrics) and label
the optimal solutions (if available) as Z1*, Z2
* and Z3*:
Step 2. Using “Goal Programming” define the new objective function as the sum of
deviation from pre-defined goals namely Z1*, Z2
* and Z3*. That is:
∗ ∗ ∗
New Objective = |�1 − �1 | + |�2 − �2 | + |�3 − �3 | (25)
Considering the range of each function and their unit (Throughput unit: task per time
interval, Backlog unit: task-time interval and Lost Effort unit: time), it might be better to
use the “relative change” of the functions rather than their actual difference. Therefore, the
new objective can be:
���� = | �1 − �∗
∗ | + |
1
�2 − �∗ ∗ | + |
2
�3 − �∗ ∗ | (26)
3
Weights corresponding to each metric can be determined by metric relative sensitivity as
follows:
Metric (i) Relative Sensitivity αi = 3
i=1 Metric (i) Relative Sensitivity (27)
Accordingly, the weighted objective function �� is:
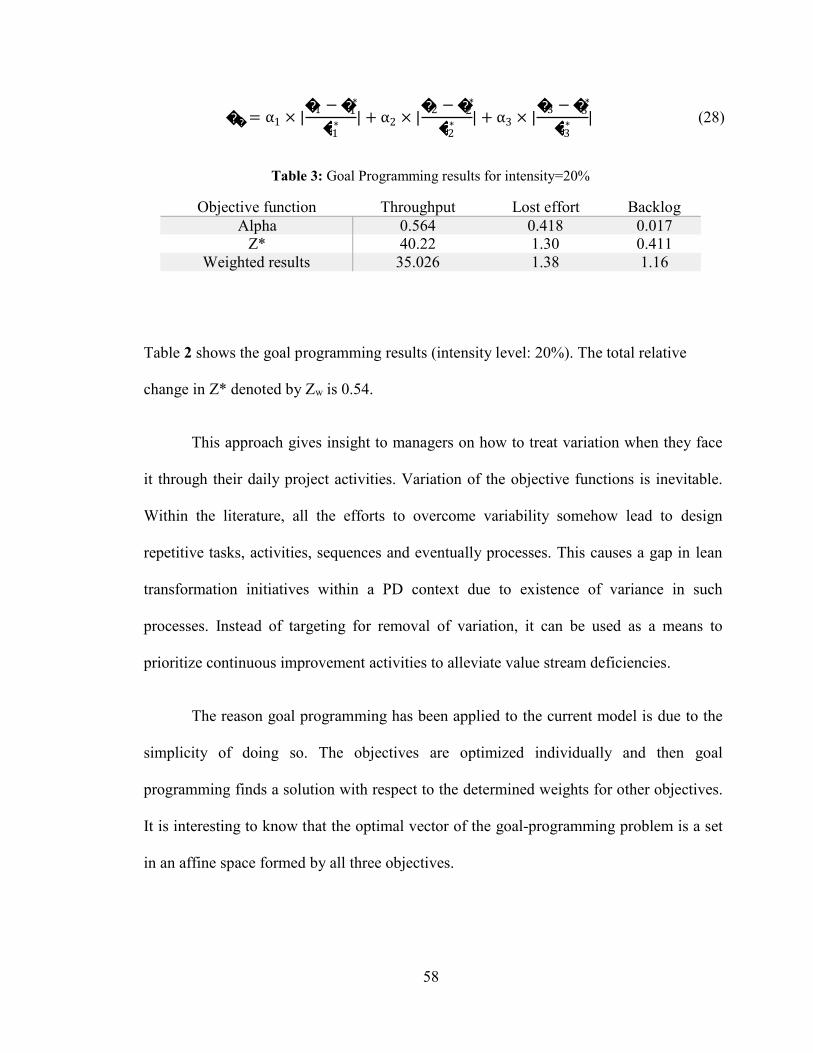
58
1 2 3
� � �
�1 − �∗ �2 − �∗ �3 − �∗
�� = α1 × | ∗ | + α2 × |
1 ∗ | + α3 × | 2
∗ | (28) 3
Table 3: Goal Programming results for intensity=20%
Objective function Throughput Lost effort Backlog
Alpha 0.564 0.418 0.017 Z* 40.22 1.30 0.411
Weighted results 35.026 1.38 1.16
Table 2 shows the goal programming results (intensity level: 20%). The total relative
change in Z* denoted by Zw is 0.54.
This approach gives insight to managers on how to treat variation when they face
it through their daily project activities. Variation of the objective functions is inevitable.
Within the literature, all the efforts to overcome variability somehow lead to design
repetitive tasks, activities, sequences and eventually processes. This causes a gap in lean
transformation initiatives within a PD context due to existence of variance in such
processes. Instead of targeting for removal of variation, it can be used as a means to
prioritize continuous improvement activities to alleviate value stream deficiencies.
The reason goal programming has been applied to the current model is due to the
simplicity of doing so. The objectives are optimized individually and then goal
programming finds a solution with respect to the determined weights for other objectives.
It is interesting to know that the optimal vector of the goal-programming problem is a set
in an affine space formed by all three objectives.
59
5 Conclusions and Future Work
We have described a new approach for addressing flow problem in the context of
PD, leading to a better understanding job release rate impact on value stream. The current
approach seeks a solution based on queueing theory basics and is insightful for product
managers on how to monitor and optimize the leanness of their PD value streams
according to their measures of interest. We studied measures namely IWIP, lost effort
and throughput through a non-linear optimization model.
Results showed that in the steady state, adverse effects of backward workflow from
downstream engineers on the studied measures are quite higher comparing to the same
type of workflow from the upstream. Our analysis also revealed the same finding for the
case when all error patterns within the value stream follow a unifrom distribution.
Furthuremore, our observations of optimization results and associated validations via
simulation indicated that for each stream, while rework inensity increases, there exists at
least one point where value stream manager can intervene and alleviate negative impacts
of increasing rework intensity on the value stream performance measures.
To address the flow problem, the current research adds the followings to the PD
literature:
1. Quantifying two types of waste in PD
2. Obtaining insights on rework flow impacts on the value stream
3. Using probability theory to maintain flow in PD
4. Using variation as a determinant factor for decision making in PD
60
As discussed earlier, we optimized a generic PD value stream using a multi-objective
approach, goal programming. The objective functions were two types of waste defined by
lean principles and throughput of the system. In fact, we bridged lean principles and PD
flow using queueing theory in order to quantify the objective functions. Accordingly, the
sensitivity of the aformentioned objectives enabled us to structure a meaningful
weighting policy for the goal programming model. Moreover, probability theory proved
useful in providing managers with insights on how to treat problems related to flow
maintenance in PD.
There are a number of opportunities that we believe gives researchers a chance to
study behavior of waste in PD. The present model assumes three engineers representing
tandem processes or teams in a generic three-phase value stream. The nature of
assumptions made to model the value stream limited us to expand it to the team level due
to absence of M/G/C preemptive repeat models from the queueing literature. Such
models, in addition to closed queueing networks are too complex and the literature is
mostly limited to M/G/1 priority models. In fact, more realistic situations that include just
in time information sharing via communication mediums can be studied only through
simulation of closed loop networks where interarrival times are not random. Nonetheless,
due to complexity of retrial queues with preemptive priority, insightful models can be
investigated through a detailed Monte Carlo simulation allowing us to understand the
trade-offs amongst jobs size, intensity of the rework, and their impact on churn.
Other limitations arise from the optimization perspective where algorithms such
as GA are used to find a global optimal solution. Apart from the formulation, finding an
optimal solution via heuristic algorithms due to non-linear characteristic of model

61
constraints (depending on the approach to solve the multi-objective problem) becomes a
daunting task specially regarding the required time and resources to run the model.
Nevertheless, lexicographic optimization of the same problem with pareto optimality
decision criteria will shed light on other aspects of optimal release rates problem in PD.
In the current research we assumed that only one error occurs during the time
interval the system is being monitored, and the flow of rework tasks in an open network
of queues generated by that error are attributed with random interarrival times.
Straightforward extensions to our approach include assumming multiple errors with setup
times using vacation queueing models that enables study of PD value stream from a
better perspective regarding the occurrence of errors.
Other opportunities are related to decision makers who are concerned about cost
of delay and cost of the lost effort. Further studies can be done on the trade-offs amongst
such costs and associated weighting policies to objective functions. The present research
used the concept of variation to facilitate the decision making process. In addition, it can
be concluded that the costs associated with each objective function in our model were the
same. Once the incurred costs resulted from different categories of waste can be
perceived and distinguished, identification of break even points among wastes and
throughput will become essential to efficient delivery of the project.
62
rk q
k rk a bk
B
B B
B
2
k
6 Appendix I – Queueing Formulation
6.1 Appendix I-M/G/1 Preemptive Repeat
The following formulas have been utilized to develop the model in Matlab, using
FminCon solver to find the optimal results. Consider a single server priority queueing
system where jobs of different priority classes arrive according to a Poisson process with
rate i where 1 ≤ � ≤ � and service time of class i is generally distributed with mean
i and variance i . Waiting or Flow time in the system for a class k job includes the
average residence time ( E(P ) ) plus the average queue waiting time ( E (W k ) ) which is
calculated as follows (Conway et al., 2012):
E(F ) = E(P ) E(P
2 )
E(T
2 )
(29) k rk 2(1 k E(Prk )) 2(1 a E(Tbk ))
If a class K preemption does occur and the server becomes occupied solely with
customers of classes 1 through k 1 , we shall now let Bk denote the high priority
busy period generated by that group of customers, having LST Bk
(s) obtained
recursively starting from (s) = 1
1 by:
k 1
(s) =
a
ak
(s k
k
k (s))
k
ak
k (s)
(30)
where k (s) denotes the busy period LST in an M/G/1 queue with arrival rate k
and service time LST Rk
.
i (s) = i (s i ii (s)) (31)
And the first and second moment of breakdown time T experienced by class K
k

63
B
B
a
k rk a bk
k
customers is obtained recursively by:
E(T
) =
a E(T
bk )
k E(P
rk )
(32) b,k 1 ( )(1 E(P )) a k k rk
2 2
E(T 2
) = a E(Tbk )(1 k E(Prk )) k E(Prk )(1 a E(Tbk )
b,k 1
(
)(1 E(P
))3
(33) a k k rk
Also, E(T )
k could be obtained by:
E(T ) = k
k 1
a (1
k 1 )
(34)
Preemptive Repeat Mean gross processing time:
E(Pgk
) = 1
k (
a )
a k (a )
(35)
Gross processing time-second moment:
E(P 2
) = 2 (1
( ) E(P e
a Pk ))
(36) gk
2 ( (a ))
2
k a a k
Obviously, the queue waiting time for class k jobs are:
E(W k ) = E(F ) E(P ) = E(P
2 )
E(T
2 )
(37) q k rk 2(1 k E(Prk )) 2(1 a E(Tbk ))
Number of the jobs waiting in the system and in each class queue is determined by little’
s law respectively:
�� = �� × �� (38)
� �
�� = �� × �� (39)
According to Stewart (2009), the time interval from the moment service began until the

64
current time is known as “backward recurrence time”.
Backward Recurrence Time = BRT = E[S
2 ]
2E[S ]
(40)
where E[s] and E[S 2 ] are the first and the second moments of service time
respectively. This clearly represents the duration before preemption occurs.

63
6.2 Appendix II-Optimimization Results
Table 4: Stream CA Optimization Results
X5 and Xl5 are artificial variables used for progranuning in matrix structw·e in Matlab and therefore, in the
optimal results they are equal to zero.
XI X2 X3 X4 X5 X6 X7 XS X9 XlO Xll Xl2 Xl3 Xl4 XIS
0 0.17 0.166634 16.663366 0 0.17 0.17 0.16495 16.49505 0 0.17 0.166634 16.663366 0
0.17 0.17 0.16495 16.49\05 0.17 0.17 0.17 0.163267 16.326733 0.17 0.17 0.16495 16.4950.\ 0
0.34 0.17 0.16.1267 16.326733 0.34 0.17 0.17 0.161584 16.158416 0.34 0.17 0.163267 16.326733 0
0.51 0.17 0.161584 16.158416 0.51 0.17 0.17 0.159901 15.990099 0.51 0.17 0.161.\84 16.158416 0 0.68 0.17 0. 59901 15.990099 0.68 0.17 0.17 0.158218 15.821782 0.68 0.17 0.159901 15.990099 0 0.85 0.17 0.158218 15.821782 0.85 0.17 0.17 0.156535 15.653465 0.85 0.17 0.158218 15.821782 0
1.02 0.17 0.156535 15.653465 1.02 0.17 0.17 0.154851 15.485149 1.02 0.17 0.156535 15.65346.\ 0
1.19 0.17 0.154851 15.48.\149 1.19 0.17 0.17 0.153168 15.316&12 1.19 0.17 0.154851 15.485149 0
1.36 0.17 0.153168 15.316832 1.36 0.17 0.17 0.151485 15.148.\15 1.36 0.17 0.153168 15.316832 0 1.53 0.17 0.151485 15.148515 1.53 0.17 0.17 0.149802 14.980198 1.53 0.17 0.151485 15.14851.\ 0 1.7 0.17 0.149802 14.980198 1.7 0.17 0.17 0.148119 14.811881 1.7 0.17 0.149802 14.980198 0
1.87 0.17 0.148119 14.811881 1.87 0.17 0.17 0.146436 14.643\.64 1.87 0.17 0.148119 14.811881 0
2.04 0.17 0.146436 14.643564 2.04 0.17 0.17 0.144752 14.475248 2.04 0.17 0.146436 14.643564 0
2.21 0.17 0.144752 14.47.\248 2.21 0.17 0.17 0.143069 14.306931 2.21 0.17 0.144752 14.475248 0 2.38 0.17 0.143069 14.306931 2.38 0.17 0.17 0.141386 14.138614 2.38 0.17 0.143069 14.306931 0
2.55 0.17 0.141386 14.138614 2.55 0.17 0.17 0.139703 13.970297 2.55 0.17 0.141386 14.138614 0
2.72 0.17 0.139703 13.970297 2.72 0.17 0.17 0.13802 13.80198 2.72 0.17 0.1397o.3 13.970297 0
2.89 0.17 0.13802 13.80198 2.89 0.17 0.17 0.136337 13.633663 2.89 0.17 0.13802 13.80198 0
3.06 0.17 0. 38337 13.633663 3.06 0.17 0.17 0.134653!3.465347 3.06 0.17 0.136337 13.633663 0 3.23 0.17 0.134653 13.46.\347 3.23 0.17 0.17 0.13297
13.29703
3.23 0.17 0.134653 13.465347 0
3.4
3.57
3.74
3.91
4.08
4.25
4.42
4.59
4.76
4.93
5.1
0.17
0.17
0.17
0.17
0.17
0.17
0.17
0.17
0.17
0.17
0.17
0.13297
0.131287
0.129604
0.127921
0.126238
0.124554
0.122871
0.121188
0.119505
0.117822
0.116139
13.29703
13.128713
12.960396
12.792079
12.623762
12.45.\446
12.287129
12.118812
11.950495
11.782178
11.613861
3.4
3.57
3.74
3.91
4.08
4.25
4.42
4.59
4.76
4.93
5.1
0.17
0.17
0.17
0.17
0.17
0.17
0.17
0.17
0.17
0.17
0.17
0.17
0.17
0.17
0.17
0.17
0.17
0.17
0.17
0.17
0.17
0.17
0.131287
13.128713
0.129604
12.960396
0.127921
12.792079
0.126238
12.623762
0.124554 12.455446
0.122871
12.287129
0.121188
12.118812
0.119505 11.950495
0.117822 11.782178
0.116139 11.613861
0.114455 11.445545
3.4
3.57
3.74
3.91
4.08
4.25
4.42
4.59
4.76
4.93
5.1
0.17
0.17
0.17
0.17
0.17
0.17
0.17
0.17
0.17
0.17
0.17
0.13297
0.13128
7
0.129604
0.127921
0.126238
0.124554
0.122871
0.121188
0.119505
0.117822
0.116139
13.29703 0
13.128713 0
12.960396 0 12.792079 0 12.623762 0
12.455446 0
12.287129 0
12.118812 0 11.95049.\ 0 11.782178 0
11.613861 0
5.27
5.44
0.17
0.17
0.114455 11.44.\545
0.112772 11.277228
5.27
5.44
0.17
0.17
0.17
0.17
0.112772 11.277228
0.111089 11.108911
5.27
5.44
0.17
0.17
0.114455
0.112772
11.44554.\ 0
11.277228 0 4.29
4.42
0.17
0.17
0.124158
0.122871
12.41.\842
12.287129
4.29
4.42
0.13
0.13
0.17
0.17
0.122871
12.287129
0.121584 12.158416
4.29
4.42
0.13
0.13
0.08495
0.08366.1
8.49505 0 8.366337 0
4.55
4.68
4.81
4.94
5.07
0.17
0.17
0.17
0.17
0.17
0.121584
0.120297
0.11901
0.117723
0.116436
12.158416
12.029703
11.90099
11.772277
11.643564
4.55
4.68
4.81
4.94
5.07
0.13
0.13
0.13
0.13
0.13
0.17
0.17
0.17
0.17
0.17
0.120297
0.11901
0.117723
0.116436
0.11.\149
12.029703
11.90099
11.772277
11.643.\64
11.5148M
4.55
4.68
4.81
4.94
5.07
0.13
0.13
0.13
0.13
0.13
0.082376
0.081089
0.079802
0.078515
0.077228
8.237624 0
8.108911 0
7.980198 0 7.85148.\ 0
7.722772 0
5.2
5.33
5.46
5.59
5.72
5.85
5.98
6.11
6.24
6.37
0.17 0.115149 11.514851
0.17 0.113861 11.386139
0.17 0.112574 11.257426
0.17 0.111287 11.128713
0.17 0.11 11
0.17 0.108713 10.871287
0.17 0.107426 10.742574
0.17 0.106139 10.613861
0.17 0.104851 10.48\.149
0.17 0.1D.1564 10.356436
5.2
5.33
5.46
5.59
5.72
5.85
5.98
6.11
6.24
6.37
0.13
0.13
0.13
0.13
0.13
0.13
0.13
0.13
0.13
0.13
0.17
0.17
0.17
0.17
0.17
0.17
0.17
0.17
0.17
0.17
0.113861 11.386139
0.112574 11.257426
0.111287 11.128713
0.11 11
0.108713 10.871287
0.107426 10.742.\74
0.106139
10.613861
0.104851
10.485149
0.103564 10.356436
0.102277 10.227723
5.2
5.33
5.46
5.59
5.72
5.85
5.98
6.11
6.24
6.37
0.13
0.13
0.13
0.13
0.13
0.13
0.13
0.13
0.13
0.13
0.075941
0.074653
0.073366
0.072079
0.070792
0.069505
0.068218
0.066931
0.065644
0.064356
7.594059 0
7.46.\347 0 7.336634 0 7.207921 0
7.079208 0
6.95049.\ 0
6.821782 0 6.693069 0 6.564356 0
6.435644 0
6.5
6.63
6.76
6.89
7.02
7.15
7.28
7.41
7.54
7.67
7.8
8.106579
8.462162
8.8375
9.2.14286
9
.
6
5
4
4
1
2
1
0.
1
10.57
3437
0.17
0.17
0.17
0.17
0.17
0.17
0.17
0.17
0.17
0.17
0.17 0.17
0.17
0.17
0.17
0.17
0.17
0.17
0.102277
0.10099
0.099703
0.098416
0.097129
0.095842
0.094554
0.093267
0.0919
8
0.090693
0.089406 0.086371
0.082&\
0.079134
0.075
205
0.071
045
0.066
634
0.061946
10.227723
10.09901
9.970297
9.841.\84
9.712871
9.584158
9.45.\446
9.326733
9.19802
9.069307
8.940.\94
8.637051
8.284988
7.913.166
7.520.\09
7.104543
6.663.166
6.194616
6.5
6.63
6.76
6.89
7.02
7.15
7.28
7.41
7.54
7.67
7.8 8.106579
8.462162
8.8375
9.234286
9.654412
10.1
10.573437
0.13
0.13
0.13
0.13
0.13
0.13
0.13
0.13
0.13
0.13
0.13 0.132895
0.136486
0.140278
0.144286
0.148529
0.1530.
0.157812
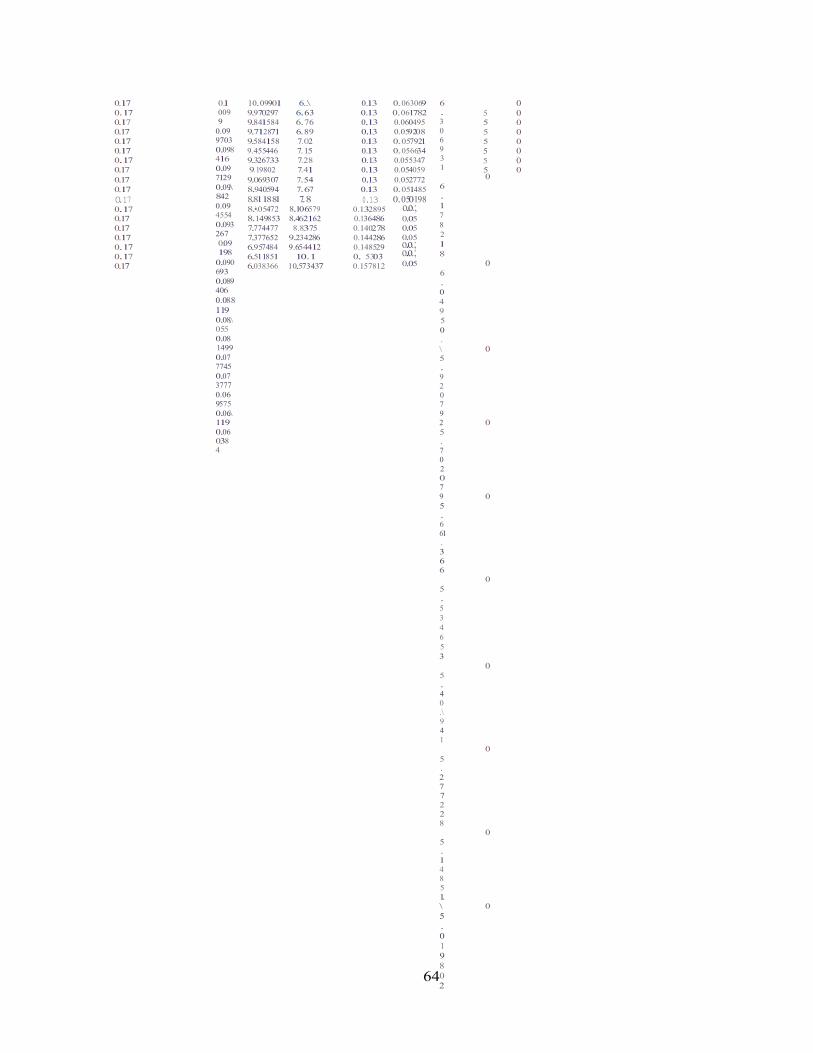
64
0.17
0.17
0.17
0.17
0.17
0.17
0.17
0.17
0.17
0.17
0.17 0.17
0.17
0.17
0.17
0.17
0.17
0.17
0.1
009
9
0.09
9703
0.098
416
0.09
7129
0.09.\
842
0.09
4554
0.093
267
0.09
198
0.090
693
0.089
406
0.088
119 0.08.\
055
0.08
1499
0.07
7745
0.07
3777
0.06
9575
0.06.\
119
0.060384
10.09901
9.970297
9.841584
9.712871
9.584158
9.455446
9.326733
9.19802
9.069307
8.940594
8.811881 8.•\05472
8.149853
7.774477
7.377652
6.957484
6.511851
6.038366
6..\
6.63
6.76
6.89
7.02
7.15
7.28
7.41
7.54
7.67
7.8 8.106579
8.462162
8.8375
9.234286
9.654412
10.1
10.573437
0.13
0.13
0.13
0.13
0.13
0.13
0.13
0.13
0.13
0.13
0.13 0.132895
0.136486
0.140278
0.144286
0.148529
0. 5303
0.157812
0.063069
0.061782
0.060495
0.059208
0.057921
0.056634
0.055347
0.054059
0.052772
0.051485
0.050198 o.o.; 0.05
0.05
0.05 o.o.; o.o.; 0.05
6
.
3
0
6
9
3
1
0
6
.
1
7
8
2
1
8
0 6
.
0
4
9
5
0
.
\ 0 5
.
9
2
0
7
9
2 0
5
.
7
0
2
0
7
9 0
5
.
6
61
.
3
6
6
0
5
.
5
3
4
6
5
3
0 5
.
4
0
.\
9
4
1
0
5
.
2
7
7
2
2
8
0
5
.
1
4
8
5
1.
\ 0
5
.
0
1
9
8
0
2
0
5 0 5 0
5 0
5 0
5 0 5 0 5 0

65
11.077419
11.615
0.17 0.056956 5.69.\624
0.170034 0.051633 5.163.133
11.077419 0.162903 0.17
11.615 0.168333 0.170034
0.055343
0.05
5.534334
5
11.077419 0.162903
11.615 0.168333
0.05 5 0
0.05 5 0

66
Table 5: Stream BA Optimization Results
XI X2 X3 X4 X5 X6 X7 X X9 X IO Xll X12 X13 X14 X15
0.17 0 0.166631 16.663366 0 0.17 0.17 0 0.1 95 16.49505 0.17 0.17 0.1 195 16.49505 0 0.17 0.17 0.16 95 16.49505 0 0.17 0.17 0.17 0.163267 16.326733 0.17 0.17 0.16495 16.49505 0 0.17 0.34 0.163267 16.326733 0 0.17 0.17 0.3-1 0.161584 16.158416 0.17 0.17 0.1 95 16.49505 0
0.17 0.51 0.161584 16.158416 0 0.17 0.17 0.51 0.159901 15.990099 0.17 0.17 0.16495 16.49505 0 0.17 0.6 0.159901 15.990099 0 0.17 0.17 0.68 0.15821 15.8217 2 0.17 0.17 0.16495 16.49505 0 0.17 0. 5 0.158218 15.821782 0 0.17 0.17 0.85 0.156535 15.653465 0.17 0.17 0.1 95 16.49505 0
0.17 1.02 0.156535 15.653465 0 0.17 0.17 1.02 0.15-1851 15.485149 0.17 0.1 7 0.1 95 16.49505 0 0.17 1.19 0.1 851 15.4 5149 0 0.17 0.17 1.19 0.153168 15.316832 0.17 0.17 0.1 95 16.49505 0
0.17 1.36 0.153168 15.316832 0 0.17 0.17 1.36 0.151485 15.148515 0.17 0.17 0.1 95 16.49505 0
0.17 !.53 0.151485 15.148515 0 0.17 0.17 !.53 0.149802 14.98019 0.17 0.17 0.1 95 16.49505 0 0.17 1.7 0.149802 14.980198 0 0.17 0.17 1.7 0.148119 14.811881 0.17 0.17 0.1 95 16.49505 0
0.17 I. 7 0.14 ll9 14. 11 I 0 0.17 0.17 I. 7 0.14 36 14.6 3564 0.17 0.17 0.1 95 16.49505 0
0.17 2.0-1 0.14636 14. 35 0 0.17 0.17 2.0-1 0.144752 14.475U 0.17 0.17 0.1 95 16.49505 0 0.17 2.21 0.141752 14.47524 0 0.17 0.17 2.21 0.143069 I 1.306931 0.17 0.17 0.1 95 16.49505 0
0.17 2.38 0.143069 H.306931 0 0.17 0.17 2.38 0.141386 14.138614 0.17 0.17 0.1 95 16.49505 0
0.17 2.55 0.141386 14.138614 0 0.17 0.17 2.55 0.139703 13.970297 0.17 0.17 0.1 95 16.49505 0
0.17 2.72 0.139703 13.970297 0 0.17 0.17 2.72 0.13802 13.80198 0.17 0.17 0.1 195 16.49505 0
0.17 2. 9 0.13802 13. 019 0 0.17 0.17 2. 9 0.136337 13.633663 0.17 0.17 0.16495 16.49505 0 0.17 3.06 0.136337 13.633663 0 0.17 0.17 3.06 0.1653 13.4653H 0.17 0.17 0.16495 16.49505 0 0.17 3.23 0.13-1653 13.4653-17 0 0.17 0.17 3.23 0.13297 13.29703 0.17 0.17 0.1 95 16.49505 0
0.17 3.4 0.13297 13.29703 0 0.17 0.17 3.4 0.1312 7 13.12 713 0.17 0.1 7 0.16495 16.49505 0 0.17 3.57 0.131287 13.128713 0 0.17 0.17 3.57 0.1296 12.960396 0.17 0.17 0.1 95 16.49505 0
0.17 3.74 0.129601 12.960396 0 0.17 0.1 7 3.74 0.1 27921 12.792079 0.17 0.17 0.1 95 16.49505 0
0.17 3.91 0.127921 12.792079 0 0.17 0.17 3.91 0.126238 12.623762 0.17 0.17 0.1 95 16.49505 0 0.17 4.08 0.126238 12.623762 0 0.17 0.17 4.08 0.12 15 12.455-1-16 0.17 0.17 0.1 95 16.49505 0
0.17 4.25 0.12-155 12.45 -16 0 0.17 0.17 4.25 0.122 71 12.287129 0.17 0.17 0.16495 16.49505 0 0.17 4.42 0.122 71 12.287129 0 0.17 0.17 4.42 0.1211 12.11 812 0.17 0.17 0.16 95 16.49505 0 0.17 4.59 0.12118 12.ll 12 0 0.17 0.17 4.59 0.119505 I 1.950-195 0.17 0.17 0.1 95 16.49505 0
0.17 4.76 0.119505 I 1.95 95 0 0.17 0.17 4.76 0.117 22 11.7 2178 0.17 0.17 0.1 95 16.49505 0
0.17 4.93 0.117822 11.782178 0 0.17 0.17 4.93 0.116139 11.613861 0.17 0.17 0.1 95 16.49505 0
0.17 5.1 0.116139 11.613861 0 0.17 0.17 5.1 0.111155 11.415515 0.17 0.17 0.1 95 16.49505 0
0.17 5.27 0.114455 11.445545 0 0.17 0.17 5.27 O. ll2772 I 1.27722 0.17 0.17 0.16-195 16.49505 0 0.17 5.4-1 0.112772 11.277228 0 0.17 0.17 5.4-1 0.1110 9 11.108911 0.17 0.17 0.16495 16.49505 0 0.17 5.61 O.ll1089 11.109ll 0 0.17 0.17 5.61 0.109-106 10.9-1059-1 0.17 0.17 0.1 95 16.49505 0
0.17 5.7 0.109406 10.940594 0 0.17 0.17 5.7 0.107723 10.772277 0.17 0.17 0.16495 16.49505 0 0.17 5.95 0.107723 10.772277 0 0.17 0.17 5.95 0.1061 10.60396 0.17 0.17 0.1 95 16.49505 0
0.17 6.12 0.10W 10.60396 0 0.17 0.17 6.12 0.1356 10.435644 0.17 0.17 0.16495 16.49505 0
0.17 6.29 0.1 356 10.43564.4. 0 0.17 0.17 6.29 0.102673 10.267327 0.17 0.17 0.1 195 16.49505 0
0.17 6.46 0.102673 10.267327 0 0.17 0.17 6.46 0.10099 10.09901 0.17 0.17 0.16495 16.49505 0
0.17 6.63 0.10099 10.09901 0 0.17 0.17 6.63 0.099307 9.930693 0.17 0.17 0.16-195 16.49505 0 0.17 6. 0.099307 9.930693 0 0.17 0.17 6. 0.097624 9.762376 0.17 0.17 0.16 95 16.49505 0 0.17 6.97 0.097624 9.762376 0 0.17 0.17 6.97 0.095941 9.594059 0.17 0.17 0.1&195 16.49505 0
0.17 7.1<1 0.095941 9.594059 0 0.17 0.17 7.1-1 0.09-1257 9.425743 0.17 0.17 0.1 95 16.49505 0 0.17 7.31 0.091257 9.425743 0 0.17 0.17 7.31 0.092574 9.257426 0.17 0.17 0.1 95 16.49505 0
0.17 7.48 0.092574 9.257426 0 0.17 0.17 7.18 0.090891 9.089109 0.17 0.17 0.16495 16.49505 0
0.17 7.65 0.090 91 9.089109 0 0.17 0.17 7.65 0.0 9208 .920792 0.17 0.17 0.1 95 16.49505 0 0.17 7.82 0.089208 8.920792 0 0.17 0.17 7.82 0.0 7525 8.752475 0.17 0.17 0.1 95 16.49505 0
0.17 7.99 0.087525 8.752475 0 0.17 0.17 7.99 0.085842 .584158 0.17 0.17 0.16495 16.49505 0
0.17 .16 0.0858-12 .58-115 0 0.17 0.17 .16 0.08-1158 .415842 0.17 0.17 0.1 95 16.49505 0
0.17 .33 0.08<115 8.41582 0 0.17 0.17 8.33 0.082175 8.247525 0.17 0.17 0.1 95 16.49505 0
0.17 8.276774 0.08-1685 .461 0 0.17 0.17 8.276774 0.0785 2 7.858192 0.17 0.1 7 0.1 95 16.49505 0
0.17 6.63 0.10099 10.09901 0 0.17 0.17 6.63 0.059703 5.970297 0.17 0.17 0.16-195 16.49505 0
0.17 6.76 0.099703 9.970297 0 0.17 0.17 6.76 0.058116 5. 1158-1 0.17 0.17 0.16195 16.49505 0 0.17 6. 9 0.098416 9.8-11584 0 0.17 0.17 6. 9 0.057129 5.712 71 0.17 0.17 0.16495 16.49505 0 0.17 7.02 0.097129 9.712871 0 0.17 0.17 7.02 0.055842 5.584158 0.17 0.17 0.1 95 16.49505 0 0.17 7.15 0.095 12 9.58 158 0 0.17 0.17 7.15 0.05-1554 5.4 46 0.17 0.17 0.16495 16.49505 0
0.17 7.2 0.094554 9.455446 0 0.17 0.17 7.28 0.053267 5.326733 0.17 0.17 0.16-195 16.49505 0 0.17 7.41 0.093267 9.326733 0 0.17 0.17 7.41 0.05198 5.19802 0.17 0.17 0.16495 16.49505 0
0.17 7.51 0.09198 9.19802 0 0.17 0.17 7.5-1 0.050693 5.069307 0.17 0.17 0.16495 16.49505 0
0.17 7.7563 1 0.08983 8.9 382 0 0.17 0.17 7.756311 0.05 5 0.17 0.17 0.1 95 16.49505 0 0.17 8.085 0.086584 8.658416 0 0.17 0.17 8.085 0.05 5 0.17 0.17 0.16495 16.49505 0
0.17 8.430513 0.083163 8.316324 0 0.17 0.17 8.130513 0.05 5 0.17 0.17 0.16495 16.49505 0
0.17 .7912ll 0.079562 7.956227 0 0.17 0.17 8.791211 0.05 5 0.17 0.17 0.1 95 16.49505 0 0.17 9.177568 0.075767 7.576666 0 0.17 0.17 9.177568 0.05 5 0.17 0.17 0.1 195 16.49505 0
0.17 9.5 2222 0.07176 7.17601 0 0.17 0.17 9.582222 0.05 5 0.17 0.17 0.16495 16.49505 0
0.17 10.01 0.067525 6.752475 0 0.17 0.17 10.01 0.05 5 0.17 0.17 0.16-195 16.49505 0 0.17 10.4629H 0.06301 6.30019 0 0.17 0.17 10.462911 0.05 5 0.17 0.17 0.1 195 16.19505 0
0.17 10.9 3333 0.0582 4 5. 28383 0 0.17 0.17 10.943333 0.05 5 0.17 0.17 0.1 95 16.49505 0 0.17 11.45375 0.05323 5.32302 0 0.17 0.17 11.45375 0.05 5 0.17 0.17 0.1 95 16.49505 0
0.13 11.819032 0.05001 5.000958 0 0.13 0.13 I I. 19032 0.05 5 0.13 0.13 0.126139 12.613861 0

67
Table 6: Stream CB Optimization Results
XI X2 X3 X4 X5 X6 X7 X X9 XIO XII Xl2 Xl3 Xl4 Xl5
0.17 0.1 7 0.16495 16.49505 0 0.17 0 0.17 0.16495 16.49505 0.17 0 0.166634 16.6633()6 0
0.17 0.1 7 0.1649:> 16.49505 0 0.17 0.17 0.17 0.163267 16.326733 0.17 0.17 0.16495 16.49505 0
0.17 0.17 0.16495 16.49505 0 0.17 0.34 0.17 0.161584 16.158-116 0.17 0.34 0.163267 16.326733 0
0.17 0.17 0.16495 16.49505 0 0.17 0.51 0.17 0.159901 15.990099 0.17 0.51 0.161584 16.158416 0
0.17 0.1 7 0.16495 16.49:>05 0 0.17 0.68 0.17 0.158218 15.8217 '2 0.17 0.68 0.159901 15.990099 0
0.17 0.1 7 0.1649::> 16.49505 0 0.17 0. 5 0.17 0.156535 15.653465 0.17 0.85 0.15821 15. 217 2 0
0.17 0.17 0.16495 16.49505 0 0.17 1.02 0.17 0.154851 15.485149 0.17 1.02 0.156535 15.65346:; 0
0.17 0.17 0.16495 16.49505 0 0.17 1.19 0.17 0.153168 15.316832 0.17 1.19 0.154851 15.485149 0
0.17 0.1 7 0.16495 16.49505 0 0.17 1.36 0.17 0.151485 15.148515 0.17 1.3G 0.15316 15.316832 0
0.17 0.1 7 0.16495 1 6.49505 0 0.17 1.53 0.17 0.149802 14.980198 0.17 1.53 0.1511 5 15.148515 0
0.17 0.17 0.1649::> 16.49505 0 0.17 1.7 0.17 0.148119 14.811 I 0.17 1.7 0.149802 14.980198 0
0.17 0.17 0.16495 16.49505 0 0.17 1.87 0.17 0.146436 14.643564 0.17 1.87 0.148119 14.811881 0
0.17 0.1 7 0.16495 16.49505 0 0.17 2.04 0.17 0.14H52 14.H5248 0.17 2.Q.l 0.146436 14.643564 0
0.17 0.1 7 0.16495 16.49505 0 0.17 2.21 0.17 0.143009 14.300931 0.17 2.21 0.144752 14.47524 0
0.17 0.17 0.16495 16.49505 0 0.17 2.3 0.17 0.141386 14.138614 0.17 2.38 0.143009 14.300931 0
0.17 0.17 0.16495 16.49505 0 0.17 2.55 0.17 0.139703 13.970297 0.17 2.55 0.141386 14.138614 0
0.17 0.1 7 0.16495 16.49505 0 0.17 2.72 0.17 0.13802 13. 0198 0.17 2.72 0.139703 13.970297 0
0.17 0.1 7 0.16495 16.49505 0 0.17 2. 9 0.17 0.13G337 13.633663 0.17 2.89 0.13802 13.80198 0
0.17 0.17 0.16495 16.49505 0 0.17 3.06 0.17 0.134653 13.465347 0.17 3.00 0.136337 13.633663 0
0.17 0.17 0.16495 16.49505 0 0.17 3.23 0.17 0.13297 13.29703 0.17 3.23 0.134653 13.465347 0
0.17 0.1 7 0.16495 16.49505 0 0.17 3.4 0.17 0.131287 13.128713 0.17 3.4 0.13297 13.29703 0
0.17 0.1 7 0.16495 16.49505 0 0.17 3.57 0.17 0.1296Q.l 12.960396 0.17 3.57 0.131287 13.128713 0
0.17 0.1 7 0.16495 16.49505 0 0.17 3.74 0.17 0.127921 12.792079 0.17 3.74 0.129604 12.960396 0
0.17 0.17 0.16495 16.49505 0 0.17 3.91 0.17 0.126238 12.623762 0.17 3.91 0.127921 12.792079 0
0.17 0.1 7 0.16495 16.49505 0 0.17 4.0 0.17 0.124554 12.455446 0.17 4.08 0.126238 12.623762 0
0.17 0.1 7 0.16495 16.49505 0 0.17 4.25 0.17 0.122 7l 12.287129 0.17 4.25 0.124554 12.455446 0
0.17 0.1 7 0.16495 16.49505 0 0.17 4.42 0.17 0.121 1 12.11 12 0.17 4.42 0.122871 12.2 7129 0
0.17 0.17 0.16495 16.49:>05 0 0.17 4.59 0.17 0.119505 11.95Q.l9::> 0.17 4.59 0.12118 12.118812 0
0.17 0.1 7 0.16495 16.49505 0 0.17 4.76 0.17 0.117822 11.78217 0.17 4.76 0.11950::> 11.950495 0
0.17 0.17 0.16495 16.49505 0 0.17 4.93 0.17 0.116139 11.613861 0.17 4.93 0.117822 11.782178 0
0.17 0.1 7 0.16495 16.49505 0 0.1 7 5.1 0.17 0.1 14455 11.445545 0.17 5.1 0.116139 11.613861 0
0.17 0.1 7 0.1649::> 16.49505 0 0.17 5.27 0.17 0.1 12772 11.27722 0.17 5.27 0.114455 t 1.+15545 0
0.17 0.17 0.16495 16.49505 0 0.17 5.44 0.17 0.111089 11.108911 0.17 5.4-t 0.112772 11.27722 0 0.17 0.17 0.16495 16.49:;05 0 0.17 5.61 0.17 0.109400 10.940594 0.17 5.61 0.111089 11.108911 0
0.17 0.17 0.16495 16.49505 0 0.17 5.7 0.17 0.107723 10.772277 0.17 5.78 0.109406 10.940594 0
0.17 0.1 7 0.16495 16.49505 0 0.17 5.95 0.17 O.I OOQ.l 10.60396 0.17 5.93 0.107723 10.772277 0
0.17 0.17 0.16495 16.49505 0 0.17 6.12 0.17 O.IQ.l356 10.435644 0.17 6.12 0.10604 10.60396 0 0.17 0.1 7 0.16495 16.49505 0 0.17 6.29 0.17 0.102673 10.267327 0.17 6.29 0.1043:>6 10.435644 0
0.17 0.1 7 0.16495 16.49505 0 0.17 6.46 0.17 0.10099 10.09901 0.17 6.46 0.102673 10.267327 0
0.17 0.1 7 0.16495 16.49505 0 0.17 6.63 0.17 0.099307 9.930093 0.17 6.63 0.10009 10.09901 0
0.17 0.17 0.1649::> 16.49505 0 0.17 6.8 0.17 0.097624 9.762376 0.17 6. 0.099307 9.930693 0 0.17 0.17 0.16495 16.49:;05 0 0.17 6.97 0.17 0.095941 9.594059 0.17 6.97 0.097624 9.762376 0
0.17 0.17 0.16495 16.49505 0 0.17 7.14 0.17 0.094257 9.425743 0.17 7.14 0.09594 1 9.594059 0
0.17 0.1 7 0.16495 16.49505 0 0.17 7.31 0.17 0.092574 9.257426 0.17 7.31 0.094257 9.425743 0
0.17 0.17 0.16495 16.49505 0 0.17 7.4 0.17 0.090o91 9.089109 0.17 7.48 0.092574 9.257426 0 0.17 0.1 7 0.16495 16.49505 0 0.17 7.65 0.17 0.089208 8.920792 0.17 7.65 0.090891 9.089109 0
0.17 0.17 0.16495 16.49505 0 0.17 7.82 0.17 0.087525 8.752H5 0.17 7.82 0.089208 8.920792 0
0.17 0.1 7 0.16495 16.49505 0 0.17 7.99 0.17 0.085842 8.584158 0.17 7.99 0.087525 8.752475 0
0.17 0.1 7 0.16495 16.49505 0 0.17 .16 0.17 0.084158 8.415842 0.17 .16 0.0858 2 8.584158 0
0.13 0.17 0.165347 16.534653 0 0.13 6.37 0.17 0.102277 10.227723 0.13 6.37 0.004356 6.435().14 0
0.13 0.17 0.165347 16.534653 0 0.13 6.5 0.17 0.10099 10.09901 0.13 6.5 0.003009 6.300931 0
0.13 0.1 7 0.165347 16.534653 0 0.13 6.63 0.17 0.099703 9.970297 0.13 6.63 0.0017 2 6.1 78218 0
0.13 0.1 7 0.165347 16.534653 0 0.13 6.76 0.17 0.09 416 9.84 1584 0.13 6.76 0.006495 6.049505 0
0.13 0.1 7 0.165347 16.53.1653 0 0.13 6. 9 0.17 0.097129 9.712 71 0.13 6. 9 0.059208 5.920792 0
0.13 0.1 7 0.165347 16.534653 0 0.13 7.02 0.17 0.095842 9.584158 0.13 7.02 0.057921 5.792079 0
0.13 0.1 7 0.165347 16.534653 0 0.13 7.15 0.17 0.09 554 9.455446 0.13 7.15 0.05663 5.663366 0
0.13 0.1 7 0.165347 16.534653 0 0.13 7.2 0.17 0.093267 9.326733 0.13 7.2 0.055.3-17 5.53-1653 0
0.13 0.1 7 0.165347 16.534653 0 0.13 7.41 0.17 0.09198 9.19802 0.13 7.41 0.054059 5.405941 0
0.13 0.17 0.165347 16.534653 0 0.13 7.54 0.17 0.090693 9.009307 0.13 7.54 0.052772 5.277228 0
0.13 0.17 0.165347 16.534653 0 0.13 7.67 0.17 0.089400 8.940594 0.13 7.67 0.051485 5.148515 0
0.13 0.1 7 0.165347 16.534653 0 0.13 7 0.17 0.0 119 . I I I 0.13 7. 0.05019 5.019802 0
0.132 95 0.1 7 0.165318 16.531787 0 0.132895 8.100579 0.17 0.085055 .505472 0.132895 8.100579 0.05 5 0
0.136486 0.1 7 0.1652 2 16.528231 0 0.1364 6 8.462162 0.17 0.0 1499 .149 53 0.13()4 6 .462162 0.05 5 0
0.140278 0.1 7 0.165245 16.524477 0 0.140"278 8.8375 0.17 0.077745 7.774477 0.140278 8.8375 0.05 0
0.144286 0.1 7 0.165205 16.520509 0 0.144286 9.234286 0.17 0.073777 7.377652 0.144286 9.234286 0.05 0
0.148529 0.1 7 0.165163 16.516308 0 0.148529 9.654-112 0.17 0.069575 6.957484 0.148529 9.654412 0.05 0 0.15303 0.1 7 0.1651 19 16.511851 0 0.15303 10.1 0.17 0.065119 6.51 1 51 0.15303 10.1 0.05 0
0.157812 0.1 7 0.165071 16.507116 0 0.157812 10.573437 0.17 0.060384 6.038366 0.157 1 2 10.573437 0.05 0
0.162903 0.17 0.165021 16.502076 0 0.162903 11.077419 0.17 0.055343 5.534334 0.162903 11.077419 0.05 0
0.168333 0.170034 0.164967 16.496666 0 0.168333 11.615 0.170034 0.05 5 0.168333 11.615 0.05 0

68
7 References
Ahmadi, R., and Wang, R. H. (1999). Managing development risk in product
design processes. Operations Research, 47(2): 235-46.
AitSahlia, F., Johnson, E., and Will, P. (1995). Is concurrent engineering always a
sensible proposition?. , IEEE Transactions on Engineering Management,42(2):166-70.
Andrezak, M. and Schiffer, B. (2010). Kanban and Technical Excellence or: Why
Daily Releases Are a Great Objective to Meet. In Lean Enterprise Software and Systems.
115-17. Springer Berlin Heidelberg.
Schulze, A., and Störmer, T. (2012). Lean product development–enabling
management factors for waste elimination. International Journal of Technology
Management, 57(1): 71-91.
Beauregard, Y., Bhuiyan, N., and Thomson, V. (2011). Post-Certification
Engineering Taxonomy and Task Value Optimization in the Aerospace Industry.
Engineering Management Journal, 23(1).
Beauregard, Y., Thomson, V., and Bhuiyan, N. (2008). Lean engineering
logistics: load leveling of design jobs with capacity considerations. Canadian
Aeronautics and Space Journal, 54(2):19-30.
69
Bhat, U. N. (2008). An introduction to queueing theory: modeling and analysis in
applications. Springer.
Bhuiyan, N., Gerwin, D., and Thomson, V. (2004). Simulation of the new
product development process for performance improvement. Management Science,
50(12):1690–1703.
Bohn, R. E. and Jaikumar, R. (2000). Firefighting by Knowledge Workers.
Information Storage Industry Center, Graduate School of International Relations and
Pacific Studies, University of California.
Browning, T. R. (2000). Value-based product development: refocusing lean. In
Proceedings of the 2000 IEEE Engineering Management Society, 2000., 168–72. IEEE.
Browning, T. R. (2003). On customer value and improvement in product
development processes. Systems Engineering, 6(1): 49–61.
Browning, T. R., and Eppinger, S. D. (2002). Modeling impacts of process
architecture on cost and schedule risk in product development. Engineering Management,
IEEE Transactions on, 49(4): 428-42.
Browning, T. R., and Ramasesh, R. V. (2007). A Survey of Activity Network‐
70
Based Process Models for Managing Product Development Projects. Production and
Operations Management, 16(2): 217-40.
Clark, K. B., and Fujimoto, T. (1991). Product development process. Harvard
Business School Press, Boston, MA.
Conway, R., Maxwell, W. and Miller, L. (2012). Theory of Scheduling. Dover
Books on Computer Science. Dover Publications.
Epema, D. H., Livny, M., van Dantzig, R., Evers, X. and Pruyne, J. (1996). A
worldwide flock of Condors: Load sharing among workstation clusters. Future
Generation Computer Systems, 12(1): 53-65.
Eppinger, S. D. (2001). Innovation at the speed of information. Harvard Business
Review, 79(1):149–58.
Felekoglu, B., Maier, A. M., and Moultrie, J. (2013). Interactions in new product
development: How the nature of the NPD process influences interaction between teams
and management. Journal of Engineering and Technology Management, 30(4): 384-401.
Felekoglu, B., and Moultrie, J. (2014). Top Management Involvement in New
Product Development: A Review and Synthesis. Journal of Product Innovation
Management, 31(1): 159-75.

71
Gmelin, H., and Seuring, S. (2014). Determinants of a sustainable new product
development. Journal of Cleaner Production, 69: 1-9.
Griffin, A. and Somermeyer, S. (2007). The PDMA toolbook 3 for new product
development. Wiley Online Library.
Gudem, M., Steinert, M., Welo, T., and Leifer, L. (2013). Redefining customer
value in lean product development design projects. Journal of Engineering, Design and
Technology, 11(1): 71-89.
Hayes, J. F. and Babu, T. V. G. (2004). Modeling and analysis of
telecommunications networks. John Wiley & Sons.
Holmdahl, L. (2010). Lean Product Development Pa Svenska. Stromia
Digitaltryck, 15th edition.
Holweg, M. (2007). The genealogy of lean production. Journal of Operations
Management, 25(2): 420-37.
IndustryCanada (2010a). Product design research and development, Retrieved
25/05/2014.http://www.ic.gc.ca/eic/site/dsib-dsib.nsf/eng/oq01801.html.
72
IndustryCanada (2010b). State of design:the Canadian report 2010. Retrieved
25/05/2014. http://www.ic.gc.ca/eic/site/dsib-dsib.nsf/eng/oq01777.html.
Kendall, M. G. and Buckland, W. R. (1957). A dictionary of statistical terms. A
dictionary of statistical terms.
Kerga, E., Rossi, M., Taisch, M., and Terzi, S. (2011). Lean product
development:a learning kit. In proceedings of the SIG workshop IFIP GaLA Workshop:
Co-Designing Serious Games, 55–65.
Kirner, K. G.M, Siyam, G. I., Lindemann, U., Wynn, D. C., and Clarkson, P. J.
(2013). Information in Lean Product Development: Assessment of Value and Waste. In
ICoRD'13, 809-819. Springer India.
Krafcik, J. F. (1988). Triumph of the lean production system. Sloan Management
Review, 30(1):41–52.
Krieg, G. N. (2005 Krieg, G. N. (2005). Kanban-controlled manufacturing
systems. Vol. 549. Springer.
Leiponen, A. (2006). Managing knowledge for innovation: The case of
business-to-business services. Journal of Product Innovation Management, 23(3):238–
258.
73
León, H., and Farris, J. A. (2011). Lean Product Development Research: Current
State and Future Directions. Engineering Management Journal, 23(1): 29-51.
Liker, J. K. (1997). Becoming lean: Inside stories of US manufacturers.
Productivity Press.
Lin, J., Qian, Y., and Cui, W. (2012). Managing the concurrent execution of
dependent product development stages. Engineering Management, IEEE Transactions,
59(1):104–14.
Lindlöf, L., Söderberg, B., and Persson, M. (2013). Practices supporting
knowledge transfer–an analysis of lean product development. International Journal of
Computer Integrated Manufacturing, 26(12): 1128-35.
Little, J. D. and Graves, S. C. (2008). Little's law. In Building Intuition.81-100.
Springer US.
Loch, C., and Kavadias, S. (Eds.). (2008). Handbook of new product development
management. Routledge.
McManus, H., Haggerty, A., and Murman, E. (2005). Lean engineering: Doing
the right thing right. In Proceedings of the 1st international conference on innovation and
74
integration in aerospace sciences, Queen's University Belfast, Northern Ireland. UK
2005
McManus, H. L., Product Development Value Stream Mapping (PDVSM)
Manual, Release 1.0, MIT Lean Aerospace Initiative, September 2005.
Mihm, J., Loch, C., and Huchzermeier, A. (2003). Problem–Solving Oscillations
in Complex Engineering Projects. Management Science, 49(6): 733-50.
Morgan, J. M. and Liker, J. K. (2006). The Toyota product development system.
Productivity Press New York.
Munthe, C. I., Uppvall, L., Engwall, M., and Dahlén, L. (2014). Dealing with the
devil of deviation: managing uncertainty during product development execution. R&D
Management, 44(2), 203-16.
Murman, E. M. (2002). Lean enterprise value: insights from MIT's lean
aerospace initiative. Palgrave Macmillan.
Nepal, B. P., Yadav, O. P., and Solanki, R. (2011). Improving the npd process
by applying lean principles: A case study. Engineering Management Journal, 23:65 – 81.
Nightingale, D., Abdimomunova, L., Shields, T., Perkins, L. N., Srinivasan, J.,

75
and Valerdi, R. (2012). LAI Self Assessment Tool. LAI releases, LESAT 2.0. Retrieved
25/5/2014, http://hdl.handle.net/1721.1/84688, 2012
Oehmen, J. and Rebentisch, E. (2010). Waste in lean product development. In
LAI Paper Series: “Lean Product Development for Practitioners”. Massachusetts
Institute of Technology.
Oehmen, J., Oppenheim, B.W., Secor, D., Norman, E., Rebentisch, E., Sopko,
J.A., Steuber, M., Dove, R., Moghaddam, K., McNeal, S., Bowie, M., Ben-Daya, M.,
Altman, W., and Driessnack, J., 2012. The Guide to Lean Enablers for Managing
Engineering Programs. Joint MIT-PMI-INCOSE Community of Practice on Lean in
Program Management, Cambridge, MA.
Oppenheim, B. W. (2004). Lean product development flow. Systems Engineering,
7(4): 352-76.
Oppenheim, B. W. (2011) Development of Lean Enablers for Systems
Engineering (LEfSE), In Lean for Systems Engineering with Lean Enablers for Systems
Engineering, John Wiley & Sons, Inc., Hoboken, NJ, USA.
Rebentisch, E., and McManus, H. (2007). Tutorial on Lean PD. Massachusetts
Institute of Technology, Lean Advancement Initiative, Cambridge, MA.
Reinertsen, D. G. (2009). The Principles of Product Development Flow: Second

76
Generation Lean Product Development. Celeritas Publishing.
Ringen, G., and Holtskog, H. (2013). How enablers for lean product development
motivate engineers. International Journal of Computer Integrated Manufacturing,
26(12): 1117-27.
Rossi, M., Taisch, M., and Terzi, S. (2012). Lean product development: A
five-steps methodology for continuous improvement. In Engineering, Technology and
Innovation (ICE), 2012 18th International ICE Conference on, 1–10.
Rother, M. and Shook, J. (2003). Learning to See: Value Stream Mapping to Add
Value and Eliminate Muda. Lean Enterprise Institute.
Siyam, G., Kirner, K., Wynn, D., U.Lindemann, and Clarkson, P. (2012a).
Relating value methods to waste types in lean product development. In Proceedings of
DESIGN 2012, the 12th International Design Conference, Dubrovnik, Croatia.
Siyam, G. I., Kirner, K. G. M., Wynn, D. C., Lindemann, U., Wynn, D. C., and
Clarkson, P. J. (2012). Value and waste dependencies and guidelines. In 14th
international DSM conference (DSM2012), Kyoto, Japan.
Smith, R. P. and Eppinger, S. D. (1997). A predictive model of sequential
iteration in engineering design. Management Science, 43(8): 1104-20.

77
Smith, P. G. and Reinertsen, D. G. (1991). Developing products in half the time.
Van Nostrand Reinhold New York.
Stewart, W. J. (2009). Probability, Markov chains, queues, and simulation: the
mathematical basis of performance modeling. Princeton University Press.
Stidham Jr, S. (2009). Optimal design of queueing systems. CRC Press.
Tsung, K. Y., Ping-Hong, K., and Chia-Wen, Y. (2010). Modelling concurrent
workflow for new product development management. In Management of Innovation and
Technology (ICMIT), 2010 IEEE International Conference on, 474–79, IEEE.
Tzokas, N., Hultink, E. J., and Hart, S. (2004). Navigating the new product
development process. Industrial Marketing Management, 33(7):619–26.
Ulrich, K. and Eppinger, S. (2012). Product Design and Development. Business
And Economics, 5 edition.
Wheelwright, S. C. (1992). Revolutionizing product development: quantum leaps
in speed, efficiency, and quality. Simon and Schuster.
Wheelwright, S. C., and Clark, K. B. (1994). Accelerating the design-build-test
cycle for effective product development. International Marketing Review, 11(1): 32-46.

78
Womack, J. P. and Jones, D. T. (2003). Lean Thinking: Banish Waste and Create
Wealth in Your Corporation. Free Press, 2nd edition.
Womack, J., Jones, D., and Roos, D. (1990). The machine that changed the world.
New York: Rawson Associates.
Yassine, A., Joglekar, N., Braha, D., Eppinger, S., and Whitney, D. (2003).
Information hiding in product development: The design churn effect. Research in
Engineering Design, 14(3): 145-61.


![08 Queueing Models.ppt [Kompatibilitätsmodus] ... KeyelementsofqueueingsystemsKey elements of queueing systems ... • Customer is pendingwhen the customer is outside the queueing](https://img.pdfslide.us/doc/110x75/5b236bc17f8b9a92298b6c18/08-queueing-kompatibilitaetsmodus-keyelementsofqueueingsystemskey-elements.jpg)