Embed Size (px)
Citation preview
Abstract—The paper presents a product architecture and
technology selection model applied to product positioning decision
in dynamic business environment. The model underlines the
importance of considering potential alterations of endogenous and
exogenous market factors, namely changes in market regulations
and entry of a new competitor, while making the product
positioning decisions.
Index Terms— Business-to-Business; Competitive Analysis; Multi-
attribute Utility Analysis; Product Architecture;
I. INTRODUCTION
For any firm offering a right set of new products is a key driver
of profitability. “Right” products are the ones that are
appropriately positioned with regard to the latest market trends
and existing or potential competition. Product positioning has
been long viewed as a key marketing activity underlining its
importance for a firm’s strategy in general [1]. The business
environment of every firm is a dynamic system with constantly
changing internal and external factors. Thus, a good product
positioning decision making should anticipate potential
changes and make product architecture (PA) and technology
choices appropriately.
From the microeconomic perspective, the resulting market
equilibrium differs whenever firms consider product
positioning decisions of each other or not [2]. Market analysis,
within a new product development, without considering
competitive responses, generally leads to profit overestimation
and strategic “misses” [4]. Since the beginning of the
millennium more and more researchers advocated the
importance of considering competitive reactions in a new
product development [2-4]. However, the previously published
research on the topic is primarily focused on consumer market.
Moreover, the majority of papers has a descriptive flavor and
can be hardly used in the actual product development scenario
supporting the product positioning decisions.
The current work focuses on business-to-business (B2B)
market for several reasons. First of all, this is the most suitable
environment for “classical” oligopolies. Hence, competitive
analysis is of great value in such arrangement. Secondly, most
Manuscript received March 06, 2013; revised March 06, 2013. This work
was supported in part by Foundation for Science and Technology, Portugal, under the doctoral scholarship grant SFRH / BD / 33750 / 2009.
A. Sabaleuski is with Faculty of Engineering of University of Porto, Porto,
4200-465 Portugal (phone: + 351 22 508 2251; e-mail: [email protected]). F. M. Andrade Pires is with Faculty of Engineering of University of Porto,
Porto, 4200-465 Portugal (e-mail: [email protected]).
P. P. Camanho is with Faculty of Engineering of University of Porto, Porto, 4200-465 Portugal (e-mail: [email protected]).
of the companies are SMEs that are in need of a simple and
straightforward model. Consequently, the main objective of
this paper is to introduce a practical framework to evaluate
technology selection decisions in new product development
under competitive responses in B2B environment.
The paper starts with research contextualization and proceeds
with the model presentation. A case study is presented to
illustrate the most important concepts of the proposed model
and shows how it can be used in actual decision making
scenario. Finally, we discuss how the results of the analysis are
related to existing research on competitive interactions.
II. CONTEXTUALISATION
In this section, we focus on the background of the current
research. We realize that there are three interconnected
domains that are specific to the model. First of all, we discuss
B2B environment and the particular part that we are focusing
on. Secondly, we concentrate on the competitors and their
relationships both with the buyers and each other. Finally, we
explain in detail the link between product position and
manufacturing technologies and make the connection between
the parts.
A. Market Players, segmentation, value functions and
bidding mechanism
The target market is a set of few large OEMs (buyers) that
outsource some of the subassemblies from smaller TIER 1
SMEs (suppliers). The subassemblies are then used to
manufacture the final product that is sold to a final user (end
customers). The total market volume is discretized through
individual projects. Thus, there is no continuous stream of
production, but rather a sequence of individual projects.
B. Negotiation Mechanism
Negotiation between customers and suppliers occurs in the
form of competitive tendering. Each competing supplier is
assumed to be an approved bidder by the buyers. Therefore, for
every upcoming project each supplier receives Request for
Proposals (RFP). Suppliers respond to the RFP with details on
how they would satisfy the buyer’s performance requirements
and the price they would be willing to accept to do so. They
submit their proposals to the customers in the form of sealed
bid auction, which is the most common type for projects
related to public procurement. That is, the suppliers cannot see
the bids of each other and have to anticipate the possible
competitive offerings. The buyer evaluates the bids and offers
the project to the supplier that submitted a proposal with the
Product Architecture and Technology Selection in
Dynamic Business Environment A. Sabaleuski, F. M. Andrade Pires, and P. P. Camanho
Proceedings of the World Congress on Engineering 2013 Vol I, WCE 2013, July 3 - 5, 2013, London, U.K.
ISBN: 978-988-19251-0-7 ISSN: 2078-0958 (Print); ISSN: 2078-0966 (Online)
WCE 2013
highest utility for the buyer. We consider that all buyers have
similar standardized supplier selection procedures.
C. Buyer Value Function
Typically, the buyer makes multi-attribute evaluation of the
received proposals. Together with price, he is looking on
product performance over the number of relevant attributes.
We realize that there are no two buyers with identical product
preferences and each of them sets up product priorities in its
own way. It is typically a result of different business strategies
and internal product/process policies and constraints. Note that
our model focuses on product performance only, i.e. without
taking into account other aspects like, payment terms, etc.
In our model, we make use of multi-attribute utility analysis
(MAUA) in order to estimate the value function of the buyer.
MAUA interviews have to be hold with relevant decision
makers inside a buyer, which is typically a complex
organization. MAUA is used for that step because of several
advantages. First of all, utility analysis measures preference
structure rather than imposing one, which is critical in
communications with new buyers [5]. Secondly, MAUA takes
explicit considerations of decision maker preferences
incorporating risk attitudes [6]. Since decision makers within
the buyers are professionals in their field, it is easier for them
to make more precise utility judgments. Finally, MAUA has
been successfully applied in a similar context [7].
D. Market Segmentation
Every buyer sells the final product to one or more end users.
Whenever there are few big end users or many small ones that
can be effectively clustered, we say that the intersection
between a particular buyer and a cluster of end users forms a
market segment. The difference between the clusters of end
customers can be readily explained through differences in
national regulations. Moreover, the end customers that are big
enough can have considerable negotiation power and their own
restrictions to the products of the suppliers. We assume,
without loss of generality, that the number of projects in the
analysis period is equal to the number of market segments.
E. Product Architectures
House of Quality is a typical tool that helps to transform
market requirements in product functions and evaluate
competing alternatives [10]. As shown in Figure 2 any product
function can be supported by one or the other manufacturing
technology. Various combinations of production technologies
provide different PAs. Different sets of initial product
functions can deliver unlike architectures, since architecture
comprises entities and the structure of relationships and
interfaces between them [11]. Thus, we focus solely on high-
cost impact and high-market impact functions, which are
crucial for the buyers’ perception and competitive
differentiation.
III. PRODUCT ARCHITECTURE AND TECHNOLOGY
SELECTION MODEL
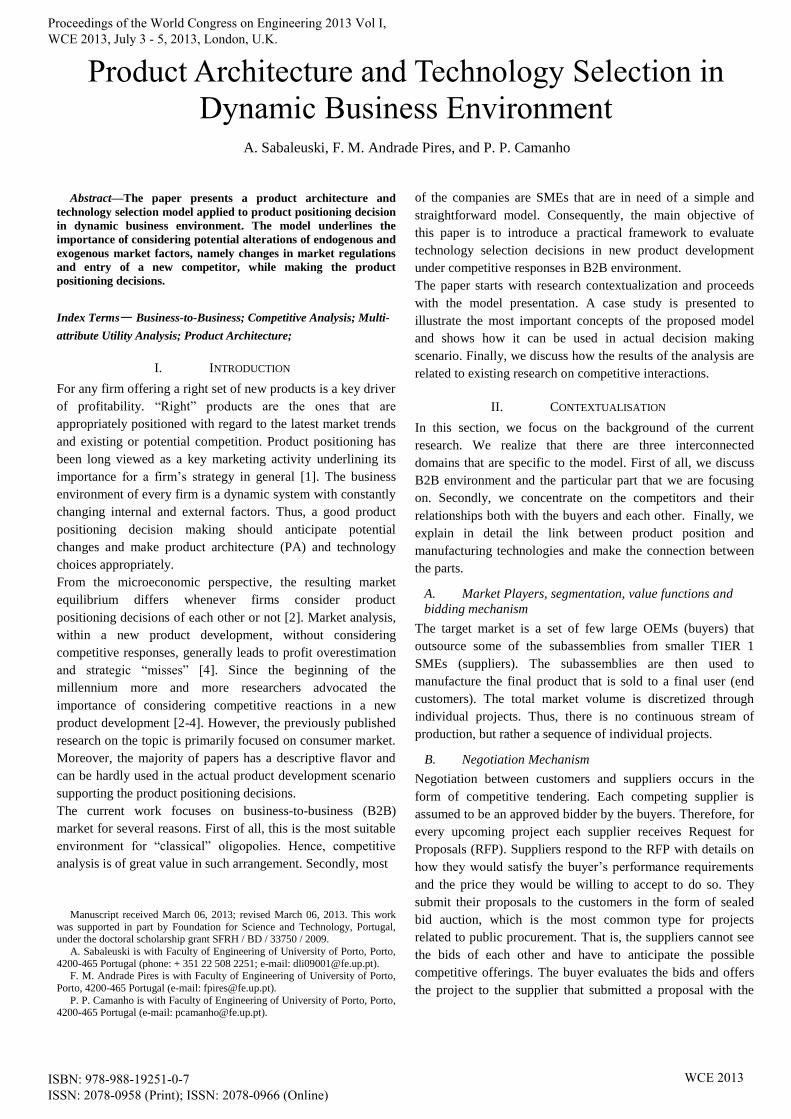
Figure 1 summarizes the model described in a previous section.
It is followed by the mathematical description of the value
functions and decision mechanisms.
Fig. 1. The product architecture and technology selection model
There are bidders (suppliers) approved by buyers on the
market. Each buyer is active in national markets. Suppliers
offer different products to the market by investing in certain
PAs. Buyers make their purchasing decisions looking to
maximize their utility concerning product performance. Both
buyers and suppliers are aware of functional requirements in
different national markets and make their choices rationally.
A. Buyers’ Value Function
Every buyer has product preferences upon product attributes.
Nevertheless, each customer is different from the other
customer with regards to its preferences. Let denote the
weight of attribute for the customer . Each supplier
considers finite number of architecture options . Let
denote performance of architecture on the product attribute
. Subsequently, represents the utility of architecture
for the customer in market
∏
(1)
Power utility functions help to eliminate options that are out of
the product attribute range expected by the buyers. That is, if
any of the attributes exceeds the maximum (minimum)
required level considered by the buyer, its utility automatically
equals to zero.
B. Suppliers’ Value Function
Each supplier on the market is looking to select the PA that
would maximize his profits (single-attribute utility
function). The suppliers select PAs from the pre-existing set of
Proceedings of the World Congress on Engineering 2013 Vol I, WCE 2013, July 3 - 5, 2013, London, U.K.
ISBN: 978-988-19251-0-7 ISSN: 2078-0958 (Print); ISSN: 2078-0966 (Online)
WCE 2013
technology options. Thus, the utility that each supplier offers to
the market is the following:
(2)
When all suppliers make their choices of architecture they form
a portfolio that is available for buyers. By choosing a certain
architecture, the supplier understands that he will be eventually
losing the niches where the chosen architecture performs worse
than other competing architectures.
{
(3)
Total realized profits in the period by supplier :
∑ ∑
(4)
where is the number of end customers on the market and is
the number of buyers on the market.
The profit that the supplier realizes after winning a project in
each market segment is the difference between the price and
variable and fixed product costs:
(5)
where represents the price of product offer of supplier ;
– variable costs of the architecture supplied to national
market ; and defines the fixed costs of architecture .
Fixed costs have two components: product development costs
and production fixed costs. Product development costs are
assumed to be equal for all alternative product architectures.
Secondly, production fixed costs are realized only after the
decision is made and a supplier has been offered a project.
Thus, we disregard fixed costs since they do not play a
strategic role in the PA selection problem.
We employ margin to operationalize the dependence between
profit, price and variable costs. Thus, we re-write the profit and
price functions in the following manner:
(6)
(7)
where denotes the margin level selected by the supplier .
The supplier can select either monopoly or oligopoly level
margin for each market segment.
C. Value Maximization Mechanisms
The profits are characterized by the differences in utility values
of different PAs for different buyers. The oligopoly profits in
this scenario are equal to oligopoly profits in Scenario 1.
However, monopoly profits now depend on the utility
difference between our choice of architecture and competitive
offer.
(
)
(8)
We take first-order condition and optimize the profits of each
individual competitor subjected to its own PA decision and PA
decisions of its competitors.
(9)
The game is at Nash equilibrium (NE) when no player has a
better strategy to play given the strategies of the other players.
In general, monopoly profits are higher than oligopoly profits,
and market players will tend to establish local monopolies
through the choice of PA in the first stage of the game [12]. We
assume that all market suppliers are rational decision makers,
maximizing their profits. Thus, the equilibrium predicted by
the model is stable in new circumstances. Note that we change
only input data on market regulations and the number of
competitors to find out potential equilibria in new
circumstances.
IV. THE EVALUATION CASE ANALYSIS
The case study presented builds up on the ongoing
collaboration with a Portuguese SME looking for a sustainable
market position in European railway interiors market. The
target market has two key buyers that are selling to three end
customers each operating in a different national market. The
national markets are different in terms of regulations applied to
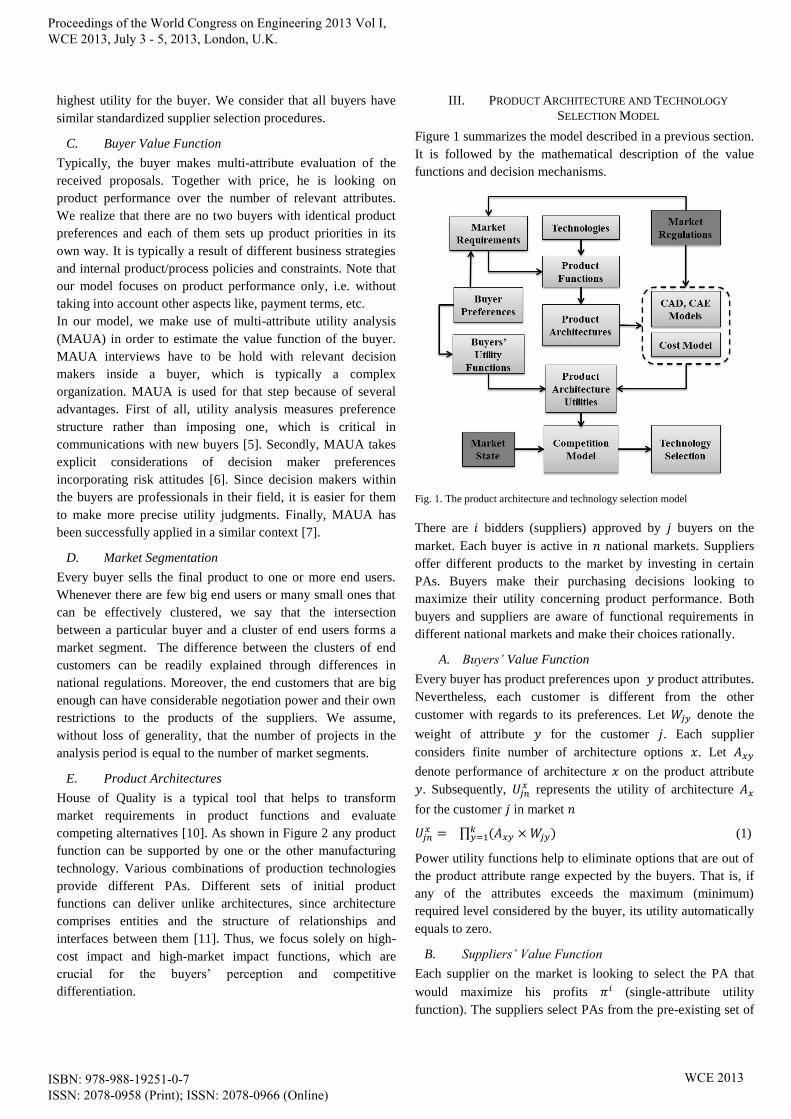
product performance (Figure 2). Thus, there are six business
segments on the market.
Fig. 2. Technology options and market regulations applied to product sub-
assemblies based on functional analysis.
The target product is a seat for regional rail transportation.
Product sub-assemblies are defined by product functions such
as supporting the body and interacting with the body providing
comfort to a passenger. The design of each product sub-
assembly is affected by at least one national standard (Figure
2). Each sub-assembly can be manufactured out of few possible
Proceedings of the World Congress on Engineering 2013 Vol I, WCE 2013, July 3 - 5, 2013, London, U.K.
ISBN: 978-988-19251-0-7 ISSN: 2078-0958 (Print); ISSN: 2078-0966 (Online)
WCE 2013
technology options (Table 1). Foam and Fabric sub-assembly is
assumed to be identical for all possible PAs. There are two
technology options for Product Structure and Rigid Cover
forming four possible PAs.
TABLE 1 PRODUCT ARCHITECTURES IN CASE STUDY
Rigid Cover Product Structure
HSS Laser Cutting Aluminum Extrusion
Mild Steel Stamping Architecture 1 Architecture 3
GFRP Hand Lay-out Architecture 2 Architecture 4
The structural performance of each PA has been verified
through finite element simulation in ABAQUS®. The Fire and
Smoke data is a courtesy of the collaborating company. The
above data was feed into the cost model. Costs were estimated
based on the cost data of the collaborating company and
information received from the potential technology suppliers.
Typical business data, such as margin levels, structural costs,
and interest rates, was obtained through the interviews with the
buyers and prospective competition. Due to differences in the
regulations between national markets of end customers each
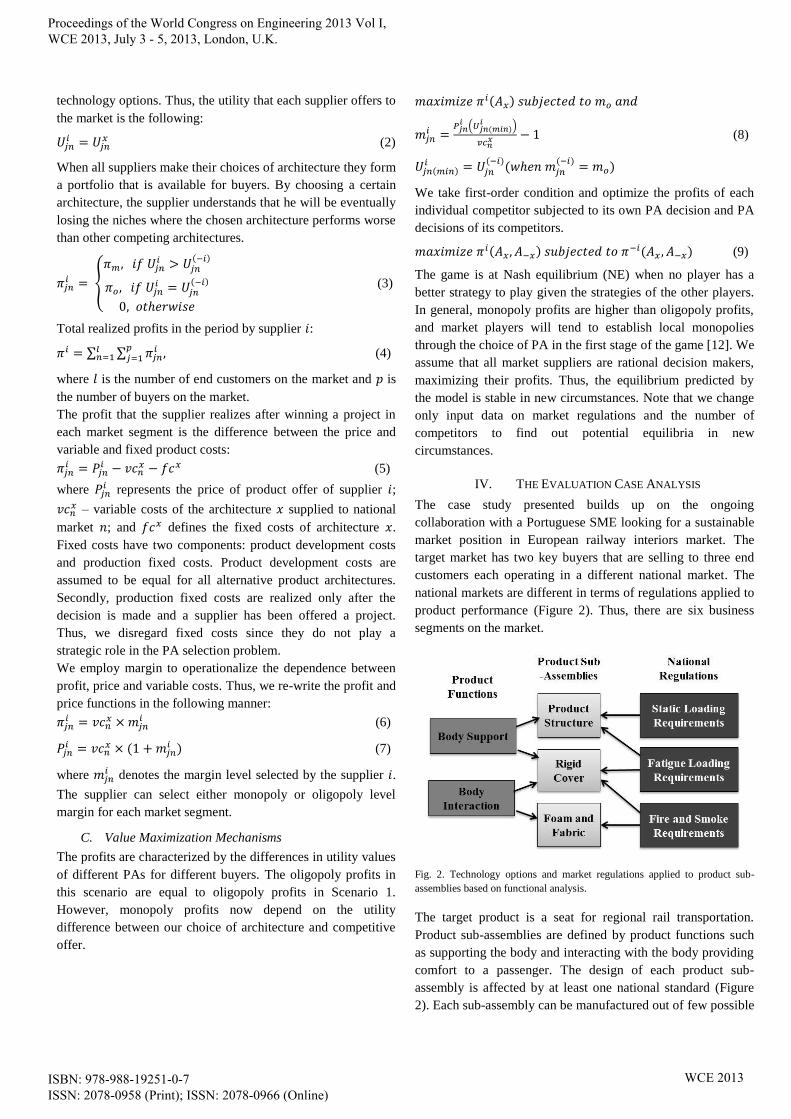
PA can have different performance (Figure 3).
Fig. 3. Performance of technology options before new regulations.
The national market of end customer 2 has the strictest Static
and Fatigue Loading Requirements, while national markets of
end customers 1 and 3 are stricter in terms of Fire and Smoke
Requirements with end customer 3 being the strictest.
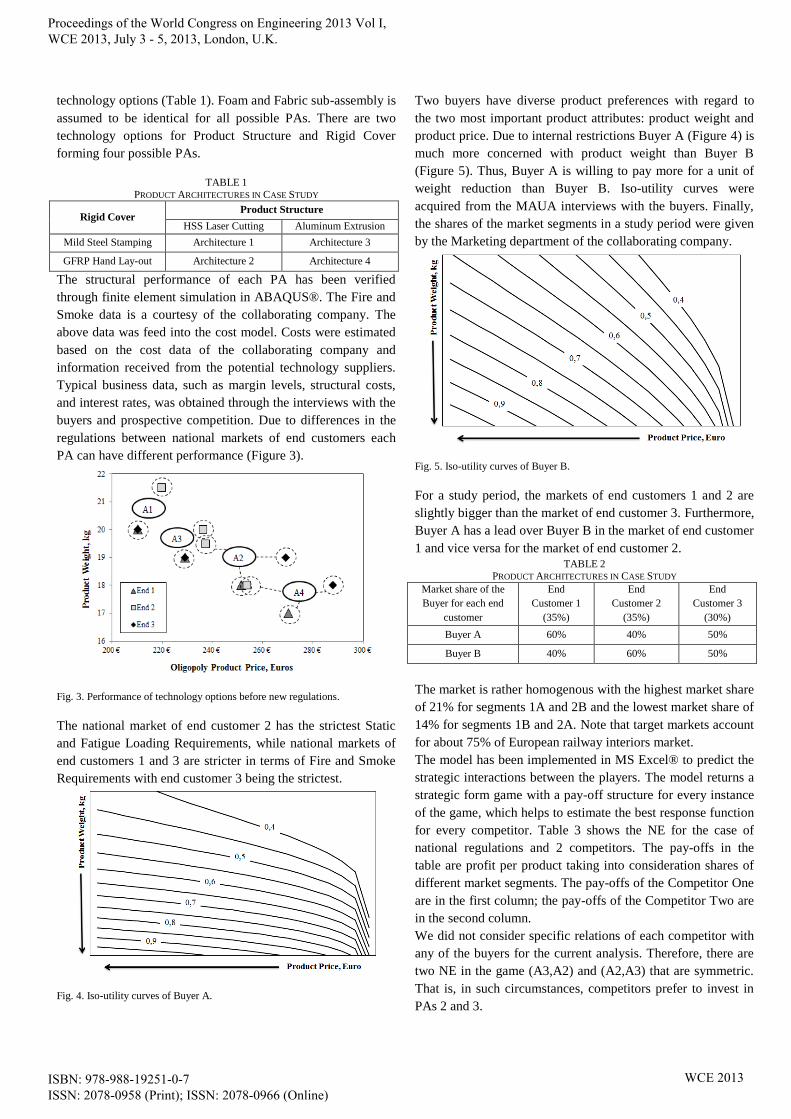
Fig. 4. Iso-utility curves of Buyer A.
Two buyers have diverse product preferences with regard to
the two most important product attributes: product weight and
product price. Due to internal restrictions Buyer A (Figure 4) is
much more concerned with product weight than Buyer B
(Figure 5). Thus, Buyer A is willing to pay more for a unit of
weight reduction than Buyer B. Iso-utility curves were
acquired from the MAUA interviews with the buyers. Finally,
the shares of the market segments in a study period were given
by the Marketing department of the collaborating company.
Fig. 5. Iso-utility curves of Buyer B.
For a study period, the markets of end customers 1 and 2 are
slightly bigger than the market of end customer 3. Furthermore,
Buyer A has a lead over Buyer B in the market of end customer
1 and vice versa for the market of end customer 2. TABLE 2
PRODUCT ARCHITECTURES IN CASE STUDY
Market share of the
Buyer for each end
customer
End
Customer 1
(35%)
End
Customer 2
(35%)
End
Customer 3
(30%)
Buyer A 60% 40% 50%
Buyer B 40% 60% 50%
The market is rather homogenous with the highest market share
of 21% for segments 1A and 2B and the lowest market share of
14% for segments 1B and 2A. Note that target markets account
for about 75% of European railway interiors market.
The model has been implemented in MS Excel® to predict the
strategic interactions between the players. The model returns a
strategic form game with a pay-off structure for every instance
of the game, which helps to estimate the best response function
for every competitor. Table 3 shows the NE for the case of
national regulations and 2 competitors. The pay-offs in the
table are profit per product taking into consideration shares of
different market segments. The pay-offs of the Competitor One
are in the first column; the pay-offs of the Competitor Two are
in the second column.
We did not consider specific relations of each competitor with
any of the buyers for the current analysis. Therefore, there are
two NE in the game (A3,A2) and (A2,A3) that are symmetric.
That is, in such circumstances, competitors prefer to invest in
PAs 2 and 3.
Proceedings of the World Congress on Engineering 2013 Vol I, WCE 2013, July 3 - 5, 2013, London, U.K.
ISBN: 978-988-19251-0-7 ISSN: 2078-0958 (Print); ISSN: 2078-0966 (Online)
WCE 2013
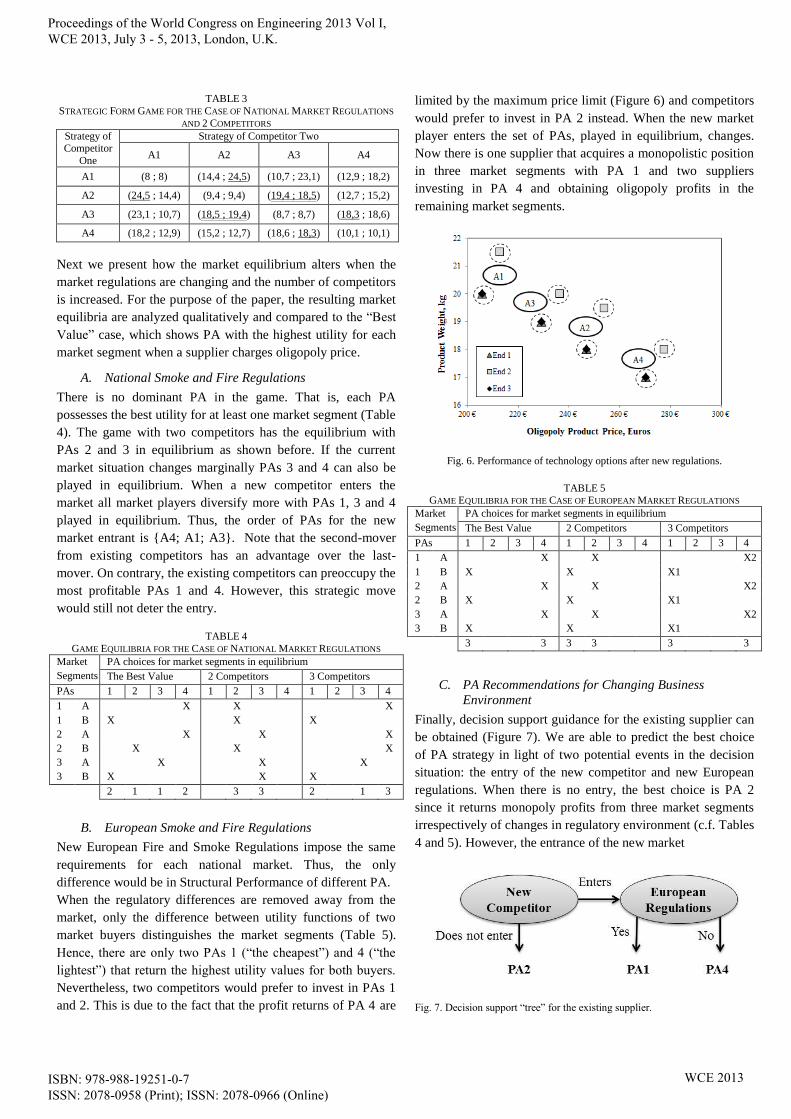
TABLE 3
STRATEGIC FORM GAME FOR THE CASE OF NATIONAL MARKET REGULATIONS
AND 2 COMPETITORS
Strategy of Competitor
One
Strategy of Competitor Two
A1 A2 A3 A4
A1 (8 ; 8) (14,4 ; 24,5) (10,7 ; 23,1) (12,9 ; 18,2)
A2 (24,5 ; 14,4) (9,4 ; 9,4) (19,4 ; 18,5) (12,7 ; 15,2)
A3 (23,1 ; 10,7) (18,5 ; 19,4) (8,7 ; 8,7) (18,3 ; 18,6)
A4 (18,2 ; 12,9) (15,2 ; 12,7) (18,6 ; 18,3) (10,1 ; 10,1)
Next we present how the market equilibrium alters when the
market regulations are changing and the number of competitors
is increased. For the purpose of the paper, the resulting market
equilibria are analyzed qualitatively and compared to the “Best
Value” case, which shows PA with the highest utility for each
market segment when a supplier charges oligopoly price.
A. National Smoke and Fire Regulations
There is no dominant PA in the game. That is, each PA
possesses the best utility for at least one market segment (Table
4). The game with two competitors has the equilibrium with
PAs 2 and 3 in equilibrium as shown before. If the current
market situation changes marginally PAs 3 and 4 can also be
played in equilibrium. When a new competitor enters the
market all market players diversify more with PAs 1, 3 and 4
played in equilibrium. Thus, the order of PAs for the new
market entrant is {A4; A1; A3}. Note that the second-mover
from existing competitors has an advantage over the last-
mover. On contrary, the existing competitors can preoccupy the
most profitable PAs 1 and 4. However, this strategic move
would still not deter the entry.
TABLE 4
GAME EQUILIBRIA FOR THE CASE OF NATIONAL MARKET REGULATIONS
Market
Segments
PA choices for market segments in equilibrium
The Best Value 2 Competitors 3 Competitors
PAs 1 2 3 4 1 2 3 4 1 2 3 4
1 A X X X
1 B X X X
2 A X X X
2 B X X X
3 A X X X
3 B X X X
2 1 1 2 3 3 2 1 3
B. European Smoke and Fire Regulations
New European Fire and Smoke Regulations impose the same
requirements for each national market. Thus, the only
difference would be in Structural Performance of different PA.
When the regulatory differences are removed away from the
market, only the difference between utility functions of two
market buyers distinguishes the market segments (Table 5).
Hence, there are only two PAs 1 (“the cheapest”) and 4 (“the
lightest”) that return the highest utility values for both buyers.
Nevertheless, two competitors would prefer to invest in PAs 1
and 2. This is due to the fact that the profit returns of PA 4 are
limited by the maximum price limit (Figure 6) and competitors
would prefer to invest in PA 2 instead. When the new market
player enters the set of PAs, played in equilibrium, changes.
Now there is one supplier that acquires a monopolistic position
in three market segments with PA 1 and two suppliers
investing in PA 4 and obtaining oligopoly profits in the
remaining market segments.
Fig. 6. Performance of technology options after new regulations.
TABLE 5 GAME EQUILIBRIA FOR THE CASE OF EUROPEAN MARKET REGULATIONS
Market
Segments
PA choices for market segments in equilibrium
The Best Value 2 Competitors 3 Competitors
PAs 1 2 3 4 1 2 3 4 1 2 3 4
1 A X X X2
1 B X X X1
2 A X X X2
2 B X X X1
3 A X X X2
3 B X X X1
3 3 3 3 3 3
C. PA Recommendations for Changing Business
Environment
Finally, decision support guidance for the existing supplier can
be obtained (Figure 7). We are able to predict the best choice
of PA strategy in light of two potential events in the decision
situation: the entry of the new competitor and new European
regulations. When there is no entry, the best choice is PA 2
since it returns monopoly profits from three market segments
irrespectively of changes in regulatory environment (c.f. Tables
4 and 5). However, the entrance of the new market
Fig. 7. Decision support “tree” for the existing supplier.
Proceedings of the World Congress on Engineering 2013 Vol I, WCE 2013, July 3 - 5, 2013, London, U.K.
ISBN: 978-988-19251-0-7 ISSN: 2078-0958 (Print); ISSN: 2078-0966 (Online)
WCE 2013
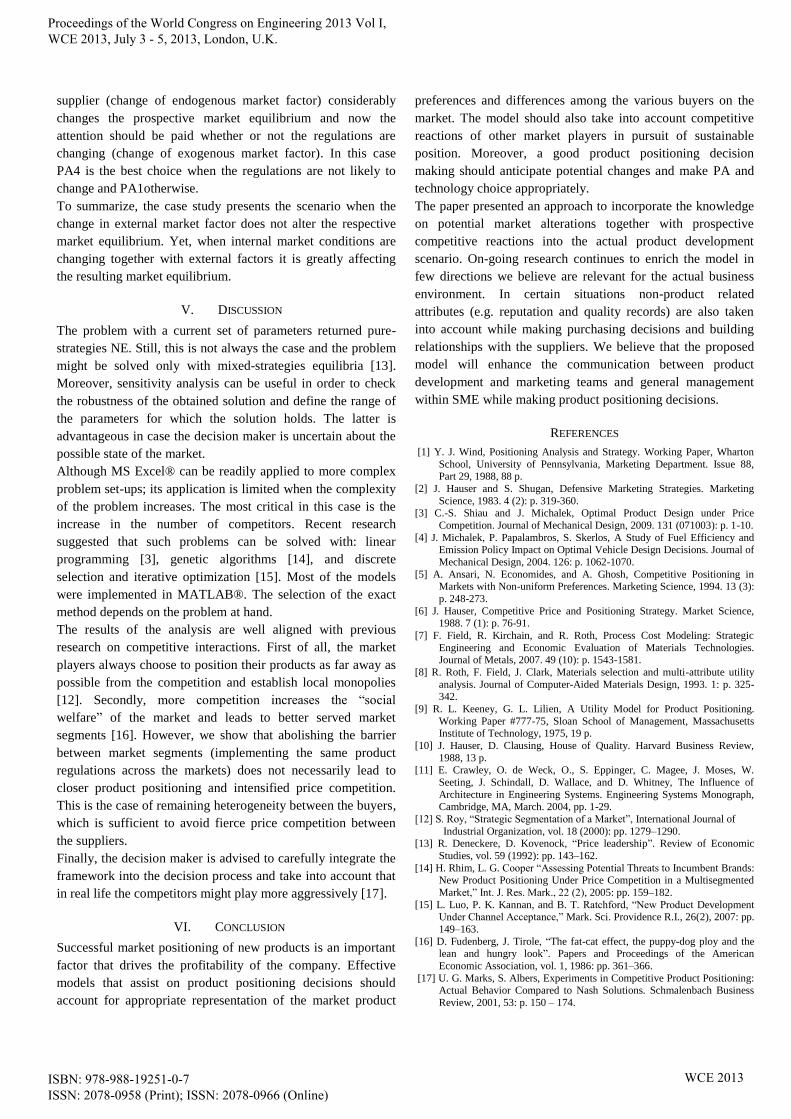
supplier (change of endogenous market factor) considerably
changes the prospective market equilibrium and now the
attention should be paid whether or not the regulations are
changing (change of exogenous market factor). In this case
PA4 is the best choice when the regulations are not likely to
change and PA1otherwise.
To summarize, the case study presents the scenario when the
change in external market factor does not alter the respective
market equilibrium. Yet, when internal market conditions are
changing together with external factors it is greatly affecting
the resulting market equilibrium.
V. DISCUSSION
The problem with a current set of parameters returned pure-
strategies NE. Still, this is not always the case and the problem
might be solved only with mixed-strategies equilibria [13].
Moreover, sensitivity analysis can be useful in order to check
the robustness of the obtained solution and define the range of
the parameters for which the solution holds. The latter is
advantageous in case the decision maker is uncertain about the
possible state of the market.
Although MS Excel® can be readily applied to more complex
problem set-ups; its application is limited when the complexity
of the problem increases. The most critical in this case is the
increase in the number of competitors. Recent research
suggested that such problems can be solved with: linear
programming [3], genetic algorithms [14], and discrete
selection and iterative optimization [15]. Most of the models
were implemented in MATLAB®. The selection of the exact
method depends on the problem at hand.
The results of the analysis are well aligned with previous
research on competitive interactions. First of all, the market
players always choose to position their products as far away as
possible from the competition and establish local monopolies
[12]. Secondly, more competition increases the “social
welfare” of the market and leads to better served market
segments [16]. However, we show that abolishing the barrier
between market segments (implementing the same product
regulations across the markets) does not necessarily lead to
closer product positioning and intensified price competition.
This is the case of remaining heterogeneity between the buyers,
which is sufficient to avoid fierce price competition between
the suppliers.
Finally, the decision maker is advised to carefully integrate the
framework into the decision process and take into account that
in real life the competitors might play more aggressively [17].
VI. CONCLUSION
Successful market positioning of new products is an important
factor that drives the profitability of the company. Effective
models that assist on product positioning decisions should
account for appropriate representation of the market product
preferences and differences among the various buyers on the
market. The model should also take into account competitive
reactions of other market players in pursuit of sustainable
position. Moreover, a good product positioning decision
making should anticipate potential changes and make PA and
technology choice appropriately.
The paper presented an approach to incorporate the knowledge
on potential market alterations together with prospective
competitive reactions into the actual product development
scenario. On-going research continues to enrich the model in
few directions we believe are relevant for the actual business
environment. In certain situations non-product related
attributes (e.g. reputation and quality records) are also taken
into account while making purchasing decisions and building
relationships with the suppliers. We believe that the proposed
model will enhance the communication between product
development and marketing teams and general management
within SME while making product positioning decisions.
REFERENCES
[1] Y. J. Wind, Positioning Analysis and Strategy. Working Paper, Wharton
School, University of Pennsylvania, Marketing Department. Issue 88, Part 29, 1988, 88 p.
[2] J. Hauser and S. Shugan, Defensive Marketing Strategies. Marketing
Science, 1983. 4 (2): p. 319-360. [3] C.-S. Shiau and J. Michalek, Optimal Product Design under Price
Competition. Journal of Mechanical Design, 2009. 131 (071003): p. 1-10.
[4] J. Michalek, P. Papalambros, S. Skerlos, A Study of Fuel Efficiency and Emission Policy Impact on Optimal Vehicle Design Decisions. Journal of
Mechanical Design, 2004. 126: p. 1062-1070.
[5] A. Ansari, N. Economides, and A. Ghosh, Competitive Positioning in Markets with Non-uniform Preferences. Marketing Science, 1994. 13 (3):
p. 248-273.
[6] J. Hauser, Competitive Price and Positioning Strategy. Market Science,
1988. 7 (1): p. 76-91.
[7] F. Field, R. Kirchain, and R. Roth, Process Cost Modeling: Strategic
Engineering and Economic Evaluation of Materials Technologies. Journal of Metals, 2007. 49 (10): p. 1543-1581.
[8] R. Roth, F. Field, J. Clark, Materials selection and multi-attribute utility
analysis. Journal of Computer-Aided Materials Design, 1993. 1: p. 325-342.
[9] R. L. Keeney, G. L. Lilien, A Utility Model for Product Positioning.
Working Paper #777-75, Sloan School of Management, Massachusetts Institute of Technology, 1975, 19 p.
[10] J. Hauser, D. Clausing, House of Quality. Harvard Business Review,
1988, 13 p. [11] E. Crawley, O. de Weck, O., S. Eppinger, C. Magee, J. Moses, W.
Seeting, J. Schindall, D. Wallace, and D. Whitney, The Influence of
Architecture in Engineering Systems. Engineering Systems Monograph, Cambridge, MA, March. 2004, pp. 1-29.
[12] S. Roy, “Strategic Segmentation of a Market”, International Journal of
Industrial Organization, vol. 18 (2000): pp. 1279–1290. [13] R. Deneckere, D. Kovenock, “Price leadership”. Review of Economic
Studies, vol. 59 (1992): pp. 143–162.
[14] H. Rhim, L. G. Cooper “Assessing Potential Threats to Incumbent Brands: New Product Positioning Under Price Competition in a Multisegmented
Market,” Int. J. Res. Mark., 22 (2), 2005: pp. 159–182.
[15] L. Luo, P. K. Kannan, and B. T. Ratchford, “New Product Development Under Channel Acceptance,” Mark. Sci. Providence R.I., 26(2), 2007: pp.
149–163.
[16] D. Fudenberg, J. Tirole, “The fat-cat effect, the puppy-dog ploy and the lean and hungry look”. Papers and Proceedings of the American
Economic Association, vol. 1, 1986: pp. 361–366.
[17] U. G. Marks, S. Albers, Experiments in Competitive Product Positioning: Actual Behavior Compared to Nash Solutions. Schmalenbach Business
Review, 2001, 53: p. 150 – 174.
Proceedings of the World Congress on Engineering 2013 Vol I, WCE 2013, July 3 - 5, 2013, London, U.K.
ISBN: 978-988-19251-0-7 ISSN: 2078-0958 (Print); ISSN: 2078-0966 (Online)
WCE 2013