Embed Size (px)
Citation preview
4643 S Ulster Street | Suite 1040 | Denver, CO 80237 303.694.1900 | innovestinc.com
Product Analysis Search Book
Mid Cap Value
Summer 2017

© 2017 INNOVEST PORTFOLIO SOLUTIONS, LLC
This page left intentionally blank.
2
© 2017 INNOVEST PORTFOLIO SOLUTIONS, LLC
MANAGER SEARCH PROCESS
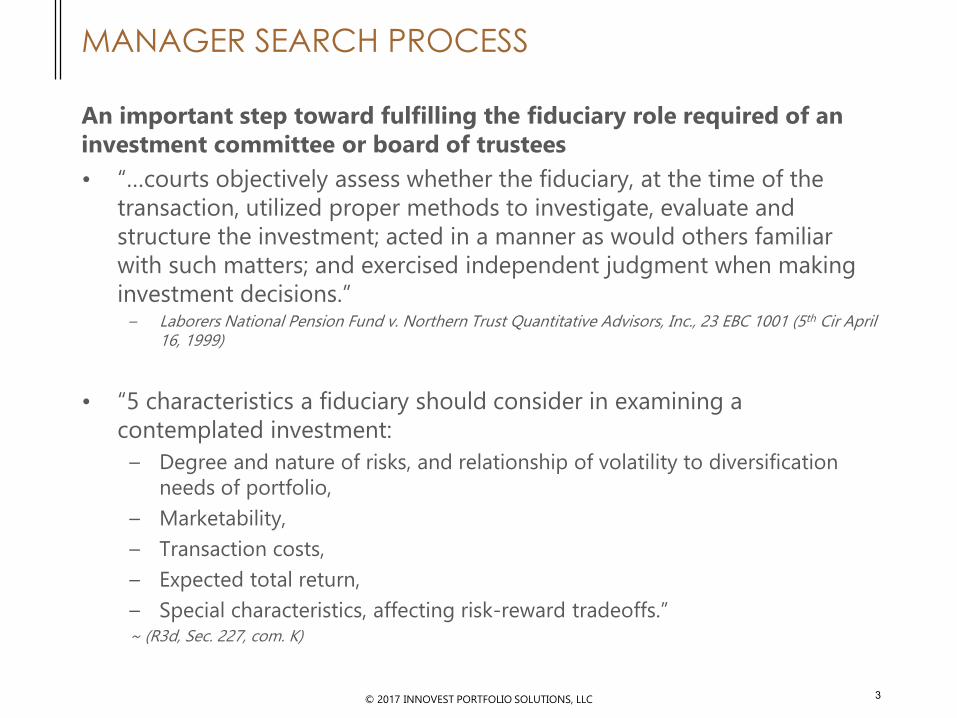
An important step toward fulfilling the fiduciary role required of an
investment committee or board of trustees
• “…courts objectively assess whether the fiduciary, at the time of the
transaction, utilized proper methods to investigate, evaluate and
structure the investment; acted in a manner as would others familiar
with such matters; and exercised independent judgment when making
investment decisions.”– Laborers National Pension Fund v. Northern Trust Quantitative Advisors, Inc., 23 EBC 1001 (5th Cir April
16, 1999)
• “5 characteristics a fiduciary should consider in examining a
contemplated investment:
– Degree and nature of risks, and relationship of volatility to diversification
needs of portfolio,
– Marketability,
– Transaction costs,
– Expected total return,
– Special characteristics, affecting risk-reward tradeoffs.”~ (R3d, Sec. 227, com. K)
3
© 2017 INNOVEST PORTFOLIO SOLUTIONS, LLC
IMPLEMENT WITH HIGH QUALITY, LOW COST
INVESTMENT VEHICLES
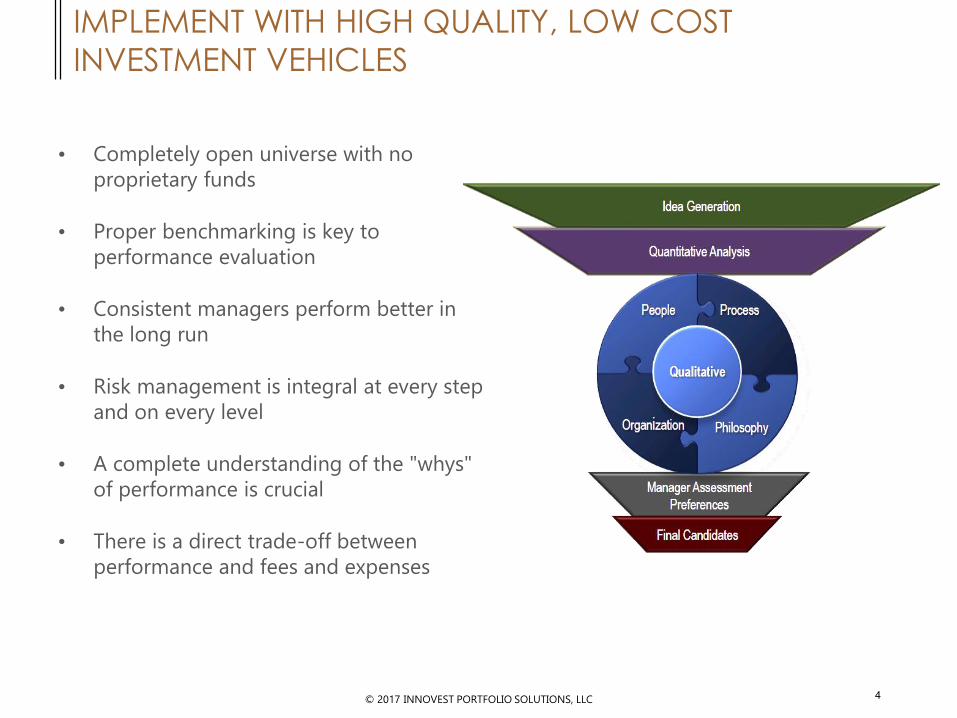
• Completely open universe with no
proprietary funds
• Proper benchmarking is key to
performance evaluation
• Consistent managers perform better in
the long run
• Risk management is integral at every step
and on every level
• A complete understanding of the "whys"
of performance is crucial
• There is a direct trade-off between
performance and fees and expenses
4
© 2017 INNOVEST PORTFOLIO SOLUTIONS, LLC
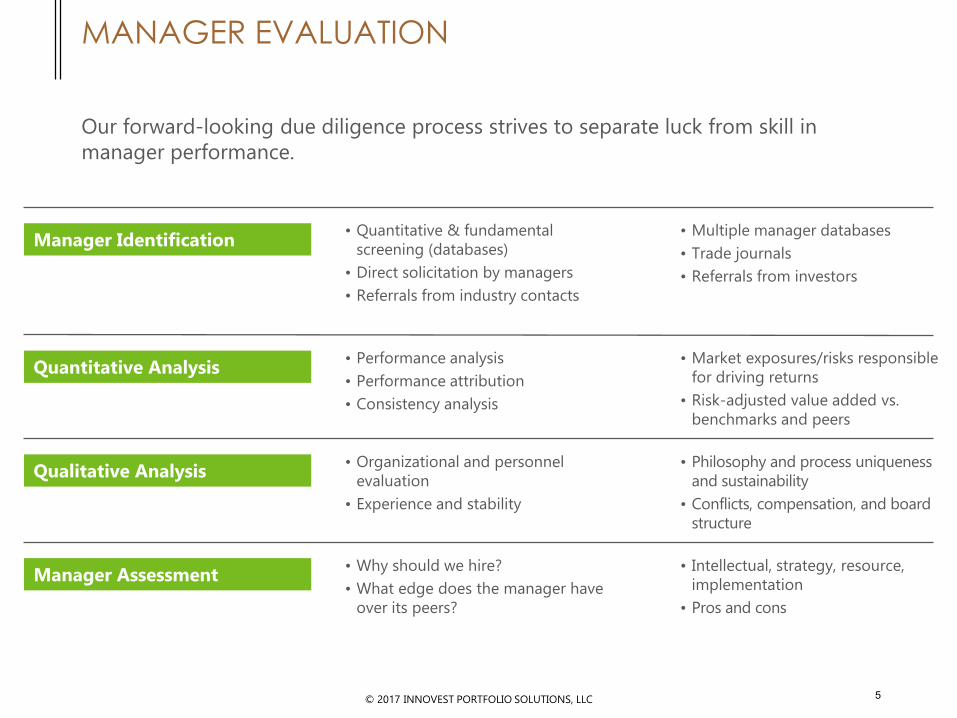
• Quantitative & fundamental
screening (databases)
• Direct solicitation by managers
• Referrals from industry contacts
MANAGER EVALUATION
• Why should we hire?
• What edge does the manager have
over its peers?
• Performance analysis
• Performance attribution
• Consistency analysis
Our forward-looking due diligence process strives to separate luck from skill in
manager performance.
• Multiple manager databases
• Trade journals
• Referrals from investors
• Market exposures/risks responsible
for driving returns
• Risk-adjusted value added vs.
benchmarks and peers
• Organizational and personnel
evaluation
• Experience and stability
• Philosophy and process uniqueness
and sustainability
• Conflicts, compensation, and board
structure
• Intellectual, strategy, resource,
implementation
• Pros and cons
Manager Identification
Quantitative Analysis
Qualitative Analysis
Manager Assessment
5
© 2017 INNOVEST PORTFOLIO SOLUTIONS, LLC
VANGUARD SELECTED VALUE FUND
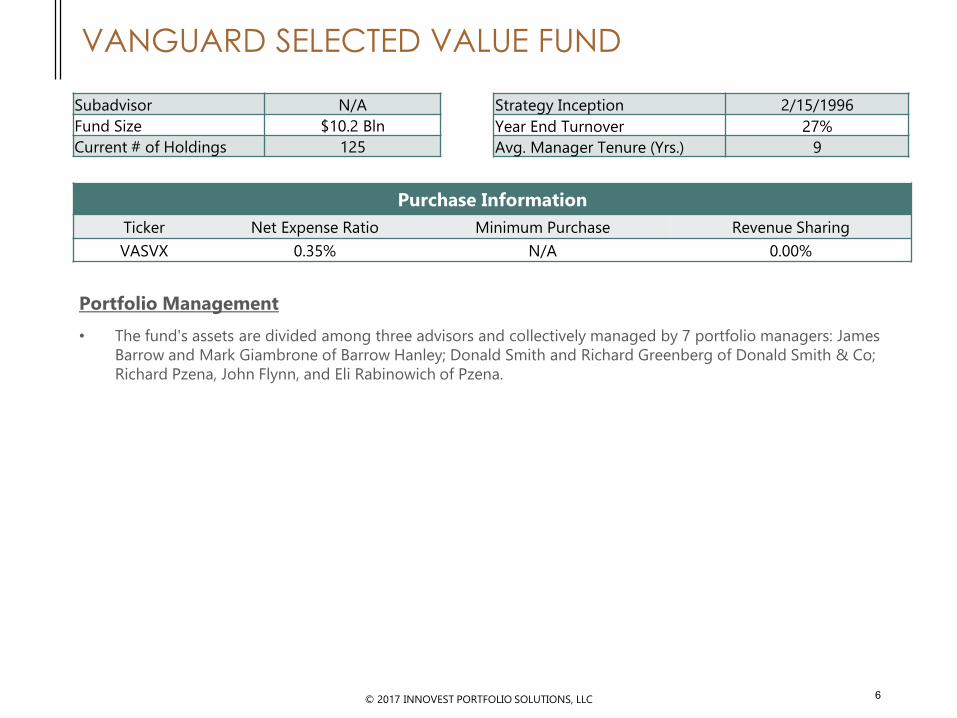
Portfolio Management
• The fund's assets are divided among three advisors and collectively managed by 7 portfolio managers: James
Barrow and Mark Giambrone of Barrow Hanley; Donald Smith and Richard Greenberg of Donald Smith & Co;
Richard Pzena, John Flynn, and Eli Rabinowich of Pzena.
Subadvisor N/A
Fund Size $10.2 Bln
Current # of Holdings 125
Strategy Inception 2/15/1996
Year End Turnover 27%
Avg. Manager Tenure (Yrs.) 9
Purchase Information
Ticker Net Expense Ratio Minimum Purchase Revenue Sharing
VASVX 0.35% N/A 0.00%
6
© 2017 INNOVEST PORTFOLIO SOLUTIONS, LLC
INVESTMENT PROCESS
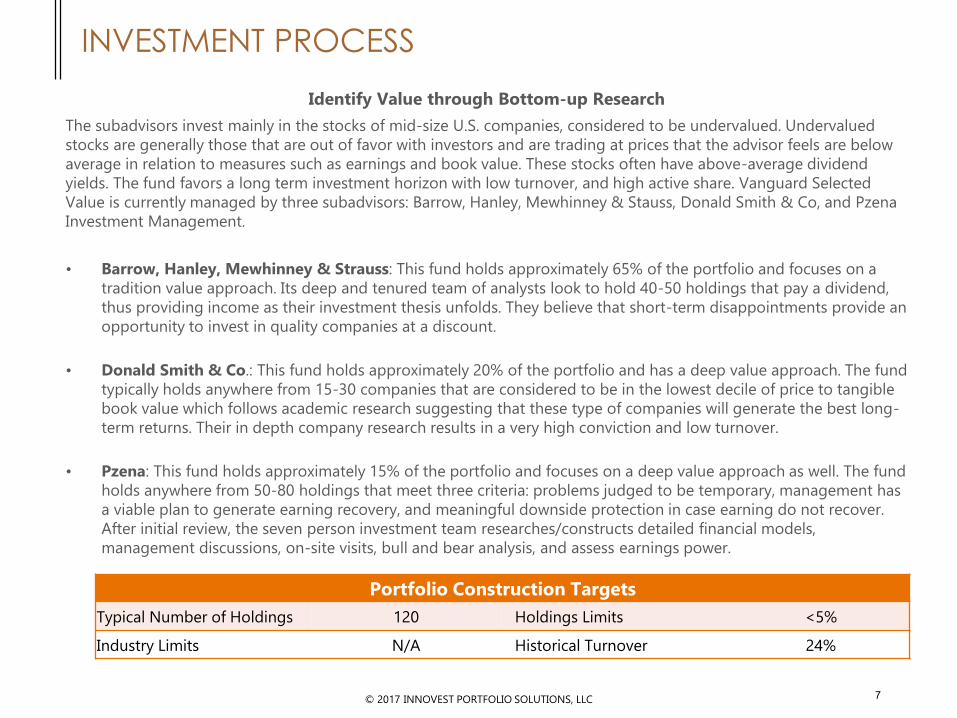
Identify Value through Bottom-up Research
The subadvisors invest mainly in the stocks of mid-size U.S. companies, considered to be undervalued. Undervalued
stocks are generally those that are out of favor with investors and are trading at prices that the advisor feels are below
average in relation to measures such as earnings and book value. These stocks often have above-average dividend
yields. The fund favors a long term investment horizon with low turnover, and high active share. Vanguard Selected
Value is currently managed by three subadvisors: Barrow, Hanley, Mewhinney & Stauss, Donald Smith & Co, and Pzena
Investment Management.
• Barrow, Hanley, Mewhinney & Strauss: This fund holds approximately 65% of the portfolio and focuses on a
tradition value approach. Its deep and tenured team of analysts look to hold 40-50 holdings that pay a dividend,
thus providing income as their investment thesis unfolds. They believe that short-term disappointments provide an
opportunity to invest in quality companies at a discount.
• Donald Smith & Co.: This fund holds approximately 20% of the portfolio and has a deep value approach. The fund
typically holds anywhere from 15-30 companies that are considered to be in the lowest decile of price to tangible
book value which follows academic research suggesting that these type of companies will generate the best long-
term returns. Their in depth company research results in a very high conviction and low turnover.
• Pzena: This fund holds approximately 15% of the portfolio and focuses on a deep value approach as well. The fund
holds anywhere from 50-80 holdings that meet three criteria: problems judged to be temporary, management has
a viable plan to generate earning recovery, and meaningful downside protection in case earning do not recover.
After initial review, the seven person investment team researches/constructs detailed financial models,
management discussions, on-site visits, bull and bear analysis, and assess earnings power.
Portfolio Construction Targets
Typical Number of Holdings 120 Holdings Limits <5%
Industry Limits N/A Historical Turnover 24%
7
© 2017 INNOVEST PORTFOLIO SOLUTIONS, LLC
PROS & CONS
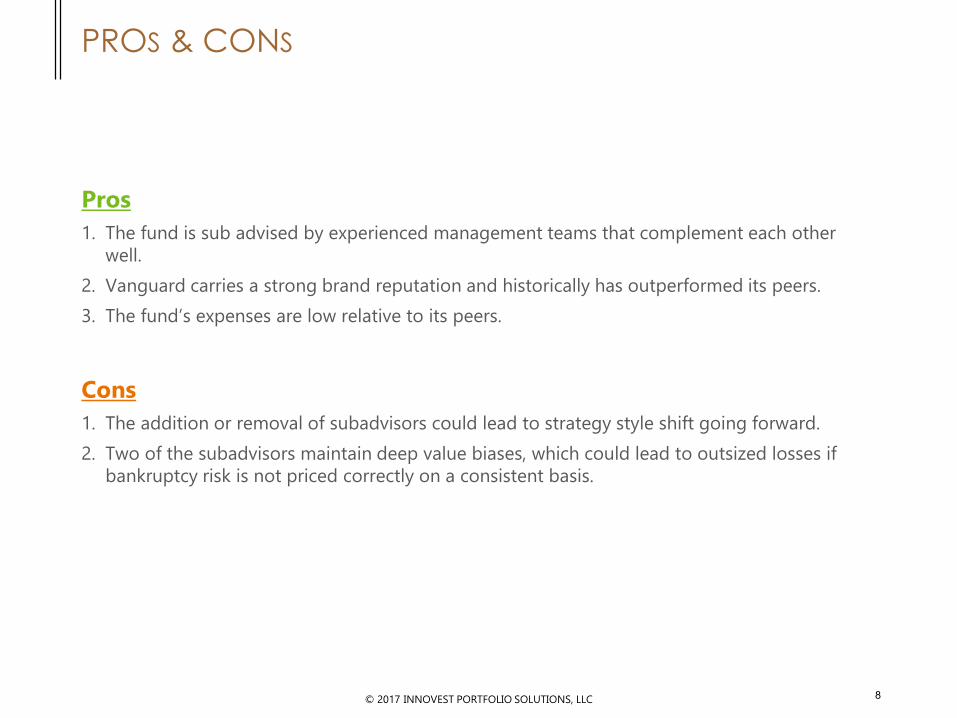
Pros
1. The fund is sub advised by experienced management teams that complement each other
well.
2. Vanguard carries a strong brand reputation and historically has outperformed its peers.
3. The fund’s expenses are low relative to its peers.
Cons
1. The addition or removal of subadvisors could lead to strategy style shift going forward.
2. Two of the subadvisors maintain deep value biases, which could lead to outsized losses if
bankruptcy risk is not priced correctly on a consistent basis.
8
SECTOR ALLOCATION
STYLE MAP (03/01/96 - 06/30/17)
SECTOR PERFORMANCE
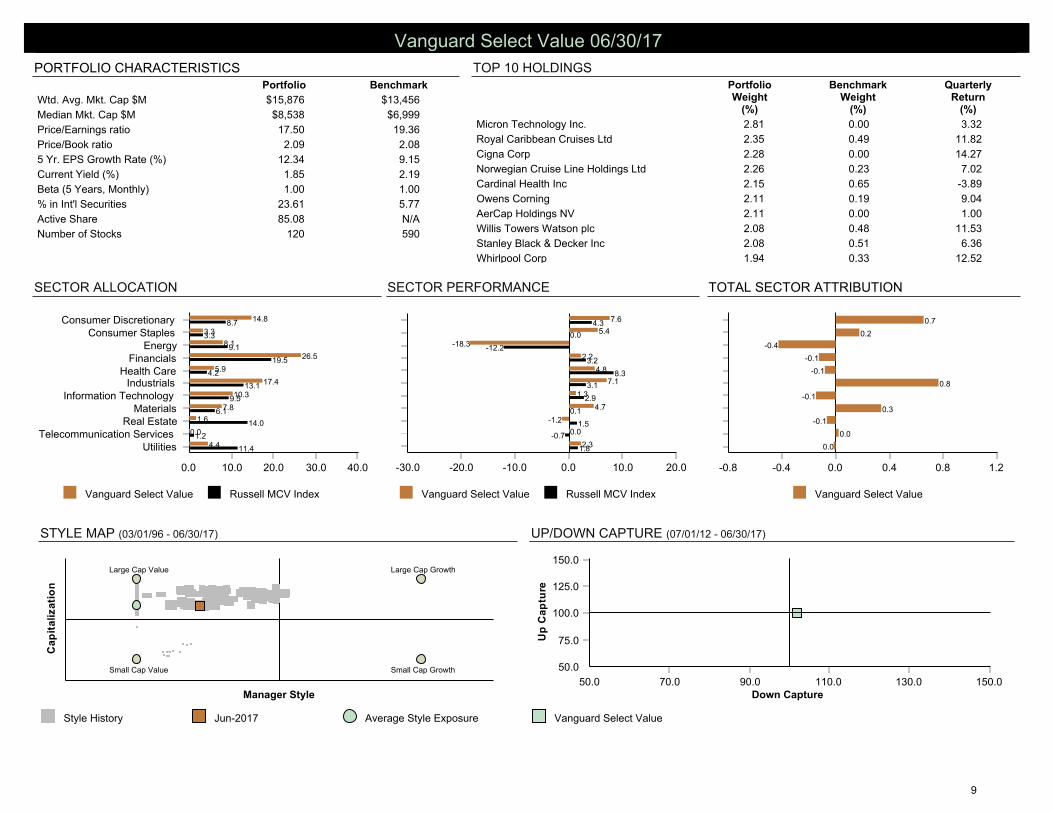
TOP 10 HOLDINGSPORTFOLIO CHARACTERISTICS
UP/DOWN CAPTURE (07/01/12 - 06/30/17)
TOTAL SECTOR ATTRIBUTION
PortfolioWeight
(%)
BenchmarkWeight
(%)
QuarterlyReturn
(%)
Micron Technology Inc. 2.81 0.00 3.32
Royal Caribbean Cruises Ltd 2.35 0.49 11.82
Cigna Corp 2.28 0.00 14.27
Norwegian Cruise Line Holdings Ltd 2.26 0.23 7.02
Cardinal Health Inc 2.15 0.65 -3.89
Owens Corning 2.11 0.19 9.04
AerCap Holdings NV 2.11 0.00 1.00
Willis Towers Watson plc 2.08 0.48 11.53
Stanley Black & Decker Inc 2.08 0.51 6.36
Whirlpool Corp 1.94 0.33 12.52
% of Portfolio 22.17 2.88
Portfolio Benchmark
Wtd. Avg. Mkt. Cap $M $15,876 $13,456
Median Mkt. Cap $M $8,538 $6,999
Price/Earnings ratio 17.50 19.36
Price/Book ratio 2.09 2.08
5 Yr. EPS Growth Rate (%) 12.34 9.15
Current Yield (%) 1.85 2.19
Beta (5 Years, Monthly) 1.00 1.00
% in Int'l Securities 23.61 5.77
Active Share 85.08 N/A
Number of Stocks 120 590
Vanguard Select Value Russell MCV Index
0.0 10.0 20.0 30.0 40.0
UtilitiesTelecommunication Services
Real EstateMaterials
Information TechnologyIndustrials
Health CareFinancials
EnergyConsumer Staples
Consumer Discretionary
4.4
0.0
1.6
7.8
10.3
17.4
5.9
26.5
8.1
3.3
14.8
11.4
1.2
14.0
6.1
9.5
13.1
4.2
19.5
9.1
3.3
8.7
Vanguard Select Value
0.0 0.4 0.8 1.2-0.4-0.8
0.0
0.0
-0.1
0.3
-0.1
0.8
-0.1
-0.1
-0.4
0.2
0.7
Vanguard Select Value Russell MCV Index
0.0 10.0 20.0-10.0-20.0-30.0
2.3
0.0
-1.2
4.7
1.3
7.1
4.8
2.2
-18.3
5.4
7.6
1.8
-0.7
1.5
0.1
2.9
3.1
8.3
3.2
-12.2
0.0
4.3
Style History Jun-2017 Average Style Exposure
Ca
pit
ali
za
tio
n
Manager Style
Large Cap Growth
Small Cap GrowthSmall Cap Value
Large Cap Value
Vanguard Select Value
50.0
75.0
100.0
125.0
150.0
Up
Ca
ptu
re
50.0 70.0 90.0 110.0 130.0 150.0Down Capture
Vanguard Select Value 06/30/17
9
© 2017 INNOVEST PORTFOLIO SOLUTIONS, LLC
VIRTUS CEREDEX MID-CAP VALUE
Portfolio Management
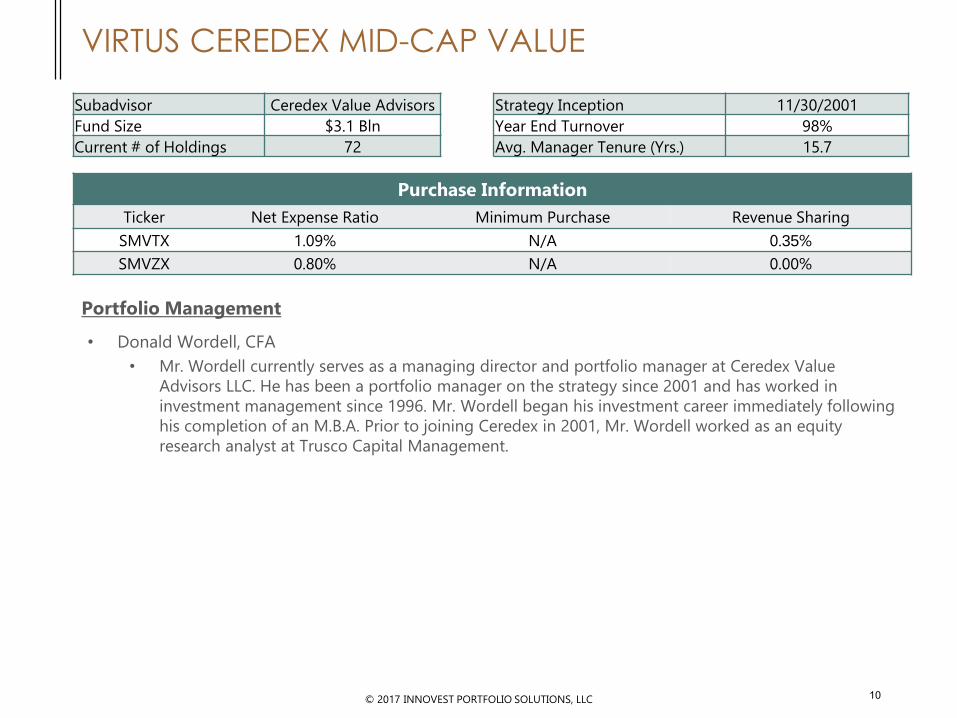
• Donald Wordell, CFA
• Mr. Wordell currently serves as a managing director and portfolio manager at Ceredex Value
Advisors LLC. He has been a portfolio manager on the strategy since 2001 and has worked in
investment management since 1996. Mr. Wordell began his investment career immediately following
his completion of an M.B.A. Prior to joining Ceredex in 2001, Mr. Wordell worked as an equity
research analyst at Trusco Capital Management.
Subadvisor Ceredex Value Advisors
Fund Size $3.1 Bln
Current # of Holdings 72
Strategy Inception 11/30/2001
Year End Turnover 98%
Avg. Manager Tenure (Yrs.) 15.7
Purchase Information
Ticker Net Expense Ratio Minimum Purchase Revenue Sharing
SMVTX 1.09% N/A 0.35%
SMVZX 0.80% N/A 0.00%
10
© 2017 INNOVEST PORTFOLIO SOLUTIONS, LLC
INVESTMENT PROCESS
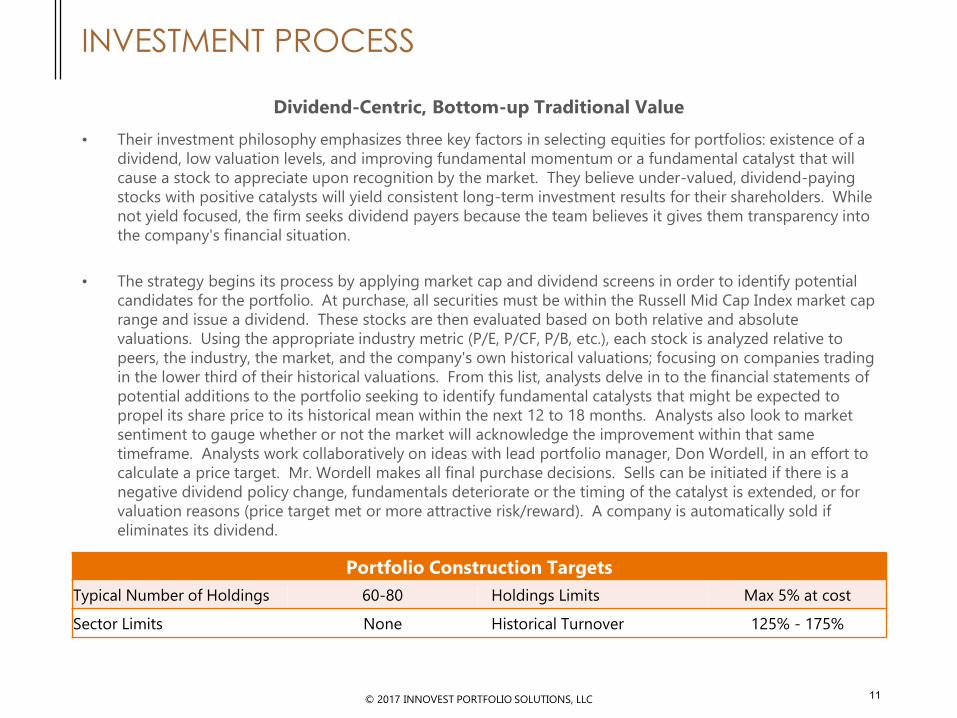
Dividend-Centric, Bottom-up Traditional Value
• Their investment philosophy emphasizes three key factors in selecting equities for portfolios: existence of a
dividend, low valuation levels, and improving fundamental momentum or a fundamental catalyst that will
cause a stock to appreciate upon recognition by the market. They believe under-valued, dividend-paying
stocks with positive catalysts will yield consistent long-term investment results for their shareholders. While
not yield focused, the firm seeks dividend payers because the team believes it gives them transparency into
the company's financial situation.
• The strategy begins its process by applying market cap and dividend screens in order to identify potential
candidates for the portfolio. At purchase, all securities must be within the Russell Mid Cap Index market cap
range and issue a dividend. These stocks are then evaluated based on both relative and absolute
valuations. Using the appropriate industry metric (P/E, P/CF, P/B, etc.), each stock is analyzed relative to
peers, the industry, the market, and the company's own historical valuations; focusing on companies trading
in the lower third of their historical valuations. From this list, analysts delve in to the financial statements of
potential additions to the portfolio seeking to identify fundamental catalysts that might be expected to
propel its share price to its historical mean within the next 12 to 18 months. Analysts also look to market
sentiment to gauge whether or not the market will acknowledge the improvement within that same
timeframe. Analysts work collaboratively on ideas with lead portfolio manager, Don Wordell, in an effort to
calculate a price target. Mr. Wordell makes all final purchase decisions. Sells can be initiated if there is a
negative dividend policy change, fundamentals deteriorate or the timing of the catalyst is extended, or for
valuation reasons (price target met or more attractive risk/reward). A company is automatically sold if
eliminates its dividend.
Portfolio Construction Targets
Typical Number of Holdings 60-80 Holdings Limits Max 5% at cost
Sector Limits None Historical Turnover 125% - 175%
11
© 2017 INNOVEST PORTFOLIO SOLUTIONS, LLC
PROS & CONS
Pros
1. Ceredex's dividend-centric focus not only results in yield, but may provide a level of cushion
to help offset market declines.
2. The identification of specific fundamental catalysts that are expected to help initiate positive
price movements may help the strategy avoid "value traps".
3. The strategy's transparent sell discipline removes much of the emotion from decisions.
Cons
1. The lack of formal sector constraints and requirement of a dividend policy may cause the
strategy to favor dividend paying sectors (utilities and financials) over typical non-dividend
paying sectors (technology).
2. The strategy's higher turnover may be difficult to stomach for tax-sensitive investors.
12
SECTOR ALLOCATION
STYLE MAP (12/01/01 - 06/30/17)
SECTOR PERFORMANCE
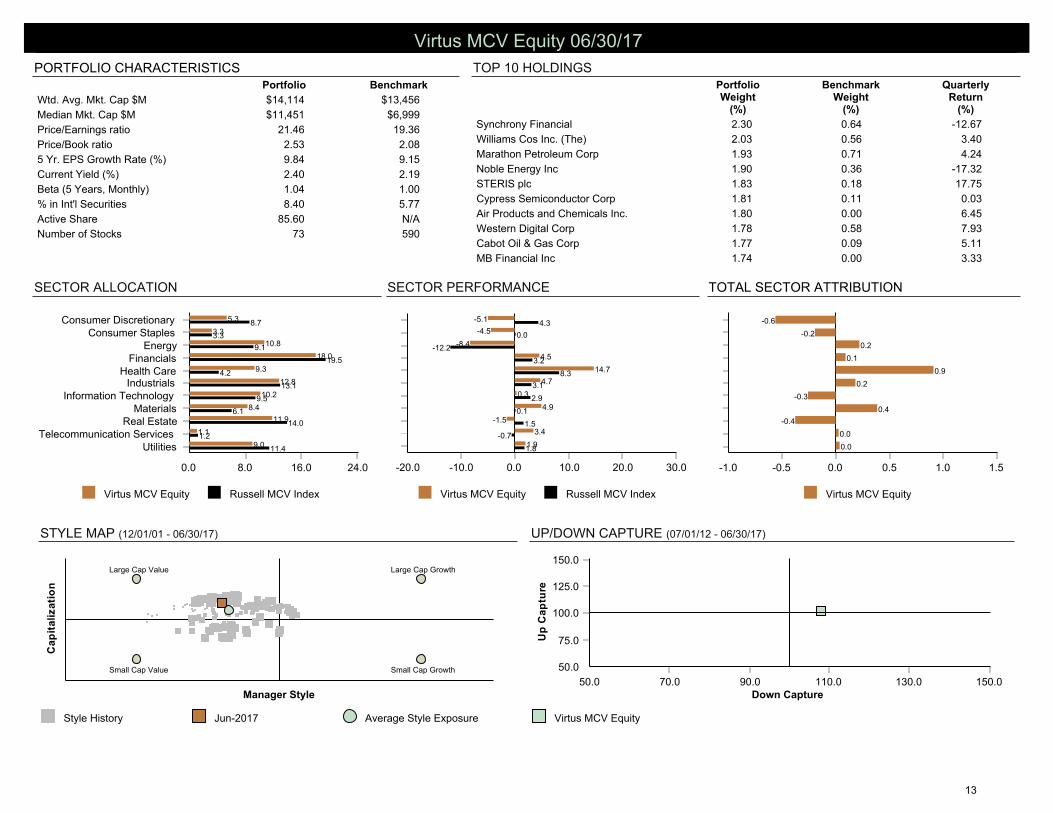
TOP 10 HOLDINGSPORTFOLIO CHARACTERISTICS
UP/DOWN CAPTURE (07/01/12 - 06/30/17)
TOTAL SECTOR ATTRIBUTION
PortfolioWeight
(%)
BenchmarkWeight
(%)
QuarterlyReturn
(%)
Synchrony Financial 2.30 0.64 -12.67
Williams Cos Inc. (The) 2.03 0.56 3.40
Marathon Petroleum Corp 1.93 0.71 4.24
Noble Energy Inc 1.90 0.36 -17.32
STERIS plc 1.83 0.18 17.75
Cypress Semiconductor Corp 1.81 0.11 0.03
Air Products and Chemicals Inc. 1.80 0.00 6.45
Western Digital Corp 1.78 0.58 7.93
Cabot Oil & Gas Corp 1.77 0.09 5.11
MB Financial Inc 1.74 0.00 3.33
% of Portfolio 18.89 3.23
Portfolio Benchmark
Wtd. Avg. Mkt. Cap $M $14,114 $13,456
Median Mkt. Cap $M $11,451 $6,999
Price/Earnings ratio 21.46 19.36
Price/Book ratio 2.53 2.08
5 Yr. EPS Growth Rate (%) 9.84 9.15
Current Yield (%) 2.40 2.19
Beta (5 Years, Monthly) 1.04 1.00
% in Int'l Securities 8.40 5.77
Active Share 85.60 N/A
Number of Stocks 73 590
Virtus MCV Equity Russell MCV Index
0.0 8.0 16.0 24.0
UtilitiesTelecommunication Services
Real EstateMaterials
Information TechnologyIndustrials
Health CareFinancials
EnergyConsumer Staples
Consumer Discretionary
9.0
1.1
11.9
8.4
10.2
12.8
9.3
18.0
10.8
3.3
5.3
11.4
1.2
14.0
6.1
9.5
13.1
4.2
19.5
9.1
3.3
8.7
Virtus MCV Equity
0.0 0.5 1.0 1.5-0.5-1.0
0.0
0.0
-0.4
0.4
-0.3
0.2
0.9
0.1
0.2
-0.2
-0.6
Virtus MCV Equity Russell MCV Index
0.0 10.0 20.0 30.0-10.0-20.0
1.9
3.4
-1.5
4.9
0.3
4.7
14.7
4.5
-8.4
-4.5
-5.1
1.8
-0.7
1.5
0.1
2.9
3.1
8.3
3.2
-12.2
0.0
4.3
Style History Jun-2017 Average Style Exposure
Ca
pit
ali
za
tio
n
Manager Style
Large Cap Growth
Small Cap GrowthSmall Cap Value
Large Cap Value
Virtus MCV Equity
50.0
75.0
100.0
125.0
150.0
Up
Ca
ptu
re
50.0 70.0 90.0 110.0 130.0 150.0Down Capture
Virtus MCV Equity 06/30/17
13
Criteria
Organization PeoplePhilosophy &
ProcessStyle
ConsistencyAsset Base Performance Expenses Overall
Costs
Exp Ratio(%)
MedianExp Ratio
(%)
Ratio ofExp to
Median (%)
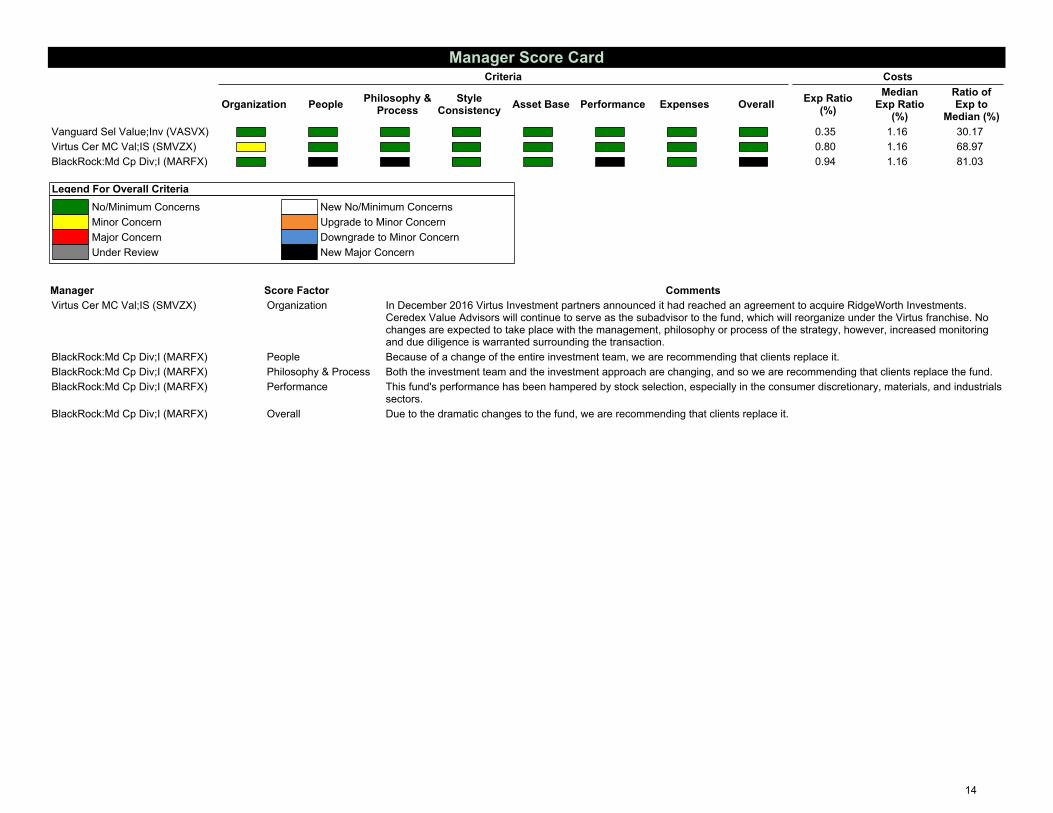
Vanguard Sel Value;Inv (VASVX) 0.35 1.16 30.17
Virtus Cer MC Val;IS (SMVZX) 0.80 1.16 68.97
BlackRock:Md Cp Div;I (MARFX) 0.94 1.16 81.03
Legend For Overall Criteria
No/Minimum Concerns
Minor Concern
Major Concern
Under Review
New No/Minimum Concerns
Upgrade to Minor Concern
Downgrade to Minor Concern
New Major Concern
Manager Score Factor Comments
Virtus Cer MC Val;IS (SMVZX) Organization In December 2016 Virtus Investment partners announced it had reached an agreement to acquire RidgeWorth Investments.Ceredex Value Advisors will continue to serve as the subadvisor to the fund, which will reorganize under the Virtus franchise. Nochanges are expected to take place with the management, philosophy or process of the strategy, however, increased monitoringand due diligence is warranted surrounding the transaction.
BlackRock:Md Cp Div;I (MARFX) People Because of a change of the entire investment team, we are recommending that clients replace it.
BlackRock:Md Cp Div;I (MARFX) Philosophy & Process Both the investment team and the investment approach are changing, and so we are recommending that clients replace the fund.
BlackRock:Md Cp Div;I (MARFX) Performance This fund's performance has been hampered by stock selection, especially in the consumer discretionary, materials, and industrialssectors.
BlackRock:Md Cp Div;I (MARFX) Overall Due to the dramatic changes to the fund, we are recommending that clients replace it.
Manager Score Card
14
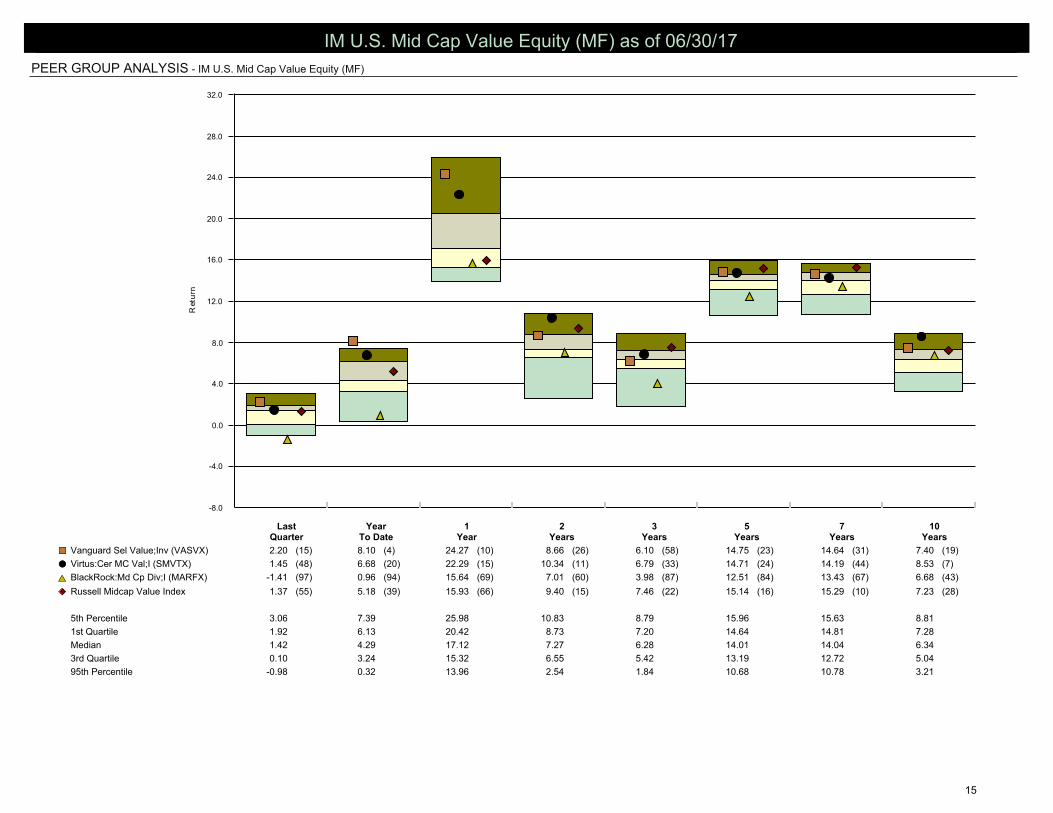
PEER GROUP ANALYSIS - IM U.S. Mid Cap Value Equity (MF)
-8.0
-4.0
0.0
4.0
8.0
12.0
16.0
20.0
24.0
28.0
32.0
Ret
urn
LastQuarter
YearTo Date
1Year
2Years
3Years
5Years
7Years
10Years
Vanguard Sel Value;Inv (VASVX) 2.20 (15) 8.10 (4) 24.27 (10) 8.66 (26) 6.10 (58) 14.75 (23) 14.64 (31) 7.40 (19)¢£
Virtus:Cer MC Val;I (SMVTX) 1.45 (48) 6.68 (20) 22.29 (15) 10.34 (11) 6.79 (33) 14.71 (24) 14.19 (44) 8.53 (7)��
BlackRock:Md Cp Div;I (MARFX) -1.41 (97) 0.96 (94) 15.64 (69) 7.01 (60) 3.98 (87) 12.51 (84) 13.43 (67) 6.68 (43)pr
Russell Midcap Value Index 1.37 (55) 5.18 (39) 15.93 (66) 9.40 (15) 7.46 (22) 15.14 (16) 15.29 (10) 7.23 (28)¿̄
5th Percentile 3.06 7.39 25.98 10.83 8.79 15.96 15.63 8.81
1st Quartile 1.92 6.13 20.42 8.73 7.20 14.64 14.81 7.28
Median 1.42 4.29 17.12 7.27 6.28 14.01 14.04 6.34
3rd Quartile 0.10 3.24 15.32 6.55 5.42 13.19 12.72 5.04
95th Percentile -0.98 0.32 13.96 2.54 1.84 10.68 10.78 3.21
IM U.S. Mid Cap Value Equity (MF) as of 06/30/17
15
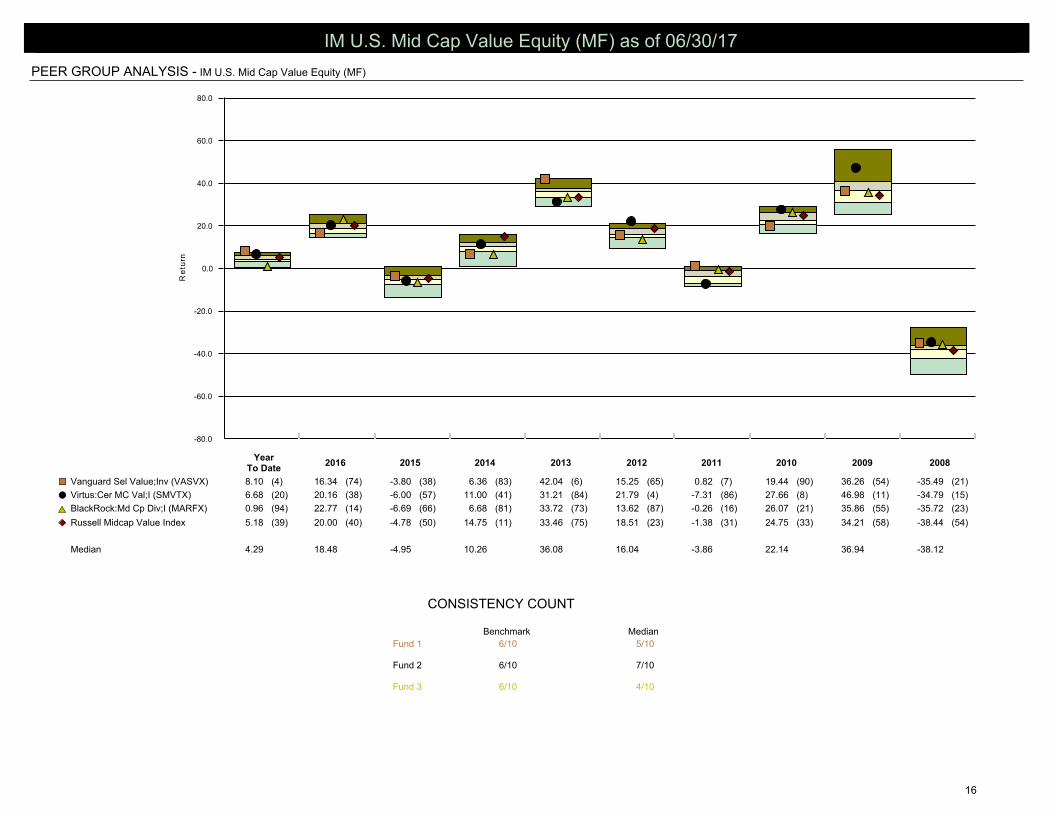
PEER GROUP ANALYSIS - IM U.S. Mid Cap Value Equity (MF)
Benchmark Median
Fund 1 6/10 5/10
Fund 2 6/10 7/10
Fund 3 6/10 4/10
CONSISTENCY COUNT
-80.0
-60.0
-40.0
-20.0
0.0
20.0
40.0
60.0
80.0
Re
turn
YearTo Date
2016 2015 2014 2013 2012 2011 2010 2009 2008
Vanguard Sel Value;Inv (VASVX) 8.10 (4) 16.34 (74) -3.80 (38) 6.36 (83) 42.04 (6) 15.25 (65) 0.82 (7) 19.44 (90) 36.26 (54) -35.49 (21)¢£
Virtus:Cer MC Val;I (SMVTX) 6.68 (20) 20.16 (38) -6.00 (57) 11.00 (41) 31.21 (84) 21.79 (4) -7.31 (86) 27.66 (8) 46.98 (11) -34.79 (15)��
BlackRock:Md Cp Div;I (MARFX) 0.96 (94) 22.77 (14) -6.69 (66) 6.68 (81) 33.72 (73) 13.62 (87) -0.26 (16) 26.07 (21) 35.86 (55) -35.72 (23)pr
Russell Midcap Value Index 5.18 (39) 20.00 (40) -4.78 (50) 14.75 (11) 33.46 (75) 18.51 (23) -1.38 (31) 24.75 (33) 34.21 (58) -38.44 (54)¿̄
Median 4.29 18.48 -4.95 10.26 36.08 16.04 -3.86 22.14 36.94 -38.12
IM U.S. Mid Cap Value Equity (MF) as of 06/30/17
16
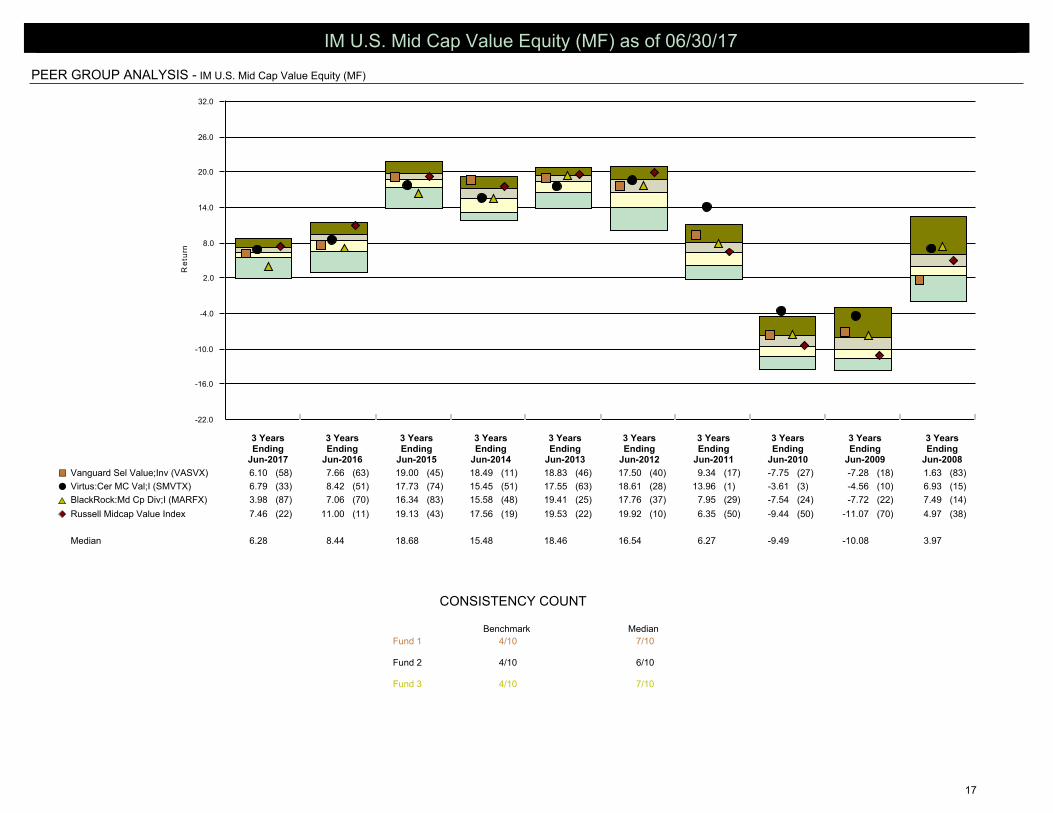
PEER GROUP ANALYSIS - IM U.S. Mid Cap Value Equity (MF)
Benchmark Median
Fund 1 4/10 7/10
Fund 2 4/10 6/10
Fund 3 4/10 7/10
CONSISTENCY COUNT
-22.0
-16.0
-10.0
-4.0
2.0
8.0
14.0
20.0
26.0
32.0
Re
turn
3 YearsEnding
Jun-2017
3 YearsEnding
Jun-2016
3 YearsEnding
Jun-2015
3 YearsEnding
Jun-2014
3 YearsEnding
Jun-2013
3 YearsEnding
Jun-2012
3 YearsEnding
Jun-2011
3 YearsEnding
Jun-2010
3 YearsEnding
Jun-2009
3 YearsEnding
Jun-2008
Vanguard Sel Value;Inv (VASVX) 6.10 (58) 7.66 (63) 19.00 (45) 18.49 (11) 18.83 (46) 17.50 (40) 9.34 (17) -7.75 (27) -7.28 (18) 1.63 (83)¢£
Virtus:Cer MC Val;I (SMVTX) 6.79 (33) 8.42 (51) 17.73 (74) 15.45 (51) 17.55 (63) 18.61 (28) 13.96 (1) -3.61 (3) -4.56 (10) 6.93 (15)��
BlackRock:Md Cp Div;I (MARFX) 3.98 (87) 7.06 (70) 16.34 (83) 15.58 (48) 19.41 (25) 17.76 (37) 7.95 (29) -7.54 (24) -7.72 (22) 7.49 (14)pr
Russell Midcap Value Index 7.46 (22) 11.00 (11) 19.13 (43) 17.56 (19) 19.53 (22) 19.92 (10) 6.35 (50) -9.44 (50) -11.07 (70) 4.97 (38)¿̄
Median 6.28 8.44 18.68 15.48 18.46 16.54 6.27 -9.49 -10.08 3.97
IM U.S. Mid Cap Value Equity (MF) as of 06/30/17
17
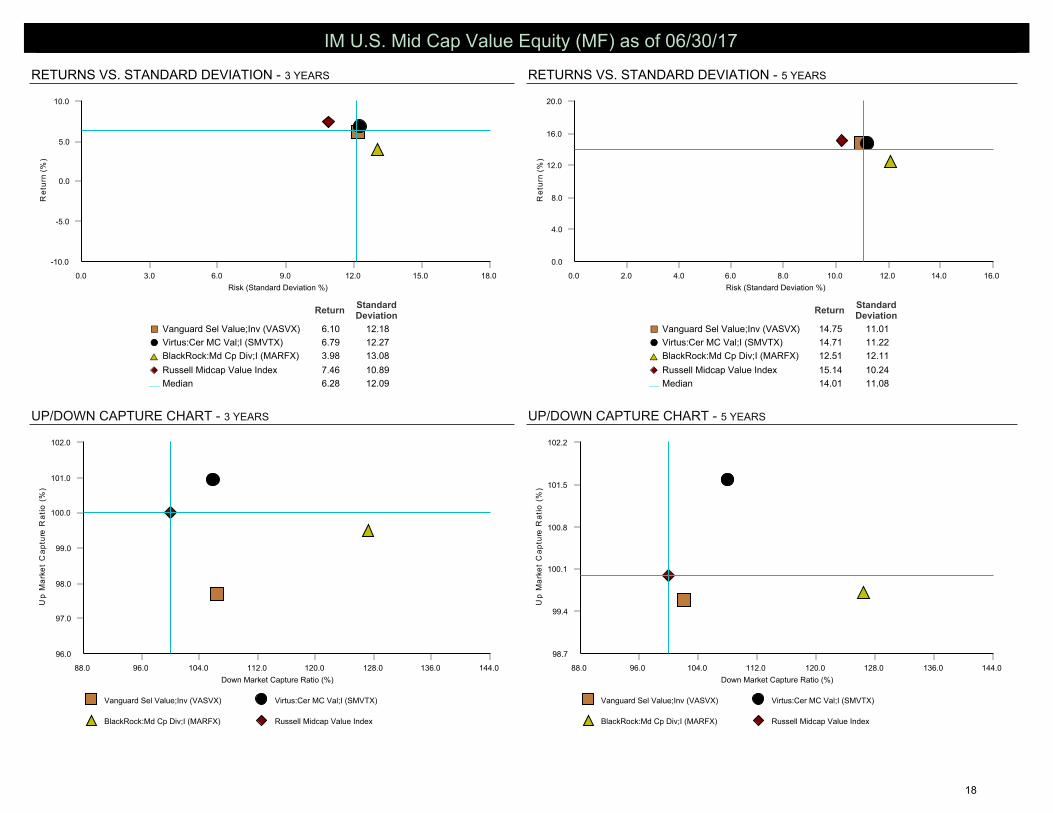
UP/DOWN CAPTURE CHART - 3 YEARS
RETURNS VS. STANDARD DEVIATION - 5 YEARSRETURNS VS. STANDARD DEVIATION - 3 YEARS
UP/DOWN CAPTURE CHART - 5 YEARS
0.0
4.0
8.0
12.0
16.0
20.0
Re
turn
(%)
0.0 2.0 4.0 6.0 8.0 10.0 12.0 14.0 16.0
Risk (Standard Deviation %)
ReturnStandardDeviation
Vanguard Sel Value;Inv (VASVX) 14.75 11.01¢£
Virtus:Cer MC Val;I (SMVTX) 14.71 11.22��
BlackRock:Md Cp Div;I (MARFX) 12.51 12.11pr
Russell Midcap Value Index 15.14 10.24¿̄
Median 14.01 11.08¾
-10.0
-5.0
0.0
5.0
10.0
Re
turn
(%)
0.0 3.0 6.0 9.0 12.0 15.0 18.0
Risk (Standard Deviation %)
ReturnStandardDeviation
Vanguard Sel Value;Inv (VASVX) 6.10 12.18¢£
Virtus:Cer MC Val;I (SMVTX) 6.79 12.27��
BlackRock:Md Cp Div;I (MARFX) 3.98 13.08pr
Russell Midcap Value Index 7.46 10.89¿̄
Median 6.28 12.09¾
Vanguard Sel Value;Inv (VASVX) Virtus:Cer MC Val;I (SMVTX)
BlackRock:Md Cp Div;I (MARFX) Russell Midcap Value Index
96.0
97.0
98.0
99.0
100.0
101.0
102.0
Up
Ma
rke
t
Ca
ptu
re R
ati
o (%
)
88.0 96.0 104.0 112.0 120.0 128.0 136.0 144.0
Down Market Capture Ratio (%)
Vanguard Sel Value;Inv (VASVX) Virtus:Cer MC Val;I (SMVTX)
BlackRock:Md Cp Div;I (MARFX) Russell Midcap Value Index
98.7
99.4
100.1
100.8
101.5
102.2
Up
Ma
rke
t
Ca
ptu
re R
ati
o (%
)
88.0 96.0 104.0 112.0 120.0 128.0 136.0 144.0
Down Market Capture Ratio (%)
IM U.S. Mid Cap Value Equity (MF) as of 06/30/17
18
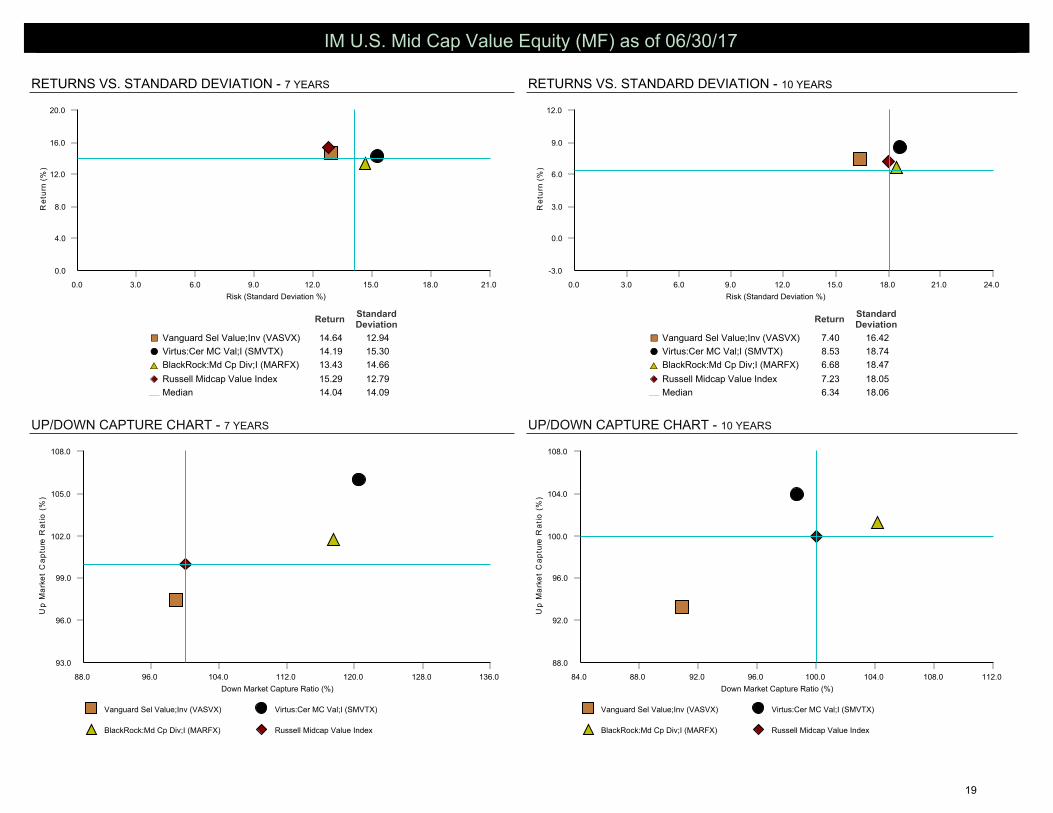
UP/DOWN CAPTURE CHART - 7 YEARS
RETURNS VS. STANDARD DEVIATION - 10 YEARSRETURNS VS. STANDARD DEVIATION - 7 YEARS
UP/DOWN CAPTURE CHART - 10 YEARS
-3.0
0.0
3.0
6.0
9.0
12.0
Re
turn
(%)
0.0 3.0 6.0 9.0 12.0 15.0 18.0 21.0 24.0
Risk (Standard Deviation %)
ReturnStandardDeviation
Vanguard Sel Value;Inv (VASVX) 7.40 16.42¢£
Virtus:Cer MC Val;I (SMVTX) 8.53 18.74��
BlackRock:Md Cp Div;I (MARFX) 6.68 18.47pr
Russell Midcap Value Index 7.23 18.05¿̄
Median 6.34 18.06¾
0.0
4.0
8.0
12.0
16.0
20.0
Re
turn
(%)
0.0 3.0 6.0 9.0 12.0 15.0 18.0 21.0
Risk (Standard Deviation %)
ReturnStandardDeviation
Vanguard Sel Value;Inv (VASVX) 14.64 12.94¢£
Virtus:Cer MC Val;I (SMVTX) 14.19 15.30��
BlackRock:Md Cp Div;I (MARFX) 13.43 14.66pr
Russell Midcap Value Index 15.29 12.79¿̄
Median 14.04 14.09¾
Vanguard Sel Value;Inv (VASVX) Virtus:Cer MC Val;I (SMVTX)
BlackRock:Md Cp Div;I (MARFX) Russell Midcap Value Index
93.0
96.0
99.0
102.0
105.0
108.0
Up
Ma
rke
t
Ca
ptu
re R
ati
o (%
)
88.0 96.0 104.0 112.0 120.0 128.0 136.0
Down Market Capture Ratio (%)
Vanguard Sel Value;Inv (VASVX) Virtus:Cer MC Val;I (SMVTX)
BlackRock:Md Cp Div;I (MARFX) Russell Midcap Value Index
88.0
92.0
96.0
100.0
104.0
108.0
Up
Ma
rke
t
Ca
ptu
re R
ati
o (%
)
84.0 88.0 92.0 96.0 100.0 104.0 108.0 112.0
Down Market Capture Ratio (%)
IM U.S. Mid Cap Value Equity (MF) as of 06/30/17
19
© 2017 INNOVEST PORTFOLIO SOLUTIONS, LLC
GLOSSARY
Alpha measures a portfolio’s return in excess of the market return adjusted for risk. It is a measure of the manager’s contribution to performance with reference to security selection. A positive
alpha indicates that a portfolio was positively rewarded for the residual risk that was taken for that level of market exposure.
Beta measures the sensitivity of rates of portfolio return to movements in the market. A portfolio’s beta measures the expected change in return per 1% change in the return on the market. If the
beta of a portfolio is 1.5, a 1 percent increase in the return of the market will result, on average, in a 1.5 percent increase in the return on the portfolio. The converse would also be true.
Dividend Yield - The total amount of dividends paid out for a stock over the preceding twelve months divided by the closing price of a share of the common stock.
Down Capture Ratio - The Down Capture Ratio is a measure of the Investment’s compound return when the Benchmark was down divided by the Benchmark’s compound return when the
Benchmark was down. The smaller the value, the better.
Duration - A time measure of a bond’s interest-rate sensitivity, based on the weighted average of the time periods over which a bond’s cash flows accrue to the bondholder.
Forecasted Long-Term Earnings Growth - This growth rate is a measure of a company’s expected long-term success in generating future year-over-year earnings growth. This growth rate is a
market value weighted average of the consensus (mean) analysts’ long-term earnings growth rate forecast for each company in the portfolio. The definition of long-term varies by analyst but is
limited to a 3-8 year range. This value is expressed as the expected average annual growth of earnings in percent.
Information Ratio measures the excess return per unit of residual “non market” risk in a portfolio. The ratio is equal to the Alpha divided by the Residual Risk.
Market Capitalization - The market value of a company’s outstanding shares of common stock at a specific point in time, computed as the product of the number of outstanding shares times the
stock’s closing price per share.
P/E ratio relates the price of the stock to the per-share earnings of the company. A high P/E generally indicates that the market will pay more to obtain the company because it has confidence in the
company’s ability to increase its earnings. Conversely, a low P/E indicates that the market has less confidence that the company’s earnings will increase, and therefore will not pay as much for its
stock. In most cases a fund with a high average P/E ratio has paid a premium for stocks that have a high potential for increased earnings. If the fund’s average P/E ratio is low, the manager may
believe that the stocks have an overlooked or undervalued potential for appreciation.
P/B ratio of a company relates the per-share market price of the company’s stock to its per-share book value, the historical accounting value of the company’s tangible assets. A high P/B ratio
indicates that the price of the stock exceeds the actual worth of the company’s assets. A low P/B ratio would indicate that the stock is a bargain, priced below what the company’s assets could be
worth if liquidated.
P/CF ratio compares the total market value of the portfolio to the portfolio’s share of the underlying stocks’ earnings (or book value, cash flow, sales or dividends).
R-Squared indicates the extent to which the variability of the portfolio returns is explained by market action. It can also be thought of as measuring the diversification relative to the appropriate
benchmark. An R-Squared value of .75 indicates that 75% of the fluctuation in a portfolio return is explained by market action. An R-Squared of 1.0 indicates that a portfolio’s returns are entirely
related to the market and it is not influenced by other factors. An R-Squared of zero indicates that no relationship exists between the portfolio’s return and the market.
Residual Risk is the unsystematic risk of a fund, or the portion of the total risk unique to the manager and not related to the overall market. This reflects the “bets” which the manager places in that
particular asset class. These bets reflect emphasis in particular sectors, maturities (for bonds), or other issue specific factors which the manager considers a good investment opportunity.
Diversification of the portfolio will reduce the residual risk of that portfolio.
Sharpe Ratio is a measure of risk-adjusted return. It is calculated by subtracting the risk-free return (90 day T-Bills) from the portfolio return and dividing the resulting “excess return” by the
portfolio’s total risk level (standard deviation). The result is a measure of returned gained per unit of total risk taken.
Standard Deviation is a statistical measure of portfolio risk. It reflects the average deviation of observations from their sample mean. Standard Deviation is used as an estimate of risk since it
measures how wide the range of returns typically is. The wider the typical range of returns, the higher the standard deviation of returns, and the higher the portfolio risk. If returns are normally
distributed (i.e. as a bell shaped curve distribution) then approximately 66% of 2/3 of the returns would occur within plus or minus one standard deviation of the sample mean.
Style Exposure Chart indicates a portfolio’s exposure to a particular capitalization (large, medium or small) and style (value or growth). Based on Sharpe’s return based style analysis, a style map
will attempt to correlate a manager to a particular style of investing (i.e. Large Cap Growth).
Turnover Ratio - This is a measure of the fund’s trading activity which is computed by taking the lesser of purchases or sales (excluding all securities with maturities of less than one year) and
dividing by average monthly net assets.
Up Capture Ratio - The Up Capture Ratio is a measure of the Investment’s compound return when the Benchmark was up divided by the Benchmark’s compound return when the Benchmark was
up. The greater the value, the better.
Down Capture Ratio - The Down Capture Ratio is a measure of the Investment’s compound return when the Benchmark was down divided by the Benchmark’s compound return when the
Benchmark was down. The smaller the value, the better.
20
© 2017 INNOVEST PORTFOLIO SOLUTIONS, LLC
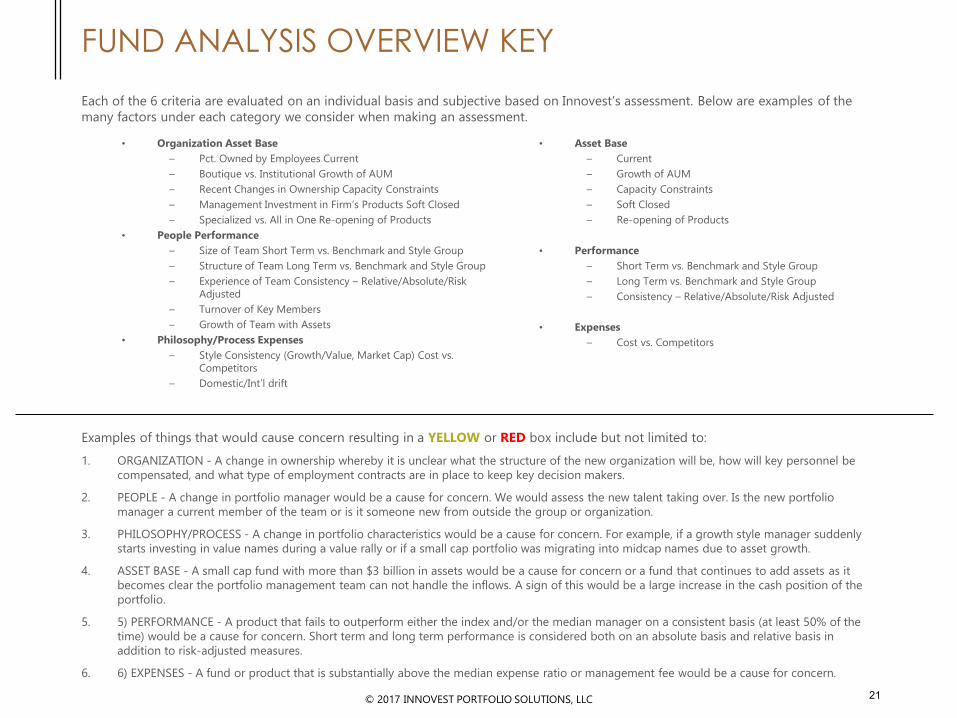
FUND ANALYSIS OVERVIEW KEY
Each of the 6 criteria are evaluated on an individual basis and subjective based on Innovest’s assessment. Below are examples of the
many factors under each category we consider when making an assessment.
• Organization Asset Base
– Pct. Owned by Employees Current
– Boutique vs. Institutional Growth of AUM
– Recent Changes in Ownership Capacity Constraints
– Management Investment in Firm’s Products Soft Closed
– Specialized vs. All in One Re-opening of Products
• People Performance
– Size of Team Short Term vs. Benchmark and Style Group
– Structure of Team Long Term vs. Benchmark and Style Group
– Experience of Team Consistency – Relative/Absolute/Risk
Adjusted
– Turnover of Key Members
– Growth of Team with Assets
• Philosophy/Process Expenses
– Style Consistency (Growth/Value, Market Cap) Cost vs.
Competitors
– Domestic/Int’l drift
• Asset Base
– Current
– Growth of AUM
– Capacity Constraints
– Soft Closed
– Re-opening of Products
• Performance
– Short Term vs. Benchmark and Style Group
– Long Term vs. Benchmark and Style Group
– Consistency – Relative/Absolute/Risk Adjusted
• Expenses
– Cost vs. Competitors
Examples of things that would cause concern resulting in a YELLOW or RED box include but not limited to:
1. ORGANIZATION - A change in ownership whereby it is unclear what the structure of the new organization will be, how will key personnel be
compensated, and what type of employment contracts are in place to keep key decision makers.
2. PEOPLE - A change in portfolio manager would be a cause for concern. We would assess the new talent taking over. Is the new portfolio
manager a current member of the team or is it someone new from outside the group or organization.
3. PHILOSOPHY/PROCESS - A change in portfolio characteristics would be a cause for concern. For example, if a growth style manager suddenly
starts investing in value names during a value rally or if a small cap portfolio was migrating into midcap names due to asset growth.
4. ASSET BASE - A small cap fund with more than $3 billion in assets would be a cause for concern or a fund that continues to add assets as it
becomes clear the portfolio management team can not handle the inflows. A sign of this would be a large increase in the cash position of the
portfolio.
5. 5) PERFORMANCE - A product that fails to outperform either the index and/or the median manager on a consistent basis (at least 50% of the
time) would be a cause for concern. Short term and long term performance is considered both on an absolute basis and relative basis in
addition to risk-adjusted measures.
6. 6) EXPENSES - A fund or product that is substantially above the median expense ratio or management fee would be a cause for concern.
21
© 2017 INNOVEST PORTFOLIO SOLUTIONS, LLC
DISCLAIMER
The preceding statistical analysis was prepared by Innovest Portfolio Solutions LLC with data provided by Investment Metrics (IM), Lipper and Morningstar, Inc. All Rights
Reserved. The investment products discussed are not insured by the FDIC and involve investment risk including the possible loss of all principal.
The information contained herein: (1) is proprietary to the vendors listed above and/or its content providers; (2) may not be copied or distributed; and (3) is not
warranted to be accurate, complete or timely. None of the vendors nor its content providers are responsible for any damages or losses arising from any use of this
information. Past performance is no guarantee of future results. Innovest compiles the information utilizing secondary data from statements provided by the plan trustee
and/or custodian.
This report may also contain returns and valuations from outside sources as directed by the client. Innovest assumes no responsibility for the accuracy of these
valuations or return methodologies. Reasonable care has been taken to assure the accuracy of the computer software and databases. Innovest disclaims responsibility,
financial or otherwise for the accuracy and completeness of this report. Copyright 2017 by Innovest Portfolio Solutions LLC Inc.
Note: Actual client mutual fund returns are reflected on the table of returns page. Fund pages subsequent to the table of returns reflect the representative mutual fund
with the longest track record and may not be the actual share class held by the client.
“Copyright 2017, Standard & Poor’s Financial Services LLC. Reproduction of S&P Index Services in any form is prohibited except with the prior written permission of S&P.
S&P does not guarantee the accuracy, adequacy, completeness or availability of any information and is not responsible for any errors or omissions, regardless of the
cause or for the results obtained from the use of such information. S&P DISCLAIMS ANY AND ALL EXPRESS OR IMPLIED WARRANTIES, INCLUDING, BUT NOT LIMITED
TO, ANY WARRANTIES OF MERCHANTABILITY OR FITNESS FOR A PARTICULAR PURPOSE OR USE. In no event shall S&P be liable for any direct, indirect, special or
consequential damages, costs, expenses, legal fees, or losses (including lost income or lost profit and opportunity costs) in connection with subscriber’s or others’ use of
S&P Index Services (2014)
Copyright MSCI 2017. Unpublished. All Rights Reserved. This information may only be used for your internal use, may not be reproduced or re-disseminated in any form
and may not be used to create any financial instruments or products or any indices. This information is provided on an “as is” basis and the user of this information
assumes the entire risk of any use it may make or permit to be made of this information. Neither MSCI, any or its affiliates or any other person involved in or related to
compiling, computing or creating this information makes any express or implied warranties or representations with respect to such information or the results to be
obtained by the use thereof, and MSCI, its affiliates and each such other person hereby expressly disclaim all warranties (including, without limitation, all warranties of
originality, accuracy, completeness, timeliness, non-infringement, merchantability and fitness for a particular purpose) with respect to this information. Without limiting
any of the foregoing, in no event shall MSCI, any of its affiliates or any other person involved in or related to compiling, computing or creating this information have any
liability for any direct, indirect, special, incidental, punitive, consequential or any other damages (including, without limitation, lost profits) even if notified of, or if it
might otherwise have anticipated, the possibility of such damages.
22