Embed Size (px)
Citation preview
Produced by and for the Hot Science - Cool Talks Outreach Lecture Series of the Environmental Science Institute. We request that the use of any of these materials include an acknowledgement of Dr. Eric J. Barron and the Hot Science - Cool Talks Outreach Lecture Series of the Environmental Science Institute of the University of
Texas at Austin. We hope you find these materials educational and enjoyable.
by Dr. Eric J. BarronHot Science - Cool Talks Volume 51
The Changing Debate on Global Warming

The Changing Debate on Global Warming
Eric J. BarronJackson School of Geosciences
The Changing Debate on Global Warming
Eric J. BarronJackson School of Geosciences

Every credible scientist recognizes that increases in greenhouse gases promote
warming
• Incoming solar energy (hot sun, short wavelengths) largely pass through the atmosphere and heat the surface
• Earth’s surface radiates to space (cooler body, longer wavelength)
• Gases like carbon dioxide selectively absorb longer wavelengths – reradiate to space and back to the surface
• Without selective absorbers Earth is 5°F
• With selective absorbers Earth is 64°F
The Real Issue in the Debate
• How much will it warm – in response to humans adding more greenhouse gases?
• How fast will it warm? • How significant will be the impact?
The first two questions will likely remain uncertain for decades.
So, for decision-makers the last question is key. It is not just a science question.It depends on what you value.
My debate with an Economist
Suppose I got a contract to cut down all
of the trees for lumber on the west side
of Austin. Good or bad?
• Suppose I got a contract to cut down all of the trees for lumber on the west side of Austin. Good or bad?
• GOOD – a product - brings in dollars; jobs bring in dollars
My debate with an Economist

• Suppose I got a contract to cut down all of the trees for lumber on the west side of Austin. Good or bad?
• GOOD – a product brings in dollars; jobs bring in dollars
• WAIT – what about beauty, habitat, ecosystem services (water)?
My debate with an Economist
• Suppose I got a contract to cut down all of the trees for lumber on the west side of Austin. Good or bad?
• GOOD – a product brings in dollars; jobs bring in dollars
• WAIT – what about beauty, habitat, ecosystem services (clean water)?
• But in one generation people won’t know what they have missed – it doesn’t have value
My debate with an Economist
The Changing Debate on Climate Change
What do scientists really believe about global warming?
What are the predictions for the future?
What are the potential impacts?
The Changing Debate on Climate Change
What do scientists really believe about global warming?
What are the predictions for the future?
What are the potential impacts?

What do climate experts say about global warming?

Foundations
• Carbon dioxide is a selective absorber
• Greenhouse gases are increasing (due to burning oil, coal and deforestation)
• Increased greenhouse gases promote warming
• Draw down of gases will take centuries
• Aerosols have human sources
• Many aerosols promote cooling
• The planet has warmed 1°F in a century

The Smoking Gun
1000 years of global CO2 and temperature change
Temperature Change
CO2 Concentrations
Carbon Emissions
Land-use ChangeFossil-fuels
U.S. Global Change Research Program
1
0.8
0.6
0.4
0.2
0
-0.2
-0.4
-0.61000
11001200
13001400
15001600
17001800
19002000
10001100
12001300
14001500
16001700
18001900
2000
10001100
12001300
14001500
16001700
18001900
2000
Bill
ion
s o
f M
etr
ic T
on
sC
O2 P
arts
pe
r M
illi
on
by
Vo
lum
e (
PP
MV
)T
em
pe
ratu
re C
han
ge
°F
380
360
340
320
300
280
260
8
6
4
2
0
Year
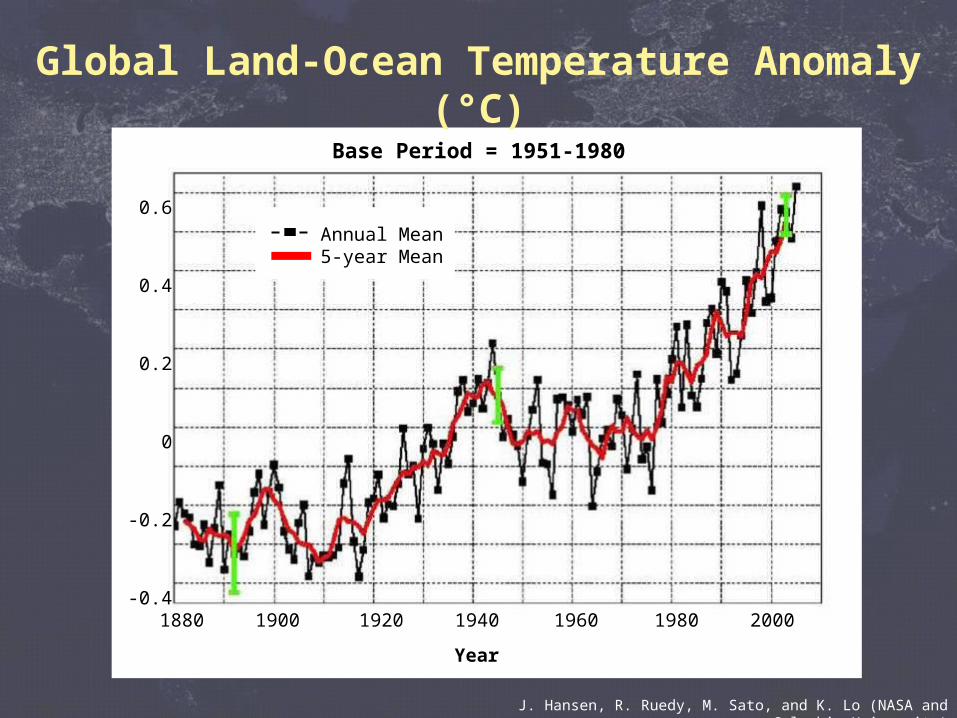
Global Land-Ocean Temperature Anomaly (°C)
0.6
0.4
0.2
0
-0.2
-0.41880 1900 1920 1940 1960 1980 2000
Annual Mean5-year Mean
Base Period = 1951-1980
Year
J. Hansen, R. Ruedy, M. Sato, and K. Lo (NASA and Columbia University)
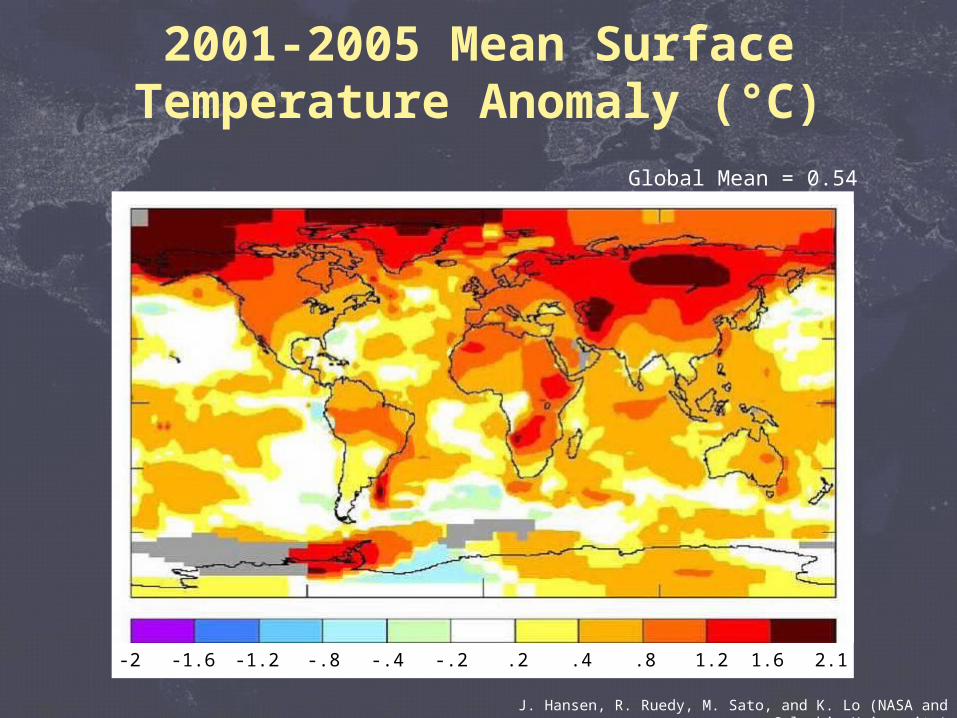
2001-2005 Mean Surface Temperature Anomaly (°C)
Global Mean = 0.54
-2 -1.6 -1.2 -.8 -.4 -.2 .2 .4 .8 1.2 1.6 2.1
J. Hansen, R. Ruedy, M. Sato, and K. Lo (NASA and Columbia University)

Predictions that are virtually certain
The stratosphere will cool.
NASA
Thickness of atmospheric layers exaggerated for clarity.
Lower Stratosphere(13-19 km) Cooling
Upper Troposphere(8-13 km) Warming
Lower Troposphere(0-8 km) Slight Warming
Earth’s SurfaceWarming

Predictions that arevery probable
• Surface temperature will increase:
• 0.5 to 2.0°C by 2050
• 1.5 to 4.5°C for a CO2 doubling
• 2.5°C most likely
• Global precipitation will increase
• Sea ice will retreat in Northern Hemisphere
• Arctic warming

Predictions that are very probable
• Sea level will rise, 5 to 40 cm by 2050
• The effects of solar variability will not be significant over the next 50 years compared to those of CO2
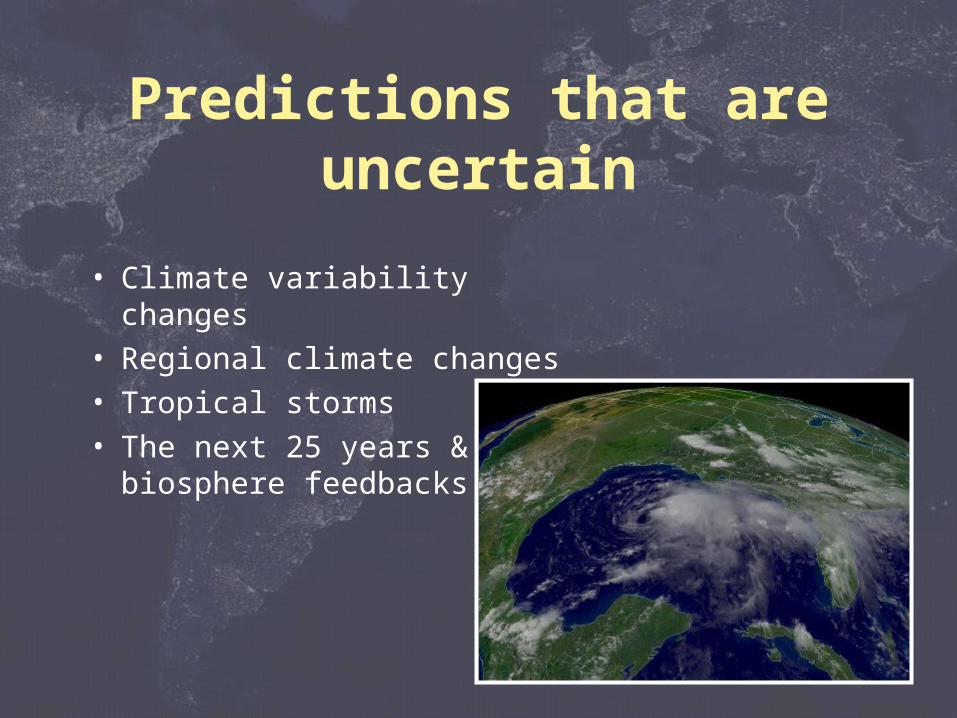
Predictions that are uncertain
• Climate variability changes
• Regional climate changes
• Tropical storms
• The next 25 years & biosphere feedbacks

What do climate models predict for the continental U.S. from 2090 to 2100?
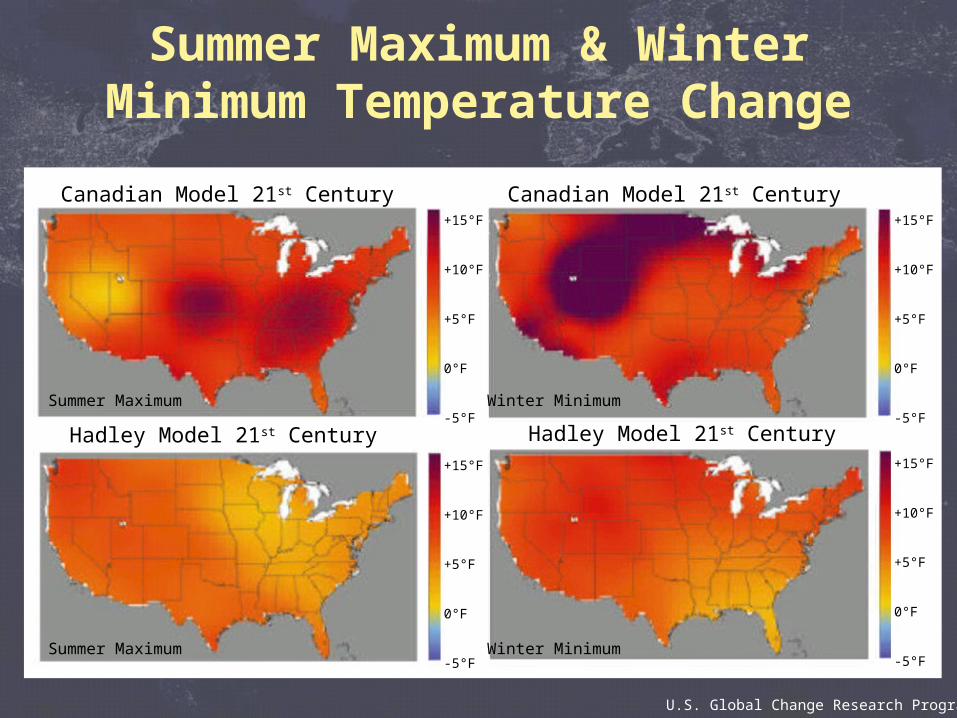
Summer Maximum & Winter Minimum Temperature Change
Canadian Model 21st Century
Summer Maximum
Canadian Model 21st Century
Hadley Model 21st Century Hadley Model 21st Century
+15°F
+10°F
+5°F
0°F
-5°F
+15°F
+10°F
+5°F
0°F
-5°F
+15°F
+10°F
+5°F
0°F
-5°F
+15°F
+10°F
+5°F
0°F
-5°FSummer Maximum
Winter Minimum
Winter Minimum
U.S. Global Change Research Program

Precipitation Change
Observed 20th Century
Canadian Model 21st Century
Hadley Model 21st Century
100%
75%
50%
25%
0
-25%
-50%
-75%
-100%
100%
75%
50%
25%
0
-25%
-50%
-75%
-100%
100%
75%
50%
25%
0
-25%
-50%
-75%
-100%
U.S. Global Change Research Program

What are the potential impacts for ecosystems, water, agriculture and health?
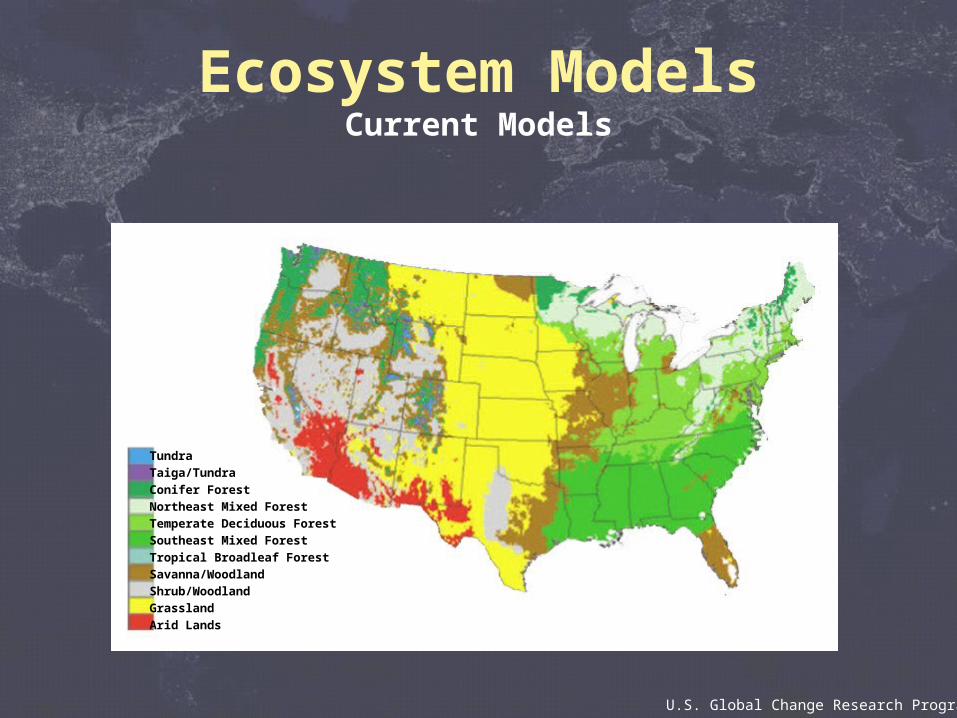
Ecosystem ModelsCurrent Models
Tundra
Taiga/Tundra
Conifer Forest
Northeast Mixed Forest
Temperate Deciduous Forest
Southeast Mixed Forest
Tropical Broadleaf Forest
Savanna/Woodland
Shrub/Woodland
Grassland
Arid Lands
U.S. Global Change Research Program
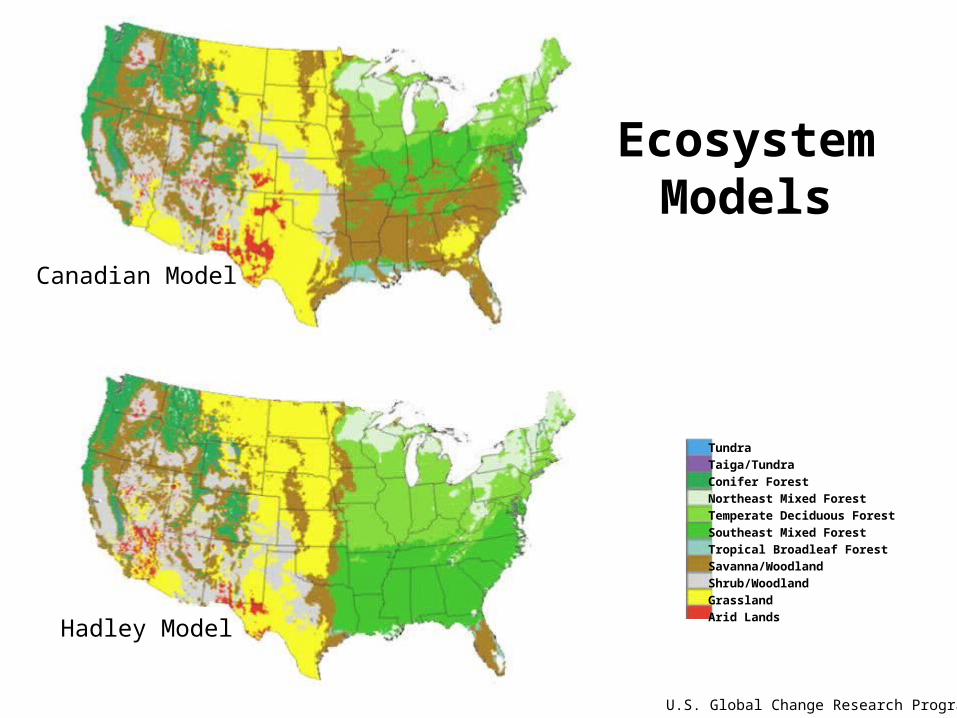
Tundra
Taiga/Tundra
Conifer Forest
Northeast Mixed Forest
Temperate Deciduous Forest
Southeast Mixed Forest
Tropical Broadleaf Forest
Savanna/Woodland
Shrub/Woodland
Grassland
Arid Lands
Canadian Model
Hadley Model
Ecosystem Models
U.S. Global Change Research Program

Even Hadley model says no sugar maples in the U.S.
Projected Changes in Distribution of Sugar Maple Trees
Iverson et al. 1999
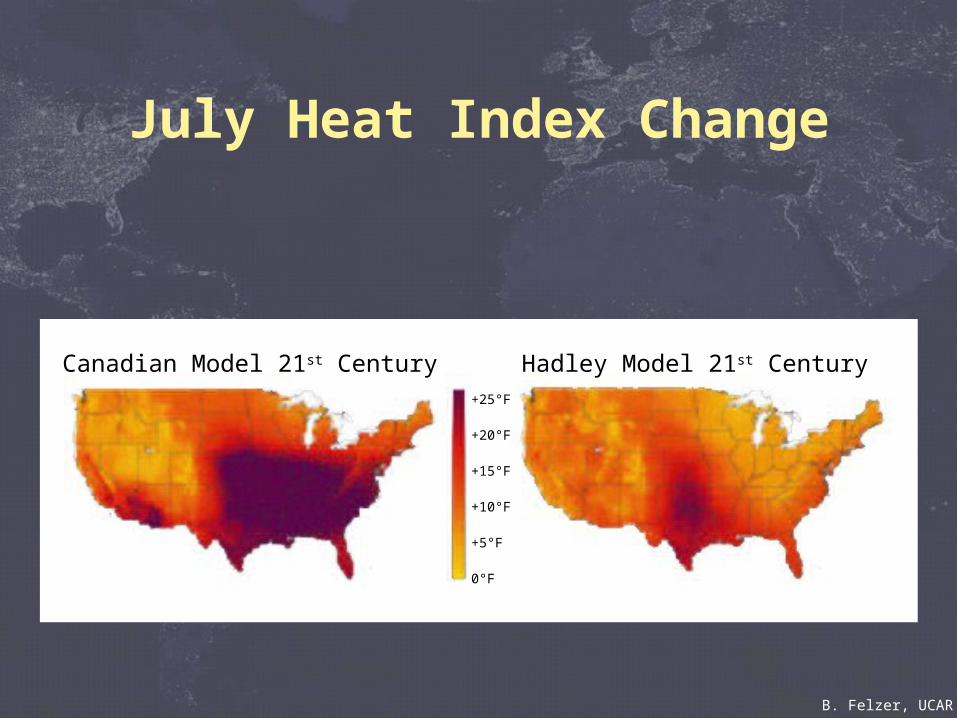
July Heat Index Change
Canadian Model 21st Century Hadley Model 21st Century+25°F
+20°F
+15°F
+10°F
+5°F
0°F
B. Felzer, UCAR

Heat Mortality and Climate ChangeHeat-related deaths in Chicago in July 1995
NOAA/NCDC
7/11
7/12
7/13
7/14
7/15
7/16
7/17
7/18
7/19
7/20
7/21
7/22
7/23
120
115
110
105
100
95
90
85
80
75
180
160
140
120
100
80
60
40
20
0
Num
ber
of
Hea
t-re
late
d D
eath
s
Max
imum
Te
mpe
ratu
re (
°F)
or
Max
Hea
t In
dex
Heat IndexMax TemperatureDeaths

Vector-borne DiseaseReported Cases of Dengue 1980 - 1999
Mexico
Texas:64 Cases
Border States:62,514 Cases
HIH, Mexico; TDH; U.S. PHS
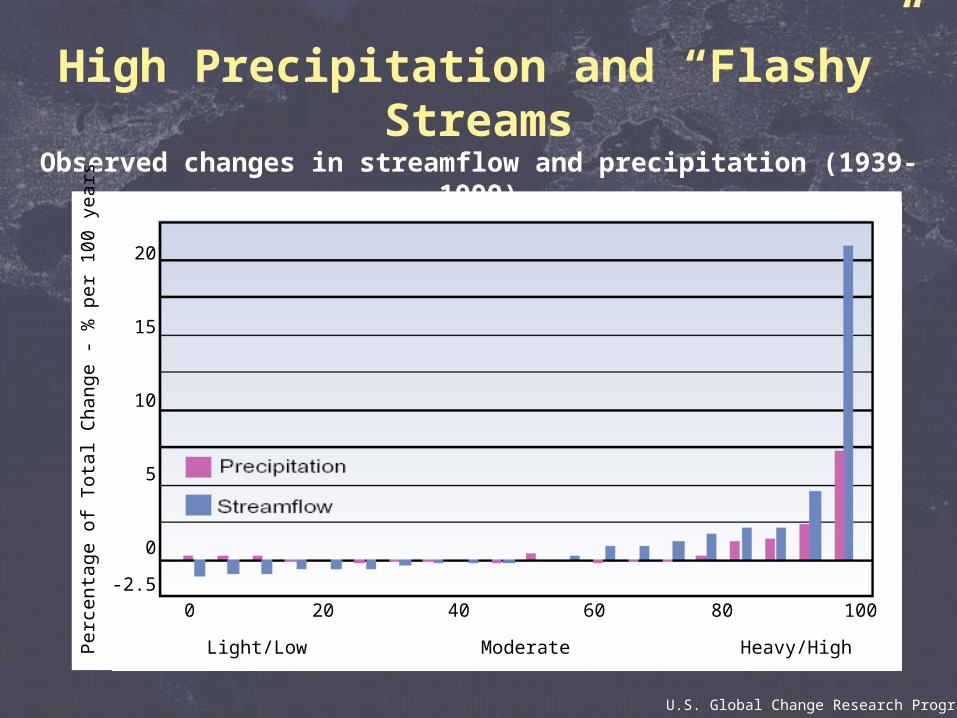
High Precipitation and “Flashy” StreamsObserved changes in streamflow and precipitation (1939-1999)
U.S. Global Change Research Program
Per
cen
tag
e o
f T
ota
l Cha
nge
- %
pe
r 1
00 y
ear
s
20
15
10
5
0
-2.5
0 20 40 60 80 100
Light/Low Moderate Heavy/High
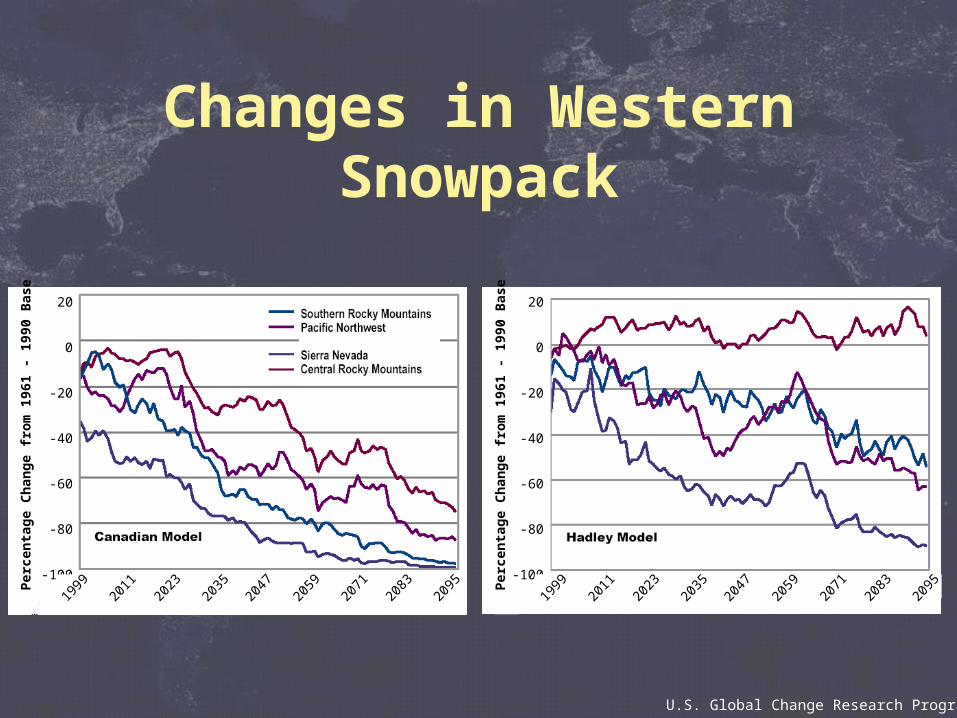
Changes in Western Snowpack
Per
cen
tag
e C
han
ge
fro
m 1
961
- 19
90 B
ase
U.S. Global Change Research Program
20
0
-20
-40
-60
-80
-100
1999
2011
2023
2035
2047
2059
2071
2083
2095
Per
cen
tag
e C
han
ge
fro
m 1
961
- 19
90 B
ase 20
0
-20
-40
-60
-80
-100
1999
2011
2023
2035
2047
2059
2071
2083
2095

Projected Trends in the PDSI21st Century Hadley Model
TrendsPalmer Drought
Severity Index / 100yr
More tendency towards drought

Projected Trends in the PDSI21st Century Canadian Model
TrendsPalmer Drought
Severity Index / 100yr
More tendency towards drought

Corn Yields and Weather EventsCorn Yields in U.S. 1950 - 1999
U.S. Global Change Research Program
Bu
shel
s p
er A
cre
140
120
100
80
60
40
20
01950 1960 1970 1980 1990 1999
Year

Projected Summer Sea Ice ChangeCanadian Model: An ice-free Arctic summer
U.S. Global Change Research Program
Current Sea Ice Extent 2030 Sea Ice Extent 2095 Sea Ice Extent

The Changing Debate on Global Warming
What do scientists really believe about
global warming?
What are the predictions for the future?
What are the potential impacts?