Embed Size (px)
Citation preview
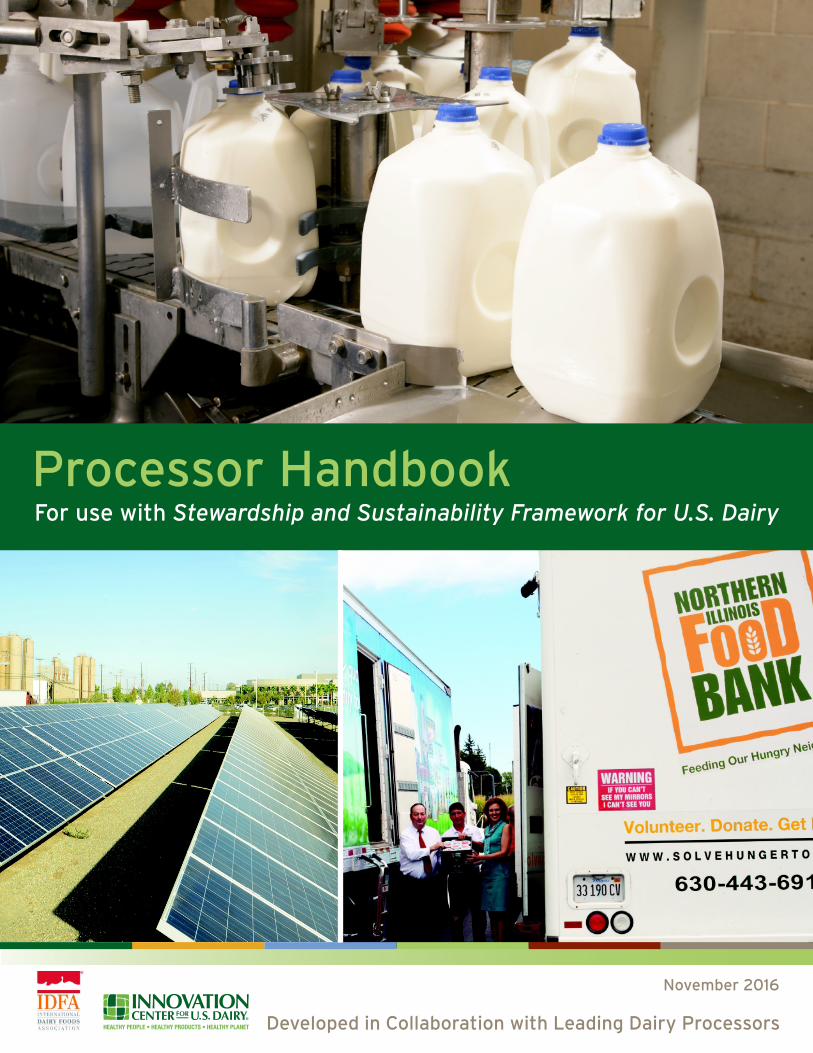
Processor Handbook For use with Stewardship and Sustainability Framework for U.S. Dairy
Developed in Collaboration with Leading Dairy Processors
November 2016
About this Resource
This Processor Handbook is a supplementary resource to the
Stewardship and Sustainability Framework for U.S. Dairy (Framework)
developed to support dairy cooperatives, processors, manufacturers
and milk marketing organizations that choose to voluntarily track
and communicate progress. This handbook provides measurement
guidance for processors across topics essential to sustainable plant
operations including: energy and greenhouse gas intensity, water use,
resource recovery (waste management), employee investment and
community contributions.
This handbook was developed to aid dairy processors in credibly and
consistently using the Framework. It provides insights and guidance
which processors can use to assess the sustainability of their operations,
highlight responsible management practices and demonstrate the
industry’s dedication to continuous improvement against the indicators
and metrics defined in the Framework.
The Innovation Center for U.S. Dairy® (Innovation Center) in partnership with dairy farmers and businesses
across the industry intends to continually update the Framework to reflect the latest scientific information
and generally-accepted best practices. Through collaboration with the International Dairy Foods
Association (IDFA) as well as leading dairy processors, the handbook will be updated accordingly. It is the
user’s responsibility to refer to the most updated version of both the Framework and Processor Handbook.
THE INFORMATION AND INDICATORS PROVIDED IN THE FRAMEWORK AND HANDBOOK DOCUMENTS ARE
BASED ON STAKEHOLDER INPUT AND STATISTICAL ESTIMATES, AND NOT ON AN ACTUAL ASSESSMENT
OF A DAIRY FARM’S OR DAIRY COMPANY’S BUSINESS NEEDS. AS SUCH, THE INFORMATION AND
INDICATORS SHOULD NOT FORM THE BASIS FOR DECISIONS WITHOUT FIRST OBTAINING APPROPRIATE
PROFESSIONAL, SCIENTIFIC, ENGINEERING AND/OR LEGAL ADVICE SPECIFIC TO THE BUSINESS.
THE FRAMEWORK AND HANDBOOK ARE PROVIDED TO INFORM THE SUSTAINABILITY EFFORTS OF
THE DAIRY COMMUNITY, BUT COMPANIES ARE RESPONSIBLE FOR THEIR OWN BUSINESS DECISIONS.
IN NO EVENT WILL THE INNOVATION CENTER FOR U.S. DAIRY, DAIRY MANAGEMENT INC. OR THE
INTERNATIONAL DAIRY FOODS ASSOCIATION BE LIABLE FOR ANY LOSSES OR DAMAGES, INCLUDING
WITHOUT LIMITATION, INDIRECT OR CONSEQUENTIAL LOSS OR DAMAGE WHATSOEVER ARISING FROM
LOSS OF PROFITS FROM THE USE OF THE INFORMATION AND INDICATORS PROVIDED HEREIN.
Download the most up-
to-date Framework and
Processor Handbook at:
www.USDairy.com/framework

Table of Contents
Metrics to Measure Progress 1 Determine the scope of Framework indicators
Processor Indicators at a Glance 2 Use an easy-to-reference overview chart
Energy Use 3 Improve energy efficiency and save money
Greenhouse Gas 8 Reduce GHG emissions and carbon footprint
Water 11 Responsibly manage water use
Resource Recovery 16 Optimize resources through recovery, recycling and reuse
Employee Investment 22 Maintain productive employees and a great work environment
Community Contributions 26 Support local communities
Scope of the Indicators and MetricsThe Framework’s indicators and metrics1 can be used by processors of fluid milk and dairy products (e.g., cheese, yogurt and ice cream). The scope of the indicators includes all company-owned facilities. Also, when in an organization’s direct operational control, the energy and water indicators cover transportation of milk from the farm and to the retail or service center. The greenhouse gas (GHG) intensity
indicator aligns with widely accepted GHG accounting practices and measures — Scope 1 (direct GHG emissions) and Scope 2 (GHG emissions from consumption of purchased electricity, heat or steam) — in the GHG protocol established by the World Resources Institute and World Business Council for Sustainable Development.2
Dairy companies should explain the boundaries of the reported information in their sustainability communications. If the scope or boundary of the reported information differs from the scope of Framework indicators, the dairy company should explain the difference and rationale for deviation.
Chapter at a Glance
Measuring sustainability indicators at the dairy
processor level supports identification of business risks,
while also providing opportunities for cost reduction
and income generation. Processors have opportunities
to enhance their leadership in sustainability through the
verification and communication of their sustainability
performance to stakeholders, which also enhances the
broader reputation of the dairy industry.
The indicators for processors are intended to
communicate to a range of stakeholders, such as
customers and engaged consumers, for the purposes of:
• Informing stakeholders about the most important
aspects of sustainable plant and transportation
operations.
• Inviting stakeholders to review, pilot and provide
feedback on Framework indicators so they can be
refined or expanded as needed.
• Highlighting responsible management practices in
key areas.
• Communicating about the dairy community’s
dedication to continuous improvement.
When communicating about a processor’s sustainability
performance, it is important to provide readers
with contextual information including management
strategies, priorities and risks and opportunities related
to the environmental, community and economic topics
identified in this handbook. This information enables
stakeholders and reviewers to more fully understand the
company and landscape in which it operates.
Value of Measurement
Value of Measurement
Key Reporting Criteria
Indicators
Metrics to Measure Progress
1
© 20
16 Innovation C
enter for U.S. D
airy. All rights reserved. M
etrics to M
easure
Pro
gress
Key Reporting Criteria
When reporting the Framework's processor metrics, please note the following:
• T The indicators, in their current format, should not be used to benchmark dairy companies against each other. The metrics do not include standardized allocations of input, output and processes; therefore, comparisons could lead to false interpretation of the performance of companies.
• Metrics are company-wide and should be used to measure and report by aggregating the totals from all facilities. If any facilities are excluded from an indicator, the company should document the boundaries and explain the rationale.
• When comparing the performance of plants within the same company, the methods of measurement used in each plant must be the same.
• Some companies may process or produce non-dairy products. In that case, the company should indicate whether or not non-dairy products are included in the measurement and reporting.
1Indicator and metric terms defined on page 1 of the Framework (www.usdairy.com/framework)2http://www.ghgprotocol.org
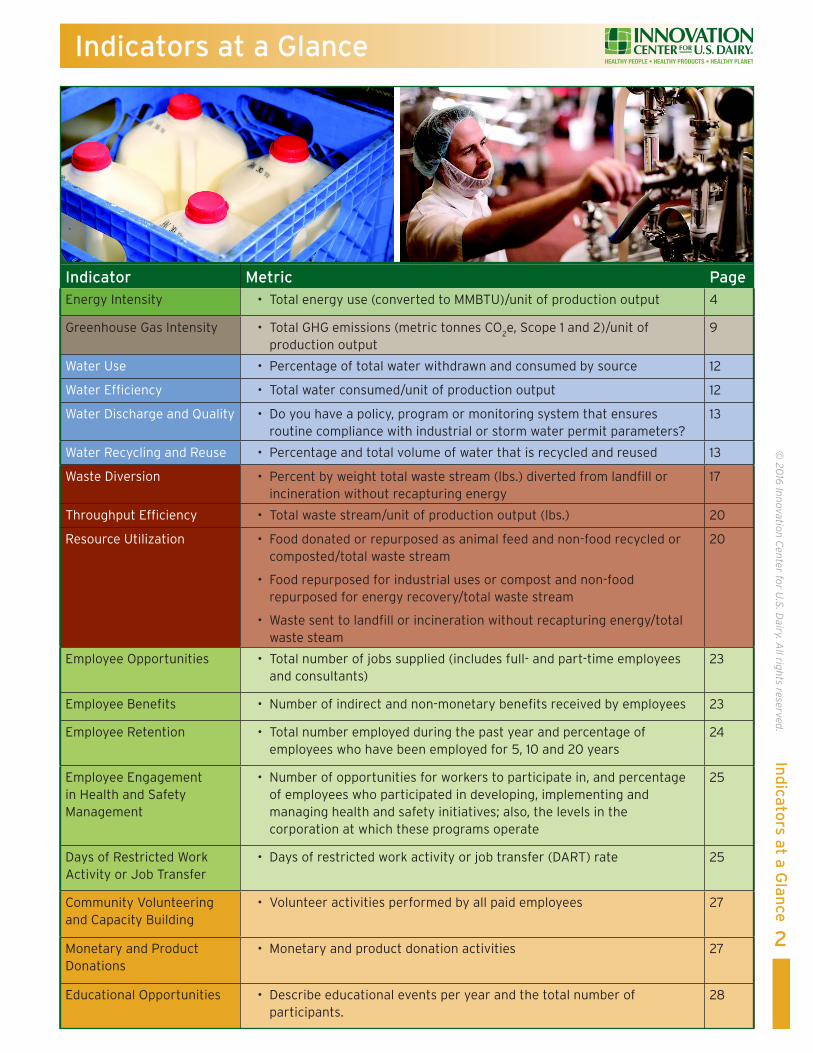
Indicators at a Glance
Indicator Metric PageEnergy Intensity • Total energy use (converted to MMBTU)/unit of production output 4
Greenhouse Gas Intensity • Total GHG emissions (metric tonnes CO2e, Scope 1 and 2)/unit of
production output9
Water Use • Percentage of total water withdrawn and consumed by source 12
Water Efficiency • Total water consumed/unit of production output 12
Water Discharge and Quality • Do you have a policy, program or monitoring system that ensures routine compliance with industrial or storm water permit parameters?
13
Water Recycling and Reuse • Percentage and total volume of water that is recycled and reused 13
Waste Diversion • Percent by weight total waste stream (lbs.) diverted from landfill or incineration without recapturing energy
17
Throughput Efficiency • Total waste stream/unit of production output (lbs.) 20
Resource Utilization • Food donated or repurposed as animal feed and non-food recycled or composted/total waste stream
• Food repurposed for industrial uses or compost and non-food repurposed for energy recovery/total waste stream
• Waste sent to landfill or incineration without recapturing energy/total waste steam
20
Employee Opportunities • Total number of jobs supplied (includes full- and part-time employees and consultants)
23
Employee Benefits • Number of indirect and non-monetary benefits received by employees 23
Employee Retention • Total number employed during the past year and percentage of employees who have been employed for 5, 10 and 20 years
24
Employee Engagement in Health and Safety Management
• Number of opportunities for workers to participate in, and percentage of employees who participated in developing, implementing and managing health and safety initiatives; also, the levels in the corporation at which these programs operate
25
Days of Restricted Work Activity or Job Transfer
• Days of restricted work activity or job transfer (DART) rate 25
Community Volunteering and Capacity Building
• Volunteer activities performed by all paid employees 27
Monetary and Product Donations
• Monetary and product donation activities 27
Educational Opportunities • Describe educational events per year and the total number of participants.
28
2
© 20
16 Innovation C
enter for U.S. D
airy. All rights reserved. In
dicato
rs at a Glan
ce
Why Measure Energy?Energy is frequently managed as part of a sustainability program due to the environmental impacts, including GHG emissions of the production and use of energy sources. This indicator reveals a dairy company’s relative energy intensity or the amount of energy used to produce a specific quantity of finished product.
Chapter at a Glance
Energy efficiency benefits a company by reducing
carbon footprint, controlling energy costs and
improving energy efficiency. Better energy
management can, also, result in:
• Lowering operational costs and future
dependency on nonrenewable energy sources.
• Reducing regulations and issues related to air
pollution and GHG emissions.
• Easing vulnerability to energy price volatility.
• Enhancing reputation with buyers and
consumers.
If tracked over time, it can demonstrate the
result of proactive efforts to improve energy
intensity by introducing new technologies and/or
management practices.
Energy intensity, however, should be analyzed within
the context of a company’s operations and production
outputs. An improved intensity ratio is not a direct
indication of reduced GHG emissions and, therefore,
should be analyzed with care3
Scope of the IndicatorThe energy intensity indicator includes measurement
of direct and indirect energy reported as total energy
use per unit of output. Direct energy is used during
transportation of milk from the farm to the processing
plants and from processing plants to retail or service
centers. Examples include gasoline and/or diesel
consumption. Also, it includes energy used during the
processing and manufacturing operations, such as
electricity used for heating and cooling.
Indirect energy is used upstream in the supply chain
for the production of energy that is purchased and
consumed by the dairy company for plant or truck
manufacturing operations, such as electricity used for
heating and cooling. The most common example is fuel
consumed outside the company’s boundary in order
to generate electricity to be consumers inside the
company’s boundary.
Value of Measurement
Value of Measurement
Scope of Indicator
Measure and Report
Resources/Definitions
Energy Use
3
© 20
16 Innovation C
enter for U.S. D
airy. All rights reserved. E
ne
rgy
Use
Indicator MetricEnergy Intensity • Total energy use (converted to MMBTU)/unit of production output
• Unit of production output can include:
º Gallon (milk, ice cream or other frozen products)
º Pound of product (e.g., milk, cheese, butter)
º Unit of representative product mix (can include both dairy and
non-dairy products)
3A. Brush, E. Masanet and E. Worrell. “Energy Efficiency Improvement and Cost Saving Opportunities for the Dairy Processing Industry,” Environmental Energy Technologies Division, Ernest Orlando Lawrence Berkeley National Laboratory, sponsored by the U.S. Environmental Protection Agency (2011).
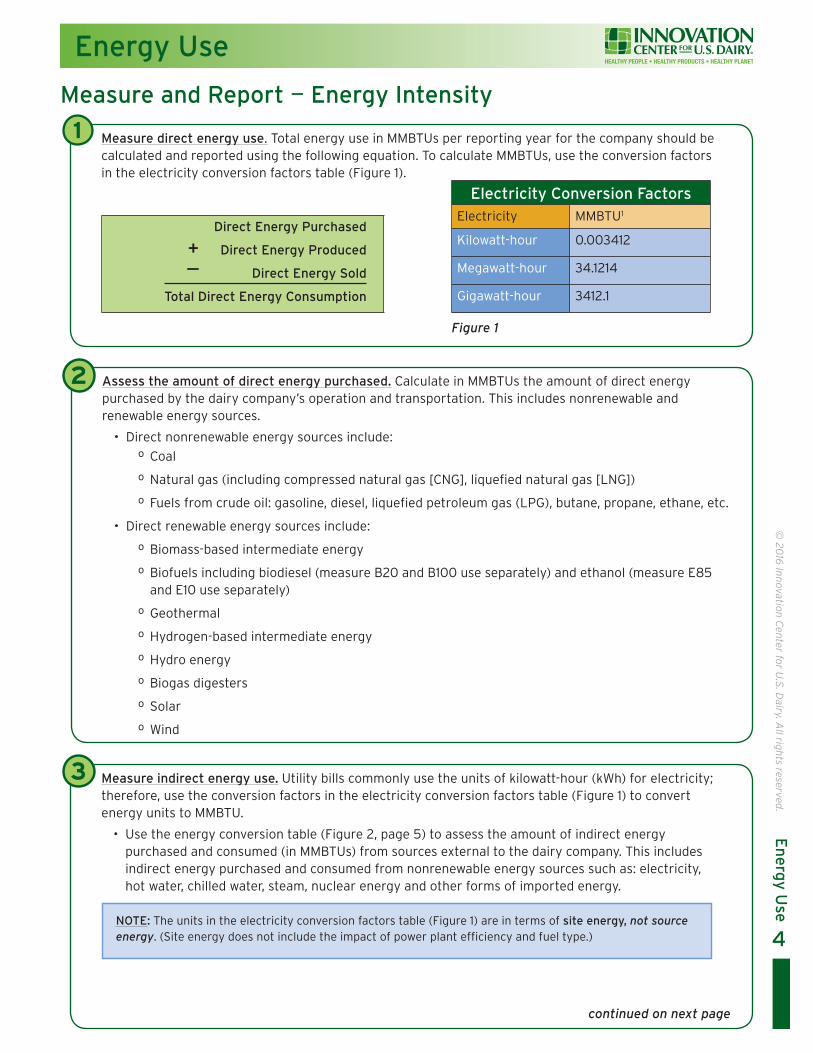
Assess the amount of direct energy purchased. Calculate in MMBTUs the amount of direct energy purchased by the dairy company’s operation and transportation. This includes nonrenewable and renewable energy sources.
• Direct nonrenewable energy sources include:
º Coal
º Natural gas (including compressed natural gas [CNG], liquefied natural gas [LNG])
º Fuels from crude oil: gasoline, diesel, liquefied petroleum gas (LPG), butane, propane, ethane, etc.
• Direct renewable energy sources include:
º Biomass-based intermediate energy
º Biofuels including biodiesel (measure B20 and B100 use separately) and ethanol (measure E85 and E10 use separately)
º Geothermal
º Hydrogen-based intermediate energy
º Hydro energy
º Biogas digesters
º Solar
º Wind
Measure direct energy use. Total energy use in MMBTUs per reporting year for the company should be calculated and reported using the following equation. To calculate MMBTUs, use the conversion factors in the electricity conversion factors table (Figure 1).
Measure indirect energy use. Utility bills commonly use the units of kilowatt-hour (kWh) for electricity; therefore, use the conversion factors in the electricity conversion factors table (Figure 1) to convert energy units to MMBTU.
• Use the energy conversion table (Figure 2, page 5) to assess the amount of indirect energy purchased and consumed (in MMBTUs) from sources external to the dairy company. This includes indirect energy purchased and consumed from nonrenewable energy sources such as: electricity, hot water, chilled water, steam, nuclear energy and other forms of imported energy.
Measure and Report — Energy Intensity
1
3
2
Energy Use
Electricity Conversion FactorsElectricity MMBTU1
Kilowatt-hour 0.003412
Megawatt-hour 34.1214
Gigawatt-hour 3412.1
4
© 20
16 Innovation C
enter for U.S. D
airy. All rights reserved. E
ne
rgy
Use
Figure 1
continued on next page
Direct Energy Purchased
+ Direct Energy Produced
— Direct Energy Sold
Total Direct Energy Consumption
NOTE: The units in the electricity conversion factors table (Figure 1) are in terms of site energy, not source energy. (Site energy does not include the impact of power plant efficiency and fuel type.)
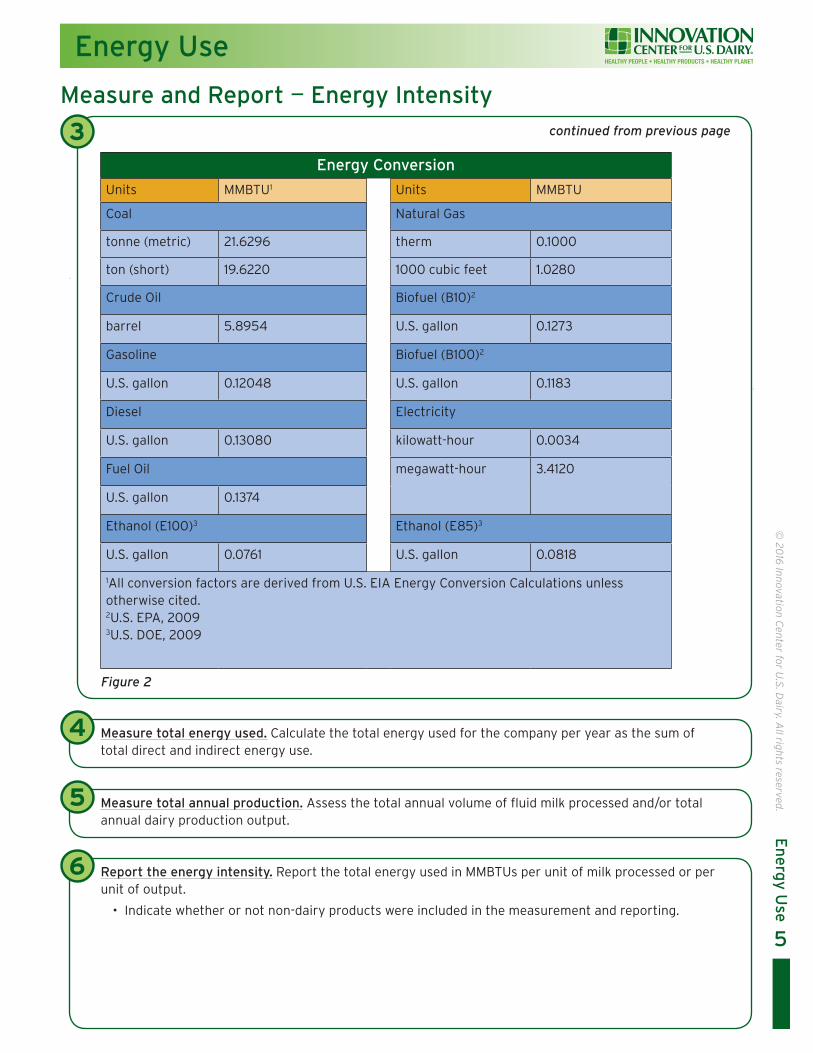
3Energy Conversion
Units MMBTU1 Units MMBTU
Coal Natural Gas
tonne (metric) 21.6296 therm 0.1000
ton (short) 19.6220 1000 cubic feet 1.0280
Crude Oil Biofuel (B10)2
barrel 5.8954 U.S. gallon 0.1273
Gasoline Biofuel (B100)2
U.S. gallon 0.12048 U.S. gallon 0.1183
Diesel Electricity
U.S. gallon 0.13080 kilowatt-hour 0.0034
Fuel Oil megawatt-hour 3.4120
U.S. gallon 0.1374
Ethanol (E100)3 Ethanol (E85)3
U.S. gallon 0.0761 U.S. gallon 0.0818
1All conversion factors are derived from U.S. EIA Energy Conversion Calculations unless otherwise cited.2U.S. EPA, 2009 3U.S. DOE, 2009
Energy Use
5
© 20
16 Innovation C
enter for U.S. D
airy. All rights reserved. E
ne
rgy
Use
Figure 2
Measure total energy used. Calculate the total energy used for the company per year as the sum of total direct and indirect energy use.
Measure total annual production. Assess the total annual volume of fluid milk processed and/or total annual dairy production output.
Report the energy intensity. Report the total energy used in MMBTUs per unit of milk processed or per unit of output.
• Indicate whether or not non-dairy products were included in the measurement and reporting.
4
5
6
Measure and Report — Energy Intensitycontinued from previous page
Optional measurement considerations. Consider reporting energy consumption in MMBTUs both in total and broken down by renewable primary energy source as an additional information point for the company.
• Renewable energy sources include:
º Biomass-based intermediate energy
º Biofuels including biodiesel (measure B20 and B100 use separately) and ethanol (measure E85 and E10 separately)
º Geothermal
º Hydrogen-based intermediate energy
º Hydro energy
º Biogas digesters
º Solar
º Wind
Documentation. Energy use information can be obtained by reviewing invoices, measured or calculated heat/fuel accounting or estimations.
• Amounts of MMBTUs can be taken directly from invoices and delivery notes or can be converted using energy units multiplied by conversion factors in the “Measure indirect energy use” section in measure and report (page 4).
• For a dairy processing or manufacturing plant, annual dairy product production can be calculated from annual sales.
7
8
Measure and Report — Energy Intensity
Energy Use
6
© 20
16 Innovation C
enter for U.S. D
airy. All rights reserved. E
ne
rgy
Use
• EPA’s ENERGY STAR® Performance Indicators, www.energystar.gov: Provides industry-specific benchmarking tools to score a plant’s energy performance and compare it to that of similar plants; includes resources and guidance.
• Energy Insights and Tips, http://1.usa.gov/1OgYYfr: Includes insights on renewable energy technologies and energy saving tips for commercial buildings.
• EPA Water & Energy Efficiency by Sectors, http://bit.ly/2dvEtzH: Provides guidance on how both energy and water can be used more efficiently.
Resources
Direct energy Direct energy is a form of energy that crosses plant boundaries. It is consumed either by the plant within its boundaries, or it can be exported to another user. Direct energy can appear in either primary (e.g., natural gas for heating) or intermediate (e.g., electricity for lighting) forms. It can be purchased, extracted (e.g., coal, natural gas, oil), harvested (e.g., biomass energy), collected (e.g., solar, wind) or brought into the plant’s boundaries by other means. (Definition from Global Reporting Initiative [GRI] Guidelines and updated to make relevant to processors)
Definitions
continued on next page
Energy Use
7
© 20
16 Innovation C
enter for U.S. D
airy. All rights reserved. E
ne
rgy
Use
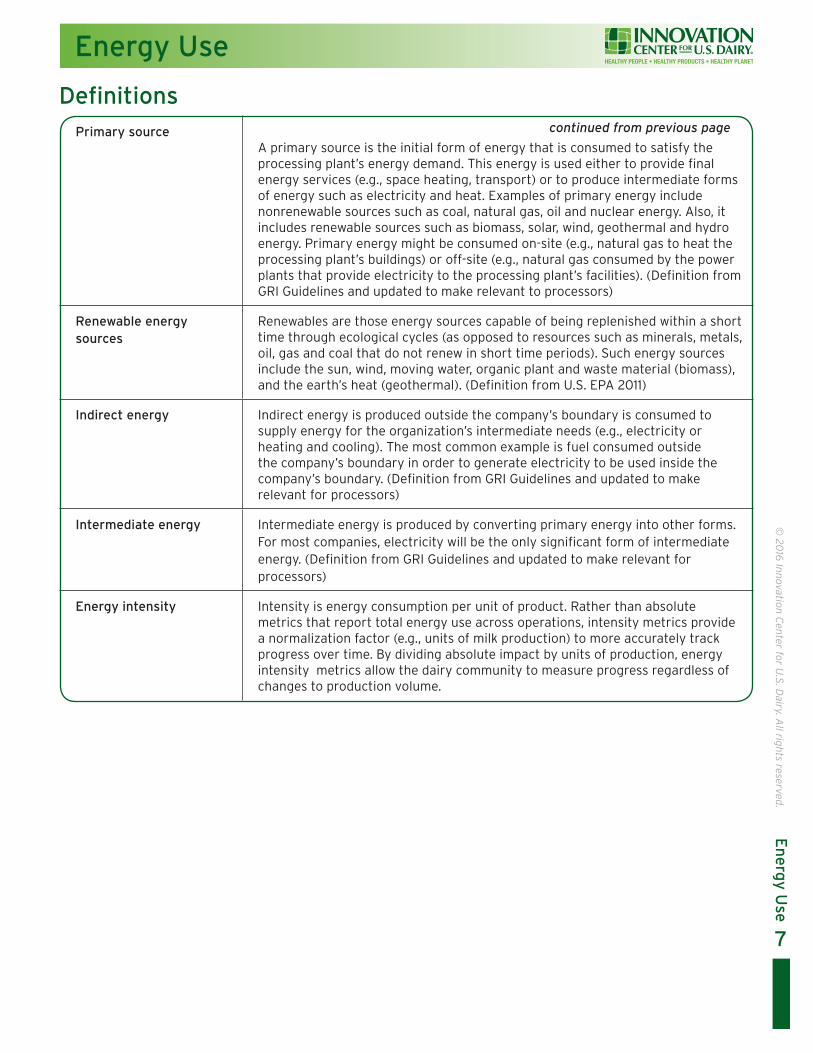
Primary sourceA primary source is the initial form of energy that is consumed to satisfy the processing plant’s energy demand. This energy is used either to provide final energy services (e.g., space heating, transport) or to produce intermediate forms of energy such as electricity and heat. Examples of primary energy include nonrenewable sources such as coal, natural gas, oil and nuclear energy. Also, it includes renewable sources such as biomass, solar, wind, geothermal and hydro energy. Primary energy might be consumed on-site (e.g., natural gas to heat the processing plant’s buildings) or off-site (e.g., natural gas consumed by the power plants that provide electricity to the processing plant’s facilities). (Definition from GRI Guidelines and updated to make relevant to processors)
Renewable energy sources
Renewables are those energy sources capable of being replenished within a short time through ecological cycles (as opposed to resources such as minerals, metals, oil, gas and coal that do not renew in short time periods). Such energy sources include the sun, wind, moving water, organic plant and waste material (biomass), and the earth’s heat (geothermal). (Definition from U.S. EPA 2011)
Indirect energy Indirect energy is produced outside the company’s boundary is consumed to supply energy for the organization’s intermediate needs (e.g., electricity or heating and cooling). The most common example is fuel consumed outside the company’s boundary in order to generate electricity to be used inside the company’s boundary. (Definition from GRI Guidelines and updated to make relevant for processors)
Intermediate energy Intermediate energy is produced by converting primary energy into other forms. For most companies, electricity will be the only significant form of intermediate energy. (Definition from GRI Guidelines and updated to make relevant for processors)
Energy intensity Intensity is energy consumption per unit of product. Rather than absolute metrics that report total energy use across operations, intensity metrics provide a normalization factor (e.g., units of milk production) to more accurately track progress over time. By dividing absolute impact by units of production, energy intensity metrics allow the dairy community to measure progress regardless of changes to production volume.
Definitionscontinued from previous page
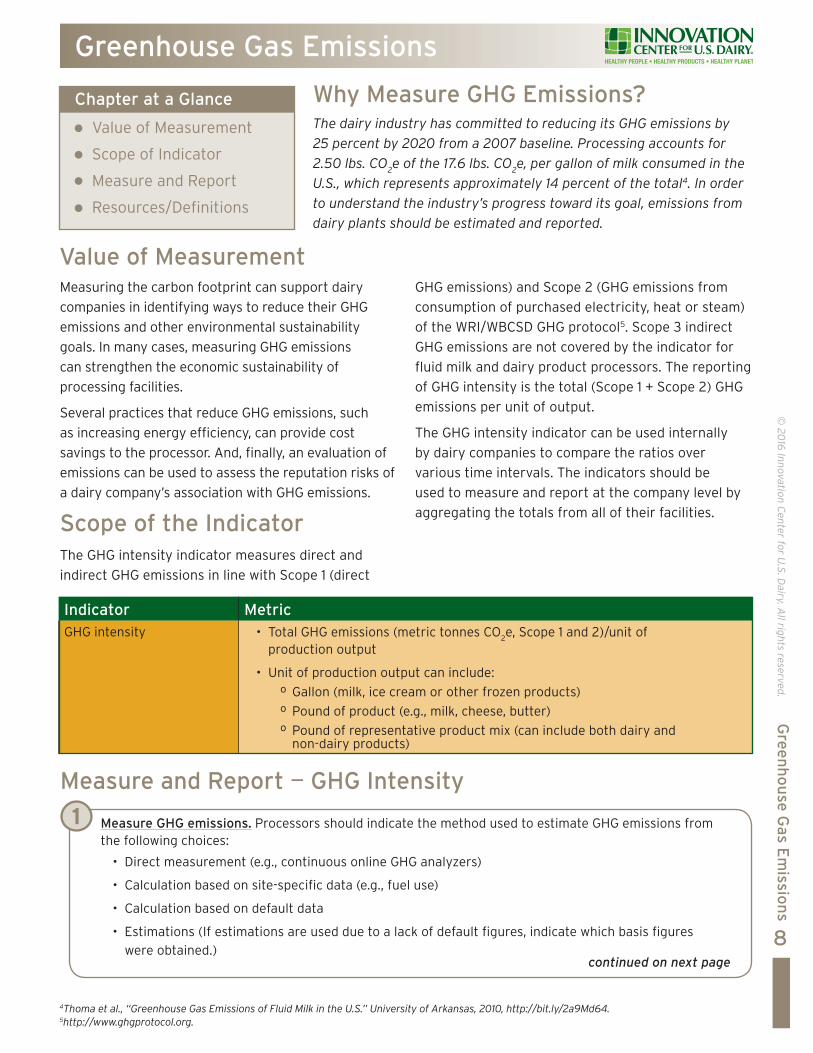
Why Measure GHG Emissions?The dairy industry has committed to reducing its GHG emissions by 25 percent by 2020 from a 2007 baseline. Processing accounts for 2.50 lbs. CO2e of the 17.6 lbs. CO2e, per gallon of milk consumed in the U.S., which represents approximately 14 percent of the total4. In order to understand the industry’s progress toward its goal, emissions from dairy plants should be estimated and reported.
Measuring the carbon footprint can support dairy
companies in identifying ways to reduce their GHG
emissions and other environmental sustainability
goals. In many cases, measuring GHG emissions
can strengthen the economic sustainability of
processing facilities.
Several practices that reduce GHG emissions, such
as increasing energy efficiency, can provide cost
savings to the processor. And, finally, an evaluation of
emissions can be used to assess the reputation risks of
a dairy company’s association with GHG emissions.
Scope of the IndicatorThe GHG intensity indicator measures direct and
indirect GHG emissions in line with Scope 1 (direct
GHG emissions) and Scope 2 (GHG emissions from
consumption of purchased electricity, heat or steam)
of the WRI/WBCSD GHG protocol5. Scope 3 indirect
GHG emissions are not covered by the indicator for
fluid milk and dairy product processors. The reporting
of GHG intensity is the total (Scope 1 + Scope 2) GHG
emissions per unit of output.
The GHG intensity indicator can be used internally
by dairy companies to compare the ratios over
various time intervals. The indicators should be
used to measure and report at the company level by
aggregating the totals from all of their facilities.
Value of Measurement
Indicator MetricGHG intensity • Total GHG emissions (metric tonnes CO
2e, Scope 1 and 2)/unit of
production output
• Unit of production output can include:
º Gallon (milk, ice cream or other frozen products)
º Pound of product (e.g., milk, cheese, butter)
º Pound of representative product mix (can include both dairy and non-dairy products)
8
© 20
16 Innovation C
enter for U.S. D
airy. All rights reserved. G
ree
nh
ou
se G
as Em
ission
s Greenhouse Gas Emissions
4Thoma et al., “Greenhouse Gas Emissions of Fluid Milk in the U.S.” University of Arkansas, 2010, http://bit.ly/2a9Md64.5http://www.ghgprotocol.org.
Chapter at a Glance
Value of Measurement
Scope of Indicator
Measure and Report
Resources/Definitions
Measure GHG emissions. Processors should indicate the method used to estimate GHG emissions from the following choices:
• Direct measurement (e.g., continuous online GHG analyzers)
• Calculation based on site-specific data (e.g., fuel use)
• Calculation based on default data
• Estimations (If estimations are used due to a lack of default figures, indicate which basis figures
were obtained.)
1
Measure and Report — GHG Intensity
continued on next page
9
© 20
16 Innovation C
enter for U.S. D
airy. All rights reserved.
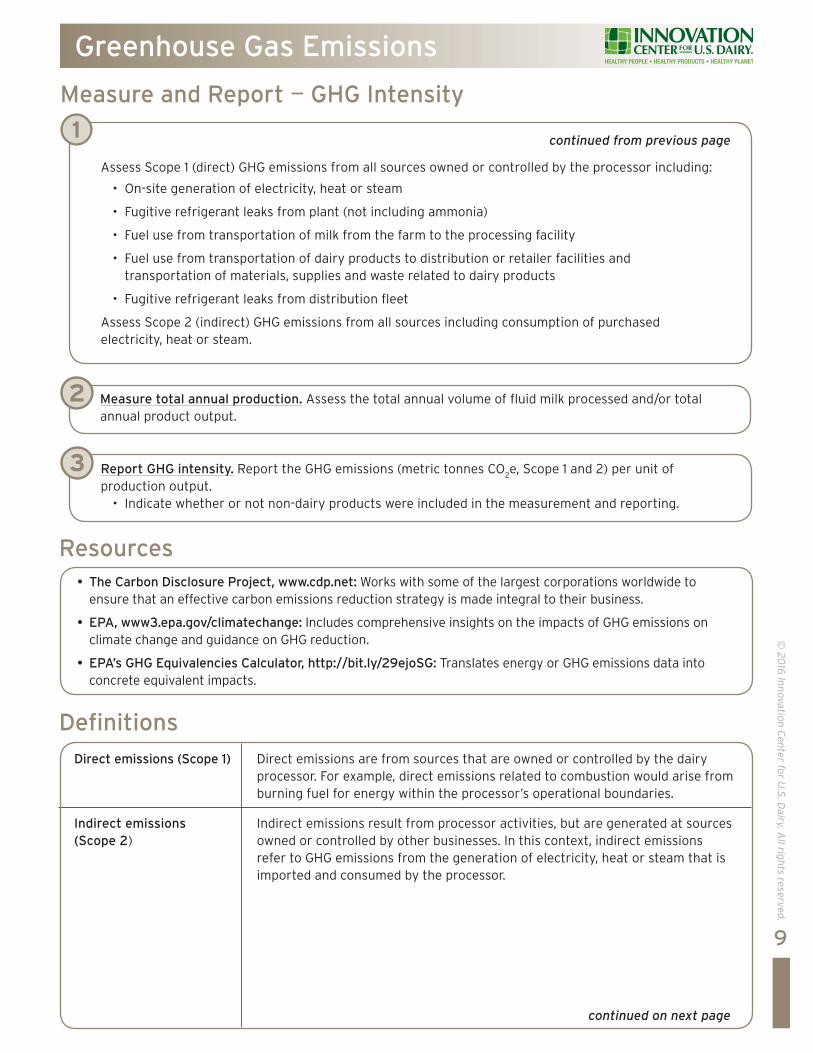
Assess Scope 1 (direct) GHG emissions from all sources owned or controlled by the processor including:
• On-site generation of electricity, heat or steam
• Fugitive refrigerant leaks from plant (not including ammonia)
• Fuel use from transportation of milk from the farm to the processing facility
• Fuel use from transportation of dairy products to distribution or retailer facilities and transportation of materials, supplies and waste related to dairy products
• Fugitive refrigerant leaks from distribution fleet
Assess Scope 2 (indirect) GHG emissions from all sources including consumption of purchased electricity, heat or steam.
Measure total annual production. Assess the total annual volume of fluid milk processed and/or total annual product output.
Report GHG intensity. Report the GHG emissions (metric tonnes CO2e, Scope 1 and 2) per unit of
production output. • Indicate whether or not non-dairy products were included in the measurement and reporting.
1
2
3
Measure and Report — GHG Intensity
Greenhouse Gas Emissions
• The Carbon Disclosure Project, www.cdp.net: Works with some of the largest corporations worldwide to ensure that an effective carbon emissions reduction strategy is made integral to their business.
• EPA, www3.epa.gov/climatechange: Includes comprehensive insights on the impacts of GHG emissions on climate change and guidance on GHG reduction.
• EPA’s GHG Equivalencies Calculator, http://bit.ly/29ejoSG: Translates energy or GHG emissions data into concrete equivalent impacts.
Resources
continued from previous page
Direct emissions (Scope 1) Direct emissions are from sources that are owned or controlled by the dairy processor. For example, direct emissions related to combustion would arise from burning fuel for energy within the processor’s operational boundaries.
Indirect emissions (Scope 2)
Indirect emissions result from processor activities, but are generated at sources owned or controlled by other businesses. In this context, indirect emissions refer to GHG emissions from the generation of electricity, heat or steam that is imported and consumed by the processor.
Definitions
continued on next page
10
© 20
16 Innovation C
enter for U.S. D
airy. All rights reserved. G
ree
nh
ou
se G
as Em
ission
s
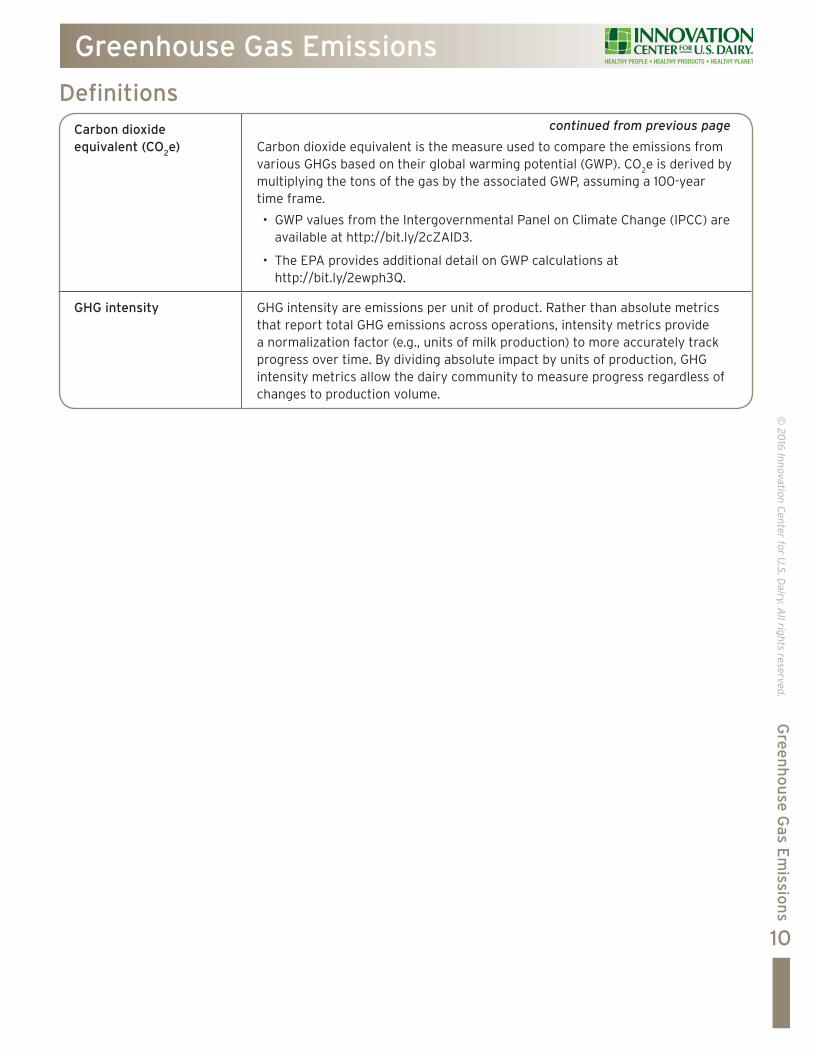
Carbon dioxide equivalent (CO
2e) Carbon dioxide equivalent is the measure used to compare the emissions from
various GHGs based on their global warming potential (GWP). CO2e is derived by
multiplying the tons of the gas by the associated GWP, assuming a 100-year time frame.
• GWP values from the Intergovernmental Panel on Climate Change (IPCC) are available at http://bit.ly/2cZAlD3.
• The EPA provides additional detail on GWP calculations at http://bit.ly/2ewph3Q.
GHG intensity GHG intensity are emissions per unit of product. Rather than absolute metrics that report total GHG emissions across operations, intensity metrics provide a normalization factor (e.g., units of milk production) to more accurately track progress over time. By dividing absolute impact by units of production, GHG intensity metrics allow the dairy community to measure progress regardless of changes to production volume.
Greenhouse Gas Emissions
Definitionscontinued from previous page
Water
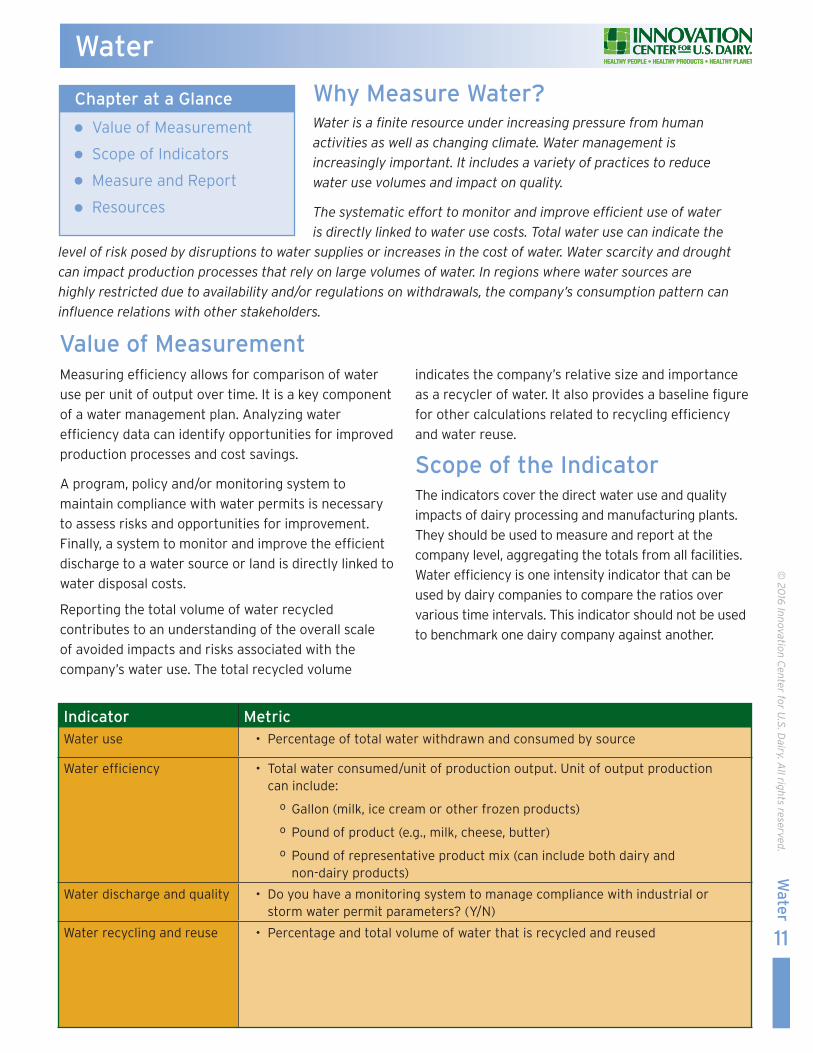
Why Measure Water? Water is a finite resource under increasing pressure from human activities as well as changing climate. Water management is increasingly important. It includes a variety of practices to reduce water use volumes and impact on quality.
The systematic effort to monitor and improve efficient use of water is directly linked to water use costs. Total water use can indicate the
level of risk posed by disruptions to water supplies or increases in the cost of water. Water scarcity and drought can impact production processes that rely on large volumes of water. In regions where water sources are highly restricted due to availability and/or regulations on withdrawals, the company’s consumption pattern can influence relations with other stakeholders.
Measuring efficiency allows for comparison of water
use per unit of output over time. It is a key component
of a water management plan. Analyzing water
efficiency data can identify opportunities for improved
production processes and cost savings.
A program, policy and/or monitoring system to
maintain compliance with water permits is necessary
to assess risks and opportunities for improvement.
Finally, a system to monitor and improve the efficient
discharge to a water source or land is directly linked to
water disposal costs.
Reporting the total volume of water recycled
contributes to an understanding of the overall scale
of avoided impacts and risks associated with the
company’s water use. The total recycled volume
indicates the company’s relative size and importance
as a recycler of water. It also provides a baseline figure
for other calculations related to recycling efficiency
and water reuse.
Scope of the Indicator
The indicators cover the direct water use and quality
impacts of dairy processing and manufacturing plants.
They should be used to measure and report at the
company level, aggregating the totals from all facilities.
Water efficiency is one intensity indicator that can be
used by dairy companies to compare the ratios over
various time intervals. This indicator should not be used
to benchmark one dairy company against another.
Value of Measurement
11
© 20
16 Innovation C
enter for U.S. D
airy. All rights reserved. W
ater
Indicator MetricWater use • Percentage of total water withdrawn and consumed by source
Water efficiency • Total water consumed/unit of production output. Unit of output production can include:
º Gallon (milk, ice cream or other frozen products)
º Pound of product (e.g., milk, cheese, butter)
º Pound of representative product mix (can include both dairy and non-dairy products)
Water discharge and quality • Do you have a monitoring system to manage compliance with industrial or storm water permit parameters? (Y/N)
Water recycling and reuse • Percentage and total volume of water that is recycled and reused
Chapter at a Glance
Value of Measurement
Scope of Indicators
Measure and Report
Resources
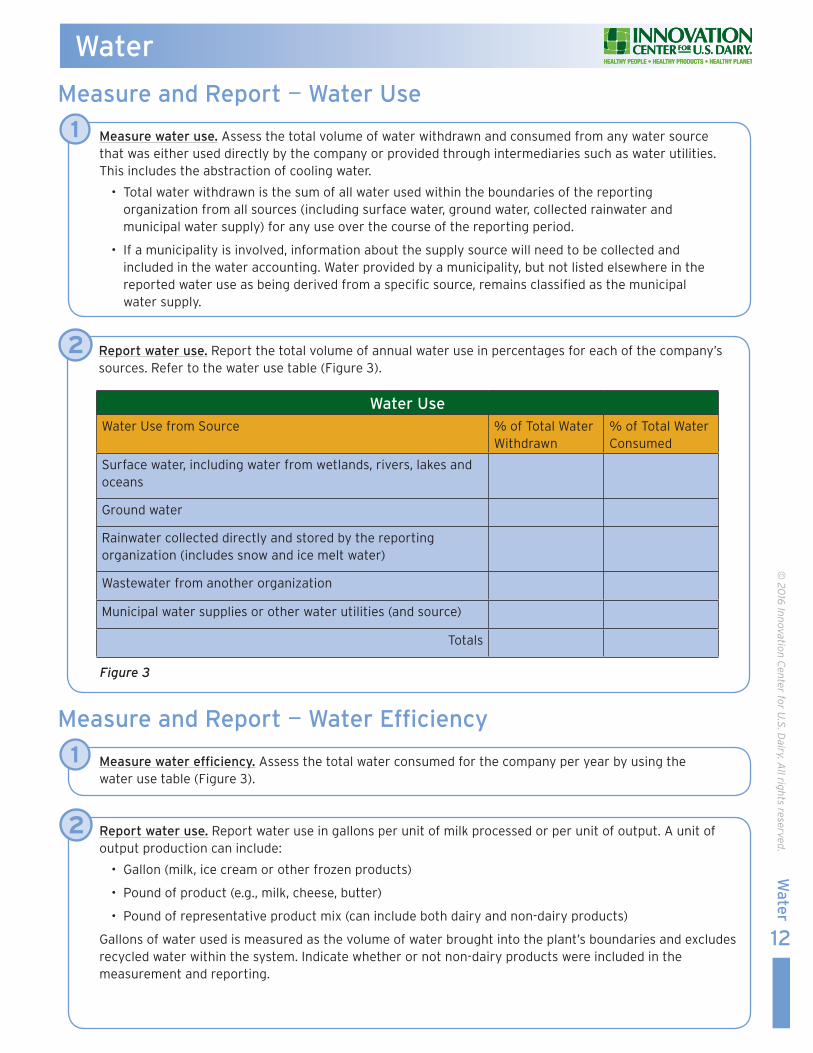
Measure water use. Assess the total volume of water withdrawn and consumed from any water source that was either used directly by the company or provided through intermediaries such as water utilities. This includes the abstraction of cooling water.
• Total water withdrawn is the sum of all water used within the boundaries of the reporting organization from all sources (including surface water, ground water, collected rainwater and municipal water supply) for any use over the course of the reporting period.
• If a municipality is involved, information about the supply source will need to be collected and included in the water accounting. Water provided by a municipality, but not listed elsewhere in the reported water use as being derived from a specific source, remains classified as the municipal water supply.
Measure water efficiency. Assess the total water consumed for the company per year by using the water use table (Figure 3).
Report water use. Report water use in gallons per unit of milk processed or per unit of output. A unit of output production can include:
• Gallon (milk, ice cream or other frozen products)
• Pound of product (e.g., milk, cheese, butter)
• Pound of representative product mix (can include both dairy and non-dairy products)
Gallons of water used is measured as the volume of water brought into the plant’s boundaries and excludes recycled water within the system. Indicate whether or not non-dairy products were included in the measurement and reporting.
Report water use. Report the total volume of annual water use in percentages for each of the company’s sources. Refer to the water use table (Figure 3).
1
1
2
2
Measure and Report — Water Use
Measure and Report — Water Efficiency
Water
Water Use Water Use from Source % of Total Water
Withdrawn% of Total Water Consumed
Surface water, including water from wetlands, rivers, lakes and oceans
Ground water
Rainwater collected directly and stored by the reporting organization (includes snow and ice melt water)
Wastewater from another organization
Municipal water supplies or other water utilities (and source)
Totals
Figure 3
12
© 20
16 Innovation C
enter for U.S. D
airy. All rights reserved. W
ater
Water
13
© 20
16 Innovation C
enter for U.S. D
airy. All rights reserved. W
ater
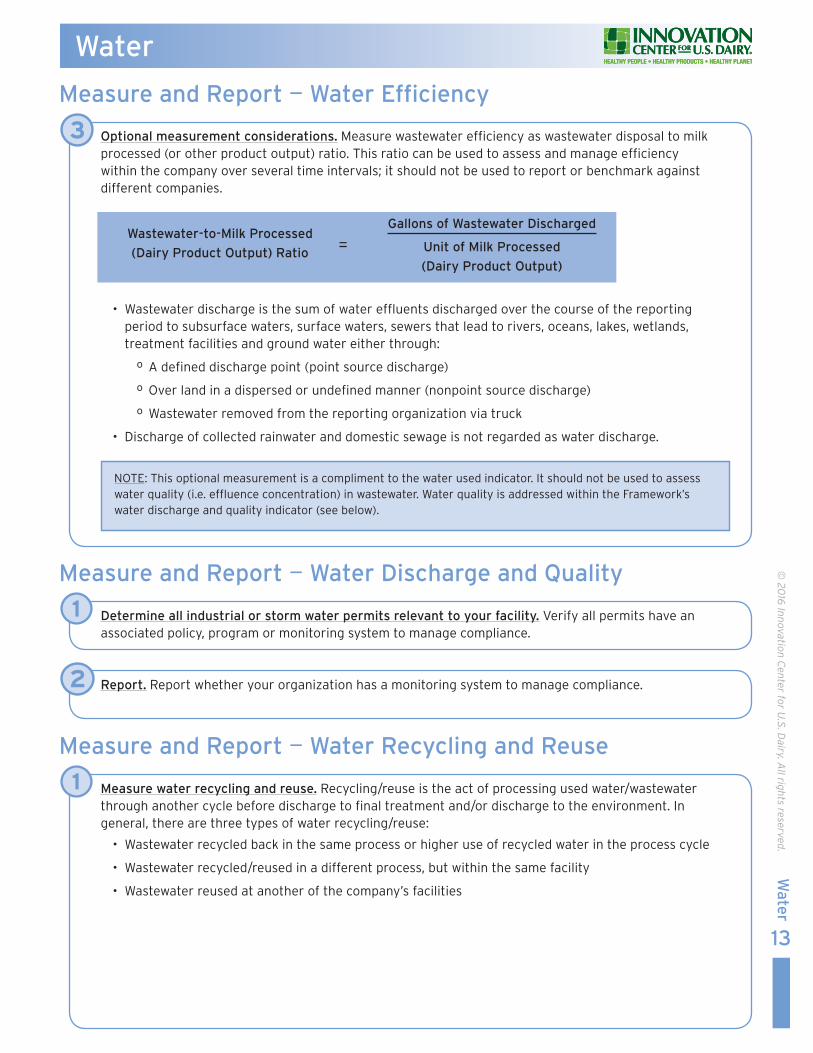
Optional measurement considerations. Measure wastewater efficiency as wastewater disposal to milk processed (or other product output) ratio. This ratio can be used to assess and manage efficiency within the company over several time intervals; it should not be used to report or benchmark against different companies.
• Wastewater discharge is the sum of water effluents discharged over the course of the reporting period to subsurface waters, surface waters, sewers that lead to rivers, oceans, lakes, wetlands, treatment facilities and ground water either through:
º A defined discharge point (point source discharge)
º Over land in a dispersed or undefined manner (nonpoint source discharge)
º Wastewater removed from the reporting organization via truck
• Discharge of collected rainwater and domestic sewage is not regarded as water discharge.
3
Measure and Report — Water Efficiency
Wastewater-to-Milk Processed
(Dairy Product Output) Ratio
=Gallons of Wastewater Discharged
Unit of Milk Processed
(Dairy Product Output)
Determine all industrial or storm water permits relevant to your facility. Verify all permits have an associated policy, program or monitoring system to manage compliance.
Measure water recycling and reuse. Recycling/reuse is the act of processing used water/wastewater through another cycle before discharge to final treatment and/or discharge to the environment. In general, there are three types of water recycling/reuse:
• Wastewater recycled back in the same process or higher use of recycled water in the process cycle
• Wastewater recycled/reused in a different process, but within the same facility
• Wastewater reused at another of the company’s facilities
Report. Report whether your organization has a monitoring system to manage compliance.
1
1
2
Measure and Report — Water Discharge and Quality
Measure and Report — Water Recycling and Reuse
NOTE: This optional measurement is a compliment to the water used indicator. It should not be used to assess water quality (i.e. effluence concentration) in wastewater. Water quality is addressed within the Framework’s water discharge and quality indicator (see below).
Water
14
© 20
16 Innovation C
enter for U.S. D
airy. All rights reserved. W
ater
Measure and Report — Water Recycling and Reuse
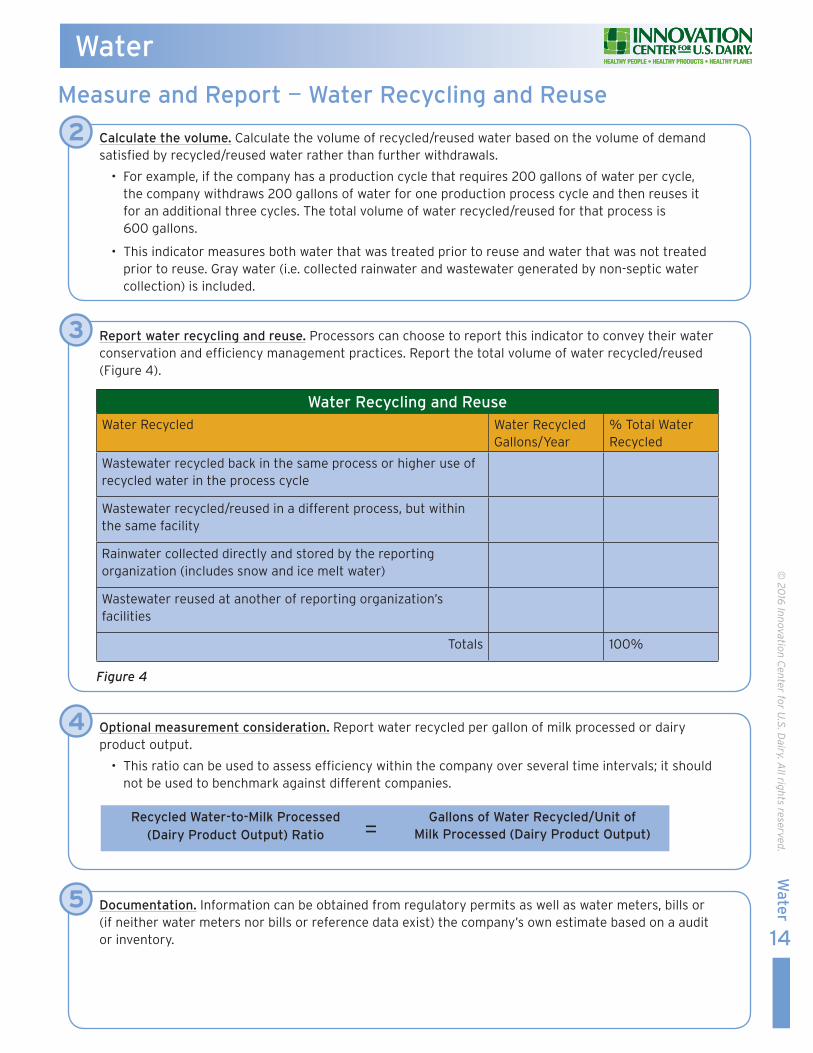
Calculate the volume. Calculate the volume of recycled/reused water based on the volume of demand satisfied by recycled/reused water rather than further withdrawals.
• For example, if the company has a production cycle that requires 200 gallons of water per cycle, the company withdraws 200 gallons of water for one production process cycle and then reuses it for an additional three cycles. The total volume of water recycled/reused for that process is 600 gallons.
• This indicator measures both water that was treated prior to reuse and water that was not treated prior to reuse. Gray water (i.e. collected rainwater and wastewater generated by non-septic water collection) is included.
Report water recycling and reuse. Processors can choose to report this indicator to convey their water conservation and efficiency management practices. Report the total volume of water recycled/reused (Figure 4).
2
3
Water Recycling and ReuseWater Recycled Water Recycled
Gallons/Year% Total Water Recycled
Wastewater recycled back in the same process or higher use of recycled water in the process cycle
Wastewater recycled/reused in a different process, but within the same facility
Rainwater collected directly and stored by the reporting organization (includes snow and ice melt water)
Wastewater reused at another of reporting organization’s facilities
Totals 100%
Figure 4
Optional measurement consideration. Report water recycled per gallon of milk processed or dairy product output.
• This ratio can be used to assess efficiency within the company over several time intervals; it should not be used to benchmark against different companies.
Documentation. Information can be obtained from regulatory permits as well as water meters, bills or (if neither water meters nor bills or reference data exist) the company’s own estimate based on a audit or inventory.
4
5
Recycled Water-to-Milk Processed (Dairy Product Output) Ratio
=
Gallons of Water Recycled/Unit of Milk Processed (Dairy Product Output)
15
© 20
15 Innovation C
enter for U.S. D
airy. All rights reserved. W
ater
Water
• National Standards for Wastewater Discharges to Surface Waters and Publicly Owned Treatment Works for Dairy Products Processing, http://bit.ly/2dugHQg: Many states and localities require processors to comply with a permitting process.
• EPA Case Studies and Guidance, http://1.usa.gov/1ZEBou0: For both water and energy use efficiency.
• The Water Footprint Network, http://waterfootprint.org/en: Works across sectors to share knowledge and insights for water stewardship and resource efficiency.
• ISO 14046, http://bit.ly/2eH2HpB: An international standard which helps organizations identify and define their water footprint.
• The World Resources Institute Aqueduct Measuring and Mapping Water Risk Tool, http://bit.ly/1XLTIE9: Provides comprehensive global mapping to understand water risks and opportunities worldwide.
Resources
Resource Recovery
Why Measure Resource Recovery? Resource recovery options include recycled packaging, reused wastewater and repurposed organics/food waste. Of these, food waste is a priority issue for agricultural products. In the United States, one in three calories is wasted and 40 percent of food goes uneaten6.
At the same time one out of every six Americans lacks a secure supply of food7. Organizations can donate safe and nutritious food to a food
bank or food rescue organization and both reduce food sent to landfills and feed those in need. Further, by donating edible food to food banks or food rescue organizations, businesses can claim tax benefits.
The case for resource renewal comes from dairy buyers and consumer as well, and many dairy customers are calling for suppliers to reduce waste overall. Further, there is current and emerging legislation that further creates the case for resource recovery. Through tracking and measuring progress in waste reduction and resource renewal, dairy processors a can enhance their reputation with customers and consumers, while reducing risks from environmental regulations, fines and fees.
Optimizing resource recovery is a business
imperative. It reduces the volume of materials
consumed and increases efficiencies directly related
to lower operational costs. Also, repurposed waste,
such as recyclable products, can result in an added
source of revenue.
In addition to revenue generation and costs savings,
optimizing resource recovery generates societal and
environmental benefits essential to a sustainable food
system. Faced with a growing population and a finite
resource base, there is a clear need to do more with
less. Further, food waste is a significant contributor to
GHG emissions and comprises nearly 20 percent of
what is hauled to landfills7.
The Scope of Indicators
The scope of resource renewal includes all waste or
byproducts produced from a manufacturing facility
during normal manufacturing processes (with the
exception of “out of scope” topics). A facility includes
the manufacturing building and any office space
that is located within the building footprint. The
facility as a whole will communicate progress for the
manufacturing of any product (not just dairy).
Materials in scope include (but are not limited to)
paper, plastics, organic/food waste, corrugated,
used oil, metals, hazardous waste, wood, biogas
and electronics.
Sludge is within scope of resource renewal indicators
and defined liquid waste that cannot be discharged as
wastewater and must be transported off site for further
treatment and processing. Wastewater is otherwise out
of scope as this topic is addressed separately within the
processor water indicators (page 11).
Out of scope issues include:
• Consumer/customer packaging waste —
packaging waste within the manufacturing
process is in scope
• Wastewater (i.e. treated or untreated water that
can be discharged on site) — sludge that cannot
be treated on site is within scope
• Transportation waste (e.g., tires from fleet trucks)
• Construction and demolition waste
• One time incidents such as natural disasters and
other emergency situations
Value of Measurement
16
© 20
16 Innovation C
enter for U.S. D
airy. All rights reserved. R
esou
rce R
ecove
ry
6NRDC Food Waste, http://on.nrdc.org/2dJD6g97Sustainable Management of Food Basics, U.S. Environmental Protection Agency, http://bit.ly/2eccbFN
Chapter at a Glance
Value of Measurements
Scope of Indicators
Measure and Report
Resources/Definitions
Resource Recovery
17
© 20
16 Innovation C
enter for U.S. D
airy. All rights reserved. R
esou
rce R
ecove
ry
Indicator MetricWaste diversion • Percent by weight total waste stream (lbs.) diverted from landfill or
incineration without recapturing energy
Throughput efficiency • Total waste stream/unit of production output (lbs.)
Resource utilization • Food donated or repurposed as animal feed and non-food recycled or composted/total waste stream
• Food repurposed for industrial uses or compost and non-food repurposed for energy recovery/total waste stream
• Waste sent to landfill or incineration without recapturing energy/total waste steam
The boundaries of the indicators are the point where
a recycling, treatment or disposal facility accepts the
facility’s waste. This means, for example, that waste
generated/landfilled by the recycling process for
cardboard and plastic, or the ash from incineration
facilities, is not considered to be within the scope of
a facility’s waste. This is a globally accepted approach
and, if not followed, it would be virtually impossible to
ever achieve zero manufacturing waste to landfill.
The indicators do not cover food donations as a
stand-alone metric. This metric is linked to another
indicator, product donation activities (page 27).
The Scope of Indicators
Measure waste streams using established hierarchies. The first step to reducing waste is to measure and track the amount, type and reason for its generation. A variety of tools exist to conduct waste audits from simple waste logs to commercial measurement and tracking software and equipment. Knowing how much and why waste is generated helps a business create targeted waste prevention strategies. This baseline also serves as a marker for measuring diversion rates and changes in spending.
The EPA’s widely adopted waste management and food recovery hierarchies provide guidance to prioritize actions to prevent and reduce waste. Each tier of these hierarchies focuses on different waste management strategies.
• The Food Recovery Hierarchy (Figure 5, page 18) refers to organic materials, such as whey solids, from the dairy processing stream that have the potential to be fed to either humans or animals, whether or not they actually are used for such purposes.
• The Waste Management Hierarchy (Figure 6, page 18) refers to waste that cannot be fed to either humans or animals.
The top levels of the hierarchy are the best ways to prevent and divert waste because they create the most benefits for the environment, society and the economy. The EPA hierarchies define source reduction or preventing waste before it ever is created as the most desirable approach. Benefits include reducing disposal costs, over-purchasing and resources associated with food and raw material production.
While preventing waste from ever occurring is preferred, the EPA food recovery hierarchy provides guidance on how best to repurpose the inevitable waste that does occur. Feeding hungry people is the best use of surplus food. Dairy processors can play leadership roles in this area by donating safe, wholesome and edible dairy products.
1
Measure and Report — Waste Diversion
continued on next page
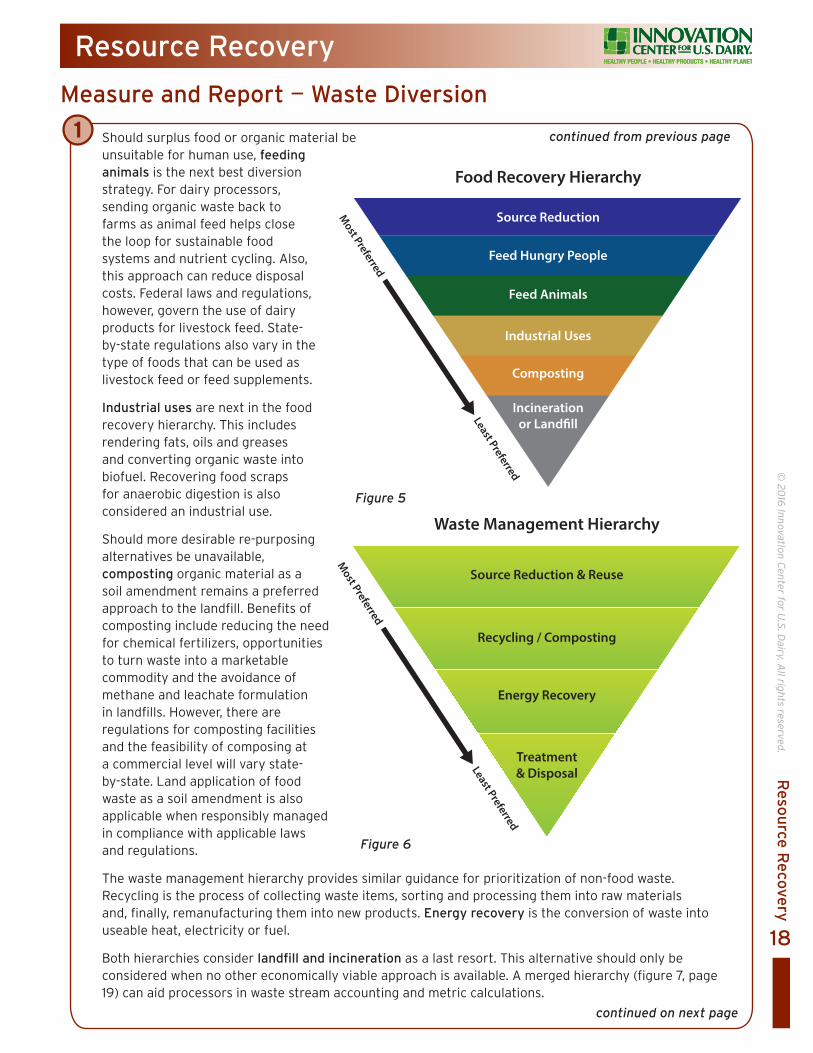
Should surplus food or organic material be unsuitable for human use, feeding animals is the next best diversion strategy. For dairy processors, sending organic waste back to farms as animal feed helps close the loop for sustainable food systems and nutrient cycling. Also, this approach can reduce disposal costs. Federal laws and regulations, however, govern the use of dairy products for livestock feed. State-by-state regulations also vary in the type of foods that can be used as livestock feed or feed supplements. Industrial uses are next in the food recovery hierarchy. This includes rendering fats, oils and greases and converting organic waste into biofuel. Recovering food scraps for anaerobic digestion is also considered an industrial use. Should more desirable re-purposing alternatives be unavailable, composting organic material as a soil amendment remains a preferred approach to the landfill. Benefits of composting include reducing the need for chemical fertilizers, opportunities to turn waste into a marketable commodity and the avoidance of methane and leachate formulation in landfills. However, there are regulations for composting facilities and the feasibility of composing at a commercial level will vary state-by-state. Land application of food waste as a soil amendment is also applicable when responsibly managed in compliance with applicable laws and regulations. The waste management hierarchy provides similar guidance for prioritization of non-food waste. Recycling is the process of collecting waste items, sorting and processing them into raw materials and, finally, remanufacturing them into new products. Energy recovery is the conversion of waste into useable heat, electricity or fuel. Both hierarchies consider landfill and incineration as a last resort. This alternative should only be considered when no other economically viable approach is available. A merged hierarchy (figure 7, page 19) can aid processors in waste stream accounting and metric calculations.
Food Recovery Hierarchy
Source Reduction
Feed Animals
Feed Hungry People
Industrial Uses
Composting
Incinerationor Land�ll
Most Preferred
Least Preferred
Waste Management Hierarchy
Source Reduction & Reuse
Recycling / Composting
Energy Recovery
Treatment& Disposal
Most Preferred
Least Preferred
Resource Recovery
18
© 20
16 Innovation C
enter for U.S. D
airy. All rights reserved. R
esou
rce R
ecove
ry
1
Measure and Report — Waste Diversion
Figure 5
continued on next page
continued from previous page
Figure 6
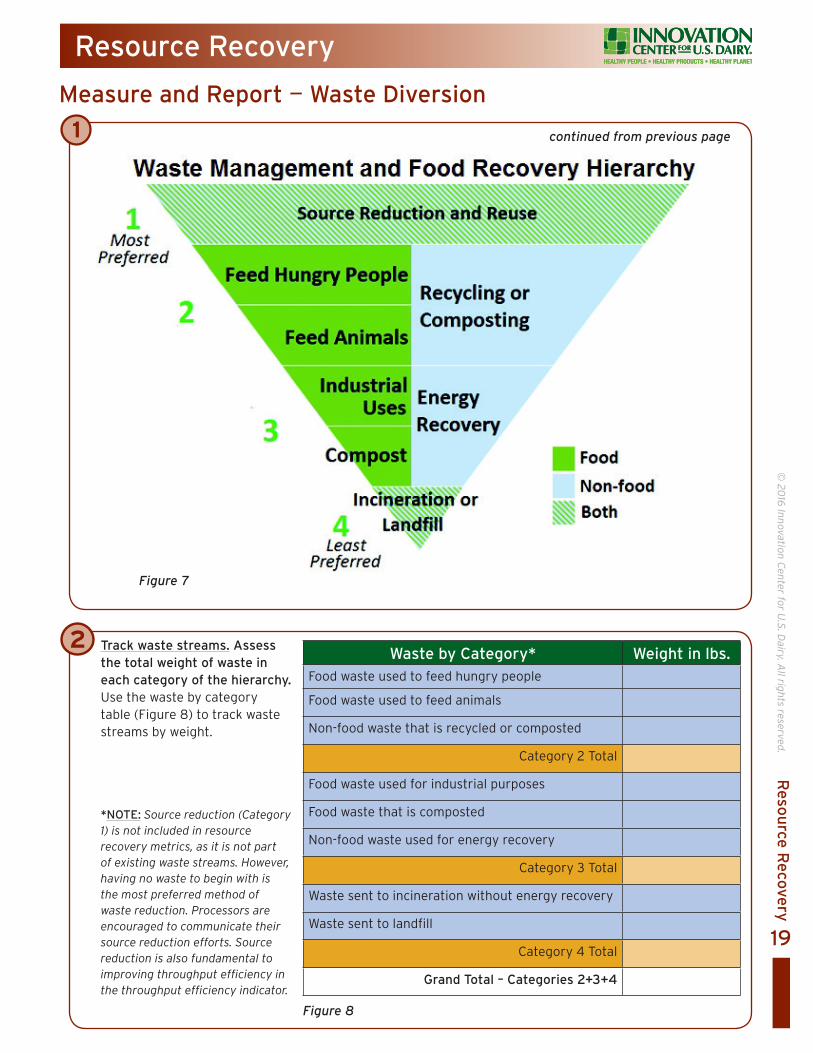
Track waste streams. Assess the total weight of waste in each category of the hierarchy. Use the waste by category table (Figure 8) to track waste streams by weight.
*NOTE: Source reduction (Category 1) is not included in resource recovery metrics, as it is not part of existing waste streams. However, having no waste to begin with is the most preferred method of waste reduction. Processors are encouraged to communicate their source reduction efforts. Source reduction is also fundamental to improving throughput efficiency in the throughput efficiency indicator.
Resource Recovery
19
© 20
16 Innovation C
enter for U.S. D
airy. All rights reserved. R
esou
rce R
ecove
ry
1
2
Measure and Report — Waste Diversion
Figure 8
Waste by Category* Weight in lbs.Food waste used to feed hungry people
Food waste used to feed animals
Non-food waste that is recycled or composted
Category 2 Total
Food waste used for industrial purposes
Food waste that is composted
Non-food waste used for energy recovery
Category 3 Total
Waste sent to incineration without energy recovery
Waste sent to landfill
Category 4 Total
Grand Total – Categories 2+3+4
continued from previous page
Figure 7
Resource Recovery
20
© 20
16 Innovation C
enter for U.S. D
airy. All rights reserved. R
esou
rce R
ecove
ry
Measure and Report — Waste Diversion
Measure and Report — Resource Utilization
Measure and Report — Throughput Efficiency
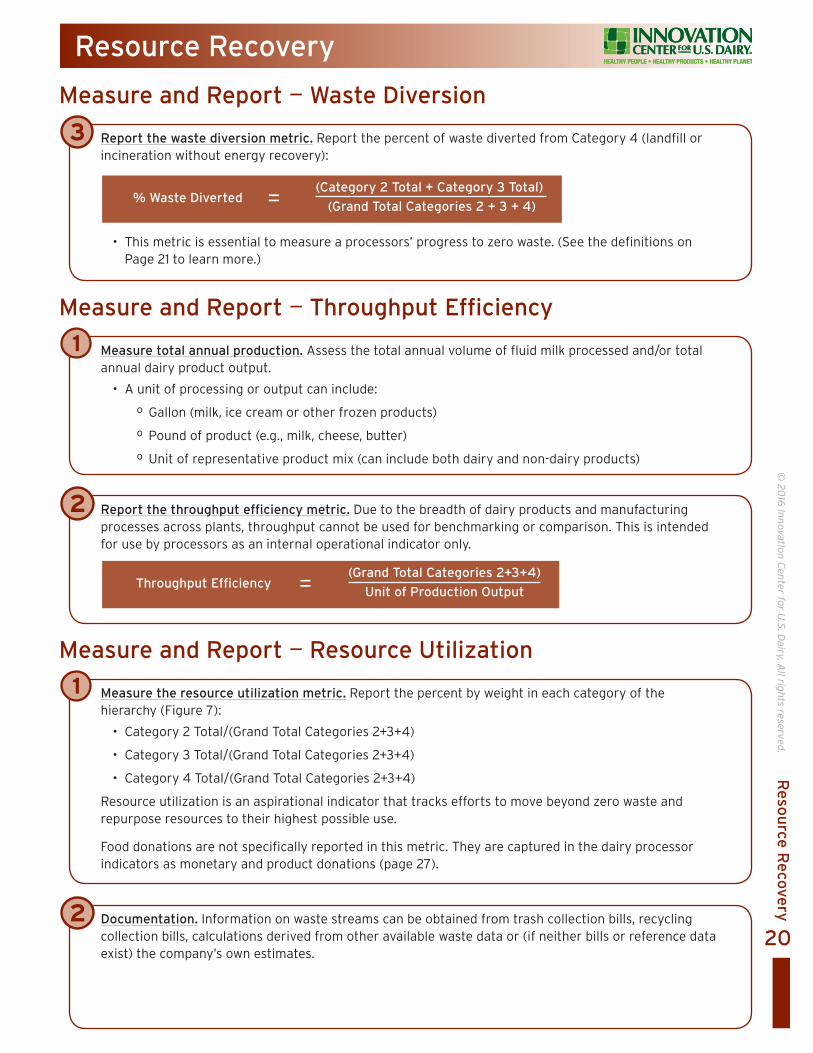
Report the waste diversion metric. Report the percent of waste diverted from Category 4 (landfill or incineration without energy recovery):
• This metric is essential to measure a processors’ progress to zero waste. (See the definitions on Page 21 to learn more.)
Measure total annual production. Assess the total annual volume of fluid milk processed and/or total annual dairy product output.
• A unit of processing or output can include:
º Gallon (milk, ice cream or other frozen products)
º Pound of product (e.g., milk, cheese, butter)
º Unit of representative product mix (can include both dairy and non-dairy products)
Measure the resource utilization metric. Report the percent by weight in each category of the hierarchy (Figure 7):
• Category 2 Total/(Grand Total Categories 2+3+4)
• Category 3 Total/(Grand Total Categories 2+3+4)
• Category 4 Total/(Grand Total Categories 2+3+4)
Resource utilization is an aspirational indicator that tracks efforts to move beyond zero waste and repurpose resources to their highest possible use. Food donations are not specifically reported in this metric. They are captured in the dairy processor indicators as monetary and product donations (page 27).
Documentation. Information on waste streams can be obtained from trash collection bills, recycling collection bills, calculations derived from other available waste data or (if neither bills or reference data exist) the company’s own estimates.
Report the throughput efficiency metric. Due to the breadth of dairy products and manufacturing processes across plants, throughput cannot be used for benchmarking or comparison. This is intended for use by processors as an internal operational indicator only.
3
1
1
2
2
% Waste Diverted =
(Category 2 Total + Category 3 Total)
(Grand Total Categories 2 + 3 + 4)
Throughput Efficiency =
(Grand Total Categories 2+3+4)
Unit of Production Output
Resource Recovery
21
© 20
16 Innovation C
enter for U.S. D
airy. All rights reserved. R
esou
rce R
ecove
ry
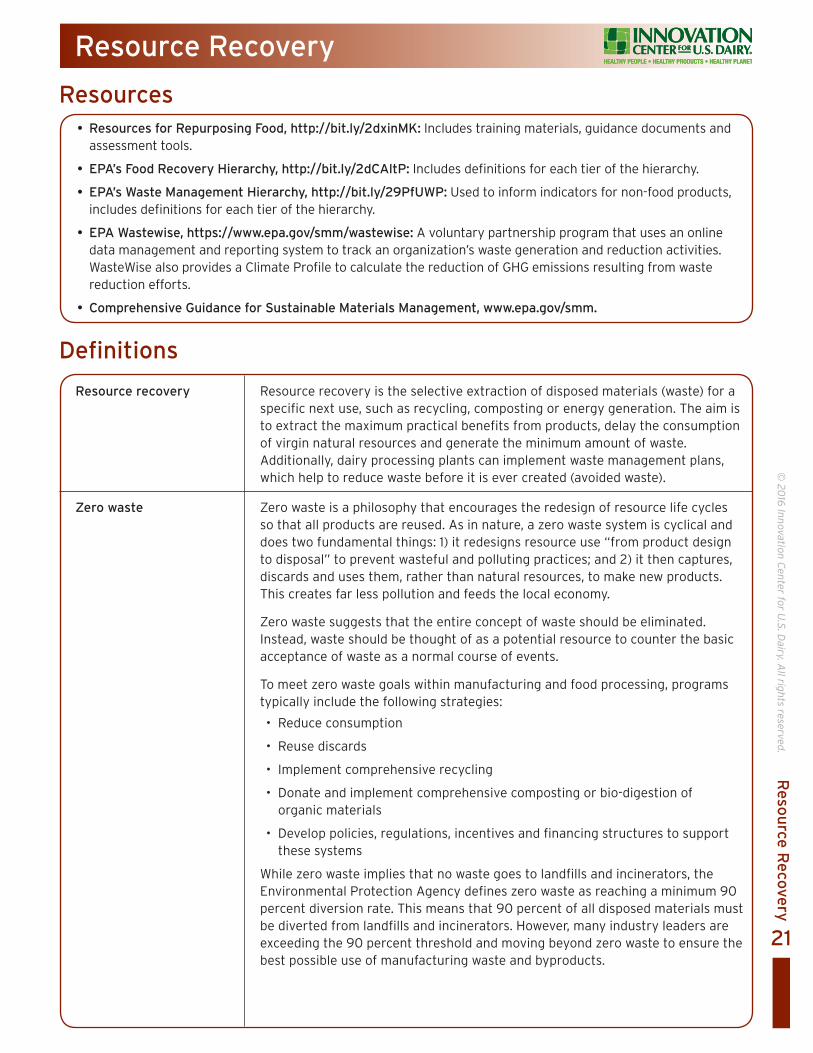
Resource recovery Resource recovery is the selective extraction of disposed materials (waste) for a specific next use, such as recycling, composting or energy generation. The aim is to extract the maximum practical benefits from products, delay the consumption of virgin natural resources and generate the minimum amount of waste. Additionally, dairy processing plants can implement waste management plans, which help to reduce waste before it is ever created (avoided waste).
Zero waste Zero waste is a philosophy that encourages the redesign of resource life cycles so that all products are reused. As in nature, a zero waste system is cyclical and does two fundamental things: 1) it redesigns resource use “from product design to disposal” to prevent wasteful and polluting practices; and 2) it then captures, discards and uses them, rather than natural resources, to make new products. This creates far less pollution and feeds the local economy.
Zero waste suggests that the entire concept of waste should be eliminated. Instead, waste should be thought of as a potential resource to counter the basic acceptance of waste as a normal course of events. To meet zero waste goals within manufacturing and food processing, programs typically include the following strategies:
• Reduce consumption
• Reuse discards
• Implement comprehensive recycling
• Donate and implement comprehensive composting or bio-digestion of organic materials
• Develop policies, regulations, incentives and financing structures to support these systems
While zero waste implies that no waste goes to landfills and incinerators, the Environmental Protection Agency defines zero waste as reaching a minimum 90 percent diversion rate. This means that 90 percent of all disposed materials must be diverted from landfills and incinerators. However, many industry leaders are exceeding the 90 percent threshold and moving beyond zero waste to ensure the best possible use of manufacturing waste and byproducts.
Definitions
• Resources for Repurposing Food, http://bit.ly/2dxinMK: Includes training materials, guidance documents and assessment tools.
• EPA’s Food Recovery Hierarchy, http://bit.ly/2dCAltP: Includes definitions for each tier of the hierarchy.
• EPA’s Waste Management Hierarchy, http://bit.ly/29PfUWP: Used to inform indicators for non-food products, includes definitions for each tier of the hierarchy.
• EPA Wastewise, https://www.epa.gov/smm/wastewise: A voluntary partnership program that uses an online data management and reporting system to track an organization’s waste generation and reduction activities. WasteWise also provides a Climate Profile to calculate the reduction of GHG emissions resulting from waste reduction efforts.
• Comprehensive Guidance for Sustainable Materials Management, www.epa.gov/smm.
Resources
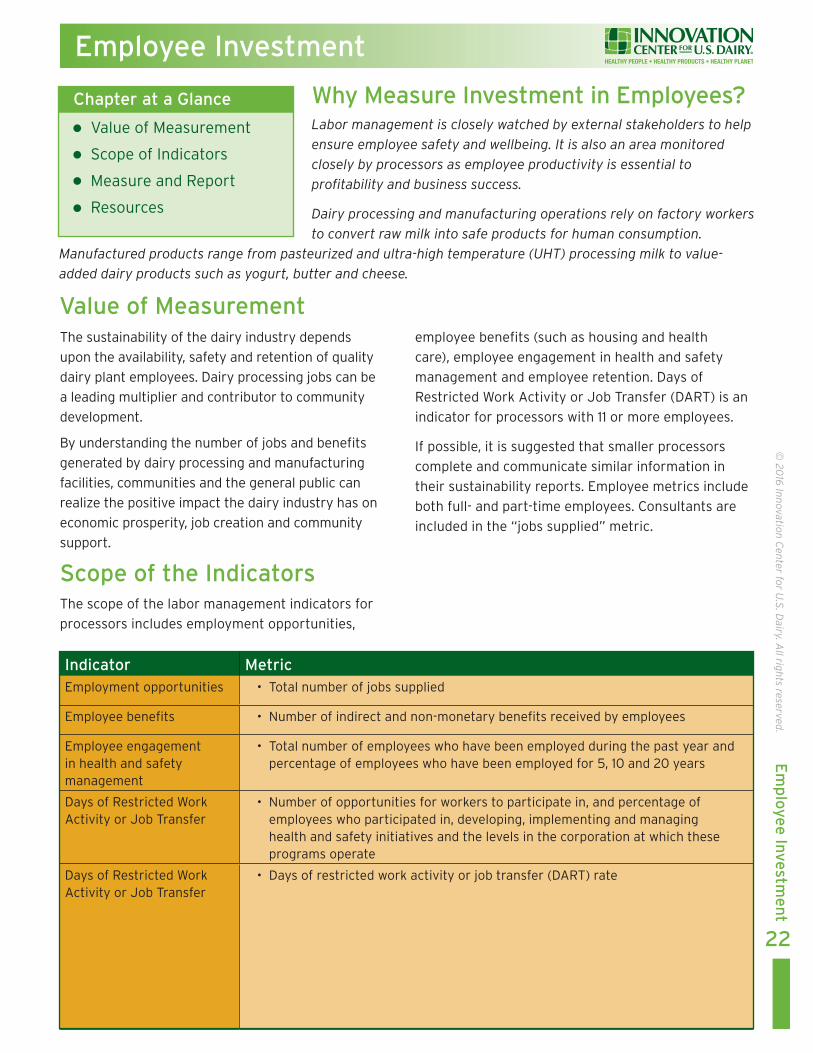
Why Measure Investment in Employees? Labor management is closely watched by external stakeholders to help ensure employee safety and wellbeing. It is also an area monitored closely by processors as employee productivity is essential to profitability and business success.
Dairy processing and manufacturing operations rely on factory workers to convert raw milk into safe products for human consumption.
Manufactured products range from pasteurized and ultra-high temperature (UHT) processing milk to value-added dairy products such as yogurt, butter and cheese.
Employee Investment
22
© 20
16 Innovation C
enter for U.S. D
airy. All rights reserved. E
mp
loyee
Investme
nt
Indicator MetricEmployment opportunities • Total number of jobs supplied
Employee benefits • Number of indirect and non-monetary benefits received by employees
Employee engagement in health and safety management
• Total number of employees who have been employed during the past year and percentage of employees who have been employed for 5, 10 and 20 years
Days of Restricted Work Activity or Job Transfer
• Number of opportunities for workers to participate in, and percentage of employees who participated in, developing, implementing and managing health and safety initiatives and the levels in the corporation at which these programs operate
Days of Restricted Work Activity or Job Transfer
• Days of restricted work activity or job transfer (DART) rate
Chapter at a Glance
Value of Measurement
Scope of Indicators
Measure and Report
Resources
The sustainability of the dairy industry depends
upon the availability, safety and retention of quality
dairy plant employees. Dairy processing jobs can be
a leading multiplier and contributor to community
development.
By understanding the number of jobs and benefits
generated by dairy processing and manufacturing
facilities, communities and the general public can
realize the positive impact the dairy industry has on
economic prosperity, job creation and community
support.
Scope of the IndicatorsThe scope of the labor management indicators for
processors includes employment opportunities,
employee benefits (such as housing and health
care), employee engagement in health and safety
management and employee retention. Days of
Restricted Work Activity or Job Transfer (DART) is an
indicator for processors with 11 or more employees.
If possible, it is suggested that smaller processors
complete and communicate similar information in
their sustainability reports. Employee metrics include
both full- and part-time employees. Consultants are
included in the “jobs supplied” metric.
Value of Measurement
Employee Investment
23
© 20
16 Innovation C
enter for U.S. D
airy. All rights reserved. E
mp
loyee
Investme
nt
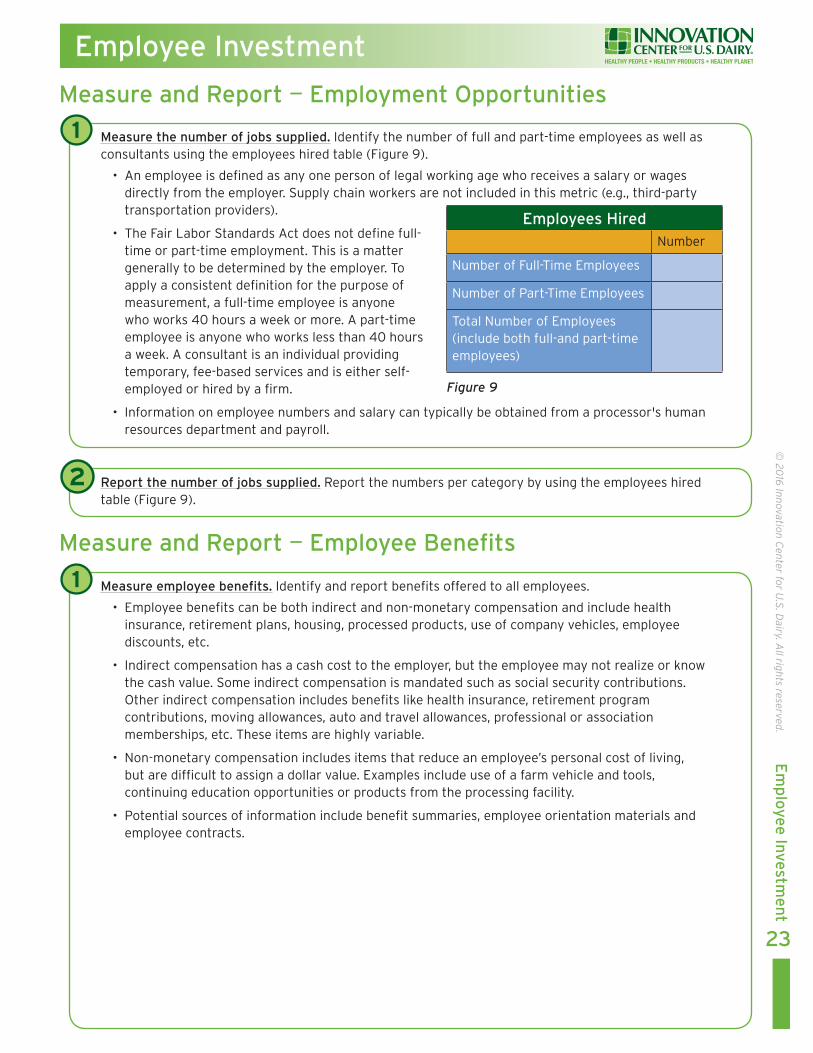
Measure the number of jobs supplied. Identify the number of full and part-time employees as well as consultants using the employees hired table (Figure 9).
• An employee is defined as any one person of legal working age who receives a salary or wages directly from the employer. Supply chain workers are not included in this metric (e.g., third-party transportation providers).
• The Fair Labor Standards Act does not define full-time or part-time employment. This is a matter generally to be determined by the employer. To apply a consistent definition for the purpose of measurement, a full-time employee is anyone who works 40 hours a week or more. A part-time employee is anyone who works less than 40 hours a week. A consultant is an individual providing temporary, fee-based services and is either self-employed or hired by a firm.
• Information on employee numbers and salary can typically be obtained from a processor's human resources department and payroll.
Measure employee benefits. Identify and report benefits offered to all employees.
• Employee benefits can be both indirect and non-monetary compensation and include health insurance, retirement plans, housing, processed products, use of company vehicles, employee discounts, etc.
• Indirect compensation has a cash cost to the employer, but the employee may not realize or know the cash value. Some indirect compensation is mandated such as social security contributions. Other indirect compensation includes benefits like health insurance, retirement program contributions, moving allowances, auto and travel allowances, professional or association memberships, etc. These items are highly variable.
• Non-monetary compensation includes items that reduce an employee’s personal cost of living, but are difficult to assign a dollar value. Examples include use of a farm vehicle and tools, continuing education opportunities or products from the processing facility.
• Potential sources of information include benefit summaries, employee orientation materials and employee contracts.
Report the number of jobs supplied. Report the numbers per category by using the employees hired table (Figure 9).
1
1
2
Measure and Report — Employment Opportunities
Measure and Report — Employee Benefits
Employees HiredNumber
Number of Full-Time Employees
Number of Part-Time Employees
Total Number of Employees (include both full-and part-time employees)
Figure 9
Employee Investment
24
© 20
16 Innovation C
enter for U.S. D
airy. All rights reserved. E
mp
loyee
Investme
nt
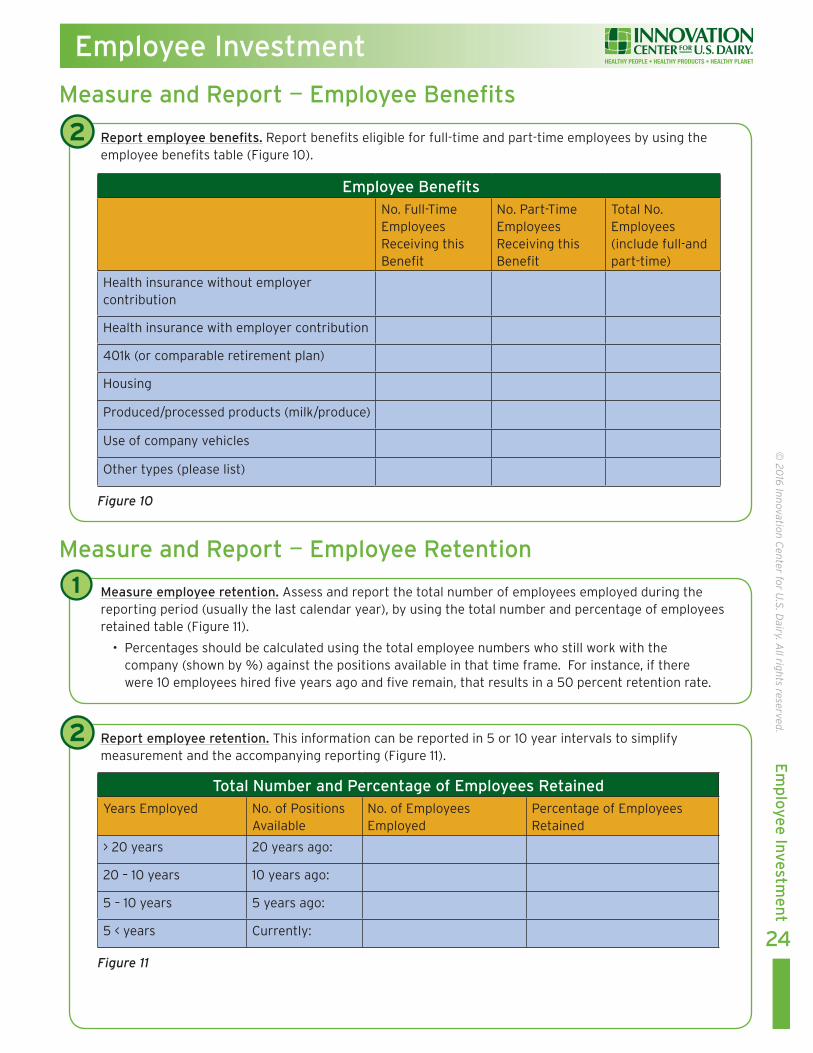
Report employee benefits. Report benefits eligible for full-time and part-time employees by using the employee benefits table (Figure 10).
Measure employee retention. Assess and report the total number of employees employed during the reporting period (usually the last calendar year), by using the total number and percentage of employees retained table (Figure 11).
• Percentages should be calculated using the total employee numbers who still work with the company (shown by %) against the positions available in that time frame. For instance, if there were 10 employees hired five years ago and five remain, that results in a 50 percent retention rate.
Report employee retention. This information can be reported in 5 or 10 year intervals to simplify measurement and the accompanying reporting (Figure 11).
2
1
2
Measure and Report — Employee Benefits
Measure and Report — Employee Retention
Employee BenefitsNo. Full-Time Employees Receiving this Benefit
No. Part-Time Employees Receiving this Benefit
Total No. Employees (include full-and part-time)
Health insurance without employer contribution
Health insurance with employer contribution
401k (or comparable retirement plan)
Housing
Produced/processed products (milk/produce)
Use of company vehicles
Other types (please list)
Total Number and Percentage of Employees RetainedYears Employed No. of Positions
AvailableNo. of Employees Employed
Percentage of Employees Retained
> 20 years 20 years ago:
20 – 10 years 10 years ago:
5 – 10 years 5 years ago:
5 < years Currently:
Figure 10
Figure 11
Employee Investment
25
© 20
16 Innovation C
enter for U.S. D
airy. All rights reserved. E
mp
loyee
Investme
nt
Measure and report employee engagement in health and safety management. Identify and report the number of committees and/or programs available within the company, which help to monitor and advise occupational health and safety at the facility level; or higher, which have workforce representation and involvement.
• Report the percentage of total employees represented or participating on the formal health and safety committee and/or programs.
• Report the level(s) at which the committee(s)/programs operate (e.g., facility level and/or at multiple facilities, region, group or company levels). This may be the result of a formal policy, procedure or informal practice with the company.
• Potential sources of information include organizational procedures and minutes of occupational health and safety committee(s).
Measure and report employee engagement in health and safety management. Use Occupational Safety and Health Administration (OSHA) Form 300, which is included in OSHA Forms for Recording Work-Related Injuries and Illnesses, to calculate the DART rate. Companies with 11 or more employees will have completed this form and will only need to complete the following calculations:
• (Number of entries in Column H + Column I) x 200,000 ÷ Number of hours worked by all employees = DART incidence rate
• If a plant is not required to report a DART rate, consider completing the worksheet in Form 300.
• Employee records, employee contracts, attendance records and accident records will provide relevant data for this indicator.
1
1
Measure and Report — Employee Engagement in Health and Safety Management
Measure and Report — Days of Restricted Work Activity or Job Transfer (DART) Rate
• The Bureau of Labor Statistics, http://bit.ly/29nOcUM: Find the National Industry-Specific Occupational Employment and Wage estimates for the dairy product manufacturing industry provided by the Bureau of Labor Statistics.
• OSHA 2012, Form 300A, http://bit.ly/29lJBRe: Get forms for recording work-related injuries and illnesses.
• International Dairy Foods Association Worker Safety Awards, http://bit.ly/2duYzdm: Honors facilities for outstanding worker safety performance.
• International Dairy Foods Association Worker Safety, http://bit.ly/2devL53: Provides general information on worker safety for dairy processing and manufacturing plants.
Resources
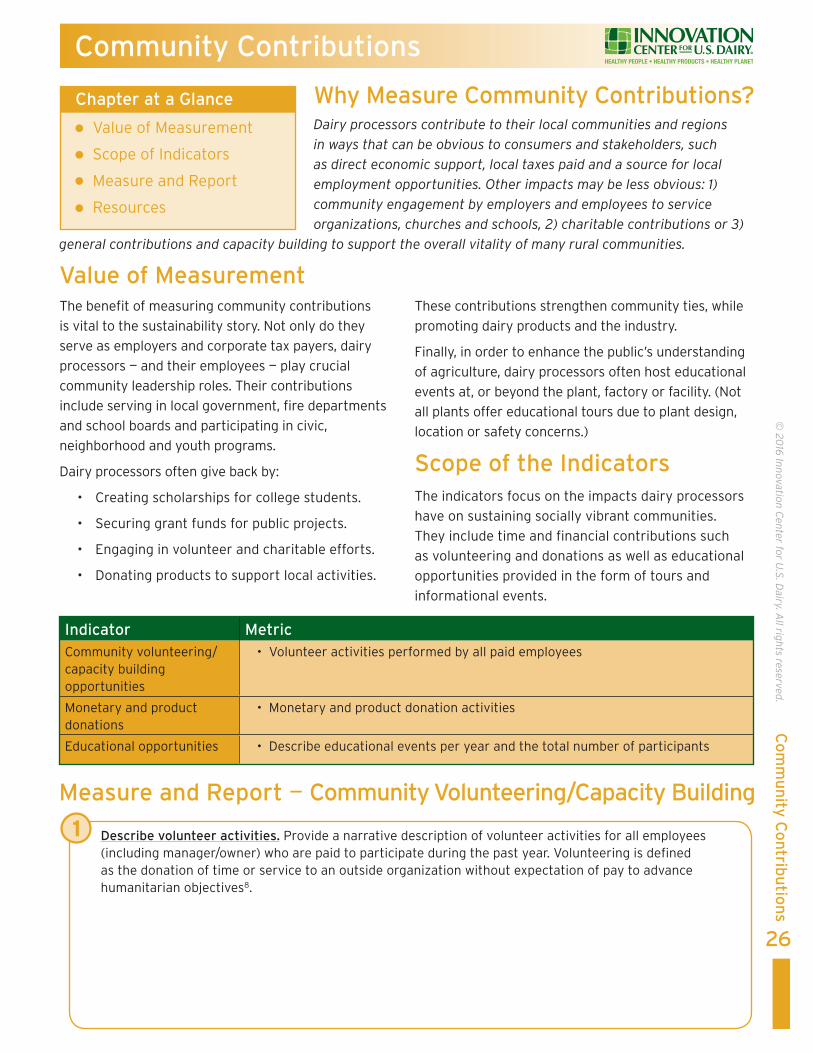
Why Measure Community Contributions? Dairy processors contribute to their local communities and regions in ways that can be obvious to consumers and stakeholders, such as direct economic support, local taxes paid and a source for local employment opportunities. Other impacts may be less obvious: 1) community engagement by employers and employees to service organizations, churches and schools, 2) charitable contributions or 3)
general contributions and capacity building to support the overall vitality of many rural communities.
Community Contributions
26
© 20
16 Innovation C
enter for U.S. D
airy. All rights reserved. C
om
mu
nity
Co
ntrib
utio
ns
Indicator MetricCommunity volunteering/capacity building opportunities
• Volunteer activities performed by all paid employees
Monetary and product donations
• Monetary and product donation activities
Educational opportunities • Describe educational events per year and the total number of participants
Chapter at a Glance
Value of Measurement
Scope of Indicators
Measure and Report
Resources
Value of MeasurementThe benefit of measuring community contributions
is vital to the sustainability story. Not only do they
serve as employers and corporate tax payers, dairy
processors — and their employees — play crucial
community leadership roles. Their contributions
include serving in local government, fire departments
and school boards and participating in civic,
neighborhood and youth programs.
Dairy processors often give back by:
• Creating scholarships for college students.
• Securing grant funds for public projects.
• Engaging in volunteer and charitable efforts.
• Donating products to support local activities.
These contributions strengthen community ties, while
promoting dairy products and the industry.
Finally, in order to enhance the public’s understanding
of agriculture, dairy processors often host educational
events at, or beyond the plant, factory or facility. (Not
all plants offer educational tours due to plant design,
location or safety concerns.)
Scope of the IndicatorsThe indicators focus on the impacts dairy processors
have on sustaining socially vibrant communities.
They include time and financial contributions such
as volunteering and donations as well as educational
opportunities provided in the form of tours and
informational events.
Describe volunteer activities. Provide a narrative description of volunteer activities for all employees (including manager/owner) who are paid to participate during the past year. Volunteering is defined as the donation of time or service to an outside organization without expectation of pay to advance humanitarian objectives8.
1
Measure and Report — Community Volunteering/Capacity Building

Community Contributions
27
© 20
16 Innovation C
enter for U.S. D
airy. All rights reserved. C
om
mu
nity
Co
ntrib
utio
ns
Describe monetary and product donation activities. Monetary donations are financial contributions to outside organizations. These can include sports and event sponsorships, scholarships and awards, non-profit donations, etc.
• Monetary efforts help to support local efforts and generate a strong relationship between dairy processors and their communities. Company product donations are also a large component of supporting philanthropic efforts.
• Product donations include donations of cheese, yogurt, ice cream, butter and other finished products to fundraising events, soup kitchens and other local and national causes. Donations are defined as products provided to outside organizations without remuneration.
• Information on monetary donations can be found in financial records. Product donations can be found in product inventories.
Optional measurement considerations. Report the total number of hours volunteered by all employees (including manager/owner) who are paid to participate in volunteer activities for the reporting year. The optional measurement considerations employees retained table (Figure 12) provides a template for this optional reporting.
1
2
Measure and Report — Community Volunteering/Capacity Building
Measure and Report — Monetary and Product Donations
Optional Measurement Considerations Employees RetainedType of Service Hours Volunteered
Civic organizations
Emergency services (e.g., ambulance, fire department)
Industry organizations
Local government
Non-profit
Religious
School
Youth group
Other
Total Hours Volunteered
8DOL. 2012. FLSA Advisor: Volunteers, www.dol.gov/elaws/esa/flsa/docs/volunteers.asp
Figure 12
Community Contributions
28
© 20
16 Innovation C
enter for U.S. D
airy. All rights reserved. C
om
mu
nity
Co
ntrib
utio
ns
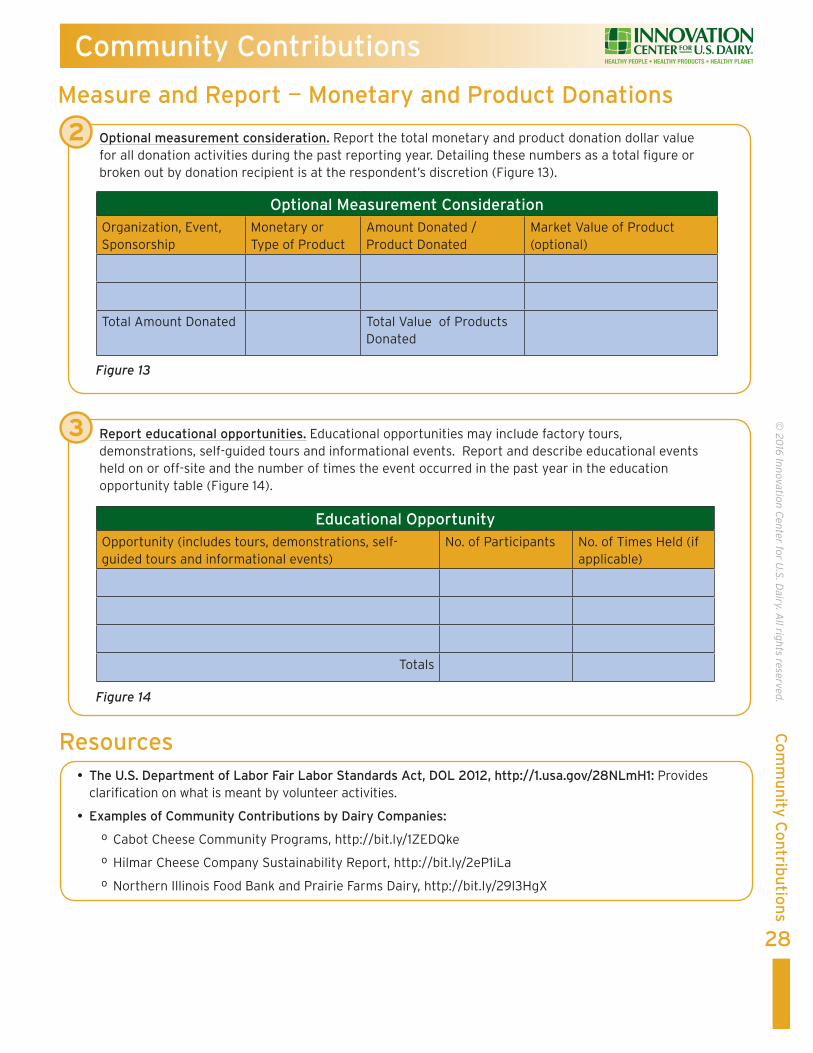
Optional measurement consideration. Report the total monetary and product donation dollar value for all donation activities during the past reporting year. Detailing these numbers as a total figure or broken out by donation recipient is at the respondent’s discretion (Figure 13).
Report educational opportunities. Educational opportunities may include factory tours, demonstrations, self-guided tours and informational events. Report and describe educational events held on or off-site and the number of times the event occurred in the past year in the education opportunity table (Figure 14).
2
3
Measure and Report — Monetary and Product Donations
Figure 13
Figure 14
Optional Measurement ConsiderationOrganization, Event, Sponsorship
Monetary or Type of Product
Amount Donated / Product Donated
Market Value of Product (optional)
Total Amount Donated Total Value of Products Donated
• The U.S. Department of Labor Fair Labor Standards Act, DOL 2012, http://1.usa.gov/28NLmH1: Provides clarification on what is meant by volunteer activities.
• Examples of Community Contributions by Dairy Companies:
º Cabot Cheese Community Programs, http://bit.ly/1ZEDQke
º Hilmar Cheese Company Sustainability Report, http://bit.ly/2eP1iLa
º Northern Illinois Food Bank and Prairie Farms Dairy, http://bit.ly/29l3HgX
Resources
Educational OpportunityOpportunity (includes tours, demonstrations, self-guided tours and informational events)
No. of Participants No. of Times Held (if applicable)
Totals
About the Innovation Center for U.S. Dairy®
The Innovation Center for U.S. Dairy (Innovation Center) provides
a forum for dairy companies to work pre-competitively to address
barriers to and opportunities for innovation and sales growth. The
Innovation Center aligns the collective resources of the industry
to offer consumers nutritious dairy products and ingredients,
and to promote the health of people, communities, the planet
and the industry. The Innovation Center was established in 2008
under the leadership of America’s dairy farmers through Dairy
Management Inc.™, the nonprofit organization that manages the
producer checkoff program. Learn more at www.USDairy.com or
email [email protected].
About the International Dairy Food Association®
The International Dairy Foods Association represents the nation’s
dairy manufacturing and marketing industries and their suppliers
with a membership of 550 companies within a $125-billion a year
industry. IDFA is composed of three constituent organizations:
the Milk Industry Foundation, the National Cheese Institute, and
the International Ice Cream Association. IDFA’s nearly 200 dairy
processing members run 600 plant operations, and range from large
multi-national organizations to single-plant companies. Together
they represent more than 85 percent of milk, cultured products,
cheese, ice cream and frozen desserts produced and marketed in
the United States. Learn more at www.idfa.org
©2016 Innovation Center for U.S. Dairy. All rights reserved.