Embed Size (px)
Citation preview
* Corresponding author's E-mail address: [email protected], [email protected]
Advanced Journal of Chemistry-Section A, 2020, 3(4), 422–431 Available online at : www.ajchem-a.com ISSN Online: 2645-5676 DOI: 10.33945/SAMI/AJCA.2020.4.4
Original Research Article
Processing of Nanostructured TiO2 and Modification of Its Photocatalytic Behavior for Methylene Blue Degradation
Mohammad Sajjadnejada,* , Hooman Karimi Abadehb
a Department of Materials Engineering, School of Engineering, Yasouj University, Yasouj, Iran b Department of Materials Science and Engineering, School of Engineering, Shiraz University, Shiraz, Iran
A R T I C L E I N F O A B S T R A C T
Received: 07 October 2019
Revised: 10 November 2019
Accepted: 15 November 2019
Available online: 08 December 2019
K E Y W O R D S
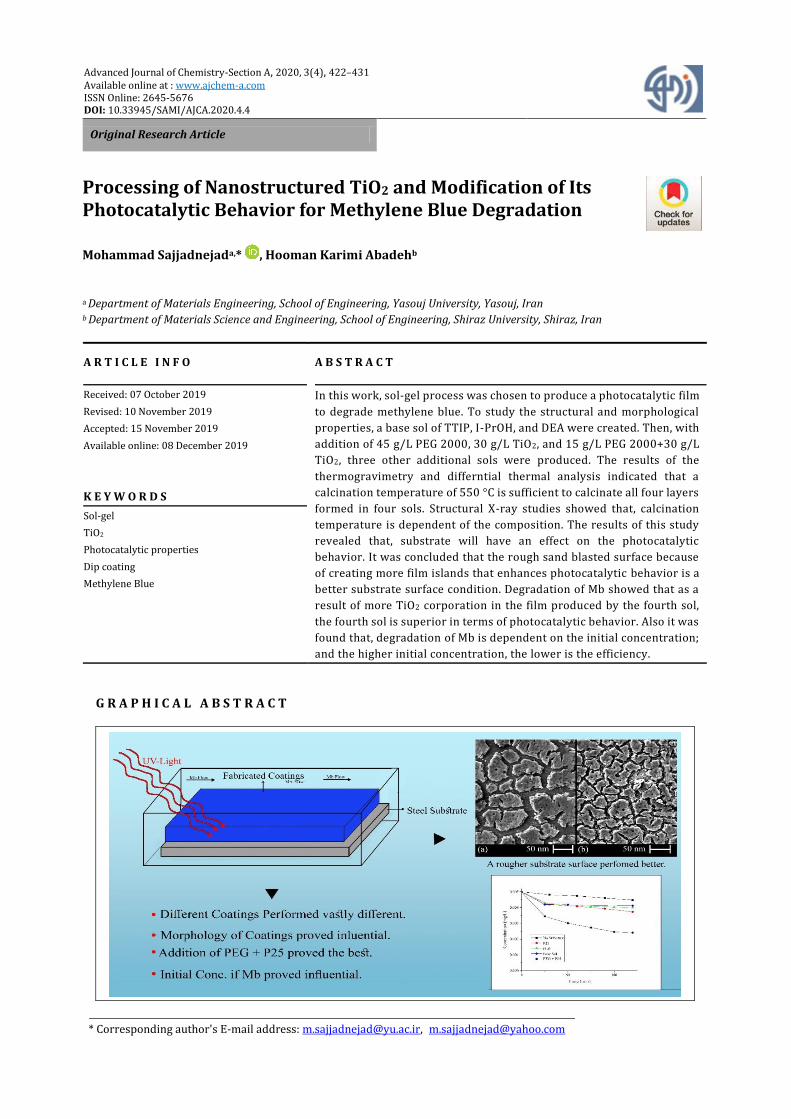
In this work, sol-gel process was chosen to produce a photocatalytic film
to degrade methylene blue. To study the structural and morphological
properties, a base sol of TTIP, I-PrOH, and DEA were created. Then, with
addition of 45 g/L PEG 2000, 30 g/L TiO2, and 15 g/L PEG 2000+30 g/L
TiO2, three other additional sols were produced. The results of the
thermogravimetry and differntial thermal analysis indicated that a
calcination temperature of 550 °C is sufficient to calcinate all four layers
formed in four sols. Structural X-ray studies showed that, calcination
temperature is dependent of the composition. The results of this study
revealed that, substrate will have an effect on the photocatalytic
behavior. It was concluded that the rough sand blasted surface because
of creating more film islands that enhances photocatalytic behavior is a
better substrate surface condition. Degradation of Mb showed that as a
result of more TiO2 corporation in the film produced by the fourth sol,
the fourth sol is superior in terms of photocatalytic behavior. Also it was
found that, degradation of Mb is dependent on the initial concentration;
and the higher initial concentration, the lower is the efficiency.
Sol-gel
TiO2
Photocatalytic properties
Dip coating
Methylene Blue
G R A P H I C A L A B S T R A C T
M. Sajjadnejad & H. K. Abadeh 423
Introduction
TiO2 has been used and studied extensively
for its outstanding photocatalytic behavior [1-
3]. Non-toxicity, chemical stability in aqueous
environments, and inexpensiveness made this
material a desirable semiconductor for
industrial purposes. Due to inherent practical
problems of using powder catalysts for water
treatment and purification processes, i.e.
homogenizing the powder throughout the
whole medium and separation after
treatment, immobilized TiO2 films have been
extensively researched and utilized.
Diverse techniques such as sputtering
[4], electrospinning [2], chemical vapor
deposition [5-7] and sol-gel [8-14] can be used
to produce a desirable TiO2 film. Among all
these methods, sol-gel has been widely used
due to its low cost, desirable homogeneity,
and low processing temperature. There are
two feasible methods for producing the TiO2
films, the alkoxide route and non-alkoxide
route. Inorganic salts (TiCl4) are used in
alkoxide route as the starting material for
reactions, then after removing the inorganic
anion of these salts results the desired TiO2
from the film is achieved. However, halides
are notoriously challenging to be removed
and often remain in the material. The TiO2
films produced by the non-alkoxide route
possess high density and are crystalline [15].
Microstructure, density and phase
identity of the film are the key factors in
shaping the photocatalytic behavior of a film.
The TiO2 film produced from the mentioned
process fabricated a network of material; so a
calcination step should be carefully designed
and undertaken to achieve the optimum
photocatalytic properties, otherwise
extensive deterioration of quality will occur.
Modified alkoxide sol-gel method has
been extensively evaluated. The phenomena
was first studied by Balasubramanian et al.
[15] in 2004 and has stablished that a more
sensitive TiO2 photocatalyst can be produced
by incorporating P-25 powder into an
isopropoxide sol. Chen et al. [16,17] found out
that this improvement is due to the grain
reduction size, higher number of pores, micro-
cracks and crystalline material on the surface
of the coating. Polyethylene gelycol (PEG)
addition to alkoxide solution and its beneficial
application to increase the thickness of TiO2
film and morpholgy was first reported by Kato
et al. [18]. Many researches expanded this
new finding and produced a rather well
understanding of the PEG effect on TiO2 film
produced by sol gel method [19-22]. There are
also many studies assessed the crystal size
and phase transformation during the
calcination steps [23,24].
One of the main organic pollutants of
many industries such as pharmaceuticals,
dyeing, printing, paper and ink industries is an
organic solution called methylene blue (Mb).
Fortunately, this aqueous contamination can
easily be removed by using a photocatalysis
method. There are several advantages in
utilizing this route such as cost-effectiveness,
solar light energy source, and operation near
the ambient temperature.
The aim of this study is to synthesize
nanostructured TiO2 film using sol-gel
containing both P-25 and PEG. Then the
structure and morphology of the synthesized
TiO2 films to used as an effective photocatalyst
to degrade Mb in environment were
evaluated. It was found that, the TiO2 powder
(Degussa, P-25), is a standard material for
photocatalytic applications, containing
anatase and rutile phases in a ratio of about
3:1.
Experimental
Matrials and chemicals
TiO2 films were produced using sol-gel
method to study structural and morphological
properties by XRD and SEM, respectively. To get
clearer understanding of different affecting
parameters, four different sols were prepared.
Processing of Nanostructured TiO2 and Modification … 424
Table 1. Different materials used to create sols
Material Original company and purity
(%)
Chemical formula and molar
mas
Titanium isopropoxide
(TTIP) Aldrich (97%) C12H28O4Ti (284.215 g/mol)
Isopropyl alcohol
(i-PrOH) Merck (99.99%) C3H8O (60.10 g/mol)
Diethylamine (DEA) Aldrich (99%) C4H11N (73.14 g/mol)
Polyethylene glycol (PEG) Merck (99.9%) C2nH4n+2On+1(2000 g/mol)
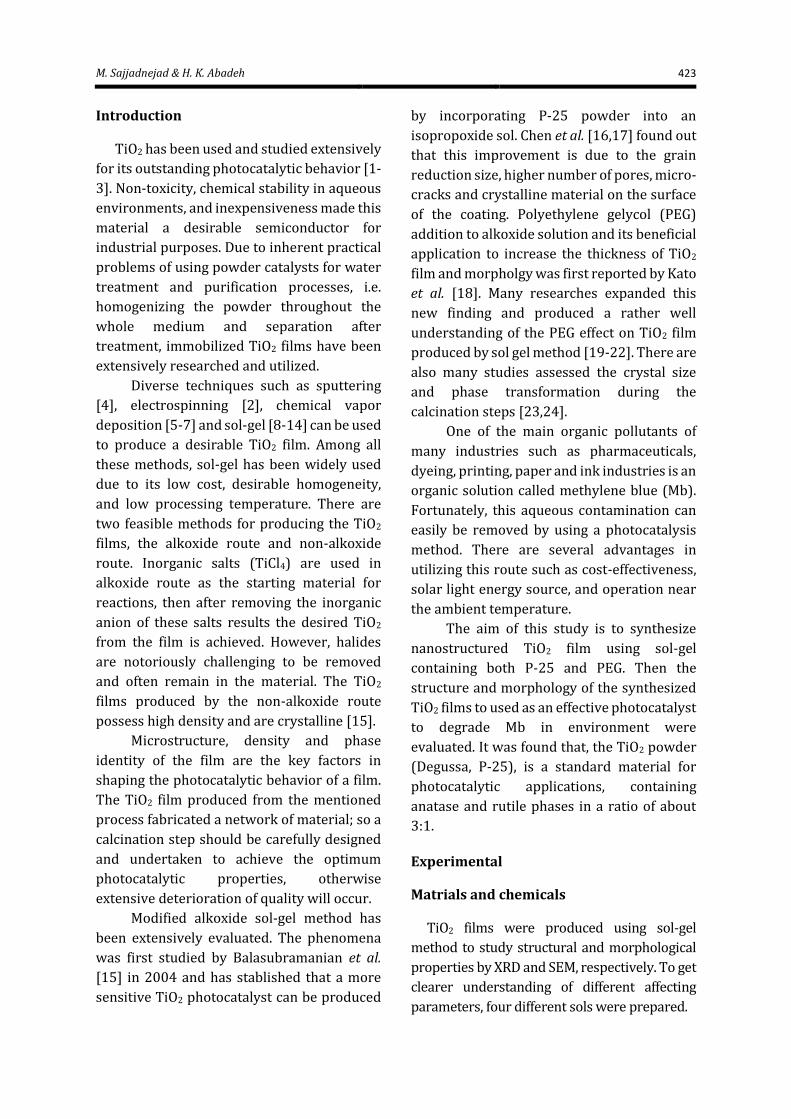
Figure 1. Sols that
were used in this study
Table 1 presents the materials that were
used to synthesize the sols. Methylene blue with
the chemical formulae was used to assess which
TiO2 film possesses superior photocatalytic
behavior.
Preparation of TiO2 films by Sol-Gel method
A base sol and three derivative sols were
prepared. To prepare the base sol, TTIP, i-PrOH
and DEA were evaluated in terms of
DEA:TTIP=4:1. Stirring was done for 2 h and
then deionized water in terms of H2O:TTIP=2:1
in molar ratio was added. To prepare the three
other sols, 15 g/L PEG 2000, 30 g/L TiO2 and 15
g/L PEG 2000+30 g/L TiO2 were added to the
base sol respectively. The ratios were chosen
based on the reviewed literature [15-17]. Figure
1 schematically shows the constituents of
different sols.
Dip coating method was utilized to produce
the TiO2 films required. Initially two substrates
were used. 304 stainless steel and glass, 304
stainless steel showed preferential properties
(for the reasons that will be explained) so the
rest of the experiments were done on this
substrate. The withdrawal rate was chosen to be
13.5 cm/min-1 and in order to increase film
thickness 1 to 6 dipping cycles were performed.
After each dip-coating cycle, specimens were
dried for 2 h at 120 °C to obtain the crystallized
anatase phase. Subsequently each sample was
calcined in an oven at 400 °C to 700 °C. To
minimize the nucleation of cracks in the coating
surface, a slow heating rate of 3 °C/min-1 was
chosen.
Characterization technique
To evaluate the thermal decomposition
properties of the assynthesized dried zero gel
samples, a thermogravimetry and differential
thermal analyzer (PL-STA-1640, Polymer
Labaratories Satntom Redcraft, UK) was used.
By the means of a heating rate of 5 °C/min-1
temperature rose from 25 °C to 900 °C. X-ray
diffraction (XRD) analysis was performed using
an EQUINOX 3000 INEL with Cu (kα) radiation
M. Sajjadnejad & H. K. Abadeh 425
to determine the present phases and crystalline
size calculated from Debye-Scherrer equation
[19].
𝐿 =𝑘𝜆
𝛽 cos 𝜃
Where L is crystalline size that is equal to
multiplication of Debye-Scherrer constant
(k=0.89) in the X-ray radiation wavelength
(0.15481 nm for Cu (Kα)) divided by full-width
half-maximum of diffraction (β) peak at 2θ.
Morphology, thickness and chemical
composition of the coatings were studied using
scanning electron microscopy (SEX) (Seron
Tech, AIS 2100) equipped with the energy
dispersive X-ray spectroscopy (EDAX).
Results and discussion
TGA/DTA and UV-visible analysis
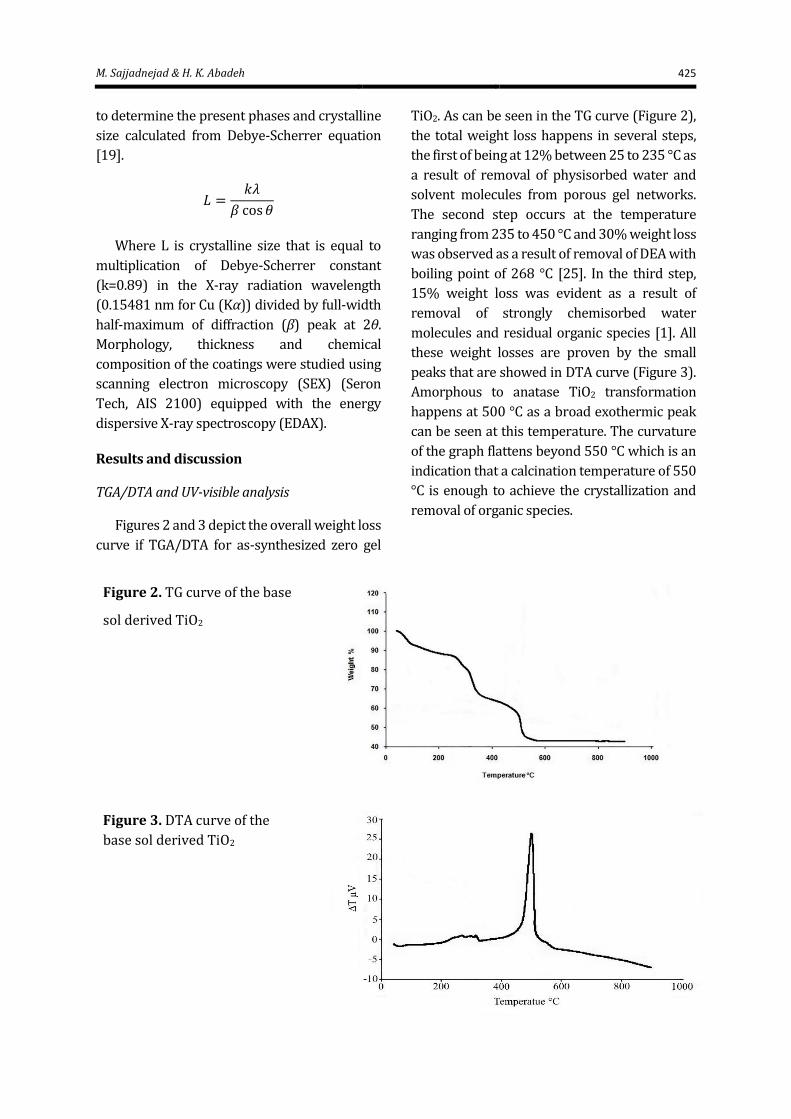
Figures 2 and 3 depict the overall weight loss
curve if TGA/DTA for as-synthesized zero gel
TiO2. As can be seen in the TG curve (Figure 2),
the total weight loss happens in several steps,
the first of being at 12% between 25 to 235 °C as
a result of removal of physisorbed water and
solvent molecules from porous gel networks.
The second step occurs at the temperature
ranging from 235 to 450 °C and 30% weight loss
was observed as a result of removal of DEA with
boiling point of 268 °C [25]. In the third step,
15% weight loss was evident as a result of
removal of strongly chemisorbed water
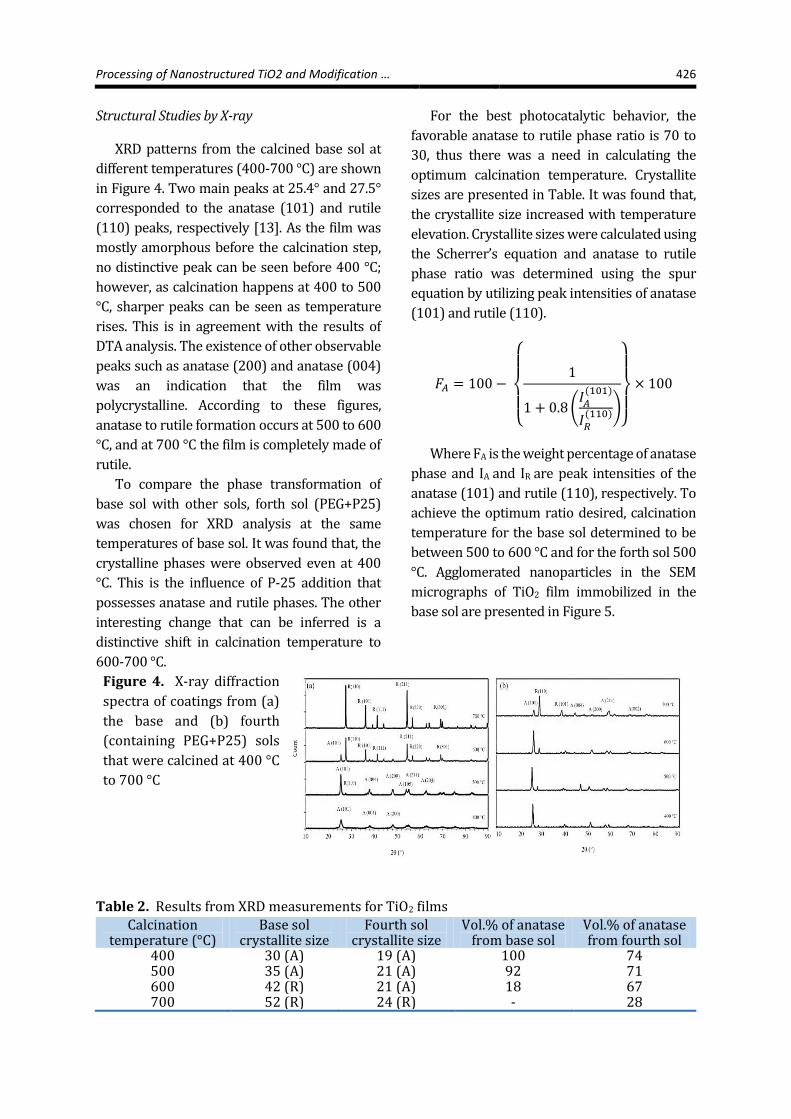
molecules and residual organic species [1]. All
these weight losses are proven by the small
peaks that are showed in DTA curve (Figure 3).
Amorphous to anatase TiO2 transformation
happens at 500 °C as a broad exothermic peak
can be seen at this temperature. The curvature
of the graph flattens beyond 550 °C which is an
indication that a calcination temperature of 550
°C is enough to achieve the crystallization and
removal of organic species.
Figure 2. TG curve of the base
sol derived TiO2
Figure 3. DTA curve of the
base sol derived TiO2
Processing of Nanostructured TiO2 and Modification … 426
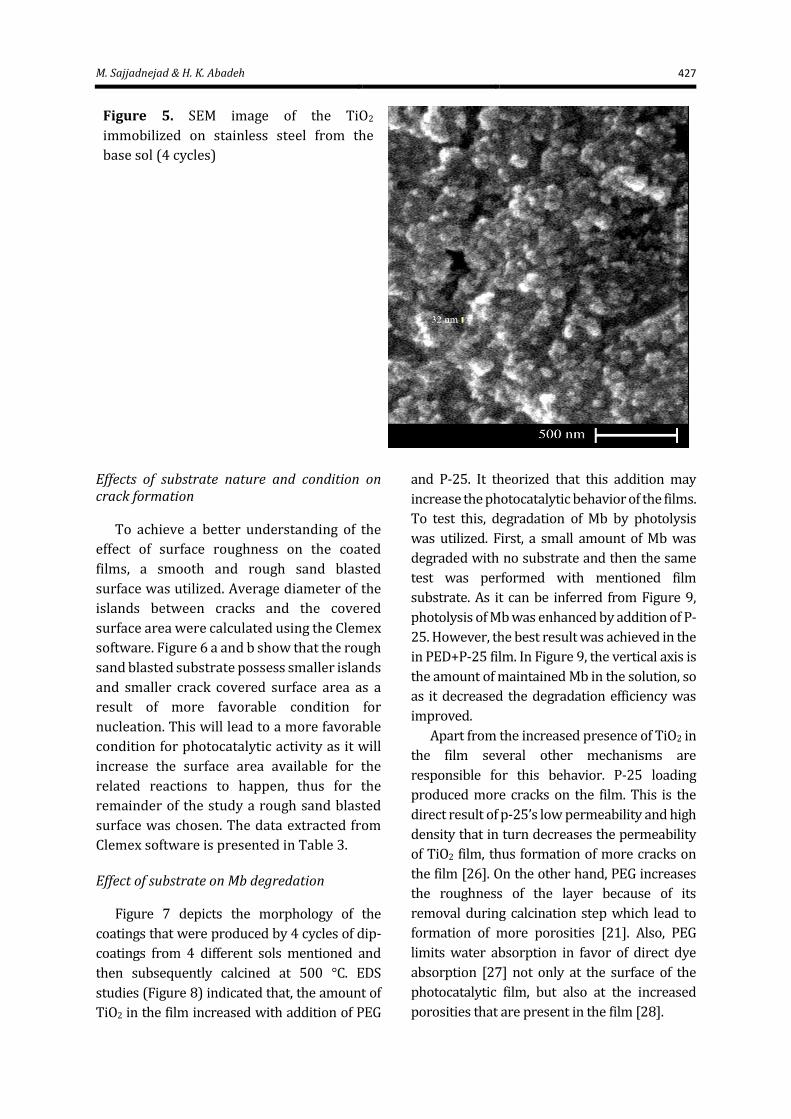
Structural Studies by X-ray
XRD patterns from the calcined base sol at
different temperatures (400-700 °C) are shown
in Figure 4. Two main peaks at 25.4° and 27.5°
corresponded to the anatase (101) and rutile
(110) peaks, respectively [13]. As the film was
mostly amorphous before the calcination step,
no distinctive peak can be seen before 400 °C;
however, as calcination happens at 400 to 500
°C, sharper peaks can be seen as temperature
rises. This is in agreement with the results of
DTA analysis. The existence of other observable
peaks such as anatase (200) and anatase (004)
was an indication that the film was
polycrystalline. According to these figures,
anatase to rutile formation occurs at 500 to 600
°C, and at 700 °C the film is completely made of
rutile.
To compare the phase transformation of
base sol with other sols, forth sol (PEG+P25)
was chosen for XRD analysis at the same
temperatures of base sol. It was found that, the
crystalline phases were observed even at 400
°C. This is the influence of P-25 addition that
possesses anatase and rutile phases. The other
interesting change that can be inferred is a
distinctive shift in calcination temperature to
600-700 °C.
For the best photocatalytic behavior, the
favorable anatase to rutile phase ratio is 70 to
30, thus there was a need in calculating the
optimum calcination temperature. Crystallite
sizes are presented in Table. It was found that,
the crystallite size increased with temperature
elevation. Crystallite sizes were calculated using
the Scherrer’s equation and anatase to rutile
phase ratio was determined using the spur
equation by utilizing peak intensities of anatase
(101) and rutile (110).
𝐹𝐴 = 100 −
{
1
1 + 0.8(𝐼𝐴(101)
𝐼𝑅(110))
}
× 100
Where FA is the weight percentage of anatase
phase and IA and IR are peak intensities of the
anatase (101) and rutile (110), respectively. To
achieve the optimum ratio desired, calcination
temperature for the base sol determined to be
between 500 to 600 °C and for the forth sol 500
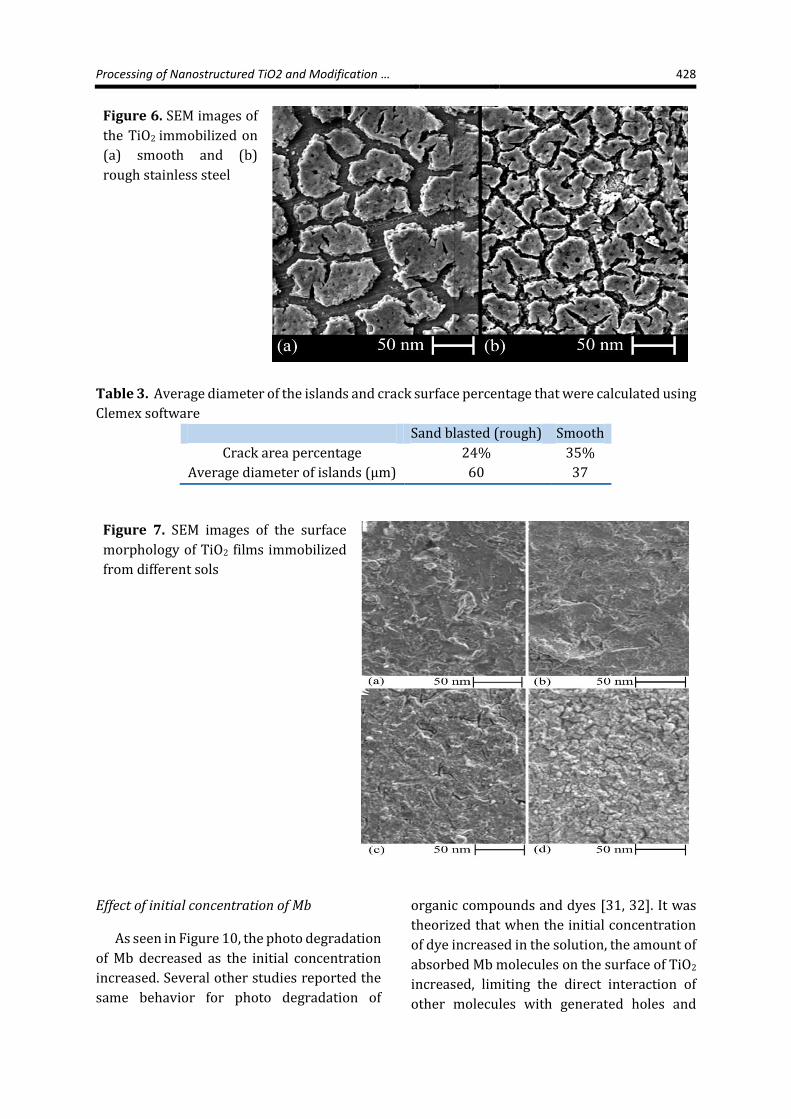
°C. Agglomerated nanoparticles in the SEM
micrographs of TiO2 film immobilized in the
base sol are presented in Figure 5.
Figure 4. X-ray diffraction
spectra of coatings from (a)
the base and (b) fourth
(containing PEG+P25) sols
that were calcined at 400 °C
to 700 °C
Table 2. Results from XRD measurements for TiO2 films Calcination
temperature (°C) Base sol
crystallite size Fourth sol
crystallite size Vol.% of anatase
from base sol Vol.% of anatase from fourth sol
400 30 (A) 19 (A) 100 74 500 35 (A) 21 (A) 92 71 600 42 (R) 21 (A) 18 67 700 52 (R) 24 (R) - 28
M. Sajjadnejad & H. K. Abadeh 427
Figure 5. SEM image of the TiO2
immobilized on stainless steel from the
base sol (4 cycles)
Effects of substrate nature and condition on crack formation
To achieve a better understanding of the
effect of surface roughness on the coated
films, a smooth and rough sand blasted
surface was utilized. Average diameter of the
islands between cracks and the covered
surface area were calculated using the Clemex
software. Figure 6 a and b show that the rough
sand blasted substrate possess smaller islands
and smaller crack covered surface area as a
result of more favorable condition for
nucleation. This will lead to a more favorable
condition for photocatalytic activity as it will
increase the surface area available for the
related reactions to happen, thus for the
remainder of the study a rough sand blasted
surface was chosen. The data extracted from
Clemex software is presented in Table 3.
Effect of substrate on Mb degredation
Figure 7 depicts the morphology of the
coatings that were produced by 4 cycles of dip-
coatings from 4 different sols mentioned and
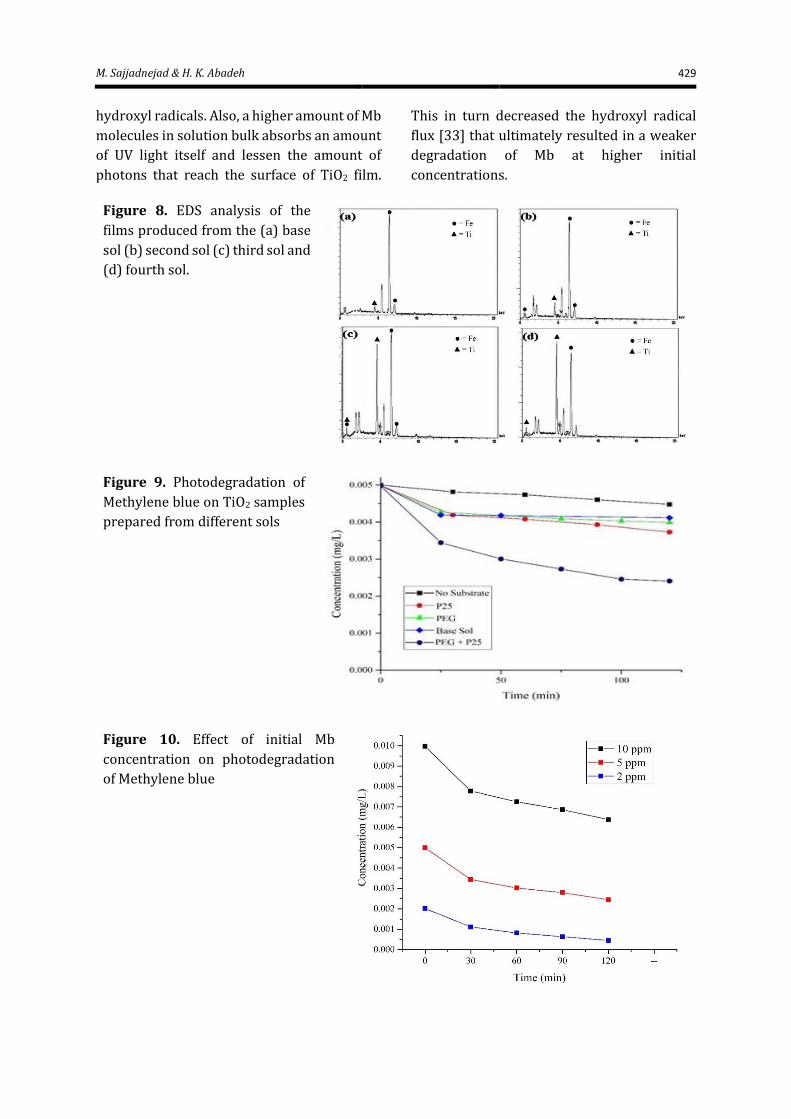
then subsequently calcined at 500 °C. EDS
studies (Figure 8) indicated that, the amount of
TiO2 in the film increased with addition of PEG
and P-25. It theorized that this addition may
increase the photocatalytic behavior of the films.
To test this, degradation of Mb by photolysis
was utilized. First, a small amount of Mb was
degraded with no substrate and then the same
test was performed with mentioned film
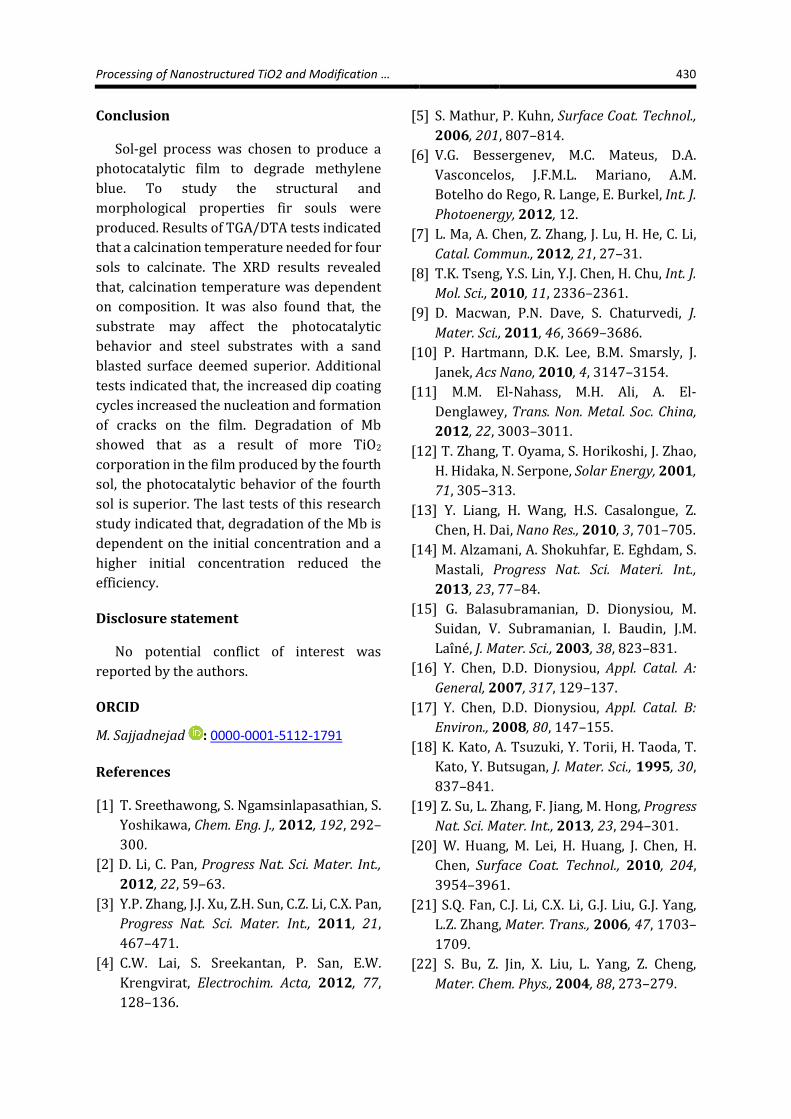
substrate. As it can be inferred from Figure 9,
photolysis of Mb was enhanced by addition of P-
25. However, the best result was achieved in the
in PED+P-25 film. In Figure 9, the vertical axis is
the amount of maintained Mb in the solution, so
as it decreased the degradation efficiency was
improved.
Apart from the increased presence of TiO2 in
the film several other mechanisms are
responsible for this behavior. P-25 loading
produced more cracks on the film. This is the
direct result of p-25’s low permeability and high
density that in turn decreases the permeability
of TiO2 film, thus formation of more cracks on
the film [26]. On the other hand, PEG increases
the roughness of the layer because of its
removal during calcination step which lead to
formation of more porosities [21]. Also, PEG
limits water absorption in favor of direct dye
absorption [27] not only at the surface of the
photocatalytic film, but also at the increased
porosities that are present in the film [28].
Processing of Nanostructured TiO2 and Modification … 428
Figure 6. SEM images of
the TiO2 immobilized on
(a) smooth and (b)
rough stainless steel
Table 3. Average diameter of the islands and crack surface percentage that were calculated using
Clemex software
Sand blasted (rough) Smooth
Crack area percentage 24% 35%
Average diameter of islands (µm) 60 37
Figure 7. SEM images of the surface
morphology of TiO2 films immobilized
from different sols
Effect of initial concentration of Mb
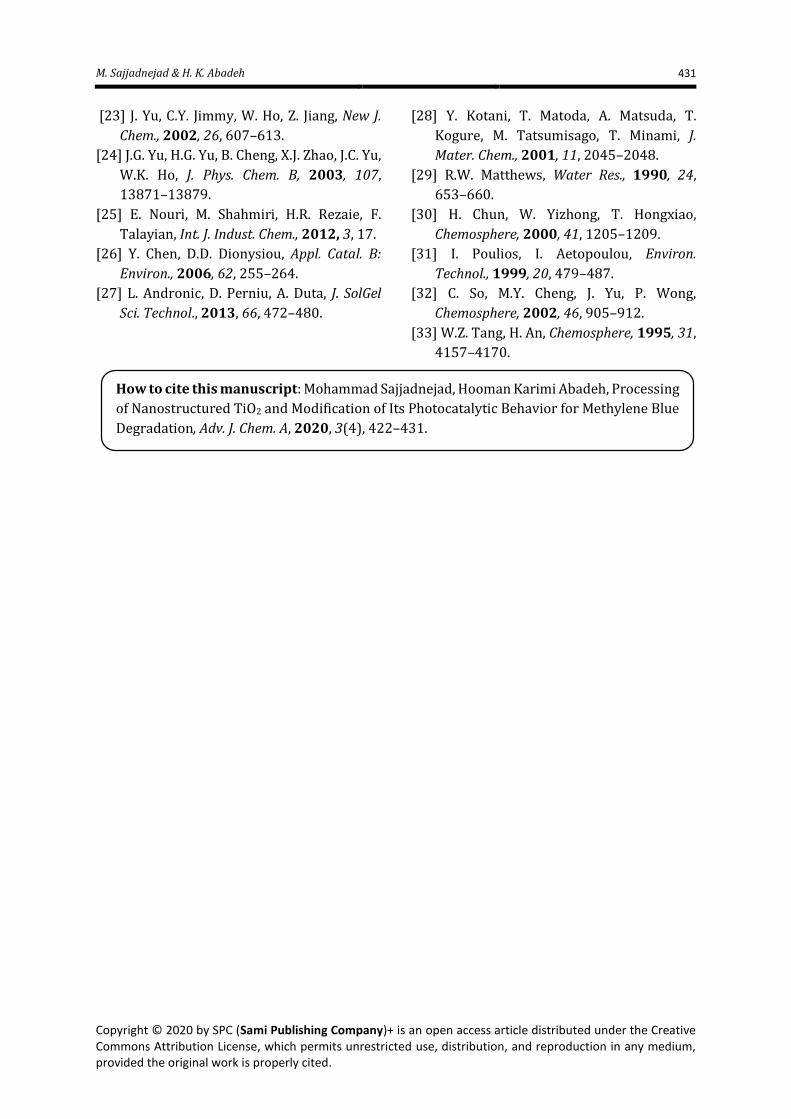
As seen in Figure 10, the photo degradation
of Mb decreased as the initial concentration
increased. Several other studies reported the
same behavior for photo degradation of
organic compounds and dyes [31, 32]. It was
theorized that when the initial concentration
of dye increased in the solution, the amount of
absorbed Mb molecules on the surface of TiO2
increased, limiting the direct interaction of
other molecules with generated holes and
M. Sajjadnejad & H. K. Abadeh 429
hydroxyl radicals. Also, a higher amount of Mb
molecules in solution bulk absorbs an amount
of UV light itself and lessen the amount of
photons that reach the surface of TiO2 film.
This in turn decreased the hydroxyl radical
flux [33] that ultimately resulted in a weaker
degradation of Mb at higher initial
concentrations.
Figure 8. EDS analysis of the
films produced from the (a) base
sol (b) second sol (c) third sol and
(d) fourth sol.
Figure 9. Photodegradation of
Methylene blue on TiO2 samples
prepared from different sols
Figure 10. Effect of initial Mb
concentration on photodegradation
of Methylene blue
Processing of Nanostructured TiO2 and Modification … 430
Conclusion
Sol-gel process was chosen to produce a
photocatalytic film to degrade methylene
blue. To study the structural and
morphological properties fir souls were
produced. Results of TGA/DTA tests indicated
that a calcination temperature needed for four
sols to calcinate. The XRD results revealed
that, calcination temperature was dependent
on composition. It was also found that, the
substrate may affect the photocatalytic
behavior and steel substrates with a sand
blasted surface deemed superior. Additional
tests indicated that, the increased dip coating
cycles increased the nucleation and formation
of cracks on the film. Degradation of Mb
showed that as a result of more TiO2
corporation in the film produced by the fourth
sol, the photocatalytic behavior of the fourth
sol is superior. The last tests of this research
study indicated that, degradation of the Mb is
dependent on the initial concentration and a
higher initial concentration reduced the
efficiency.
Disclosure statement
No potential conflict of interest was
reported by the authors.
ORCID
M. Sajjadnejad : 0000-0001-5112-1791
References
[1] T. Sreethawong, S. Ngamsinlapasathian, S.
Yoshikawa, Chem. Eng. J., 2012, 192, 292–
300.
[2] D. Li, C. Pan, Progress Nat. Sci. Mater. Int.,
2012, 22, 59–63.
[3] Y.P. Zhang, J.J. Xu, Z.H. Sun, C.Z. Li, C.X. Pan,
Progress Nat. Sci. Mater. Int., 2011, 21,
467–471.
[4] C.W. Lai, S. Sreekantan, P. San, E.W.
Krengvirat, Electrochim. Acta, 2012, 77,
128–136.
[5] S. Mathur, P. Kuhn, Surface Coat. Technol.,
2006, 201, 807–814.
[6] V.G. Bessergenev, M.C. Mateus, D.A.
Vasconcelos, J.F.M.L. Mariano, A.M.
Botelho do Rego, R. Lange, E. Burkel, Int. J.
Photoenergy, 2012, 12.
[7] L. Ma, A. Chen, Z. Zhang, J. Lu, H. He, C. Li,
Catal. Commun., 2012, 21, 27–31.
[8] T.K. Tseng, Y.S. Lin, Y.J. Chen, H. Chu, Int. J.
Mol. Sci., 2010, 11, 2336–2361.
[9] D. Macwan, P.N. Dave, S. Chaturvedi, J.
Mater. Sci., 2011, 46, 3669–3686.
[10] P. Hartmann, D.K. Lee, B.M. Smarsly, J.
Janek, Acs Nano, 2010, 4, 3147–3154.
[11] M.M. El-Nahass, M.H. Ali, A. El-
Denglawey, Trans. Non. Metal. Soc. China,
2012, 22, 3003–3011.
[12] T. Zhang, T. Oyama, S. Horikoshi, J. Zhao,
H. Hidaka, N. Serpone, Solar Energy, 2001,
71, 305–313.
[13] Y. Liang, H. Wang, H.S. Casalongue, Z.
Chen, H. Dai, Nano Res., 2010, 3, 701–705.
[14] M. Alzamani, A. Shokuhfar, E. Eghdam, S.
Mastali, Progress Nat. Sci. Materi. Int.,
2013, 23, 77–84.
[15] G. Balasubramanian, D. Dionysiou, M.
Suidan, V. Subramanian, I. Baudin, J.M.
Laîné, J. Mater. Sci., 2003, 38, 823–831.
[16] Y. Chen, D.D. Dionysiou, Appl. Catal. A:
General, 2007, 317, 129–137.
[17] Y. Chen, D.D. Dionysiou, Appl. Catal. B:
Environ., 2008, 80, 147–155.
[18] K. Kato, A. Tsuzuki, Y. Torii, H. Taoda, T.
Kato, Y. Butsugan, J. Mater. Sci., 1995, 30,
837–841.
[19] Z. Su, L. Zhang, F. Jiang, M. Hong, Progress
Nat. Sci. Mater. Int., 2013, 23, 294–301.
[20] W. Huang, M. Lei, H. Huang, J. Chen, H.
Chen, Surface Coat. Technol., 2010, 204,
3954–3961.
[21] S.Q. Fan, C.J. Li, C.X. Li, G.J. Liu, G.J. Yang,
L.Z. Zhang, Mater. Trans., 2006, 47, 1703–
1709.
[22] S. Bu, Z. Jin, X. Liu, L. Yang, Z. Cheng,
Mater. Chem. Phys., 2004, 88, 273–279.
M. Sajjadnejad & H. K. Abadeh 431
Copyright © 2020 by SPC (Sami Publishing Company)+ is an open access article distributed under the Creative Commons Attribution License, which permits unrestricted use, distribution, and reproduction in any medium, provided the original work is properly cited.
[23] J. Yu, C.Y. Jimmy, W. Ho, Z. Jiang, New J.
Chem., 2002, 26, 607–613.
[24] J.G. Yu, H.G. Yu, B. Cheng, X.J. Zhao, J.C. Yu,
W.K. Ho, J. Phys. Chem. B, 2003, 107,
13871–13879.
[25] E. Nouri, M. Shahmiri, H.R. Rezaie, F.
Talayian, Int. J. Indust. Chem., 2012, 3, 17.
[26] Y. Chen, D.D. Dionysiou, Appl. Catal. B:
Environ., 2006, 62, 255–264.
[27] L. Andronic, D. Perniu, A. Duta, J. SolGel
Sci. Technol., 2013, 66, 472–480.
[28] Y. Kotani, T. Matoda, A. Matsuda, T.
Kogure, M. Tatsumisago, T. Minami, J.
Mater. Chem., 2001, 11, 2045–2048.
[29] R.W. Matthews, Water Res., 1990, 24,
653–660.
[30] H. Chun, W. Yizhong, T. Hongxiao,
Chemosphere, 2000, 41, 1205–1209.
[31] I. Poulios, I. Aetopoulou, Environ.
Technol., 1999, 20, 479–487.
[32] C. So, M.Y. Cheng, J. Yu, P. Wong,
Chemosphere, 2002, 46, 905–912.
[33] W.Z. Tang, H. An, Chemosphere, 1995, 31,
4157–4170.
How to cite this manuscript: Mohammad Sajjadnejad, Hooman Karimi Abadeh, Processing
of Nanostructured TiO2 and Modification of Its Photocatalytic Behavior for Methylene Blue
Degradation, Adv. J. Chem. A, 2020, 3(4), 422–431.