Embed Size (px)
Citation preview

1
Processing and Properties of Eu3+-doped Transparent YAG (Y3Al5O12) Nano Glass-Ceramics
Anal Tarafder, Atiar Rahaman Molla, and Basudeb Karmakar†
Glass Science and Technology Section, Glass Division, Central Glass and Ceramic Research Institute
(Council of Scientific and Industrial Research), Kolkata 700032, India Abstract
Eu3+
-doped novel mother glass in the K2O-SiO2-Y2O3-Al2O3 (KSYA) system was
prepared by the melt-quench technique. The transparent Y3Al5O12 (YAG) glass-
ceramics were derived from this glass by a controlled crystallization process. The
formation of YAG crystal phase, size and morphology with progression of heat-
treatment was examined by X-ray diffraction (XRD), transmission electron microscopy
(TEM), field emission scanning electron microscopy (FESEM) and Fourier transformed
infrared reflectance spectroscopy (FT-IRRS). The crystallite sizes obtained from XRD
are found to increase with heat-treatment time and vary in the range 35-45 nm. The
photoluminescence spectra of Eu3+
ions exhibit emission transitions of 5D0, 1 ����
7Fj (j = 0,
1, 2, 3 and 4) and its excitation spectra shows a charge transfer band (CTB) around 280
nm. From these emissions, the site symmetry in the vicinity of Eu3+
ions has been found
to be Cs or lower than Cs in the nano glass-ceramics. The absorption and fluorescence
spectra reveal that the Eu3+
ions are entering into the YAG nanocrystals of the glass-
ceramics. The present study indicates that the incorporation of Eu3+
ions into YAG
crystal lattice enhance the fluorescence performance of the nano glass-ceramics. We
believe that this work would generate new avenues in the exploration of YAG nano
glass-ceramics in particular and other glass-ceramics of very high temperature melting
crystals in general.
†Author to whom correspondence should be addressed. e-mail address: [email protected]

2
I. Introduction
Optically transparent single crystal YAG is used as optical host materials in various solid-
state lasers for its outstanding optical properties when doped with lanthanide (4f1-13) or
transition (3d1-9) elements. Laser operation of Nd:YAG was first demonstrated by Geusic et
al.1 at Bell Laboratories in 1964. Since then it is one of the most widely used laser materials
available till date. YAG based materials are used for many different applications such as in
cathode-ray tube (CRTs), field emission displays (FED), scintillation, phosphors and electro-
luminescent applications as well.2-7 Generally, single crystals YAG is formed by the crystal
growth techniques. Single crystal YAG preparation by crystal growth technique is expensive
and requires very sophisticated equipment, and is technically difficult to produce in desired
shape, size and optical quality.
In addition to its single crystal form, polycrystalline YAG doped with active rare-earth
(RE) ions prepared by different routes other than glass-ceramics route has received much
attention and has been used as an excellent phosphor or laser material.8-12 However, the
glass-ceramics route has not been used to prepare YAG based transparent glass-ceramics
laser materials due to several difficulties such as requirement of very high temperature (>
1650oC) and opaqueness of the resultant product. Johnson et al.13 investigated kinetics and
pathways for crystallization of glasses with YAG. Nishi et al.14 investigated the phase-
selective cathodoluminescence spectra of Er:YAG glass-ceramics. Crystallization of YAG in
yttrium alumina silica glass was reported by P. Jander15 and found that the crystallized phase
was almost YAG but not transparent or nanocrystalline. It was also observed that the batch
materials could not be melted completely and unmelted batch materials remained at the
bottom of the melting crucible. Therefore, the reports of YAG based transparent glass-
ceramics prepared by controlled crystallization of melt-quenched mother glass obtained from

3
a homogeneous glass melt are very rare. Moreover in all the cases the derived glass-ceramics
are macrocrystalline in nature and not suitable for optical applications.
During the past decades, the novel and enhanced properties of nanostructured materials
have also attracted considerable attention for their interesting optical properties.16, 17 In this
context Tarafder el al.18 and Chaliha et al.19 have very recently reported the processing and
properties of RE-doped nanostructured transparent glass-ceramics prepared by controlled
crystallization technique. They have also reported that those nano glass-ceramics have
potential optical applications. To the best of our knowledge, there is no report on transparent
nanostructured YAG glass-ceramics in the potassium aluminosilicate, K2O-SiO2-Y2O3-Al2O3
(KSYA) glass-matrix due to the difficulties in preparation of transparent precursor glass in
general and transparent glass-ceramics in particular which involves high temperature (about
1650-1700oC) for its precursor glass melting. In view of this, it is interesting to study the
properties of nanostructured YAG glass-ceramics prepared by controlled crystallization of
mother glass.
In the present work, we report the preparation of Eu3+-doped novel K2O-SiO2-Y2O3-
Al2O3 (KSYA) based glass by melt-quench technique and transparent nano glass-ceramics by
isothermal controlled crystallization of mother glasses. The crystallization process has been
studied by differential thermal analysis (DTA), X-ray diffraction (XRD), transmission
electron microscopy (TEM), field emission scanning electron microscopy (FESEM) and
Fourier transform infrared reflection spectroscopy (FT-IRRS). The glass and derived nano
glass-ceramics were characterized by studying their thermal, structural and optical properties.
4
II. Experimental Procedure
(1) Mother Glass Preparation
The mother glass having molar composition 28Ki2O-42SiO2-11.25Y2O3-18.75Al2O3 doped
with Eu2O3 (0.5 mol% in excess) was prepared from pure raw materials such as potassium
carbonate, K2CO3 (GR, 99%, Loba Chemie, Mumbai, India), silica, SiO2 (99.8%, Sipur A1
Bremtheler Quartzitwerk, Usingen, Germany), yttrium (III) oxide, Y2O3 (99.99%, Alfa
Aesar, Ward Hill, MA), alumina, Al2O3 (99%, Aldrich, Milwaukee, WI), and europium (III)
oxide, Eu2O3 (99.9%, Alfa Aesar, Ward Hill, MA) by conventional melt-quench technique.
The well-mixed batch of about 150 g glass was melted in a platinum crucible in an electric
furnace at 1680°C for 2h in air with intermittent stirring. The glass melt was poured onto a
pre-heated iron mould. It was annealed at 700°C for 2 h to remove the internal stresses of the
glass and then slowly cooled down to room temperature. The as-prepared glass block was cut
into desired dimensions and optically polished for ceramization and subsequent
characterization.
(2) Characterization
The density of mother glass was measured using Archimedes principle using water as
buoyancy liquid. The refractive indices were measured by a Prism Coupler (Model: 2010/M,
Metricon Corporation, Pennington, NJ) at five different wavelengths (λ = 473, 532, 633, 1064
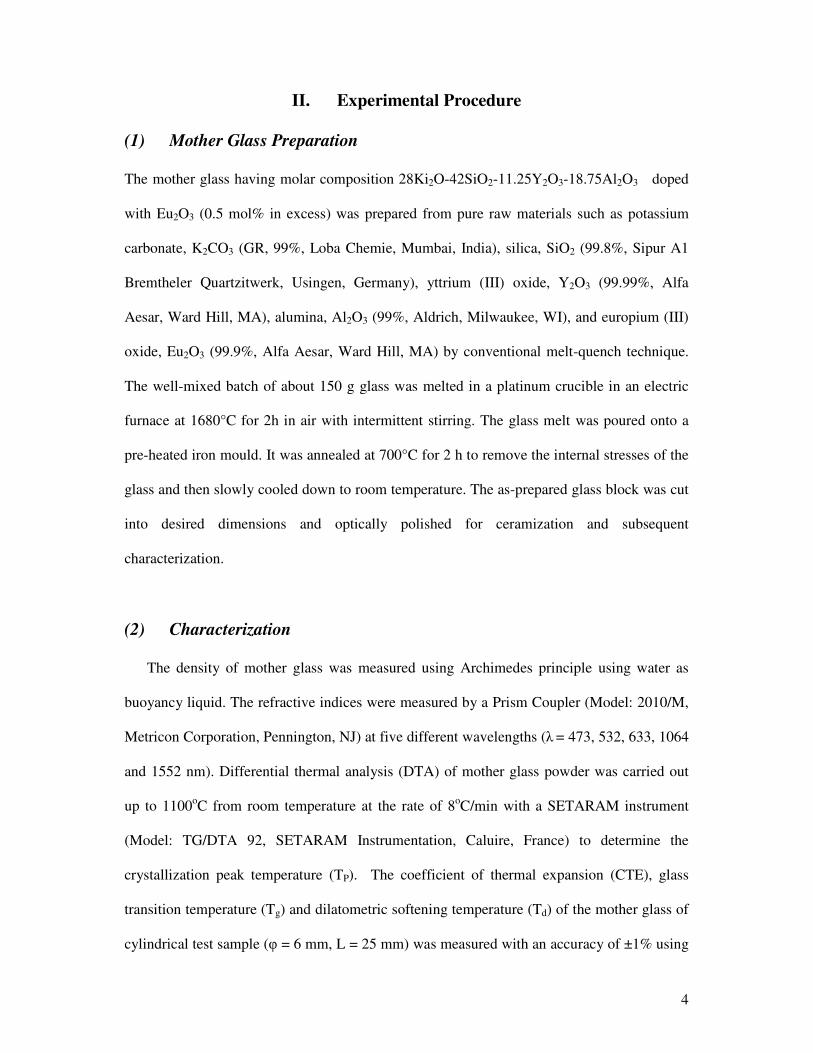
and 1552 nm). Differential thermal analysis (DTA) of mother glass powder was carried out
up to 1100oC from room temperature at the rate of 8oC/min with a SETARAM instrument
(Model: TG/DTA 92, SETARAM Instrumentation, Caluire, France) to determine the
crystallization peak temperature (TP). The coefficient of thermal expansion (CTE), glass
transition temperature (Tg) and dilatometric softening temperature (Td) of the mother glass of
cylindrical test sample (φ = 6 mm, L = 25 mm) was measured with an accuracy of ±1% using

5
a horizontal-loading dilatometer (Model: DIL 402 PC, NETZSCH-Gerätebau GmbH, Selb,
Germany) after calibration with a standard alumina supplied with the instrument by the
manufacturer. The CTE in the temperature range 50-350oC is reported here. XRD patterns
were recorded using an XPERT-PRO MPD diffractometer (PANalytical, Almelo, the
Netherlands) and the measurements were operated with Ni-filtered CuKα = 1.5406 Å
radiation as the X-ray source at 40 kV and 40 mA to identify the developed crystalline
phases. The 2θ scan range was 10o to 80o with a step size of 0.05o.
The TEM images and selected area electron diffraction (SAED) pattern of powdered
glass-ceramics were obtained from FEI (Model: Tecnai G2 30ST, FEI Company, Hillsboro,
OR) instrument. A high resolution FESEM (Gemini Zeiss SupraTM 35 VP model of Carl
Zeiss Microimaging GmbH, Berlin, Germany) was used to observe the microstructure of
freshly fractured surfaces of the heat-treated nano glass-ceramics after etching in 2% HF
aqueous solution for 5 minutes, dried and then coated with a thin carbon film. The FTIR
reflectance spectra of all Eu3+-doped glass and glass-ceramics were recorded using a FTIR
spectrometer (Model: 1615 Series, Perkin-Elmer Corporation, Norwalk, USA) in the
wavenumber range 400-1500 cm-1 with a spectral resolution of + 2 cm-1 and at 15o angle of
incidence. Optical absorption spectra were recorded UV-Vis-NIR spectrophotometer
(Lambda 20, Perkin-Elmer Corporation, Norwalk, USA) at room temperature to monitor the
changes of the environmental structure of the Eu3+ ions. The fluorescence emission and
excitation spectra were measured on a bench top modular spectrofluorometer (QuantaMaster,
Photon Technology International, Birmingham, NJ) attached with a Xe arc lamp as excitation
source. The excited state lifetime was measured with the same instrument using a Xe flash
lamp of 75 W.
6
III. Results and Discussion
(1) Thermal, Optical and Other Physical Properties
The composition of mother glass is 28Ki2O-42SiO2-11.25Y2O3-18.75Al2O3 (mol%) doped
with 0.5 mol% Eu2O3 (in excess). We tried to melt several glass compositions with higher
quantities of YAG forming oxides (Y2O3 and Al2O3). It was observed that higher quantity
(>30 mol%) of Y2O3 and Al2O3 could not be incorporated in the glass matrix without
sacrificing the transparency. In this context, it may be mentioned that Nishi et al.14 could
incorporate 29.5 mol% YAG compositions in the 34CaO-8.5Y2O3-21Al2O3-36SiO2-0.5Er2O3
glass-matrix. However, their ultimate glass-ceramic was opaque. The DTA curve of the
mother glass is shown in Fig. 1. It exhibits two intense exothermic peak at 940oC (Tp1) and
971oC (Tp2) corresponding to the YAG and potassium aluminium silicate, KAlSiO4
crystallization respectively. In addition the Tg estimated from this curve found to be 8210C.
Coefficient of thermal expansion (CTE), glass transition temperature (Tg) and dilatometric
softening point (Td) of the mother glass were measured using a dilatometer and the measured
values from this dilatometric curve (Fig. 2) are presented in Table I. CTE was measured over
the temperature range of 50- 3500C and its value is 111 x 10-7 K-1. The dilatometric curve
revealed that the mother glass possesses a very high glass transition (8190C) and softening
temperature (8670C) due to the presence of high melting SiO2, Y2O3 and Al2O3 as major
constituents of glass.
The mother glass is visually transparent, appearing light brownish yellow due to Eu3+
doping. The mother glass samples were heat treated at 750oC for 0, 3, 10, 30 and 50 h after
nucleating at 700oC for 2 h. The obtained samples were labelled as a, b, c, d and e (Fig. 3)
respectively for convenience. In the preliminary experimentation to obtain nanostructured
transparent glass-ceramics, it was observed that the mother glass had been transformed into
opaque glass-ceramics after heat-treating at Tg or above Tg. In the course of this investigation,
7
we established an optimum nucleation temperature of 700oC and crystallization temperature
of 750oC where the nano glass-ceramics maintain their transparency. Tarafder et al.20 has also
adopted a similar heat-treatment protocol for developing nanostructured transparent
Eu3+:LiTaO3 in Li2O-Ta2O5-SiO2-Al2O3 glass-ceramics. The transparency of the mother glass
persists in the heat-treated samples. The glass-ceramics thus obtained became more
transparent by decreasing the brownish yellow color intensity due to devitrification with the
progress of heat-treatment duration. The measured density of the mother glass is 3.033 g.cm-3
and this high value attributes to the presence of relatively high molecular weight Y2O3 as a
component of the glass. Fig. 4 presents Cauchy fitting based on measured refractive indices at
five different wavelengths (see experimental techniques) and shows the dependences of the
refractive index on the wavelength for mother glass (a) and the 30 h heat-treated glass-
ceramics (d) sample. In general, refractive index decreases with increasing wavelength due to
dispersion. This trend is observed in both the samples. In addition to this, the refractive index
of the glass-ceramic sample (d) has increased in comparison with mother glass (a) that can be
seen in Fig. 4. The refractive indices nF, nD and nC have been estimated at three standard
wavelengths (λF = 486.1 nm, λD = 589.2 nm and λC = 656.3 nm respectively) from the
dispersion curve (Fig. 4, curve a). The Abbe number (υD) is calculated by the relation
CF
D
nn
n
D −
−=
1υ (1)
The calculated υD for mother glass (a) and glass-ceramic (d) are 53 and 56 respectively.
Therefore, the glass-ceramics are of lower dispersion than mother glass. From the measured
glass density (ρ) and refractive index (nD) at wavelength λD = 589.2 nm, other related optical
properties have been determined using relevant expressions and the results are presented in
Table I. It is observed that the formation of high refractive index YAG (RI = 1.8317 at 600
8
nm21) causes the heat-treated sample to exhibit higher refractive indices as compared to
mother glass. This is shown in Fig. 4, curve-d.
(2) X-ray Diffraction Analysis
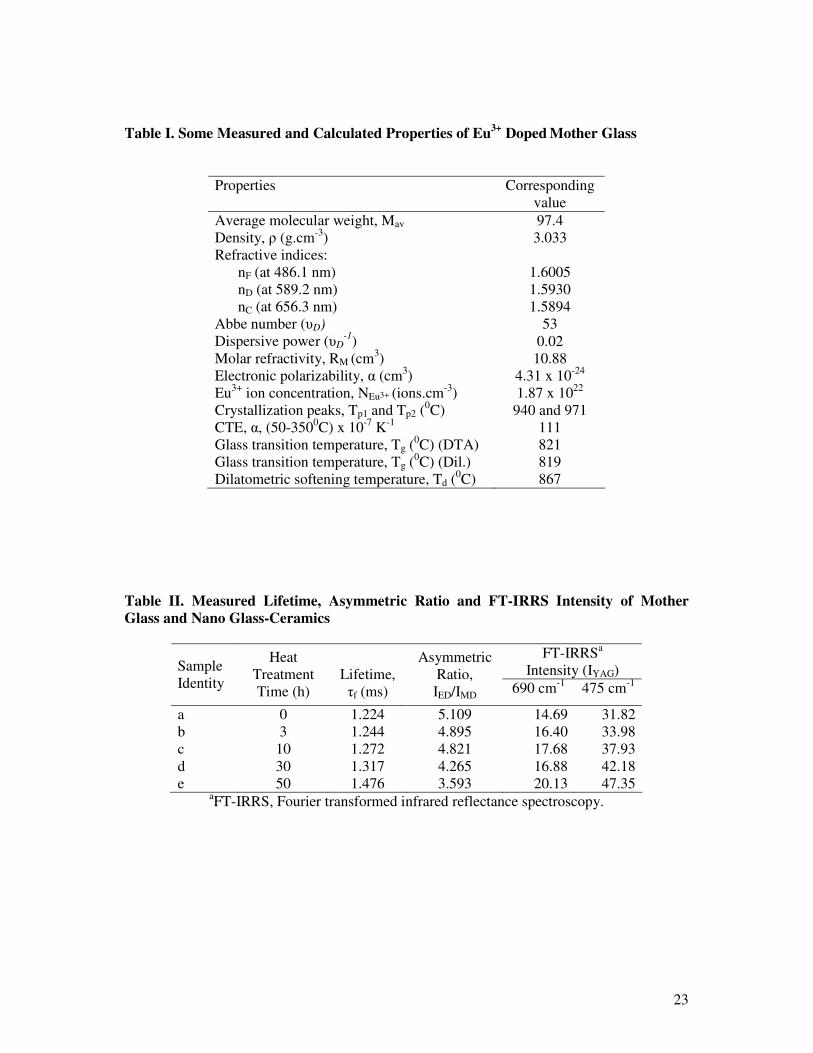
The X-ray diffraction pattern of the Eu3+-doped KSYA mother glass and cerammed glass-
ceramics are shown in Fig. 5. No diffraction peak appears for the samples a-c which indicates
that the powders are amorphous in nature for these samples. The diffraction peak of the
samples d and e heat-treated for longer duration are indexed and it resembled to some extent
as Y3Al5O12 phase (JCPDS file 33-0040). Progression of heat-treatment leads to an increase
of diffraction peak intensity and a decrease of peak full-width at half-maxima (FWHM) due
to the improved crystallinity and the coarsening of grains. The two YAG glass-ceramics
obtained after heat-treating the mother glass at 940 and 9800C for 10 h duration are opaque in
appearance and their respective XRD patter is included in Fig. 5. The sharp diffraction lines
are also attributed to the better crystallinity and coarsening of grains in the opaque YAG
glass-ceramics.
From the full width at half maximum (FWHM) of the most intense diffraction peak (420)
of transparent YAG nano glass-ceramics, the average crystallite size (diameter, d) is
calculated by using the Scherrer’s formula22
θβλ cos/9.0=d (2)
where λ is the wavelength of X-ray radiation (CuKα = 1.5406Å), and β is the full width at
half maximum (FWHM) of the peak at 2θ.
The average calculated crystallite sizes of YAG nanocrystal increase with progression of
heat-treatment and the values increasing in the range 35-45 nm over the investigated heat-
treatment time period. It is observed from the XRD patterns that there is evidence of presence
of minor amount KAlSiO4 (JCPDS file 33-0989) in the derived nano glass-ceramics which is

9
also marked in Fig. 5. It correlates well with the observation of formation of minor
spodumene (LiAlSi2O6) phase in the Eu3+:Li2O-Ta2O5-SiO2-Al2O3 system as reported by
Tarafder et al.18
(3) TEM and FESEM Image Analyses
TEM and FESEM analyses were performed to study the size, shape and morphology of nano
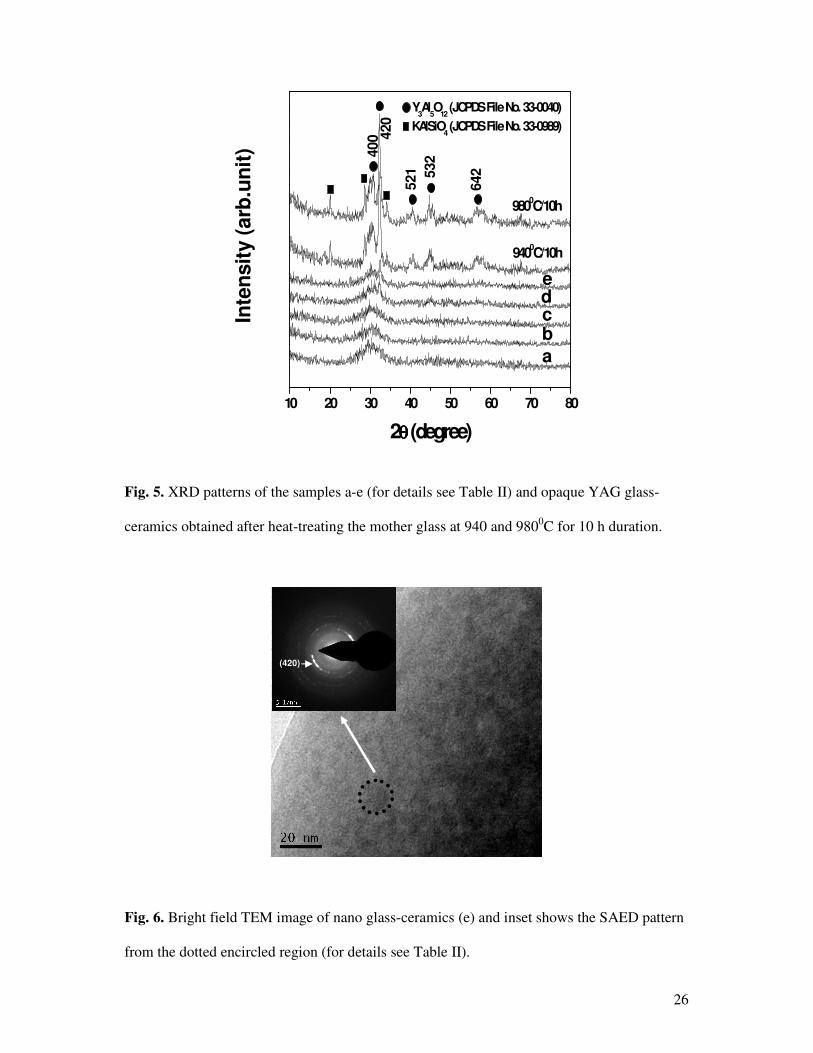
glass-ceramics. Fig. 6 shows bright field TEM image of nano glass-ceramics (e) and its inset
shows the selected area electron diffraction (SAED) pattern from the dotted encircled region.
The SAED pattern confirms the presence of crystalline YAG in the nano glass-ceramics as
JCPDS file 33-0040. It is also found that the crystallite sizes are in the range of 10-15 nm.
FESEM images of the fractured surface of samples c and e have been presented in Figs. 7(a)
and (b) respectively. From the FESEM micrographs, it is clearly observed that the glassy
matrix of the heat-treated samples initially phase separated on nanometric scale followed by
incipient precipitation of defined crystallites (YAG) within the phase-separated grains (Fig. 7
a) with increase in heat-treatment time. The phase separated grains are irregular in shapes and
distributed uniformly thought out the bulk glass matrix. The size of the phase separated
grains varies in the range 50-60 nm. These grains are well separated and grown with distinct
features by way of further increase in heat-treatment time (Fig. 7 b). Comparing with the
crystalline sizes, it is clear that these phase separated grains are polycrystalline in nature. The
crystallite sizes obtained from TEM image is less than that of evaluated by Scherrer’s
formula using XRD patterns. This difference is due to the following facts. TEM gives the
images of crystallites at a particular selected region of the sample whereas Scherrer’s formula
gives the average crystallite sizes comprising of from very small to very large size
crystallites. This difference, therefore, is not unexpected.
10
(4) Fourier Transform Infrared Reflectance Spectroscopy (FTIRRS)
The FTIR reflectance spectra of the bulk mother glass and heat-treated samples in the
wavenumber range 400-1500 cm-1 are shown in Fig. 8(A). It is seen from these spectra that
the mother glass (curve-a) exhibits three broad reflection bands centred around 950, 675 and
475 cm-1 as a result of wider distribution of silicon and YAG structural units. It is also
observed that one more reflection band gradually appeared around 575 cm-1 with increasing
heat-treatment duration. The reflection bands centred at 690, 575 and 475 cm-1 are assigned
to the characteristics Al-O and Y-O bond vibrations of crystalline YAG. All these bands well
matched with the reported data of a crystallized YAG.23-26 The reflection band centred at 950
cm-1 and gradually shifted to 980 cm-1. It is assigned to Si-O stretching vibration of residual
glass and potassium aluminium silicate.27 It is seen that with progression of heat-treatment all
the FTIR reflection band intensities (here reflectivities) increase and become narrower
gradually. The values of FTIR band intensities due to YAG formation at 690 and 475 cm-1
are given in Table II and plotted in Fig. 8(B) with heat-treatment time. Thus from the
investigations of FTIR reflectance spectra of Eu3+ doped K2O-SiO2-Y2O3-Al2O3 glass and
glass-ceramics, it is clear that the crystallization is taking place with initial phase separation
followed by advancement of mainly YAG crystal formation along with minor quantity of
potassium aluminium silicate phase formation in the residual glass matrix. The results of the
FTIRRS are in good agreement with that of XRD, TEM and FESEM studies.
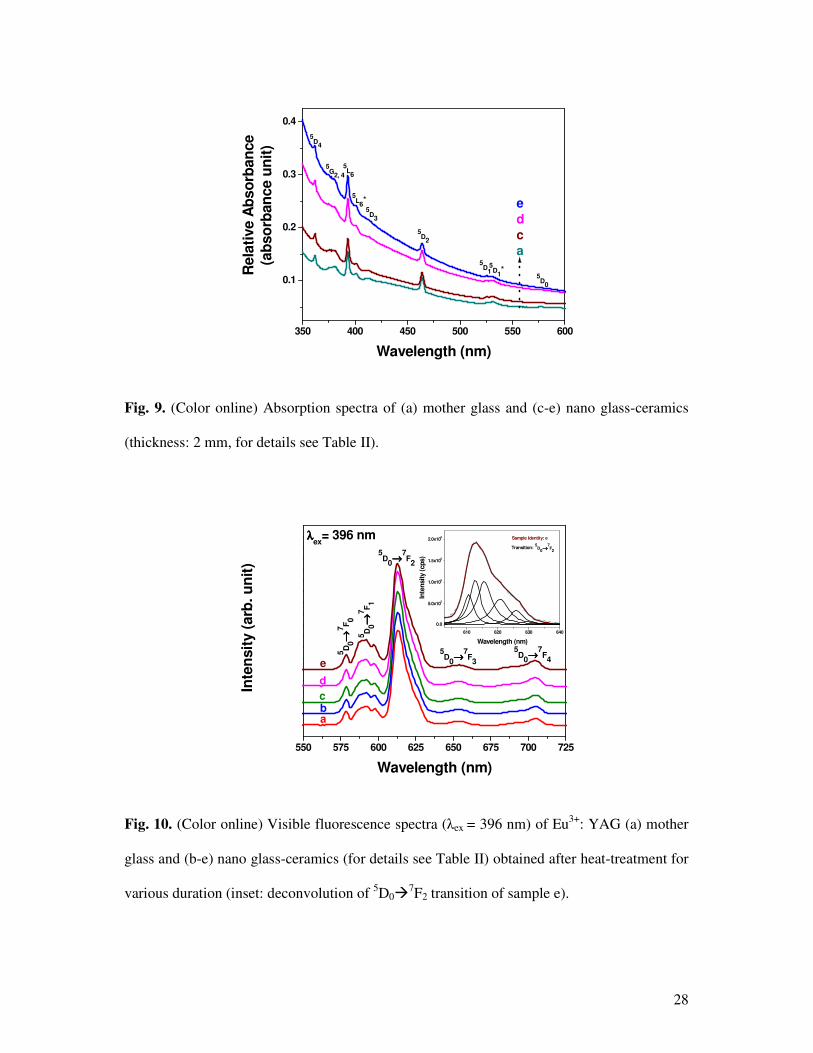
(5) UV-Visible Absorption Spectra
The room temperature measured absorption spectra of Eu3+-doped KSYA mother glass and
heat-treated glass-ceramic samples in the UV-visible range (350-600 nm) have been
presented in Fig. 9. The spectra reveal the absorption bands of Eu3+ ion due to transitions
from its ground state multiplets such as 7F0 and thermally populated 7F1 levels to the upper

11
levels of 4f6 configuration. In the case of Eu3+ ions, the ground state 7F0 and the higher-level
7F1 are very close to each other (around 360 cm-1 apart). So, at room temperature a significant
amount of 7F1 level is thermally populated28, 29 according to Boltzmann distribution law with
the thermal energy kT (0.025 eV = 201.6 cm-1 at room temperature which results in a
characteristic absorption spectrum of Eu3+ ions exhibiting closely spaced doublets. In the
present study, the recorded absorption peaks for all the glass and glass-ceramics under
investigation are assigned in accordance with Carnall’s convention.28 The observed
transitions of 7F0�5D0 (578 nm), 5D1 (526 nm), 5D2 (463 nm), 5D3 (412 nm), 5L6 (393 nm),
5G2 (381 nm), 5G4 (376 nm), 5D4 (362 nm) and 7F1� 5D1* (531 nm), 5L6
* (401 nm) are
marked in the absorption spectra depending upon their peak energies. From this figure it is
noticed that the base line of absorption spectra of heat-treated samples (c-e) has been elevated
significantly with the diminishing intensities of the absorption peaks. This elevation could be
attributed to scattering of short wavelength light by the crystals30, 31 or may be due to the
difference in refractive index of crystalline phase (RI of YAG is 1.8317 at 600 nm21 with that
of residual glassy matrix (RI = 1.5905 at 656.3 nm, see Table I). These elevations are larger
in lower wavelength region than that of higher wavelength. Since the crystallites (35-45 nm)
are smaller than the visible wavelength, a Rayleigh scattering model should be applicable.32
According to this model, the scattering loss, τ is given by
(3)
where d is the particle diameter, λ the wavelength of light, n the refractive index, N the
number density of particles, and V the volume of the particle. In general, with progression of
heat-treatment, the number and sizes of nanocrystallites developed in the glassy matrix have
been increased. Hence the scattering centres and scattering loss have also been increased that
NVnnd
4
234
3
)(32
λ
πτ
∆=
12
corresponds to a decrease in the visible transparency of the nano glass-ceramics. The similar
type elevation of base line of absorption spectrum in nano glass-ceramics has earlier been
shown by Hirano et al.33 However, there is no significant difference amongst the shapes
(profiles) of the absorption bands of the glass and nano glass-ceramics.
(6) Emission Spectra
The emission spectra of the mother glass and the glass-ceramics under the excitation at 396
nm monochromatic light from an arc Xe lamp is shown in Fig. 10. The spectra of the Eu3+-
doped glass and the glass–ceramics exhibit five emission peaks at 579, 592, 613, 653 and 704
nm. These five emission peaks can be attributed to the 5D0�7F0, 1, 2, 3, 4 transitions of Eu3+.
More emission peaks have been observed in YAG nano powder34-36 in comparison to our
developed nano glass-ceramics because of the formed YAG nanocrystals are surrounded by
amorphous glass matrix which leads to less emission peaks. The main emission peak near
613 nm is assigned to the induced electric dipole (ED) transition 5D0�7F2 of Eu3+ and it is
dominant over emission peak near 592 nm which is assigned to the magnetic dipole (MD)
transition 5D0�7F1 of Eu3+. The induced electric dipole transition appears when Eu3+ ions
occupy non-centrosymmetric lattice centres, whereas the magnetic dipole transition appears
due to both centrosymmetric and non-centrosymmetric lattice centres.37 Therefore, the
analysis of the spectral features of 5D0�7F1,2 transitions are very important to understand the
local environment of Eu3+ ions. Upon the heat-treatment, it is also observed that the emission
transitions from 5D0�7F1 (MD) and 5D0�
7F2 (ED) in glass-ceramic samples (b-e) have
displayed three and five Stark splittings respectively. These changes in emission spectra of
glass-ceramics suggest the fact that the Eu3+ ions enter into the crystalline phase (YAG) thus
formed. The Eu3+ ion is entering into the crystal (YAG) and it prefers to replace Y3+ over
Al3+ site due to the closeness of their ionic radii (Eu3+ = 0.95 Å, Y3+ = 1.04 Å and Al3+ = 0.50
13
Å). Following the crystal field selection rules, the presence of 5D0� 7F0 transition and the
existence of three and five Stark components for the transitions 5D0� 7F1 and 5D0� 7F2 (see
inset of Fig. 10) respectively, this could be suggested that the rare earth (Eu3+) ions are facing
near Cs or lower point symmetry in its vicinity in this host matrix.37, 38 As seen in Fig. 9, the
5D0�7F2 transition is dominant among the 5D0�
7FJ transitions, and the half width for the
5D0�7F2 transition is about 10 nm. It is, therefore, revealed from the emission spectra that the
crystal field at Eu3+ sites in transparent nanocrystalline glass-ceramic composites is not
homogeneous. The local field asymmetry defining factor such as relative intensity ratio of IED
to IMD of Eu3+ doped glass and nano glass-ceramics has been estimated from their
fluorescence spectra and listed in Table II. The values of 5.109 for mother glass, and of
4.895, 4.821, 4.265 and 3.593 for the nano glass-ceramics (b-e) were obtained. A similar type
observation has also been reported in transparent TeO2-based glass-ceramics by Hirano et
al.33 The asymmetric ratio of all the samples is greater than unity, which implies that the Eu3+
ions take non-centrosymmetric sites.
(7) Excitation Spectra
The fluorescence excitation spectra of samples (a) and (e) are measured in the wavelength
range 250 – 575 nm by monitoring with the intense red emission located at 613 nm. The
excitation spectra (Fig. 11) give a vivid picture of the presence of charge transfer band (CTB)
of Eu3+ and different f-f transitions within Eu3+ 4f6 configuration. The excitation spectra
consist of two intense bands at 396 and 466 nm in addition to eight relatively weak bands
peaking about 300, 322, 364, 383, 404, 416, 528 and 534 nm. The bands peaking around 322,
364, 396, 466 and 528 nm are assigned to transitions from the 7F0 level to the 5H4, 5D4,
5L6,
5D3, 5D2, and 5D1 levels of f-f transitions of Eu3+ ions respectively. On the other hand, rest of
the bands peaking around 300, 383, 404, 416 and 534 nm are assigned to the transitions from
14
thermally populated 7F1 level to the 5F4, 5L7,
5L6, 5D3 and 5D1 levels of f-f transitions of Eu3+
ions respectively. The Eu3+ ion has a CTB in the region of 200–300 nm.39 Thus, excitation
spectra exhibited a broad band around 280 nm which is attributed to the charge-transfer in the
Eu3+-O2- species. The CTB of YAG:Eu3+ corresponds to the electronic transition from 2p
orbital of O2- to the 4f orbital of Eu3+. With progress of heat-treatment the charge transfer
band shifts towards higher energy side (blue shifting) due to the decreased covalency in the
glass-ceramics compared to the mother glass. A similar type of CTB has also been reported in
nano-sized YAG:Eu3+ particles by Nakamura et al.36
(8) Lifetime
Fig. 12 shows the room temperature fluorescence decay curves of Eu3+ ions in mother glass
(a) and nano glass-ceramics (c and e) of the emission transition (5D0�7F2) at 613 nm with an
excitation at 396 nm. The measured curves demonstrate a single exponential decay. The
excited state lifetime (τf) for all has been estimated from these decay curves and the results
are shown in Table II. It is seen that the excited state (5D0) lifetime (τf) increases with
increase in Eu3+:YAG nanocrystallite sizes. Such variation can be attributed to the high
interaction of smaller particles with the high energy phonons of surrounding silicate glass
(about 1100 cm-1) which increases the nonradiative relaxation with decrease in particle size.40
In larger particles, less interaction with surrounding glass along with stable crystal site
occupation by the Eu3+ ion in the low phonon energy YAG host (about 690 cm-1 of YAG
nanocrystal, see Fig. 8A) decrease the nonradiative relaxation41 and thereby increase the
measured lifetime (τf) as governed by the equation42
nrr
f γγτ
+= 1
(4)

15
where γr and γnr are the radiative and nonradiative rates respectively. A similar behavior has
been found in other nano glass-ceramics containing nanocrystals of LiTaO3 and LaF2 doped
with Eu3+ and Er3+ respectively.26, 41
IV. Conclusions
The thermal, structural and optical properties of Eu2O3 doped transparent glass and nano
glass-ceramics in the K2O-SiO2-Y2O3-Al2O3 system are demonstrated here. The results of
XRD, TEM, FESEM, and FT-IRRS evidenced the formation of nanocrystalline YAG phase
in the KSYA glass matrix. The nanocrystallite size of YAG has been evaluated from XRD,
and found to vary in the range 35-45 nm. The FESEM image revealed that with progression
of heat-treatment the glassy matrix initially phase-separated followed by crystallization. The
appearance of Al-O and Y-O vibration bands in FTIR reflection spectra are also
characteristics of YAG phase formation. In addition, the fluorescence spectra of nano glass-
ceramics demonstrate that the Eu3+ ion enter into the YAG crystalline phase and takes nearly
Cs point symmetry in the place of Y3+ sites. We believe that this work would create new
avenues in the area of YAG nano glass-ceramics in particular and other glass-ceramics of
very high temperature melting crystals in general.
Acknowledgements
The authors thank Dr. D. K. Bhattacharya, Acting Director of the institute for his kind permission to publish
this paper. They thank Dr. R. Sen, Head, Glass Division, CGCRI for his encouragement to carry out this work.
The authors would like to thank Dr. K. Annapurna and Dr. K. Biswas, Scientists, CGCRI for their help in
recording the photoluminescence and refractive indices respectively. They thankfully acknowledge the RRCAT,
Indore for DTA measurements, and XRD and Electron Microscope Division of this institute for recording XRD
patterns and microscopic images respectively.
16
References
1B. H. King and J. W. Halloran, “Polycrystalline Yttrium Aluminum Garnet Fibers from
Colloidal Sols,” J. Am. Ceram. Soc., 78, 2141-2148 (1995).
2S. M. Sim, K. A. Keller, and T. I. Mah, “Phase Formation in Yttrium Aluminum Garnet
Powders Synthesized by Chemical Methods,” J. Mater. Sci., 35, 713–716 (2000).
3X. D. Zhang, H. Liu, W. He, J. Y. Wang, X. Li, and R. I. Boughton, “Synthesis of
Monodisperse and Spherical YAG Nanopowder by a Mixed Solvothermal Method,” J. Alloys
Compd., 372, 300–303 (2004).
4Y. H. Zhou, J. Lin, M. Yu, S. M. Han, S. B. Wang, and H. J. Zhang, “Morphology
Control and Luminescence Properties of YAG:Eu Phosphors Prepared by Spray Pyrolysis,”
Mater. Res. Bull., 38, 1289–1299 (2003).
5X. Li, H. Liu, J. Y. Wang, H. M. Cui, X. D. Zhang, and F. Han, “Preparation of YAG:Nd
Nano-Sized Powder by Co-Precipitation Method,” Mater. Sci. Eng. A, 379, 347–350 (2004).
6R. A. Rodriguez, E. De la Rosa, L. A. Diaz-Torres, P. Salas, R. Melendrez, and M.
Barboza-Flores, “Thermoluminescence Characterization of Tb3+ and Ce3+ Doped
Nanocrystalline Y3Al5O12 Exposed to X- and β-Ray Irradiation,” Opt. Mater., 27, 293–299
(2004).
7Z. Wu, X. Zhang, W. He, Y. Du, N. Jia, and G. Xu, “Preparation of YAG:Ce Spherical
Phase-Pure Particles by Solvo-Thermal Method and Their Photoluminescence,” J. Alloys.
Compd., 468, 571-574 (2009).
8S. Fujita, A. Sakamoto, and S. Tanabe, “Luminescence Characteristics of YAG Glass-
Ceramic Phosphor for White LED,” IEEE Sel. Top. Quantum Electron., 14, 1387-1391
(2008).
9G. Xia, S. Zhou, J. Zhang, and J. Xu, “Structural and Optical Properties of YAG:Ce3+
Phosphors by Sol-Gel Combustion Method,” J. Cryst. Growth, 279, 357-362 (2005).

17
10D. Boyer, G. B. Chadeyron, and R. Mahiou, “Structural and Optical Characterizations
of YAG: Eu3+ Elaborated by the Sol-Gel Process,” Opt. Mater., 26, 101-105 (2004).
11S. Nakamura, H. Yoshioka, Y. Matsubara, T. Ogawa, and S. Wada, “Efficient Tunable
Yb:YAG Ceramic Laser,” Opt. Commun., 281, 4411-4414 (2008).
12J. Lu, M. Prabhu, J. Song, C. Li, J. Xu, K. Ueda, A. A. Kaminskii, H. Yagi, and T.
Yanagitani, “Optical Properties and Highly Efficient Laser Oscillation of Nd:YAG
Ceramics,” Appl. Phys. B, 71, 469-473 (2000).
13B. R. Johnson and W. M. Kriven, “Crystallization Kinetics of Yttrium Aluminum
Garnet (Y3Al5O12),” J. Mater. Res., 16, 1795-1805 (2001).
14M. Nishi, S. Tanabe, K. Fujita, K. Hirao, and G. Pezzotti, “Phase-Selective
Cathodoluminescence Spectroscopy of Er:YAG Glass-Ceramics,” Solid State. Commun.,
132, 19-23 (2004).
15P. Jander, “An Investigation of Novel Materials for Active Optical Devices,” Ph.D.
Thesis, Optoelectronics Research Centre, Faculty of Engineering and Applied Science,
University of Southampton, UK, Dec. 2002.
16R.N. Bhargava, D. Gallagher, X. Hong, and A. Nurmikko, “Optical Properties of
Manganese-Doped Nanocrystals of ZnS,” Phys. Rev. Lett., 72, 416-419 (1994).
17G. Xia, S. Zhou, J. Zhang, S. Wang, Y. Liu, and J. Xu, “Sol–Gel Combustion Synthesis
and Luminescent Properties of Nanocrystalline YAG:Eu3+ Phosphors,” J. Cryst. Growth,
283, 257–262 (2005).
18A. Tarafder, K. Annapurna, R. S. Chaliha, V. S. Tiwari, P. K. Gupta, and B. Karmakar,
“Processing and Properties of Eu3+:LiTaO3 Transparent Glass-Ceramic Nanocomposites,” J.
Am. Ceram. Soc., 92, 1934-1939 (2009).

18
19R. S. Chaliha, K. Annapurna, A. Tarafder, V. S. Tiwari, P. K. Gupta, and B. Karmakar,
“Luminescence and Dielectric Properties of Nano-Structured Eu3+:K2O-Nb2O5-SiO2 Glass-
Ceramics,” Solid State Sci., 11, 1325–1332 (2009).
20A. Tarafder, K. Annapurna, R. S. Chaliha, V. S. Tiwari, P. K. Gupta, and B. Karmakar,
“Nanostructuring and Fluorescence Properties of Eu3+:LiTaO3 in Li2O-Ta2O5-SiO2-Al2O3
Glass-Ceramics,” J. Mater. Sci., 44, 4495–4498 (2009).
21D. E. Zelmon, D. L. Small, and R. Page, “Refractive-Index Measurements of Undoped
Yttrium Aluminium Garnet from 0.4 to 5.0 µm,” Appl. Optics, 37, 4933-4935 (1998).
22B. D. Cullity, Elements of X-Ray Diffraction, 2nd Edition, pp. 101-2, Addison-Wesley
Publishing Co., London, 1978.
23A. M. Hofmeister and K. R. Campbell, “Infrared Spectroscopy of Yttrium Aluminum,
Yttrium Gallium, and Yttrium Iron Garnet,” J. Appl. Phys., 72, 638-646 (1992).
24L. M. Seaverson, S. Q. Luo, P. L. Chien, and J. F. McClelland, “Carbonate Associated
with Hydroxide Sol-Gel Processing of Yttria:An Infrared Spectroscopic Study,” J. Am.
Ceram. Soc., 69, 423-429 (1986).
25P. Apte, H. Bruke, and H. Pickup, “Synthesis of Yttrium Aluminum Garnet by Reverse
Strike Precipitation,” J. Mater. Res., 7, 706-711 (1992).
26Q. Lu, W. Dong, H. Wang, and X. Wang, “A Novel Way to Synthesize Yttrium
Aluminum Garnet from Metal–Inorganic Precursors,” J. Am. Ceram. Soc., 85, 490-492
(2002).
27G. Fuxi, Optical and Spectroscopic Properties of Glass, pp. 18-61, Springer-Verlag,
Berlin, 1992.
28W. T. Carnall, P. R. Fields, and K. Rajnak, “Electronic Energy Levels of the Trivalent
Lanthanide Aquo Ions. Eu3+,” J. Chem. Phys., 49, 4450-4455 (1968).
19
29A. Ivankov, J. Seekamp, and W. Bauhofer, “Optical Properties of Eu3+-Doped Zinc
Borate Glasses,” J. Lumin., 121, 123-131 (2006).
30G. H. Beall and D. A. Duke, Glass-Ceramic Technology in Glass Science and
Technology; Vol. 1, p.403, Edited by D. R. Uhlmann and N. J. Kreidl, Academic Press, New
York, 1983.
31G. H. Beall and D. A. Duke, “Transparent Glass-Ceramics,” J. Mater. Sci., 4, 340-352
(1969).
32H. C. Van De Hulst, Light Scattering by Small Particles, Wiley, New York, 1957.
33K. Hirano, Y. Benino and T. Komatsu, “Rare Earth Doping into Optical Nonlinear
Nanocrystalline Phase Transparent TeO2-based Glass-Ceramics”, J. Phys. Chem. Solids, 62,
2075-2082 (2001).
34X. Li, H. Liu, J. Wang, H. Cui, X. Zhang and F. Han, “Preparation of YAG Nano-sized
Powder by Co-precipitation Method”, Mater. Sci. Eng. A, 379, 347-350 (2004).
35S. Georgescu, A. M. Chinie, A. Stefan and O. Toma, “Effects of Thermal Treatment on
the Luminescence of YAG:Eu Nanocrystals Synthesized by a Nitrate-Citrate Sol-Gel
Method”, J. Optoelectron. Adv. Mater., 7, 2985-2990 (2005).
36T. Nakamura, S. Yanagida and Y. Wada, “Preparation of Nano-sized YAG:Eu3+
Particles by a Microwave-Assisted Polyol Process and Their Luminescence Properties”, Res.
Chem. Intermed., 32, 331-339 (2006).
37K. Binnemans and C. Görller-Walrand, “Application of the Eu3+ Ion for Site Symmetry
Determination”, J. Rare. Earth, 14, 173-180 (1996).
38A. D. Sontakke, A. Tarafder, K. Biswas, and K. Annapurna, “Sensitized Red
Luminescence from Bi3+ Co-Doped Eu3+:ZnO-B2O3 Glasses”, Physica B, 404, 3525-3529
(2009).

20
39M. Kusaba, N. Nakashima, Y. Izawa, C. Yamanaka, and W. Kawamura “Two-Photon
Reduction of Eu3+ to Eu2+ via the f′← f Transitions in Methanol,” Chem. Phys. Lett., 221,
407-411 (1994).
40R. S. Meltzer, W. M. Yen, H. Zheng, S. P. Feofilov, and M. J. Dejneka, “Relaxation
between Closely Spaced Electronic Levels of Rare-Earth Ions Doped in Nanocrystals
Embedded in Glass,” Phys. Rev. B, 66, 224202 1-6 (2002).
41Y. Yu, D. Chen, E. Ma, Y. Wang and Z. Hu, “Spectroscopic Properties of Nd3+ Doped
Transparent Oxyfluoride Glass Ceramics”, Spectrochim. Acta Part A, 67, 709-713 (2007).
42R. Reisfeld and C. K. Jørgensen, Lasers and Excited States of Rare Earths, p.98,
Springer-Verlag, Berlin, 1977.
21
Figure Captions
Fig. 1. DTA curve of Eu3+:K2O-SiO2-Y2O3-Al2O3 mother glass powder.
Fig. 2. Dilatometric curve of Eu3+:K2O-SiO2-Y2O3-Al2O3 mother glass.
Fig. 3. (Color online) Photograph of Eu3+: YAG (a) mother glass and (b-e) nano glass-
ceramics (thickness: 2 mm) obtained after heat-treatment for different duration at 7500C laid
over the writing to show their transparency (for details see Table II and Section III (1)).
Fig. 4. Variation of refractive indices (Cauchy fitted) of Eu3+: YAG (a) mother glass and (d)
nano glass-ceramics 30 h heat-treated at 7500C as a function of wavelength.
Fig. 5. XRD patterns of the samples a-e (for details see Table II) and opaque YAG glass-
ceramics obtained after heat-treating the mother glass at 940 and 9800C for 10 h duration.
Fig. 6. Bright field TEM image of nano glass-ceramics (e) and inset shows the SAED pattern
from the dotted encircled region (for details see Table II).
Fig. 7. FESEM images of samples (a) c and (b) e (for details see Table II).
Fig. 8. (A) FT-IRR spectra of the samples a-e (for details see Table II) and (B) variation of
reflectivities at 475 and 690 cm-1 bands as a function of heat-treatment time at 7500C.
Fig. 9. (Color online) Absorption spectra of (a) mother glass and (c-e) nano glass-ceramics
(thickness: 2 mm, for details see Table II).

22
Fig. 10. (Color online) Visible fluorescence spectra (λex = 396 nm) of Eu3+: YAG (a) mother
glass and (b-e) nano glass-ceramics (for details see Table II) obtained after heat-treatment for
various duration (inset: deconvolution of 5D0�7F2 transition of sample e).
Fig.11. (Color online) Excitation spectra of (a) mother glass and (e) nano glass-ceramics (for
details see Table II).
Fig. 12. (Color online) Decay curves for the 5D0�7F2 emission transition of Eu3+ ion at 613
nm under excitation at 396 nm of samples a, c, and e (for details see Table II).
23
Table I. Some Measured and Calculated Properties of Eu3+
Doped Mother Glass
Properties Corresponding value
Average molecular weight, Mav 97.4 Density, ρ (g.cm-3) 3.033 Refractive indices:
nF (at 486.1 nm) nD (at 589.2 nm) nC (at 656.3 nm)
1.6005 1.5930 1.5894
Abbe number (υD) 53 Dispersive power (υD
-1) 0.02 Molar refractivity, RM (cm3) 10.88 Electronic polarizability, α (cm3) 4.31 x 10⁻²⁴ Eu3+ ion concentration, NEu3+ (ions.cm-3) 1.87 x 10²² Crystallization peaks, Tp1 and Tp2 (
0C) 940 and 971 CTE, α, (50-3500C) x 10-7 K-1 111 Glass transition temperature, Tg (
0C) (DTA) 821 Glass transition temperature, Tg (
0C) (Dil.) 819 Dilatometric softening temperature, Td (
0C) 867
Table II. Measured Lifetime, Asymmetric Ratio and FT-IRRS Intensity of Mother
Glass and Nano Glass-Ceramics
FT-IRRSa Intensity (IYAG) Sample
Identity
Heat Treatment Time (h)
Lifetime, τf (ms)
Asymmetric Ratio, IED/IMD 690 cm-1 475 cm-1
a 0 1.224 5.109 14.69 31.82 b 3 1.244 4.895 16.40 33.98 c 10 1.272 4.821 17.68 37.93 d 30 1.317 4.265 16.88 42.18 e 50 1.476 3.593 20.13 47.35
aFT-IRRS, Fourier transformed infrared reflectance spectroscopy.

24
Figures
600 700 800 900 1000 1100-10
-5
0
5
10
15
20
→
Tg = 821
oC
→
→
Tp2
= 971oC
Tp1
= 940oC
→ En
do
.→
Exo
.
Sample weight = 86 mg
Heating rate = 8°C/min
Temperature (oC)
Fig. 1. DTA curve of Eu3+:K2O-SiO2-Y2O3-Al2O3 mother glass powder.
200 400 600 800 1000
0.0
0.2
0.4
0.6
0.8
1.0
1.2 →
→
Td = 867
0
C
Tg = 819
0
C
dL
/L0(%
)
Temperature (oC)
CTE (50-3500C) = 111 x 10
-7K
-1
Fig. 2. Dilatometric curve of Eu3+:K2O-SiO2-Y2O3-Al2O3 mother glass.

25
Fig. 3. (Color online) Photograph of Eu3+: YAG (a) mother glass and (b-e) nano glass-
ceramics (thickness: 2 mm) obtained after heat-treatment for different duration at 7500C laid
over the writing to show their transparency (for details see Table II and Section III (1)).
400 600 800 1000 1200 1400 16001.570
1.575
1.580
1.585
1.590
1.595
1.600
1.605
1.610
d
a
Refr
acti
ve In
dex
Wavelength (nm)
Fig. 4. Variation of refractive indices (Cauchy fitted) of Eu3+: YAG (a) mother glass and (d)
nano glass-ceramics 30 h heat-treated at 7500C as a function of wavelength.
(a) (b) (c) (d) (e)
26
10 20 30 40 50 60 70 80
Y3Al
5O
12 (JCPDS File No. 33-0040)
642532
521
9800C/10h
9400C/10h
KAlSiO4 (JCPDS File No. 33-0989)
400 4
20
edcb
a
Inte
nsit
y (
arb
.un
it)
2θθθθ (degree)
Fig. 5. XRD patterns of the samples a-e (for details see Table II) and opaque YAG glass-
ceramics obtained after heat-treating the mother glass at 940 and 9800C for 10 h duration.
Fig. 6. Bright field TEM image of nano glass-ceramics (e) and inset shows the SAED pattern
from the dotted encircled region (for details see Table II).
(420)

27
Fig. 7. FESEM images of samples (a) c and (b) e (for details see Table II).
0 10 20 30 40 500
10
20
30
40
50
60
(B)
Rela
tive R
efl
ecti
vit
y (
%)
Heat-treatment Time (h)
690 cm-1
475 cm-1
Fig. 8. (A) FT-IRR spectra of the samples a-e (for details see Table II) and (B) variation of
reflectivities at 475 and 690 cm-1 bands as a function of heat-treatment time at 7500C.
100 nm 100 nm
(a) (b)
28
350 400 450 500 550 600
0.1
0.2
0.3
0.4
e
d
c
a
5D
0
5D
2
5D
1 5D
1*
5D
4
5D
3
5L
6*
5L
6
5G
2, 4
Rela
tive A
bso
rban
ce
(ab
so
rban
ce u
nit
)
Wavelength (nm)
Fig. 9. (Color online) Absorption spectra of (a) mother glass and (c-e) nano glass-ceramics
(thickness: 2 mm, for details see Table II).
550 575 600 625 650 675 700 725
610 620 630 640
0.0
5.0x10⁵
1.0x10⁶
1.5x10⁶
2.0x10⁶
Transition:
Sample Identity: e
5D
0→→→→
7F2
Inte
nsit
y (
cps)
Wavelength (nm)
e
d
cba
5D
0→→→→
7F
45D
0→→→→
7F
3
5D
0→→→→
7F
2
5D
0→→ →→
7F
1
5D
0→→ →→
7F
0
λλλλex
= 396 nm
Inte
nsit
y (
arb
. u
nit
)
Wavelength (nm)
Fig. 10. (Color online) Visible fluorescence spectra (λex = 396 nm) of Eu3+: YAG (a) mother
glass and (b-e) nano glass-ceramics (for details see Table II) obtained after heat-treatment for
various duration (inset: deconvolution of 5D0�7F2 transition of sample e).

29
250 300 350 400 450 500 550
0.0
5.0x10⁵
1.0x10⁶
1.5x10⁶
2.0x10⁶
2.5x10⁶
CT
B
Glass-ceramic: eGlass: a
7F
0→→ →→
5D
1
7F1→→ →→
5L
6
7F
1→→ →→
5L7
7F0→→ →→
5H
4
7F
1→→ →→
5F4
7F
1→→ →→
5D
1
7F
0→→→→
5D
2
7F
1→→ →→
5D
3
7F
0→→→→
5L
6
7F
0→→ →→
5D
4
λλλλem
= 613 nm
Inte
nsit
y (
cp
s)
Wavelength (nm)
Fig.11. (Color online) Excitation spectra of (a) mother glass and (e) nano glass-ceramics (for
details see Table II).
0 500 1000 1500 20000
20
40
60
80
100
120
140
160
180
200
ττττ (ms)
a 1.224
c 1.272
e 1.476
Inte
nsit
y (
cp
s)
Lifetime (ms)
Fig. 12. (Color online) Decay curves for the 5D0�
7F2 emission transition of Eu3+ ion at 613
nm under excitation at 396 nm of samples a, c, and e (for details see Table II).


![VISULAS YAG III...000000-1272-175-Inhalt0-GB-060613 Contents User manual VISULAS YAG III [000000 -1272 175 GA GB 060613]Appendix VISULAS YAG III stand-alone operation - Quick instructions](https://img.pdfslide.us/doc/110x75/606e9018c22f4860603c0faf/visulas-yag-iii-000000-1272-175-inhalt0-gb-060613-contents-user-manual-visulas.jpg)