Embed Size (px)
Citation preview

Processing and characterization of Cu-Al2O3 and Al-Al2O3
composites: an evaluation for micro- and nano-
particulate reinforcements
A Thesis submitted in partial fulfilment of the
requirements for the degree of
DOCTOR OF PHILOSOPHY
by
Khushbu Dash
(Roll No: 509mm101)
Department of Metallurgical and Materials Engineering
National Institute of Technology, Rourkela
Rourkela – 769008
INDIA
January 2014

Processing and characterization of Cu-Al2O3 and Al-Al2O3
composites: an evaluation for micro- and nano-
particulate reinforcements
________________________________________________________
January, 2014 Khushbu Dash

Supervisors
_______________________
Prof. Bankim Chandra Ray
Prof. Debasis Chaira

“Dedicated to my parents”

Department of Metallurgical and Materials Engineering,
National Institute of Technology
Rourkela-769008
India
CERTIFICATE
This is to certify that the thesis entitled “Processing and characterization of Cu-Al2O3 and
Al-Al2O3 composites: an evaluation for micro- and nano- particulate reinforcements”
submitted by Khushbu Dash to National Institute of Technology, Rourkela is a record of
bonafide research work under our supervision and is worthy of consideration for the award of
the degree of Doctor of Philosophy of the Institute. The candidate has fulfilled all prescribed
requirements for the thesis, which is based on candidate’s own work and has not been
submitted elsewhere for a degree or diploma.
Prof. Bankim Chandra Ray Prof. Debasis Chaira
Supervisor Co-supervisor

ii
Acknowledgement
The research work for my PhD programme has been carried out in Department of
Metallurgical and Materials Engineering, National Institute of Technology, Rourkela.
My supervisors Prof. Bankim Chandra Ray and Prof. Debasis Chaira have supported me for
my PhD work unconditionally. I am heartily indebted to my supervisors for training me in my
journey to achieve a respectable degree in Metallurgical and Materials Engineering.
Prof. Bankim Chandra Ray has been an inextinguishable fire of inspiration to me from the
days I had not joined his group for doctoral work. My journey with him started as a student-
teacher and progressed day by day converting him as my guiding light in all spheres of life. I
take the liberty to dedicate this section of my thesis to him and thank him from the bottom of
my heart for all that he has given me. I will cherish all the moments of enlightenment he has
shared with me. Undoubtedly, a free thinker and believer, I will always remember him for his
attitude of pushing all limits for his dear students.
I would take the pleasure of thanking all my doctoral scrutiny committee members for
fulfilling their duties of assessing my PhD work without fail.
I am grateful to our director Prof. Sunil Kumar Sarangi to get encouraged and motivated by
a magnanimous personality like him who is a core academician.
I thank all our collaborators Prof. Bikramjit Basu, Indian Institute of Technology, Kanpur,
Prof. Sidhartha Das, Indian Institute of Technology, Kharagpur, Dr Sidhartha Pradhan
Institute of Minerals and Materials Technology, Bhubaneshwar for unconditional help,
prompt attention and effective support to bring this thesis into existence. I also take the
privilege to thank Prof Anindya Basu, National Insitute of Technology, Rourkela for helping
me to conduct wear measurements.
I am also thankful to laboratory members of Department of Metallurgical and Materials
Engineering, NIT Rourkela, especially, R. Pattanaik, S. Pradhan, U. K. Sahu and S.
Hembram for constant practical assistance and help whenever required.

iii
I acknowledge the discussions and work done with my labmates Suvin Sukumaran and Sujata
Panda.
My parents Laxmi Prasad Dash and Swadhini Dash have been a constant source of
inspiration for my perseverance during my PhD tenure. I am thankful to my brother Apurv
Dash to run small errands whenever I needed him.
I am thankful to my beloved husband Nachiketa Mishra to support me in my concluding
months of PhD and being the most precious gift of my life.
All errors and limitations remaining in this thesis are mine alone.
Khushbu Dash
(January 2014)

iv
Abstract
Composites are formed by the physical association of matrix and reinforcement and possess
intermediate properties of the components’ it is constituted of. Metal matrix composites
(MMCs) reinforced with ceramic particles furnishes ductility along with strength and has
been into practice since decades. The applications cater the aerospace and automobile
industries such as turbine rotatory machinery components, rocket turbine housing, cryostat,
cryo-pump impeller and cryo-pump inducer. Powder metallurgy has been a conventional still
inevitable technique to serve the automotive and aerospace industries with components of
utmost importance. The powder metallurgy process consists of several steps which are crucial
to the end products’ properties. This work aims at investigating some of the steps to assess
the microstructure and properties of copper and aluminium based composites varying the
reinforcement particle size and volume fraction. Structural integrity is a vital factor of a
composite which accounts for the physical intimate bonding of matrix and reinforcement.
This factor varies with the fabrication parameters and techniques which are also fundamental
for effective stress transmissibility from matrix to reinforcement. Structural integrity of a
composite material also fluctuates within the service life of the material, for eg. during harsh
and hostile environment thermal exposures.
The preliminary part of the work consists of evaluation of the effect of processing parameters
on the properties of Cu-Al2O3 and Al-Al2O3 composites. The effect of blending and planetary
milling processes (powder mixing techniques) on the distribution, particle size and sintering
response of Cu-Al2O3 and Al-Al2O3 composites were studied. Milling was performed for 2, 5
and 10 hours and blending was performed for 2, 4 and 8 hours followed by investigation of
dispersion, microstructure and particle size analysis as well as mechanical properties of the
composite powders and composites sintered at 900°C (Cu-Al2O3) and 600°C (Al-Al2O3)
temperatures.
The effect of sintering atmosphere on the microstructure and mechanical properties of Cu-
Al2O3 composites have been discussed too. Nitrogen, argon and hydrogen atmospheres were
used for sintering and the comparison in matrix and reinforcement compatibility as well as
study of microstructure and mechanical properties were made. Synthesis of microcomposites
was carried out by reinforcing 5, 10 and 15 volume % of alumina powder particles (average
size~5.71µm) in copper matrix via conventional sintering using N2, H2 and Ar atmospheres.

v
Maximum Vickers hardness of 60, 75 and 80 was obtained when the Cu-15 volume % Al2O3
was conventionally sintered in N2, Ar and H2 atmosphere respectively. It has been observed
that Cu-Al2O3 metal matrix composite shows poor mechanical properties when it is
conventionally sintered in N2 or Ar atmosphere compared to that in H2 atmosphere.
The synthesis, characterization and mechanical properties evaluation of Cu-Al2O3 and
Al-Al2O3 micro- and nano-composites fabricated by conventional and spark plasma sintering
was done to compare the attributes between the traditional and advanced methods of
sintering. Status of the interfacial integrity of Cu-Al2O3 and Al-Al2O3 micro- and nano-
composites with the variation in sintering temperature were investigated.
Nanocomposites of 1, 3, 5 and 7 vol. % Al2O3 (average size<50nm) and microcomposites
having compositions 5, 10, 15, 20 vol. % of Al2O3 (average size~10µm) reinforced in copper
and aluminium matrix were fabricated by powder metallurgy route. All the Cu-Al2O3
specimens were sintered conventionally at different sintering temperatures (850°C, 900°C,
1000°C) whereas all the Al-Al2O3 specimens were sintered conventionally at (500°C, 550°C,
600°C) temperatures to study the effect of temperature on the process and progress of
sinterability of the reinforced micro- and nano-particles in the matrix. These micro- and nano-
composites were characterized using X-ray diffraction and scanning electron microscopy
followed by density, microhardness and wear measurements. The compression and flexural
tests were also carried out in order to investigate the mechanical behaviour of the micro- and
nano-composites for a fixed optimum sintering temperature. Fractography of the 3-point bend
specimens was performed to investigate the fracture behaviour of the micro- and nano-
composites. The flexural test results showed that the ultimate flexural strength decreases and
flexural modulus increases with increase in reinforcement content.
Nanocomposites consisting 0.5, 1, 3, 5, 7 volume % alumina (average size<50nm) and
microcomposites having 1, 5, 20 volume % of alumina (average size~10µm) reinforced in
copper and aluminium matrix were fabricated by spark plasma sintering technique at a
temperature of 700°C (copper) and 500°C (aluminium) respectively and pressure of 50 MPa
for a holding time of 5 minutes. These micro- and nano-composites have been characterized
using X-ray diffraction, scanning electron microscopy and transmission electron microscopy
followed by density, microhardness, nanoindentation hardness and wear measurements.
Spark plasma sintering rendered high densification, higher microhardness and wear resistance

vi
to the composites improving the physical integrity of matrix and reinforcement to an
appreciable extent in comparison to conventional method of sintering. We have obtained
95.82% densification as well as 93.17 HV0.3 and 124 HV0.3 microhardness for spark plasma
sintered Cu-20 vol. % Al2O3 microcomposite and Cu-7 vol. % Al2O3 nanocomposite
respectively. The wear rate is appreciably low i.e. 0.86 x 10⁻⁴
mm3N
-1m
-1 for 20 vol. %
alumina reinforced copper microcomposite. The alumina nanoparticles revealed appreciable
physical intimacy with the aluminum matrix than that of alumina microparticles. The highest
nanohardness recorded 0.85 GPa and 99% densification for 7 and 1 vol. % Al-Al2O3
nancomposites respectively. Spark plasma sintering imparts enhanced densification and
matrix-reinforcement proximity which have been corroborated with the experimental results.
Copper and aluminium based composites find applications in aerospace and automobile
sectors. These applications demand accelerated weathering study on these composites.
Induced thermal stresses in these composites would affect the structural integrity and
mechanical properties. The assessment of these variations would enable us to predict the
behaviour of these composites in harsh and hostile conditions. Flexural test was used to
explore the effect of thermal treatments i.e. high temperature and cryogenic environments on
the mechanical property of Al2O3 particulate reinforced Cu and Al metal matrix micro- and
nano-composites in ex-situ and in-situ conditions. Cu- Al2O3 and Al-Al2O3 reinforced with 5,
10, 15, 20 vol. % Al2O3 micro (10µm)- and 1, 3, 5, 7 vol. % Al2O3 nano (<50 nm)-composites
were fabricated by powder metallurgy route. All the compositions of micro- and nano-
composites were thermally shocked from positive to negative (down thermal shock) and
negative to positive temperature (up thermal shock). Both the micro- and nano-composites
were treated at +40°C temperature for 1 hour followed by -40°C temperature for 1 hour. This
treatment was also done in the reverse order i.e. from -40°C to +40°C. The above stated
thermal shock module was repeated with temperatures (+80°C to -80°C) and (-80°C to
+80°C) with both micro- and nano-composites with 1 hour isothermal holding at each
temperature. For thermal conditioning the micro- and nano-composites were exposed to
+80°C for 1 hour and -80°C for 1 hour separately.
High temperature in-situ 3-point bend test was performed at 100°C and 250°C for the
composites after temperature attainment. All the micro- and nano-composites subjected to
thermal shock, thermal conditionings were tested in flexural mode at a span length of 26 mm
and loading rate of 0.5 mm/min. The micro- and nano-composites were also tested at ambient
temperature to note the difference after the thermal treatments. The fractured samples were
vii
studied under field emission scanning electron microscopy. The improvement in flexural
strength of thermally shocked and conditioned samples have been discussed in the light of
fractography.
The composites’ performance at high loading rate (crosshead velocity) differs considerably
from that of low loading rates. Different loading rates are quite probable in several
applications of metal matrix composites to evaluate their crashworthiness. High impact
loading conditions are withstood at instances such as MMC armours, collision of cars and
impact of foreign objects on aerospace structures. Cu-Al2O3 and Al-Al2O3 micro- and nano-
composites were subjected to 3-point bend test under various loading rates to evaluate the
flexural strength and its variation with volume fraction of alumina. The flexural strength with
respect to crosshead speed of copper and aluminium based composites varies with size and
content of alumina particles.
Keywords: Metal matrix composites; Spark plasma sintering; Scanning electron microscopy;
Field emission scanning electron microscopy; Transmission electron microscopy; Structural
integrity; Mechanical properties; Flexural strength; Thermal conditioning; Thermal shock;
Cryogenic treatment; Loading rate.

viii
Contents
Page No.
Certificate----------------------------------------------------------------------------------------
Acknowledgement------------------------------------------------------------------------------
Abstract------------------------------------------------------------------------------------------
List of figures------------------------------------------------------------------------------------
List of tables-------------------------------------------------------------------------------------
Nomenclature------------------------------------------------------------------------------------
Abbreviations------------------------------------------------------------------------------------
Chapter 1 Introduction
1.1 Literature review---------------------------------------------------------------------
1.1.1 Composite---------------------------------------------------------------
1.1.2 Metal matrix composite-----------------------------------------------
1.1.3 Fabrication routes------------------------------------------------------
1.1.3.1 Powder metallurgy------------------------------------------
1.1.3.2 Blending and milling---------------------------------------
1.1.3.3 Conventional sintering--------------------------------------
1.1.3.4 Spark plasma sintering--------------------------------------
1.1.4 Interface-----------------------------------------------------------------
1.1.5 Characteristic features-------------------------------------------------
1.1.5a Fabrication of copper-alumina composites---------------
1.1.5b Fabrication of aluminium-alumina composites----------
1.1.6 Thermal Loadings------------------------------- ----------------------
1.1.7 Loading rate-------------------------------------------------------------
1.2 Scope of the thesis--------------------------------------------------------------------
References-----------------------------------------------------------------------------
Chapter 2 Experimental details
2.1 Fabrication-----------------------------------------------------------------------------
2.1.1 Blending------------------------------------------------------------------
2.1.2 Milling--------------------------------------------------------------------
2.1.3 Compaction--------------------------------------------------------------
2.1.4 Sintering------------------------------------------------------------------
2.1.4.1 Conventional sintering--------------------------------------
2.1.4.2 Spark plasma sintering--------------------------------------
2.2. Characterization-----------------------------------------------------------------------
2.2.1 Particle size analysis----------------------------------------------------
2.2.2 X-ray diffraction--------------------------------------------------------
2.2.3 Scanning electron microscope-----------------------------------------
2.2.4 Field emission scanning electron microscopy---------------------
2.2.5 Transmission electron microscopy------------------------------------
2.3 Mechanical property study-----------------------------------------------------------
2.3.1 Density measurement --------------------------------------------------
2.3.2 Microhardness study---------------------------------------------------
2.3.3 Nanoindentation hardness---------------------------------------------
2.3.4 Compression test---------------------------------------------------------
2.3.5 Flexural test--------------------------------------------------------------
2.3.6 Wear----------------------------------------------------------------------
2.4 Thermal treatment---------------------------------------------------------------------
2.4.1 Furnace-------------------------------------------------------------------
2.4.2 Ultra-low temperature chamber---------------------------------------
i
ii
iv
xii
xviii
xix
xxi
1-21
3
3
3
4
5
5
6
9
10
11
11
12
13
15
15
16
22-29
22
22
22
23
23
23
23
24
24
24
24
25
25
25
25
25
25
26
26
26
26
26
27

ix
Chapter 3 Results and Discussion
3.1a Effect of milling and blending on the dispersion, microstructure
and properties of Cu-Al2O3 and Al-Al2O3 composites.
3.1a.1 Scope and objectives of the work-----------------------------------------------
3.1a.2 Fabrication of composites--------------------------------------------------------
3.1a.3 Characterization of composites--------------------------------------------------
3.1a.3.1 X-ray diffraction--------------------------------------------------------
3.1a.3.2 Particle size analysis---------------------------------------------------
3.1a.3.3 Scanning electron microscopy----------------------------------------
3.1a.3.3.1 Dispersion---------------------------------------------------
3.1a.3.3.2 Sintering response-----------------------------------------
3.1a.4 Density and microhardness measurements-------------------------------------
3.1a.5 Summary and conclusions--------------------------------------------------------
References--------------------------------------------------------------------------
3.1b Effect of sintering atmosphere on the microstructure and
properties of Cu-Al2O3 composites
3.1b.1 Scope and objectives of the work------------------------------------------------
3.1b.2 Fabrication of microcomposites--------------------------------------------------
3.1b.3 Characterization of the microcomposites---------------------------------------
3.1b.3.1 X-ray diffraction---------------------------------------------------------
3.1b.3.2 Scanning electron microscopy-----------------------------------------
3.1b.4 Density and microhardness measurement---------------------------------------
3.1b.5 Summary and conclusions---------------------------------------------------------
References----------------------------------------------------------------------------
3.2 Evaluation of processing and properties of Cu-Al2O3 and Al-Al2O3
composites by conventional and spark plasma sintering method
3.2.1 Scope and objectives of the work------------------------------------------------
3.2.2 Conventional sintering-------------------------------------------------------------
3.2.2.1 Fabrication of composites----------------------------------------------
3.2.2.1a Copper-alumina composites--------------------------------
3.2.2.1b Aluminium-alumina composite----------------------------
3.2.2.2 Characterization of the composites-----------------------------------
3.2.2.2a Copper-alumina composite---------------------------------
3.2.2.2a.1 X-ray diffraction--------------------------------
3.2.2.2a.2 Scanning electron microscopy ---------------
3.2.2.2b Aluminium-alumina composite----------------------------
3.2.2.2b.1 X-ray diffraction--------------------------------
3.2.2.2b.2 Scanning electron microscopy ----------------
3.2.2.3 Mechanical testing--------------------------------------------------------
3.2.2.3a Copper-alumina composite------------------------------------
3.2.2.3a.1 Density----------------------------------------------
3.2.2.3a.2 Microhardness-------------------------------------
3.2.2.3a.3 Compression test----------------------------------
3.2.2.3a.4 3-point bend test-----------------------------------
3.2.2.3a.5 Fractography---------------------------------------
3.2.2.3a.6 Wear test-------------------------------------------
3.2.2.3b Aluminium-alumina composite------------------------------
3.2.2.3b.1 Density---------------------------------------------
30-163
30-44
30
31
31
31
33
34
34
38
40
43
44
45-52
45
45
45
46
47
49
51
52
53-120
53
54
54
54
55
55
55
55
57
60
60
61
63
64
64
65
68
70
71
73
75
75
77

x
3.2.2.3b.2 Microhardness-------------------------------------
3.2.2.3b.3 Compression test----------------------------------
3.2.2.3b.4 3-point bend test-----------------------------------
3.2.2.3b.5 Fractography---------------------------------------
3.2.2.3b.6 Wear test-------------------------------------------
3.2.3 Spark plasma sintering--------------------------------------------------------------
3.2.3.1 Fabrication of composites---------------------------------------------
3.2.3.1a Copper-alumina composites-------------------------------
3.2.3.1b Aluminium-alumina composites--------------------------
3.2.3.2 Characterization of composites---------------------------------------
3.2.3.2a Copper-alumina composite--------------------------------
3.2.3.2a.1 X-ray diffraction-------------------------------
3.2.3.2a.2 Scanning electron microscopy --------------
3.2.3.2a.3 Transmission electron microscopy ---------
3.2.3.2b Aluminium-alumina composite----------------------------
3.2.3.2b.1 X-ray diffraction-------------------------------
3.2.3.2b.2 Scanning electron microscopy --------------
3.2.3.2b.3 Transmission electron microscopy ---------
3.2.3.3 Mechanical testing----------------------------------------------------
3.2.3.3a Copper-alumina composite-------------------------------
3.2.3.3a.1 Density and microhardness study ----------
3.2.3.3a.2 Wear study------------------------------------
3.2.3.3a.2.1 Wear depth--------------------
3.2.3.3a.2.2 Wear track--------------------
3.2.3.2a.2.3 Wear rate and volume-------
3.2.3.2a.2.4 Wear mechanism-------------
3.2.3.2a.2.5 Wear debris-------------------
3.2.3.3b Aluminium-alumina composite-------------------------
3.2.3.3b.1 Density measurement-----------------------
3.2.3.3b.2 Microhardness and Nanohardness------
measurement
3.2.3.3b.3 Wear study------------------------------------
3.2.4 Summary and conclusions----------------------------------------------------------
References----------------------------------------------------------------------------
3.3 Effect of thermal and cryogenic conditioning on flexural
behaviour of thermally shocked Cu-Al2O3 and Al-Al2O3
micro- and nano-composites
3.3.1 Scope and objectives of the work----------------------------------------------
3.3.2 Fabrication of composites-------------------------------------------------------
3.3.2a Copper-alumina composite-------------------------------------------
3.2.2b Aluminium-alumina composite--------------------------------------
3.3.3 Thermal shock--------------------------------------------------------------------
3.3.3a Copper-alumina composite-------------------------------------------
3.3.3a.1 Transmission electron microscopy------------------------
3.3.3b Aluminium-alumina composite--------------------------------------
3.3.4 Thermal conditioning------------------------------------------------------------
3.3.4a Copper-alumina composite-------------------------------------------
3.3.4b Aluminium-alumina composite--------------------------------------
3.3.5 High temperature in-situ 3-point bend test------------------------------------
3.3.5a Copper-alumina composite-------------------------------------------
3.3.5b Aluminium-alumina composite--------------------------------------
3.3.6 Comparison of mechanical behaviour of differently thermal treated
composites----------------------------------------------------------------
78
80
81
82
84
84
84
84
85
85
85
87
89
91
91
92
95
97
98
98
101
101
102
104
105
107
107
108
110
111
114
115
121-156
121
122
122
122
122
123
132
133
140
140
143
145
145
149
152
154

xi
3.3.7 Summary and conclusions------------------------------------------------------
References-------------------------------------------------------------------------
3.4 An exploratory study on the effect of loading rate on flexural
strength of Cu-Al2O3 and Al-Al2O3 micro- and nano-composites
3.4.1 Scope and objectives of the work-----------------------------------------------
3.4.2 Fabrication of composites-------------------------------------------------------
3.4.2a Copper-alumina composite---------------------------------------------
3.4.2b Aluminium-alumina composite----------------------------------------
3.4.3 Effect of loading rate on the flexural strength of composites---------------
3.4.3a Copper-alumina composite---------------------------------------------
3.4.3b Aluminium-alumina composite----------------------------------------
3.4.4 Summary and conclusions-------------------------------------------------------
References-------------------------------------------------------------------------
Chapter 4 Summary and Conclusions
List of papers based on the thesis
Biography
155
157-163
157
157
157
158
158
158
161
162
162
164-167
168
170

xii
List of Figures
Figure No. Figure Description Page
No.
Chapter 1 Introduction
Fig. 1.1 Schematic diagram of ball and powder collision 6
Fig. 1.2 Diffusion paths during sintering 7
Fig. 1.3 Schematic diagram of SPS process 9
Chapter 2 Experimental Details
Fig. 2.1 XRD patterns of as received alumina micropowder and
nanopowder 27
Fig. 2.2 SEM micrographs of as received alumina micropowder and
nanopowder 27
Chapter 3.1a Effect of milling and blending on the dispersion, microstructure and
properties of Cu-Al2O3 and Al-Al2O3 composites
Fig. 3.1a.1 X-ray diffraction patterns of Cu-5 vol. % Al2O3 micro-
composite powders after 2, 5, 10 hours of milling 32
Fig. 3.1a.2 X-ray diffraction patterns of Al-5 vol. % Al2O3 microcomposite
powders after 2, 5, 10 hours of milling 32
Fig. 3.1a.3 Particle size distribution of Cu-5 vol. % Al2O3 microcomposite
powders milled for different time periods 33
Fig. 3.1a.4 Particle size distribution of Al-5 vol. % Al2O3 microcomposite
powders milled for different time periods 34
Fig. 3.1a.5 SEM micrographs of Cu-5 vol. % Al2O3 microcomposite
powders after 2,5,10 hours of milling 35
Fig. 3.1a.6 SEM micrographs of Al-5 vol. % Al2O3 microcomposite
powders after 2,5,10 hours of milling 36
Fig. 3.1a.7 SEM micrographs of Cu-5 vol. % Al2O3 microcomposite
powders after 2 and 8 hours of blending 36
Fig. 3.1a.8 SEM micrographs of Cu-5 vol. % Al2O3 nanocomposite powders
after 2 and 8 hours of blending 37
Fig. 3.1a.9 SEM micrographs of Al-5 vol. % Al2O3 nanocomposite powders
after 2 and 8 hours of blending 37
Fig. 3.1a.10 SEM micrographs of Al-5 vol. % Al2O3 microcomposite
powders after 2 and 8 hours of blending 38
Fig. 3.1a.11
SEM micrographs of Cu-5 vol. % Al2O3 microcomposite
powders after 2,5,10 hours of milling and 8 hours of blending
followed by sintering at 900°C temperature
39
Fig. 3.1a.12
SEM micrographs of Al-5 vol. % Al2O3 microcomposite
powders after 2,5,10 hours of milling and 8 hours of blending
followed by sintering at 600°C temperature
40
Fig. 3.1a.13 Density of Cu-5 vol. % Al2O3 composites sintered at 900°C
composites after milling 41
Fig. 3.1a.14 Density of Al-5 vol. % Al2O3 composites sintered at 600°C
composites after milling 41

xiii
Fig. 3.1a.15 Microhardness of Cu-5 vol. % Al2O3 composites sintered at
900°C after milling 42
Fig. 3.1a.16 Microhardness of Al-5 vol. % Al2O3 composites sintered at
600°C after milling 43
Chapter 3.1b Effect of sintering atmosphere on the microstructure and properties of
Cu-Al2O3 composites
Fig. 3.1b.1
XRD diffraction patterns of Cu-15 vol. % Al2O3 micro-
composites sintered conventionally in nitrogen and hydrogen
atmosphere
46
Fig. 3.1b.2 SEM micrographs and EDS analysis of Cu-15 vol. % Al2O3
sintered in nitrogen atmosphere 47
Fig. 3.1b.3 SEM micrographs and EDS analysis of Cu-15 vol. % Al2O3
sintered in hydrogen atmosphere 48
Fig. 3.1b.4 SEM micrographs and EDS analysis of Cu-15 vol. % Al2O3
sintered in argon atmosphere 49
Fig. 3.1b.5
Densification of Cu-Al2O3 microcomposites fabricated using
nitrogen, hydrogen and argon sintering atmospheres by
conventional sintering
50
Fig. 3.1b.6
Comparison of hardness of Cu-Al2O3 microcomposites
fabricated using nitrogen, hydrogen and argon sintering
atmospheres by conventional sintering
51
Chapter 3.2 Evaluation of processing and properties of Cu-Al2O3 and Al-Al2O3
composites by conventional and spark plasma sintering method
Fig. 3.2.1 X-ray diffraction patterns of Cu–20 vol. % Al2O3
microcomposites sintered at 850°C, 900°C, 1000°C 56
Fig. 3.2.2 X-ray diffraction patterns of Cu–7 vol. % Al2O3 nano-
composites sintered at 850°C, and 900° C
57
Fig. 3.2.3
SEM micrographs of Cu–10 vol. % Al2O3 microcomposites
sintered at temperature (a) 850°C, (b) 900°C and (c) 1000°C (d)
Cu-15 vol. % Al2O3 microcomposites sintered at 900°C
temperature
58
Fig. 3.2.4 SEM micrographs of Cu–10 vol. % Al2O3 microcomposites
sintered at temperature 1000°C 59
Fig. 3.2.5
FESEM micrographs of Cu–3 vol. % Al2O3 nanocomposites
sintered at 1000°C temperature at (a) 100000X and (b) 200000X
magnifications
59
Fig. 3.2.6 X-ray diffraction patterns of Al-Al2O3 microcomposites sintered
at 600°C temperature 60
Fig. 3.2.7
X-ray diffraction patterns of Al-Al2O3 nanocomposites sintered
at 600°C temperature
61
Fig. 3.2.8
FESEM micrographs of Al–5 vol. % Al2O3 microcomposite
sintered at temperature 600°C captured at (a) 5000X and (b)
30000X magnification
62
Fig. 3.2.9
FESEM micrographs of Al–5 vol. % Al2O3 nanocomposites
sintered at temperature 600°C captured at (a) 5000X and (b)
100000X magnification
62

xiv
Fig. 3.2.10 Compression strength of Cu-Al2O3 microcomposites sintered at
900°C 69
Fig. 3.2.11 Compression strength of Cu-Al2O3 nanocomposites sintered at
900°C 69
Fig. 3.2.12 Plot for ultimate flexural stress (MPa) vs. vol. % of
reinforcement content for Cu-Al2O3 microcomposites 70
Fig. 3.2.13 Plot for ultimate flexural stress (MPa) vs. vol. % of
reinforcement content for Cu-Al2O3 nanocomposites 71
Fig. 3.2.14 Fractographs of Cu-5 vol. % Al2O3 (a) microcomposites (b)
nanocomposites sintered at 900°C 72
Fig. 3.2.15 Fractograph of Cu-10 vol. % Al2O3 microcomposites sintered at
900°C 72
Fig. 3.2.16 Plot for wear depth vs. time of Cu-Al2O3 microcomposites with
different vol. % of Al2O3 sintered at 900°C temperature 73
Fig. 3.2.17 Plot for wear depth vs. time of nanocomposites with different
vol. % of Al2O3 sintered at 900°C temperature 74
Fig. 3.2.18
SEM images of worn-out surfaces of (a) Cu-5 vol. % Al2O3
(microcomposite) (b) Cu-10 vol. % Al2O3 (microcomposite) (c)
Cu-1 vol. % Al2O3 (nanocomposite)
75
Fig. 3.2.19 Densification plots of Al-Al2O3 microcomposites sintered at
different temperatures 76
Fig. 3.2.20 Densification plots of Al-Al2O3 nanocomposites sintered at
different temperatures 76
Fig. 3.2.21 Microhardness plots of Al-Al2O3 microcomposites sintered at
different temperatures 77
Fig. 3.2.22 Microhardness plots of Al-Al2O3 nanocomposites sintered at
different temperatures 78
Fig. 3.2.23 Compressive strength of Al-Al2O3 microcomposites sintered at
600°C 79
Fig. 3.2.24 Compressive strength of Al-Al2O3 nanocomposites sintered at
600°C 79
Fig. 3.2.25 Plot of flexural strength vs. vol. % of reinforcement of Al-Al2O3
microcomposites sintered at 600°C 80
Fig. 3.2.26 Plot of flexural strength vs. vol. % of reinforcement of Al-Al2O3
nanocomposites sintered at 600°C 81
Fig. 3.2.27 SEM fractographs of Al-5 vol. % Al2O3 (a) microcomposite (b)
nanocomposite sintered at 600°C 82
Fig. 3.2.28 Wear depth vs time plot of Al-Al2O3 microcomposites sintered at
600°C 83
Fig. 3.2.29
Wear depth vs time plot of Al-Al2O3 nanocomposites sintered
at 600°C
83
Fig. 3.2.30 XRD pattern of Cu-7 vol. % Al2O3 nanocomposite sintered by
SPS 86
Fig. 3.2.31 XRD pattern of Cu-20 vol. % Al2O3 microcomposite sintered by
SPS 87
Fig. 3.2.32
SEM micrograph of Cu-7 vol. % Al2O3 nanocomposite sintered
by SPS
87

xv
Fig. 3.2.33 SEM micrograph of Cu-5 vol. % Al2O3 microcomposite sintered
by SPS 88
Fig. 3.2.34 TEM micrograph of Cu-5 vol. % Al2O3 nanocomposite sintered
by SPS 89
Fig. 3.2.35
TEM micrograph of Cu-5 vol. % Al2O3 microcomposite sintered
by SPS
90
Fig. 3.2.36 XRD patterns of Al-Al2O3 microcomposites sintered using SPS 91
Fig. 3.2.37 XRD patterns of Al-Al2O3 nanocomposites sintered using SPS 92
Fig. 3.2.38
SEM micrographs of (a) Al-5vol. % Al2O3 nanocomposite, (b)
Al-7vol. % Al2O3 nanocomposite, (c) Al-5vol. % Al2O3 micro
composite sintered using SPS
93
Fig. 3.2.39
TEM micrographs of (a) Al-1vol. % Al2O3, (b) Al-5vol. % Al2O3
nanocomposites sintered by SPS
95
Fig. 3.2.40 TEM micrograph of (a) Al-7vol. % Al2O3 nanocomposite, (b)
Al-5vol. % Al2O3 microcomposite sintered by SPS 96
Fig. 3.2.41 TEM micrograph of (a) Al-7vol. % Al2O3 nanocomposite, (b)
Al-5vol. % Al2O3 microcomposite sintered by SPS 97
Fig. 3.2.42
Plot for nanohardness of Cu-Al2O3 nanocomposites and
microhardness of Cu-Al2O3 microcomposites
99
Fig. 3.2.43 Elastic modulus of Cu-Al2O3 nanocomposites fabricated by SPS 100
Fig. 3.2.44 Wear depth vs. time plot for Cu-Al2O3 nanocomposites sintered
by SPS 101
Fig. 3.2.45 Wear depth vs. time plot for Cu-Al2O3 microcomposites sintered
by SPS 102
Fig. 3.2.46
SEM micrographs of the worn surfaces showing wear track of (a)
Cu-1 vol. % Al2O3 and (b) Cu-5 vol. % Al2O3 nanocomposite,
(c) Cu-5 vol. % Al2O3 and (d) Cu-20 vol. % Al2O3
microcomposite
103
Fig. 3.2.47(a) Wear rate vs. volume % of alumina of the Cu-Al2O3 composites 104
Fig. 3.2.47(b) Wear volume vs. volume % of alumina of the Cu-Al2O3
composites 105
Fig. 3.2.48
SEM micrographs of worn surfaces of (a) Cu-5 vol. % Al2O3
nanocomposite, (b) Cu-5 vol. % Al2O3 microcomposite, (c) Cu 1
vol. % Al2O3 nanocomposite, (d) Cu-5 vol. % Al2O3
nanocomposite
106
Fig. 3.2.49
SEM micrographs of worn surfaces of Cu-7 vol. % Al2O3 nano-
composite and Cu-20 vol. % Al2O3 microcomposite along with
EDS analysis
106
Fig. 3.2.50
SEM micrograph of the worn surfaces showing wear debris of
Cu-5 vol. % Al2O3 microcomposite and EDS of the whole
micrograph
107
Fig. 3.2.51 SEM micrograph of worn surfaces of Cu-5 vol. % Al2O3
nanocomposite and EDS of the whole micrograph 108
Fig. 3.2.52
Wear depth vs time profile for Al-Al2O3 microcomposites
fabricated by spark plasma sintering
111
xvi
Fig. 3.2.53 Wear depth vs time profile for Al-Al2O3 nanocomposites
fabricated by spark plasma sintering 112
Fig. 3.2.54
SEM micrographs of worn out surface of (a) Al-20 vol. %Al2O3
microcomposite and (b) Al-5 vol.% Al2O3 nanocomposites
fabricated by spark plasma sintering
113
Fig. 3.2.55
SEM micrographs of worn out surface of (a) Al-1 vol. % Al2O3
microcomposite and (b) Al-1 vol.% Al2O3 nanocomposites
fabricated by spark plasma sintering
113
Chapter 3.3 Effect of thermal and cryogenic conditioning on flexural behaviour of
thermally shocked Cu-Al2O3 and Al-Al2O3 micro- and nanocomposites
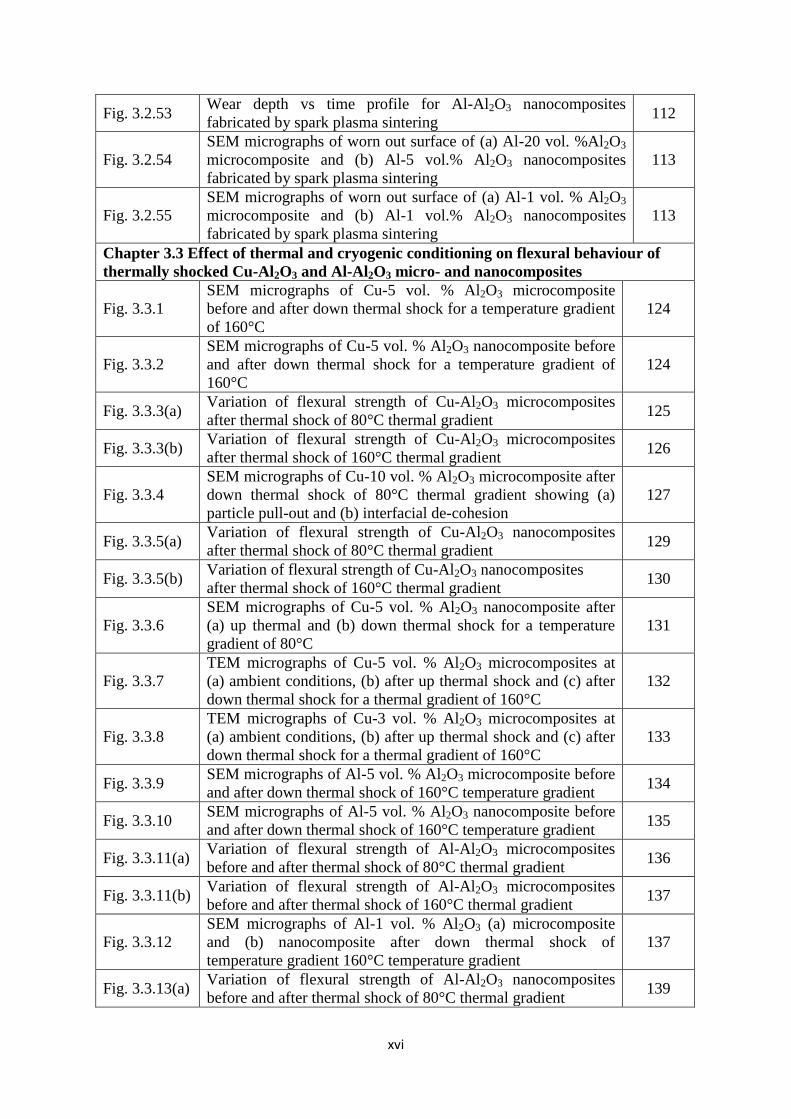
Fig. 3.3.1
SEM micrographs of Cu-5 vol. % Al2O3 microcomposite
before and after down thermal shock for a temperature gradient
of 160°C
124
Fig. 3.3.2
SEM micrographs of Cu-5 vol. % Al2O3 nanocomposite before
and after down thermal shock for a temperature gradient of
160°C
124
Fig. 3.3.3(a) Variation of flexural strength of Cu-Al2O3 microcomposites
after thermal shock of 80°C thermal gradient 125
Fig. 3.3.3(b) Variation of flexural strength of Cu-Al2O3 microcomposites
after thermal shock of 160°C thermal gradient 126
Fig. 3.3.4
SEM micrographs of Cu-10 vol. % Al2O3 microcomposite after
down thermal shock of 80°C thermal gradient showing (a)
particle pull-out and (b) interfacial de-cohesion
127
Fig. 3.3.5(a) Variation of flexural strength of Cu-Al2O3 nanocomposites
after thermal shock of 80°C thermal gradient 129
Fig. 3.3.5(b) Variation of flexural strength of Cu-Al2O3 nanocomposites
after thermal shock of 160°C thermal gradient 130
Fig. 3.3.6
SEM micrographs of Cu-5 vol. % Al2O3 nanocomposite after
(a) up thermal and (b) down thermal shock for a temperature
gradient of 80°C
131
Fig. 3.3.7
TEM micrographs of Cu-5 vol. % Al2O3 microcomposites at
(a) ambient conditions, (b) after up thermal shock and (c) after
down thermal shock for a thermal gradient of 160°C
132
Fig. 3.3.8
TEM micrographs of Cu-3 vol. % Al2O3 microcomposites at
(a) ambient conditions, (b) after up thermal shock and (c) after
down thermal shock for a thermal gradient of 160°C
133
Fig. 3.3.9 SEM micrographs of Al-5 vol. % Al2O3 microcomposite before
and after down thermal shock of 160°C temperature gradient 134
Fig. 3.3.10 SEM micrographs of Al-5 vol. % Al2O3 nanocomposite before
and after down thermal shock of 160°C temperature gradient 135
Fig. 3.3.11(a) Variation of flexural strength of Al-Al2O3 microcomposites
before and after thermal shock of 80°C thermal gradient 136
Fig. 3.3.11(b) Variation of flexural strength of Al-Al2O3 microcomposites
before and after thermal shock of 160°C thermal gradient 137
Fig. 3.3.12
SEM micrographs of Al-1 vol. % Al2O3 (a) microcomposite
and (b) nanocomposite after down thermal shock of
temperature gradient 160°C temperature gradient
137
Fig. 3.3.13(a) Variation of flexural strength of Al-Al2O3 nanocomposites
before and after thermal shock of 80°C thermal gradient 139

xvii
Fig. 3.3.13(b) Variation of flexural strength of Al-Al2O3 nanocomposites
before and after thermal shock of 160°C thermal gradient 139
Fig. 3.3.14 Flexural strength of Cu-Al2O3 microcomposites after thermal
conditioning 141
Fig. 3.3.15 SEM micrographs of Cu-10 vol. % Al2O3 (a) & (b)
microcomposite after thermal conditioning at +80°C 141
Fig. 3.3.16 Flexural strength of Cu-Al2O3 nanocomposites after thermal
conditioning 142
Fig. 3.3.17 Flexural strength of Al-Al2O3 microcomposite after thermal
conditionings 143
Fig. 3.3.18 Flexural strength of Al-Al2O3 nanocomposites after thermal
conditionings 144
Fig. 3.3.19 SEM micrographs of Al-1 vol. % Al2O3 (a) & (b)
nanocomposite thermal conditioned at -80°C 145
Fig. 3.3.20 High temperature flexural strength of Cu-Al2O3 micro-
composites 146
Fig. 3.3.21 High temperature flexural strength of Cu-Al2O3 nano-
composites 148
Fig. 3.3.22 SEM micrograph of Cu-5 vol. % Al2O3 nanocomposite after
high temperature flexural test at 250°C 149
Fig. 3.3.23 High temperature flexural strength of Al-Al2O3
microcomposites 150
Fig. 3.3.24
High temperature flexural strength of Al-Al2O3
nanocomposites
151
Fig. 3.3.25
SEM micrographs of Al-5 vol. % Al2O3 nanocomposite after
high temperature flexural test at (a) 100°C and (b) 250°C
151
Chapter 3.4 An exploration on the effect of loading rate on flexural strength of Cu-
Al2O3 and Al-Al2O3 micro- and nanocomposites
Fig. 3.4.1 Variation in flexural strength of Cu-Al2O3 microcomposites at
different loading rates 159
Fig. 3.4.2 Variation in flexural strength of Cu-Al2O3 nanocomposites at
different loading rates 160
Fig. 3.4.3 Variation in flexural strength of Al-Al2O3 microcomposites at
different loading rates 161
Fig. 3.4.4 Variation in flexural strength of Al-Al2O3 nanocomposites at
different loading rates 162

xviii
List of Tables
Table
No. Description
Page
No.
Table 2.1
The compositions of micro- and nano-composite used for copper
and aluminium matrix and their corresponding sintering
temperatures
24
Table 2.2
Schematic diagram explaining the experimental process for thermal
shock experiments 28
Table 2.3
Schematic diagram explaining the experimental process for thermal
conditioning experiments 29
Table 3.2.1
Theoretical and sintered density values of Cu-Al2O3 micro- and
nano-composites processed at different sintering temperatures 65
Table 3.2.2
Mean hardness and standard deviation of copper-alumina nano- and
micro-composites 67
Table 3.2.3
Microhardness, sintered and theoretical density of Cu-Al2O3 micro-
and nano-composites with varying alumina content 99
Table 3.2.4
% of theoretical density, microhardness and nanoindentation
hardness values of Al-Al2O3 micro- and nano-composites 109

xix
Nomenclature
Dispersion/Orowan strengthening
Strain rate
Shear modulus of the matrix
Strengthening coefficient
Engineering/ Conventional strain rate
Peierls stress
Grain boundary strengthening
∆σthermal Strengthening resulting from the residual plastic strain due to thermal
mismatch
Difference between the processing and test temperatures
Difference in coefficient of thermal expansion between matrix and particles
b Burgers vector
d Grain size
dp Particle diameter
ɛ Thermal strain
f Fractional volume of reinforcement
G Final average grain size (chapter 1)
G Shear modulus of material (chapter 3.2)
G0 Initial average grain size
k a constant (chapter 1)
K a factor given by K = K0 * exp( − Q / RT) (chapter 1)
K0 Material dependent factor
L Length after time‘t’
L0 Original length
m A factor between 2 and 4
Me Matrix

xx
MOn Reinforcing oxide
Q Molar activation energy
r Particle radius
R Ideal gas constant
T Absolute temperature
t Time
Vp Particle volume fraction
Wa Work of adhesion
ΔGO
r Gibbs free energy change
δT Range of temperature experienced during processing
δα Difference between the thermal expansion coefficient of the reinforcement
and the matrix
λ Distance apart from the reinforcements (chapter 3.2)
λ Interparticle distance (chapter 1)
λ wavelength of CuKα radiation (chapter 2)
ν crosshead velocity
ρG Dislocation density in the reinforcement matrix interface (chapter 3.2)
τo Stress required for a dislocation to pass reinforcement
Dislocation density (chapter 1)
xxi
Abbreviations
ASTM American Society for Testing of Materials
at. % Atomic percent
BSE Back Scattered Electron
CTE Coefficient of thermal expansion
Cu (ss) Solid solution of copper
EDAX Energy Dispersive X-ray Analysis
EDS Energy Dispersive Spectrometry
FCC Face Centered Cubic
FESEM Field Emission Scanning Electron Microscopy
HIP Hot Isostatic Pressing
HV Vickers Pyramid Number
ITER International Thermonuclear Experimental Reactor
MMC Metal Matrix Composite
P/M Powder Metallurgy
PCA Process Control Agent
PSR Particle Size Ratio
SE Secondary Electron
SEM Scanning Electron Microscopy
SPS Spark Plasma Sintering
TEM Transmission Electron Microscopy
vol. % Volume percent
wt. % Weight percent
XRD X-Ray Diffraction

xxii

1
Chapter 1
Introduction
The central theme of the thesis revolves around the comparison of the microstructural and
mechanical aspects in conventional microcomposites and advanced nanocomposites. Here, by
micro- and nano-composites we refer to the variation in the reinforcement particle size,
keeping the matrix particle size constant i.e. in micrometer scale. The applications of MMCs
include catering the aerospace, automobile and military industries. The crucial parameters
influencing the properties of a particle reinforced composites are size, shape, concentration
and spatial distribution of the reinforcement, the concentration of impurities present in the
constituent’s phase of composites, thermal and chemical exposure environment and particular
reinforcement size matrix alloy combination. The dominance of nanocomposites over
microcomposites on micro as well as macro attributes has led to the comparative discussion
of both. The nanoparticles in a metal matrix furnish intimate mixing with the matrix as well
as higher degree of dispersion strengthening, except for clustering of nanoparticles at certain
instances. The clustering of nanoparticles takes place in compositions with higher
nanoparticle content.
The consolidation of metal matrix composites by conventional methods has been done since
decades. The new era of materials include nanocomposites which cannot be consolidated
effectively by conventional means. The advanced techniques of consolidation include hot

Chapter 1 Introduction
2
pressing, hot isostatic pressing and spark plasma sintering. These advanced techniques render
microstructural evolution, elevated mechanical properties as well as varied structural integrity
of matrix and reinforcement. The microstructural as well as mechanical attributes of a
composite depend on several factors, out of which the reinforcement particle size is a vital
one.
The variation in reinforcement particle size alters the overall chemistry and character of
interface, microstructure and mechanical performance of the composite. The study of effect
of fabrication parameters such as mixing of powders, sintering atmosphere and techniques
has been done in detail. The synthesis and characterization of copper-alumina as well as
aluminium-alumina micro- and nano-composites by conventional and spark plasma sintering
techniques has been performed extensively. The comparison of microstructure, structural
integrity, mechanical properties in conventionally fabricated and spark plasma sintered
composites has been done. Copper and aluminium are metals with low hardness, so addition
of alumina renders hardness to the metals as well inertness at high temperature. These
systems of composites possess hardness and strength higher than monolithic metals. This
dichotomy of strength and ductility offers applications in ample fields of engineering and
technology.
The composites possess thermal residual stress by virtue of its processing parameters, and
differential co-efficient of thermal expansion of matrix and reinforcement entities. The high,
low as well as ultra low temperature applications of metal matrix composites have led to the
study of their structural integrity and mechanical behaviour by inducing thermal stresses by
different methods and modules. The advancement of science and technology has been rapidly
demanding newer materials which can endure extreme weathering exposures and excursion.
This may necessitate the design of experimental process and procedures to generate data and
findings which would lead to the prediction of reliability of mechanical performance of
material behaviour in unpredictably harsh and hostile environments. The response of
mechanical behaviour and structural integrity to induced thermal stress of copper-alumina
and aluminium-alumina micro- and nano-composites has been discussed in this thesis.
Metal matrix composites respond differently to high strain rate loading conditions as
compared to monotonic or quasistatic loading. The high and low strain rate sensitivity of
composites for a wide range of applications, necessitate the study of variation of loading rate

Chapter 1 Introduction
3
on the composites. The loading rate sensitivity of copper and aluminium based micro- and
nano-composites have been elaborated comprehensively.
1.1 Literature Review
1.1.1 Composite
Composite is a multiphase material which consists of a matrix and one or many
reinforcements. The matrix material could be polymer, metal or ceramic in nature. The nature
of reinforcements varies over a wide range depending upon the desired quality and properties
of the composite. The composites possess properties intermediate of that of matrix and
reinforcement. Selection of nature of matrix and reinforcement as well as content of
reinforcement is decisive of the tailoring of the composite for desired attributes. Out of the
three kinds of matrices, in this thesis metal matrix composites embedded with ceramic
particulates have been investigated.
1.1.2 Metal matrix composite
Metal matrix composites (MMCs) are excellent candidates for structural components in the
aerospace and automotive industries due to their high specific modulus, strength, and thermal
stability. Metal matrix composites (MMCs) combine both metallic properties (ductility and
toughness) with ceramic properties (high strength and modulus) and possess greater strength
in shear and compression and high service temperature capabilities. Nanocomposites are
gaining tremendous popularity in the material industry for replacing the monoliths. On the
other hand microcomposites have already been put into practice long back. The comparison
of microstructural and mechanical attributes of nanocomposites and microcomposites is a
burning area of research. The extensive use of MMCs in aerospace, automotive industries and
in structural applications has increased over past 20 years due to the availability of
inexpensive reinforcements and cost effective processing routes which give rise to
reproducible properties [1]. The driving phenomena for generation of dislocations in MMCs
are misfit strain, thermal misfit, allotropic misfit, lattice parameter misfit and elastic
inhomogenity misfit [2]. In case of solid solution strengthening the dislocation motion gets
impinged principally by elastic interaction between the dislocation and solute atoms as well
as by alteration of the energy of stacking fault [3]. The physical and mechanical superiority of
nano-structured materials has fascinated scientists in recent times [4]. The strengthening due

Chapter 1 Introduction
4
to grain refinement can be delegated to a number of theories such as the Hall-Petch relation,
Orowan bowing mechanism, Taylor relationship and several other models [5].
Strengthening resulting from the grain size known as grain boundary strengthening can
be represented as:
(1)
with σ0 the Peierls stress, KHP strengthening coefficient constant, and d the grain size
expressed in m.
Strengthening resulting from oxide particle reinforcement, known as dispersion
strengthening, can be shown as:
(2)
with Gm the shear modulus of the matrix, b the Burgers vector , r the particle radius, and λ the
interparticle distance given by
(3)
with dp the particle diameter, and Vp the volume fraction particles.
Strengthening resulting from the residual plastic strain due to the thermal mismatch between
particles and matrix during post-processing cooling, can be represented as:
(4)
with k a constant, and ρ the dislocation density induced by plastic strain due to a thermal
mismatch. This ρ is given by:
(5)
with the difference in the coefficient of thermal expansion between the matrix and the
particles, b the burgers vector, and the difference between the processing and the test
temperatures [6-10].
1.1.3 Fabrication routes
There exists a wide spectrum of routes of fabrication of metal matrix composites i.e. solid
state routes, liquid state routes and gaseous state routes. Solid state routes include diffusion

Chapter 1 Introduction
5
bonding, in-situ fabrication, powder metallurgy, sintering, hot pressing and hot isostatic
pressing. Liquid state routes consist of gas pressure infiltration, squeeze casting infiltration
and pressure die infiltration.
1.1.3.1 Powder metallurgy
Powder metallurgy method fabricates complex components economically. Powder metallurgy
promotes synthesis of prealloyed powders below melting temperature. The powder
metallurgy route in case of oxide reinforcements has an added advantage as they follow the
energy efficient method [11]. The greatest threat in this fabrication route is the absence of an
integrated interface formation as the metal powders are less reactive in solid state [12].
Powder metallurgy route is one of the versatile routes for fabrication of MMCs because of
less probability of particle segregation, undesirable brittle phase formation, free from cast
defects, consistent distribution of reinforcement and superior mechanical properties [13-15].
Advantages of P/M route over casting comprises of eliminating segregation and defects
associated with casting.
1.1.3.2 Blending and milling
Blending is the mixing of powders using a blender which works on the principle of tumbling,
shaking or planetary action of movement. Blenders can be of several types such as double
cone blender, turbula shaker mixer and V-mixer. Blending method involves only intermixing
of powders.
Mechanical milling is a solid-state powder processing technique that involves repeated cold
welding, fracturing, and re-welding of powder particles in a high-energy ball mill. In this
process, the blended elemental powder mixture is loaded into the vials along with the
grinding media, and the whole mass is agitated at a high speed for a definite period of time.
Process control agent (PCA) (also referred to as lubricant or surfactant) is occasionally added,
especially when ductile materials are being milled, to minimize the effect of cold welding and
consequent formation of large lumps of powder.

Chapter 1 Introduction
6
Fig. 1.1 Schematic diagram of ball and powder collision [11].
Milling uses balls for mixing as well as reducing the particle size of powders. Milling
includes grinding of powders in specially designed vials in presence of balls with a process
control agent. The powders are subjected to milling and milling parameters are decided
keeping in concern the final size of powders required, nature of powders and content of
powders. Fig. 1.1 illustrates the schematic diagram during ball and powder particles collision
describing the mechanism of particle size reduction and fragmentation. Milling of powders is
dependent on several factors: type of mill, mill speed, milling time, size distribution of the
grinding medium, ball to powder weight ratio, milling atmosphere and process control agent.
1.1.3.3 Conventional sintering
The technique of consolidation without melting is a boon to the world of materials which is
possible by thermal activation of mass transport processes [16]. The driving force for the
former being reduction of surface and grain boundary energies, high sintering temperature is
a desirable facet for formidable strength [17]. The consolidation of matrix and reinforcement
powders is successful when the interfacial bonding along with the uniform distribution and
other factors promote good mechanical properties. Sintering is a thermally activated diffusion
of atoms to form desirable shapes. Thermodynamically sintering is driven by surface area
reduction. Smaller particles sinter faster than large particles, and high temperature accelerates

Chapter 1 Introduction
7
the process of sintering [18]. Sintering is consolidation of compacted powders compacted
into required shapes. Sintering comprises of three stages; initial stage being neck growth
between contact particles, intermediate stage corresponding to pore rounding and onset of
grain growth and finally the pores collapse into closed spheres impeding the grain growth.
Initial Stage: Transport from high energy convex particle surfaces to concave surfaces
forming necks. Fusing increases surface area, pore volume and density remains almost
constant (4-5% shrinkage, relative density 0.5-0.6).
Intermediate Stage: Interparticle neck growth takes place increasing the grain boundary area.
Interparticle grain boundary flattens, pore diameter decreases (5-20% shrinkage, relative
density upto 0.95).
Final Stage: Isolated pores may remain at triple points or inside grain matrix. These pores
may be gradually eliminated. (relative density >0.95).
Fig. 1.2 reveals the play of different sintering mechanisms in the sintering process of green
compacts.
Sintering mechanisms
1. Evaporation-condensation (higher vapour pressure over a convex surface compared to
concave).
2. Diffusion (differences in vacancy concentration) (a) surface diffusion, (b) grain
boundary diffusion, (c) volume diffusion.
3. Flow (pressure induced).
4. Dissolution-precipitation (liquid phase wetting the surface).
Fig.1.2 Diffusion paths during sintering. The numbers correspond to the numbers in
the above paragraph [11].

Chapter 1 Introduction
8
Aftermath of sintering
An aggregate of fine grained crystal size increases in average grain size when heated at
elevated temperatures. As the average grain size increases it is obvious that some grains must
shrink and disappear. An equivalent way of looking at the grain growth is as the rate of
disappearance of grains. Then the driving force for the process is the difference in energy
between the fine grained material and the larger grain size product resulting from the
decrease in grain boundary area and total boundary energy. This energy change corresponds
to about 0.1-0.5 cal/g for the change from a 1 micron to 1 cm grain size.
Grain growth happens due to motion of atoms across a grain boundary. Convex surfaces have
a higher chemical potential than concave surfaces, therefore grain boundaries will move
towards their center of curvature. As smaller particles tend to have a higher radius of
curvature this leads to smaller grains losing atoms to larger grains and shrinking. This is a
process called Oswald ripening. Large grains grow at the expense of small grains. Grain
growth in a simple model is found to follow:
(6)
Where G is final average grain size, G0 is the initial average grain size, t is time, m is a factor
between 2 and 4, and K is a factor given by:
K = K0 * exp( − Q / RT) (7)
Where Q is the molar activation energy, R is the ideal gas constant, T is absolute temperature,
and K0 is a material dependent factor.
The conventional method of sintering renders coarse microstructure, poor adhesion and
density, low strength and hardness at high temperatures. There is a need of advanced
sintering techniques to obtain finer microstructures.

Chapter 1 Introduction
9
1.1.3.4 Spark plasma sintering
The spark plasma sintering technique is becoming popular due to the intrinsic advantages of
the method and the enhanced material properties, as well as lower processing temperature and
shorter sintering time to consolidate powders compared to conventional methods. The
differences between SPS and conventional methods include process efficiency and energy
savings as well as microstructural and compositional implications. Sintering at lower
temperatures and shorter times reduces the threat of vaporization, minimizes grain growth
and renders cleaner grain boundary. Spark plasma sintering (SPS) uses high amperage, low
voltage, pulse DC current and uniaxial pressure to consolidate powders [16]. The exciting
results obtained in the sintering of composites by SPS can be ascribed to the differential
activation of the matrix and reinforcement, as the existing theory for SPS proposes that the
current pathway is unlike for conducting and non-conducting powders.
Fig.1.3 Schematic diagram of SPS process [18]
Fig. 1.3 shows the schematic process of SPS method illustrating the arrangement of die and
sample. A combination of current flow through the sample and radiative heat loss on the die
wall gives rise to a radial temperature distribution in conductive samples. The rapid increase
in the use of SPS can be attributed largely to two broad considerations: (a) the intrinsic
advantages of the method relative to conventional sintering methods and (b) the observations
of enhanced properties of materials consolidated by this method. With respect to
compositional

Chapter 1 Introduction
10
and microstructural changes, sintering at lower temperatures and for shorter times minimizes
material loss due to vaporization, [19-22] undesirable phase transformation, [23] and
suppression of grain growth [24-26]. The parameters that are associated with the SPS process
include the current, the applied uniaxial pressure, and heating rate. Typically, the current and
sintering temperature are dependent parameters as Joule heating is the source of thermal
activation, either in the graphite die only (when the sample is nonelectrically conducting) or
in the die and sample (when the sample is electrically conducting). The pressure has been
recently shown to play a crucial role in the consolidation of materials, particularly in
nanostructured powders. The maximum pressure that can be uniaxially applied in the SPS
process is mostly decided by the mechanical property of the graphite die. The fabrication of
nanocomposites via spark plasma sintering renders the grain boundaries clean, to avoid oxide
interfacial layer. The highly reduced time of fabrication controls the grain growth of matrix
particles as well as aids in better pinning effect and retention of nanostructure. Spark plasma
sintering has the advantage of combining the effects of axial mechanical loading, temperature
and electric current. The current plays two roles in SPS i.e. current is the source of heating by
Joule effect and it also has the positive effect of enhanced diffusion rate during phase growth
and intermetallic diffusion [26]. The advent of nanostructured material production techniques
have led to an unprecedented growth in the area of metal matrix composites with
extraordinary superior strengths.
1.1.4 Interface
The zone between the matrix and reinforcement phase (interface or interphase) is an essential
part of MMC. Bonding between the two phases develops from interfacial frictional stress,
physical and chemical interaction and thermal stresses due to mismatch between coefficient
of thermal expansion of matrix and reinforcement. During the designing of a MMC the
underlying interfacial phenomenon governing the transmission of thermal, electrical and
mechanical properties is of utmost importance [12]. The physicochemistry of wetting and
bonding of oxide reinforcements with the metal matrix (i.e. the non reactivity at the interface
zone) in terms of Gibbs free energy change ΔGO
r is as follows
(8)

Chapter 1 Introduction
11
where Me is the matrix and MOn is the reinforcing oxide. The Gibbs free energy is strongly
positive in this case; therefore it has been proposed that the oxide reinforcements can have
only Vander Waals kind of interaction with metal matrices arising from dispersion forces.
Some groups [27-30] who were working on the thermodynamic aspects of wetting of
metal/oxide couples have reported large variations between the experimental results and the
theoretical considerations. The work of adhesion Wa plays a major role in determining the
level of interaction of matrix and reinforcement. The more the work of adhesion Wa the better
is the adhesion [15].
The interfacial failure needs to be evaluated accurately to estimate the performance of a metal
matrix composite. The interfacial failure in case of particulate reinforced metal matrix
composite has not been apprehended comprehensively till date. Several groups [31-34] have
reported the basic mechanisms of interfacial failure in particle reinforced metal matrix
composites as interface decohesion, damage accumulation, solute segregation, thermal misfit
dislocation density, reinforcement geometry and clustering. To quantify the interfacial failure
we need to understand the sintering response in context to the matrix-reinforcement alliance
and the later depends directly on the reinforcement particle size and PSR (particle size ratio).
1.1.5 Characteristic Features
1.1.5a Fabrication of copper-alumina composites
Copper-alumina composites have a wide range of practical applications in electrical,
automobile and aerospace industries [35]. The copper-alumina interaction is of utmost
importance to certify specific applications. The surplus strength entitled to the material has to
be compromised with the loss in ductility. The strength-ductility dichotomy can be alleviated
by using small volume fraction of inclusions (reinforcements). Alumina is a strength boon to
the matrix because it is chemically stable, inert and non reactive at high temperatures. Copper
poses a threat in terms of mechanical pursuit, such as abrasion, sudden failure due to contact
resistance (i.e. because of poor high temperature strength and wear performance) [36]. The
electrical applications of copper demand high wear resistance to avoid abrasion failure in
sliding contacts. Regarding reinforcements, oxide nanoparticles are most suitable because of
their hardness, stability and insolubility in base metal and they also offer obstacles to
dislocation motion at elevated temperatures without affecting the electrical and thermal
conductivity [37]. Copper is an excellent material for electrical applications whose efficiency

Chapter 1 Introduction
12
can be enhanced by improving its mechanical properties [38]. When alumina particles are
dispersed in copper matrix, they exhibit unique characteristics, such as high thermal and
electrical conductivity, as well as high strength and excellent resistance to annealing [35].
The applications encompass resistance welding electrodes, lead frames and electrical
connectors [39]. Its use has been suggested in International Thermonuclear Experimental
Reactor (ITER). The first wall of the reactor has been proposed to be made out of austenitic
stainless steel plate bonded to an alumina dispersed copper plate. Such critical applications of
this material give way to their fabrication by powder metallurgy route. The studies on copper-
alumina MMC along with their properties have been carried out by several groups [40-43].
Fathy et al. [40] have demonstrated improvement in compressive strength, hardness and wear
resistance of Cu-Al2O3 system, Ritasalo et al. [41] have reported hardness value of 1.58 GPa
for SPS sintered Cu-Al2O3 composite. The increase in arc erosion resistance of Cu-Al2O3
with the increase in alumina content has been reported by Wang et al. [42]. Nachum et al.
[43] have studied the microstructural and mechanical properties of Cu-Al2O3 nanocomposites
fabricated by HIPing, where the increase in strength and nanohardness has been highlighted.
The fabrication of Cu-Al2O3 nanocomposites containing high volume fraction of alumina by
SPS route has been performed by Michalski et al. [44], shows that it does not cater to the cost
effectiveness factor of engineering industry. The influence of sintering atmosphere on the
matrix-reinforcement bonding and subsequently other properties, such as densification and
hardness, has not yet been understood in detail.
1.1.5b Fabrication of aluminium-alumina composites
Aluminium is a potent material for aerospace as well as military and electronics applications
such as cryostats, cryo pump inducer and impeller, drive shafts and rotatory turbine
machinery because it possesses high specific strength, high toughness and corrosion
resistance [45]. Aluminium poses poor wear resistance which can be improved by the
addition of ceramic reinforcements. Hesabi et al. [46] studied the compressibility of
aluminium/nanometric alumina and have drawn a comparison between blended and milled
powders. Rahimian et al. [47] have investigated that proper sintering parameters result in
improved wear properties of Al-Al2O3 composites. Gudlur et al. [48] studied the variation in
porosity with particle size and predicted the mechanical and thermal properties in Al-Al2O3
system. Tatar et al. [49] have reported the improvement of thermal conductivity of Al-Al2O3
composites with different alumina content. Zahibi et al. [50] have fabricated Al-Al2O3

Chapter 1 Introduction
13
composites by powder metallurgy and hot rolling processes, and showed that hot rolling
process improved bonding of Al and Al2O3 as well distribution of Al2O3 in Al. Tahamtan et
al. [51] synthesized Al-nano Al2O3 composites by ball milling followed by stir casting which
resulted in better wettability of Al2O3 in Al, fair distribution of alumina particles in the
matrix, low porosity and high tensile strength. Zebarjad and Sajjadi [52,53] milled Al–5 wt.%
Al2O3 composite powders and noted that the alumina powders became finer and got dispersed
more uniformly with increasing milling time and increase in microhardness of the composite.
Prabhu et al. [54] milled Al–Al2O3 powder mixtures with different particle sizes (50 nm, 150
nm, and 5µm) and volume fractions (5, 10, 20, 30, and 50) of Al2O3. By milling the powder
mixtures for different times in a SPEX mixer mill, the authors noted that a uniform dispersion
of the reinforcement phase was obtained in all the cases after milling for about 20 h. Hesabi
et al. [55] investigated the effect of Al2O3 powder particle size on the morphological and
structural changes of Al–Al2O3 composites. They added 5 vol.% of nano- Al2O3 (with 35 nm
particle size) and micro- Al2O3 (1µm particle size) to pure Al and milled these powders under
identical conditions in a planetary ball mill. The milling stages include plastic deformation,
microwelding, and particle fragmentation. These stages were found to occur earlier in the
microcomposites than in the nanocomposites. On the other hand, longer milling time was
found to be necessary to achieve the steady-state condition in the nanocomposites compared
to the microcomposites. It was also noted that at the steady-state condition, the crystallite size
and lattice strain of the Al matrix in the nanocomposite powder were smaller than in the
microcomposites, suggesting a faster refinement process occurring in the nanocomposites.
Zedah et al. [56] synthesized Al-Al2O3 adding mechanically activated nano-crystalline Al2O3
particles into aluminum matrix which showed finer microstructure, good dispersion and
better mechanical attributes. Razavi-Tousi et al. [57] studied the effect of particle size and
volume fraction of alumina on aluminium’s compaction and densification and concluded that
pressability decreases with decrease in particle size, with inhibition of grain growth.
1.1.6 Thermal Loadings
The ceramic phase which is generally used as reinforcement in MMC has a large difference
in coefficient of thermal expansion with the metal phase. This thermal mismatch causes large
residual thermal stresses near the interfaces of composite when they are cooled from the
fabrication temperature [58-60]. Thermal stresses are important in design because they lead to
plastic yielding or failure of the material. There are several mechanisms by which thermal

Chapter 1 Introduction
14
stresses can be relaxed which includes interface debonding, by microplasticity of the metal
matrix and crack initiation and propagation [61]. These act as relaxation phenomenon to
lower the internal strain in the composite.
The difference in thermal conductivity of the matrix and reinforcement generates a thermal
gradient throughout the composite. The thermal mismatch of both constituents (matrix and
reinforcement) plays a vital role in the thermo-mechanical reliability of devices. Some
amount of thermal stress is relaxed by dislocation punching from the interface into the matrix
via cooling from the processing temperature. This leads to high dislocation density and high
yield strength. Thermal stress depends on: reinforcement volume fraction and morphology,
matrix crystallographic texture, void or lack of adhesion at matrix reinforcement interface.
Repetitive non reversible phenomena like thermal cycling leads to permanent deformation.
The reinforcement particle geometry influences the degree of thermal stress as: reducing the
size of the reinforcing particles would increase thermal fatigue resistance [62].
The thermal strain , developed at the interface of discontinuously reinforced MMCs due to
thermal stress is expressed as
(9)
Where δα is the difference between the thermal expansion coefficient of the reinforcement
and the matrix and δT is the range of temperature experienced during processing. The
generated thermal strain may exceed the local yield strain of matrix–reinforcement interface
which will lead to the damage accumulation at the interface. The resultant phenomena of
thermal stress are particulate fracture, de-bonding and cracking in the matrix–reinforcement
interface, failure in the matrix via micro-void coalescence and shear fracture of the matrix
which deteriorate the composite properties. The above failure mechanisms act as relaxation
phenomena and lower the internal strain energy and entropy of the composite [63,64].
Characterization of damaged particles will be valuable in improving processing procedures
and in understanding deformation and failure of MMCs.
The behaviour of metal matrix composites will be different from isothermal conditions when
they are subjected to temperature cycling [65]. Plastic flow stress and strain hardening
behaviour of the composites are affected by thermal cycling because of the triaxial state of
stress generated at the particle–matrix interfaces. Residual stress can also have a considerable
influence on the composites subjected to thermal cycling as they can initiate matrix phase

Chapter 1 Introduction
15
yielding which causes the formation of strain hysteresis loops between the heating and
cooling segments of the cycle.
1.1.7 Loading rate
Loading rate corresponds to the crosshead velocity at which the mechanical test has been
performed. Metal matrix composites respond differently to high strain rate loading conditions
as compared to monotonic or quasistatic loading. As strain rate is increased from quasi-static
to dynamic, the temperature conditions gradually change from isothermal to fully adiabatic.
There is thermo-mechanical coupling in the adiabatic stress-strain curves i.e the effects of
strain hardening, strain rate strengthening and thermal softening caused by the adiabatic
temperature increase couple together. Structural applications require good performance
during impact or high strain rate deformation [66]. Thermo-mechanical coupling effect has
been observed in MMCs. Strain rate sensitivity of composites mostly adheres to the strain
rate sensitivity behaviour of the corresponding matrices. Increasing particle content increases
strain rate sensitivity. Strength of composites increases with increasing strain rate. The
increase in strength with increasing strain rates was observed by some school of researchers,
but some also concluded increase-decrease trend with increasing strain rates for stiffness and
strength of materials. Flow stress also experiences an increasing trend with increasing strain
rate [67]. Flow stress of matrix increases with increasing reinforcement content. At high
strain rates local heat is generated which sometimes results in matrix melting. At high strain
rates composites experience higher strain rate sensitivity than the monolithics.
1.2 Scope of the thesis
The organization of the rest of the thesis is as follows. A detailed experimental study and
different experimental techniques are provided in chapter 2. All the equipments used for
fabrication and characterization have been described. The thermal modules and processes
followed for the thermal shock and conditioning experiments has also been tabulated.
In chapter 3.1a, a description of the effect of powder mixing techniques such as blending and
milling experiments on the dispersion, microstructure and properties of Cu-Al2O3 and Al-
Al2O3 micro- and nano-composites have been discussed in detail. A comparison of blending
and milling procedures on several aspects such as dispersion of alumina particles in matrix
particles, particle size variation and sintering response have been studied comprehensively.

Chapter 1 Introduction
16
Chapter 3.1b explains the effect of sintering atmosphere on microstructural evolution,
structural integrity and properties of Cu-Al2O3 composites.
Chapter 3.2 is devoted to fabrication and characterization of Cu-Al2O3 and Al-Al2O3 micro-
and nano-composites by conventional and spark plasma sintering. After fabrication and
characterization of both systems mechanical properties were evaluated and a comparative
study for micro- and nano-composites has been reported.
Chapter 3.3 describes the effects of induced thermal stress on the structural integrity and
mechanical behaviour of Cu-Al2O3 and Al-Al2O3. A study on induced thermal stress by
subjecting the copper and aluminium based micro- and nano-composites to thermal shock of
different degrees, thermal conditioning, and high temperature flexural test with subsequent
fractographies correlating microstructural integrity and mechanical behaviour has been
conducted extensively for both the systems.
Chapter 3.4 is an exploratory study on the effect of loading rate sensitivity on the flexural
strength of Cu-Al2O3 and Al-Al2O3 micro- and nano-composites. Different loading rates were
maintained for flexural testing at ambient conditions and compared.
A summary of the main findings along with conclusions is presented in chapter 4.
References
[1] S.C. Tjong, Z.Y. Ma, Microstructural and mechanical characteristics of in situ metal
matrix composites, Mat. Sci. Eng. R 29 (3) (2000) 49-113.
[2] A. Kelly, C. Zweben, Comprehensive Composite Materials Vol. 3, Elsevier Science Ltd.,
United Kingdom, first edition, 2000, 1-50.
[3] G.E. Dieter, Mechanical Metallurgy, McGraw- Hill, London, United Kingdom, Third
Edition 1988.
[4] S.M. Choi, H. Awaji, Nanocomposites-a new material design concept, Sci. Technol. Adv.
Mater. 6 (2005) 2-10.
[5] Y. Li, Y.H. Zhao, V. Ortalan, W. Liu, Z.H. Zhang, R.G. Vogt, N.D. Browning, E.J.
Lavernia, J.M. Schoenung, Investigation of aluminium-based nanocomposites with ultra-
high strength, Mat. Sci. Eng. A. 527 (2009) 305-316.
Chapter 1 Introduction
17
[6] W.Z. Eddine, P. Matteazzi , J-P. Celis, Mechanical and tribological behaviour of
nanostructured copper-alumina cermets obtained by pulsed electric current sintering,
Wear 297 (2013) 762-773.
[7] E.O. Hall, The deformation and ageing of mild steel: II Characteristics of the luders
deformation, Proceedings of the physical society-section B, 64 (9) (1951) 742-747.
[8] N.J. Petch, The cleavage strength of polycrystals, J. Iron. Steel. Res. Int. 174 (1953) 25-
28.
[9] Z. Zhang, D.L. Chen, Consideration of Orowan strengthening effect in particulate-
reinforced metal matrix nanocomposites: a model for predicting their yield strength,
Scripta. Mater. 54 (2006) 1321-1326.
[10] N. Ramakrishnan, An analytical study on strengthening of particulate reinforced metal
matrix composites, Acta. Mater. 44 (1) (1996) 69-77.
[11] R.M. German, Powder Metallurgy, John Wiley and Sons, Inc., New York, Second
Edition 1994.
[12] S. Vaucher, O. Beffort, Bonding and interface formation in metal matrix composites,
MMC-Assess Thematic Network, Volume 9. Thun: EMPA, 2001.
[13] D.J. Lloyd, Particle reinforced aluminium and magnesium matrix composites, Int.
Mater. Rev. 39 (1994) 1.
[14] L. Lu, M.O. Lai, G. Li, Influence of sintering process on the mechanical property and
microstructure of ball milled composite compacts, Mater. Res. Bull. 31 (1996) 453-464.
[15] S. Suresh, A. Mortensen, A. Needleman, Fundamental of Metal Matrix Composites,
Butterworth- Heinemann, 1993.
[16] Z.A. Munir, D.V. Quach, M. Ohyanagi, Electric current activation of sintering: a
review of the pulsed electric current sintering process, J. Am. Ceram. Soc. 94 (1) (2011)
1-19.
[17] M.T. Luke, Microstructural evolution of nickel during spark plasma sintering, Master
of Science Thesis, Boise State University, Idaho, United States, 2010.
[18] Z.Z. Fang, Sintering of advanced materials: fundamentals and processes, Woodhead
publishing, 2010.
[19] M. Eriksson, H. Yan, M. Nygren, M.J. Reece, Z. Shen, Low temperature consolidated
lead-free ferroelectric niobate ceramics with improved electrical properties, J. Mater.
Res. 25 (2) (2010) 240-247.

Chapter 1 Introduction
18
[20] S.L. Gallet, L. Campayo, E. Courtois, S. Hoffmann, Y. Grin, F. Bernard, F. Bart,
Spark plasma sintering of iodine-bearing apatite, J. Nuclear Mater. 400 (3) (2010) 251-256.
[21] L. Campyao, S.L Gallet, Y. Grin, E. Courtois, F. Bernard, F. Bart, Spark plasma
sintering of lead phosphovanadate Pb3(VO4)1.6(PO4)0.4, J. Eur. Ceram. Soc. 29 (14) (2009)
77-84.
[22] Y. Kan, P. Wang, T. Xu, G. Zhang, D. Yan, Z. Shen, and Y-B. Cheng, Spark plasma
sintering of bismuth titanate ceramics, J. Am. Ceram. Soc. 88 (6) (2005) 1631-1633.
[23] C. Drouet, C. Largeot, G. Raimbeaux, C. Estournes, G. Dechambre, C. Combes, C.
Rey, Bioceramics: Spark Plasma Sintering (SPS) of calcium phosphates, Adv. Sci. Technol.
49, (2006) 45-50.
[24] A. Bassano, M.T. Buscaglia, V. Buscaglia, P. Nanni, Particle size and morphology
control of perovskite oxide nanopowders for nanostructured materials, Integr Ferroelectr.
109 (1) (2009) 1-17.
[25] M. Okamoto, Y. Akimune, K. Furuya, M. Hatano, M. Yamanaka, M. Uchiyama,
Phase transition and electrical conductivity of scandia-stabilized zirconia prepared by spark
plasma sintering process, Solid State Ionics 176 (7) (2005) 675-680.
[26] N. Chennoufi, G. Majkic, Y.C. Chen, K. Salama, Temperature, current, and heat loss
distributions in reduced electrothermal loss spark plasma sintering, Metall. Mater. Trans. A,
40 (10) (2009) 2401-2409.
[27] C.A. Handwerker, J.W. Cahn, J.R. Manning, Thermodynamics and kinetics of
reactions at interfaces in composites, Mat. Sci. Eng. A 126 (1) (1990) 173-189.
[28] A. Koltsov, F. Hodaj, N. Eustathopoulos, Factors governing interfacial reactions in
liquid metal/non-oxide ceramic systems: Ni-based alloy–Ti/sintered AlN system, J. Eur.
Ceram. Soc. 29 (1) (2009) 145-154.
[29] P. Hicter, D. Chatain, A. Pasturel, N. Eustathopolous, An electronic model for
thermodynamical adhesion in non reactive SP-metal-aluminate systems, J. de. Chim. Phys.
85 (1988) 941-945.
[30] D. Chatain, I. Rivollet, N. Eustathopolous, Thermodynamic adhesion in non reactive
liquid metal alumina systems, J. de. Chim. Phys. 83 (1986) 561-567.
[31] G.G. Sozhamannan, S.B. Prabu, R. Paskaramoorthy, Failures analysis of particle
reinforced metal matrix composites by microstructure based models, Mater. Des. 31 (2010)
3785-3790.

Chapter 1 Introduction
19
[32] X.J. Wang, K. Wu, W.X. Huang, H.F .Zhang, M.Y. Zheng, D.L. Peng, Study on
fracture behaviour of particulate reinforced magnesium matrix composite using in situ
SEM, Compos. Sci. Technol. 67 (11) (2007) 2253-2260.
[33] M. Gupta, M.K. Surappa, S. Qin, Effect of interfacial characteristics on the
failure-mechanism mode of a SiC reinforced Al based metal-matrix composite, J.
Mater. Process. Technol. 67 (1) (1997) 94-99.
[34] G. Liu, Z. Zitang, J.K. Shang, Interfacial microstructure and fracture of
Al2O3 particulate reinforced Al-Cu composite, Acta. metal. mater. 42 (1) (1994) 271-282.
[35] M.S. Motta, P.K. Jena, E.Z. Brocchi, I.G. Solorzano, Characterization of Cu-Al2O3
nanoscale composites synthesized by in situ reduction. Mat. Sci. Eng. C. 15 (1) (2001)
175-177.
[36] H.W. Turner, C. Turner, Copper in electrical contacts, Technical note (edited version
of an original script commissioned by Copper Development Association, ERA
Technology Ltd., Leatherhead, Surrey) 23 (1980).
[37] M. Korac, Z. Kamberovic, M. Tasic, M. Gavrilovski, Nanocomposite powders for
new contact materials based on copper and alumina, Chem. Ind. Chem. Eng. Q. 14 (4)
(2008) 215-218.
[38] G.C. Efe, T. Yener, I. Altinsoy, M. Ipek, S. Zyetin, C. Bindal, The effect of sintering
temperature on some properties of Cu-SiC composite, J. Alloy Compd. 509 (20) (2011)
6036-6042.
[39] H. Nishi, T. Araki, M. Eto, Diffusion bonding of alumina dispersion-strengthened
copper to 316 stainless steel with interlayer metals, Fusion Eng. Des. 39-40 (1) (1998)
505-511.
[40] A. Fathy, F. Shehata, M. Abdelhameed, M. Elmahdy, Mater. Des. 36 (2012) 100-107.
[41] R. Ritasalo, X.W. Liu, O. Soderberg, A. Keski-Honkola, V. Pitkanen, S-P. Hannula,
The microstructural effects on the mechanical and thermal properties of pulsed electric
current sintered Cu-Al2O3 composites, Proc. Eng. 10 (2011) 124-129.
[42] X. Wang, S. Liang, P. Yang, and Z. Fan, Effect of Al2O3 content on electrical
breakdown properties of Al2O3/Cu composite, J. Mater. Eng. Perform. 19 (9) (2010)
1330-1336.
[43] S. Nachum, N.A. Fleck, M.F. Ashby, A. Colella, P. Matteazzi, The microstructural
basis for the mechanical properties and electrical resistivity of nanocrystalline Cu-Al2O3,
Mat. Sci. Eng. A 527 (20) (2010) 5065-5071.

Chapter 1 Introduction
20
[44] A. Michalski, J. Jaroszewicz, M. Rosinski, D. Siemiaszko, K.J. Kurzydłowski,
Nanocrystalline Cu-Al2O3 composites sintered by the pulse plasma technique, Solid State
Phenom. 114 (2006) 227-232.
[45] S. Lim, T. Imai, Y. Nishida, T. Choh, High strain rate superplasticity of TiC
particulate reinforced magnesium alloy composite by vortex method, Scripta. Metall.
Mater. 32 (11) (1995) 1713-1717.
[46] Z.R. Hesabi, H.R. Hafizpour, A. Simchi, An investigation on the compressibility of
aluminum/nano-alumina composite powder prepared by blending and mechanical milling,
Mat. Sci. Eng. A 454-455 (2007) 89-98.
[47] M. Rahimian, N. Parvin, N. Ehsani, The effect of production parameters on
microstructure and wear resistance of powder metallurgy Al–Al2O3 composite, Mater.
Des. 32 (2011) 1031-1038.
[48] P. Gudlur, A. Forness, J. Lentz, M. Radovic, A. Muliana, Thermal and mechanical
properties of Al/Al2O3 composites at elevated temperatures, Mat. Sci. Eng. A. 531 (1)
(2012) 18-27.
[49] C. Tatar, N. Ozdemir, Investigation of thermal conductivity and microstructure of the
α-Al2O3 particulate reinforced aluminium composites (Al/Al2O3-MMC) by powder
metallurgy method, Physica B 405 (3) (2010) 896-899.
[50] M. Zabihi, M.R. Toroghinejad, A. Shafyei, Application of powder metallurgy and hot
rolling processes for manufacturing aluminium/alumina composite strips Mat. Sci. Eng.
A. 560 (10) (2013) 567-574.
[51] S. Tahamtan, A. Halvaee, M. Emamy, M.S. Zabihi, Fabrication of Al/A206-Al2O3
nano/micro composite by combining ball milling and stir casting technology, Mater.
Design. 49 (2013) 347-359.
[52] S.M. Zebarjad, S.A. Sajjadi, Dependency of physical and mechanical properties of
mechanical alloyed Al–Al2O3 composite on milling time. Mater. Design. 28 (7) (2007)
2113-2120.
[53] S.A. Sajjadi, H.R. Ezatpour, H. Beygi, Microstructure and mechanical properties of
Al–Al2O3 micro and nano composites fabricated by stir casting. Mat. Sci. Eng. A 528 (29)
(2011) 8765-8771.
[54] B. Prabhu, C. Suryanarayana, L. An, R. Vaidyanathan, Synthesis and characterization
of high volume fraction Al–Al2O3 nanocomposite powders by high-energy milling, Mat.
Sci. Eng. A 425 (2006) 192-200.
Chapter 1 Introduction
21
[55] Z.R. Hesabi, A. Simchi, S.M.S. Reihani, Structural evolution during mechanical
milling of nanometric and micrometric Al2O3 reinforced Al matrix composites, Mat. Sci.
Eng. A. 428 (2006) 159-168.
[56] M.H. Zadeh, M. Razavi, O. Mirzaee, R. Ghaderi, Characterization of properties of Al-
Al2O3 nano-composite synthesized via milling and subsequent casting, Journal of King
Saud University – Engineering Sciences 25 (1) (2013) 75-80.
[57] S.S. Razavi-Tousi, R. Yazdani-Rad, S.A. Manafi, Effect of volume fraction and
particle size of alumina reinforcement on compaction and densification behaviour of Al-
Al2O3 nanocomposites, Mat. Sci. Eng. A. 528 (3) (2011) 1105-1110.
[58] R.J. Arsenault, R.M. Fisher, Microstructure of fiber and particulate SiC in 6061 Al
composites, Scripta. metal. 17 (1) (1983) 67-71.
[59] T. Christman, A. Needleman, S. Nutt, S. Suresh, On microstructural evolution and
micromechanical modelling of deformation of a whisker-reinforced metal-matrix composite,
Mat. Sci. Eng. A, 107 (1989) 49-61.
[60] A. Wang, H.J. Rack, Abrasive wear of silicon carbide particulate and whisker-
reinforced 7091 aluminium matrix composites, Wear 146 (1991) 337-348.
[61] B.C. Ray, Temperature effect during humid ageing on interfaces of glass and carbon
fibers reinforced epoxy composites, J. Colloid. Interf. Sci. 298 (1) (2006) 111-117.
[62] C.M.L. Wu, G.W. Han, Thermal fatigue behaviour of SiCp/Al composite synthesized
by metal infiltration, Compos. Part A 37 (11) (2006) 1858-1862.
[63] T.W. Clyne, P.J. Withers, An Introduction to Metal Matrix Composites, Cambridge
University Press, Cambridge, 1993.
[64] A.F. Whitehouse, T.W. Clyne, Effects of reinforcement content and shape on
cavitation and failure in metal matrix composites, Compos. 3 (1993) 256-261.
[65] S.M. Pickard, B. Derby, The deformation of particle reinforced metal matrix
composites during temperature cycling Acta. Metall. Mater. 38 (12) (1990) 2532-2552.
[66] Y. Zhou, Y. Xia, Experimental study of the rate sensitivity of SiCp /Al composites and
the establishment of a dynamic constitutive equation, Compos. Sci. Tech. 60 (2000) 403-
410.
[67] Z.H. Tan, B.J. Pang, D.T. Qin, J.Y. Shi, B.Z. Gai, The compressive properties of 2024
Al matrix composites reinforced with high content SiC particles at various strain rates,
Mat. Sci.Eng. A 489 (2008) 302-309.

22
Chapter 2
Experimental Details
2.1 Fabrication
2.1.1 Blending
Copper (Loba Chemie, purity > 99.7%, average size~11µm) aluminium (Loba Chemie, purity
> 99.7%, average size~22µm and alumina (Sigma Aldrich, average size~10µm (micro) and
<50 nm (nano)) powders were blended separately in turbula shaker mixer (T2F, LCR Hi
Tester, Switzerland) for 8 hours at 45 rpm. Copper-5 vol. % micron size alumina, copper-5
vol. % nano size alumina, aluminium-5 vol. % micron size alumina and aluminium-5 vol. %
nano size alumina compositions were blended. The compositions blended for conventional
sintering are Cu-1, 3, 5, 7 vol. % Al2O3 nanocomposites and Cu-5, 10, 15, 20 vol. % Al2O3
microcomposites. The compositions used for spark plasma sintering of nanocomposites were
0.5, 1, 3, 5, and 7 vol. % of alumina nanoparticles in copper and aluminium matrix. Another
set of specimens having compositions of 1, 5, 20 vol. % micron size alumina were used to
synthesize microcomposites by spark plasma sintering. The blended powders were collected
at 2, 4, 8 hours and characterized by scanning electron microscopy.
2.1.2 Milling
Mixture of copper-alumina and aluminium-alumina powders were milled separately at a
speed of 300 rpm in a dual drive planetary mill (the design and make of the mill is available

Chapter 2 Experimental Details
23
in an Indian patent “Synthesis of stable nanocrystalline iron carbides by reaction milling in a
dual-drive planetary mill" patent application no. 1021/DEL/2007, Dated: 10.05.07”). Copper-5
vol. % micron size alumina and aluminium-5 vol. % micron size alumina compositions were
milled for 10 hours. The powders were collected at intervals of 2, 5, 10 hours and
characterized for particle size analysis, scanning electron microscopy and x-ray diffraction.
2.1.3 Compaction
The copper-alumina and aluminium-alumina milled powders were compacted at 700 MPa
and 400 MPa respectively in a uniaxial press (SoilLab). Specimens for 3-point flexural test
were compacted using a rectangular die of dimension (31.5x12.5x6.35 mm3). Compression
test samples were prepared using cylindrical die of diameter 10 mm.
2.1.4 Sintering
2.1.4.1 Conventional sintering
Sintering of the cylindrical pellets was carried out in a super kanthal heated tubular furnace
(Naskar, India). Commercially pure nitrogen, hydrogen and argon gas were used as sintering
atmosphere to prevent oxidation during heating. The samples were held at their different
sintering temperatures for 60 minutes followed by furnace cooling at a heating rate of
5°C/minute, the details of sintering temperature and compositions of composites used for
fabrication is tabulated in Table 2.1.
2.1.4.2 Spark plasma sintering
The micro- and nano-composites were fabricated via spark plasma sintering (SPS) (DR
SINTER LAB SPS Syntex INC, model: SPS-515S, Kanagawa, Japan) method at a
temperature of 700ºC (copper) and 500°C (aluminium) maintaining a soaking time of 5
minutes at a ram pressure of 50 MPa. The heating rate for the whole process was maintained
at 80ºC/minute for both cases.

Chapter 2 Experimental Details
24
Composition
Conventional sintering
temperature (°C)
Composition Spark plasma sintering
temperature (°C)
Copper-1,3,5,7 vol. %
nanoalumina
850, 900, 1000 Copper-0.5,1,3,5,7 vol.
% nanoalumina
700
Copper-5,10,15,20 vol.
% microalumina
850, 900, 1000 Copper-1,5,20 vol. %
microalumina
700
Aluminium-1,3,5,7 vol.
% nanoalumina
500, 550, 600 Aluminium-0.5,1,3,5,7
vol. % nanoalumina
500
Aluminium- 5,10,15,20
vol. % microalumina
500, 550, 600 Aluminium-1,5,20 vol.
% microalumina
500
Table 2.1 The compositions of micro- and nano-composite used for copper and aluminium
matrix and their corresponding sintering temperatures.
2.2 Characterization
2.2.1 Particle size analysis
The particle size was measured in a laser particle size analyzer (Malvern, Mastersizer 2000,
UK). The dispersion for paricle size analysis was prepared by dispersing the powder particles
in sodium hexa metaphosphate solution made by dissolving 2gms in 100 ml of water.
2.2.2 X-ray diffraction
X-ray diffraction of the as milled powders, and sintered composite samples were performed
using the diffractometer (PANalytical model: DY-1656). The radiations used were CuKα
(λ=1.542A°). X-ray diffraction was carried out with a scan speed of 2°/minute. The XRD
patterns of as-received alumina micropowder and nanopowder has been plotted in Fig. 2.1.
2.2.3 Scanning electron microscopy
The SEM micrographs of as received powder, blended powder, milled powder, sintered
samples and fracture surfaces were obtained using the scanning electron microscope (JEOL
JSM 6480 LV). The images were taken in both secondary electron (SE) and back scattered
electron (BSE) mode according to requirement. The elemental detection analysis (EDS) was
also done in order to study the elements present in the samples which is equipped with INCA

Chapter 2 Experimental Details
25
software. SEM micrographs of as-received alumina micropowder and nanopowder have been
illustrated in Fig. 2.2.
2.2.4 Field emission scanning electron microscopy
The sintered composites and fracture surfaces of flexural bend test samples were captured
under field emission electron microscope (NOVA NANOSEM 450). The FESEM
micrographs were obtained at high magnifications such as 100000X and 200000X
magnifications also.
2.2.5 Transmission electron microscopy
Transmission electron microscopy (TECNAI G2 20S-TWIN) equipped with an energy
dispersive X-ray analyser was used to obtain transmission electron micrographs of composite
samples and thermally treated samples. The samples were prepared by punching 3 mm discs
from the sample whose thickness had been reduced to 100µm. The discs were then dimpled
to around below 10µm and then ion milled for 1 hour for perforation.
2.3 Mechanical property study
2.3.1 Density measurement
Density of sintered specimens was measured by Archimedes water immersion method. The
density measurement kit (Contech model no: CB-300) was used for measuring the suspended
weight and soaked weight of the specimens.
2.3.2 Microhardness study
Microhardness of the specimens was measured by Vickers hardness tester (Leco
Microhardness Tester LM248AT) at a load of 0.3kgf for a dwell time of 5 seconds. A
minimum of 4 readings was taken for each specimen.
2.3.3 Nanoindentation hardness
The nanoindentation hardness and elastic modulus of the nanocomposites were determined
using nanoindentation (Fisher-Cripps UMIS) technique by applying a load of 20mN for a
dwell time of 10 seconds. The readings were recorded at ten equivalent locations for each
specimen and the closest values were considered.

Chapter 2 Experimental Details
26
2.3.4 Compression test
According to ASTM standard E9-89 compression test was conducted with the aid of
universal testing machine (INSTRON SATEC series servo-hydraulic machine) with
specimen dimensions of 10 mm diameter and 8 mm height at a strain rate of 1min-1
. Graphite
powder was used to minimize friction between the sample and fixture of compression
machine. A reduction of 50% in height was maintained for all the specimens. The end
surfaces were kept normal to the axis of the specimen.
2.3.5 Flexural test
A set of specimens having dimensions of 31.5 x12.7 x 6.3 mm3, in accordance with ASTM
standard B925-08 were fabricated following the above mentioned route for both copper and
aluminium matrix micro- and nano-composites except for maintaining the sintering holding
time for 90 minutes. A span length of 26mm and crosshead velocity of 0.5mm/minute was
maintained during the flexural tests which were carried out in universal testing machine
(INSTRON-5967).
2.3.6 Wear test
Sliding wear tests were performed using a ball on plate type wear machine (DUCOM TR-
208-M1) using hardened steel ball (SAE 52100) indenter of 2 mm diameter, with an applied
load of 2 Kgf and sliding time of 15 minutes at a speed of 30 rpm. The hardened steel ball
slides unidirectionally on fixed samples. The tests were carried out in laboratory atmosphere
at a relative humidity of around 50-60% and temperature of about 25 C. The wear depth vs
sliding time data was obtained from the inbuilt WINCOM software in the wear machine. The
worn surfaces were characterized by SEM.
2.4 Thermal treatment
2.4.1 Furnace
The composites were subjected to high temperatures in furnace (OE motors India Ltd.) for
thermal shock and thermal conditioning treatments.

Chapter 2 Experimental Details
27
2.4.2 Ultra-low temperature chamber
The composites were subjected to ultra low temperature in a chamber (S.D. Scientific) for
thermal shock and thermal conditioning treatments.
Fig. 2.1 XRD patterns of as-received alumina micropowder (left) and nanopowder (right)
Fig. 2.2 SEM micrographs of as-received alumina micropowder (left) and nanopowder (right)
20 30 40 50 60 70 80
(10
10
)(2
08
)
(12
5)
(30
0)
(21
4)
(12
2)
(21
1)
(11
6)
(02
4)
(20
2)
(11
3)
(11
0)
(10
4)
Inte
ns
ity
(A
.U.)
2 (degrees)
(01
2)
30 60 90
(11
2)
(00
2)
Inte
ns
ity
(A
.U)
2 degrees
(60
3)
(11
1)
(71
2)

Chapter 2 Experimental Details
28
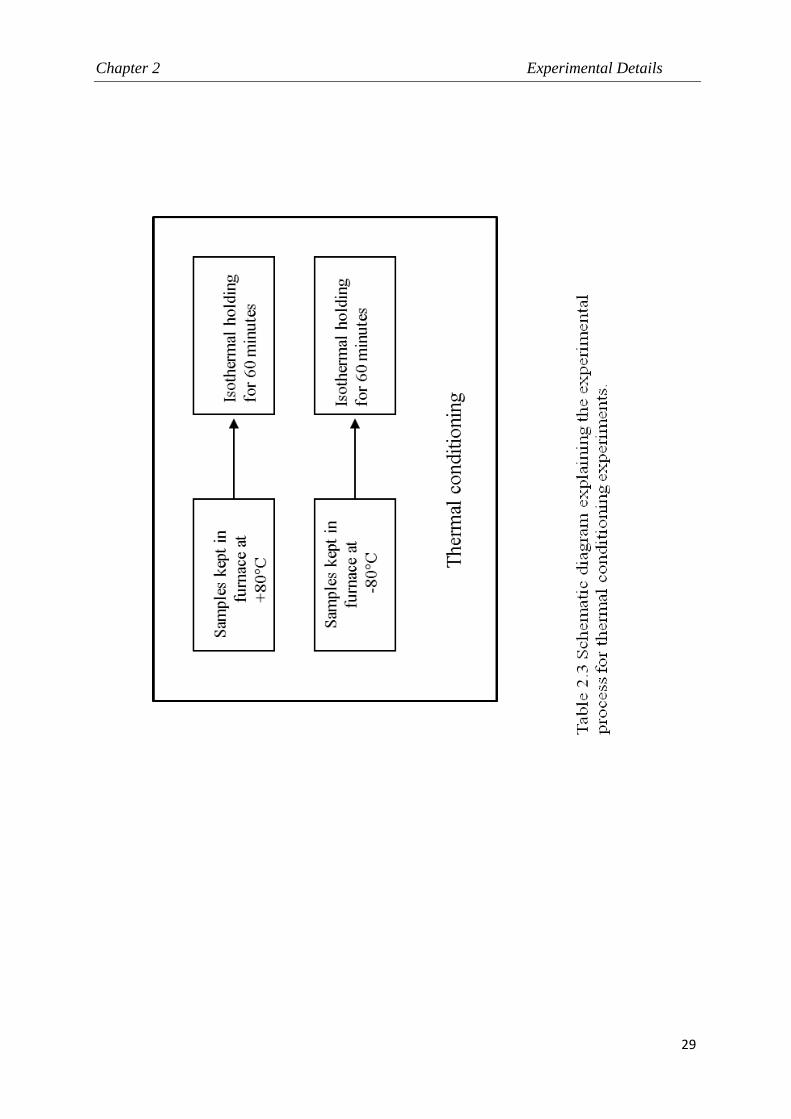
Chapter 2 Experimental Details
29

30
Chapter 3
Results and Discussion
3.1a Effect of milling and blending on the dispersion, microstructure and
properties of Cu-Al2O3 and Al-Al2O3 composites
3.1a.1 Scope and objectives of the work
During fabrication of MMC, homogeneous dispersion of reinforcement into metal matrix is
always a great challenge. Blending and milling are widely used for this purpose. Here,
turbula shaker mixer has been used for uniform dispersion of reinforcement into matrix. The
3-D movement of the jar results in homogeneous mixing. High energy planetary milling has
also been used to reduce powder particle size as well for mixing powder particles. The
comparison between milling and blending of powders in terms of dispersion and sintering
response of milled and blended powders after consolidation has been investigated in this
chapter.

Chapter 3 Results and Discussion
31
3.1a.2 Fabrication of composites
Blending
The Cu-5 vol. % micro- as well as nano-alumina powders were blended separately in a
turbula shaker mixer for 2, 4 and 8 hours and consolidation was done using conventional
sintering method.
Milling
The Cu-5 vol. % micro-alumina powder was milled in a dual drive planetary mill for 2, 5 and
10 hours and consolidation was done using conventional sintering method. A ball to powder
weight ratio of 10:1 was used during milling. Milling was conducted under toluene to prevent
oxidation.
Consolidation
The milled and blended powders were compacted uniaxially and sintered conventionally in a
tubular furnace at 900°C for copper-alumina and at 600°C for aluminium-alumina composites
for 1 hour in both cases.
3.1a.3 Characterization of composites
3.1a.3.1 X-Ray diffraction
Fig. 3.1a.1 shows XRD pattern of Cu-5 vol. % Al2O3 microcomposite powders milled for
different time periods. The XRD patterns show broadening and reduced intensity of copper
and alumina peaks with increasing milling time. Heavy deformation of powders due to
collision between ball-powder, powder-powder results in decrease in crystallite size and
increase in lattice strain. Fig. 3.1a.2 shows XRD pattern of Al-5 vol. % Al2O3 micro-
composite powders milled for different periods. It shows the intensity of aluminium and
alumina peaks gradually decreases with milling demonstrating decrease in crystallite size,
severe lattice distortion and grain refinement [1].

Chapter 3 Results and Discussion
32
30 60 90
Cu
2O
Cu
2O
CuCu
Cu
Al 2
O3
Al 2
O3
10 h
5 h
Inte
ns
ity
(A
.U.)
2 (degrees)
2 h
Fig. 3.1a.1 X-ray diffraction patterns of Cu-5 vol. % Al2O3 microcomposite powders after 2,
5, 10 hours of milling
20 40 60 80
Al 2
O3
Al
Al
Al
Al
Al 2
O3
10 h
5 h
Inte
ns
ity
(A
.U.)
2 (degrees)
2 h
Al 2
O3
Fig. 3.1a.2 X-ray diffraction patterns of Al-5 vol. % Al2O3 microcomposite powders after 2,
5, 10 hours of milling

Chapter 3 Results and Discussion
33
3.1a.3.2 Particle size analysis
The particle size analysis (Fig. 3.1a.3 & 3.1a.4) reveals that the particle size initially
increases and then decreases with further milling for both Cu-5 vol. % Al2O3 and Al-5 vol. %
Al2O3 micro-composite powders. As copper and aluminium are ductile and soft in nature
during initial stage of milling the particles weld and become flat in shape [2].
1 10 100
0
20
40
60
80
100
Cu
mu
lati
ve
wt
% p
as
sin
g
Particle size ( m)
2h
5h
10h
Fig. 3.1a.3 Particle size distribution of Cu-5 vol. % Al2O3 microcomposite powders milled
for different time periods
The flattening of particles is followed by welding of flat particles with each other. Further
milling leads to work hardening and result in particle fragmentation [3].

Chapter 3 Results and Discussion
34
1 10 100
0
20
40
60
80
100C
um
ula
tiv
e w
t %
pa
ss
ing
2h
5h
10h
Particle size( m)
Fig. 3.1a.4 Particle size distribution of Al-5 vol. % Al2O3 microcomposite powders milled for
different time periods
3.1a.3.3 Scanning electron microscopy
3.1a.3.3.1 Dispersion
The SEM micrographs in Fig. 3.1a.5 show the Cu-5 vol. % Al2O3 microcomposite powders
after 2, 5 and 10 hours of milling. The micrographs show increase in particle size and become
flaky after 2 hours of milling and then decreases after 10 hours of milling. After 10 hours of
milling particles become almost spherical in nature.

Chapter 3 Results and Discussion
35
Fig. 3.1a.5 SEM micrographs of Cu-5 vol. % Al2O3 microcomposite powders after 2,5,10
hours of milling
Fig. 3.1a.6 shows the SEM micrographs Al-5 vol. % Al2O3 microcomposite powders milled
for different times. The particle size gradually reduces as milling progresses. Agglomeration
of particles is visible at places due to surface activation during milling. The initial stage of
milling results in particle size increase due to flattening of particle as aluminium is ductile.
The flattened particles then weld with each other forming stacked flat particles. These stacks
then get strain hardened with milling and then particle fragmentation takes place, reducing
the particle size appreciably.
2h
10h
5h

Chapter 3 Results and Discussion
36
Fig. 3.1a.6 SEM micrographs of Al-5 vol. % Al2O3 microcomposite powders after 2,5,10
hours of milling
Fig. 3.1a.7 & 3.1a.8 reveal fair distribution of micron size alumina particles in copper matrix.
As the blending time increase the distribution gets better.
Fig. 3.1a.7 SEM micrographs of Cu-5 vol. % Al2O3 microcomposite powders after 2 and 8
hours of blending
2h
10h
5h
2h 8h

Chapter 3 Results and Discussion
37
The nanoalumina particles show appreciable distribution in copper particles, which improves
with increase in blending time. Th copper particles show dendritic shape and alumina
particles are spherical in shape.
Fig. 3.1a.8 SEM micrographs of Cu-5 vol. % Al2O3 nanocomposite powders after 2 and 8
hours of blending
The Al-5 vol. % Al2O3 micro and nano-composite powders show good distribution of
alumina particles in the aluminium matrix powders.
Fig. 3.1a.9 SEM micrographs of Al-5 vol. % Al2O3 nanocomposite powders after 2 and 8
hours of blending
Fig. 3.1a.9 & 3.1a.10 show alumina particles in aluminium matrix powders well distributed
throughout the aluminium matrix powders. The powders at 8 hours of blending show finer
distribution than in 2 hours of blending. The reason may be the tumbling action of turbula
mixer which helps in breakage of agglomerated particles by shaking action.
2h 8h
2h 8h

Chapter 3 Results and Discussion
38
Fig. 3.1a.10 SEM micrographs of Al-5 vol. % Al2O3 microcomposite powders after 2 and 8
hours of blending
3.1a.3.3.2 Sintering response
Fig. 3.1a.9 & 3.1a.10 illustrates the SEM micrographs of sintered specimens of Cu-5 vol. %
Al2O3 and Al-5 vol. % Al2O3 microcomposites after 2, 5 and 10 hours of milling. The
sintering response of milled powders improves with increase in milling time. Milling
activates the powder particles and introduces lattice defects like vacancy and dislocations.
The increase in milling time also results in grain refinement of the matrix.
2h 8h

Chapter 3 Results and Discussion
39
Fig. 3.1a.11 SEM micrographs of Cu-5 vol. % Al2O3 microcomposite powders after 2,5,10
hours of milling and 8 hours of blending followed by sintering at 900°C temperature
The SEM micrographs of blended and sintered samples do not show any grain refinement, as
blending could not reduce particle size. Milling also reduces the reinforcement particle size
which results in effective grain boundary pinning.
2h 5h
10h Blended 8h

Chapter 3 Results and Discussion
40
Fig. 3.1a.12 SEM micrographs of Al-5 vol. % Al2O3 microcomposite powders after 2,5,10
hours of milling and 8 hours of blending followed by sintering at 600°C temperature
3.1a.4 Density and microhardness measurements
The density of the composites prepared using blending and milling was measured using
Archimedes method. The Vickers microhardness measurements were done at a load of 0.3kgf
for a dwell time of 5 seconds. The density of milled samples decreases with milling time (Fig.
3.1a.13 & 3.1a.14). The density of milled samples decreases due to brittleness of particles in
the course of milling. As milling progresses particles become brittle due to strain hardening
and their compressibility reduces [4]. The density values of milled samples maintain a
negative trend with increase in milling time, as milling time increases more ball and powder
collisions lead to brittleness of particles and surface activation leads to agglomeration of
particles which impedes the compressibility of powders.
The Cu-5 vol. % Al2O3 composite synthesized by blending shows 86.2 and 91.2% of
theoretical density for nano-composite and micro-composite respectively. The Al-5 vol. %
10h
5h 2h
Blended 8h

Chapter 3 Results and Discussion
41
Al2O3 blended micro-composite and nano-composite show 92.39 and 91.3% of theoretical
density.
2 4 6 8 10
71
72
73
74
75
76%
th
eo
riti
ca
l d
en
sit
y
Milling time (h)
Fig. 3.1a.13 Density of Cu-5 vol. % Al2O3 sintered at 900°C after milling
2 4 6 8 10
65
70
75
80
85
% t
he
ori
tic
al
de
ns
ity
Milling time (h)
Fig. 3.1a.14 Density of Al-5 vol. % Al2O3 sintered at 600°C after milling

Chapter 3 Results and Discussion
42
Fig. 3.1a.15 & 3.1a.16 show variation of microhardness of sintered samples of Cu-5 vol. %
Al2O3 and Al-5 vol. % Al2O3 composites with milling time.
2 4 6 8 10110
120
130
140
150
160
170
180
190
200
Mic
roh
ard
ne
ss
(H
V0
.3)
Milling time (h)
Fig. 3.1a.15 Microhardness of Cu-5 vol. % Al2O3 sintered at 900°C after milling
The microhardness value for sintered Cu-5 vol. % Al2O3 microcomposite recorded was
25.9 HV and for nanocomposite was 47.25 HV after blending. The microhardness values for
milled samples are higher than that of blended samples. The reason is that milling
mechanically activates the powder particles and also refines powders. As a result milled
powder shows higher sintering response than blending. The microhardness values for
aluminium-alumina blended samples were 35.77 HV for microcomposite and 31.65 HV for
nanocomposite. The milled samples possess brittleness, as well as grain refinement. After 5
hours the microhardness values decrease as particles get welded and flattened and then after
10 hours of milling, the microhardness values increase as particle fragmentation takes place.

Chapter 3 Results and Discussion
43
2 4 6 8 10
90
100
110
120
130
140
150
160
170
180
190
200
210
Mic
roh
ard
ne
ss
(H
V0
.3)
Milling Time (h)
Fig. 3.1a.16 Microhardness of Al-5 vol. % Al2O3 sintered at 600°C after milling
3.1a.5 Summary and Conclusions
Cu-5 vol. % Al2O3 and Al-5 vol. % Al2O3 micro-and nano-composites were fabricated by
milling and blending of copper and alumina, aluminium and alumina powders followed by
conventional sintering. Milling reduces the particle size of composite powders with
increasing milling time. X-ray diffraction, particle size analysis and microstructure reveal
particle size reduction and good distribution of alumina particles in copper and aluminium
matrix powders. Microhardness of milled samples is higher than blended samples. Blending
of powders followed by sintering impart higher density than milled and sintered samples.
Grain refinement of copper and aluminium is observed with increasing milling time. Milling
process demonstrates plastic deformation, micro-welding and particle fragmentation in SEM
micrographs.

Chapter 3 Results and Discussion
44
References
[1] C. Suryanarayana, N. Al-Aqeeli, Mechanically alloyed nanocomposites, Prog. Mater.
Sci. 58 (4) (2013) 383-502.
[2] C. Suryanarayana, Mechanical alloying and milling, Prog. Mater. Sci. 46 (2001) 1-
184.
[3] C.P. Samal, J.S. Parihar, D. Chaira, The effect of milling and sintering techniques on
mechanical properties of Cu-graphite metal matrix composite prepared by powder
metallurgy route, J. Alloy Compd. 569 (2013) 95-101.
[4] C. Suryanarayana, Synthesis of nanocomposites by mechanical alloying, J. Alloy
Compd. 509 (1) (2011) 229-234.

Chapter 3 Results and Discussion
45
3.1b Effect of sintering atmosphere on the microstructure and properties of
Cu-Al2O3 composites
3.1b.1 Scope and objectives of the work
Sintering atmosphere plays a crucial role in the sintering response of the material. Synthesis
of microcomposites via conventional sintering using N2, H2 and Ar atmospheres has been
investigated here. It has been observed that Cu-Al2O3 metal matrix composite (MMC) shows
poor mechanical properties and physical bonding of matrix and reinforcement when it is
conventionally sintered in N2 or Ar atmosphere compared to those in H2 atmosphere. The
structural integrity of the microcomposites with the variation in sintering atmosphere differs,
hence providing a scope for tailoring the properties of copper-alumina composites by
changing sintering environments.
3. 1b.2 Fabrication of microcomposites
The as-received copper (Loba Chemie, purity > 99.7%, average size-11µm) and alumina
(Sigma Aldrich, average size-5.71µm) powders were mixed and blended separately using
turbula shaker mixer for 8 hours at a speed of 45 rpm to ensure homogeneous mixing. The
reinforcement (alumina) content added to copper was 5, 10, 15 volume %. The powders were
compacted into cylindrical pellets (diameter: 15 mm) using uniaxial hydraulic press at an
applied pressure of 700 MPa for 2 minutes. The green samples were then sintered by
conventional sintering in a tubular furnace at 900°C for a holding time of 60 minutes in
nitrogen (Asiatic gases Ltd., 99.8% purity) atmosphere at a heating rate of 5°C/minutes. In
another set of experiments, specimens of same constituents were fabricated by sintering them
in hydrogen (99% purity) atmosphere, while keeping the other parameters fixed. The third set
of specimens with similar composition as above were synthesized by sintering them in argon
atmosphere (British oxygen company, 99.994% purity), maintaining rest of the parameters
fixed.
3.1b.3 Characterization of the microcomposites
Sintered specimens were characterized by X-Ray diffraction (PANalytical model: DY-1656)
CuKα, and scanning electron microscope (JEOL 6480 LV). The micrographs of the specimen

Chapter 3 Results and Discussion
46
were obtained by chemically etching the samples by a mixture of 5 g FeCl3 and 50 ml HCl in
100 ml distilled water.
3.1b.3.1 X-Ray diffraction
The X-Ray diffraction of sintered samples was carried out to study the phases present after
sintering. The alumina peaks confirm to be monoclinic in nature. The X-Ray diffraction
patterns of the specimen sintered conventionally in nitrogen, hydrogen and argon atmosphere,
illustrated in Figs.3.1b.1 show the presence of cuprous oxide (Cu2O) along with Cu and
Al2O3 in both cases. In the composites sintered in argon atmosphere, the peak for cuprous
oxide is not that intense, but the presence of oxygen has been further verified by EDAX.
20 30 40 50 60 70 80
Cu2OAl
2O
3 Al2O
3
Cu
Cu
Inte
nsity (
arb
un
its)
2 (degrees)
Cu
Al2O
3
H2
N2
[22
0]
[60
3]
[20
0]
[11
1]
[11
1]
[11
0]
Fig. 3.1b.1 XRD diffraction patterns of Cu- 15 vol. % Al2O3 microcomposites sintered
conventionally in nitrogen and hydrogen atmosphere

Chapter 3 Results and Discussion
47
3.1b.3.2 Scanning electron microscopy
The microstructure obtained by scanning electron microscope (SEM) gives ample
information about the pore density, distribution, alignment and nature of porosity along with
the matrix-reinforcement bonding. Figs. 3.1b.2, 3.1b.3 & 3.1b.4 depict the microstructure of
Cu-Al2O3 MMC, the white patches showing alumina and the grey area referring to the copper
matrix. The scanning micrographs reveal the clear difference between the bonding of copper
and alumina in N2, Ar and H2 atmospheres. The specimen sintered in hydrogen atmosphere,
(Fig.3.1b.3), shows good copper-alumina interfacial bonding, as compared to the composites
sintered in nitrogen and argon atmosphere, (Figs. 3.1b.2 & 3.1b.4). There exists a
discontinuity in bonding of the alumina particles with the copper matrix in the composites
sintered in argon atmosphere (Fig. 3.1b.4).
Fig. 3.1b.2 SEM micrographs and EDS analysis of Cu-15 vol. % Al2O3 sintered in nitrogen
atmosphere
The proximity and degree of physical attachment of the alumina and copper particles in the
sintered composites can be ranked in order of nitrogen, argon and hydrogen (in increasing
order). It is desirable to remove cuprous oxides from the interface of Cu-Al2O3 composite to
enhance mechanical properties. This fact can be attributed to the high bond strength of
Cu/Al2O3 than those of Cu2O/Al2O3 and Cu/Cu2O [1-3]. This could possibly be attributed to
the formation of cuprous oxide at low temperatures (tentatively 700°C) and possibility of
beginning the decomposition at higher temperatures close to 1000°C.

Chapter 3 Results and Discussion
48
Fig. 3.1b.3 SEM micrographs and EDS analysis of Cu-15 vol. % Al2O3 sintered in hydrogen
atmosphere
The decomposition yields copper and oxygen; in this process the oxygen escapes from the
surface creating voids and expanding them eventually. The creation of voids impedes the
densification causing swelling in addition as the oxygen released from the copper oxide
formed at the copper-alumina interface disturbs the continuity in bonding of copper and
alumina. Ghasemi et al. have reported that in reducing atmosphere the Cu2O particles will be
reduced to Cu and the removal of Cu2O particles from the interface results in the substitution
of Cu2O/Al2O3 and Cu/Cu2O interfaces by a Cu/Al2O3 interface [4]. Chiang et al. [2] and
Sun, Discoll investigations [5] have shown that the strength of Cu/Al2O3 interface is higher
than that of Cu2O/Cu interface. Therefore, an improved alumina-copper contact surface and a
decreasing stress concentration, owing to the absence of Cu2O particles, resulted in an
increase of bond strength. These micrographs also depict the fact that as the alumina content
increases the tendency of embedment of alumina particles in the copper matrix deteriorates.
Elements with less stable oxides than alumina will be reactive only to the extent that they
obtain oxygen from other sources (e.g.: atmosphere) [6].

Chapter 3 Results and Discussion
49
Fig. 3.1b.4 SEM micrographs and EDS analysis of Cu-15 vol. % Al2O3 sintered in argon
atmosphere
The EDS analysis of the specimen (the whole micrograph in Figs. 3.1b.2, 3.1b.3, 3.1b.4) was
selected for EDS analysis) sintered in nitrogen, hydrogen and argon atmosphere is shown in
Figs. which shows a noticeable difference in the oxygen content of the samples. The
elemental composition of oxygen estimated in Cu-15 vol. % Al2O3 MMC sintered in N2, H2
and Ar atmosphere is 21.02, 4 and 12.99% respectively. It is evident from the EDAX values
that a smaller amount of O2 is present in the composite sintered in H2 atmosphere compared
to that in N2 atmosphere. The oxygen content present in the specimens sintered in argon
atmosphere is somewhere in between of that of nitrogen and hydrogen.
3.1b.4 Density and microhardness measurement
The densification of all the specimens has been estimated using Archimedes method. The
micro-hardness values of all the specimens were determined by Vickers hardness tester (Leco
LV 700) applying a load of 0.3 kgf and a dwell time of 1 sec. The readings were recorded
here at four equivalent locations for each specimen.
The densities of all the specimens recorded using Archimedes method shown in; Fig. 3.1b.5
indicates that the composites sintered by conventional method in nitrogen atmosphere show a
slight increase in densification as the alumina content increases. With the number of finer
particles increasing (alumina particles are finer than copper particles), the particle packing

Chapter 3 Results and Discussion
50
and particle–particle contact increases, hence the density of the compacts increases. The
densification process in argon atmosphere is peculiar i.e. it increases up to 10 vol. % of
alumina and then a slight decrease takes place. This could be supported by the fact that as the
amount of alumina increases to 15 % there is some chemical interfacial phenomenon taking
place at this particular composition [7] which can be further confirmed by high resolution
electron microscope. The trend in densification for the compacts sintered in hydrogen
atmosphere is opposite to that obtained in the nitrogen atmosphere, which needs further study
to clarify. The amount of cuprous oxide (Cu2O) formed in H2 atmosphere is less as compared
to that in N2 atmosphere. The composites sintered in nitrogen atmosphere have considerably
low density due to the fact that during decomposition of cuprous oxide, oxygen gets released
expanding the sintered compact by creating voids.
4 6 8 10 12 14 16
84
85
86
87
88
89
90
91
92
93
94
95
% t
he
ore
tic
al
de
ns
ity
Vol. % of alumina
Conventional sintering in N2 atmosphere
Conventional sintering in Ar atmosphere
Conventional sintering in H2 atmosphere
Fig. 3.1b.5 Densification of Cu-Al2O3 microcomposites fabricated using nitrogen, hydrogen
and argon sintering atmospheres by conventional sintering
The hardness studies of microcomposites sintered in nitrogen as well as hydrogen
atmosphere, shown in Fig. 3.1b.6, indicate that the microcomposites sintered in hydrogen
atmosphere show higher hardness values than those sintered in nitrogen atmosphere. The
microcomposites sintered in argon atmosphere possess hardness values close to that of
nitrogen atmosphere.

Chapter 3 Results and Discussion
51
4 6 8 10 12 14 1640
45
50
55
60
65
70
75
80
85
90
95
Mic
roh
ard
ne
ss
(in
HV
0.3
)
Vol. % of alumina
Cu-Al2O
3 sintered in N
2 atm
Cu-Al2O
3 sintered in H
2 atm
Cu-Al2O
3 sintered in Ar atm
Fig. 3.1b.6 Comparison of hardness of Cu-Al2O3 microcomposites fabricated using nitrogen,
hydrogen and argon sintering atmospheres by conventional sintering
The underlying fact can be correlated with the densification study: the density is higher for
the microcomposites sintered in hydrogen atmosphere, complementing the hardness data. The
proposed reason possibly could be the basis of argument in the comparison of hardness
profiles of microcomposites.
3.1b.5 Summary and Conclusions
The Cu-Al2O3 microcomposites were fabricated using conventional sintering route in
nitrogen, argon as well as hydrogen atmospheres. The densification process is more efficient
in the case of hydrogen atmosphere than in nitrogen or argon atmosphere. The microstructure
of the composites sintered in hydrogen atmosphere reveals better matrix-reinforcement
bonding. The problem of poor interfacial bonding caused in the nitrogen and argon
atmosphere has been addressed up to a certain extent using hydrogen atmosphere. The EDS
analysis also proves the same. The formation of Cu2O in the case of sintering in nitrogen as
well as argon atmosphere reduced the extent of bonding of copper with alumina. The density

Chapter 3 Results and Discussion
52
and hardness values are also in accordance to the above fact. The poor bonding between
copper and alumina leads to inefficient load transfer during mechanical loading of the
composite.
References
[1] Y. Yoshino, Role of oxygen in bonding copper to alumina, J. Am. Ceramic Soc. 72 (8)
(1989) 1322-1327.
[2] W.L. Chiang, V.A. Greenhut, D.J. Shanefield, L.A. Johnson, R.L. Moore, Gas-metal
eutectic bonded Cu to Al2O3 substrate mechanism and substrates additives effect study,
Ceramic Eng. Sci. Proc. 14 (9) (2008) 802-812.
[3] K.P. Trumble, Thermodynamic analysis of aluminate formation at Fe/Al2O3 and
Cu/Al2O3, Acta. Metall. Mater. 40 (1992) 105-110.
[4] H. Ghasemi, A.H. Kokabi, M.A.F. Sani, and Z. Riazi, Alumina-copper eutectic bond
strength: contribution of preoxidation, cuprous oxides particles and pores, Mater. Forum.
32 (2008) 90-97.
[5] Y.S. Sun, J.C. Discroll, A new hybrid power technique utilizing a direct copper to
ceramic bond, IEEE. T. Electron. Dev. 23 (8) (1976) 961-967.
[6] A.G. Metcalfe, Academic Press, New York, Interfaces in metal matrix composites Vol. 1,
1974.
[7] A. Upadhyaya, G.S. Upadhyaya, Sintering of copper-alumina composites through
blending and mechanical alloying powder metallurgy routes, Mater. Des. 16 (1) (1995)
41-45.

Chapter 3 Results and Discussion
53
3.2 Evaluation of processing and properties of Cu-Al2O3 and Al-Al2O3
composites by conventional and spark plasma sintering method
3.2.1 Scope and Objectives of the work
Nanocomposites containing 1, 3, 5 and 7 vol. % Al2O3 (average size<50nm) and
microcomposites having compositions 5, 10, 15, 20 vol. % of Al2O3 (average size~10µm)
reinforced in copper and aluminium matrix individually were fabricated by powder metallurgy
route. All the copper-alumina specimens were sintered conventionally at different sintering
temperatures (850°C, 900°C, 1000°C) to study the effect of temperature on the process and
progress of sinterability of the reinforced micro- and nano-particles in the matrix. All the
aluminium-alumina specimens were sintered conventionally at different sintering temperatures
(500°C, 550°C, 600°C). These micro- and nano-composites were characterized using X-ray
diffraction and scanning electron microscopy followed by density, microhardness and wear
measurements. The compression and flexural tests were also carried out in order to investigate
the mechanical behaviour of the micro- and nano-composites for a fixed optimum sintering
temperature. Fractography of the 3-point bend specimens was performed to investigate the
fracture behaviour of the micro- and nano-composites.
In the second part of this chapter, copper-alumina and aluminium-alumina nanocomposites of
0.5, 1, 3, 5, 7 vol. % alumina (average size<50nm) were fabricated using spark plasma sintering
(SPS) technique. Another set of microcomposites containing 1, 5, 20 vol. % of alumina (average
size~10µm) had been fabricated for both copper and aluminium matrices to compare the physical
as well as mechanical attributes of composites with variation of reinforcement particle size.
These micro- and nano-composites have been characterized by X-ray diffraction (XRD),
scanning electron microscopy (SEM), transmission electron microscopy (TEM) followed by
microhardness, nanoindentation hardness and wear measurements.

Chapter 3 Results and Discussion
54
3.2.2 Conventional Sintering
In this section, the physical integrity and sinterability of reinforcement particle in the matrix at
different sintering temperatures was investigated by SEM. Sintering response and microstructure
of Cu-Al2O3(p) and Al-Al2O3(p) composites with the variation of Al2O3 content as well as size
and sintering temperature were investigated extensively. Subsequently, phase analysis,
percentage of theoretical density, microstructure, hardness, compression strength, flexural
strength and failure mode of the composites were elaborately investigated to arrive at a
conclusive particle size – process parameter – microstructure – properties correlation. The
microscopic deformation behaviour of Cu-Al2O3(p) and Al-Al2O3(p) composites were
investigated by 3-point bend test followed by fractography and wear test.
3.2.2.1 Fabrication of composites
3.2.2.1a Copper-alumina composite
Cu powder (Loba Chemie average particle size~11.09μm, purity >99.7%), Al2O3 micropowder
(Sigma Aldrich, average particle size~10 μm) and Al2O3 nanopowder (Sigma Aldrich, average
particle size<50nm) were used to fabricate the Cu- Al2O3 micro- and nano-composites. Cu and
Al2O3 (5, 10, 15 and 20 vol. %) micro-powders were blended using turbula shaker mixer
followed by compaction to 15 mm diameter cylindrical pellets in an electrically operated uni-
axial cold compaction machine (Soil Lab) at an applied pressure of 700 MPa for 2 minutes.
Three sets of specimen were prepared and sintered in a tubular furnace (Naskar) at three different
sintering temperatures (850°C, 900°C, 1000°C) for 1 hour in argon atmosphere. The above
procedure was also followed for Cu and Al2O3 (1, 3, 5, 7 vol. %) nanopowder to fabricate
nanocomposites with the same variation in sintering temperature and conditions.
3.2.2.1b Aluminium-alumina composite
Al powder (Loba Chemie average particle size~22.09μm, purity >99.7%), Al2O3 micropowder
(Sigma Aldrich, average particle size~10 μm) and Al2O3 nanopowder (Sigma Aldrich, average
particle size<50nm) were used to fabricate the Al-Al2O3 micro- and nano-composites. Al and

Chapter 3 Results and Discussion
55
Al2O3 (5, 10, 15 and 20 vol. %) micro-powders were blended using turbula mixer followed by
compaction to 15 mm diameter cylindrical pellets in an electrically operated uni-axial cold
compaction machine (Soil Lab) at an applied pressure of 400 MPa. Three sets of specimen were
prepared and sintered in a tubular furnace (Naskar) at three different sintering temperatures
(500°C, 550°C, 600°C) for 1 hour in argon atmosphere. The above procedure was also followed
for Al and Al2O3 (1, 3, 5, 7 vol. %) nanopowder to fabricate nanocomposites with the same
variation of sintering temperature and conditions.
3.2.2.2 Characterization of the composites
The specimens were characterized using X-Ray diffraction (PANalytical model: DY-1656) CuKα
and scanning electron microscopy (JEOL 6480 LV). The SEM micrographs of the specimen
were obtained by treating the samples with ferric chloride solution (5 g FeCl3 and 50 ml HCl in
100 ml distilled water) for Cu-Al2O3 and Keller’s reagent for Al-Al2O3 as an etchant.
3.2.2.2a Copper-alumina composite
3.2.2.2a.1 X-Ray Diffraction
The X–ray diffraction patterns of Cu-Al2O3(p) microcomposites sintered at 850°C, 900°C and
1000°C sintering temperature are illustrated in Fig. 3.2.1. The X-ray peaks confirm the presence
of Cu, Al2O3 and Cu2O phases. As the vol. % of Al2O3 increases the intensity of the Al2O3 peaks
increases. The formation of Cu2O at 900°C and 1000°C can be attributed to high sintering
temperatures as well as high susceptibility of oxide formation of Cu at high temperatures. With
the increase in Al2O3 content the intensity of Cu2O peak increases.

Chapter 3 Results and Discussion
56
20 30 40 50 60 70 80
1000 C
900 C
Al 2
O3 (
30
0)
Cu
(2
20
)
Cu
2O
(2
20
)
Al 2
O3 (
11
6)
Cu
(2
00
)
Cu
(1
11
)
Cu
2O
(1
11
)
Al 2
O3 (
10
4)
Al 2
O3 (
01
2)
Inte
ns
ity
(A
.U.)
2 (degrees)
850 C
Fig. 3.2.1 X-ray diffraction patterns of Cu–20 vol. % Al2O3 microcomposites sintered at 850°C,
900°C and 1000°C
This can be attributed to the enhanced formation of interface with increasing Al2O3 content
resulting in generation of new surface which gets exposed to oxide formation [1]. Fig. 3.2.2
refers to the X-ray diffraction patterns of the Cu-Al2O3(p) nanocomposites sintered at 850°C and
900°C temperatures. The cuprous oxide peaks are prominent in the diffraction patterns of
nanocomposites than in microcomposites. This may be due to the presence of Al2O3
nanoparticles in Cu matrix leading to higher interface area resulting in higher amount of Cu
matrix exposed for oxidation.

Chapter 3 Results and Discussion
57
20 30 40 50 60 70 80
900 C
850 C
Cu
(2
20
)
Cu
(2
00
)
Cu
(1
11
)
Cu
2O
(1
11
)
Al 2
O3 (
01
2)
Inte
ns
ity
(A
.U.)
2 (degrees)
Fig. 3.2.2 X-ray diffraction patterns of Cu–7 vol. % Al2O3 nanocomposites sintered at 850°C,
and 900°C
3.2.2.2a.2 Scanning electron microscopy
The SEM micrographs give abundant information about the reinforcement distribution, status of
physical intimacy between Cu and Al2O3, clustering and mechanical phenomena like twinning.
The black regions in the SEM micrographs indicate the Al2O3 particles while the white portion
corresponds to the Cu matrix captured in back scattered electron mode. (Fig. 3.2.3 (a, b (SE
mode) & c)) illustrate the distribution of Al2O3 in Cu matrix in the micro-composites sintered at
various sintering temperatures.
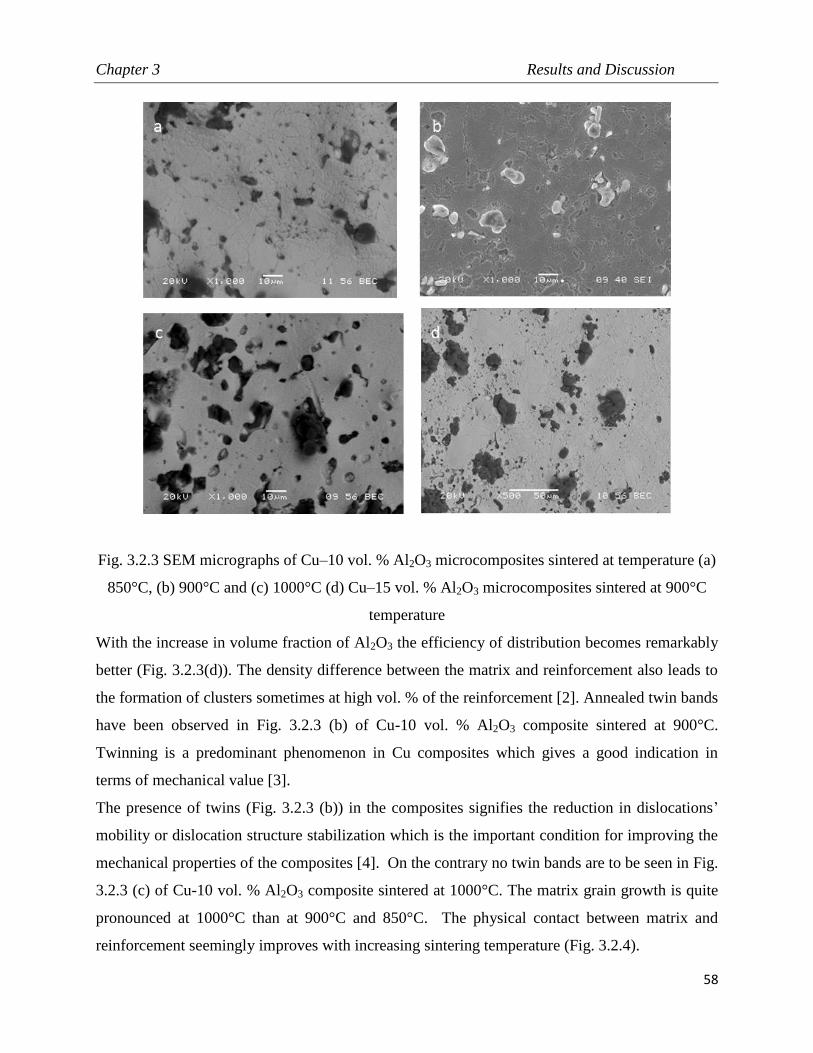
Chapter 3 Results and Discussion
58
Fig. 3.2.3 SEM micrographs of Cu–10 vol. % Al2O3 microcomposites sintered at temperature (a)
850°C, (b) 900°C and (c) 1000°C (d) Cu–15 vol. % Al2O3 microcomposites sintered at 900°C
temperature
With the increase in volume fraction of Al2O3 the efficiency of distribution becomes remarkably
better (Fig. 3.2.3(d)). The density difference between the matrix and reinforcement also leads to
the formation of clusters sometimes at high vol. % of the reinforcement [2]. Annealed twin bands
have been observed in Fig. 3.2.3 (b) of Cu-10 vol. % Al2O3 composite sintered at 900°C.
Twinning is a predominant phenomenon in Cu composites which gives a good indication in
terms of mechanical value [3].
The presence of twins (Fig. 3.2.3 (b)) in the composites signifies the reduction in dislocations’
mobility or dislocation structure stabilization which is the important condition for improving the
mechanical properties of the composites [4]. On the contrary no twin bands are to be seen in Fig.
3.2.3 (c) of Cu-10 vol. % Al2O3 composite sintered at 1000°C. The matrix grain growth is quite
pronounced at 1000°C than at 900°C and 850°C. The physical contact between matrix and
reinforcement seemingly improves with increasing sintering temperature (Fig. 3.2.4).
b

Chapter 3 Results and Discussion
59
Fig. 3.2.4 SEM micrographs of Cu–10 vol. % Al2O3 microcomposites sintered at temperature
1000°C
The SEM micrographs of Cu-Al2O3 nanocomposites illustrate improved distribution of Al2O3 in
the matrix compared to that in microcomposites (Fig. 3.2.5 (a & b)) [5]. The agglomeration of
Al2O3 nanoparticles is quite vigilant in the SEM micrograph. The embedment of Al2O3
nanoparticles in Cu matrix is appreciably intimate than in the microcomposites (Fig. 3.2.5 (b)).
Fig. 3.2.5 FESEM micrographs of Cu–3 vol. % Al2O3 nanocomposites sintered at 1000°C
temperature at (a) 100000X and (b) 200000X maginifcations
The enhanced physical contact of Al2O3 nanoparticles with the matrix can be attributed to the
high atomic diffusivity of the nanoparticles [6]. The stabilization of the surface energy of
nanoparticles is a thermodynamically driven phenomenon; hence it is quite obvious that the
physical adherence of Cu with Al2O3 is better in nanocomposites.
ear debrisa

Chapter 3 Results and Discussion
60
3.2.2.2b Aluminium-alumina composite
3.2.2.2b.1 X-Ray Diffraction
The X-ray diffraction patterns of Al-Al2O3 microcomposites sintered at 600°C is illustrated in
Fig. 3.2.6. The patterns show the presence of Al and Al2O3 peaks. It has been found that no other
intermediate phase is formed during sintering. As reported literature suggests, the formation of
any other phase is not feasible. Hence composites sintered at rest of the sintering temperatures
(i.e. 500°C and 550°C) also shows similar x-ray diffraction patterns.
10 20 30 40 50 60 70 80 90 100
[22
2] A
l
[31
1] A
l
[30
0] A
l 2O
3
[22
0] A
l
[11
6] A
l 2O
3
[02
4] A
l 2O
3
[20
0] A
l[1
13
] A
l 2O
3[1
11
] A
l
[10
4] A
l2O
3
[01
2] A
l 2O
3
20% alumina
5% alumina
1% alumina
Inte
ns
ity
(A
.U.)
2 (degree)
[11
0] A
l 2O
3
[10
(10
)] A
l 2O
3
[21
4] A
l 2O
3
Fig. 3.2.6 X-ray diffraction patterns of Al-Al2O3 microcomposites sintered at 600°C temperature
The x-ray diffraction patterns of Al-Al2O3 nanocomposites sintered at 600°C is shown in Fig.
3.2.7. The peaks for Al2O3 are not distinct because of nanosize effect, i.e. peak broadening and
reduced intensity. The X-ray diffraction patterns show similar peaks for all the microcomposites
and nancomposites at all temperatures.

Chapter 3 Results and Discussion
61
10 20 30 40 50 60 70 80 90 100
Al 2
O3 (
71
2)
Al
(22
2)Al
(31
1)
Al
(22
0)
Al
(20
0)
7% alumina
5% alumina
Inte
ns
ity
(A
.U)
2 (degrees)
1% aluminaA
l (1
11
)
Fig. 3.2.7 X-ray diffraction patterns of Al-Al2O3 nanocomposites sintered at 600°C temperature
3.2.2.2b.2 Scanning electron microscopy
The FESEM micrographs of Al-Al2O3 microcomposites sintered at 600°C temperature is
illustrated in Fig. 3.2.8 (a & b). The distribution of alumina particles is fair in the aluminium
matrix. Fig. 3.2.8 (b) shows good compatibility of alumina microparticles in the matrix. Fig.
3.2.9(a & b) shows distribution of alumina nanoparticles in aluminium matrix. The alumina
nanoparticles are evenly distributed in the matrix and also aid in grain boundary pinning of
aluminium grains. Fig. 3.2.9(b) illustrates good embedment of alumina nanoparticles in the
matrix.

Chapter 3 Results and Discussion
62
Fig. 3.2.8 FESEM micrographs of Al–5 vol. % Al2O3 microcomposite sintered at temperature
600°C captured at (a) 5000X and (b) 30000X magnification
Fig. 3.2.9 FESEM micrographs of Cu–5 vol. % Al2O3 nanocomposites sintered at temperature
600°C captured at (a) 5000X and (b) 100000X magnification
a b
a b

Chapter 3 Results and Discussion
63
3.2.2.3 Mechanical testing
Sintered density of the copper-alumina and aluminium-alumina pellets was determined by
Archimedes method. Microhardness of the specimen was measured by Vickers hardness tester
(Leco Microhardness Tester LM248AT) at a load of 0.3kgf for a dwell time of 5 seconds. The
readings were recorded here at four equivalent locations for each specimen. For compression
test, flexural test and wear test, sintered samples of copper-alumina sintered at 900°C and
aluminium-alumina sintered at 600°C temperature were tested. According to ASTM standard E9-
89 compression test was conducted with the aid of universal testing machine (INSTRON SATEC
series servo-hydraulic machine) with specimen dimensions of 10 mm diameter and 8 mm height
at a strain rate of 1min-1
. Graphite powder was used to minimize friction between the sample and
fixture of compression machine. A reduction of 50% in height was maintained for all the
specimens. The end surfaces were kept normal to the axis of the specimen. A set of specimens
having dimensions of 31.5 x12.7 x 6.3 mm3, in accordance with ASTM standard B925-08 were
fabricated following the above mentioned route for both micro- and nano-composites. A span
length of 26mm and cross-head velocity of 0.5mm/minute was maintained during the flexural
tests which were carried out in universal testing machine (INSTRON-5967). Fractography of the
3-point bend test specimens was carried out by scanning electron microscopy (JEOL 6480 LV).
The copper based micro- and nano-composites which were sintered at 900°C were subjected to
wear test at a load of 20N at a speed of 30 rpm for a time period of 10 minutes. Aluminium-
alumina composites sintered at 600°C temperature were tested at a load of 10N at a speed 30 rpm
for a time period of 10 minutes. The wear tested specimens were examined by scanning electron
microscopy.

Chapter 3 Results and Discussion
64
3.2.2.3a Copper-alumina composite
3.2.2.3a.1 Density
Density measurements were carried out using the Archimedes water immersion method. The
theoretical and sintered density values of all the specimens have been tabulated (Table.3.2.1).
Table 3.2.1 demonstrates that the percentage of theoretical density (calculated by rule of
mixtures) decreases with increasing content of Al2O3 micro- and nano-particles. This may be due
to low density value of Al2O3 particles than that of Cu [7]. With the increase in sintering
temperature from 900oC to 1000
oC the % theoretical density also increases for microcomposites.
Percentage of theoretical density of the microcomposites increases at a temperature of 1000oC as
compared to the 900oC sintering temperature. This may be due to the enhanced viscosity of the
Cu matrix at higher sintering temperature which results in efficient pore filling. In case of
nanocomposites as the interfacial area is more, the detrimental effect of interfacial phenomenon
(de-cohesion, void formation) are more likely to prevail at high sintering temperature as
compared to lower sintering temperature. The maximum density value was observed for the
sintering temperature at 850°C. The rise in sintering temperature triggers enhanced formation of
Cu2O (Fig. 3.2.1) representing that the matrix is more susceptible to oxide formation at higher
sintering temperature.
The pullout of cuprous oxide by evolution of O2 gas (decomposition of cuprous oxide into Cu
and oxygen) creates voids in the matrix and interface expanding the matrix eventually. The
creation of voids in the matrix hinders the densification and impedes the continuity in intimacy
contact of Cu and Al2O3 [1,5]. Hence, the interfacial area being more in nanocomposites the
degree of oxidation is higher thus limiting densification at higher sintering temperatures. Shehata
et al. [8] have investigated the densification% of Cu-5 vol. % Al2O3 at 950°C sintering
temperature (with finer Al2O3) to be 93.9% and our results show 94.47% densification for the
same composition at 1000°C sintering temperature.

Chapter 3 Results and Discussion
65
Sintering Temperature
850˚C 900˚C 1000˚C
Composition Theoritical
density (g/cc)
Sintered density
(g/cc)
Sintered density
(g/cc)
Sintered density
(g/cc)
Pure copper 8.9 8.05 8.4 8.49
Cu- 1%
nanoalumina 8.85 8.31 7.92 7.54
Cu- 3%
nanoalumina 8.75 8 7.55 7.51
Cu- 5%
nanoalumina 8.65 7.61 7.37 7.2
Cu- 7%
nanoalumina 8.55 7.26 7.27 6.97
Cu- 5%
microalumina 8.69 7.62 7.9 8.22
Cu- 10%
microalumina 8.49 7.36 7.64 7.75
Cu- 15%
microalumina 8.14 7.04 7.3 7.35
Cu- 20%
microalumina 7.9 6.7 7.03 6.88
Table 3.2.1 Theoretical and sintered density values of Cu-Al2O3 micro- and nano-composites
processed at different sintering temperatures
3.2.2.3a.2 Microhardness
The hardness of the micro- and nano- composites increases with the increase in Al2O3 content in
the matrix. As Al2O3 is inherently harder than Cu, its presence leads to a higher hardness in the
composite. It was observed from (Table 3.2.2) that by increasing the amount of Al2O3 from 0%
to 20 % in microcomposites, the hardness value increases from 53.7 to 103 HV at a sintering

Chapter 3 Results and Discussion
66
temperature of 900°C. The hardness enhancement is an indication to good physical bonding at
Cu-Al2O3 interface [9].
As the sintering temperature increases from 900˚C to 1000˚C the hardness value decreases which
may be due to matrix grain coarsening [10]. At high volume fraction of reinforcement, surface
area of Al2O3 particles reduces due to clustering which minimizes the effect of grain boundary
pinning resulting in lower hardness value. In case of nanocomposites, nano-Al2O3 which have
high hardness impedes the movement of dislocation during plastic deformation. Nano-Al2O3
restricts the grain growth of the Cu matrix by effective pinning [11]. The hardness of the
composite gets improved with increase in the reinforcement content. The hardness values are
maximum for the composites sintered at 850°C temperature. This can be further complemented
by the density values. The Al2O3 nanoparticles tend to agglomerate which decreases the Orowan
strengthening effect. The hardness values trend represents better hardness of Cu-Al2O3
nanocomposites at low sintering temperature such as 850°C.
The highest hardness values recorded are 109.27 HV for 7 vol. % reinforced Cu-Al2O3
nanocomposites. The density hierarchy complements the hardness trends followed at different
sintering temperatures. The lowest sintering temperature imparts highest density to the
nanocomposites. This can be ascribed to the fact that the interface dimension in the
nanocomposites is high, leading to increased susceptibility for interfacial de-cohesion. Hence at
higher sintering temperature exposed area for oxidation is higher, so the hardness values are
lower due to subsequent decomposition of cuprous oxide and matrix expansion. Tjong et al. [12]
have reported 101 HV Vickers microhardness for Cu-20 vol. %SiC HIPed composite whereas in
our results we have obtained 103 HV Vickers microhardness for Cu-20 vol. % Al2O3
microcomposites with conventional sintering.

Chapter 3 Results and Discussion
67
Sintering Temperature
850°C 900°C 1000°C
Composition
Mean
Hardness
(HV0.3)
Standard
deviation
Mean
Hardness
(HV0.3)
Standard
deviation
Mean
Hardness
(HV0.3)
Standard
deviation
Cu- 1%
nanoalumina 68.52 0.93 53.1 2.12
40.22 0.42
Cu- 3%
nanoalumina 76.87 3.66 88.55 5.04 48.82 3.37
Cu- 5%
nanoalumina 100.35 5.09 52.8 1.83 49.55 0.73
Cu- 7%
nanoalumina 109.27 3.98 85.17 3.12
68.70 2.57
Cu- 5%
microalumina 66.05 4.44
84.97 9.31
67.83 4.20
Cu- 10%
microalumina 72.63 2.20
95.73 11.74
88.19 15.24
Cu- 15%
microalumina 78.38 4.80
102.80 6.36
63.33 8.46
Cu- 20%
microalumina 73.03 2.99
103.43 10.37
60.08 2.43
Table 3.2.2 Mean hardness and standard deviation of copper-alumina nano- and micro-
composites

Chapter 3 Results and Discussion
68
3.2.2.3a.3 Compression Test
The compression test results of Cu-Al2O3 micro- and nano-composites have been illustrated in
(Fig.3.2.10 & 3.2.11). The results indicate that the compression strength decreases with the
increase in Al2O3 content (with exceptions for Cu-15 vol. % Al2O3 microcomposite and Cu-3
vol. % Al2O3 nanocomposite). The compression strength of Cu-Al2O3 microcomposites
decreases with increasing amount of Al2O3 at a strain rate of 1min-1
. Localized softening of the
composite (difference in thermal conductivity of the Cu and Al2O3 constituents) at high volume
fraction of reinforcement during compressive testing may possibly decrease the compressive
strength [13]. The compressive strength for Cu-Al2O3 nanocomposites increases as the Al2O3
content increases till 3 vol. % of Al2O3 followed by downfall of compressive strength values.
The decrease after 3 vol. % may be attributed to the agglomeration of Al2O3 nanoparticles at
higher vol. % of Al2O3. The agglomeration leads to increases in damage density and hence early
fracture. For composites, the presence of particles induces an inhomogeneous elastic strain due
to the elastic modulus mismatch of matrix Cu (117 GPa) and reinforced Al2O3 particle (300
GPa). The elastic strain leads to the generation of high geometrically necessary dislocation
density ρG at the composite interface. For nano particles the increased geometrically necessary
dislocation density ρG leads to a higher work hardening in the matrix, thus leads to a higher
composite flow stress [14]. With increase in reinforcement content nanocomposite tends to fail
through void nucleation, growth, and coalescence in the matrix regions near particles.
The above failure mechanisms lead to the decrease in strain hardening exponent. The
compressive strength of 3 vol. % alumina reinforced copper nanocomposite was recorded to be
around 800 MPa whereas Fathy et al. [15] reported around 600 MPa for 12.5 wt. % Cu-Al2O3
nanocomposite at 10-2
sec-1
strain rate. The composite reinforced with microparticles tends to fail
through particle fracture which leads to decrease in strain hardening exponent.

Chapter 3 Results and Discussion
69
5 10 15 200
200
400
600
800C
om
pre
ss
ive
str
en
gth
(M
Pa
)
Vol. % alumina
Fig. 3.2.10 Compression strength of Cu-Al2O3 microcomposites sintered at 900°C
0 1 2 3 4 5 6 7 80
100
200
300
400
500
600
700
800
Co
mp
res
siv
e s
ten
gth
(M
Pa
)
Vol. % alumina
Fig. 3.2.11 Compression strength of Cu-Al2O3 nanocomposites sintered at 900°C

Chapter 3 Results and Discussion
70
3.2.2.3a.4 3-point bend test
From the 3-point bend test results it was found that the ultimate flexural strength value decreases
with increase in volume fraction of the reinforcement as illustrated in (Fig. 3.2.12 & 3.2.13). The
underlying reason could be the addition of ceramic particles which decreases its ductility
component, hence lowering the ultimate flexural strength. This may be due to the enhancement
in damage sites with increase in reinforcement content.
0 5 10 15 200
50
100
150
200
250
300
350
Fle
xu
ral
str
en
gth
(M
Pa
)
Vol. % of alumina
Pure Cu
Fig. 3.2.12 Plot for ultimate flexural stress (MPa) vs. vol. % of reinforcement content for Cu-
Al2O3 microcomposites
Early fracture possibly occurs by linking the damage in clustered regions, as a result ultimate
flexural strength value decreases. According to Griffith criterion, cracked particle in the clustered
region hinders dislocation strengthening which decreases the ultimate flexural strength value.
Defects such as porosity, macro-, micro-cracks and interface de-union promote premature failure
and ultimate fracture occurs early.

Chapter 3 Results and Discussion
71
0 1 2 3 4 5 6 70
50
100
150
200
250
300
350
Fle
xu
ral
str
en
gth
(M
Pa
)
Vol. % of alumina
Pure Cu
Fig. 3.2.13 Plot for ultimate flexural stress (MPa) vs vol. % of reinforcement content for Cu-
Al2O3 nanocomposites
3.2.2.3a.5 Fractography
Fracture surface of the three-point flexural test microcomposite and nanocomposite specimens
have been shown in (Fig. 3.2.14 (a & b)). The fracture mode for the micro- and nano-composites
is seemingly mixed mode. The dimple fracture surface suggests ductile fracture as the principal
mode of fracture in the microcomposite. Fracture surface of the microcomposite exhibit micro-
void coalescence in the matrix and particle cracking or matrix-particle interface de-cohesion
(Fig. 3.2.14 (a) & 3.2.15). No secondary cracks are observed in the brittle Al2O3 particle which
indicates the premature failure of the composite [16].
Damage is possibly nucleated by interfacial de-cohesion, particle cracking, void growth and
finally coalescence of voids in the matrix around the reinforcement particles. The dimple size
decreases with increase in Al2O3 content. Dimple growth is hindered by the presence of Al2O3
particles. The sharp micro-cracks that develop due to particle fracture can enhance localized
plastic flow within the ductile matrix which aids in failure phenomena such as ductile separation
of the matrix by void growth and shear bands [17].

Chapter 3 Results and Discussion
72
Fig. 3.2.14 Fractographs of Cu-5 vol. % Al2O3 (a) microcomposites (b) nanocomposites sintered
at 900°C
Fig. 3.2.15 Fractograph of Cu-10 vol. % Al2O3 microcomposites sintered at 900°C
The fracture mode for nanocomposites also depict mixed mode, showing quasi-cleavage type of
fracture. The fracture surface of nanocomposites exhibits more of void formation and matrix-
reinforcement debonding. For high volume fraction of reinforcement content, early fracture of
material occurs with minimal plastic deformation. The macroscopic features of the fracture
surface of Cu-Al2O3 nanocomposites indicate nearly flat surface, minimal plastic deformation
preceding the fracture and rapid crack growth accompanied by loud noise [18]. The microscopic
characteristics include faceted fracture surface at certain instances and transgranular fracture of
Cu grains in the nanocomposites.

Chapter 3 Results and Discussion
73
3.2.2.3a. 6 Wear test
The abrasive wear rate is greatly reduced as Al2O3 content in the composite increases (Fig.
3.2.16 & 3.2.17).
Fig. 3.2.16 Plot for wear depth vs. time of Cu-Al2O3 microcomposites with different vol. % of
Al2O3 sintered at 900°C temperature
Al2O3 being inherently harder than Cu, hence the wear resistance of the composites are higher
than native Cu. However, as the number of Al2O3 microparticles increase, the resistance to the
penetration of abrasive particles increases (Hardness increases with increases in the
reinforcement content) and hence the wear depth decreases [8]. The drastic reduction in wear
rate may be attributed by (1) enhancement in hardness of the composite reinforced by Al2O3
particles and (2) greater reduction of direct load contact between the Cu/Al2O3 composite surface
and disk in comparison with pure Cu due to load bearing component action of hard Al2O3
particles [19].

Chapter 3 Results and Discussion
74
Fig. 3.2.17 Plot for wear depth vs. time of Cu-Al2O3 nanocomposites with different vol. % of
Al2O3 sintered at 900°C temperature
The worn out specimens’ SEM micrographs (Fig. 3.2.18(a) & (b)) represents that with increase
in reinforcement content the surface roughness decreases. As nano particles act as obstacle for
the smooth removal of material, the abrasion resistance also increases. The wear mechanisms
operating can be enlisted as grooving and micro-plastic ploughing. The microploughing has
eventually created long grooves, and the removed material has been pushed to the ridges of the
grooves (Fig. 3.2.18(b)). The intensity of microploughing decreases as the Al2O3 content in the
composites increases [15]. Fig. 3.2.18(c) shows microcrack formation in the nanocomposite
during wear.

Chapter 3 Results and Discussion
75
Fig. 3.2.18 SEM images of worn-out surfaces of (a) Cu-5 vol. % Al2O3 (microcomposite) (b) Cu-
10 vol. % Al2O3 (microcomposite) (c) Cu-1 vol. % Al2O3 (nanocomposite)
3.2.2.3b Aluminium-alumina composite
3.2.2.3b.1 Density
Densification of aluminium-alumina micro- and nano-composites at different sintering
temperatures were recorded and plotted in Fig. 3.2.19 & 3.2.20. It has been found that the % of
theoretical density decreases with increasing alumina content in both cases. As alumina is hard
and brittle; addition of alumina decreases compressibility in both composites. For the same
composition nanocomposites show lower density than microcomposites. The reason is higher
degree of agglomeration of nanoparticles than micron-size particles leads to lesser densification.
The density of samples sintered at higher temperature exhibits higher sinterability and increased
pore filling. These events lead to higher density at higher sintering temperature. From the
densification plots for both micro- and nano-composites it is observed that densification
behaviour does not follow any trend with sintering temperature. The nanocomposites with higher
content of alumina at sintering temperature of 600°C show lower value of density, as
agglomeration of alumina nanoparticles takes place to a higher degree impeding effective
densification. The nanocomposites with 5 and 7 vol% of alumina show high density for sintering
temperature of 550°C, because lower temperature leads to lower degree of clustering compared
to higher temperatures.
(a) (c) (b)

Chapter 3 Results and Discussion
76
4 6 8 10 12 14 16 18 20 22
86
88
90
92
94
96
% t
he
ori
tic
al
de
ns
ity
Vol. % alumina
5000C
5500C
6000C
Fig. 3.2.19 Densification plots of Al-Al2O3 microcomposites sintered at different temperatures
1 2 3 4 5 6 7
86
88
90
92
94
96
98
% t
he
ore
tic
al
de
ns
ity
Vol. % alumina
500o
C
550o
C
600o
C
Fig. 3.2.20 Densification plots of Al-Al2O3 nanocomposites sintered at different temperatures

Chapter 3 Results and Discussion
77
3.2.2.3b.2 Microhardness
Fig. 3.2.21 reveals higher microhardness for Al-Al2O3 microcomposite samples sintered at
lowest sintering temperatures. Microcomposites with higher alumina content show higher
hardness due to higher pinning effect of alumina particle, hence higher resistance to indentation.
The samples sintered at higher sintering temperature i.e. 600°C show lower microhardness due to
grain coarsening at higher temperatures. Fig. 3.2.22 shows Al-Al2O3 nanocomposites sintered at
low sintering temperature possessing high hardness for lower content of alumina. It has been
observed that the samples sintered at 600°C show higher hardness than other temperatures due to
higher sinterability and increased pore filling.
4 6 8 10 12 14 16 18 20 2233
34
35
36
37
38
39
40
41
42
43
Mic
roh
ard
ne
ss
(H
V0
.3)
Vol.% alumina
6000C
5500C
5000C
Fig. 3.2.21 Microhardness plots of Al-Al2O3 microcomposites sintered at different temperatures

Chapter 3 Results and Discussion
78
1 2 3 4 5 6 738
40
42
44
46
48
50
52
54
56
58
60
62
Mic
roh
ard
ne
ss
(H
V0
.3)
Vol.% alumina
600 C
550 C
500 C
Fig. 3.2.22 Microhardness plots of Al-Al2O3 nanocomposites sintered at different temperatures
3.2.2.3b.3 Compression Test
Compressive strength of Al-Al2O3 microcomposites have been shown in Fig. 3.2.23. The
compressive strength of 5, 10, 15, 20 vol. % of alumina revolve around the same values, the
highest value being for 5 vol. % alumina. The higher alumina content reduces the ductility of the
composite leading to premature cracking of samples during compressive loading. The
compressive strength of 5 vol. % alumina microcomposites is 240MPa. Compressive strength of
nanocomposites is illustrated in Fig. 3.2.24 which demonstrates that both 1 vol. % and 5
vol. % alumina reinforced nanocomposite possess high strength than other compositions. The
higher content of nanoparticles induce brittleness and lead to cracking of samples before bearing
the compressive load, hence the strength decreases. The premature cracking of higher content of
alumina causes the incomplete load bearing of nanocomposites. The compressive strength of
nanocomposite is higher than microcomposites as lower compositions of nanocomposites
possess same strength as higher compositions of microcomposites. The lowering of strength for 3
and 7 vol. % alumina reinforced nanocomposites is due to high surface area of nanoparticles and
agglomeration which gives rise to early breakage of samples.
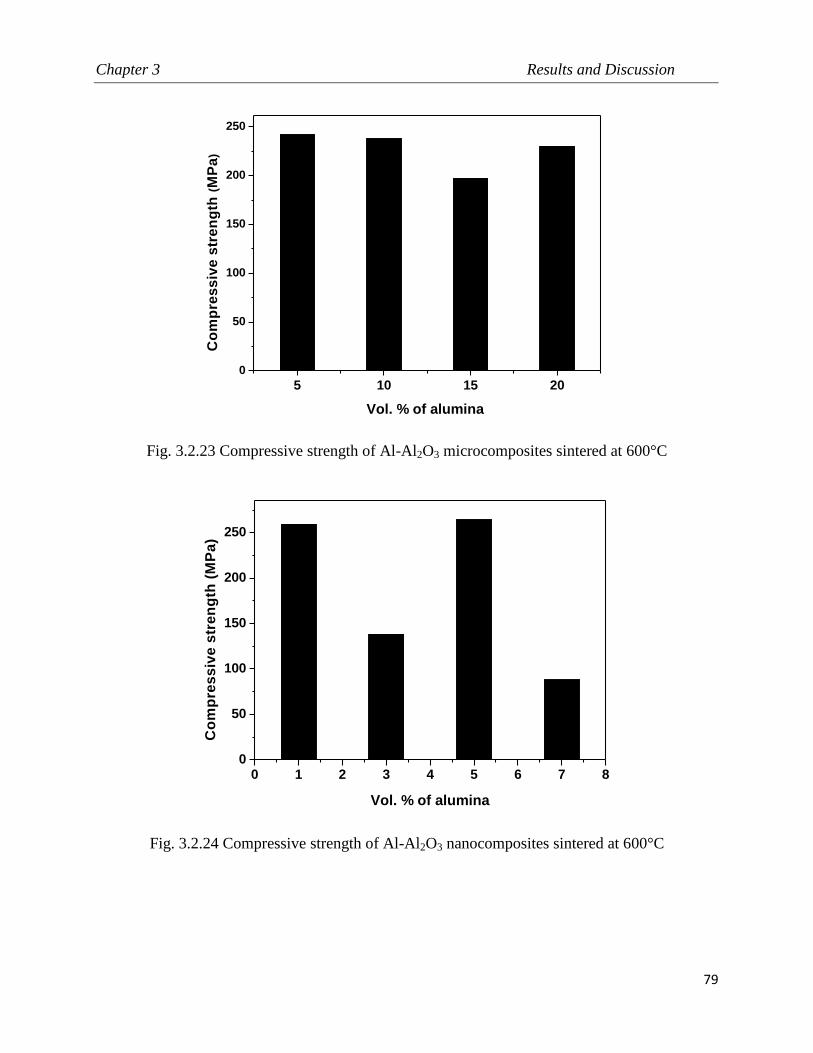
Chapter 3 Results and Discussion
79
5 10 15 20
0
50
100
150
200
250
Co
mp
res
siv
e s
tre
ng
th (
MP
a)
Vol. % of alumina
Fig. 3.2.23 Compressive strength of Al-Al2O3 microcomposites sintered at 600°C
0 1 2 3 4 5 6 7 80
50
100
150
200
250
Co
mp
res
siv
e s
tre
ng
th (
MP
a)
Vol. % of alumina
Fig. 3.2.24 Compressive strength of Al-Al2O3 nanocomposites sintered at 600°C

Chapter 3 Results and Discussion
80
3.2.2.3b.4 3-point bend test
The flexural tests of microcomposites reveal that the former shows low flexural strength than
pure aluminium strength. The flexural test is a combination of tensile and compressive tests,
hence gives us a combined idea of the mechanical strength of the composites. The
microcomposites possess low strength than pure aluminium because the alumina particles act as
defects during flexural loading. During flexural loading the microvoids formed in the vicinity of
alumina particles leading to the coalescence of the same. Flexural strength of 10 vol. % alumina
reinforced microcomposite is high among all the compositions, showing that it is the optimum
composition (Fig. 3.2.25). Flexural strength of nanocomposites is also lower than pure
aluminium following the same principle as described above. Fig. 3.2.26 shows that 3 vol. %
alumina reinforced nanocomposite possess high flexural strength compared to other
compositions proving it to be an optimum composition among nanocomposites. The flexural
strength of nanocomposites containing low percent of alumina is same as microcomposites
having high high content of alumina. The 5 vol. % alumina reinforced nanocomposite possess
flexural strength lower than 3 vol. % alumina composition because higher alumina nanoparticles
content leads to clustering of nanoparticles and lowering of strength due to increased density of
defects.
0 5 10 15 200
20
40
60
80
100
120
140
Fle
xu
ral
str
en
gth
(M
Pa
)
Vol. % of alumina
Pure Al
Fig. 3.2.25 Plot of flexural strength vs. vol. % of reinforcement of Al-Al2O3 microcomposites
sintered at 600°C.

Chapter 3 Results and Discussion
81
0 1 2 3 4 50
20
40
60
80
100
120
140
Fle
xu
ral
str
en
gth
(M
Pa
)
Vol. % of alumina
Pure Al
Fig. 3.2.26 Plot of flexural strength vs. vol. % of reinforcement of Al-Al2O3 nanocomposites
sintered at 600°C
3.2.2.3b.5 Fractography
Fig. 3.2.27(a & b) illustrates SEM fractographs of Al-5 vol. % alumina microcomposite and
nanocomposite respectively sintered at 600°C. The fracture surface shows intergranular fracture,
as aluminium is a soft and ductile metal, the grain boundaries are harder compared to the interior
of grains. The nanocomposites show pores on the fracture surface. These pores symbolize the
release of trapped gas formed during sintering. Alumina particles have been covered by
aluminum particles, hence the contrast is not visible in the fractographs. The nanocomposite’s
fractograph reveal that there is higher oxide formation of matrix particles in nanocomposites than
microcomposites as suggested by increased number of pores. It has been observed that the
microcomposites show dimpled structure representing higher ductility than nanocomposites.

Chapter 3 Results and Discussion
82
Fig. 3.2.27 SEM fractographs of Al-5 vol. % Al2O3 (a) microcomposite (b) nanocomposite
sintered at 600°C
3.2.2.3b.6 Wear test
Fig.3.2.28 & 3.2.29 show wear depth vs. sliding time for Al-Al2O3 micro and nanocomposites
sintered at 600°C. The general trend here is that the wear depth decreases with alumina content
in both cases. Al2O3 being hard and brittle, impart high wear resistance i.e. the wear depth
decreases. As the number of Al2O3 particles increases the wear indenter encounters Al2O3
particles more than the soft matrix. For the same composition it is found that the nanocomposite
(~6µm) reflects lower wear depth than microcomposite (~10µm) due to higher hardness. The
nanocomposites having low alumina percentage show almost equal wear depth as the
microcomposites containing higher amount of alumina
b b

Chapter 3 Results and Discussion
83
0 100 200 300 400 500 600
0
2
4
6
8
10
12
we
ar
de
pth
(m
)
time(s)
5 vol% microalumina
15 vol% microalumina
20 vol% microalumina
Fig. 3.2.28 Wear depth vs. time plot of Al-Al2O3 microcomposites sintered at 600°C
.
0 100 200 300 400 500 6000
2
4
6
8
10
12
we
ar
de
pth
(m
)
time(s)
1 vol% nanoalumina
3 vol% nanoalumina
5 vol% nanoalumina
7 vol% nanoalumina
Fig. 3.2.29 Wear depth vs. time plot of Al-Al2O3 nanocomposites sintered at 600°C

Chapter 3 Results and Discussion
84
3.2.3 Spark Plasma Sintering
This investigation focuses on the fabrication of copper-alumina microcomposites and
nanocomposites by spark plasma sintering technique. The subsequent microstructural studies and
mechanical properties assessment and correlation helps in understanding the science and
technology of microcomposites and nanocomposites reflecting each ones dominance on another
on every aspect. The characterization of micro- and nano-composites using X-ray diffraction,
scanning electron microscopy and transmission electron microscopy followed by microhardness,
nanohardness and wear measurements have been studied.
3.2.3.1. Fabrication of Composites
3.2.3.1a Copper-alumina composite
Copper (Loba Chemie, purity > 99.7%, average size~11.09µm) and alumina (Sigma Aldrich,
average size~10µm (micro) and <50 nm (nano) both having purity > 99.7%) powders were
blended separately in turbula shaker mixer. The compositions used for fabricating
nanocomposites were 0.5, 1, 3, 5, and 7 volume % of alumina nanoparticles in copper matrix.
Another set of specimens having compositions of 1, 5, 20 volume % micron size alumina were
used to synthesize microcomposites. The micro- and nano-composites were fabricated via spark
plasma sintering (SPS) (DR SINTER LAB SPS Syntex INC, model: SPS-515S, Kanagawa,
Japan) method at a temperature of 700ºC maintaining a soaking time of 5 minutes at a pressure
of 50 MPa. The heating rate for the whole process was maintained at 80ºC/minute.
3.2.3.1b Aluminium-alumina composite
The as-received aluminium (Loba Chemie, purity > 99.7%, average size~22.09µm) and alumina
(Sigma Aldrich, average size~10µm and <50 nm) (surface area: 40 m2/g for alumina
nanopowder) powders were mixed and blended separately using agate mortar for 60 minutes to
ensure homogeneous mixing. Nanocomposites containing 0.5, 1, 3, 5 and 7 vol. % of Al2O3
(average size<50nm) were fabricated by blending the matrix and reinforcement powders,

Chapter 3 Results and Discussion
85
followed by spark plasma sintering (SPS) (DR SINTER LAB SPS Syntex). Another set of
specimens having compositions of 1, 5, 20 volume% were chosen to fabricate microcomposites.
SPS was carried out at a temperature of 500ºC and an applied pressure of 50MPa for 5 minutes
under vacuum with a heating rate of 80ºC/minute for nanocomposites as well as the
microcomposites.
3.2.3.2 Characterization of Composites
The specimens were characterized by X-Ray diffraction (PANalytical model: DY-1656) with
CuKα radiation, scanning electron microscopy (JEOL JSM 6480 LV) and transmission electron
microscopy (TECNAI G2 20S-TWIN) equipped with an energy dispersive X-Ray analyzer. The
sample preparation for conducting TEM study was done by punching 3 mm discs from the
sample whose thickness had been reduced to 100µm. The discs were then dimpled to around
below 10µm and then ion milled for 1 hour for perforation.
3.2.3.2a Copper-alumina composite
3.2.3.2a.1 X-Ray Diffraction
To study phase evolution during composite fabrication by SPS process, X-ray diffraction was
conducted. The XRD patterns (Fig. 3.2.30 & 3.2.31) confirm the presence of Cu, Al2O3 and
CuAlO2 phases for both micro and nanocomposites. The copper, alumina and CuAlO2 peaks
have also been indexed in the X-ray diffraction patterns. The formation of CuAlO2 in Cu-Al2O3
system has been reported by many groups such as Trumble et al. [20], Seager et al. [21], Kim et
al. [22] and Fathy et al. [15]. The thermodynamics of the interaction between copper and alumina
point towards the fact that the formation of CuAlO2 is feasible in the present processing
conditions [23].

Chapter 3 Results and Discussion
86
20 30 40 50 60 70 80
Cu
(2
20
)
Al 2
O3 (
60
3)C
u (
20
0)
Cu
(1
11
)
Inte
ns
ity
(A
.U.)
2 degree)
Cu
AlO
2(1
01
)
Fig. 3.2.30 XRD pattern of Cu-7 vol. % Al2O3 nanocomposite sintered by SPS
The formation of CuAlO2 as a function of temperature at the Cu(ss)/Al2O3 interface can be
represented as [20]
[at. % OCu(ss)] = exp (-18100/T +9.1) (700-1050°C) (1)
The formation of CuAlO2 starts at the isothermal sintering time, i.e. after the formation of Cu2O
the same reacts with alumina to form the aluminate.
Cu2O+ Al2O3 (Heated) → 2CuAlO2 [24] (2)

Chapter 3 Results and Discussion
87
20 30 40 50 60 70 80
(10
10
)Cu
AlO
2
(10
1)C
uA
lO2
(11
6)A
l 2O
3
(10
4)A
l 2O
3
(01
2)A
l 2O
3
(22
0)C
u(20
0)C
u
(11
1)C
u
Inte
ns
ity
(A
.U.)
(degree)
(01
2)
Cu
AlO
2
Fig. 3.2.31 XRD pattern of Cu-20 vol. % Al2O3 microcomposite sintered by SPS
3.2.3.2a.2 Scanning electron microscopy
Fig. 3.2.32 & 3.2.33 show the SEM micrographs of nanocomposites and microcomposites
respectively. The distribution of nanoparticles is better compared to microparticles in the copper
matrix [5].
Fig. 3.2.32 SEM micrograph of Cu-7 vol. % Al2O3 nanocomposite sintered by SPS

Chapter 3 Results and Discussion
88
There are several pores visible on the grain boundary of the copper grains in the
microcomposites which indicate the poor intermixing of matrix and reinforcement powder
particles in the microcomposites compared to the nanocomposites. The intermixing of alumina
nanoparticles and the copper matrix particles is quite intimate and the alumina particles have
penetrated into the voids of copper-copper particle contact unlike the micron sized alumina
particles. The difference in the intermixing and embedment of the micron size particle and the
nano sized particle is visible in the SEM micrographs.
Fig. 3.2.33 SEM micrograph of Cu-5 vol. % Al2O3 microcomposite sintered by SPS
The copper and alumina interaction has also aided in the formation of a new phase i.e. CuAlO2
which has been identified from XRD and TEM analysis. Diminished grain growth of copper can
be observed (Fig. 3.2.32) in the areas where the distribution is proficient due to the pinning effect
of the nanosized alumina particles [25]. In nanocomposites, as the interparticle distance
decreases, interaction between the dislocations and particles increases, and this results in faster
dislocation multiplication. The matrix-reinforcement bonding seems to have improved in the
nanocomposites sintered by SPS. The reason could be anticipated as the high surface energy of
the particles compelling them to compensate their thermodynamic instability by efficient
bonding.
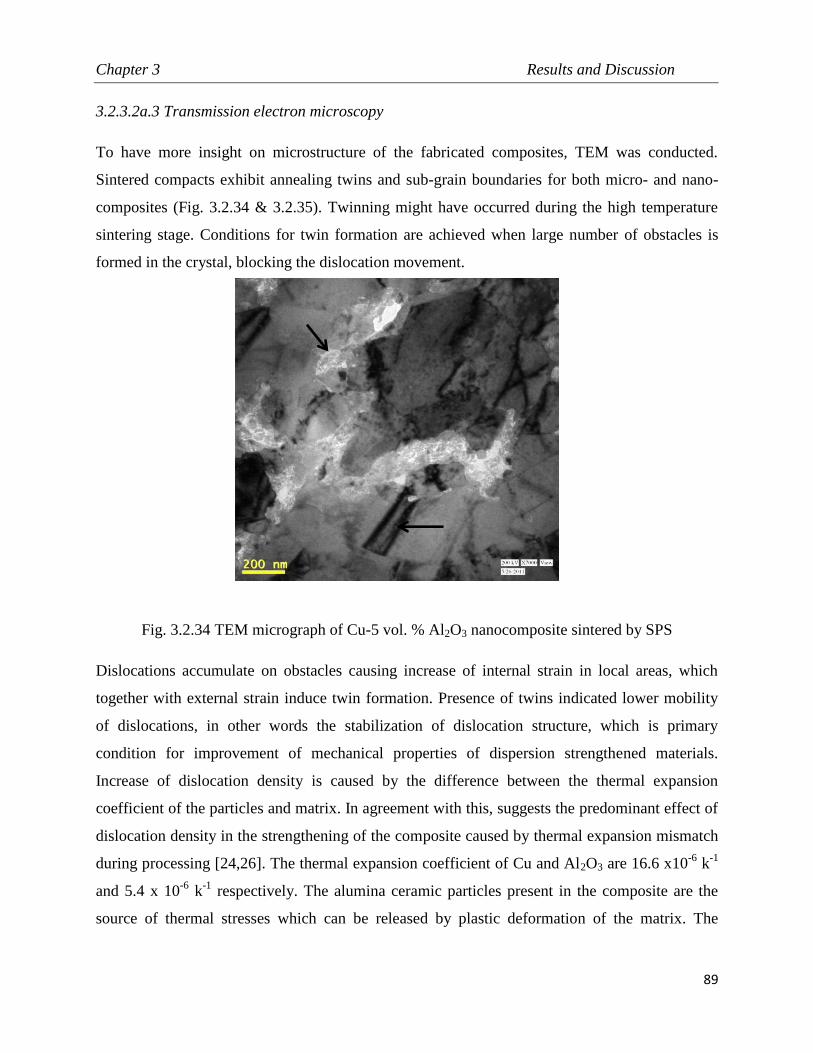
Chapter 3 Results and Discussion
89
3.2.3.2a.3 Transmission electron microscopy
To have more insight on microstructure of the fabricated composites, TEM was conducted.
Sintered compacts exhibit annealing twins and sub-grain boundaries for both micro- and nano-
composites (Fig. 3.2.34 & 3.2.35). Twinning might have occurred during the high temperature
sintering stage. Conditions for twin formation are achieved when large number of obstacles is
formed in the crystal, blocking the dislocation movement.
Fig. 3.2.34 TEM micrograph of Cu-5 vol. % Al2O3 nanocomposite sintered by SPS
Dislocations accumulate on obstacles causing increase of internal strain in local areas, which
together with external strain induce twin formation. Presence of twins indicated lower mobility
of dislocations, in other words the stabilization of dislocation structure, which is primary
condition for improvement of mechanical properties of dispersion strengthened materials.
Increase of dislocation density is caused by the difference between the thermal expansion
coefficient of the particles and matrix. In agreement with this, suggests the predominant effect of
dislocation density in the strengthening of the composite caused by thermal expansion mismatch
during processing [24,26]. The thermal expansion coefficient of Cu and Al2O3 are 16.6 x10⁻⁶
k-1
and 5.4 x 10⁻⁶
k-1
respectively. The alumina ceramic particles present in the composite are the
source of thermal stresses which can be released by plastic deformation of the matrix. The

Chapter 3 Results and Discussion
90
thermal stresses during the production process could generate dislocations in the matrix and
inside the particles that is clearly visible in the alumina particles [27].
Fig. 3.2.35 TEM micrograph of Cu-5 vol. % Al2O3 microcomposite sintered by SPS
The TEM micrographs represent nano twinning in case of 5 vol. % reinforced nanocomposite. A
milky white appearance of the new phase formed is quite prominent in Fig. 3.2.34. The
interaction of alumina nanoparticles is far more proficient than the alumina microparticles which
can be realized from the amount of CuAlO2 formed in the TEM micrographs. The difference in
contrast in the TEM micrographs suggests the presence of Cu (grey), Al2O3 (black) and CuAlO2
(white region). Formation of CuAlO2 can also be anticipated due to its presence in the proximity
with the alumina particles. The formation of intermediate phase is highly concentrated around
the alumina particles. The XRD study also supports the presence of CuAlO2.
Twin

Chapter 3 Results and Discussion
91
3.2.3.2b Aluminium-alumina composite
3.2.3.2b.1 X-ray diffraction
The X-Ray diffraction patterns obtained from the SPS sintered compacts of the Al-Al2O3
nanocomposites reveal aluminium as well as alumina phases. The X-Ray diffraction patterns of
the Al-Al2O3 microcomposites and nanocomposites are shown in Fig. 3.2.36 & 3.2.37
respectively. The patterns depict small peaks of alumina present in the X-Ray patterns of
nanocomposites (the combined effect of peak broadening and low intensity peaks of alumina
nanoparticles) whereas in case of microcomposites, the alumina peaks are quite distinct and
clear.
20 30 40 50 60 70 80 90
(21
4)
Al 2O
3
(12
2)
Al 2O
3
(11
0)
Al 2O
3
(11
3)
Al 2O
3
(01
2)
Al 2O
3
(10
(10
)) A
l 2O
3
(30
0)
Al 2O
3
(11
6)
Al 2O
3
(02
4)
Al 2O
3
(10
4)
Al 2O
3
(22
2)A
l(31
1)A
l
(20
0)A
l
(22
0)A
l
Inte
ns
ity
(A
.U.)
2 (degrees)
1%
5%
20%
(11
1)A
l
Fig. 3.2.36 XRD patterns of Al-Al2O3 microcomposites sintered using SPS
The XRD patterns confirm that no new phase was formed in the nano- and microcomposites.
The alumina peaks are distinct in the 20 vol. % reinforced Al-Al2O3 microcomposite due to
higher amount of alumina.

Chapter 3 Results and Discussion
92
30 40 50 60 70 80 90
(22
2)A
l
(31
1)A
l
(22
0)A
l(20
0)A
l
Inte
ns
ity
(a
rb u
nit
s)
2 (degrees)
(11
1)A
l
1%
5%
7%
(60
3)
Al 2
O3
Fig. 3.2.37 XRD patterns of Al-Al2O3 nanocomposites sintered using SPS
3.2.3.2b.2 Scanning electron microscopy
The back scattered scanning electron micrographs of Al-Al2O3 nanocomposites and
microcomposites are illustrated in Fig. 3.2.38(a), (b) & (c) indicating grey and black regions
which correspond to the aluminum and alumina respectively confirmed by EDS analysis. Fig.
3.2.38 (a) shows the EDS analysis of the black region in the figure depicted by arrow mark. The
alumina nanoparticles are present in the interspaces of aluminium particles. The distribution of
reinforcement particles in Al-Al2O3 nanocomposites is proficient than in the case of
microcomposites. The well-established mathematical relation (Eq. (2)) which explains the
requirement of uniform dispersion of reinforcement in the matrix
(3)
Where λ is distance apart from the reinforcements, f is the fractional volume of reinforcement; r
is the radius of the particles (assuming them to be spherical). The SEM micrographs of the
nancomposites suggest presence of network of the alumina particles within the intergranular
spaces of the aluminium matrix. The micrographs connote the intimate level of mixing of matrix

Chapter 3 Results and Discussion
93
and reinforcement powders in the nanocomposites which is seemingly due to the aluminium-
alumina bonding in the composite. The proximate level of intermixing of alumina nanoparticles
in the aluminium matrix has supposedly given rise to such a microstructure. A striking difference
regarding the mode of interaction of alumina nanoparticle and alumina microparticle with the
aluminium matrix individually can be realized from the micrographs. The differential interaction
of nanoparticles and microparticles could be implicated to the reason of clustering in composites,
the closer the ratio of reinforcement particle size to the matrix particle size (PSR) is to 1, the
lower is the possibility of clustering [28]. The clustering which is apparently visible in the case
of microcomposite is due to the deviation of the ratio from the value 1.
Fig. 3.2.38 SEM micrographs of (a) Al-5vol. % Al2O3 nanocomposite, (b) Al-7vol. % Al2O3
nanocomposite, (c) Al-5vol. % Al2O3 microcomposite sintered using SPS
In nanocomposites, the reinforcement particle size is much smaller than the matrix particle size,
and hence the inter-particle voids created by the consolidation of aluminium particles have been
occupied by the alumina nanoparticles. The conspicuous bonding of nanoparticles with the
matrix particles can also be due to the fact that the atomic diffusivity of the nanoparticles is quite
c
b

Chapter 3 Results and Discussion
94
high than the micron-sized particles [6]. The accommodation of alumina nanoparticles is better
in the aluminium matrix i.e. the alumina nanoparticles have occupied the interparticle spaces in
the aluminium matrix which is not the case with microcomposites. The grain growth in the
microcomposites is likely to occur to a greater extent than in nanocomposites. This observation
could be attributed to the inability of the alumina microparticles to pin down the grain growth at
a larger scale. The thermal stability against grain growth observed in the nanocomposites can be
ascribed to the presence of alumina nanoparticles which are expected to hinder the grain
boundary movement via Zener pinning [29].
Incipient fusion phenomenon probably has occured which can be observed in the
nanocomposites in between the intergranular spaces of aluminium, which can be ascribed to
plasma formation at interparticle contacts at the time of sintering. The pores present in the
nanocomposites are sparse in number which can be observed in SEM micrograph i.e. Fig. 3.2.38
(a) & (b) as compared to the microcomposites shown in Fig. 3.2.38 (c). The poor bonding of
aluminium and alumina nanoparticles has been reported in literature by conventional sintering
[30]. The distribution of alumina in nanocomposites is better than in the microcomposites. The
improved bonding between the matrix and reinforcement by spark plasma sintering method can
be attributed to the pressure assisted sintering as well as the grain boundaries rendered clean in
the process of SPS.
Olevsky et al. [31] have investigated the impact of thermal diffusion in spark plasma sintering
which reflects that the non-uniform distribution of temperature causes local melting at the
interparticle contacts. Munir et al. [32] have demonstrated higher diffusion co-efficient for spark
plasma sintering. Xie et al. [33] have studied the spark plasma sintering of aluminium powders
and have reported the presence of a clean interface from high resolution TEM experiments. In
the present investigation, clean interface (absence of interphase or reaction products) and a
reasonable amount of physical contact of the alumina particles to the aluminum particles has also
been observed. The dispersion of reinforcements in the matrix is the blue print of the degree of
strengthening rendered by the reinforcement particles.
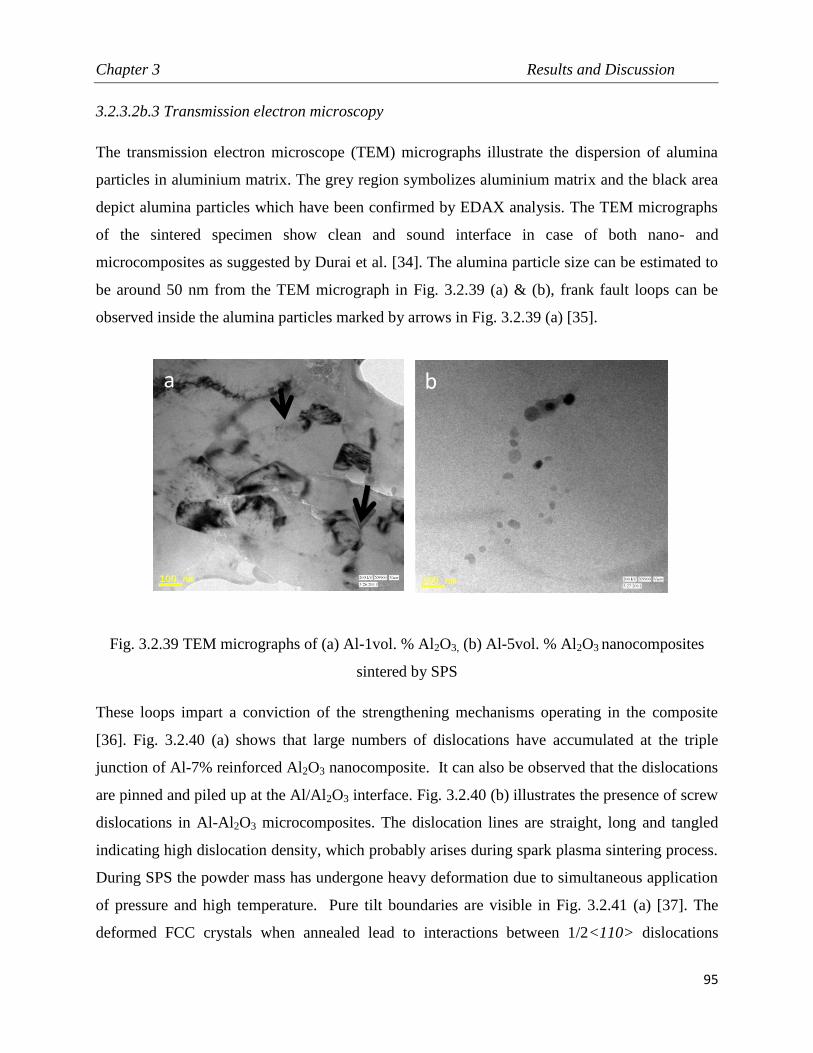
Chapter 3 Results and Discussion
95
3.2.3.2b.3 Transmission electron microscopy
The transmission electron microscope (TEM) micrographs illustrate the dispersion of alumina
particles in aluminium matrix. The grey region symbolizes aluminium matrix and the black area
depict alumina particles which have been confirmed by EDAX analysis. The TEM micrographs
of the sintered specimen show clean and sound interface in case of both nano- and
microcomposites as suggested by Durai et al. [34]. The alumina particle size can be estimated to
be around 50 nm from the TEM micrograph in Fig. 3.2.39 (a) & (b), frank fault loops can be
observed inside the alumina particles marked by arrows in Fig. 3.2.39 (a) [35].
Fig. 3.2.39 TEM micrographs of (a) Al-1vol. % Al2O3, (b) Al-5vol. % Al2O3 nanocomposites
sintered by SPS
These loops impart a conviction of the strengthening mechanisms operating in the composite
[36]. Fig. 3.2.40 (a) shows that large numbers of dislocations have accumulated at the triple
junction of Al-7% reinforced Al2O3 nanocomposite. It can also be observed that the dislocations
are pinned and piled up at the Al/Al2O3 interface. Fig. 3.2.40 (b) illustrates the presence of screw
dislocations in Al-Al2O3 microcomposites. The dislocation lines are straight, long and tangled
indicating high dislocation density, which probably arises during spark plasma sintering process.
During SPS the powder mass has undergone heavy deformation due to simultaneous application
of pressure and high temperature. Pure tilt boundaries are visible in Fig. 3.2.41 (a) [37]. The
deformed FCC crystals when annealed lead to interactions between 1/2<110> dislocations
a b

Chapter 3 Results and Discussion
96
resulting in the formation of low-energy networks and sub-boundaries. This refers to: when
dislocations’ motion is impeded from moving in their slip plane by interacting with other
dislocations, sub-boundaries, and others, the strain energy can be minimized by the dislocations
climbing out of slip planes where they align in low energy configurations, e:g: cell walls. The
high dislocation density at the sub-boundaries can be attributed to the large difference in thermal
conductivity of aluminium (24 x 10-6
/°C) and alumina (7.92 x 10⁻⁶
/°C). Cooling of the composite
furnishes limited deformation of aluminium inhibited by alumina particles, hence high
dislocation density is visible at the boundaries [38].
Fig. 3.2.40 TEM micrograph of (a) Al-7vol. % Al2O3 nanocomposite, (b) Al-5vol. % Al2O3
microcomposite sintered by SPS
Fig. 3.2.41 (b) shows a stacking fault [35] present in the microcomposite, which could be
explained as follows: the intermixing of alumina microparticles in the matrix is inappreciable;
therefore there may be formation of some sessile dislocations during packing of matrix and
microparticle powders. As dislocation is a temperature driven phenomenon, the sessile
dislocations formed must have resulted in stacking fault at the time of sintering [36].
a b

Chapter 3 Results and Discussion
97
Fig. 3.2.41 TEM micrograph of (a) Al-7vol. % Al2O3 nanocomposite, (b) Al-5vol. % Al2O3
microcomposite sintered by SPS
During sintering, the energy supplied by the combined elasto-plastic (compression) and electro-
magnetic (discharge) processes imparts sufficient mobility for movement of edge dislocations
[39]. A sessile dislocation can move only by the diffusion of atoms or vacancies to or from the
fault. The width of the stacking fault ribbon is directly proportional to the stacking fault energy
which is quite prevalent in case of aluminium.
3.2.3.3 Mechanical Testing
The density of the composites was measured using Archimedes method. The elastic modulus of
nanocomposites was determined using nanoindentation (Fisher-Cripps UMIS) technique
applying a load of 20mN for a dwell time of 10 seconds. The readings were recorded here at ten
equivalent locations for each specimen and the closest values were considered. The micro-
hardness values of the microcomposites were determined by Vickers hardness tester (Leco LV
700) applying a load of 0.3 kgf and a dwell time of 5 seconds. The readings were recorded here
at four equivalent locations for each specimen. Sliding wear tests were performed using a ball on
plate type wear machine (DUCOM TR-208-M1) using hardened steel ball (SAE 52100) indenter
a b

Chapter 3 Results and Discussion
98
of 2 mm diameter, with an applied load of 2 Kgf and time period of 15 minutes at a speed of 30
rpm. The hardened steel ball slides unidirectionally on fixed samples. The tests were carried out
in laboratory atmosphere at a relative humidity of around 50-60% and temperature of about
25 C. The wear depth vs time data was obtained from the inbuilt WINCOM software in the wear
machine. The worn surfaces were characterized by SEM.
3.2.3.3a Copper-alumina composite
3.2.3.3a.1 Density and microhardness study
The density and hardness values for both micro and nanocomposites are tabulated in Table 3.2.3.
The density values for 1 and 5 vol. % alumina reinforced microcomposites are 95.25 and 95.39%
of theoretical density, whereas for same composition of nanocomposites density values are
93.22% and 92.17% of theoretical density. It is observed from the table that density value is
lower in case of nanocomposites than microcomposites for the same composition. The reason
could be attributed to the higher surface energy of alumina nanoparticles which lead to
agglomeration and higher copper-copper contacts hindering densification. Higher number of
agglomerates of hard alumina particles shields the copper deformability which does not take
place in microcomposites [40].
Fig. 3.2.42 shows the variation of microhardness and nano indentation hardness values with
alumina content. The nanohardness values of the nanocomposites are higher than that the
corresponding microhardness values of nanocomposites. This can be attributed to the indentation
size effect [41].

Chapter 3 Results and Discussion
99
Composition Microhardness
(HV0.3)
Sintered
density (g/cm3)
% theoretical
density
Cu- 0.5%Al2O3(nano) 76.02 7.51 84.66
Cu- 1% Al2O3 (nano) 77.42 8.25 93.22
Cu- 3 % Al2O3 (nano) 98.55 8.23 94.05
Cu- 5 % Al2O3 (nano) 124.5 8.01 92.17
Cu- 7 % Al2O3 (nano) 76.17 7.60 88.93
Cu- 1% Al2O3 (micron) 58.97
8.43 95.25
Cu- 5% Al2O3 (micron)
82.47 8.29 95.39
Cu- 20% Al2O3 (micron) 93.17
7.57 95.82
Table 3.2.3 Microhardness, sintered and theoretical density of Cu-Al2O3 micro- and nano-
composites with varying alumina content
0 5 10 15 200.8
1.0
1.2
1.4
1.6
1.8
2.0
2.2
2.4
Cu-Al2O3 nanocomposites (nanohardness)
Cu-Al2O3 microcomposites (microhardness)
Vol.% of alumina
Na
no
ha
rdn
es
s (
GP
a)
0.4
0.5
0.6
0.7
0.8
0.9
1.0
1.1
Mic
roh
ard
ne
ss
(GP
a)
Fig. 3.2.42 Plot for nanohardness of Cu-Al2O3 nanocomposites and microhardness of Cu-Al2O3
microcomposites

Chapter 3 Results and Discussion
100
1 2 3 4 5 6 7
110
115
120
125
130
135
140
145
150
155
160
Ela
sti
c m
od
ulu
s (
in G
Pa
)
Vol percent of alumina
Cu-Al2O
3 nanocomposites
Theoritical values
Fig. 3.2.43 Elastic modulus of Cu-Al2O3 nanocomposites fabricated by SPS
The elastic modulus values obtained from nanoindentation hardness measurements have been
reported against the volume percentage of alumina which is shown in Fig. 3.2.43. Elastic
modulus values of the nanocomposites revolve around the theoretical values obtained from rule
of mixture. The elastic modulus value of reinforced Cu-1 vol. % Al2O3 nanocomposite is higher
than the corresponding theoretical value calculated using rule of mixtures. The rest of the
compositions i.e. reinforced Cu-5 and 7 vol. % Al2O3 nanocomposites display lower elastic
modulus values than the theoretical data. The decrease in hardness after 5 vol. % can be
attributed to the agglomeration of nanoparticles eventually increasing the interparticle distance.
The formation of a new phase CuAlO2 (from XRD and TEM) suggested is a soft phase. The
CuAlO2 phase when present discontinuously result in toughening of the interface by crack
pinning and enhances the strength of the composite [42].

Chapter 3 Results and Discussion
101
3.2.3.3a.2 Wear study
3.2.3.3a.2.1 Wear depth
The wear depth vs. time plot for nanocomposites and microcomposites has been illustrated in
Fig. 3.2.44 & 3.2.45.
0 200 400 600 800 10000
10
20
30
40
7% nanoalumina
5% nanoalumina
1% nanoalumina
We
ar
De
pth
(m
)
Time (secs)
Fig. 3.2.44 Wear depth vs. time plot for Cu-Al2O3 nanocomposites sintered by SPS
The wear resistance of microcomposites is higher than nanocomposites for the same
compositions [43]. The reason could be ascribed to the fact that the wear indenter in case of
microcomposites has a higher retention of contact with the microparticle in microcomposites in
comparison to the nanoparticles in nanocomposites. The microparticles render higher time of
contact with the wear indenter than the nanoparticles. The reason could be the higher area of
contact with the wear indenter in case of microparticles, which is less likely for the nanoparticles
reinforced composites. Moreover, the microparticles also prevent origination of sub-surface
cracks.

Chapter 3 Results and Discussion
102
0 100 200 300 400 500 600-10
0
10
20
30
40
50
60
20% microalumina
5% microalumina
We
ar
de
pth
(m
)
Time (secs)
1% microalumina
Fig. 3.2.45 Wear depth vs. time plot for Cu-Al2O3 microcomposites sintered by SPS
It has also been found that wear resistance increases as the alumina content increases in both the
cases due to hard and brittle nature of alumina reinforcement. Alumina particles support contact
stresses and prevent plastic deformation. The wear resistance of the specimens is in accordance
with the hardness trends. In some cases negative slopes can be seen from wear depth vs. time
plot. This may be due to the welding of the soft copper phase with the steel ball (indenter) which
results in decrease in wear depth [44].
3.2.3.3a.2.2 Wear track
The wear tracks of Cu-Al2O3 nano- and micro-composites have been illustrated in Fig. 3.2.46
(a)-(d). The wear track of Cu-1vol. % Al2O3 nanocomposite is wider as compared to Cu-5 vol. %
Al2O3 nanocomposite.

Chapter 3 Results and Discussion
103
Fig. 3.2.46 SEM micrographs of the worn surfaces showing wear track of (a) Cu-1 vol. % Al2O3
and (b) Cu-5 vol. % Al2O3 nanocomposite, (c) Cu-5 vol. % Al2O3 and (d) Cu-20 vol. % Al2O3
microcomposite
The wear track of nanocomposite with low content of alumina has been observed to get more
eroded in comparison to higher content of alumina.
The wear track of microcomposites is narrower than that of nanocomposites. The reason could
be attributed to the fact that the alumina microparticles being larger in size, do not allow the wear
indenter to erode the surface continuously. The alumina nanoparticles are hard but the surface
exposed to the wear indenter is quite small to prevent erosion.
a
b
c

Chapter 3 Results and Discussion
104
3.2.3.3a.2.3 Wear rate and volume
The wear rate and volume have been plotted against volume content of alumina in Fig. 3.2.47 (a)
& (b). The wear rate and volume have been calculated using the following equations [45]
Wear volume (mm3) = 2π x track radius x track width x wear depth (III)
Wear rate (mm3N
-1m
-1) = wear volume / (normal load x sliding distance) (IV)
The wear rate and volume of micro- and nano-composites follow the same trend. The wear rate
decreases as the amount of alumina increases in the composites. The steel ball indenter-copper
matrix contact causes erosion from the surface which gets minimized as the alumina content
increases. Hence the metal-ceramic contact results in higher wear resistance and lower wear rate
and volume.
0 5 10 15 20
0
1
2
3
4
5
6
7
We
ar
rate
(X1
0-4
) m
m3
/Nm
Volume % of alumina
Cu-Al2O3 nanocomposites
Cu-Al2O3 microcomposites
Fig. 3.2.47(a) Wear rate vs. volume % of alumina of the Cu-Al2O3 composites
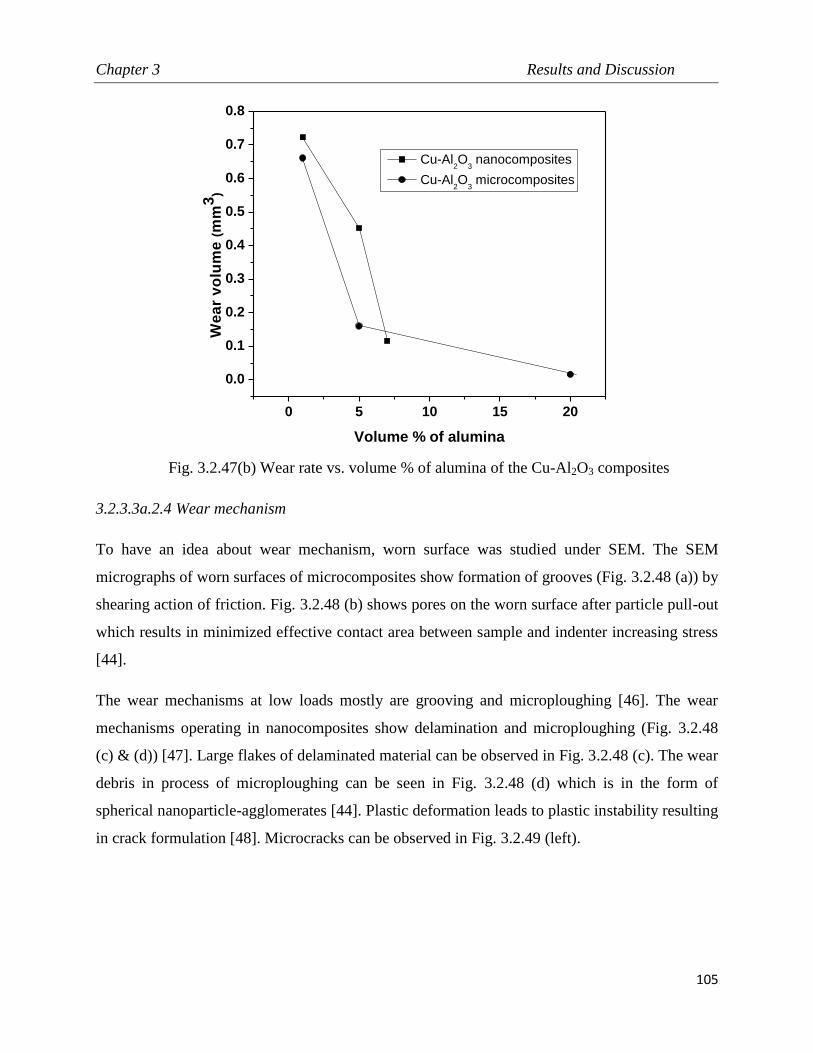
Chapter 3 Results and Discussion
105
0 5 10 15 20
0.0
0.1
0.2
0.3
0.4
0.5
0.6
0.7
0.8
We
ar
vo
lum
e (
mm
3)
Volume % of alumina
Cu-Al2O
3 nanocomposites
Cu-Al2O
3 microcomposites
Fig. 3.2.47(b) Wear rate vs. volume % of alumina of the Cu-Al2O3 composites
3.2.3.3a.2.4 Wear mechanism
To have an idea about wear mechanism, worn surface was studied under SEM. The SEM
micrographs of worn surfaces of microcomposites show formation of grooves (Fig. 3.2.48 (a)) by
shearing action of friction. Fig. 3.2.48 (b) shows pores on the worn surface after particle pull-out
which results in minimized effective contact area between sample and indenter increasing stress
[44].
The wear mechanisms at low loads mostly are grooving and microploughing [46]. The wear
mechanisms operating in nanocomposites show delamination and microploughing (Fig. 3.2.48
(c) & (d)) [47]. Large flakes of delaminated material can be observed in Fig. 3.2.48 (c). The wear
debris in process of microploughing can be seen in Fig. 3.2.48 (d) which is in the form of
spherical nanoparticle-agglomerates [44]. Plastic deformation leads to plastic instability resulting
in crack formulation [48]. Microcracks can be observed in Fig. 3.2.49 (left).

Chapter 3 Results and Discussion
106
Fig. 3.2.48 SEM micrographs of worn surfaces of (a) Cu-5 vol. % Al2O3 nanocomposite, (b) Cu-
5 vol. % Al2O3 microcomposite, (c) Cu-1 vol. % Al2O3 nanocomposite, (d) Cu-5 vol. % Al2O3
nanocomposite
Fig. 3.2.49 SEM micrographs of worn surfaces of Cu-7 vol. % Al2O3 nanocomposite (left) Cu-20
vol. % Al2O3 microcomposite along with EDS analysis (right)
Micro-crack d
Grooves
De-lamination Wear debris
a
d c
b
Particle pull-out

Chapter 3 Results and Discussion
107
Fig. 3.2.48 (right) shows SEM micrograph of worn surface and corresponding EDS spectra. The
EDS spectrum shows the presence of Fe on the worn surfaces of microcomposite which attribute
wear of steel ball by hard and brittle alumina particles. The formation of tribolayer has also been
observed with microcomposites as well as low concentration of alumina in nanocomposites [49].
The adhesive wear action could be seen by the presence of wear debris sliding from one site to
another on the composite. The abrasive wear mechanism was evident by the presence of iron
particles in the wear debris of the composites. The wear rate of copper-7.5% alumina reinforced
Cu investigated by Fathy et al.[15] has been reported as higher than 2x10⁻⁴
g/m whereas in our
experiments we have obtained 1x10⁻⁴
mm3/Nm for copper-7 vol. % alumina.
3.2.3.3a.2.5 Wear debris
The wear debris of microcomposites shows flakes whereas the wear debris of nanocomposites is
spherical in shape (Fig. 3.2.50 & 3.2.51). The nature of wear debris is different in micro- and
nano-composites due to the higher deformability of microcomposites because of presence of less
hard alumina microparticles in comparison to nanoparticles.
Fig. 3.2.50 SEM micrograph of the worn surfaces showing wear debris of Cu-5 vol. % Al2O3
microcomposite (left), EDS of the whole micrograph (right)
The wear debris formation may be attributed to the fact that copper being soft in nature gets
eroded by the steel ball indenter, thereby exposing the alumina particles to the surface. The wear
debris of microcomposites was analyzed for element detection by the help of EDS. The EDS

Chapter 3 Results and Discussion
108
analysis showed that the wear debris of microcomposite contains higher content of iron than that
of nanocomposites (Fig. 3.2.50).
Fig. 3.2.51 SEM micrograph of worn surfaces of Cu-5 vol. % Al2O3 nanocomposite (left),
EDS of the whole micrograph (right)
This observation points towards the fact that the abrasion of wear indenter with microcomposites
is higher than nanocomposites. The abrasive wear actions of the composites lead to the abrasion
of the steel ball wear indenter.
3.2.3.3b Aluminium-alumina composite
3.2.3.3b.1 Density measurement
The density measurements exhibit close values to % of theoretical density for microcomposites
and nanocomposites (Table 3.2.4). The microcomposites exhibit poor bonding and compatibility
of alumina in the aluminium matrix. The % of theoretical density of microcomposites and
nanocomposites falls as the volume of alumina increases. The density values of 5 vol. % alumina
reinforced microcomposite are higher than the corresponding nanocomposite density values. The
underlying reason could be that the compressibility of hard nanoparticles in a ductile matrix is
tedious. The compressibility of hard and non-deformable particles in a ductile matrix decreases
with increasing content of the hard particles (reinforcements) [50]. Moreover the formation of
networks also retards compaction. This is the same reason for which the density plot shows a
steep fall from 1 to 5 vol. % of alumina.

Chapter 3 Results and Discussion
109
Table 3.2.4 % of theoretical density, microhardness and nanoindentation hardness values of Al-
Al2O3 micro- and nano-composites
The density data for nanocomposites are scattered but the trend of density values with increasing
amount of reinforcement is negative. This can be attributed to the plastic deformation of
aluminium particles through particle contact during compaction. The higher alumina content
increases alumina-alumina contact which impedes the deformability of aluminium particles [51].
Hence, the densification trend shows a downfall with the increase in alumina content. The major
concern of nanoparticles is agglomeration as well as the tendency to form interconnected
networks. The problem of agglomeration in nanoparticles leads to lesser densification in
nanocomposites whereas this does not impair the densification of microcomposites to a larger
extent. This is due to the fact that the specific surface of coarser particles is lower and the
powder compressibility is higher [52]. Rahimian et al. [29] have obtained 96.8% of relative
density for Al-10 wt. % Al2O3 conventionally sintered at 500°C where as we have reported
Composition (alumina
content in wt. %)
% theoretical
density Microhardness (GPa)
Nanoindentation
hardness (GPa)
Nanocomposites
0.5 95.5 0.36 0.02
1 99.5 0.32 0.01 0.60 0.07
3 90.1 0.35 0.01
5 93.6 0.51 0.06 0.49 0.07
7 93.6 0.38 0.03 0.85 0.14
Microcomposites
1 98.8 0.37 0.01
5 97.1 0.46 0.04
20 92.5 0.55 0.02

Chapter 3 Results and Discussion
110
98.8% for Al-1 vol. %Al2O3 microcomposite and 99.5% relative density for Al-1 vol. %Al2O3
nanocomposite.
3.2.3.3b.2 Microhardness and nanohardness measurements
The microhardness measurements show high hardness values for nanocomposites than for
microcomposites which are visible in Table 3.2.4. In case of nanocomposites hardness increases
upto 5 vol. % of alumina due to the positive effect of dispersion strengthening but after that it
decreases due to agglomeration of nanoparticles. The micron sized particles have lower tendency
to agglomerate compared to nanoparticles hence, it is attributed to the effect of positive
dispersion strengthening. The micron-sized particles were inefficient to pin down the grain
growth of the aluminium grains compared to the alumina nanoparticles. Agglomeration of
nanoparticles results in the increase of interparticle distance subsequently reducing the particle-
dislocation interaction. Moreover less strength is required to move a dislocation where the
interparticle distance is large. The nanoparticles possess high yield stress and are sensitive to
work hardening so render lesser compressibility. Hence, nanocomposites possess higher
microhardness (for 5 vol. %) referring to greater hardening response [51]. The grain growth
stagnation in nanocomposites occurs due to Zener effect [53]. Solute segregation is another
method for grain growth stagnation. Since the alumina particles are hard and in nanoscale range,
high energy is required for the movement of dislocations when they encounter a hard
nanoparticle (Dieter, 1976).
(4)
where is the stress required for a dislocation to pass reinforcement, G is the shear modulus of
the material and b is the burger vector of the dislocation. It is very difficult to make exact
comparison of microstructure and mechanical properties of composites fabricated by
conventional sintering and present SPS method as the processing parameters and raw materials
sizes are different. However, we have achieved higher hardness at lower processing temperature
and time as compared to conventional sintering [29].

Chapter 3 Results and Discussion
111
The nanohardness values of the nanocomposites are higher than the corresponding
microhardness values (Table 3.2.4). This could be attributed to the indentation size effect
explained by Mukhopadhyay and Paufler [41]. In microhardness measurements the hardness
values of microcomposites (for 5 vol. % of alumina) is lower than that of nanocomposites. The
enhanced strength of the nanocomposites can be attributed to the stronger diffusional bonds and
structural integrity achieved due to greater diffusional activity [54] by sintering the alumina
nanoparticles and aluminium matrix particles by spark plasma sintering. The highest value of
microhardness is revealed by the 20 vol. % alumina reinforced microcomposite. The highest
amount of alumina could be the reason for the highest value of microhardness.
3.2.3.3b.3 Wear study
Fig. 3.2.52 Wear depth vs time profile for Al-Al2O3 microcomposites fabricated by spark plasma
sintering
Fig. 3.2.52 & 3.2.53 demonstrate the wear depth vs time graphs for Al-Al2O3 micro- and nano-
composites fabricated by spark plasma sintering. The wear depth is higher for nanocomposites
than microcomposites. The microcomposites show better wear resistance than nanocomposites
which could be attributed to the fact that the microcomposites contain alumina microparticles
and as wear is a surface phenomenon the microparticles have higher surface exposed to the wear

Chapter 3 Results and Discussion
112
indenter compared to nanoparticles. Hence, the microparticles prevented the wear indenter to
erode the matrix to a higher degree compared to the nanoparticles.
Fig. 3.2.53 Wear depth vs time profile for Al-Al2O3 nanocomposites fabricated by spark plasma
sintering
Fig. 3.2.54 (a & b) illustrates the wear tracks of Al-Al2O3 microcomposites and nanocomposites
respectively. The wear tracks reveal low wear resistance for nanocomposites.
The Al-20 vol. % Al2O3 microcomposite showed a narrow wear track than for Al-5 vol. % Al2O3
nanocomposite. Fig. 3.2.55 showed wear mechanisms operating in micro- and nano-composites.
The nanocomposites seem to have got eroded proficiently creating microcracks and distinct
delamination was visible for microcomposites.

Chapter 3 Results and Discussion
113
Fig. 3.2.54 SEM micrographs of worn out surface of (a) Al-20 vol. % Al2O3 microcomposite and
(b) Al-5 vol. % Al2O3 nanocomposites fabricated by spark plasma sintering
Fig. 3.2.55 SEM micrographs of worn out surface of (a) Al-1 vol. % Al2O3 microcomposite and
(b) Al-1 vol. % Al2O3 nanocomposites fabricated by spark plasma sintering
a b
aarticle pull-out
Wb

Chapter 3 Results and Discussion
114
3.2.4 Summary and Conclusions
The Cu-Al2O3 and Al-Al2O3 micro- and nano-composites were fabricated by blend-compact-
sinter powder metallurgy route at different sintering temperatures. The microcomposites possess
better properties (density and hardness) at higher sintering temperatures. In nanocomposites
density and hardness are better at lower sintering temperatures. The incorporation of Al2O3
nanoparticles strengthens the matrix to a greater extent resulting in increase of microhardness
compared to Al2O3 microparticles. The microstructures of micro- as well as nano-composites
demonstrate better distribution in the later. Compressive strength is highest for the Cu-15 vol. %
Al2O3 microcomposites. The flexural modulus of nanocomposites is higher as compared to the
microcomposites. Fractography of the microcomposites and nanocomposites revealed mixed
mode of fracture in both the cases. The wear resistance of nanocomposites is higher than the
microcomposites under the same experimental conditions. The rise in reinforcement content
imparts higher microhardness, low density and high wear resistance values for both the systems.
Cu-Al2O3 and Al-Al2O3 micro-(1, 5, 20 vol. %) and nano-(0.5, 1, 3, 5, 7 vol. %) composites
were fabricated by spark plasma sintering technique. XRD analysis shows the presence of Cu,
Al2O3 and CuAlO2 in both the micro- as well as nano-composites. The SEM micrographs show
the presence of annealing twins during fabrication by SPS in both nano and micro-composites.
TEM micrographs suggest the formation of a third phase i.e. CuAlO2 (copper aluminate) around
the alumina particles. The hardness measurements show that the nanocomposites are harder than
microcomposites. The wear resistance of microcomposites is higher than the nanocomposites.
The possible wear mechanisms for both composites are microploughing, delamination as well as
microcrack formation. The wear mechanisms operating in the micro- and nano-composites is
dominated by the reinforcement particle size effect and their implications. We have obtained
95.82% densification and 93.17 HV hardness for spark plasma sintered Cu-20 vol. % Al2O3
microcomposite. The elastic modulus of Cu-1% alumina nanocomposite is obtained as 128 GPa.
The wear rate is appreciably low i.e. 0.86 x 10⁻⁴
mm3N
-1m
-1 for 20 vol. % alumina reinforced
copper microcomposite.

Chapter 3 Results and Discussion
115
The distribution of alumina particles in the aluminium matrix is homogeneous and uniform both
in nanocomposites and microcomposites (slightly better distribution in nanocomposites than
microcomposite). The interface of aluminium and alumina in nanocomposites is seemingly
sound than in the case of microcomposite i.e. the compatibility of alumina in aluminium matrix
in nanocomposites is better than in the microcomposites. The TEM and SEM micrographs reveal
a lack of intimate proximity between matrix and reinforcement entities in microcomposites.
Almost full densification in case of 1 vol. % alumina reinforced nano- and microcomposites have
been achieved. The density of microcomposites as well as nanocomposites decreases with
increasing alumina content. The nanohardness of nanocomposites is higher than the
corresponding microhardness values. The highest nanohardness recorded was 0.85 GPa for 7 vol.
% Al-Al2O3 nancomposites.
References
[1] H. Ghasemi, A.H. Kohabi, M.A.F. Sani, Z. Riazi, Alumina-copper eutectic bond strength:
contribution of preoxidation, cuprous oxides particles and pores, Mater. Forum 32 (2008) 90-
97.
[2] A. Slipenyuk, V. Kuprin, Y. Milman, V. Goncharuk, J. Eckert, Properties of P/M processed
particle reinforced metal matrix composites specified by reinforcement concentration and
matrix-to-reinforcement particle size ratio, Acta. Mater. 54 (1) (2006) 157-166.
[3] R.W. Hertzberg, Deformation and Fracture Mechanics of Engineering Materials, John Wiley
and Sons Inc., Canada, fourth edition, 1996.
[4] M. Korac, Z. Kamberovic, M. Tasic, M. Gavrilovski, Nanocomposite powders for new
contact materials based on copper and alumina, Chem. Ind. Chem. Eng. Q 14 (4) (2008) 215-
218.
[5] K. Dash, B.C. Ray, D. Chaira, Synthesis and characterization of copper-alumina metal matrix
composite by conventional and spark plasma sintering, J. Alloy. Compd. 516 (2012) 78-84.
[6] G.S Upadhaya, Future directions in sintering research, Sci. Sinter. 43 (2011) 3-8.

Chapter 3 Results and Discussion
116
[7] G.C. Efe, T. Yener, I. Altinsoy, M. Ipek, S. Zeytin, C. Bindal, The effect of sintering
temperature on some properties of Cu-SiC composite, J. Alloy. Compd. 509 (20) (2011)
6036-6042.
[8] F. Shehata, A. Fathy, M. Abdelhameed, S.F. Moustafa, Fabrication of copper-alumina
nanocomposites by mechano-chemical routes, J. Alloy. Compd. 476 (1) (2009) 300-305.
[9] W.M. Daoushb, B.K. Lim, C.B. Mo, D.H. Nam, S.H. Hong, Electrical and mechanical
properties of carbon nanotube reinforced copper nanocomposites fabricated by electroless
deposition process, Mater. Sci. Eng. A 513-514 (2009) 247-253.
[10] V. Rajkovic, D. Bozic, M.T. Jovanovic, Properties of copper matrix reinforced with
various size and amount of Al2O3 particles, J. Mater. Process. Technol. 200 (1) (2008) 106-
114.
[11] B. Tian, P. Liu, K. Song, Y. Li, Y. Liu, F. Rena, J. Sua, Microstructure and properties at
elevated temperature of a nano-Al2O3 particles dispersion-strengthened copper base
composite, Mater. Sci. Eng. A 435-436 (2006) 705-710.
[12] S.C. Tjong, K.C. Lau, Tribological behaviour of SiC particle-reinforced copper matrix
composites, Mater. Lett. 43 (5) (2000) 274-280.
[13] Z.H. Tan, B.J. Pang, D.T. Qin, J.Y. Shi, B.Z. Gai, The compressive properties of 2024Al
matrix composites reinforced with high content SiC particles at various strain rates, Mater.
Sci. Eng. A 489 (1) (2008) 302-309.
[14] R. Fernandez, G. Bruno, G. Gonzalez-Doncel, Residual stress evolution with
compressive plastic deformation in 6061Al-15 vol.% SiCw composites as studied by neutron
diffraction, Mater. Sci. Eng. A 403 (1) (2005) 260-268.
[15] A. Fathy, F. Shehata, M. Abdelhameed, M. Elmahdy, Compressive and wear resistance
of nanometric alumina reinforced copper matrix composites. Mater. Des. 36 (2012) 100-107.
[16] F. Akhtar, S.J. Askari, K.A. Shah, X. Du, S. Guo, Microstructure, mechanical properties,
electrical conductivity and wear behaviour of high volume TiC reinforced Cu-matrix
composites, Mater. Charact. 60 (4) (2009) 327-336.
[17] A. Rabiei, L. Vendra, T. Kishi, Fracture behavior of particle reinforced metal matrix
composites, Composites: Part A 39 (2) (2008) 294-300.

Chapter 3 Results and Discussion
117
[18] ASM Handbook Committee, ASM Handbook Vol. 12, Fractography, ASM International-
The materials information company, 1987.
[19] C.S. Ramesh, R.N. Ahmed, M.A. Mujeebu, M.Z. Abdullah, Development and
performance analysis of novel cast copper–SiC–Gr hybrid composites, 2009 Mater. Des. 30
(6) (2009) 1957-1965.
[20] K.P. Trumble, Prediction of a critical temperature for aluminate formation in
alumina/copper–oxygen eutectic bonding, J. Am. Ceram. Soc. 82 (10) (1999) 2919-2920.
[21] C.W. Seager, K. Kokini, K. Trumble, M.J.M Krane, The influence of CuAlO2 on the
strength of eutectically bonded Cu/Al2O3 interfaces, Scripta. Mater 46 (5) (2002) 395-400.
[22] S.T Kim, C.H. Kim, Interfacial reaction product and its effect on the strength of copper to
alumina eutectic bonding. J. Mater. Sci. 27 (1992) 2061-2066.
[23] A.M. Hassan, A. Alrashdan, M.T. Hayajneh, A.T. Mayyas. Wear behavior of Al-Mg-Cu-
based composites containing SiC particles. Tribol. Int. 42 (8) (2009) 1230-1238.
[24] A. Afshar, A. Simchi, Flow stress dependence on the grain size in alumina dispersion-
strengthened copper with a bimodal grain size distribution. Mat. Sci. Eng. A. 518 (1) (2009)
41-46.
[25] Z.R. Hesabi, A. Simchi, S.M.S. Reihani, Structural evolution during mechanical milling
of nanometric and micrometric Al2O3 reinforced Al matrix composites, Mat. Sci. Eng. A 428
(1) (2006) 159-168.
[26] J. Tian, K. Shobu, Hot-pressed AlN-Cu metal matrix composites and their thermal
properties, J. Mater. Sci. 39 (2004) 1309-1313.
[27] A. Kostka, J. Lelatko, M. Gigla, H. Morawiec, A. Janas, TEM study of the interface in
ceramic-reinforced aluminium-based composites. Mat. Chem. Phy. 81 (2) (2003) 323-325.
[28] A. Kelly, C. Zweben, Comprehensive Composite Materials, Elsevier Science Ltd., United
Kingdom, Vol. 3, first edition, 2000, pp. 139-149.
[29] M. Rahimian, N. Ehsani, N. Parvin, H.R. Baharvandi, The effect of particle size,
sintering temperature and sintering time on the properties of Al-Al2O3 composites, made by
powder metallurgy, J. Mater. Process. Technol. 209 (14) (2009) 5387-5393.

Chapter 3 Results and Discussion
118
[30] M. Rahimian, N. Parvin, N. Ehsani, The effect of production parameters on
microstructure and wear resistance of powder metallurgy Al-Al2O3 composite, Mater. Design
32 (2) (2011) 1031-1038.
[31] E.A. Olevsky, L. Froyen, Impact of thermal diffusion on densification during SPS, J. Am.
Ceram. Soc. 92 (1) (2009) 122-132.
[32] Z.A. Munir, D.V. Quach, M. Ohyanagi, Electric Current Activation of Sintering: A
Review of the Pulsed Electric Current Sintering Process, J. Am. Ceram. Soc. 94 (1) (2011) 1-
19.
[33] G. Xie, O. Ohashi, M. Song, K. Furuya, T. Noda, Behavior of Oxide Film at the Interface
between Particles in Sintered Al Powders by Pulse Electric-Current Sintering, Mett. Trans. A
34 (2003) 699-703.
[34] T.G. Durai, K. Das, S. Das, Synthesis and characterization of Al matrix composites
reinforced by in situ alumina particulates, Mat. Sci. Eng. A 445–446 (2007) 100–105.
[35] J.W. Edington, Interpretation of transmission electron micrographs, Macmillan, London,
1975.
[36] G.E. Dieter, Mechanical Metallurgy, McGraw-Hill, London, United Kingdom, Third
Edition 1988.
[37] T. Zhang, Q. Meng, Y. Wang, Y. Zhou, G. Song, Dislocation behavior in ZrC particles
during elevated temperature compressive deformation of a 30 vol.% ZrCp/w composite, J.
Mater. Sci. Technol. 27 (2011) 553-558.
[38] H. Wang, G. Li, Y. Zhao, G. Chen, In situ fabrication and microstructure of
Al2O3 particles reinforced aluminium matrix composites, Mat. Sci. Eng. A 527 (2010) 2881-
2885.
[39] A. Fais, M. Leoni, P. Scardi, Fast Sintering of Nanocrystalline Copper, Metall. Mater.
Trans. A. 43 (2012) 1517-1521.
[40] C.A. Leon, G. Rodriguez-Ortiz, E.A. Aguilar-Reyes, Cold compaction of metal-ceramic
powders in the preparation of copper base hybrid materials, Mat. Sci. Eng. A 526 (1) (2009)
106-112.
[41] N.K. Mukhopadhyay, P. Paufler, Micro and nanoindentation techniques for mechanical
characterization of materials, Int. Mater. Rev. 51 (2006) 209-245.
Chapter 3 Results and Discussion
119
[42] I.E. Reimanis, K.P. Trumble, K.A. Rogers, B.J. Dalgleish, Influence of Cu2O and
CuAlO2 interphases on crack propagation at Cu/α-Al2O3 interfaces, J. Am. Ceramic. Soc. 80
(1997) 424-432.
[43] S. Chung, B.H. Hwang, A microstructural study of the wear behaviour of SiCp/Al
composites, Tribol. Int. 27 (5) (1994) 307-314.
[44] G. Parida, D. Chaira, M. Chopkar, A. Basu, Synthesis and characterization of Ni-
TiO2 composite coatings by electro-co-deposition, Surf. Coat. Technol. 205 (21) (2011)
4871-4879.
[45] A. Jain, B. Basu, B.V.M. Kumar, H. Vardhan, J. Sarkar, Grain size-wear rate relationship
for titanium in liquid nitrogen environment, Acta. Mater. 58 (7) (2010) 2313-2323.
[46] M. Hashempour, H. Razavizadeh, H. Rezaie, Investigation on wear mechanism of
thermochemically fabricated W-Cu Composites, Wear 269 (2010) 405-415.
[47] J. Hemanth, Abrasive and slurry wear behaviour of chilled aluminium alloy (A356)
reinforced with fused silica (SiO2p) metal matrix composites, Composites Part B 42 (2011)
1826-1833.
[48] J. Jiang, F.H. Stott, M.M. Stack, A mathematical model for sliding wear of metals at
elevated temperatures, Wear 181-183 (1995) 20-31.
[49] S.G. Sapate, A. Uttarwar, R.C. Rathod, R.K. Paretkar, Analyzing dry sliding wear
behaviour of copper matrix composites reinforced with pre-coated SiCp particles, Mater.
Design 30 (2009) 376-386.
[50] C.A. Leon, G. Rodriguez-Ortiz, E.A. Aguilar-Reyes, Cold compaction of metal-ceramic
powders in the preparation of copper base hybrid materials, Mat. Sci. Eng. A 526 (2009) 106-
112.
[51] S.S. Razavi-Tousi, R. Yazdani-Rad, S.A. Manafi, Effect of volume fraction and particle
size of alumina reinforcement on compaction and densification behaviour of Al-
Al2O3 nanocomposites, Mat. Sci. Eng. A. 528 (3) (2011) 1105-1110.
[52] D. Roy, A. Sinha, P.P. Chattopadhyay, I. Manna, Nanoindentation behaviour of bulk
metastable Al65Cu20Ti15 alloy prepared by consolidation of the ball milled powder, Mat. Sci.
Eng. A 528 (28) (2011) 8047-8050.
Chapter 3 Results and Discussion
120
[53] Z.R. Hesabi, A. Simchi, S.M.S. Reihani, Structural evolution during mechanical milling
of nanometric and micrometric Al2O3 reinforced Al matrix composites, Mat. Sci. Eng. A 428
(1) (2006) 159-168.
[54] S.K. Karak, J.D. Majumdar, W. Lojkowski, A. Michalski, L. Ciupinski, K.J.
Kurzydłowski, I. Manna, Microstructure and mechanical properties of nano-Y2O3 dispersed
ferritic steel synthesized by mechanical alloying and consolidated by pulse plasma sintering,
Philos. Mag. 92 (2012) 516-534.

Chapter 3 Results and Discussion
121
3.3 Effect of thermal and cryogenic conditioning on flexural behaviour of
thermally shocked Cu-Al2O3 and Al-Al2O3 micro- and nano-composites
3.3.1 Scope and Objectives of the work
This investigation has used flexural test to explore the effect of thermal treatments i.e. high
temperature and cryogenic environments on the mechanical property of Al2O3 particulate
reinforced Cu and Al metal matrix micro- and nano-composites in ex-situ and in-situ conditions.
Cu- Al2O3 and Al-Al2O3 reinforced with 5, 10, 15, 20 vol. % Al2O3 micro- (~10µm) and 1, 3, 5, 7
vol. % Al2O3 nano- (<50 nm)composites were fabricated by powder metallurgy route. Both the
micro- and nano-composites were treated at +40°C temperature for 1 hour followed by -40°C
temperature for 1 hour. This treatment was also done in the reverse order i.e. from -40°C to
+40°C. The above stated thermal shock module was repeated with temperatures (+80°C to
-80°C) and (-80°C to +80°C) with both micro- and nano-composites with 1 hour isothermal
holding at each temperature. For thermal conditioning the micro- and nano-composites were
exposed to +80°C for 1 hour and -80°C for 1 hour separately. High temperature 3- point bend
test was performed at 100°C and 250°C for the composites after temperature attainment. All the
micro- and nano-composites subjected to thermal shock, thermal conditionings were tested in
flexural mode at a span length of 26 mm and loading rate of 0.5 mm/min. The micro- and nano-
composites were also tested at ambient temperature to note the difference after the thermal
treatments. The fractured samples were studied under field emission scanning electron
microscopy. All the fractured samples obtained after various thermal treatments were studied
under scanning electron microscope (SEM). The development of thermal stresses quite often
results in concentration of residual stresses at the particle/matrix interface eventually weakening
it. Enhancement of flexural strength was recorded for down- as well as for up-thermal shock in
microcomposites. The high temperature flexural strength of micro- and nano-composites is lower
than that at ambient temperature. The amelioration and declination in mechanical properties as a
consequence of thermal shock, thermal conditioning and high temperature flexural testing have
been discussed in the light of fractography. The objective of this investigation is to assess the

Chapter 3 Results and Discussion
122
variation in mechanical property with the thermal treatments, but not so much emphasis on
evaluating the absolute values of mechanical properties. The absolute value of different
properties might differ with the route of fabrication techniques.
3.3.2 Fabrication of composites
3.3.2a Copper-alumina composite
Copper powder (Loba Chemie) (average particle size~11μm, purity >99.7%) was used as the
matrix material. Alumina powders (Sigma Aldrich, purity >99.7%)) (average particle size~10μm
and < 50 nm) were selected as the reinforcement material. The Cu with 5, 10, 15, 20 vol. %
Al2O3 (10 µm) microcomposites and Cu with 1, 3, 5, 7 vol. % Al2O3 (< 50 nm) nanocomposites
powders were blended separately. The specimens having dimensions (31.5 x 12.7 x 6.3 mm3)
were prepared by compacting the powders at a pressure of 500 MPa as per ASTM B 925-08 for
3-point flexural test. The compacted specimens were sintered conventionally at 900°C for 90
minutes in argon atmosphere.
3.3.2b Aluminium-alumina composite
Aluminium powder (Loba Chemie) (average particle size~22μm, purity- >99.7%) was used as
the matrix material. Alumina powders (Sigma Aldrich, purity >99.7%)) (average particle
size~10μm and < 50 nm) were selected as the reinforcement material. The Al- 5, 10, 20 vol.
%Al2O3 (10 µm) microcomposites and Al- 1, 3, 5 vol. % Al2O3 (< 50 nm) nanocomposites
powders were blended separately. The specimens having dimensions (31.5 x12.7 x 6.3 mm3)
were prepared by compacting the powders at a pressure of 400 MPa as per ASTM B 925-08 for
3-point flexural test. The compacted specimens were sintered conventionally at 600°C for 90
minutes in argon atmosphere.
3.3.3 Thermal shock
The 3-point flexural test standard specimens were subjected to thermal shock environment with a
160°C and 80°C temperature gradients by two separate routes. For one batch of specimens
(micro- and nano-composites) the treatment started from +80°C temperature to -80°C
temperature (down thermal shock) and for the other batch it was in the reverse order (up thermal
shock). For second batch of specimens (micro- and nano-composites) the treatment started from

Chapter 3 Results and Discussion
123
+40°C temperature to -40°C temperature (down thermal shock) and for the other batch it was in
the reverse order (up thermal shock). Choice of temperatures between +80°C and -80°C was
made to promote accelerated weathering which readily induces significant scale of damage and
development in shorter span of time, this accelerated weathering data may be used to predict
long term durability for application at higher temperatures than -80°C. The same is true for
+80°C.
After each thermal shock treatment, 3-point flexural test of each sample was performed
immediately in an universal testing machine (Instron-5967) at a cross-head speed of 0.5 mm/min
and span length of 26 mm. The fractured specimens of all the thermal shock treatments i.e.
(+80°C to -80°C temperature), (-80°C to +80°C temperature), (+40°C to -40°C temperature) and
(-40°C to +40°C temperature) were characterized by both field emission scanning and
conventional scanning electron microscopy for fracture surface analysis.
3.3.3a Copper-alumina composite
The microstructures of Cu-5 vol. % Al2O3 microcomposites before and after down thermal shock
treatment have been illustrated in Fig. 3.3.1. The fabricated microcomposites show good
dispersion of alumina particles in copper matrix, whereas the down-thermal shock treated
microcomposites show particle cracking and particle pull out too. The thermal shock induces
compressive stresses on the alumina particle as copper expands at +80°C, successively releasing
the stress at -80°C. The alumina particles crack under stresses and lead to interfacial de-cohesion
which also gives rise to particle pull-out.

Chapter 3 Results and Discussion
124
Fig. 3.3.1 SEM micrographs of Cu-5 vol. % Al2O3 microcomposite before (left) and after (right)
down thermal shock for a temperature gradient of 160°C
Fig. 3.3.2 shows micrographs of Cu-5 vol. % Al2O3 nanocomposites before and after down-
thermal shock treatment. The nanocomposite before treatment has been marked with alumina
Fig. 3.3.2 SEM micrographs of Cu-5 vol. % Al2O3 nanocomposite before (left) and after (right)
down thermal shock for a temperature gradient of 160°
nanoparticles which show almost uniform distribution. The microstructure of nanocomposite
after down-thermal shock shows pulled out agglomerated particle lying on the matrix.
Microcomposite
The variation in flexural strength has been plotted against the alumina content in the
microcomposites after down- (+40°C to -40°C temperature) and up- (-40°C to +40°C
temperature) thermal shock treatment (Fig. 3.3.3(a)). The down thermal shock treatment leads to
Al2O3 nanoparticles
Particle pull out
Particle cracking
Particle pull-out

Chapter 3 Results and Discussion
125
increase in flexural strength when compared to the ambient flexural strength. The subjection of
the composites to +40°C temperature results in expansion of matrix enhancing the
microstructural integrity or mechanical keying of the alumina particle with the matrix. At low
temperature i.e. at -40°C the matrix contracts leading to generation of gap at the interface due to
outgripping of alumina particle by the copper matrix.
5 10 15 200
50
100
150
200
250
300
350
400
Ult
ima
te f
lex
ura
l s
tre
ng
th (
MP
a)
Vol.% of alumina
Ambient
Up thermal shock
Down thermal shock
Fig. 3.3.3(a) Variation of flexural strength of Cu-Al2O3 microcomposites after thermal shock of
80°C temperature gradient
The up-thermal shock from -40°C to +40°C temperature treated microcomposites show an
increase in flexural strength with increasing vol. % of alumina and then decreases at 20 vol. %
composition. The extent of matrix shrinkage decreases as the alumina content increases because
the increasing number of alumina particles poses a barrier for excessive shrinkage of matrix. The
Cu-20 vol. % alumina composition probably results in clustering of alumina particles, hence the
keying and un-keying of alumina particle with the matrix is ineffective.
The variation in flexural strength has been plotted against the alumina content in the
microcomposites after down- (+80°C to -80°C temperature) and up- (-80°C to +80°C
temperature) thermal shock treatment (Fig. 3.3.3(b)). At +80°C temperature treatment the

Chapter 3 Results and Discussion
126
mechanical keying and un-keying effect diminishes with the increase in vol. % of alumina. The
underlying reason could be attributed to the fact of agglomeration at higher vol. % of alumina.
The agglomeration of microparticles would lead to the formation of a cluster which would
possess an uneven complex shaped contour. Hence, this uneven contour prevents effective
gripping or outgripping of alumina particle with the matrix at high and low temperatures
respectively.
5 10 15 200
50
100
150
200
250
300
350
Ult
ima
te f
lex
ura
l s
tre
ng
th (
MP
a)
Vol. % of alumina
Ambient
Down thermal shock
Up thermal shock
Fig. 3.3.3(b) Variation of flexural strength of Cu-Al2O3 microcomposites after thermal shock of
160°C temperature gradient
The increase in flexural strength is higher after a thermal shock of 80°C temperature gradient (ie.
From +40° to -40°C and from -40°C to +40°C temperature) than the shock of 160°C temperature
gradient (ie. From -80°C to +80°C and from +80°C to -80°C temperature) in the second module.
The degree of enhancement of flexural strength decreases as the range of shock temperature
increases i.e. the increase in flexural strength is higher at 80°C temperature shock rather than
after 160°C temperature shock.

Chapter 3 Results and Discussion
127
The fractography studies reveal particle pull-out and physical detachment of alumina particle
from copper matrix (Fig. 3.3.4 (a) & (b)). The down-thermal shock (i.e. +80°C to-80°C)
promoted the intimate physical bonding of reinforcement-matrix.
Fig. 3.3.4 SEM micrographs of Cu-10 vol. % Al2O3 microcomposite after down thermal shock of
80°C temperature gradient showing (a) particle pull-out and (b) interfacial de-cohesion
The reason could be attributed to the following: at +80°C temperature the matrix around the
alumina particles expands and it imparts a compressive force on the alumina particle which could
lead to particle fragmentation sometimes [1]. This also leads to better mechanical keying of the
particle with the matrix [2]. Whereas on the contrary when cooling occurs from the processing
temperature during fabrication of composite, the matrix shrinks around the reinforcement particle
rendering residual tensile stresses/strains in the matrix and compressive stresses/strains in the
reinforcement [3]. The increase of flexural strength in down-thermally shocked microcomposite
is slightly higher than in up-thermal shock because the prior conditioning effect predominates
over the later shock (which means that the thermal shock from (+80°C to -80°C) is manifested as
prior conditioning at +80°C temperature followed by immediate exposure to -80°C temperature
i.e. the specimen was conditioned at +80°C temperature for 1 hour and then immediately
exposed to -80°C temperature. Thus the prior thermally conditioned specimen has experienced a
thermal shock of 160°C temperature). For the microcomposites subjected to up-thermal shock
(i.e. from -80°C to +80°C) the contraction of matrix (copper) takes place to a larger extent than
the reinforcement particle (alumina). The reason for this could be the higher co-efficient of
thermal expansion of copper (16.6 x10⁻⁶
k-1
) than alumina (5.4 x 10⁻⁶
k-1
), which also aids the
(a) (b)

Chapter 3 Results and Discussion
128
presence of dislocation density at the interface [4]. This may lead to physical de-cohesion (Fig.
3.3.4(b)) at the particle/matrix conjunction which has been observed earlier by Ray et al. [5] in
inorganic fiber/polymer composite. The dislocations present in the reinforcement proximity also
get pinned down when the composite is subjected to -80°C. The pinning of dislocations
strengthens the composite by resisting the plastic flow of the matrix [6]. The interfacial de-
cohesion which had possibly occurred at ultra low temperature could not be restored at +80°C on
the same scale. The conditioning at -80°C for 60 minutes might have created a large interfacial
mismatch at the interface which is manifested by the presence of differential co-efficient of
thermal expansion between copper matrix and alumina reinforcement particle [2].
Nanocomposite
The ultimate flexural strength value increases for up-thermal shock (-40°C to +40°C
temperature) whereas the strength values decreases for down-thermal shock (+40°C to -40°C
temperature) which is confirmed from Fig 3.3.5(a). The trend in the variation in flexural strength
in nanocomposites at (+80°C to -80°C temperature) and (-80°C to +80°C temperature) is same as
that of the microcomposites for the same thermal shock treatment (Fig. 3.3.5(b)). The (-40°C to
+40°C temperature) up thermal shock initiates the contraction of matrix resulting in physical
detachment of reinforcement particle from the matrix followed by expansion of matrix which
probably bridges the gap at the interface to some extent. This series of events delays the crack
initiation and propagation due to initial arrest of dislocations and plastic deformation. The SEM
micrographs Fig. 3.3.6(a) & (b) show quasi-cleavage in thermally shocked nanocomposites.

Chapter 3 Results and Discussion
129
0 1 2 3 4 5 6 7 80
50
100
150
200
250
300
350
400
450
Ult
ima
te f
lex
ura
l s
tre
ng
th (
MP
a)
Vol.% of alumina
Ambient
Down thermal shock
Up thermal shock
Fig. 3.3.5(a) Variation of flexural strength of Cu-Al2O3 nanocomposites after thermal shock of
80°C temperature gradient
Fig. 3.3.6(a) denotes crack entrapment in the up thermally shocked nanocomposite which reveals
indirect strengthening, hence the elevation in flexural strength [7]. The declination of surface
diffusivity of alumina nanoparticles which took place at -80°C was unlikely to be restored by the
treatment at +80°C temperature. The effect of primary treatment is predominant over the
following treatment. The trend of variation in flexural strength of copper-alumina
nanocomposites after up-thermal shock at (-40°C to +40°C temperature) and at (-80°C to +80°C
temperature) treatment is opposite. The reason could be attributed to the fact that at -80°C the
surface diffusivity/activity of alumina nanoparticles is lowered drastically, but -40°C is not
enough to lower its surface diffusivity to a greater extent, hence after the -40°C to +40°C
temperature treatment the flexural strength is elevated. The ultimate flexural strength value
decreases for up-thermal shock whereas the strength values increases for down-thermal shock
which is confirmed from Fig 3.3.5(a).

Chapter 3 Results and Discussion
130
0 1 2 3 4 5 6 7 80
50
100
150
200
250
300
350
Ult
ima
te f
lex
ura
l s
tre
ng
th (
MP
a)
Vol. % of alumina
Ambient
Down thermal shock
Up thermal shock
Fig. 3.3.5(b) Variation of flexural strength of Cu-Al2O3 nanocomposites after thermal shock of
160°C temperature gradient
In case of up-thermal shock the matrix in the vicinity of the particle contracts at -80°C
temperature possibly leading to interfacial de-cohesion. The surface area of the nano particles
being higher, the degree of de-union anticipated is also high rendering the interfacial bond weak.
The above being a physical phenomenon cannot be reversed/restored at +80°C temperature,
hence the ultimate flexural strength decreases. The surface deactivation of alumina nanoparticles
which took place at -80°C was unlikely to be restored at +80°C. The adverse effect of prior
thermal conditioning treatment on the composites is not being reversibly reinstated by the
subsequent treatment; this could be a possible reason for a reduced value of flexural strength. In
the case of down-thermal shock, the degree of physical contact of matrix and the reinforced
nanoparticle increases at +80°C temperature (The expansivity of copper matrix is much higher
compared to that of alumina particle. So, the expansion of matrix onto the particle at +80˚C leads
to enhanced gripping of alumina by the matrix. This enhanced proximity leads to mechanical
strengthening of the interface which is reflected by the increased flexural strength values). The
improved integrity can also be attributed to the enhanced surface diffusivity of nanoparticles at
high temperature. The physical integrity of copper and alumina has been shown by flexural

Chapter 3 Results and Discussion
131
strength. Nanoparticles have high surface energy leading to high surface diffusivity. At high
temperature it is reasonably expected that the surface diffusivity of nanoparticles gets improved,
and at sub-zero temperature surface diffusivity gets reduced, as diffusion is a temperature
dependent phenomenon.
Fig. 3.3.6 SEM micrographs of Cu-5 vol. % Al2O3 nanocomposite after (a) up thermal and (b)
down thermal shock for a temperature gradient of 80°C
The ultimate flexural strength increases due to the high surface area of nanoparticles and hence
leading to enhanced interaction of nanoparticles with the matrix at high temperature. Later the
exposure at -80°C temperature could not induce damage on the same scale as the prior treatment
at +80°C. Fig. 3.3.6(b) shows flaky appearance of fracture surface, the flakes of white alumina
nanoparticles are covering the copper matrix surface. The Al/AlN composites were synthesized
by squeeze casting, and were solution treated at 530°C and quenched in water for 2 hours
followed by aging for 10 hours at 160°C. Thermal cycling led to increase in tensile strength,
elastic limit and yield strength, and overall properties’ stability of the composites, which is in
accordance with our case, where flexural strength increases with thermal shock treatment [8].
Bhattacharya et al. [9] have reported increase in microhardness and decrease in density (due to
formation of voids) after thermal cycling in Al-SiC composites. Cracks at the interface have been
observed due to thermal strain in the composite in the clustered region of reinforcement. Our
investigation also reports particle cracking after thermal shock treatment.
(a) (b)

Chapter 3 Results and Discussion
132
3.3.3a.1 Transmission electron microscopy
Fig. 3.3.7 illustrates the TEM micrographs for the fractured samples of Cu-5 vol. % Al2O3
microcomposites at (a) ambient conditions, (b) after up thermal shock and (c) after down thermal
shock. The TEM micrographs reveal a typical dislocation sub-structure for all the specimens.
The down thermally treated samples exhibit smaller size of dislocation cells than the specimen
tested at ambient conditions. As the temperature increases the cell size decreases. Curly
dislocations are visible for up thermally shocked samples. A dense dislocation forest indicates
dislocation entanglement which leads to strengthening of the microcomposite as the dislocation
mobility gets arrested [10].
Fig. 3.3.7 TEM micrographs of Cu-5 vol. % Al2O3 microcomposites at (a) ambient conditions,
(b) after up thermal shock and (c) after down thermal shock for a temperature gradient of 160°C
The cell structure differs for different deformation temperatures. The cell size usually increases
with increase in the temperature. The rise in temperature is accompanied by sharpening of cell
walls. This phenomenon is an avenue for stress relaxation.
Fig. 3.3.7(a) shows a ragged cell wall structure with dislocations inside the cells. After up
thermal shock treatment the cell walls become smaller in size and almost clear of dislocations.
a b
c

Chapter 3 Results and Discussion
133
The down thermally treated samples show a dense dislocation forest with presence of slip planes.
The low temperature treatment has arrested the dislocation mobility by entanglement and coiling
of dislocations. Dislocations move short distances at lower temperatures. Fig. 3.3.8 demonstrates
the dislocation sub-structure for Cu-5 vol. % Al2O3 nanocomposites (a) at ambient conditions,
(b) after up thermal shock and (c) after down thermal shock. Strengthening mechanisms in FCC
metals operate through dislocation forest formation [11]. The nanocomposites also show a
typical dislocation sub-structure showing supercoiling of dislocations, the overall number of
dislocations can be estimated to be low as compared to microcomposites.
Fig. 3.3.8 TEM micrographs of Cu-3vol. % Al2O3 nanocomposites at (a) ambient conditions, (b)
after up thermal shock and (c) after down thermal shock for a temperature gradient of 160°C
a b
c

Chapter 3 Results and Discussion
134
3.3.3b Aluminium-alumina composite
The microstructures obtained after sintering of Al-Al2O3 for micro- and nano-composites show
good distribution of alumina in the aluminium matrix (Fig. 3.3.9 & 3.3.10).
Fig. 3.3.9 SEM micrographs of Al-5 vol. % Al2O3 microcomposite before (left) and after (right)
down thermal shock of 160°C temperature gradient
The alumina nanoparticles have intimately mixed with the matrix and are distributed almost
uniformly in aluminium. The grain boundary pinning is also effective as seen from the
micrographs. The physical integrity of aluminium-alumina seems to be appreciable as no third
phase forms in this system. The thermal shock treatment has induced differential expansion and
contraction of matrix and reinforcement. Down thermal shock consists of treatment at +80°C
temperature followed by immediate treatment at -80°C temperature. At +80°C temperature the
aluminium matrix expands and exerts a compressive force on alumina so that physical integrity
of aluminium and alumina gets improved. The thermal shock experienced when exposed to
-80°C temperature induces contraction of aluminium and alumina leading to interfacial de-
cohesion of alumina from matrix due to higher contraction of aluminium than alumina. The
reverse phenomenon takes place during up-thermal shock. Alumina nanoparticles possess high
surface area and as a result the interfacial decohesion and physical integrity induced by thermal
shocks have a higher magnitude in case of nanocomposites. The microcomposites also exhibit
decohesion and disintegration in the microstructure (Fig. 3.3.9). The thermally shocked
nanocomposites show decohesion of nanoparticle from the matrix and defect generation in the
matrix (Fig. 3.3.10).
Disintegration of interface

Chapter 3 Results and Discussion
135
Fig. 3.3.10 SEM micrographs of Al-5 vol. % Al2O3 nanocomposite before (left) and after (right)
down thermal shock of 160°C temperature gradient
Microcomposite
The variation of flexural strength of Al-Al2O3 microcomposites after thermal shock of 80°C and
160°C temperature gradients is illustrated in Fig. 3.3.11 (a) & (b). The thermal shock with
conditioning treatment can be divided into three steps. For down thermal shock the first step
starts with primary conditioning at +80°C temperature for one hour. The second step is the shock
experienced by the composites when the samples are exposed to -80°C temperature immediately
after the first step. The third step is the secondary conditioning which consists of holding the
samples for one hour at -80°C temperature. In up-thermal shock the same steps are followed with
reversion in temperature i.e. from positive to negative temperature and vice versa.
The flexural strength of microcomposites increases after down- and up-thermal shocks
irrespective of volume percentage of alumina used (with the highest values at 10 vol. %, which is
anticipated to be the optimum composition). The co-efficient of thermal expansion (CTE) of
aluminium (24x10-6
/°C) is almost five times higher than alumina (5.4x10⁻⁶
/°C). Due to this large
difference in CTE values the thermal shock gradient imposes higher expansion of matrix than the
alumina particle in the first step in case of down thermal shock. This expansion leads to
improved mechanical keying of alumina with aluminium matrix, elevating the particle
strengthening effect which is visible in this case. The second step i.e. shock at -80°C results in
contraction of matrix followed by interfacial de-cohesion.

Chapter 3 Results and Discussion
136
5 10 15 200
20
40
60
80
100
Ult
ima
te f
lex
ura
l s
tre
ng
th (
MP
a)
Vol. % of alumina
Ambient
Down thermal shock
Up thermal shock
Fig. 3.3.11(a) Variation of flexural strength of Al-Al2O3 microcomposites before and after
thermal shock of 80°C temperature gradient
The secondary conditioning for one hour at -80°C further promotes de-cohesion at the
matrix/particle junction. The attribution of mechanical keying effect during primary conditioning
is being counteracted by two consecutive de-registry effects during shock as well as secondary
conditioning. In up thermal shock the primary conditioning results in interfacial de-cohesion due
to matrix shrinkage. The second step exposes the samples to shock at +80°C allowing aluminium
matrix to grip alumina by differential expansion of matrix. The secondary conditioning also
follows the same route of particle gripping by aluminium matrix. During up thermal shock the
gripping effect counteracts the interfacial de-cohesion effect. As the changes taking place in the
composite after the primary steps are physical phenomenon, they cannot be reinstated to the
same scale and degree after secondary shock treatments.

Chapter 3 Results and Discussion
137
5 10 15 200
50
100
150
200
Ult
ima
te f
lex
ura
l s
tre
ng
th (
MP
a)
Vol.% of alumina
Ambient
Down thermal shock
Up thermal shock
Fig. 3.3.11(b) Variation of flexural strength of Al-Al2O3 microcomposites before and after
thermal shock of 160°C temperature gradient
Fig. 3.3.12 SEM micrographs of Al-1 vol. % Al2O3 (a) microcomposite and (b) nanocomposite
after down thermal shock of 160°C temperature gradient
Particle pulled-out region
Interfacial de-cohesion (a) (b)

Chapter 3 Results and Discussion
138
Nanocomposite
The flexural strength of Al-Al2O3 nanocomposites after subjection to thermal shock of 80°C and
160°C thermal gradient is shown in Fig. 3.3.13 (a) & (b). In nanocomposites the same series of
events take place during down- and up-thermal shocks. The flexural strength also increases after
thermal shock treatment with highest value for 3 volume percent of alumina reinforced
aluminium nanocomposite. The exceptions in variation of flexural strength in nanocomposites
for some instances of shock treatments could be attributed to agglomeration of nanoparticles.
Agglomeration is a common occurrence in nanoparticles and that is why mechanical keying and
un-keying effect may not be effective as anticipated. This may be case sensitive from sample to
sample which leads to wide fluctuation in strength values. The distribution of alumina particle in
the matrix, tendency of agglomeration, agglomerated size of particle may not be ascertained
throughout the matrix and from sample to sample. The degree of increase in flexural strength in
micro- and nano-composites after thermal shocks is higher for a shock of 160°C than for 80°C.
The reason could be the higher expansion/contraction of matrix for a shock of 160°C, compared
to shock of 80°C. In this case the thermal conditioning effect predominates on the shock effect
and hence the increase of strength for the former is higher than the later.

Chapter 3 Results and Discussion
139
0 1 2 3 4 5 60
5
10
15
20
25
30
35
40
45
Ult
ima
te f
lex
ura
l s
tre
ng
th (
MP
a)
Vol. % of alumina
Ambient
Down thermal shock
Up thermal shock
Fig. 3.3.13(a) Variation of flexural strength of Al-Al2O3 nanocomposites before and after
thermal shock of 80°C temperature gradient
0 1 2 3 4 5 60
20
40
60
80
100
120
Ult
ima
te f
lex
ura
l s
tre
ng
th (
MP
a)
Vol. % of alumina
Ambient
Down thermal shock
Up thermal shock
Fig. 3.3.13(b) Variation of flexural strength of Al-Al2O3 nanocomposites before and after
thermal shock of 160°C temperature gradient

Chapter 3 Results and Discussion
140
3.3.4 Thermal conditioning
In order to treat the samples for thermal conditioning the samples were categorized into 3 groups.
The first group was treated at +80°C in muffle furnace for 60 minutes isothermally. The blower
of the furnace was on function for heat circulation and uniform heating of the samples. The
second set of samples were treated at -80°C in an ultra low temperature chamber for 60 minutes
by isothermal holding. The third batch of samples was maintained at ambient temperature. 3-
point flexural test was conducted immediately at room temperature after each thermal
conditioning treatment. The loading rate and span length was maintained at 0.5 mm/min and
26mm respectively for all the 3-point bend tests.
3.3.4a Copper-alumina composite
Microcomposite
The 3-point flexural strength values at various conditioning temperatures are illustrated in Fig.
3.3.14. As the expanding elastic matrix imparts a compressive force on the reinforcement
particle, this results in particle fragmentation (abundantly visible in SEM micrograph Fig.
3.3.15(a) & (b)) which leads to composite softening. This differential expansion also leads to
localized stresses and strain fields in the microcomposite [12]. The ultra low temperature
conditioning at -80°C may impart shrinkage of matrix which causes interfacial de-cohesion,
decreasing the flexural strength of microcomposite. At low temperature the degree of contraction
of matrix is higher than the reinforcement particle shrinkage. As the probability of particle
cracking decreases, this results in decrease of the detrimental softening effect.

Chapter 3 Results and Discussion
141
5 10 15 200
50
100
150
200
250
Ult
ima
te f
lex
ura
l s
tre
ng
th (
MP
a)
Vol % of alumina
Ambient
+80 C
-80 C
Fig. 3.3.14 Flexural strength of Cu-Al2O3 microcomposites after thermal conditioning
So, the decrease in ultimate flexural strength is less pronounced as compared to the +80°C
conditioning.
Fig. 3.3.15 FESEM micrographs of Cu-10 vol. % Al2O3 (a) & (b) microcomposite after thermal
conditioning at +80°C
(a) (b)

Chapter 3 Results and Discussion
142
Nanocomposite
At +80°C temperature, the ultimate flexural strength increases in comparison to the untreated
sample (Fig. 3.3.16). The nano alumina particles impede the dislocation motion leading to the
dislocation pileups at the reinforcement particle-matrix boundary, which leads to strain
hardening of the composite. The enhanced surface diffusivity of nanoparticles at high
temperature could be another reason for proficient interfacial interaction and subsequent
composite strengthening. On the contrary the ultralow temperature conditioning of the
nanocomposite at -80°C decreases the composite strength. As the movement of dislocations is a
temperature driven phenomena, at low temperature the movement of dislocations get arrested
which restricts the dislocation pile up consequently decreasing the density of dislocation forest
[13]. At low temperature the surface diffusivity of alumina nanoparticles is quite likely to get
lowered in comparison to enhanced diffusivity at high temperature, hence the thermal
conditioning effect in nanocomposites is pronounced.
0 1 2 3 4 5 60
50
100
150
200
250
300
Ult
ima
te f
lex
ura
l s
tre
ng
th (
MP
a)
Vol. % of alumina
Ambient
+80 C
-80 C
Fig. 3.3.16 Flexural strength of Cu-Al2O3 nanocomposites after thermal conditioning

Chapter 3 Results and Discussion
143
3.3.4b Aluminium-alumina composite
Microcomposite
Flexural strength of thermally conditioned samples of Al-Al2O3 microcomposites has been
demonstrated in Fig. 3.3.17 respectively. The residual stresses generated by virtue of fabrication
i.e. compaction and sintering might have developed defects such as macro- and micro-cracks.
The conditioning of samples at -80°C temperature leads to contraction of aluminium matrix
resulting in closure of many potential cracks. The differential contraction between matrix and
particulate reinforcement may lead to de-registry at the interface which may lead to
release/relaxation of built in residual stresses after fabrication. These could be the reason
attributed to strengthening of composite after -80°C temperature thermal conditioning.
5 10 15 200
50
100
150
200
Ult
ima
te f
lex
ura
l s
tre
ng
th (
MP
a)
Vol. % of alumina
Ambient
+80 C
-80 C
Fig. 3.3.17 Flexural strength of Al-Al2O3 microcomposite after thermal conditionings
Nanocomposite
The flexural strength of Al-Al2O3 nanocomposites improves post thermal conditioning both for
+80°C and -80°C temperatures. The elevation in strength can be realised through FESEM
fractographs which indicate strengthening mechanisms such as crack bifurcation (Fig. 3.3.19(a)).

Chapter 3 Results and Discussion
144
Fig. 3.3.19(b) shows serrations as a damage characteristic and ample alumina nanoparticles are
present on the matrix. The increase in strength indicates that the thermal conditioning treatment
has acted in a positive manner for the nanocomposites. At +80°C temperature the matrix expands
and tightly bonds with the alumina particle resulting in high flexural strength. At -80°C
temperature the matrix shrink and in this course leads to rise in the crack nucleation threshold
value via many crack blunting mechanisms.
0 1 2 3 4 5 60
20
40
60
80
100
Ult
ima
te f
lex
ura
l s
tre
ng
th (
MP
a)
Vol. % of alumina
Ambient
+80 C
-80 C
Fig. 3.3.18 Flexural strength of Al-Al2O3 nanocomposites after thermal conditionings.

Chapter 3 Results and Discussion
145
Fig. 3.3.19 FESEM micrographs of Al-1 vol. % Al2O3 (a) & (b) nanocomposite thermally
conditioned at -80°C.
3.3.5 High temperature in-situ 3-point bend test
High temperature 3-point flexural test was carried out at a temperature of 100°C, 250°C on the
micro- and nano-composites. The samples were kept inside the furnace chamber and the furnace
was allowed to reach the required temperature. The 3-point flexural test was conducted just after
the temperature attainment under in-situ conditions.
3.3.5a Copper-alumina composite
Microcomposite
At 100°C temperature the copper matrix expands resulting in tensile and compressive stress in
the matrix and reinforcement respectively enhancing the mechanical locking between matrix and
reinforcement [14]. This leads to the direct strengthening of the composite and as a result the
ultimate flexural strength of the composite increases from the ambient test value (illustrated in
Fig. 3.3.20).
At 250°C temperature the ultimate flexural strength values decreases from the room temperature
test value. At higher operating temperatures plasticity of the composite increases due to (1)
Crack bifurcation
Serrations
(a) (b)

Chapter 3 Results and Discussion
146
dislocation annihilation (2) activation of dislocation motion by different mechanism other than
glide (3) relaxation of internal stress at the matrix-particle front, (4) enhancement of dislocation
recovery at the interface [15]. All the above stated phenomena decrease the strain hardening
exponent of the composite leading to decrease in ultimate flexural strength of the composite.
The microcomposites’ flexural strength decreases when excursed to high temperature testing at
100°C and 250°C temperature (Fig. 3.3.20). The matrix softening along with de-cohesion of
alumina particle from the softened matrix leads to the lowering of flexural strength at elevated
temperatures [16]. As reported by Wu et al. [17] thermal fatigue resistance increases as the
reinforcement particle size decreases.
5 10 15 200
50
100
150
200
250
Ult
ima
te f
lex
ura
l s
tre
ng
th (
MP
a)
Vol. % alumina
Ambient
100 C
250 C
Fig. 3.3.20 High temperature flexural strength of Cu-Al2O3 microcomposites
Nanocomposite
Fig. 3.3.21 illustrates increase of flexural strength in nanocomposites when tested at 100°C,
indicating the enhancement of microstructural integrity and the mechanical keying of the

Chapter 3 Results and Discussion
147
alumina particle with the copper matrix. The deviation in the variation of flexural strength of Cu-
5 vol. % Al2O3 nanocomposite from rest of the two compositions could be attributed to the
agglomerating effect of alumina nanoparticles which impedes excessive softening of matrix. This
hinders the lowering of flexural strength. The temperature of 100°C acts as a thermal
conditioning to enhance the flexural strength of nanocomposites. The decrease of strength at
250°C reveals the softening of matrix and the outgripping of alumina particle from the copper
matrix. With increase in operating temperature the strengthening mechanisms that operate at low
temperature get relaxed which decrease the strength of the composite [14]. The fractography
studies (Fig. 3.3.22) reveal that the failure characteristic features of the composite at 250°C
temperature can be characterized by dimple markings (matrix softening at elevated temperature).
The nanocomposites do not show pronounced dimples in ambient conditions of testing, whereas
at high temperature of testing presence of dimples suggest matrix softening to a certain extent.
The microcomposites’ strength is better at 250°C than nanocomposites due to softening of matrix
at 250°C and as the interfacial area is high in nanocomposites, the de-cohesion of alumina
nanoparticle from the matrix leads to drastic lowering of strength. Whereas at 100°C the
nanocomposites show high strength than the microcomposites, the reason could be attributed to
the conditioning effect of 100°C on the nanocomposites to improve its structural integrity as well
as enhances the interlocking of alumina nanoparticles with the matrix [18]. The high temperature
properties of copper-alumina nanocomposites are appreciably high at 100°C, with adversity to
250°C.

Chapter 3 Results and Discussion
148
0 1 2 3 4 5 60
50
100
150
200
250
300
350
Ult
ima
te f
lex
ura
l s
tre
ng
th (
MP
a)
Vol. % alumina
Ambient
100 C
250 C
Fig. 3.3.21 High temperature flexural strength of Cu-Al2O3 nanocomposites
Uematsu et al. subjected Al-SiC composites to high temperature testing, showing decrease in
tensile strength with increase in testing temperature such as 150˚C and 250˚C [19]. The fracture
surface indicated particle fracture and particle/matrix crack intiation due to softening of matrix at
high temperature which is in agreement with our results.

Chapter 3 Results and Discussion
149
Fig. 3.3.22 SEM micrograph of Cu-5 vol. % Al2O3 nanocomposite after high temperature
flexural test at 250°C
3.3.5b Aluminium-alumina composite
Microcomposite
The in-situ high temperature testing at 100°C and 250°C demonstrated increase in flexural
strength from the ambient test values (Fig. 3.3.23). At 100°C the aluminium matrix expands and
exerts a compressive stress on the particle resulting in gripping of particle in the matrix. This
gripping leads to closer proximity of alumina particle with the matrix aiding in effective stress
transfer from the matrix to the particle. The higher content of alumina composition show
decreased effect of high temperature testing, the higher alumina content promotes clustering.
Hence, the surface area of the alumina microparticle interacting with the matrix will get reduced
effectively because of clustering. This may be the supporting fact for decreased effect in strength
value of higher alumina content composition at high temperatures.

Chapter 3 Results and Discussion
150
5 10 15 200
20
40
60
80
100
120
Ult
ima
te f
lex
ura
l s
tre
ng
th (
MP
a)
Vol % of alumina
Ambient
100 C
250 C
Fig. 3.3.23 High temperature flexural strength of Al-Al2O3 microcomposites
Nanocomposite
Fig. 3.3.24 shows flexural strength of Al-Al2O3 nanocomposites at 100°C and 250°C
temperature. 250°C temperature could be a conducive temperature for nanoparticles to diffuse
and subsequently lead to agglomeration. This is why the gripping effect explained above at
100°C could get diminished at 250°C temperature. Due to agglomeration of nanoparticle at high
temperature the alumina nanoparticle-matrix interaction will get lowered, the strength getting
reduced. At 250°C temperature the agglomeration process will be activated by the enhanced
temperature during in-situ test. The degree of agglomeration will be higher at 250°C than 100°C
visible in Fig. 3.3.25. The increase in flexural strength at 250°C for Al-1 vol. % Al2O3 reveals
the thermal conditioning effect at 100°C temperature followed by matrix softening and as this
composition contains less number of alumina particles, hence not decreasing the strength to a
larger extent.

Chapter 3 Results and Discussion
151
0 1 2 3 4 5 60
5
10
15
20
25
30
35
40
45
50
55
Ult
ima
te f
lex
ura
l s
tre
ng
th (
MP
a)
Vol. % of alumina
Ambient
100 C
250 C
Fig. 3.3.24 High temperature flexural strength of Al-Al2O3 nanocomposites
Fig. 3.3.25 SEM micrographs of Al-5 vol. % Al2O3 nanocomposite after high temperature
flexural test at (a) 100°C and (b) 250°C
(a) (b)

Chapter 3 Results and Discussion
152
3.3.6 Comparison of mechanical behaviour of differently thermal treated composites
The present investigation has largely emphasized the study of damage and/or development of
flexural properties under the condition of up-thermal and down-thermal shocks. The experiment
has further focused on the variation of flexural behaviour by the imposition of thermal
conditioning and high temperature exposure on micro- and nano-particle embedded Cu based
composites.
a. Thermal shock
The composites are exposed to temperature gradient of 160°C (from 80°C to -80°C i.e. down-
thermal shock, and -80°C to +80°C temperature i.e. up-thermal shock). This thermal shock
experiment revealed that the flexural strength of microcomposites increases after down- as well
up-thermal shock treatments. Whereas, for nanocomposites there is an incremental improvement
in flexural strength after down-thermal shock conditioning and the decrease of its value has been
observed after up-thermal shock treatment.
The larger surface/volume ratio in alumina nanoparticles in comparison to microparticles implies
more surface area contact with the copper matrix for the former. The implications of thermal
treatments for both the up-and down-thermal shocks are likely to affect more particle/matrix
interfaces in nanoparticles embedded copper matrix system. Thus it may reasonably be proposed
that the differential co-efficient of thermal expansion of copper and alumina may manifest larger
amount of interfacial damage in nanosystem, because of an exposure to a temperature gradient in
a short span of time. That is why more degradation has been observed in nanocomposites.
The enhancement of property has also been observed in few cases for both the systems. This may
be manifested by an improvement in mechanical keying factor. The improvement by keying
factor may sometimes get nullified and/or diminished during exposure in an opposite direction of
thermal cycling. These contradictory and inconclusive natures of behaviour might be attributed
by the generation of opposite and complex residual stresses during exposure to high to low and
low to high temperature cycles.

Chapter 3 Results and Discussion
153
b. Thermal conditioning
The specimens had experienced a temperature of +80°C and -80°C separately which were
conditioned at that temperature for an hour. The microcomposites reflect a decrease in flexural
strength after +80°C temperature conditioning. Nanocomposites show an increase in flexural
value at +80°C temperature, and decrease at -80°C temperature conditioning respectively.
The reduction in mechanical property during cryogenic conditioning may be attributed by the de-
cohesion between alumina particle and copper matrix in nanocomposites. This might have been
manifested because of large difference in co-efficient of thermal contraction between particle and
matrix.
The high temperature exposure of nanocomposites has demonstrated an increase in mechanical
property. It may be reasonably assumed that differential expansion may be leading to better
particle matrix registry and thereby closer proximity is ensured.
The lower surface area/volume ratio of microparticle in comparison to the nanoparticle
embedded copper matrix has shown no significant changes for cryogenic temperature
conditioning and a decline in flexural strength at high temperature conditioning. The forced close
intimacy of the alumina microparticle and matrix at high temperature leads to development of
residual stresses at the particle/matrix interfacial region. This non-uniform distribution of
residual stresses may decrease the threshold value of crack nucleation and propagation along the
particle/matrix interface region. The differential co-efficient of thermal expansion between
alumina particle and copper matrix has lesser impact and implications either in advancement or
declination of mechanical property in micro-alumina reinforced copper composites.
c. High temperature in-situ flexural test
The composites were tested at 100°C and 250°C temperatures, and these temperatures were
maintained constant throughout the experiment. The increase in flexural strength at 100°C and
decrease in flexural strength at 250°C discusses about the poor high temperature sustainability of
microcomposites. The nancomposites also reveal low flexural strength at 250°C.
The increase in flexural strength at 100°C is due to the effective gripping of alumina particle and
copper matrix due to relatively higher expansion of copper than alumina. The residual stress

Chapter 3 Results and Discussion
154
development triggers the forced close registry between particle and matrix imposed by high
temperature (250°C) conditioning. This may not be conducive for the generated residual stresses
to be distributed properly and uniformly. These accumulated non-uniform residual stresses may
decrease the threshold value of crack nucleation and propagation along the particle/matrix
interface region.
3.3.7 Summary and Conclusions
Cu-Al2O3 and Al-Al2O3 micro- and nano-composites were fabricated by conventional powder
metallurgy route. Both up- and down-thermal shock treatments enhance the ultimate flexural
strength of Cu-Al2O3 and Al-Al2O3 microcomposites. Thermal conditioning at +80°C improves
the ultimate flexural strength of Cu-Al2O3 nanocomposites and Al-Al2O3 micro- and nano-
composites. Thermal conditioning at -80°C elevates the ultimate flexural strength of Al-Al2O3
nanocomposites. At high operating temperatures (i.e. 250°C) the ultimate flexural strength of
both Cu-Al2O3 micro- and nano-composites decreases but for Al-Al2O3 microcomposites the
strength increases. SEM micrographs reveal ductile mode of fracture for both micro- and nano-
composites. The nanoparticles in nanocomposites have higher surface area as compared to
microparticles in microcomposites. So, the thermal shock induced stress in nanocomposites is
more visible in terms of degradation and enhancement of flexural strength. The development and
detoriation of physical integrity of composite is predominant in nanocomposites than
microcomposites. Noticeable differences in the flexural strength and response to thermal
exposures of the micro- and nano-composites have been observed, and have been explained in
terms of difference in their fracture surface microstructures.

Chapter 3 Results and Discussion
155
References
[1] B. Inem, G. Pollard, Interface structure and fractography of a magnesium-alloy metal-
matrix composite reinforced with SiC particles, J. Mater. Sci. 28 (16) (1993) 4427-4434.
[2] B.C. Ray, Effects of thermal and cryogenic conditionings on mechanical behaviour of
thermally shocked Glass Fiber/Epoxy composites, J. Reinf. Plast. Compos. 24 (7) (2005)
713-717.
[3] G. Meijer, F. Ellyin, Z. Xia, Aspects of residual thermal stress/strain in particle reinforced
metal matrix composites, Composites: Part B, 31 (1) (2000) 29-37.
[4] A. Kostka, J. Lelatko, M. Gigla, H. Morawiec, A. Janas, TEM study of the interface in
ceramic-reinforced aluminium-based composites, Mat. Chem. Phy. 81 (2) (2003) 323-325.
[5] B.C. Ray, Thermal shock on interfacial adhesion of thermally conditioned glass
fiber/epoxy composites, Mater. Lett. 58 (16) (2004) 2175-2177.
[6] S. Ho, E.J. Lavernia, Thermal residual stresses in metal matrix composites: a review Appl.
Compos. Mater. 2 (1) (1995) 1-30.
[7] N. Chawla, C. Andres, L.C. Davis, J.W. Jones, J.E. Allison, The Interactive role of
inclusions and SiC reinforcement on the high cycle fatigue resistance of particle reinforced
metal matrix composites, Metall. Mater. Trans. A 31 (2000) 951-957.
[8] M. Zhao, G. Wu, D. Zhu, L. Jiang, Z. Dou, Effects of thermal cycling on mechanical
properties of AlNp/Al composite, Mat Lett. 58 (12) (2004) 1899-1902.
[9] J.J. Bhattacharyya, R. Mitra, Effect of hot rolling temperature and thermal cycling on creep
and damage behaviour of powder metallurgy processed Al-SiC particulate composite, Mat.
Sci. Eng. A 557 (2012) 92-105.
[10] B.C. Ray, Temperature effect during humid ageing on interfaces of glass and carbon fibers
reinforced epoxy composites, J. Colloid Interf. Sci. 298 (1) (2006) 111-117.
[11] G. Thomas and J. Washburn, Electron microscopy and strength of crystals, Interscience
publishers., New York, 1963, 131-181.
[12] Surajit Kumar Paul, Predicting the flow behavior of metals under different strain rate and
temperature through phenomenological modelling, Comput. Mat. Sc. 65 (2012) 91–99.
[13] G.E. Dieter, Mechanical Metallurgy, McGraw-Hill Book Co., New York, Second Edition
1976, 145-183.

Chapter 3 Results and Discussion
156
[14] E. Martin, A. Forn, R. Nogue, Strain hardening behaviour and temperature effect on Al-
2124/SiCp, J. Mater. Process. Tech. 143-144 (2003) 1-4.
[15] M. Taya, K.E. Lulay, D.J. Lloyd, Strengthening of a particulate metal matrix composite by
quenching, Acta. Metal. Mater. 39 (1) (1991) 73-87.
[16] R.W. Hertzberg, Deformation and fracture mechanics of engineering materials, John Wiley
and sons., Fourth edition., 1996.
[17] L. Ceschini, G. Minak, A. Morri, Tensile and fatigue properties of the AA6061/20 vol.%
Al2O3p and AA7005/10 vol.% Al2O3p composites, Compos. Sci. Technol. 66 (2006) 333–
342.
[18] C.M.L Wu, G.W. Han, Thermal fatigue behaviour of SiCp/Al composite synthesized by
metal infiltration, Composites: Part A 37 (2006) 1858-1862.
[19] Y. Uematsu , K. Tokaji, M. Kawamura, Fatigue behaviour of SiC-particulate-reinforced
aluminium alloy composites with different particle sizes at elevated temperatures, Compos.
Sci. Technol. 68 (13) (2008) 2785-2791.

Chapter 3 Results and Discussion
157
3.4 An exploratory study on the effect of loading rate on flexural strength of
Cu-Al2O3 and Al-Al2O3 micro- and nano-composites
3.4.1 Scope and objectives of the work
Different loading rates are quite probable in several applications of metal matrix composites to
evaluate their crashworthiness [1]. High impact loading conditions are withstood at instances
such as MMC armours, collision of cars and impact of foreign objects on aerospace structures.
Metal matrix composites respond differently to high strain rate loading conditions as compared
to monotonic or quasistatic loading [2]. As loading rate is directly proportional to strain rate, we
can assume the changes in behaviour of material to possess similarity in both the cases. As strain
rate is increased from quasi-static to dynamic, the temperature conditions gradually change from
isothermal to fully adiabatic. There is thermo-mechanical coupling in the adiabatic stress-strain
curves i.e the effects of strain hardening, strain/rate strengthening and thermal softening caused
by the adiabatic temperature increase couple together. The dislocation density is an internal state
variable which is a function of plastic deformation [3]. The heterogeneous microstructure of
composites necessitates the evaluation of mechanical strength at different loading conditions.
Residual stresses also play a vital role in the effect of loading speed on composites. Loading rate
sensitivity of metal matrix composites is a function of loading rate sensitivity of the matrix as
well as the status and stability between particles and matrix [4].
3.4.2 Fabrication of composites
3.4.2a Copper-alumina composite
Copper powder (Loba Chemie) (average particle size~11μm, purity >99.7%) was used as the
matrix material. Alumina powders (Sigma Aldrich) (average particle size~10μm and < 50 nm)
were selected as the reinforcement material. The Cu with 5, 10, 20 vol. % Al2O3 (10 µm)
microcomposites and Cu with 1, 3, 5 vol. % Al2O3 (< 50 nm) nanocomposites powders were
blended separately. The specimens having dimensions (31.5 x 12.7 x 6.3 mm3) were prepared by

Chapter 3 Results and Discussion
158
compacting the powders at a pressure of 500 MPa as per ASTM B 925-08 for 3-point flexural
test. The compacted specimens were sintered conventionally at 900°C for 90 minutes in argon
atmosphere.
3.4.2b Aluminium-alumina composite
Aluminium powder (Loba Chemie) (average particle size~22μm, purity- >99.7%) was used as
the matrix material. Alumina powders (Sigma Aldrich) (average particle size~10μm and < 50
nm) were selected as the reinforcement material. The Al-5, 10, 20 vol. % Al2O3 (10 µm)
microcomposites and Al-1, 3, 5 vol. % Al2O3 (< 50 nm) nanocomposites powders were blended
separately. The specimens having dimensions (31.5 x12.7 x 6.3 mm3) were prepared by
compacting the powders at a pressure of 400 MPa as per ASTM B 925-08 for 3-point flexural
test. The compacted specimens were sintered conventionally at 600°C for 90 minutes in argon
atmosphere.
3.4.3 Effect of loading rate on the flexural strength of composites
3-point flexural test was carried out at loading rates of 0.5, 1, 10, 100, 500, 1000 mm/min for
copper-alumina and aluminium-alumina micro- and nano-composites maintaining a span length
of 26 mm in universal testing machine (INSTRON-5967).
3.4.3a Copper-alumina composite
The flexural strength of copper-alumina nanocomposites increases with increase in loading rate
whereas the microcomposites show an increase-decrease trend (Fig. 3.4.1 & 3.4.2). The effect of
loading rate on the flexural strength of Cu-Al2O3 microcomposites is not statistically significant.
The drop in flexural strength at some instances could be attributed to the presence of non-
uniform crack density. A tendency of increase in flexural strength with increasing loading rate
has been recorded for Cu-1, 3 vol. % Al2O3 nanocomposites. This increase in strength is absent
in 5 vol. % alumina reinforced copper nanocomposites, probably because of higher degree of
agglomeration of nanoparticles, it indicates analogy with microcomposites behaviour for the
loading rate effect. At higher loading rates relaxation time incurred is less hence the composites
become stiffer and exhibit strengthening effect.

Chapter 3 Results and Discussion
159
5 10 15 200
50
100
150
200
Ult
ima
te F
lex
ura
l s
tre
ng
th (
MP
a)
Vol. % alumina
0.5
1
10
100
500
1000
Fig. 3.4.1 Variation in flexural strength of Cu-Al2O3 microcomposites at different loading rates
The relationship between loading rate and strain rate is as follows
Strain rate, (1)
Cross head velocity, (2)
Engineering / Conventional strain rate,
(3)
Hence,
Where Lo is the original length and L is the length after time t [5]

Chapter 3 Results and Discussion
160
The loading rate sensitivity of composites increases with addition of particles which is visible
from Cu-1 vol. % Al2O3 to Cu-3 vol% Al2O3 nanocomposites. The increase in flexural strength
with increasing loading rate could be due to the constrained plastic flow of the matrix, which is
sufficiently high in nanoparticle embedded composites. The strain induced in matrix and
reinforcement is differential in nature and hence this strain mismatch leads to dislocation
generation eventually altering the mobility of dislocations. The degree of misfit strain fluctuates
at varied loading speeds and leads to formation of typical dislocation sub-structures [6].
Particle/matrix interfaces are preferential cavity nucleation sites [7]. Cavitation takes place at
particle/matrix interface at high loading rates during bending test, which grows and leads to
interfacial de-cohesion and ultimately fracture.
0 1 2 3 4 5 60
50
100
150
200
250
300
350
400
Ult
ima
te f
lex
ura
l s
tre
ng
th (
MP
a)
Vol. % of alumina
0.5
1
10
100
500
1000
Fig. 3.4.2 Variation in flexural strength of Cu-Al2O3 nanocomposites at different loading rates
3.4.3b Aluminium-alumina composite
The flexural strength of Al-Al2O3 microcomposites and nanocomposites at different loading rates
has been illustrated in Fig. 3.4.3 & 3.4.4. The Al matrix micro- and nano-composites show
similar trend of possessing higher strength at medium loading rates. As the loading rates increase
the flexural strength initially rises and then drops for both micro- and nano-composites showing

Chapter 3 Results and Discussion
161
an increase-decrease trend. At high strain rates composites experience higher strain rate
sensitivity than the monolithics. Strain rate sensitivity of composites mostly adheres to the strain
rate sensitivity behaviour of the corresponding matrices. Increasing particle content increases
strain rate sensitivity.
5 10 15 200
20
40
60
80
100
120
140
Ult
ima
te f
lex
ura
l s
tre
ng
th (
MP
a)
Vol. % alumina
0.5
1
10
100
500
1000
Fig. 3.4.3 Variation in flexural strength of Al-Al2O3 microcomposites at different loading rates
At higher loading rates the stress transmissibility from the matrix to reinforcement particle may
not take place effectively due to time constraint, so it becomes more of a matrix phenomenon. At
medium loading rates near uniform load distribution is anticipated; hence the composites possess
higher strength at medium loading rates.

Chapter 3 Results and Discussion
162
0 1 2 3 4 5 60
5
10
15
20
25
30
35
40
45
50
Ult
ima
te f
lex
ura
l s
tre
ng
th (
MP
a)
Vol % of alumina
0.5
1
10
100
500
1000
Fig. 3.4.4 Variation in flexural strength of Al-Al2O3 nanocomposites at different loading rates
3.4.4 Summary and Conclusions
Loading rate sensitivity is evident at lower range of loading rates, thereafter strength decreases
with increase in loading speed. Cu-Al2O3 and Al-Al2O3 composites are seemingly loading rate
sensitive materials. As the dislocation density evolution is different at different loading rates,
these materials are loading rate sensitive. The flexural strength with respect to crosshead speed
of copper and aluminium based composites varies with size and content of alumina particles.
References
[1] S. K. Paul, Predicting the flow behaviour of metals under different strain rate and
temperature through phenomenological modelling, Comp. Mater. Sci. 65 (2012) 91-99.
[2] Y. Zhou, Y. Xia, Experimental study of the rate sensitivity of SiCp /Al composites and the
establishment of a dynamic constitutive equation, Compos. Sci. Tech. 60 (2000) 403-410.
[3] J.A. Rodriguez-Martinez, M. Rodriguez-Millan, A. Rusinek, A. Arias, A dislocation-
based constitutive description for modelling the behaviour of FCC metals within wide
ranges of strain rate and temperature, Mech. Mater. 43 (2011) 901-912.

Chapter 3 Results and Discussion
163
[4] G. Bao, Z. Lin, High strain rate deformation in particle reinforced metal matrix
composites, Acta. Mater. 44 (3) (1996) 1011-1019.
[5] G.E. Dieter, Mechanical Metallurgy, McGraw- Hill, London, United Kingdom, Third
Edition 1988.
[6] S. Yadav, D.R. Chichili, K.T. Ramesh, The mechanical response of a 6061-T6 Al/Al2O3
MMC at high rates of deformation, Acta. Metall. Mater. 43 (12) (1995) 4453-4464.
[7] G. Q. Tong, K.C. Chan, High strain rate superplasticity of an Al-4.4Cu-1.5Mg/21SiCw
composite sheet, Mat. Sci. Eng. A 286 (2000) 218-224.

Chapter 4 Summary and Conclusions
164
Chapter 4
Summary and Conclusions
This thesis studies the problem of structural integrity with the variation of fabrication parameters
and also by inducing thermal stresses in copper and aluminium matrix composites varying the
reinforcement particle size (i.e. micro- and nano-particles) and volume fraction. The comparison
in micro-structural integrity both for micro- and nano-composites have been recorded at all
points of experimentation (i.e. for variation in fabrication parameters and thermal conditionings)
with the help of electron microscopy.
Cu-5 vol. % Al2O3 and Al-5 vol.% Al2O3 micro-and nano-composites were fabricated by
milling and blending of copper-alumina and aluminium-alumina powders followed by
conventional sintering. Milling reduces the particle size of composite powders with
increasing milling time. X-ray diffraction, particle size analysis and microstructure reveal
particle size reduction and good distribution of alumina particles in copper and
aluminium matrix powders. Microhardness values of milled samples are higher than
blended samples. Blending of powders followed by sintering impart higher density than

Chapter 4 Summary and Conclusions
165
milled and sintered samples. Grain refinement of copper and aluminium is observed with
increasing milling time. Milling process demonstrates plastic deformation, micro-welding
and particle fragmentation as evident from SEM micrographs.
The Cu-Al2O3 microcomposites fabricated via conventional sintering route in nitrogen,
argon and hydrogen atmospheres yielded appreciable properties for hydrogen
atmospheres. The densification process is more efficient in the case of hydrogen than in
nitrogen or argon atmosphere. The microstructure of the composites sintered in hydrogen
atmosphere reveals better matrix-reinforcement bonding. The problem of poor interfacial
bonding in nitrogen and argon atmosphere has been addressed up to a certain extent using
hydrogen atmosphere. The EDS analysis also proves the same. The formation of Cu2O
during sintering in nitrogen and argon atmosphere reduced the extent of bonding between
copper and alumina. The density and hardness values are also in accordance to the above
fact.
The Cu-Al2O3 and Al-Al2O3 micro- and nano-composites were fabricated by blending-
compaction-sintering powder metallurgy route at different sintering temperatures. The
microcomposites possess better properties (density and hardness) at higher sintering
temperatures. Whereas the nanocomposites show appreciable properties at low
temperatures. The incorporation of Al2O3 nanoparticles strengthens the matrix to a
greater extent resulting in increase of microhardness compared to Al2O3 microparticles.
The microstructures of micro- as well as nano-composites demonstrate better distribution
in the later. Compressive strength is highest for the Cu-15 vol. % Al2O3 microcomposites.
Flexural strength drops with increase in alumina content. Fractography of the
microcomposites and nanocomposites revealed mixed mode of fracture in both the cases.
The wear resistance of nanocomposites is higher than the microcomposites under the
same experimental conditions. The rise in reinforcement content imparts higher
microhardness, low density and high wear resistance values for both the systems.
Cu-Al2O3 and Al-Al2O3 micro-(1, 5, 20 vol. %) and nano-(0.5, 1, 3, 5, 7 vol. %)
composites were fabricated by spark plasma sintering technique. In Cu-Al2O3 system,

Chapter 4 Summary and Conclusions
166
XRD analysis shows the presence of Cu, Al2O3 and CuAlO2 in both the micro- as well as
nano-composites. The SEM micrographs show the presence of annealing twins during
fabrication by SPS in both nano- and micro-composites. TEM micrographs suggest the
formation of a third phase i.e. CuAlO2 (copper aluminate) around the alumina particles.
The hardness measurements show that the nanocomposites are harder than
microcomposites. The wear resistance of microcomposites is higher than the
nanocomposites. The possible wear mechanisms for both composites are microploughing,
delamination as well as microcrack formation. The wear mechanisms operating in the
micro- and nano-composites is dominated by the reinforcement particle size effect and
their implications. We have obtained 95.82% densification and 93.17 HV0.3 hardness for
spark plasma sintered Cu-20 vol. % Al2O3 microcomposite. The elastic modulus of Cu-
1% alumina nanocomposite is obtained as 128 GPa. The wear rate is appreciably low i.e.
0.86 x 10⁻⁴
mm3N
-1m
-1 for 20 vol.% alumina reinforced copper microcomposite.
In Al-Al2O3 system, the distribution of alumina particles in the aluminium matrix is
homogeneous and uniform both in nanocomposites and microcomposites (slightly better
distribution in nanocomposites than microcomposite). The interface of aluminium and
alumina in nanocomposites is seemingly sound than in the case of microcomposite i.e.
the compatibility of alumina in aluminum matrix in nanocomposites is better than in the
microcomposites. The TEM and SEM micrographs reveal a lack of intimate proximity
between matrix and reinforcement entities in microcomposites. Almost full densification
in case of 1 vol. % alumina reinforced nano- and microcomposites have been achieved.
The density of microcomposites as well as nanocomposites decreases with increasing
alumina content. The nanoindentation hardness of nanocomposites is higher than the
corresponding microhardness values. The highest nanohardness recorded was 0.85 GPa
for 7 vol. % Al-Al2O3 nancomposites.
Up- and down-thermal shock treatments enhance the ultimate flexural strength of Cu-
Al2O3 and Al-Al2O3 microcomposites. The variation of flexural strength is contradictory
and far from comprehensive conclusion in Cu-Al2O3 nanocomposites. Thermal

Chapter 4 Summary and Conclusions
167
conditioning at +80°C temperature improves the ultimate flexural strength of Cu-Al2O3
as well as Al-Al2O3 nanocomposites. Al-Al2O3 nanocomposites get thermally conditioned
at -80°C too. At high operating temperatures (i.e. 250°C) the ultimate flexural strength of
both Cu-Al2O3 micro- and nano-composites decreases. Al-Al2O3 nanocomposites show
elevation of flexural strength at 100°C, whereas the strength again falls at 250°C,
whereas the microcomposites show positive trend for both 100°C and 250°C
temperatures. SEM micrographs reveal ductile mode of fracture for both micro- and
nano-composites. Ductile fracture characteristics have been observed predominantly for
Cu-Al2O3 and Al-Al2O3 microcomposites. Fracture characters visible in Cu-Al2O3 and
Al-Al2O3 nanocomposites indicate ductile mode of failure. The fracture mechanisms
demonstrated were interfacial de-cohesion, particle cracking, interfacial dis-integrity and
particle pull-out. The nanoparticles in nanocomposites have higher surface area as
compared to microparticles in microcomposites. So, the thermal shock induced stress in
nanocomposites is more visible in terms of degradation and enhancement of flexural
strength. The development and detoriation of physical integrity of composite is
predominant in nanocomposites than microcomposites. Noticeable differences in the
flexural strength in response to thermal exposures of the micro- and nano-composites
have been observed, and have been explained in terms of difference in their fracture
surface microstructures.
Cu-Al2O3 and Al-Al2O3 composites are loading rate sensitive materials. The flexural
strength of copper and aluminium based composites varies with size and content of
alumina particles. Loading rate sensitivity is evident at lower range of loading rates,
thereafter strength decreases with increase in loading speed. As the dislocation density
evolution is different at different loading rates, these materials are loading rate sensitive.

168
List of papers based on the thesis
International Journal publications
[1] K. Dash, S. Panda and B.C. Ray, “Effect of thermal and cryogenic conditioning on
flexural behavior of thermally shocked Cu-Al2O3 micro- and nano-composites”,
Metallurgical and Materials Transactions A (accepted) DOI: 10.1007/s11661-013-
2070-7.
[2] K. Dash, D. Chaira, B.C. Ray, “Synthesis and characterization of aluminium-alumina
micro- and nano-composites by spark plasma sintering”, Materials Research Bulletin.
48 (2013) 2535-2542.
[3] K. Dash, B.C. Ray and D. Chaira, “Synthesis and characterization of copper-alumina
metal matrix composite by conventional and spark plasma sintering”, Journal of Alloys
and Compounds. 516 (2012) 78– 84.
[4] S. Panda, K. Dash and B.C. Ray, “Processing and properties of Cu based micro- and
nano-composites”, Bulletin of Materials Science (accepted).
[5] K. Dash, S. Panda and B.C. Ray, “Process and progress of sintering behavior of copper-
alumina composite”, Emerging Materials Research. 2 (2013) 32-38.
[6] S. Gupta, K. Dash and B.C. Ray, “Analysis of properties of copper-alumina composites
produced by various processing routes: a review”, Journal of Materials and
Metallurgical Engineering. 2 (2012) 11-23.
[7] K. Dash, D. Chaira and B.C. Ray, “Microstructural investigation and wear studies on
copper-alumina micro- and nano-composites fabricated by spark plasma sintering”,
(under review) Metallography, Microstructure and Analysis.
[8] K. Dash, S. Sukumaran, B.C. Ray, “The behaviour of aluminium based composites under
thermal stresses”, (under review) Science and Engineering of Composite Materials.

169
International proceedings
[1] K. Dash and B.C. Ray, “A study on thermal shock response of Al-Al2O3 micro-and
nanocomposites”, 19th International conference on composite materials, 28th
July-2nd
August, Montreal, Canada.
[2] K. Dash, S. Gupta, S. Gupta and B.C. Ray, “Effect of thermal shock on the
microstructure and mechanical properties of Cu-Al2O3 composites”, International
conference on recent advances in composite materials, Feb 18th
-21st 2013, Goa.
Conferences attended and published abstracts
[1] K. Dash, D. Chaira and B.C. Ray, “Microstructural Studies of Al-Al2O3
Nanocomposites Prepared by Powder Metallurgy Route”, National Metallurgical
Day-Annual Technical Meeting Nov-2011, Hyderabad.
[2] K. Dash, D. Chaira and B.C. Ray, “Characterization of SPS sintered Cu-Al2O3 metal
matrix nanocomposites”, ICAMMP, IIT Kharagpur, Dec 9-11, 2011.
[3] K. Dash, D. Chaira and B.C. Ray, “Comparative study of Al-Al2O3 Micro- and Nano-
composites Prepared by Powder Metallurgy Route”, International Conference on
Nanoscience + Technology (ICNT) 2012, 23-27 July, Paris.
[4] K. Dash, S. Panda and B.C. Ray, “Failure analysis of Cu-Al2O3 composites with the
variation of reinforcement particle size and content”, International conference on
strength of materials, IISc Bangalore, Aug 19-24, 2012.
[5] K. Dash, S. Gupta, S. Gupta and B.C. Ray, “Effect of sintering temperature on Al-
Al2O3 composites fabricated by powder metallurgy route”, National Metallurgical
Day-Annual Technical Meeting Nov-2012, Jamshedpur.
Awards
K. Dash and S. Panda, “A micromechanics approach to evaluate the interface of metal
matrix composites”, New idea poster competition, CSIR foundation day, IMMT
Bhubaneswar, 26th
Sept, 2011.

170
Biography of the scholar
Khushbu Dash was born in Raipur, Chattisgarh, India on 17th
August, 1985. She finished her
schooling from Carmel School, Rourkela (ICSE board) and intermediate from Deepika E.M.
School, Rourkela (CBSE board). She obtained her bachelors in science (B.Sc) from Osmania
University, Hyderabad with biotechnology, biochemistry and chemistry subjects in 2006. She
pursued her masters in science (M.Sc chemistry) from National Institute of Technology, Rourkela
in 2008. She got selected under the Indian Academy of Science banner to take up her summer
project in Indian Institute of Science, Bangalore under Prof D.D. Sarma in solid state structural
chemistry unit in the field of zinc oxide nanocrystals. She completed her final year masters
project in the field of core-shell nanocomposites under Prof G. Hota in National Institute of
Technology, Rourkela. She served a premier institute named FIITJEE ltd in New Delhi for 1 year
in 2008-09 where she taught chemistry to intermediate students who were aspirants of IIT-JEE
exam which is India’s toughest exam to crack to get into undergraduate program in engineering
in leading institutes of India i.e. to the IITs. She qualified the CSIR-UGC NET exam in her M.Sc
final year which entitled her to obtain fellowship during PhD programme. She enrolled herself
for pursuing PhD in the department of Metallurgical and Material Engineering, National
Institute of Technology, Rourkela in 2009 financed by MHRD, Govt of India, under Prof Bankim
Chandra Ray and Prof. Debasis Chaira working on the thesis titled “Processing and
characterization of Cu-Al2O3 and Al-Al2O3 composites: an evaluation for micro- and nano-
particulate reinforcements”. She worked with spark plasma sintering in the Indian Institute of
Technology, Kanpur, with transmission electron microscopy, in Indian Institute of Technology,
Kharagpur and with nanoindentation in the Institute of Materials and Minerals Technology,
Bhubaneswar. She has published papers in frontier journals such as Metallurgical and Materials
Transactions A, Materials Research Bulletin, Journal of Alloys and Compounds and Bulletin of
Material Science. Her research interests comprises of metal matrix composites, powder
metallurgy, thermal loadings, loading rate and electron microscopy of interfaces in composites.
She is interested to pursue post-doctoral research in an internationally renowned university in
the line of core materials engineering to unravel the science of interface behind the composite
technology.


![Deformation and fracture of Al O Al–Zn–Mg–Cu metal matrix ... · 194 Y.-L. Wu, C.-G. Chao:Materials Science and Engineering A282 (2000) 193–202 Al 2 O 3 [8]. The most probable](https://img.pdfslide.us/doc/110x75/5ec3d5bf84b2514dc0007a05/deformation-and-fracture-of-al-o-alaznamgacu-metal-matrix-194-y-l-wu.jpg)