Embed Size (px)
Citation preview

1
Processes in model slopes made of mixtures of wettable and water repellent sand:
implications for the initiation of debris flows in dry slopes
Sérgio D.N. Lourenço1, Gong-Hui Wang2, Toshitaka Kamai2
1 Department of Civil Engineering, The University of Hong Kong, Pokfulam Road, Hong
Kong SAR; [email protected]; +852 3917 2672; corresponding author
2 Disaster Prevention Research Institute, Kyoto University, Gokasho, Uji 611-0011, Japan
2
Abstract
Debris flows in slopes initially dry, such as post-wildfire debris flows, are initiated by surface
runoff and sediment bulking due to reduced infiltration. Soil water repellency, extreme dry
soils, and loose, cohesionless materials influence their initiation. The exact link between
these features, the resulting infiltration processes and the initiation mechanism of a debris
flow remains unclear. Here, we examine the relation between soil particle wettability and
slope processes in physical models. Flume experiments were conducted in 10% increments of
mass ratiosof wettable to water repellent sand, subjected to artificial rainfall with monitoring
of soil water content, pore water pressure, sediment and water discharge and failure mode. To
date, wettability was considered only for the water repellent end, because it reduces
infiltration, enhancing surface runoff. This study demonstrates that slight wettability changes,
in the full wettable to water repellent range, impact a variety of slope processes. The two
extremes, fully wettable and water repellent gave opposite responses, retrogressive slides for
infiltration-initiated in wettable sand and erosion by surface runoff in water repellent sand.
The transition was dominated by surface runoff and preferential flow, yielding a combination
of erosion and slides. From the tests, a continuous capping effect generated by water
repellency was a necessary condition for erosion and sand bulking i.e. the generation of
runoff-initiated debris flows. The sensitivity of the model slope response to artificial rainfall
was particularly acute at high ratios of wettable to water repellent sand. For mixtures above a
critical ratio of wettable to water repellent sand, the measurements with an index test revealed
a fully wettable material despite differences in the infiltration, saturation and pore water
pressure built-up trends. Implications for post-wildfire debris flows and debris flows in slopes
initially dry in general are discussed.

3
Keywords
Debris flows, soil particle wettability, wildfires, dry soils, flume tests

4
1. Introduction
Debris flows are often mobilized by a shallow slide in response to infiltration, saturation and
rising pore water pressures (Ellen and Fleming, 1987). However, this mechanism does not
hold for slopes affected by wildfires, where debris flows are triggered by surface runoff and
sediment bulking in response to short duration, high intensity rainfall events (Wondzell and
King, 2003, Cannon and Gartner, 2005). In such cases, the key factor controlling infiltration
is soil water repellency, the others being extreme dry soils (Moody and Ebel, 2012) and
sealing of pores by ash (Mallik et al., 1984, Gabet and Sternberg, 2008, Woods and Balfour,
2010). Soil water repellency (Figure 1) develops with the presence of organic water repellent
substances (generated by the wildfires but also naturally occurring) and when the soil
becomes dry (Doerr et al., 2000), and is quantified via the contact angles of water drops in
contact with the soil, wettable soils have contact angles <90° and water repellent soils >90°.
The general term ‘soil particle wettability’ includes wettable and water repellent soils.
The ninety-degree contact angle represents a threshold at which the mechanical and hydraulic
behavior of the soil, and therefore the slope response, is expected to change. The significance
of the threshold can be demonstrated with Young-Laplace equation, which states that soil
particle wettability (θ) relates to matric suction (s), and the radius (r) and surface tension (T)
of the water menisici via s = 2Tcosθ r⁄ (Fisher, 1926). Matric suction, which controls
unsaturated soil behavior (Fredlund and Rahardjo, 1993), will be the highest for low contact
angles (wettable soils) and the lowest for high contact angles (water repellent soils). This
suggests that soils with high contact angles are likely to be mechanically weaker, therefore
more prone to landslides. Byun et al. (2011) showed decreasing friction angles for synthetic
water repellent soils. For the capillary rise in unsaturated soils, the same equation can be
rewritten as, h = cosθ2T/rρg, where h is the capillary rise, ρ is the density of water, and g
the gravitational constant. Water will only rise (or infiltrate) for contact angles <90°. For

5
contact angles >90°, water will only infiltrate when the water-entry pressure is exceeded (the
height of water above the water repellent surface).
Soil wettability however is a dynamic property, sensitive to soil-atmosphere interactions. Soil
wettability depends on a critical water content: soils are water repellent for a water content
lower than the critical and wettable for a water content higher than the critical (Dekker et al.,
2001). Recent work has also shown that the soil water retention is affected by soil wettability.
Soils with contact angles <90° have reduced water retention i.e. they are drier than an
equivalent wettable soil when dried to the same suction (Arye et al., 2011, Lourenço et al.,
2015). Importantly, wettability of natural soils is time-dependent, it may decay or enhance
with time and switches from wettable to water repellent, and vice-versa, may also occur with
time (Morley et al., 2005) and, it has a patchy distribution in natural soils with wettable and
water repellent regions spread across the ground (Granged et al., 2011, Jackson and Roering,
2009).
Given the variability of soil wettability, both in time and space, and its threshold-dependent
behavior, addressing its role on debris flow initiation is a challenge still to be undertaken.
Moreover, debris flow initiation has been documented for the wettable and water repellent
ends with little appreciation for the slope response at the transition wettable to water
repellent, for instance, for situations where soils may be slightly water repellent.
Here, through a series of physical experiments we document the role of soil particle
wettability in the transition from infiltration to runoff-triggered debris flows by considering
the whole wettability spectrum, from wettable (<90°) to water repellent(>90°), by mixing the
same material to different ratios of soil with and without water repellent substances. This will
reveal whether the transition between runoff and infiltration-initiated debris flows is gradual
or threshold-controlled (90°) and will provide an insight into the various processes. To
minimize other effects, differences between the experiments will be exclusively due to

6
changes in the affinity of the particle surfaces’ for water, with all tests starting under the same
initial physical conditions (e.g., material, grain-size distribution and density).
This study arises from a context of post-wildfire debris flows, but the results could be
applicable to debris flows in some forested areas (where soils are likely to develop water
repellency) (Doerr et al., 2006) and to debris flows in dry soils in general, those likely to be
initiated by first-time rainfall events at the end of the dry season or after dry weather spells
(Coe et al., 2008). Runoff-initiated debris flows linked to fully wettable, saturated soils are
not covered here.
2. Materials and Methods
2.1. Wettability treatment
To induce and adjust the wettability level, the initial strategy was to use natural oily water
repellent substances because they simulate natural water repellent substances more closely,
allow switches from wettable to water repellent (and vice-versa) and take into account the
time-dependency of soil particle wettability (the contact time with water) (Morley et al.,
2005). However, as the laboratory procedures are time-consuming and large amounts of
treated material were required, permanent water repellent coatings by silanization (i.e. a
synthetic water repellent treatment) were used instead. Despite being artificial, permanent
water repellent coatings have also been used in other soils studies (Liu et al., 2012). Note
that, in these experiments, we name wettable soils those without water repellent substances
and water repellent soils those with water repellent substances.
In this study water repellency was induced by treatment with dimethyldichlorosilane
(DMDCS) and the wettability level adjusted by mixing wettable and water repellent material
to different proportions by mass. The fully wettable sample was non-treated and the fully
water repellent sample made of 100% treated material. This could constitute an advantage,

7
since water repellency is characterized by spatial variability or patchy distribution both
vertically and horizontally (Granged et al., 2011) meaning water would preferably flow
through the wettable particles. This co-existence of wettable and water repellent particles has
been named fractional wettability (Beatty and Smith, 2010).
To avoid material variability and as post-wildfires debris flows occur in granular soils, a
medium-sized industrial silica sand was used (SS#7). SS#7 is a uniform, fine silica sand with
mean grain size (D50) of 0.13 mm and uniformity coefficient (Uc) of 2.1. The maximum void
ratio (emax) is 1.23. The grain size distribution is shown in Figure 2 and material properties in
Table 1. This material has also been used in numerous laboratory studies on the mobility of
landslides (Wang and Sassa, 2003).
To induce contact angles >90°, the material was removed from the bags, in its natural
wettable state, and mixed in a fume hood with a glass beaker and glass rod in portions of
500g of sand to 0.5 ml DMDCS. The treatment was complete after 5 minutes mixing. The
treated material was then stored in a large bin until further use.
To prepare the mixtures, the fully water repellent sand was mixed with the wettable sand
(freshly removed from the bags) at the following proportions by weight (w = wettable, wr =
water repellent): 100% w; 90% w + 10% wr; 80% w + 20% wr; 70% w + 30% wr; 60% w +
40% wr; 50% w + 50% wr; 40% w + 60% wr; 30% w + 70% wr; 20% w + 80% wr; 10% w +
90% wr; 100% wr. Since temperature is known to influence soil particle wettability
(Atanassova and Doerr, 2011), no oven drying was conducted prior or after the treatment.
Residual water content, which could have been present in the samples prior the treatment or
the flume tests, was not measured.
To assess soil particle wettability, the Water Drop Penetration Time test (WDPT) was
conducted with a sample of approximately 50g immediately before the flume test. The
WDPT is an index test, widely used in soil science in sandy samples (Doerr et al., 2006). The

8
WDPT quantifies the persistence of water repellency i.e. its time decay. The WDPT consisted
in a placing water drops (volume 10 µl, 6 repeats) and timing its complete penetration. For a
wettable sand, water penetrates immediately; water repellent substances delay or completely
impede infiltration. Based on the penetration times, the samples were classified according to
the wettability classes provided by Doerr et al. (2006).
One further sample was collected from each mixture, sealed in a plastic and transported to
Cardiff University (UK) one month later to measure the apparent contact angles. The contact
angle is a physical parameter quantifying wettability and widely used in surface science
(Bachmann et al., 2000). By means of the sessile drop method, three drops of 10 µl were
placed on a layer of sand for each mixture, a video recorded with the goniometer (DSA25,
Kruss) and the first contact angle, measured on the left and right-hand side of the drop from
the time-sequence.
2.2. Model set-up and instrumentation
An important initial question was whether debris flows in soils of different wettability could
be generated on a laboratory scale. Debris flows have been induced in the laboratory in
metric and centimetric sized models, to investigate their initiation and post-failure dynamics
(e.g. Iverson, et al., 2011, Wang and Sassa, 2001). Also, soil water repellency or wettability
changes develop at very shallow depths (few centimeters) (Doerr et al., 2000). Therefore, no
exact scale modelling (as in a centrifuge) has been attempted here. Careful observations and
monitoring the response of the wettable/water repellent mixtures to rainfall were judged at
least qualitatively similar, in terms of dominant processes, to the field.
To test the relation between the failure and infiltration mode to soil particle wettability, we
carried out 11 experiments in a glass-sided 1.5 m long, 45 cm high and 29.75 cm wide flume.
The bottom of the flume was impervious, covered with coarse sand paper (average particle

9
size 0.5 mm) to increase friction and avoid sliding at the sand-flume interface. The physical
model had a trapezoidal shape, 15 cm height, 15 cm wide and 75 cm long. The model slope
surface was inclined at the angle of repose of the material (38±1°), (Figure 3). The high
length to width ratio (75 cm by 15 cm) was to provide a wider surface in contact with the
rainfall and enhance both infiltration (for the wettable mixtures) and runoff (for the water
repellent mixtures). The initial slope angle at 38° (angle of repose) was intended to simulate a
slope at imminent failure, and potentially, to trigger faster failures.
The sand mixtures were deposited in an air dried state in 5 kg loads until 45 kg was present.
The 5kg loads were dropped from a bucket from a height of ~5 cm across the length of the
model. For each deposit, the surface was gently spread with a ruler in a single layer until
covering the area of the model. This resulted in a layer thickness of around 1 cm for the
bottom layers, reaching 2 cm at the top (due to the trapezoidal shape of the model). No
compaction was conducted in order to achieve a very loose condition. Before each test, the
mass, volume and model angles (38±1°) were measured to obtain the void ratio (1.17±0.04).
The water content was not measured and assumed zero. Failure was induced by artificial
rainfall, by means of one nozzle with pressure control; rainfall intensity was measured for
each test. The pressure of the tap water was adjusted manually so that the rainfall intensity
was similar for all tests. The height of the nozzle was also adjusted so that the radial spray
exceeded the width of the model but not the length (or the water discharge would be higher).
Importantly, the wetting front advance in the 100% wettable tests was used to assess how
uniform was rainfall across the model. A wetting front advance parallel to the surface implied
uniform rainfall intensity across the model (as shown in Figure 6d). Overall, the rainfall
intensity was 34±7 mm/h. As the model was being built, four nests made of soil moisture
sensors and pressure transducers were set up to capture the spatial evolution of infiltration
and pore water pressure generation. The nests were placed at 5 cm depth and 10 cm depth.

10
The soil moisture sensors (EC-5, Decagon Devices) measured the volumetric water content
and the pressure transducers (PGM-02 kg, Kyowa, maximum capacity 20 kPa) the positive
pore water pressure. Both were calibrated in the same material at different water contents
(soil moisture sensors) and increasing head of water (pressure transducers). The pressure
transducers were fitted with a cap with a small orifice (diameter 0.12 cm), and the gap inside
the cap filled with water. The air entry value was estimated at 0.24 kPa (using Young-
Laplace equation) suggesting the reservoir would desaturate when in contact with the sand.
Therefore, a delay in the pore water pressure increase due to air bubble formation is possible.
The pressure transducers sample 10 measurements per second and the soil moisture sensors 1
measurement per minute. Since soil particle wettability is influenced by environmental
parameters (Doerr et al., 2002), the ambient temperature and Relative Humidity were
recorded before each test.
The failure mode (and infiltration process) was followed visually by recording the whole
failure sequence. The video camera was set on the side, oblique to the model in an elevated
position to capture both the sides and top surfaces of the model (Figure 3). Video recordings
were always conducted from the same side of the flume.
Sand and water discharge were measured at the bottom of the flume with a sieve (aperture 63
µm) and bucket. Since the physical model occupied the top 75 cm of the flume, a plastic
sheet was placed from the bottom of the model until the end of flume in order to drain the
water and sand (Figure 3). The plastic sheet was effective in the drainage of water, when it
reached the toe it would flow out of the flume within ∼3 seconds. However, there was a delay
in the discharge of sand, as it would accumulate rather than drain out. Therefore, for water
discharge, the timing is similar to that at the toe of the model while for the sand discharge
there is a delay that could not be quantified.

11
The initial model conditions and environmental laboratory parameters are shown in Table 2.
The initial void ratio was high (1.17±0.07) but lower than the emax for this material (1.23),
with the exception of test 1 with 100% wettable sand (void ratio was 1.24 which is likely to
reflect experimental error). This was the highest initial void ratio possible to achieve with the
model preparation method. Rainfall intensity was 34±7 mm/h, and the temperature and
Relative Humidity, ∼27.5 ±0.5°C and 86±6%, respectively (Table 2). The flume tests were
conducted in a temperature controlled room at 28°C. The temperature and Relative Humidity
were kept elevated during the test to match the outside weather conditions (hot and humid at
the time) and avoid large diurnal fluctuations (the temperature control would switch off
automatically).
Typically, the sand treatment was conducted in the morning, the flume set-up by mid-day and
the full test with the artificial rainfall later in the afternoon. Each flume test did not exceed 35
minutes. The flume tests were stopped when a steady state condition was reached or all
instrumentation had been severely disrupted by the deformation of the model. The flume was
then cleaned, the material disposed (no sand was re-used), and all flume surfaces wiped dry.
Data analysis was conducted, firstly by calibrating all raw data, followed by synchronizing
the times for all datasets. In total there was five datasets timed separately: the soil moisture
sensors and pressures transducers used separate data loggers, all ten test were filmed in a
single file, sand and water discharge measurements, and hand notes of special events or
features during the tests. All datasets were zeroed based on the time of the rainfall start, since
for the water repellent mixtures surface runoff would start immediately with rainfall. The
infiltration and failure modes were based on the video recordings and the sand and water
discharge measurements taken at discrete times.

12
3. Results
3.1. Wettability threshold
Soil particle wettability was the first parameter to be measured. According to the WDPT data,
the transition in soil particle wettability for the different mixture ratios was abrupt, rather than
linear or gradual, with a threshold at 50w+50wr (Figure 4a). Mixtures from 100 % wettable
to 60 % wettable were fully wettable i.e. the water drop would penetrate immediately,
followed by a transition for 50 % wettable and 40 % wettable, and ending in extreme water
repellency for 30 % wettable until 100 % water repellent.
The apparent contact angles measured by the sessile drop method did not agree with the
WDPT data. All mixtures became more water repellent with contact angles in the range 101°-
148° except the wettable sample at 9.9° (Figure 4b). We assumed the two parameters would
agree, at least, for the water repellent soils with high contact angles and long WDPTs.
Reasons for this increased water repellency include: (1) the transport and shaking of the
samples for the contact angle measurements could have led to further surface reactions by
any residual DMDCS remained in the sample, (2) the contact angles were conducted in
substantially cooler and drier conditions (temperature ∼ 19°C, Relative Humidity ∼ 50%) and,
(3) water repellency is known for being time-dependent (Morley et al., 2005).
Despite the empirical nature of the WDPT, we assume it to provide a reliable account of soil
particle wettability because it was conducted under the same environmental conditions as the
flume tests. We therefore use it in our analysis rather than the apparent contact angles.
To assess the stability of the water repellent condition (whether it changes with time or not),
both the WDPT and contact angles were measured with time for the 100 % water repellent
sand samples. Figure 5a shows the apparent contact angle with time. For 3 seconds, the
droplets in Figure 5b remained stable at 107° without infiltrating. Based on the WDPT data,
the drops remained stable for ≥18000 seconds (Figure 4a). In summary, the water repellent

13
condition was stable, at least, for the duration of the experiments and the behavior observed
attributed to the different wettability levels rather than wettability changes during the tests.
3.2. Model slope processes as a function of soil particle wettability
3.2.1. Rational for data interpretation
Three datasets were produced: (1) failure mode and infiltration depth and patterns; (2)
volumetric water content and pore water pressure; and (3) water and sand discharge. All these
are presented in time series. The flume tests started with the wettable untreated sand followed
by tests in 10% increments until 100% water repellent. The wettable sand is the benchmark
condition to which all the other tests are compared.
Overall, the flume tests revealed an acute sensitivity to soil particle wettability. The extremes
(wettable vs water repellent) provided opposite responses, infiltration-dominated processes
for the wettable mixtures (100% and 90% wettable) and runoff-dominated for the water
repellent mixtures (0% to 30% wettable). In between, there was a combination of processes.
The main slope processes were identified for the 11 tests and, for the sake of presentation in
this paper, the tests were grouped in sand mixtures which exhibited similar behavior and
characteristics. The classification of soil wettability by Doerr et al. (2006) was adopted and
the groups split into wettable (strong), wettable (weak), moderate to severe, and extreme. The
split into two wettable states (strong versus weak) was necessary to account for differences in
the infiltration mode (wetting front versus preferential flow). In our analysis and
interpretations, we link the volumetric water content and video recordings to the infiltration
mode and saturation process; the failure mode from the video recordings to the pore water
pressure data (rising pore water pressures trigger failure); while the sediment and water
discharge is compared to all data. One representative test from each group, i.e. sharing similar
characteristics, is presented next. Time-elapsed photographs and the time-series data from the

14
remaining tests are available in the supporting information. To allow comparison between the
different time-series datasets, all figures have the same axis scales.
3.2.2. Wettable sand (strong) mixture
The time series results for the 100% wettable sand are shown for the pore water pressure in
Figure 6a, volumetric water content in Figure 6b, water and sand discharge in Figure 6c and
failure mode and infiltration from the video snapshots in Figure 6d. From the 11 tests, the
descriptions below are applicable to tests 100w and 90w+10wr (Figure A1 in supporting
information).
The photographs show a wetting front, parallel to the surface travelling downward. No
surface runoff was observed, all rainfall infiltrated. These observations were corroborated by
the volumetric water content data, with a sudden increase at 4 minutes for the shallow soil
moisture sensors (nests 1 and 2) followed by the deeper soil moisture sensors (3 and 4).
Pore water pressure increase initiated at 14 minutes at the transducers near the slope (nests 1
and 3) propagating towards the back of the model. Eventually, the thinning of the model near
the toe allowed water to saturate and generate positive pore water pressure from the toe
(transducers 1 and 3) towards the back of the model (transducers 2 and 4). The drop in pore
water pressure in transducers 1 and 3 near the toe, at 18 minutes, matches the onset of failure
from the video recordings, through a series of retrogressive slumps. A similar drop is
documented for the back transducers (2 and 4) as the slumps approach their location. Rather
than dilation-linked (pore-size increase in dense materials), we interpret the pore water
pressure drops as a lowering in the water table due to the shortening of the physical model
length.
Assuming saturated vertical downward flow, the pore water pressure generation would have
been lower than hydrostatic. However, all transducers measured maximum pore water

15
pressures in excess of hydrostatic, 1.0 kPa for the lower transducers. This was interpreted as a
fast sand contraction (volume reduction in loose materials under reduced drainage) with pore
water being expelled from the water-saturated pores generating pore water pressure. Collapse
upon wetting is typical of very loose granular soils when wetted for the first time (Houston et
al., 2001).
Evidence of air entrapment or pore air pressure generation that could delay infiltration was
not observed (Siemens et al., 2013). No specific geomorphic features were observed during
infiltration indicating air release (e.g. pockmarks). Failure initiated in the toe, so it is possible
trapped air (if any) would be released from the toe area.
For the water and sand discharge, up to 17 minutes, only water had discharged at the end of
the flume. During this time, sand would accumulate at the toe of the model. With the
continuous rainfall and retrogressive slumps the model eventually reached an equilibrium
slope angle of the flume’s extension.
3.2.3. Wettable sand (weak) mixture
The selected representative test for predominantly wettable sand was the 60w+40wr. Despite
having 40% water repellent sand, according to the WDPT it is still classified as wettable. The
descriptions apply to tests with 80%, 70% and 60% wettable sand. The time series results for
the 60w+40wr are shown in Figure 7a for the pore water pressure, Figure 7b for the
volumetric water content, water and sand discharge are in Figure 7c, and snapshots of the
video recordings for the failure mode and infiltration process in Figure 7d. The data sets for
the 80% and 70% wettable sand are provided in Figure A2 and Figure A3, respectively, in
supporting information.
The video recordings show temporary ponding of water at the surface, followed by
infiltration. Rather than a wetting front parallel to the surface, preferential flow or fingering

16
was observed throughout the tests. Preferential flow is a key feature of water repellent soils
(Ritsema et al., 1998). It was also observed that water would advance both downward and
laterally along horizons. We speculate these horizons could correspond to more water
repellent horizons possibly a result of poor mixing of wettable and water repellent sand. Four
major fingers can be observed in Figure 7d. The infiltration mode was validated by the soil
moisture data, with the upper soil moisture sensors (1 and 2) increasing before sensors 3 and
4.
Failure initiated at 8:30 minutes at the toe of the model by small retrogressive slumps. Dry
sand pockets were visible as failure progressed. From the video recordings, water and sand
appear flowing out of the model, while portions of sand remained dry within the model. A
possible scenario is that water travelled along preferential paths downward until reaching the
bottom of the flume followed by lateral outward flow. This is compatible with the timing for
the pore water pressure increase for transducer 2 at the top and back of the model (12
minutes) and transducer 4 at the back and bottom of the model (17 minutes), both earlier than
the tests at higher proportions of wettable sand. We speculate the fingers observed laterally
through the glass, may not extend inwards. They may have developed different shapes and
travelled different extents. The response of transducer 1 is not clear. The development of
negative water pressure is possible since the water in the cap may have been drawn out of the
cap by capillarity, generating a suction effect. However, this response was unique in
comparison to all tests, thus not verifiable.
Water and sand reached the bottom of the flume at 7 minutes for water and 12 minutes for
sand, earlier than the tests at higher proportions of wettable sand. The sand and water
discharge increased linearly until 25 minutes. The test terminated when the model reached an
equilibrium slope running the length of the flume.
17
3.2.4. Moderate to severe water repellent sand mixture
Test 7 with 40% wettable sand and 60% water repellent sand was selected as representative
of the predominantly water repellent sand tests. The time series results are shown for the pore
water pressure in Figure 8a, volumetric water content in Figure 8b, water and sand discharge
in Figure 8c and failure mode and infiltration snapshots of the video recordings in Figure 8d.
The wettability for the mixture is classified as moderate i.e. water infiltration is temporarily
inhibited. The descriptions apply to tests with 40% and 50% wettable sand (the 50% wettable
is in Figure A4 in supporting information).
The time-elapsed photographs show no infiltration in the first 10 minutes. Surface runoff
started promptly with the artificial rainfall in the model’s steeper slope. By 8 minutes, a rill
was formed in the center, enlarging in size both laterally and in-depth. The rainfall
continuously depleted the material by surface runoff. No slumps were observed. Both the
pore water pressure and volumetric water content measurements revealed a random behavior
with no obvious sequence or trends. The pore water pressure suddenly increased followed by
dissipation in the shallow transducers (nests 1 and 2). This was followed by the volumetric
water content in nest 2 and then 4 and 3. Since the transducers and soil moisture sensors were
placed side by side within each nest, we speculate that preferential flow was dominating
infiltration with vertical and horizontal pipe flow randomly developing within the model.
Both water and sand reached the bottom of the flume within 3.5 minutes.
Upon completion of the test, parts of the model remained fully dry. All the boundaries: glass-
sides, top, bottom and the area around the cables were wet with dry sand pockets in-between.
It is possible all these interfaces may have contributed to interface flow, since they were more
wettable than the surrounding wettable/water repellent mixture.

18
3.2.5. Extreme water repellent sand mixture
The test presented next was conducted on the 100% water repellent sand. The sand’s water
repellency classified as extreme, the highest in the scale. The descriptions apply to tests with
90%, 80% and 70% water repellent sand, available as Figure A7, Figure A6 and Figure A5,
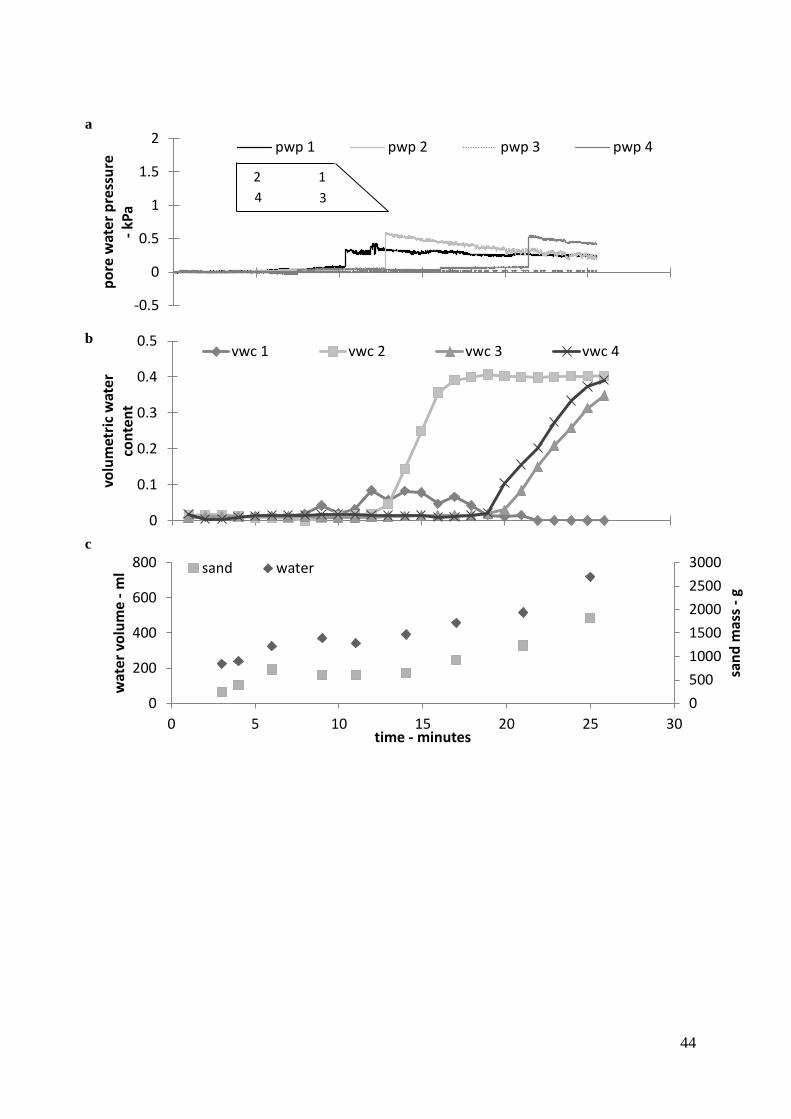
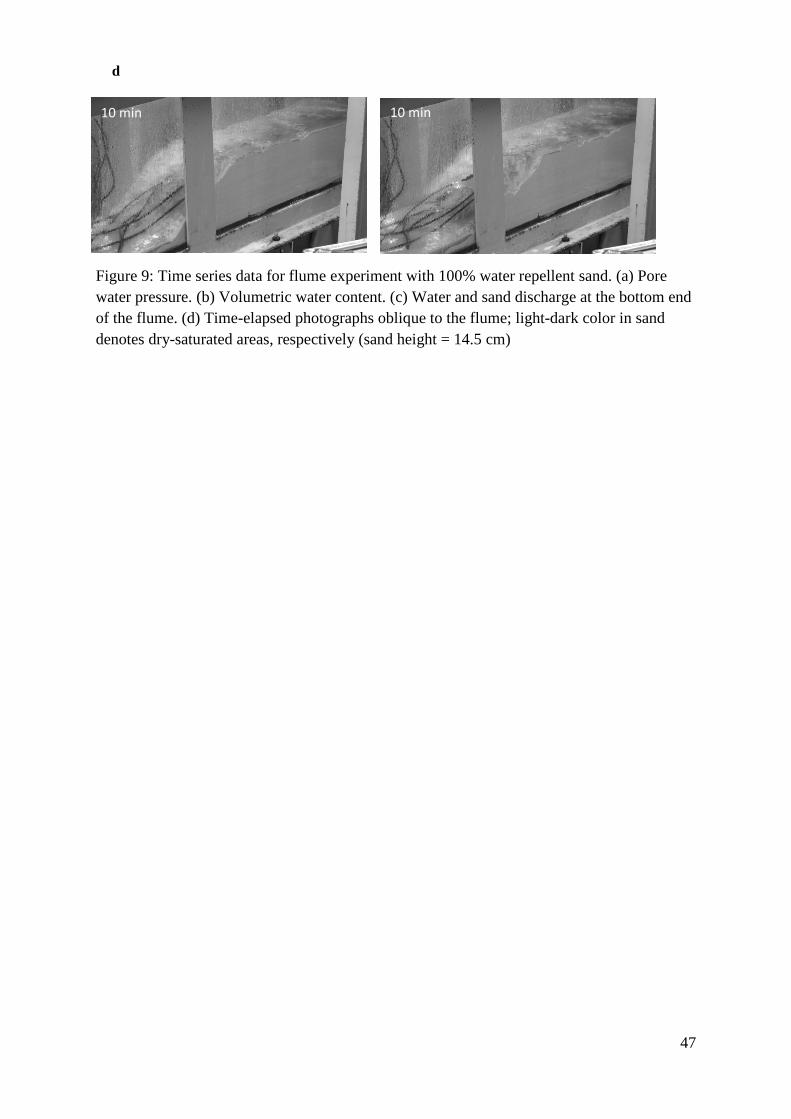
respectively, in supporting information. The time series results for test 100wr are shown in
Figure 9a for the pore water pressure, Figure 9b for the volumetric water content, water and
sand discharge in Figure 9c and snapshots of the video recordings for the infiltration and
failure mode in Figure 9d.
Throughout the duration of the test, no water infiltrated. All volumetric water contents
remained below 0.015. All pressure transducers remained near zero, except for transducer 1,
when all the sand was washed out and it got in contact with free water. Surface runoff started
simultaneously with the rainfall onset, and developed in a series of rills. Unlike the wettable
samples, where an equilibrium slope angle was formed with time, for the water repellent
samples, the whole front slope retrogressed backwards with the continuous surface runoff.
There was no deposition of material at the toe of the slope, all the material was washed-out.
Both water and sand reached the bottom of the flume shortly after the rainfall onset. The
relation between both was linear throughout the test.
Upon completion of the test, all the sand remained fully dry, except the upper surface in
contact with the atmosphere. No infiltration was observed at the interface sand-glass or
cables.
4. Discussion
This study demonstrates that slight wettability changes, in the full wettable to water repellent
range, impact a variety of slope processes. Note that all changes were exclusively due to
changes in the affinity of the surface of the particles to water. All tests started under the same

19
initial conditions, and the void ratio was similar for all tests. For instance, a denser packing
and a reduction of particle size would have reduced infiltration leading to similar responses as
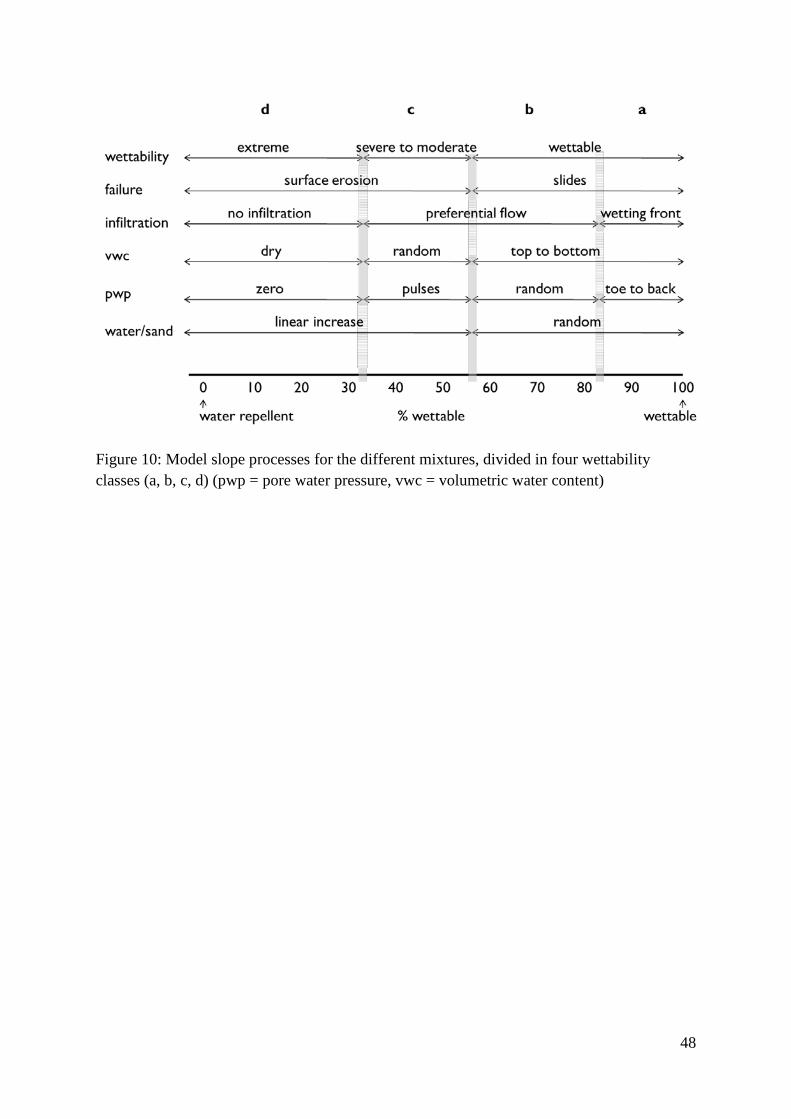
in this study. Figure 10 is a graphic representation of all processes and their dependencies for
the 11 sand mixtures, in terms of wettability, failure mode, infiltration mode, volumetric
water content, pore water pressure and water – sand discharge.
4.1. Simplified model
We propose that most dry soil slopes in nature occur at different wettability states, with the
general response to rainfall controlled by the wettability state. Wettability data to validate this
is very limited and mostly related to the water repellent end, and within soil science studies
(Bachmann et al., 2008; Doerr et al., 2006). However, there is indirect evidence that dry soils
are unlikely to be fully wettable. For instance, contact angles of 0° require flat clean surfaces
which do not exist in nature. A series of factors increase contact angles: water menisci
movement and velocity (De Gennes, 1985; Hoffman, 1975), microasperities (Taniguchi and
Belfort, 2002), impurities and solutes (Fisher and Israelachvili, 1981), organic matter (Chenu
et al., 2000), microbial cells (Busscher et al., 2000), surfactants (Karagunduz et al., 2001)
including soil type and mineralogy (e.g. Fisher and Lark, 1980). We suggest four wettability
classes, the same as in the results section, where each class shares similar attributes. As
presented in the Introduction, 90° is assumed the theoretical threshold contact angle at which
the hydraulic and mechanical response of the soil changes, below this value particles attract
and water infiltrates, and above this value, particles repel and water does not infiltrate. Figure
11 illustrates the responses of slopes to rainfall made of such materials at different wettability
states. The settings in the natural and built environment where they could occur are presented.
a. Wettable soil (strong) (<<90°): infiltration by a descending wetting front parallel to
the surface; failure initiation by slides. We found no evidence of a parallel wetting
20
front advance and landslide initiation links in field studies. Most studies are based on
spot measurements of pore water pressure and volumetric water content (Li et al.,
2004). We assume this response may occur in recent, disturbed deposits (e.g. debris
flows deposits) where the particle surfaces are fresh and without organic coatings.
Most commonly occurring minerals such as quartz are wettable (Fisher and Lark,
1980).
b. Wettable soil (weak) (<90°): infiltration by preferential flow; failure initiation by
sliding. This stage represents, possibly, the most common situation in the debris flows
literature. Preferential flow has been widely studied and closely linked to the initiation
of debris flows (McDonnell, 1990). May also be representative of long term
conditions after a wildfire where wettability was been recovered with the vegetation
regrowth (Cannon and Gartner, 2005).
c. Moderate to severe water repellent soil (>90°): limited, local infiltration by
preferential flow after a period of time; infiltration initiates when long duration
rainfall events overcome the water repellent effect; pore water pressure spikes; failure
initiation by surface erosion. Occurs sometime after wildfires (Hubbert et al., 2012)
and in some forest soils (Doerr et al., 2006).
d. Extreme water repellent soil (>>90°): complete capping; failure initiation totally
driven by surface erosion; water repellent effect only overcome by prolonged wetting
or washing out of water repellent horizon. Occurs shortly after wildfires or when the
water repellent effect is at its highest (Hubbert et al., 2012).
The scheme above and Figure 11 do not imply soils permanently belong to a particular class
and it does not force soils to undergo the sequence a to b to c to d. Changes from one
wettability state to the other are possible as soils dry and wet and, changes in wettability state
may be gradual or sudden e.g. wettable condition switching to strong water repellent (a to d).

21
The model does not imply that wettability is the only parameter to be considered in debris
flows that initiate in slopes initially dry. Soil water retention is influenced by soil wettability
(Arye et al., 2011; Lourenço et al., 2015), so soil water content and matric suction will need
to be considered. For infiltration-initiated debris flows, the mechanics will also need to be
added. The dependency of shear strength on suction and water content is well known (Escario
and Saez, 1986) but the effect of soil wettability will have to be further investigated.
4.2. Sensitivity of slope processes to soil particle wettability
The results suggest that as long as there is some water repellency (water beading up at the
surface), no infiltration occurs and debris flows are runoff-initiated. However, in nature this
may depend on the rainfall characteristics and the persistency of soil water repellency. Since
the long contact of a water repellent soil with water renders the soil wettable, long duration,
low intensity rainfall events may overcome the water repellent effects, eventually allowing
water to infiltrate and mobilize a discrete mass of soil into a debris flow. The time span of our
experiments is too short (up to 30 minutes) and the rainfall intensity rather high (∼ 40 mm/h)
to consider these time effects. Understanding the relative timescales of soil water repellency
decay in relation to rainfall intensity and duration is essential.
Infiltration-initiated debris flows do not depend on the infiltration mode. According to the
results, wettable particle surfaces are the necessary condition for water to infiltrate, saturate
the ground and mobilize a slide. Retrogressive slumps were observed for tests with 100 % to
60 % wettable sand, but while infiltration was parallel to the surface for the 100 % and 90 %
wettable sand mixtures, preferential flow dominated for the 80 % to 60 % wettable sand
mixtures. However, a change in wettability at 80 % wettable sand is plausible, but the method
used (the Water Drop Penetration Time) may not be sufficiently sensitive to capture the
subtle changes.

22
The data also shows that the pore water pressure built-up behaviour depends on soil particle
wettability. For the wettable mixtures with 100 % and 90 % wettable sand, pore water
pressure increased from the toe backwards, while for the wettable mixtures with 80 % to 60
% wettable sand (with preferential flow), the increase was random and dependent on the
location of the fingers. For the 50 % and 40 % wettable sand, pore water pressure increased
in a series of pulses, followed by a slow decrease with time. The pore water pressure pulses
appear not to be documented in the literature. We speculate that since the transducers monitor
pore water pressure locally, when a vertical pipe reaches a transducer, it generates an
immediate increase of pore water pressure equivalent to the head of water in the pipe, as the
pipe continues to travel downward or dissipates laterally, the head of water (and pore water
pressure) reduces. A pipe is interpreted as a column of water. For the mixtures with less than
30 % wettable sand, the pore water pressure did not change.
Runoff-initiated debris flows are not exclusive of post-wildfire landscapes. Coe et al. (2008)
investigated recurrent debris flows in a bare landscape in Chalk Cliffs, Colorado. They
measured low volumetric water contents before the debris flows but no information on soil
particle wettability was provided. Capra et al. (2010) identified soil water repellency as a
mechanism contributing to the generation of lahars in a volcanic landscape in Mexico.
4.3. Experimental limitations
The biggest limitation of this study has been the sole use of the Water Drop Penetration
Time. While the WDPT is widely used, it is an empirical measure for the time-dependency of
soil water repellency. Measurement of the contact angles, the main physical parameter
quantifying wettability, would have been preferred. The Sessile Drop Method was used, but
unsuccessfully due to surface wettability changes from sample preparation until

23
measurement. Other potential methods include the Capillary Rise Method and the Wilhelmy
Plate Method (Bachmann et al., 2003).
The maximum sand and water discharge decreased with increasing soil particle wettability
(wettable soils discharge less than water repellent soils) (Figure 12). While it is known that
wildfires enhance sediment discharge in burned landscapes, it should be noted that for the
wettable mixtures, material accumulated between the toe of the model and bottom of the
flume. Therefore, the sand discharge could have been higher for the wettable mixtures.
The model slope is made of a water repellent layer-only; this is a simplification of the ground
conditions after a wildfire because it does not take into account the double layer structure of
the ground (wettable ash on top of the water repellent layer) or the characteristics of the ash
(water storage) (Gabet and Sternberg, 2008) and in particular that the water repellent layer is
shallow and very thin (1-2 cm). The impervious horizon appears at the surface, either
exposed to the atmosphere or underlain a wettable ash layer near the surface (Kean et al.,
2011, Moody and Ebel, 2014). The saturated ash may induce a positive head of water,
increasing the water-entry pressure, and accelerating wetting of the underlying soil.
The observed continuous retrogressive slides for the predominantly wettable mixtures are a
consequence of the initial model conditions, i.e. the long trapezoidal shape with upper and
front free surfaces exposed to continuous rainfall. In natural slopes, debris flows in wettable
soils initiate from soil slides, which may or may not continue to fail as retrogressive slides.
5. Conclusions
From a series of flume tests at varying ratios of wettable to water repellent sand, the sequence
of processes with decreasing soil particle wettability were identified. Overall, the flume tests
revealed an acute sensitivity to soil particle wettability. The two extremes, fully wettable and
water repellent gave opposite responses, retrogressive slides for infiltration-initiated in

24
wettable sand and erosion by surface runoff in water repellent sand. The transition was
dominated by surface runoff and preferential flow, yielding a combination of erosion and
slides. From the tests, a continuous capping effect generated by water repellency was a
necessary condition for erosion and sand bulking (i.e. the generation of runoff-initiated debris
flows). The sensitivity of the model to artificial rainfall was particularly acute at high ratios
of wettable to water repellent sand. Our intention in this paper has been to demonstrate
experimentally the importance of soil particle wettability to the initiation of debris flows and
spur the need to develop models that can account for such fundamental parameter. Soil
particle wettability should not be explored in isolation as demonstrated here, but instead as
how it impacts the hydraulic and mechanical properties, their interplay with vegetation, and
how the three vary in space and time. To validate these ideas, field wettability data is needed.
Acknowledgements
Financial support for the flume tests and travel costs for the main author were provided by
Kyoto University through a long-term research visit grant. Mr. Jiang Yao (DPRI, Kyoto
University) assisted with the flume tests in its initial stages and conducted the calibration for
the soil moisture sensors. The sand treatment was conducted in Dr. Keisuke Matsushita’s
laboratory (DPRI, Kyoto University).
References
Arye G., J., Tarchitzky, Chen, Y. 2011. Treated wastewater effects on water repellency and
soil hydraulic properties of soil-aquifer treatment infiltration basins. J. Hydrol. 397, 136-
145.
25
Atanassova, I., Doerr, S.H. 2011 Changes in soil organic compound composition associated
with heat-induced increases in soil water repellency. European Journal of Soil Science 62,
516-532.
Bachmann, J., Horton, R., Ploeg, R.R. van der, Woche S. 2000. Modified sessile drop method
for assessing initial soil-water contact angle of sandy soil. Soil Sci. Soc. Am. J., 64, 564–
567.
Bachmann, J., Woche, S.K., Goebel, M.-O., Kirkham, M.B., Horton, R. 2003. Extended
methodology for determining wetting properties of porous media. Water Resources Research
39, 12, 1353–1366.
Bachmann, J., Guggenberger, G., Baumgartl, Th., Ellerbrock, R.H., Urbanek, E., Göbel, M.-
O., Kaiser, K., Horn, R., Fischer, W.R. 2008 Physical carbon-sequestration mechanisms
under special consideration of soil wettability. Special Issue SPP 1090, J. Plant Nutr. Soil
Sci., 171, 14–26.
Beatty, S.M., Smith. J.E. 2010. Fractional wettability and contact angle dynamics in burned
water repellent soils. Journal of Hydrology 391, 97-108.
Byun, Y.-H., Tran, M.K. Yun, T.S., Lee, J.-S. 2011. Strength and stiffness characteristics of
unsaturated hydrophobic granular media. ASTM Geotechnical Testing Journal 35, 1, 1-8.
Busscher, H. J., Weerkamp, A. H., Mei, H. C. van der, Pelt, A. W. J. van, Jong, H. P. De,
Arends, J. 2000. Measurement of the Surface Free Energy of Bacterial Cell Surfaces and Its
Relevance for Adhesion. App. Environ. Microbiology, 48, 5, 980-983.
Cannon, S.H., Gartner, J.E. 2005. Wildfire-related debris flow from a hazards perspective, M.
Jakob and O. Hungr (eds), Debris-flow Hazards and Related Phenomena, 363-385.
Cannon, S.H., Boldt, E.M., Laber, J.L., Kean, J.W., Staley, D.M. 2011. Rainfall intensity–
duration thresholds for postfire debris-flow emergency-response planning. Natural Hazards
59, 209–236.

26
Capra, L., Borselli, L., Varley, N., Gavilanes-Ruiz, J.C., Norini, G., Sarocchi, D., Caballero,
L., Cortes, A. 2010. Rainfall-triggered lahars at Volcán de Colima, Mexico―surface hydro-
repellency as initiation process. J. Volcanology Geothermal Res. 189, 105–117.
Cerdà, A., Doerr, S.H. 2005. Influence of vegetation recovery on soil hydrology and
erodibility following fire: an 11-year investigation. International Journal of Wildland Fire
14, 4, 423-437.
Chenu, C., Bissonnais, Y. L., Arrouays D. 2000. Organic Matter Influence on Clay
Wettability and Soil Aggregate Stability. Soil Sci. Soc. Am. J. 64, 1479–1486.
Coe, J.A., Kinner, D.A., Godt, J.W. 2008. Initiation conditions for debris flows generated by
runoff at Chalk Cliffs. Geomorphology 96, 270-297.
Dekker, L.W., Doerr, S.H., Oostindie, K., Ziogas, A.K., Ritsema, C.J. 2001. Water repellency
and critical soil water content in a dune sand. Soil Sci. Soc. Am. J. 65, 1667– 1674.
De Gennes, P.G. 1985. Wetting: statics and dynamics. Rev. Modern Physics 57, 3, I, 827-
863.
Doerr, S.H., Shakesby, R.A., Walsh, R.P.D. 2000. Soil water repellency: its causes,
characteristics and hydro-geomorphological significance. Earth-Science Reviews 51, 1, 33-
65.
Doerr, S.H., Dekker, L.W., Ritsema, C.J. Shakesby, R.A. 2002. Water repellency of soils; the
influence of ambient relative humidity. Soil Sci. Soc. Am. J. 66, 2, 401-405.
Doerr, S.H., Shakesby, R.A., Dekker, L.W., Ritsema, C. J. 2006. Occurrence, prediction and
hydrological effects of water repellency amongst major soil and land use types in a humid
temperate climate. Eur. J. Soil Sci. 57, 741-754.
Ebel, B., Moody, J.A., Martin, D.B. 2012. Hydrologic conditions controlling runoff
generation immediately after a wildfire. Water Resources Research, 48, W03529.
27
Ebel, B.A., Moody, J.A. 2013. Rethinking infiltration in wildfire-affected soils. Hydrological
Processes 27, 1510-1514.
Ellen, S.D., Fleming, R.W. 1987. Mobilization of debris flows from soil slips, San Francisco
Bay region, California. In J.E. Costa and G.F. Wieczorek (eds), Debris Flows/Avalanches:
Process, Recognition and Mitigation: Geological Society of America. Reviews in
Engineering Geology 7, 31-40.
Escario, V., Saez, J. 1986. The shear strength of partly saturated soils. Geotechnique, 36, 3,
453-456.
Fisher, R.A. 1926. On the capillary forces in an ideal soil; correction of formulas by W.B.
Haines. J. Agric. Sci., 16, 492-505.
Fisher, L.R. Lark, P.D. 1980. The effect of adsorbed water vapour on liquid water flow in
pyrex glass capillary tubes. J. Colloid and Interface Sc. 76, 1, 251-253.
Fisher, L.R. Israelachvili, J. 1981. Experimental studies on the applicability of the Kelvin
equation to highly curved concave menisci. Journal of Colloid and Interface Science, 80, 2,
528-541.
Fredlund, D.G., Rahardjo, H. 1993. Soil Mechanics for Unsaturated Soils, John Wiley &
Sons
Gabet, E.J., Sternberg, P. 2008. The effects of vegetative ash on infiltration capacity,
sediment transport, and the generation of progressively bulked debris flows. Geomorphology
101, 666–673.
Granged, A.J.P., Jordán, A., Zavala, L.M., Bárcenas, G. 2011. Fire-induced changes in soil
water repellency increased fingered flow and runoff rates following the 2004 Huelva
wildfire. Hydrological Processes 25, 10, 1614–1629.
Hoffman, R.L. 1975. A study of the advancing interface. I. Interface shape in liquid—gas
systems. J. Colloid Interface Sc., 50, 2, 228-241.

28
Houston, S.L., Houston, W.N., Zapata, C.E., C. Lawrence 2001. Geotechnical engineering
practice for collapsible soils. Geotechnical and Geological Engineering, 19, 3, 333-355.
Hubbert, K.R., Wohlgemuth, P.M., Beyers, J.L., Narog, M.G., Gerrard, R. 2012. Post-fire
soil water repellency, hydrologic response, and sediment yield compared between grass-
converted and chaparral watersheds. Fire Ecology 8, 2, 143-162.
Iverson, R.M., Reid, M.E., Logan, M., LaHusen, R.G., Godt, J.W., Griswold, J.G. 2011.
Positive feedback and momentum growth during debris-flow entrainment of wet bed
sediment. Nature Geoscience 4, 116–121.
Jackson, M., Roering, J.J. 2009. Post-fire geomorphic response in steep, forested landscapes:
Oregon Coast Range, USA. Quaternary Science Reviews 28, 11–12, 1131–1146.
Karagunduz, A., Pennell, K.D., Young, M.H. 2001. Influence of a Nonionic Surfactant on the
Water Retention Properties of Unsaturated Soils. Soil Sci. Soc. Am. J. 65, 1392–1399.
Kean, J. W., Staley, D.M. Cannon, S.H. 2011. In situ measurements of post‐fire debris flows
in southern California: Comparisons of the timing and magnitude of 24 debris‐flow events
with rainfall and soil moisture conditions. Journal of Geophysical Research 116, F04019.
Li, A.G. Yue, Z.Q., Tham, L.G., Lee, C.F. 2004. Field-monitored variations of soil moisture
and matric suction in a saprolite slope. Can. Geotech. J. 42, 13–26.
Liu, H., Ju, Z., Bachmann, J., Horton, R., Ren, T. 2012. Moisture-Dependent Wettability of
Artificial Hydrophobic Soils and Its Relevance for Soil Water Desorption Curves. Soil Sci.
Soc. Am. J. 76, 342–349.
Lourenço, S.D.N., Jones, N., Morley, C., Doerr, S., Bryant, R. 2015. Hysteresis in the soil
water retention of a sand-clay mixture with contact angles lower than ninety-degrees.
Vadose Zone Journal (accepted)

29
Mallik, A.U., Gimingham, C.H., Rahman, A.A. 1984. Ecological effects of heather burning:
1. Water infiltration, moisture retention and porosity of surface soil. Journal of Ecology 72,
767–776.
McDonnell, J. 1990. The influence of macropores on debris flow initiation, Quarterly Journal
of Engineering Geology and Hydrogeology. 23, 325-331.
Moody, J.A., Ebel, B. 2012. Hyper-dry conditions provide new insights into the cause of
extreme floods after wildfire. Catena, 93, 58-63.
Moody, J.A., Ebel, B. 2014. Infiltration and runoff generation processes in fire-affected soils,
Hydrol. Processes 38, 3432-3453.
Morley, C.P., Mainwaring, K.A., Doerr, S.H., Douglas, P., Llewellyn, C.T., Dekker, L.W.
2005. Organic compounds at different depths in a sandy soil and their role in water
repellency. Aust. J. Soil Res., 43, 239-249.
Ritsema, C.J., Dekker, L.W., Nieber, J.L., Steenhuis, T.S. 1998. Modeling and field evidence
of finger formation and finger recurrence in a water repellent sandy soil. Water Resources
Research 34, 4, 555-567.
Siemens, G. A., Peters, S. B., Take, W. A. 2013. Comparison of confined and unconfined
infiltration in transparent porous media. Water Resources Research 49, 851–863
Taniguchi, M. Belfort, G. 2002. Correcting for surface roughness: advancing and receding
contact angles. Langmuir 18, 6465-6467.
Wang, G., Sassa, K. 2001. Factors affecting rainfall-induced flowslides in laboratory flume
tests. Géotechnique, 51, 7, 587-599.
Wang, G., Sassa, K. 2003. Pore-pressure generation and movement of rainfall-induced
landslides: effects of grain size and fine particle content. Engineering Geology 69, 109– 125.
Wang, Z., Wang, L. Wu, Q.J. 2000. Water-entry value as an alternative indicator of soil
water-repellency and wettability. Journal of Hydrology 231–232, 76–83.

30
Woods, S., Balfour, V. 2010. The effects of soil texture and ash thickness on the post-fire
hydrological response from ash-covered soils. Journal of Hydrology 393, 274-286.
Wondzell, S.M., King J.G. 2003. Postfire erosional processes in the Pacific Northwest and
Rocky Mountain regions. Forest Ecology and Management 178, 75–87.

31
Figures and Tables captions
Table 1: Sand properties
Table 2: Testing programme, initial sample and environmental conditions
Figure 1: Schematic representation of interacting water with wettable and water repellent
particles (after Bachmann et al., 2008)
Figure 2: Grain-size distribution of Silica Sand #7
Figure 3: Flume set-up. The soil moisture (SM) and pore water pressure (PWP)
instrumentation was placed in four nests (1, 2, 3, 4) in two layers at ~5 cm and ~10 cm depth;
distance from the glass-sided walls was 15 cm; distance from the back of the flume was 20
cm for the back sensors and 60 cm for the front instruments (RH = Relative Humidity)
Figure 4: Soil particle wettability for the different mixtures. (a) Results from the index test,
Water Drop Penetration Time (n=6); the terminology extreme, severe, moderate and wettable
follows the classification of the persistency of soil water repellency based on the WDPT by
Doerr et al., 2006. (b) Results from the Sessile Droplet Method (n=3)
Figure 5: Contact angle measurements for the 100 % water repellent sand. (a) Stability of the
contact angles with time. The three curves correspond to 3 separate measurements where
each measurement is the average between the left and right contact angle. Recording started
at 0 seconds, drop attached to the grains substrate at ∼1 second, reached equilibrium between
1 – 2 seconds and was stable from 2 to 5 seconds. The sampling rate was 40 milliseconds (b)
photographs at time = 4 seconds for drop 1, 2 and 3 (drop volume ∼12 µl).
Figure 6: Time series data for flume experiment with 100% wettable sand. (a) Pore water
pressure. (b) Volumetric water content. (c) Water and sand discharge at the bottom end of the
flume. (d) Time-elapsed photographs oblique to the flume; light-dark color in sand denotes
dry-saturated areas, respectively (sand height = 14.5 cm)

32
Figure 7: Time series data for flume experiment with 60% wettable sand and 40% water
repellent sand. (a) Pore water pressure. (b) Volumetric water content. (c) Water and sand
discharge at the bottom end of the flume. (d) Time-elapsed photographs oblique to the flume;
light-dark color in sand denotes dry-saturated areas, respectively (sand height = 14.5 cm)
Figure 8: Time series data for flume experiment with 40% wettable sand and 60% water
repellent sand. (a) Pore water pressure. (b) Volumetric water content. (c) Water and sand
discharge at the bottom end of the flume. (d) Time-elapsed photographs oblique to the flume;
light-dark color in sand denotes dry-saturated areas, respectively (sand height = 14.5 cm)
Figure 9: Time series data for flume experiment with 100% water repellent sand. (a) Pore
water pressure. (b) Volumetric water content. (c) Water and sand discharge at the bottom end
of the flume. (d) Time-elapsed photographs oblique to the flume; light-dark color in sand
denotes dry-saturated areas, respectively (sand height = 14.5 cm)
Figure 10: Model slope processes for the different mixtures, including simplified
classification (a, b, c, d) (pwp = pore water pressure, vwc = volumetric water content)
Figure 11: Simplified conceptual model for the initiation of debris flows triggered by rainfall
for materials under variable wettability. (a) Wettable soil (contact angle ~0°). (b) Wettable
soil (contact angle <90°). (c) Water repellent material (contact angle >90°, when in contact
with water remains water repellent for a short period of time). (d) Water repellent material
(contact angle >>90°, when in contact with water remains water repellent for a long period of
time). Upper row denotes field conditions shortly after the rainfall onset. Middle row is for
steady state conditions. Bottom row is on the interaction of meniscus and bulk water with
wettable and water repellent particles.
Figure 12: Peak water and sand discharge for the different mixtures

33
Figures and Tables
Table 1: Sand properties
Physical parameters, symbol (unit)
Mean grain size, D50 (mm) 0.13
Effective grain size, D10 (mm) 0.074
Uniformity coefficient, Uc 2.10
Maximum void ratio, emax 1.23
Minimum void ratio, emin 0.70
Specific gravity, Gs 2.63

34
Table 2: Testing programme, initial sample and environmental conditions
Test
nr
%
wettable
% water
repellent
Slope
inclination
(°)
Void
ratio
(e)1
Relative
Humidity
(%)
Temperature
(°C)
Water Drop
Penetration
Time test (s)
Wettability
class2
Rainfall
intensity
(mm/h)
1 100 0 38 1.24 - 28 0 Wettable 16.95
2 90 10 37 1.16 76 27 0 Wettable 41.4
3 80 20 39 1.16 88.8 27.9 0 Wettable 37.8
4 70 30 38.5 1.13 95.6 26.4 0 Wettable 36
5 60 40 37 1.18 93.3 27.6 1 Wettable 35.1
6 50 50 39 1.12 86.3 28.1 107 Moderate 36
7 40 60 38 1.14 77.6 27.8 747 Severe 40.8
8 30 70 38 1.16 - - 14400 Extreme
9 20 80 37 1.11 82.1 27.4 >18000 Extreme 31.8
10 10 90 35.5 1.25 89.5 27.5 14400 Extreme 30
11 0 100 38 1.18 87.5 27.4 >18000 Extreme 30
1From e = Gsρwρd
− 1, assuming degree of saturation 0, where Gs is specific gravity, ρd is the
dry density, ρw is the density of water
2 Following the classification by Doerr et al., 2006

35
Figure 1: Schematic representation of interacting water with wettable and water repellent
particles (after Bachmann et al., 2008)

36
Figure 2: Grain-size distribution of Silica Sand #7
0102030405060708090
100
0.001 0.01 0.1 1
Perc
enta
ge fi
ner b
y w
eigh
t (%
)
Grain size (mm)

37
Figure 3: Flume set-up. The soil moisture (SM) and pore water pressure (PWP)
instrumentation was placed in four nests (1, 2, 3, 4) in two layers at ~5 cm and ~10 cm depth;
distance from the glass-sided walls was 15 cm; distance from the back of the flume was 20
cm for the back sensors and 60 cm for the front instruments (RH = Relative Humidity)

38
Figure 4: Soil particle wettability for the different mixtures. (a) Results from the index test, Water Drop Penetration Time (n=6); the terminology extreme, severe, moderate and wettable follows the classification of the persistency of soil water repellency based on the WDPT by Doerr et al., 2006. (b) Results from the Sessile Droplet Method (n=3)
0
4000
8000
12000
16000
20000W
ater
Dro
p Pe
netr
atio
n Ti
me
(s)
wettable moderate severe extreme
a
b
wettable

39
Figure 5: Contact angle measurements for the 100 % water repellent sand. (a) Stability of the contact angles with time. The three curves correspond to 3 separate measurements where each measurement is the average between the left and right contact angle. Recording started at 0 seconds, drop attached to the grains substrate at ∼1 second, reached equilibrium between 1 – 2 seconds and was stable from 2 to 5 seconds. The sampling rate was 40 milliseconds (b) photographs at time = 4 seconds for drop 1, 2 and 3 (drop volume ∼12 µl).
100
110
120
130
140
150
160
170
0 1 2 3 4 5 6
Appa
rent
con
tact
ang
le (°
)
Time (seconds)
Drop 3 Drop 2 Drop 1
a
b
Drop 1 Drop 2 Drop 3
sand substrate sand substrate sand substrate

40
0 min
0
0.1
0.2
0.3
0.4
0.5
volu
met
ric w
ater
co
nten
t
vwc 1 vwc 2 vwc 3 vwc 4
-0.5
0
0.5
1
1.5
2
pore
wat
er p
ress
ure
- kP
a pwp 1 pwp 2 pwp 3 pwp 4
4 2
3 1
0500100015002000250030003500
0200400600800
100012001400
0 5 10 15 20 25 30
sand
mas
s - g
wat
er v
olum
e - m
l
time - minutes
sand water
a
b
c
0 min

41
Figure 6: Time series data for flume experiment with 100% wettable sand. (a) Pore water pressure. (b) Volumetric water content. (c) Water and sand discharge at the bottom end of the flume. (d) Time-elapsed photographs oblique to the flume; light-dark color in sand denotes dry-saturated areas, respectively (sand height = 14.5 cm)
10 min d
20 min

42
-0.5
0
0.5
1
1.5
2po
re w
ater
pre
ssur
e -
kPa
pwp 1 pwp 2 pwp 4
0
0.1
0.2
0.3
0.4
0.5
volu
met
ric w
ater
co
nten
t
vwc 1 vwc 2 vwc 3 vwc 4
0
500
1000
1500
2000
2500
3000
0
200
400
600
800
0 5 10 15 20 25 30
sand
mas
s - g
wat
er v
olum
e - m
l
time - minutes
sand water
a
b
c
4 2
3 1

43
10 min
Figure 7: Time series data for flume experiment with 60% wettable sand and 40% water repellent sand. (a) Pore water pressure. (b) Volumetric water content. (c) Water and sand discharge at the bottom end of the flume. (d) Time-elapsed photographs oblique to the flume; light-dark color in sand denotes dry-saturated areas, respectively (sand height = 14.5 cm)
d
10 min 20 min
44
-0.5
0
0.5
1
1.5
2
pore
wat
er p
ress
ure
- kPa
pwp 1 pwp 2 pwp 3 pwp 4
0
0.1
0.2
0.3
0.4
0.5
volu
met
ric w
ater
co
nten
t
vwc 1 vwc 2 vwc 3 vwc 4
050010001500200025003000
0
200
400
600
800
0 5 10 15 20 25 30sa
nd m
ass -
g
wat
er v
olum
e - m
l
time - minutes
sand waterc
b
a
4 2
3 1

45
Figure 8: Time series data for flume experiment with 40% wettable sand and 60% water repellent sand. (a) Pore water pressure. (b) Volumetric water content. (c) Water and sand discharge at the bottom end of the flume. (d) Time-elapsed photographs oblique to the flume; light-dark color in sand denotes dry-saturated areas, respectively (sand height = 14.5 cm)
d
10 min 20 min

46
-0.5
0
0.5
1
1.5
2
pore
wat
er p
ress
ure
- kP
a pwp 1 pwp 2 pwp 3 pwp 4
0
0.1
0.2
0.3
0.4
0.5
volu
met
ric w
ater
co
nten
t
vwc 1 vwc 2 vwc 3 vwc 4
0
500
1000
1500
2000
2500
3000
0
200
400
600
800
0 5 10 15 20 25
sand
mas
s - g
wat
er v
olum
e - m
l
time - minutes
sand water
c
a
b
4 2
3 1
47
Figure 9: Time series data for flume experiment with 100% water repellent sand. (a) Pore water pressure. (b) Volumetric water content. (c) Water and sand discharge at the bottom end of the flume. (d) Time-elapsed photographs oblique to the flume; light-dark color in sand denotes dry-saturated areas, respectively (sand height = 14.5 cm)
d
10 min 10 min
48
Figure 10: Model slope processes for the different mixtures, divided in four wettability classes (a, b, c, d) (pwp = pore water pressure, vwc = volumetric water content)

49
Figure 11: Simplified conceptual model for the initiation of debris flows triggered by rainfall
for materials under variable wettability. (a) Wettable soil (contact angle ~0°). (b) Wettable
soil (contact angle <90°). (c) Water repellent material (contact angle >90°, when in contact
with water remains water repellent for a short period of time). (d) Water repellent material
(contact angle >>90°, when in contact with water remains water repellent for a long period of
time). Upper row denotes field conditions shortly after the rainfall onset. Middle row is for
steady state conditions. Bottom row is on the interaction of meniscus and bulk water with
wettable and water repellent particles.

50
Figure 12: Peak water and sand discharge for the different mixtures
0
500
1000
1500
2000
2500
3000
3500
4000
0 10 20 30 40 50 60 70 80 90 100
mas
s (g)
or (
ml)
% wettable
sand
water


![Aerobic sludge granulation facilitated by activated carbon ...hub.hku.hk/bitstream/10722/202687/1/Content.pdf · (anammox) or other similar processes [3,4]. Partial nitrification](https://img.pdfslide.us/doc/110x75/5e39f269c9f5a25fcb5be0fc/aerobic-sludge-granulation-facilitated-by-activated-carbon-hubhkuhkbitstream107222026871.jpg)


![RESEARCHARTICLE EffectsofUrbanLandscapePatternonPM …hub.hku.hk/bitstream/10722/227869/1/Content.pdf · 2016. 7. 21. · tion[13]and health riskassessment ofPM 2.5 [14],attemptingtomakeclear](https://img.pdfslide.us/doc/110x75/6010e1a3debb210d6d49b06b/researcharticle-effectsofurbanlandscapepatternonpm-hubhkuhkbitstream107222278691.jpg)