Embed Size (px)
Citation preview
PROCESSED MUSHROOMS: U.S. PRODUCERS' PRODUCTION, SALES, AND INVENTORIES, AND U_.S. IMPORTS, EXPORTS, AND APPARENT CONSUMPTION . SEVENTEENTH QUARTERLY_ .. ·· REPORT: FIRST CALENDAR QUARTER 1983
Report to the President on Investigation No. 3 3 2-84 Under Section 332 of the Tariff Act of 1930
USITC PUBLICATION 1386
MAY 1983
United States lntematlonal Trade Commission I Washington, D.C. 20438
UNITED STATES INTERNATIONAL TRADE COMMISSION
COMMISSIONERS
Alfred E. Eckes, Chairman
Paula Stern
Veronica A. Haggart
Kenneth R. Mason, Secretary to the Commission
This report was prepared principally by
Timothy P. McCarty Agriculture, Fisheries, and Forest Products Division
assisted by
Marretta A. Johnson Agriculture, Fisheries, and Forest Products Division
Office of Industries Norris A. Lynch, Director
Address all communications to
Office of the Secretary
United States International Trade Commission
Washington, D.C. 2Q436
. '
THE SEVENTEENTH QUARTERLY REP ORT ON PROCESSED MUSHROOMS
HIGHLIGHTS
During the first quarter (January-March) 1983, compared with the same quarter 1982:
- APPARENT CONSUMPTION of canned mushrooms increased 11 percent to 59.6 million pounds;
- DOMESTIC PRODUCTION declined 7 percent t o 22 . 7 million pounds;
- SALES of domestic canned mushrooms i ncreased 2 percent to 24.3 million pounds;
- PRODUCER ENDING INVENTORIES of canned mushr ooms declined 45 percent to 14.3 million pounds;
- IMPORTS rose 23 percent to 29.8 million pounds, constituting 50 percent of consumption compared with 45 percent last year; and
- EXPORTS increased 23 percent to 54, 000 pounds.
QUARTERLY STATISTICS
For the first quarter of 1983, compared with the same quarter a year earlier, domestic production and ending inventories of canned mushrooms declined while sales by domestic producers, exports, imports, and apparent consumption increased (see table). Domestic production t otaled 22.7 million pounds (down 7 percent); ending inventories by pr oducers, 14.3 million pounds (down 45 percent); sales by producers, 24. 3 million pounds (up 2 percent); exports, 54,000 pounds (up 23 percent); impor ts, 29.8 million pounds (up 23 percent); and apparent consumption, 59. 6 milli on pounds (up 11 percent).
Sales
The slight increase in sales of domestic canned mushrooms (2 percent) in the f irs t quarter of 1983, compared with the same quarter of 1982, primarily refl ected increases in sliced mus hrooms; t hese increases more than offset declines in sales of stems and pieces . Sale s of frozen mushrooms ( 5 . 5 million pounds) were 2 percent less than in the corresponding period of 1982 . Sales of frozen mushrooms were equival ent to 23 percent of canned mushroom sales, down slightly from 24 percent in the same quarter of 1982. Expor ts increased 23 percent to 54,000 pounds, but remained negligible with respect to U.S. production and apparent consumption.
2
Imports
The 23-percent increase in imports of processed mushrooms in the first quarter of 1983, compared to the same quarter of 1982, reflects in part the downward adjustment of the temporary rate of duty increase which was imposed on prepared or preserved mushrooms, effective on November 1, 1980. The temporary duty increase, directed by the President, was taken under provisions of the Trade Act of 1974 following a U.S. International Trade Commission determination that imports of prepared or preserved mushrooms are a substantial cause of serious injury, or the threat thereof, to the domestic industry. First quarter 1983 imports were equivalent to 50 percent of consumption, compared with 45 percent in the same quarter a year earlier.
The People's Republic of China (China) was the principal supplier of imported processed mushrooms in the first quarter of 1983. Other major suppliers of imported mushrooms are Taiwan, Hong Kong, and the Republic of Korea (Korea). Between January-March 1982 and 1983, China's share of imports rose from 29 to 39 percent while Taiwan's decreased from 31 to 25 percent and Hong Kong's share dropped from 25 to 18 percent; Korea's share rose from 9 to 12 percent in the two quarters.
MARKET YEAR DATA
As discussed in the sixteenth quarterly ·report, production, sales, ending inventories, imports, and apparent consumption of processed mushrooms all declined for the most recent marketing year (July 1981-June 1982) compared with the preceding marketing year (1980/81), but the ratio of imports to consumption rose from 45 to 46 percent. In 1981/82, China became the principal supplier of imported mushrooms, the position held by Taiwan in 1980/81.
J.
.. ,
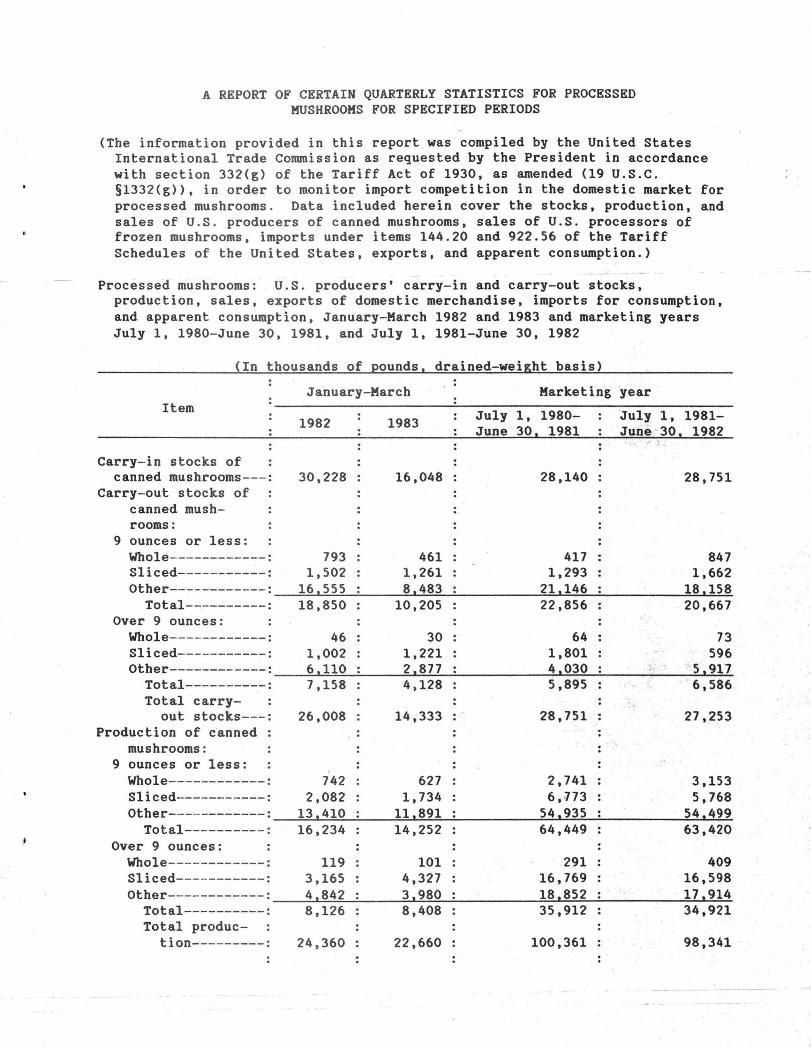
A REPORT OF CERTAIN QUARTERLY STATISTICS FOR PROCESSED MUSHROOMS FOR SPECIFIED PERIODS
(The information provided in this repor t was compiled by the United States In t e r national Trade Commission as requested by the President in accordance with section 332(g) of the Tari ff Act of 1930, as amended (19 U.S.C. §1332(g) ), in order to monitor import competition in the domestic market for proces sed mushrooms. Data included herein cover the stocks, production, and sales of U.S. producers of canned mushrooms, sales of U.S. processors of fro zen mushrooms, imports under items 144 . 20 and 922.56 of the Tariff Schedules of the United States, exports, and apparent consumption.)
Proces s ed mushrooms: U.S. producers ' carry-in and carry-out stocks, produc ti on , sales, exports of domestic merchandise, imports for consumption, and appar en t consumption, January- March 1982 and 1983 and marketing years July 1, 1980-June 30, 1981, and July 1 , 1981- June 30, 1982
(In thousands of pounds, drained-weight basis)
Item
Carry-in s t ocks of canned mushrooms---:
Carry- out stocks of canned mush-rooms :
9 ounces or l ess: Whole------------: Sliced-----------: Other------------:
Total----------: Over 9 ounces :
Whole------------: Sliced-----------:
January-March
1982 1983
30,228 16,048
793 461 1,502 1 ,261
Marketing year
July 1, 1980-June 30, 1981
28,140
417 1,293
'July 1, 1981-June 30, 1982
28,751
847 1,662
~~---....~~~~~ ......... ~~~~~~~~~~~~~~~~----.-... ......... --.. 16,555 8,483 21,146 18,158 18, 850 10 , 205 22,856 20,667
46 30 64 73 1, 002 1,221 1,801 596
Other------------=~~;:;;....z..;==-=--=---~--=~~--'-~~~~~-"-......____,_-'-~~~~~~-"-"''""'" 6 ,110 2 ,877 4,030 ~' .. 5 ,917 Total----------: Total car r y
out s t ocks---: Production of ~anned
mushrooms : 9 ounces or l ess :
Whole- - ----------: Sliced--------- --:
7, 158
26,008 ' .
I
742 2, 082
4 , 128 5,895 6,586
' " 14,333 28,751 27,253
627 2,741 3,153 1,734 6,,]73 5,768
Other------------=~-==...L..:..==--=---~-=:...&-:::....:;...::.-.:;~~~~~~~----'-~~~~--=;.....:....o<-:.,;....:;.. 13 ,410 11,891 54,935 54,499 Total - ---------: 16, 234 14,252 64,449 63,420
Over 9 ounces: Whole- - ----------: 119 101 291 409 Sliced---- -------: 3,165 4,327 16,769 16,598 Other------------=~~....:....L..;....;-=---'-~~..;:;...a....:;...;;;~~~~~~--=:;...;:o...<~~-"-~~~~---"-'-"-'-'~ 4,842 3,980 18,852 17.914
Total - ---------: 8,126 8 , 408 35,912 34,921 Total produc-
t i on---------: 24,360 22,660 100,361 98,341
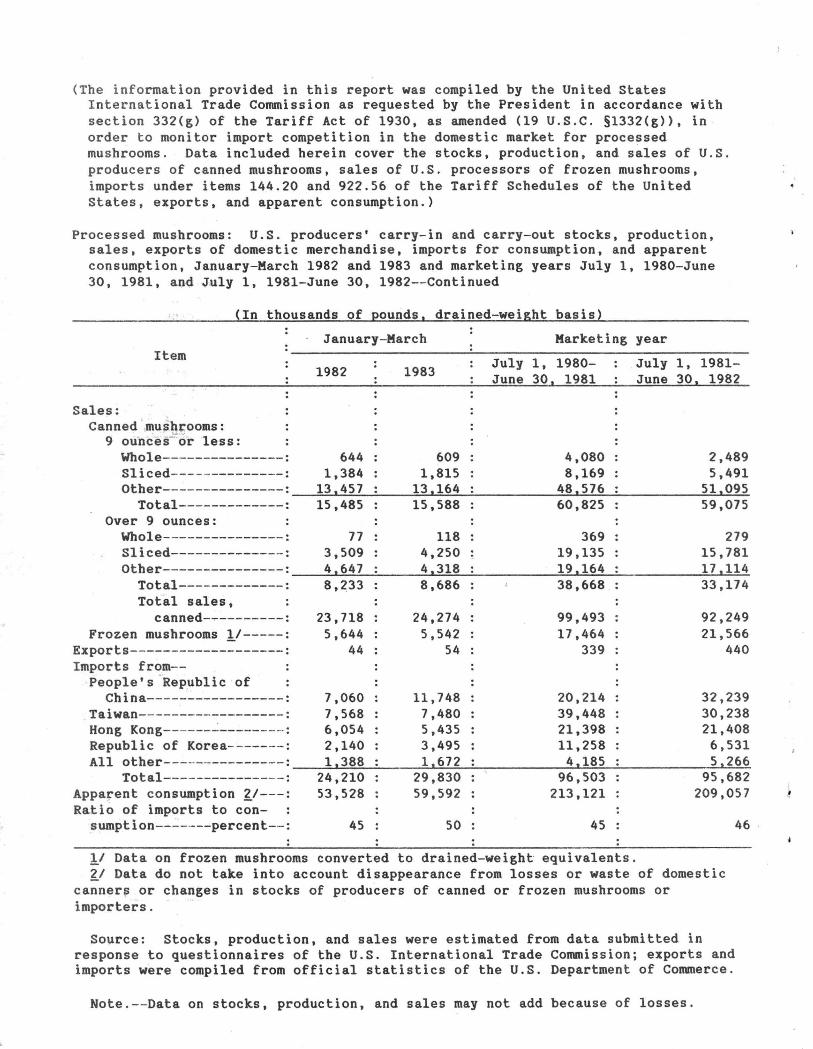
(The information provided in this report was compiled by the United States International Trade Commission as requested by the President in accordance with section 332(g) of the Tariff Act of 1930, as amended (19 U.S.C. §1332(g)), in order to monitor import competition in the domestic market for processed mushrooms. Data included herein cover the stocks, production, and sales of U.S . producers of canned mushrooms, sales of U.S. processors of frozen mushrooms, imports under items 144.20 and 922.56 of the Tariff Schedules of the United States, exports, and apparent consumption.)
Processed mushrooms: U.S. producers' carry-in and carry-out stocks, production, sales, exports of domestic merchandise, imports for consumption, and apparent consumption, January-March 1982 and 1983 and marketing years July 1, 1980-June 30, 1981, and July 1, 1981-June 30, 1982-- Continued
~ ... (In thousands of !!Ounds 1 drained-weight basis)
January-March Marketing year Item July 1, 1980- July 1, 1981-
1982 1983 June 30. 1981 June 30. 1982
Sales: Canned mush.-:ooms: .... "
9 ounces- or less: Whole---------------: 644 609 4,080 2,489 Sliced----- ---------: 1,384 1,815 8,169 5,491 Other---------------: 13 .457 13.164 48.576 51.095
Total-------------: 15,485 15,588 60,825 59,075 Over 9 ounces:
Whole---------------: 77 118 369 279 Sliced--------------: 3,509 4,250 .. 19,135 15,781 Other---------------: 4.647 4.318 19.164 11.114
Total-------------: 8,233 8,686 38,668 33,174 Total sales,
canned----------: 23. 718 24,274 99,493 92,249 Frozen mushrooms !/-----: 5,644 5,542 17,464 21,566
Exports-------------------: 44 54 339 440 Imports from--
People's -Republic of China----~------------: 7,060 11, 748 20,214 32,239
Taiwan-- ----------------: 7,568 7,480 39,448 30,238 Hong Kong------~--------: 6,054 5,435 21,398 21,408 Republic of Korea-------: 2,140 3,495 11,258 6,531 All other---------------: 1.388 1.672 4.185 5 1 266
Total-------------- -: 24,210 29,830 96,503 95,682 Apparent consumption v---: 53,528 59,592 213,121 209,057 Ratio of imports to con-
sumption--~----percent--: 45 50 45 46
1/ Data on frozen mushrooms converted to drained-weight equivalents. £! Data do not take into account disappearance from losses or waste of domestic
canner~ or changes in stocks of producers of canned or frozen mushrooms or importers.
Source: Stocks, production, and sales were estimated from data submitted in response to questionnaires of the U.S. International Trade Commission; exports and imports were compiled from official statistics of the U.S. Department of Commerce.
Note.- - Data on stocks, production, and sales may not add because of losses.
J

UNITED STATES
INTERNATIONAL TRADE COMMISSION WASHINGTON, O.C. 20436
OFFICIAL . BUSINESS
ADDRESS CORRECTION REQUESTED
ADDRESS CHANGE C Remove from List O Change as Shown
Please detach address label and mail to address shown above.
............. '\.
·Postage And Fees Paid U.S. lnternational Trade Commission
..
~