Embed Size (px)
Citation preview
Abstract
Aim/hypothesis. The aim of this study was to investi-gate the association between processed and other meatintake and incidence of Type 2 diabetes in a large co-hort of women.Methods. Incident cases of Type 2 diabetes were iden-tified during 8 years of follow-up in a prospective co-hort study of 91246 U.S. women aged 26 to 46 yearsand being free of diabetes and other major chronicdiseases at baseline in 1991.Results. We identified 741 incident cases of confirmedType 2 diabetes during 716276 person-years of fol-low-up. The relative risk adjusted for potential non-dietary confounders was 1.91 (95% CI: 1.42–2.57) inwomen consuming processed meat five times or morea week compared with those consuming processedmeat less than once a week (p<0.001 for trend). Fur-ther adjustment for intakes of magnesium, cereal fi-bre, glycaemic index, and caffeine or for a Western di-
etary pattern did not appreciably change the resultsand associations remained strong after further adjust-ment for fatty acid and cholesterol intake. Frequentconsumption of bacon, hot dogs, and sausage waseach associated with an increased risk of diabetes.While total red meat (beef or lamb as main dish, porkas main dish, hamburger, beef, pork or lamb as sand-wich or mixed dish) intake was associated with an in-creased risk of diabetes, this association was attenuat-ed after adjustment for magnesium, cereal fiber, glyc-aemic index, and caffeine (relative risk: 1.44; 95% CI:0.92–2.24).Conclusion/interpretation. Our data suggest that dietshigh in processed meats could increase the risk for de-veloping Type 2 diabetes. [Diabetologia (2003) 46:1465–1473]
Keywords Diabetes mellitus, non-insulin-dependent,meat, meat products, risk factors, prospective studies,body mass index, incidence, questionnaires, nitrites.
Received: 12 May 2003 / Revised: 21 July 2003Published online: 24 October 2003© Springer-Verlag 2003
Corresponding author: M. B. Schulze, Department of Nutrition,Harvard School of Public Health, Boston, MassachusettsE-mail: [email protected]: RR, relative risk.
Diabetologia (2003) 46:1465–1473DOI 10.1007/s00125-003-1220-7
Articles
Processed meat intake and incidence of Type 2 diabetes in younger and middle-aged womenM. B. Schulze1, J. E. Manson2, 3, 4, W. C. Willett1, 2, 3, F. B. Hu1, 2, 3
1 Department of Nutrition, Harvard School of Public Health, Boston, Massachusetts2 Department of Epidemiology, Harvard School of Public Health, Boston, Massachusetts3 Channing Laboratory, Department of Medicine, Brigham and Women’s Hospital and Harvard Medical School, Boston,
Massachusetts4 Division of Preventive Medicine, Department of Medicine, Brigham and Women’s Hospital and Harvard Medical School,
Boston, Massachusetts
particularly cardiovascular disease [5]. About 1.4 mil-lion disability-adjusted life years were lost in the USand Canada in 2001 due to diabetes [6]. In addition,diabetes mellitus is an enormous economic burden.Direct medical expenditures for diabetes care, chroniccomplications attributable to diabetes, and for the ex-cess prevalence of general medical conditions alonetotalled $91.8 billion in the United States in 2002 [7].While lifestyle characteristics such as obesity [8] andsedentary behaviour [9, 10] are established as risk fac-tors for this disease [11], less is known about dietaryfactors [12].
Recent evidence from the Health Professionals Fol-low-up Study suggests a positive association betweenintake of processed meat and the risk of Type 2 diabe-
Type 2 diabetes mellitus affects about 17 million USAmericans [1, 2] and its prevalence has increased rap-idly during the last decades [2, 3, 4]. In 2000, about 1million US Americans have been newly diagnosedwith diabetes [1, 2]. Diabetes adversely affects thequality of life of individuals and has indirect effectson morbidity and mortality due to its complications,
tes [13]. There are several potential explanations forthe observed association. Higher amounts of saturatedfat and cholesterol in processed meats could increaserisk of diabetes. Other components of red and pro-cessed meats, typically administered or developed inprocessing and preparation, such as nitrites and ad-vanced glycation end-products (AGE), are also poten-tial mediators [13, 14]. However, the increased riskwith higher meat intake observed in previous studiesmight be due to dietary factors associated with meatintake other than fatty acids, nitrites, and nitrosamines.In particular, adherence to a “Western” dietary patternis characterized by high intakes of red and processedmeat [15, 16] and this dietary pattern [17] as well asother components of it, such as refined grains, snacks,sweets, French fries, and pizza [18, 19, 20] have beenassociated with diabetes risk as well. Therefore, it isnot clear whether the observed associations were inde-pendent of the “Western” dietary pattern. We thereforeexamined the association between meat intake and riskof diabetes in a large cohort of young and middle-agedwomen, controlling for potentially confounding life-style characteristics as well as specific nutrients, par-ticularly fatty acids, and dietary patterns.
Subjects and methods
Study population. The Nurses’ Health Study II is a prospectivecohort study of 116671 female US nurses. Participants were 24to 44 years of age at study initiation in 1989. This cohort is fol-lowed using biennial mailed questionnaires with a follow-uprate exceeding 90% for every 2-year period and we estimate thatthere is almost complete (98%) ascertainment of mortality. Forthe analyses presented here, women were excluded from thebaseline population if they did not complete a dietary question-naire in 1991 or if more than nine items were left blank on it, ifthe reported dietary intake was implausible with regard to totalenergy intake (i.e., <500 kcal/day or >3500 kcal/day), if theyhad a history of diabetes, cancer (except non-melanoma skincancer) or cardiovascular disease reported on either the 1989 or1991 questionnaire, or if they had no data on physical activity in1991. These exclusions left a total of 91246 women for the ana-lyses. The study was approved by the institutional review boardsat the Harvard School of Public Health and the Brigham andWomen’s Hospital; completion of the self-administered ques-tionnaire was considered to imply informed consent.
Dietary assessment. In 1991 the mailed questionnaire includ-ed a 133-food item semi-quantitative food frequency ques-tionnaire to obtain dietary information. Women were askedhow often they had consumed a commonly used unit or por-tion size of each food on average over the previous year.Questionnaire items on processed meat consumption included“bacon”, “hot dogs”, and “sausage, salami, bologna, and otherprocessed meats” and items on red meat consumption includ-ed “beef or lamb as main dish”, “pork as main dish”, “ham-burger”, and “beef, pork, or lamb as a sandwich or mixeddish”. There were nine possible responses, ranging from “nev-er” to “six or more times per day” which were aggregated intofour categories for the overall food groups red and processedmeat (less than once per week, once per week, two to four
times per week, five or more times per week). Single meatitems were categorized into three categories (less than onceper week, once per week, two or more times per week) due tothe small number of subjects with frequent intake. The catego-rization was similar to the one previously used by our groupin the Health Professionals Follow-up Study [13]. A similarquestionnaire was used to update dietary information in 1995.Nutrient intakes were computed by multiplying the frequencyresponse by the nutrient content of the specified portion sizes.Values for nutrients were derived from the US Department ofAgriculture sources [21] and supplemented with informationfrom manufacturers. The dietary glycaemic index (based onglucose as a standard) and intakes of dietary fibre, magne-sium, and caffeine were energy-adjusted using the residualsmethod [22]. Intakes of fatty acids were expressed as nutrientdensity (% of total energy intake) [22]. The validity and reli-ability of food frequency questionnaires similar to those usedin the Nurses’ Health Study II have been described elsewhere[23, 24]. Briefly, the corrected correlation coefficients be-tween FFQ and multiple dietary records were 0.56 for hotdogs, 0.70 for bacon, 0.55 for other processed meats, 0.38 forhamburgers, 0.46 for red meat as a main dish or mixed dish,0.58 for poultry, and 0.66 for fish [23].
Ascertainment of Type 2 diabetes. Women reporting a new di-agnosis of diabetes on any of the biennial questionnaires weresent supplementary questionnaires asking about diagnosis,treatment, and history of ketoacidosis to confirm the self-reportand to distinguish between Type 1 and Type 2 diabetes. In ac-cordance with the criteria of the National Diabetes Data Group[25] confirmation of diabetes required at least one of the fol-lowing: (i) an elevated plasma glucose concentration (fastingplasma glucose ≥7.8 mmol/l, random plasma glucose≥11.1 mmol/l, and/or plasma glucose ≥11.1 mmol/l after ≥2 hduring OGTT) plus at least one classic symptom (excessivethirst, polyuria, weight loss, or hunger); (ii) no symptoms, butat least two elevated plasma glucose concentrations (by theabove criteria) on different occasions; or (iii) treatment with hy-poglycaemic medication (insulin or oral hypoglycaemic agent).We used the National Diabetes Data Group criteria to define di-abetes because the majority of our cases were diagnosed priorto the release of the American Diabetes Association criteria in1997 [26]. In substudies of the Nurses’ Health Study I and theHealth Professionals Follow-up Study, two similar cohort stud-ies among medical professionals, 98% and 97% of the self-re-ported diabetes cases by using the same supplementaryques-tionnaire were confirmed by medical record review [27, 28].
Assessment of non-dietary exposures. Information on age,weight, smoking status, contraceptive use, post-menopausalhormone replacement therapy, history of high blood pressure,and history of high blood cholesterol was collected by biennialquestionnaires. We calculated BMI as the ratio of weight (inkg) to squared height (in m2) the latter being assessed at base-line only. Self-reports of body weight have been shown to behighly correlated with technician-measured weights (r=0.96)in the Nurses’ Health Study I [29]. Family history of diabeteswas reported 1989 only. Physical activity was assessed withthe 1991 and 1997 questionnaires and was computed as meta-bolic equivalents per week using the duration per week of vari-ous forms of exercise, weighting each activity by its intensitylevel. Correlations between physical activity reported on re-calls and diaries and that reported on the questionnaire werehigh (0.79 and 0.62) [30].
Statistical analysis. We estimated the relative risk (RR) foreach category of intake compared to the lowest category using
1466 M. B. Schulze et al.: Processed meat intake and incidence of Type 2 diabetes in younger and middle-aged women
Cox proportional hazards analysis stratified on 5-year age cate-gories. Participants who were diagnosed with diabetes (Type 1or Type 2) or who died during follow-up were censored at thedate of diagnosis or death. The 1991 intake was used for thefollow-up between 1991 and 1995, and the average of the 1991and 1995 intakes for the follow-up between 1995 and 1999 toreduce within-subject variation and best represent long-termdiet [31]. We used only the 1991 but not the 1995 intake datafor those individuals who reported on the 1993 or 1995 ques-tionnaire a diagnosis of cancer (except non-melanoma skincancer) or cardiovascular disease because changes in diet afterdevelopment of these conditions might confound the relation-ship between dietary intake and diabetes [31].
We used confirmatory factor analysis to test whether a two-pattern structure, which has been repeatedly reported from theNurses’ Health Study I and the Health Professionals Follow-upStudy [15, 16, 17, 32, 33, 34, 35], does represent an acceptablemodel of the data [36]. The Goodness-of-fit of the proposedstructure was determined by the Goodness-of-Fit Index [37], theNon-normed-Fit Index [38], the Comparative Fit Index [39], theRoot Mean Square Error of Approximation [40], and by the sig-nificance-of-factor loadings. A pattern structure, representing onepattern (labelled “Western”) associated with higher intakes of redmeat, processed meat, refined grain products, snacks, sweets anddeserts, French fries, and pizza and another pattern (labelled“Prudent”) associated with higher intakes of fruits, tomatoes,cabbages, green leafy vegetables, dark yellow vegetables, le-gumes, other vegetables, poultry, and fish satisfied these assump-tions. We calculated patterns scores for each individual by sum-ming the standardized food intakes (standardizing to mean zeroand standard deviation one) for each pattern. This method hasbeen shown to lead only to a minor loss of information comparedto the more common determination of factor scores in explorato-ry [41] and confirmatory factor analysis [42] that incorporateweights corresponding to the observed factor loadings.
We used information on covariates obtained from the base-line or subsequent questionnaires in multivariate analyses, in-cluding BMI (<21.0, 21.0–22.9, 23.0–24.9, 25.0–26.9,27.0–28.9, 29.0–30.9, 31.0–32.9, 33.0–34.9, ≥35.0), total ca-loric intake (quintiles), alcohol intake (0, 0.1–4.9, 5.0–9.9,10+ g/d), physical activity (quintiles), family history of diabe-tes (yes, no), smoking (never, past, current), history of highblood pressure (yes, no), history of high blood cholesterol (yes,no), post-menopausal hormone use (never, ever), oral contra-ceptive use (never, past, current), magnesium intake (quin-tiles), glycaemic index (quintiles), cereal fibre intake (quin-tiles), caffeine intake (quintiles), types of fatty acids (quin-tiles), cholesterol intake (quintiles), and dietary patterns (quin-tiles). Non-dietary covariates were updated during follow-upusing the most recent data for each 2-year follow-up interval.
The significance of linear trends across categories of dietaryintake was tested by assigning each participant the median valuefor the category and modeling this value as a continuous variable.We also tested for effect modification by BMI and glycaemic in-dex by performing stratified analyses by these variables adjustingfor lifestyle, including BMI as continuous variable in models forBMI strata, as well as dietary variables and by modeling interac-tion terms. A p value of less than 0.05 was considered statistical-ly significant. All statistical analyses were performed using SASstatistical software (SAS Institute Inc, Cary, N.C., USA).
Results
During 716276 person-years of follow-up, we docu-mented 741 new cases of Type 2 diabetes. Among the
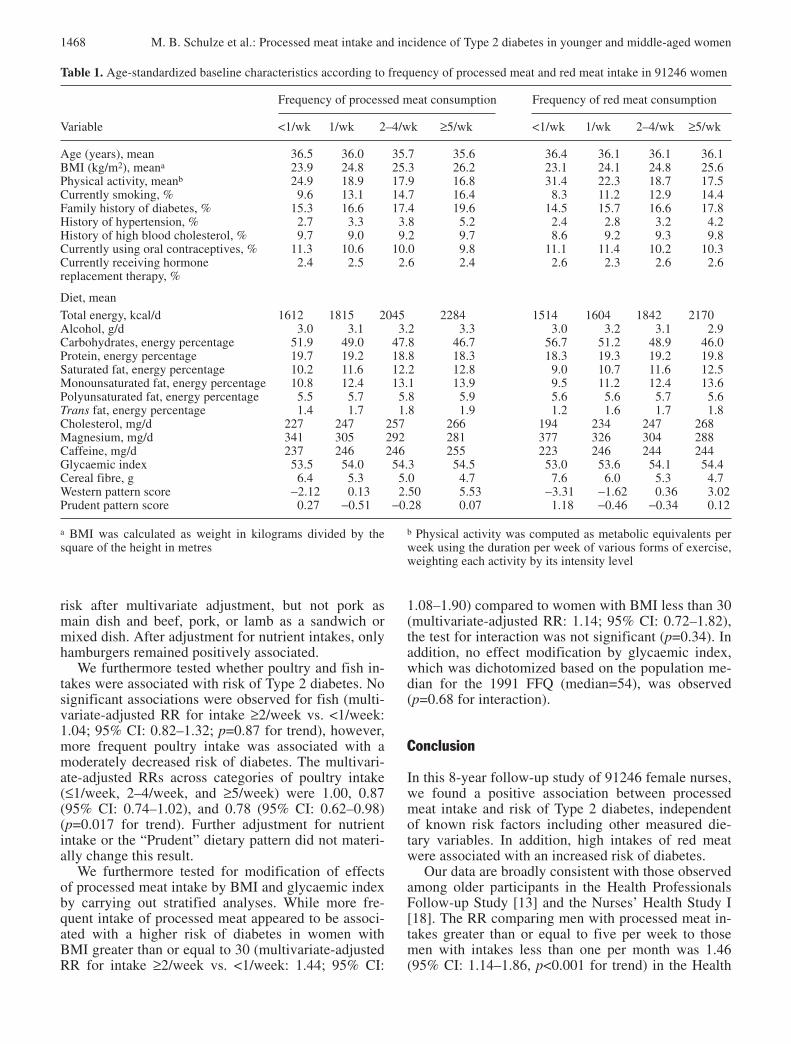
study population of 91246 women, a higher intake ofprocessed and red meat was related to higher BMI andlower physical activity and higher prevalences ofsmoking, family history of diabetes, and history of hy-pertension (Table 1). In addition, women with higherprocessed and red meat intakes had higher intakes oftotal energy and fat, and a higher “Western” patternscore and had lower intakes of carbohydrates, magne-sium, and cereal fibre.
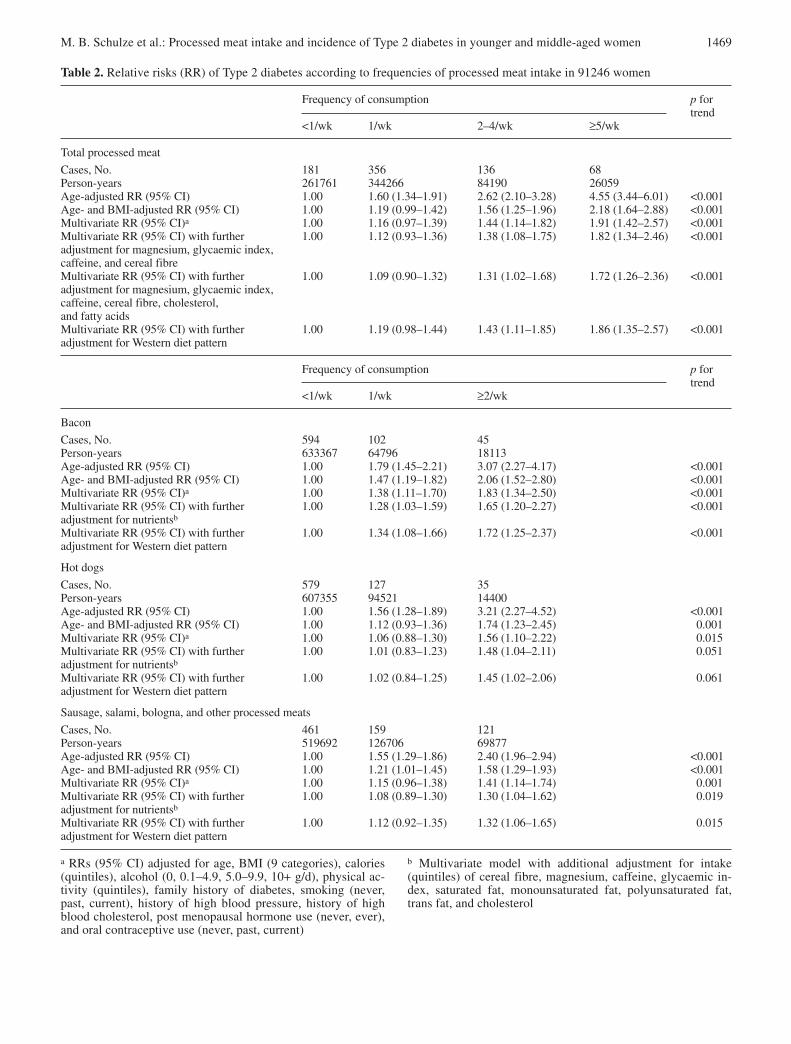
Increasing processed meat intake was strongly as-sociated with progressively higher risk for Type 2 dia-betes (Table 2). The age-adjusted RR was 4.55 (95%CI: 3.44–6.01) for women consuming processed meatfive times or more a week compared with those con-suming processed meat less than once a week. Thisassociation was attenuated after adjustment for BMI,but still remained strong. Further adjustment for life-style covariates, such as alcohol consumption, smok-ing, and family history of diabetes, did not materiallychange this observation. The multivariate
RRs across frequencies of processed meat con-sumption (<1/week, 1/week, 2–4/week, and ≥5/week)were 1.00, 1.16 (95% CI: 0.97–1.39), 1.44 (95% CI:1.14–1.82), and 1.91 (95% CI: 1.42–2.57) (p<0.001for trend). Further adjustment for cereal fibre, glyc-aemic index, magnesium, and caffeine or for the“Western” dietary pattern did not appreciably changethese results. We additionally adjusted for fruit fibre,vegetable fibre, and folate intake in the multivariateand nutrient adjusted model and for regular and dietcarbonated soft drink consumption in the multivariateand pattern-adjusted model, but results remained un-changed. Furthermore, processed meat consumptionremained strongly associated with diabetes risk afteradding intakes of specific fatty acids and cholesterolto the multivariate and nutrient-adjusted model. Simi-larly, single food items (bacon, hot dogs and sausage,salami, and bologna) showed positive associationswith risk of diabetes.
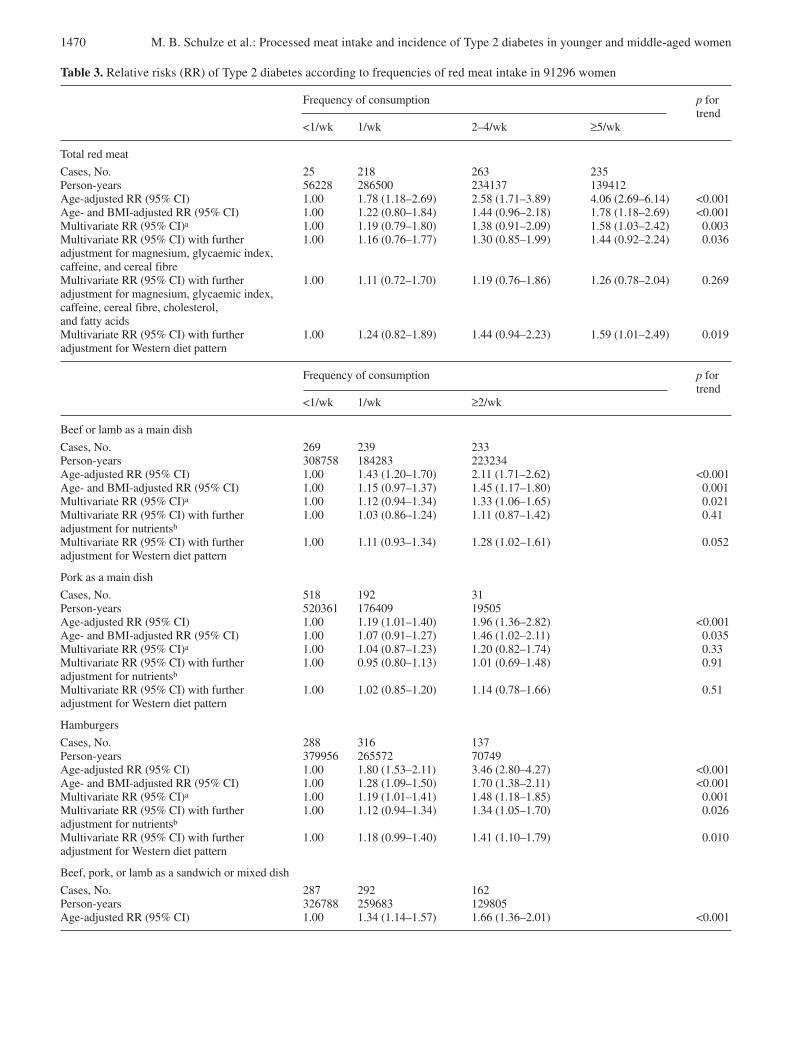
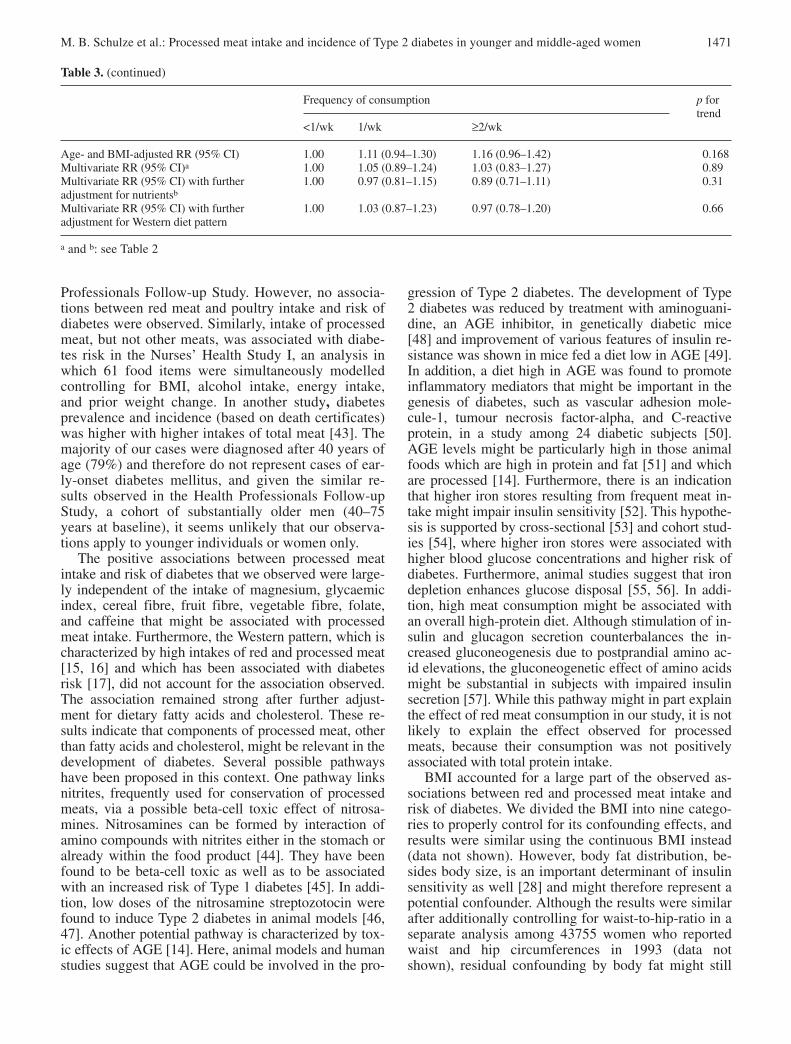
In age-adjusted analysis, total red meat intakes aswell as intake of hamburgers, beef or lamb as a maindish, pork as a main dish, and beef, lamb, or pork as asandwich or mixed dish were positively associatedwith risk of Type 2 diabetes (Table 3). These associa-tions were attenuated after adjusting for BMI. Themultivariate RRs across categories of total red meatconsumption (<1/week, 1/week, 2–4/week, and≥5/week) were 1.00, 1.19 (95% CI: 0.79–1.80), 1.38(95% CI: 0.91–2.09), and 1.58 (95% CI: 1.03–2.42)(p=0.003 for trend). Total red meat intake was associ-ated with only a modest and non-significant increaseof diabetes risk (RR for extreme categories: 1.44; 95%CI: 0.92–2.24) in multivariate analysis after additionaladjustment for magnesium, glycaemic index, cereal fi-bre, and caffeine. Further adjustment for fatty acid andcholesterol intake further attenuated the association.Among the different sources of red meat, beef as maindish and hamburgers were associated with increased
M. B. Schulze et al.: Processed meat intake and incidence of Type 2 diabetes in younger and middle-aged women 1467
risk after multivariate adjustment, but not pork asmain dish and beef, pork, or lamb as a sandwich ormixed dish. After adjustment for nutrient intakes, onlyhamburgers remained positively associated.
We furthermore tested whether poultry and fish in-takes were associated with risk of Type 2 diabetes. Nosignificant associations were observed for fish (multi-variate-adjusted RR for intake ≥2/week vs. <1/week:1.04; 95% CI: 0.82–1.32; p=0.87 for trend), however,more frequent poultry intake was associated with amoderately decreased risk of diabetes. The multivari-ate-adjusted RRs across categories of poultry intake(≤1/week, 2–4/week, and ≥5/week) were 1.00, 0.87(95% CI: 0.74–1.02), and 0.78 (95% CI: 0.62–0.98)(p=0.017 for trend). Further adjustment for nutrientintake or the “Prudent” dietary pattern did not materi-ally change this result.
We furthermore tested for modification of effectsof processed meat intake by BMI and glycaemic indexby carrying out stratified analyses. While more fre-quent intake of processed meat appeared to be associ-ated with a higher risk of diabetes in women withBMI greater than or equal to 30 (multivariate-adjustedRR for intake ≥2/week vs. <1/week: 1.44; 95% CI:
1.08–1.90) compared to women with BMI less than 30(multivariate-adjusted RR: 1.14; 95% CI: 0.72–1.82),the test for interaction was not significant (p=0.34). Inaddition, no effect modification by glycaemic index,which was dichotomized based on the population me-dian for the 1991 FFQ (median=54), was observed(p=0.68 for interaction).
Conclusion
In this 8-year follow-up study of 91246 female nurses,we found a positive association between processedmeat intake and risk of Type 2 diabetes, independentof known risk factors including other measured die-tary variables. In addition, high intakes of red meatwere associated with an increased risk of diabetes.
Our data are broadly consistent with those observedamong older participants in the Health ProfessionalsFollow-up Study [13] and the Nurses’ Health Study I[18]. The RR comparing men with processed meat in-takes greater than or equal to five per week to thosemen with intakes less than one per month was 1.46(95% CI: 1.14–1.86, p<0.001 for trend) in the Health
1468 M. B. Schulze et al.: Processed meat intake and incidence of Type 2 diabetes in younger and middle-aged women
Table 1. Age-standardized baseline characteristics according to frequency of processed meat and red meat intake in 91246 women
Frequency of processed meat consumption Frequency of red meat consumption
Variable <1/wk 1/wk 2–4/wk ≥5/wk <1/wk 1/wk 2–4/wk ≥5/wk
Age (years), mean 36.5 36.0 35.7 35.6 36.4 36.1 36.1 36.1BMI (kg/m2), meana 23.9 24.8 25.3 26.2 23.1 24.1 24.8 25.6Physical activity, meanb 24.9 18.9 17.9 16.8 31.4 22.3 18.7 17.5Currently smoking, % 9.6 13.1 14.7 16.4 8.3 11.2 12.9 14.4Family history of diabetes, % 15.3 16.6 17.4 19.6 14.5 15.7 16.6 17.8History of hypertension, % 2.7 3.3 3.8 5.2 2.4 2.8 3.2 4.2History of high blood cholesterol, % 9.7 9.0 9.2 9.7 8.6 9.2 9.3 9.8Currently using oral contraceptives, % 11.3 10.6 10.0 9.8 11.1 11.4 10.2 10.3Currently receiving hormone 2.4 2.5 2.6 2.4 2.6 2.3 2.6 2.6replacement therapy, %
Diet, meanTotal energy, kcal/d 1612 1815 2045 2284 1514 1604 1842 2170Alcohol, g/d 3.0 3.1 3.2 3.3 3.0 3.2 3.1 2.9Carbohydrates, energy percentage 51.9 49.0 47.8 46.7 56.7 51.2 48.9 46.0Protein, energy percentage 19.7 19.2 18.8 18.3 18.3 19.3 19.2 19.8Saturated fat, energy percentage 10.2 11.6 12.2 12.8 9.0 10.7 11.6 12.5Monounsaturated fat, energy percentage 10.8 12.4 13.1 13.9 9.5 11.2 12.4 13.6Polyunsaturated fat, energy percentage 5.5 5.7 5.8 5.9 5.6 5.6 5.7 5.6Trans fat, energy percentage 1.4 1.7 1.8 1.9 1.2 1.6 1.7 1.8Cholesterol, mg/d 227 247 257 266 194 234 247 268Magnesium, mg/d 341 305 292 281 377 326 304 288Caffeine, mg/d 237 246 246 255 223 246 244 244Glycaemic index 53.5 54.0 54.3 54.5 53.0 53.6 54.1 54.4Cereal fibre, g 6.4 5.3 5.0 4.7 7.6 6.0 5.3 4.7Western pattern score −2.12 0.13 2.50 5.53 −3.31 −1.62 0.36 3.02Prudent pattern score 0.27 −0.51 −0.28 0.07 1.18 −0.46 −0.34 0.12
a BMI was calculated as weight in kilograms divided by thesquare of the height in metres
b Physical activity was computed as metabolic equivalents perweek using the duration per week of various forms of exercise,weighting each activity by its intensity level
M. B. Schulze et al.: Processed meat intake and incidence of Type 2 diabetes in younger and middle-aged women 1469
Table 2. Relative risks (RR) of Type 2 diabetes according to frequencies of processed meat intake in 91246 women
Frequency of consumption p for trend
<1/wk 1/wk 2–4/wk ≥5/wk
Total processed meat
Cases, No. 181 356 136 68Person-years 261761 344266 84190 26059Age-adjusted RR (95% CI) 1.00 1.60 (1.34–1.91) 2.62 (2.10–3.28) 4.55 (3.44–6.01) <0.001Age- and BMI-adjusted RR (95% CI) 1.00 1.19 (0.99–1.42) 1.56 (1.25–1.96) 2.18 (1.64–2.88) <0.001Multivariate RR (95% CI)a 1.00 1.16 (0.97–1.39) 1.44 (1.14–1.82) 1.91 (1.42–2.57) <0.001Multivariate RR (95% CI) with further 1.00 1.12 (0.93–1.36) 1.38 (1.08–1.75) 1.82 (1.34–2.46) <0.001adjustment for magnesium, glycaemic index, caffeine, and cereal fibreMultivariate RR (95% CI) with further 1.00 1.09 (0.90–1.32) 1.31 (1.02–1.68) 1.72 (1.26–2.36) <0.001adjustment for magnesium, glycaemic index, caffeine, cereal fibre, cholesterol, and fatty acidsMultivariate RR (95% CI) with further 1.00 1.19 (0.98–1.44) 1.43 (1.11–1.85) 1.86 (1.35–2.57) <0.001adjustment for Western diet pattern
Frequency of consumption p for trend
<1/wk 1/wk ≥2/wk
Bacon
Cases, No. 594 102 45Person-years 633367 64796 18113Age-adjusted RR (95% CI) 1.00 1.79 (1.45–2.21) 3.07 (2.27–4.17) <0.001Age- and BMI-adjusted RR (95% CI) 1.00 1.47 (1.19–1.82) 2.06 (1.52–2.80) <0.001Multivariate RR (95% CI)a 1.00 1.38 (1.11–1.70) 1.83 (1.34–2.50) <0.001Multivariate RR (95% CI) with further 1.00 1.28 (1.03–1.59) 1.65 (1.20–2.27) <0.001adjustment for nutrientsb
Multivariate RR (95% CI) with further 1.00 1.34 (1.08–1.66) 1.72 (1.25–2.37) <0.001adjustment for Western diet pattern
Hot dogs
Cases, No. 579 127 35Person-years 607355 94521 14400Age-adjusted RR (95% CI) 1.00 1.56 (1.28–1.89) 3.21 (2.27–4.52) <0.001Age- and BMI-adjusted RR (95% CI) 1.00 1.12 (0.93–1.36) 1.74 (1.23–2.45) 0.001Multivariate RR (95% CI)a 1.00 1.06 (0.88–1.30) 1.56 (1.10–2.22) 0.015Multivariate RR (95% CI) with further 1.00 1.01 (0.83–1.23) 1.48 (1.04–2.11) 0.051adjustment for nutrientsb
Multivariate RR (95% CI) with further 1.00 1.02 (0.84–1.25) 1.45 (1.02–2.06) 0.061adjustment for Western diet pattern
Sausage, salami, bologna, and other processed meats
Cases, No. 461 159 121Person-years 519692 126706 69877Age-adjusted RR (95% CI) 1.00 1.55 (1.29–1.86) 2.40 (1.96–2.94) <0.001Age- and BMI-adjusted RR (95% CI) 1.00 1.21 (1.01–1.45) 1.58 (1.29–1.93) <0.001Multivariate RR (95% CI)a 1.00 1.15 (0.96–1.38) 1.41 (1.14–1.74) 0.001Multivariate RR (95% CI) with further 1.00 1.08 (0.89–1.30) 1.30 (1.04–1.62) 0.019adjustment for nutrientsb
Multivariate RR (95% CI) with further 1.00 1.12 (0.92–1.35) 1.32 (1.06–1.65) 0.015adjustment for Western diet pattern
a RRs (95% CI) adjusted for age, BMI (9 categories), calories(quintiles), alcohol (0, 0.1–4.9, 5.0–9.9, 10+ g/d), physical ac-tivity (quintiles), family history of diabetes, smoking (never,past, current), history of high blood pressure, history of highblood cholesterol, post menopausal hormone use (never, ever),and oral contraceptive use (never, past, current)
b Multivariate model with additional adjustment for intake(quintiles) of cereal fibre, magnesium, caffeine, glycaemic in-dex, saturated fat, monounsaturated fat, polyunsaturated fat,trans fat, and cholesterol
1470 M. B. Schulze et al.: Processed meat intake and incidence of Type 2 diabetes in younger and middle-aged women
Table 3. Relative risks (RR) of Type 2 diabetes according to frequencies of red meat intake in 91296 women
Frequency of consumption p for trend
<1/wk 1/wk 2–4/wk ≥5/wk
Total red meat
Cases, No. 25 218 263 235Person-years 56228 286500 234137 139412Age-adjusted RR (95% CI) 1.00 1.78 (1.18–2.69) 2.58 (1.71–3.89) 4.06 (2.69–6.14) <0.001Age- and BMI-adjusted RR (95% CI) 1.00 1.22 (0.80–1.84) 1.44 (0.96–2.18) 1.78 (1.18–2.69) <0.001Multivariate RR (95% CI)a 1.00 1.19 (0.79–1.80) 1.38 (0.91–2.09) 1.58 (1.03–2.42) 0.003Multivariate RR (95% CI) with further 1.00 1.16 (0.76–1.77) 1.30 (0.85–1.99) 1.44 (0.92–2.24) 0.036adjustment for magnesium, glycaemic index, caffeine, and cereal fibreMultivariate RR (95% CI) with further 1.00 1.11 (0.72–1.70) 1.19 (0.76–1.86) 1.26 (0.78–2.04) 0.269adjustment for magnesium, glycaemic index, caffeine, cereal fibre, cholesterol, and fatty acidsMultivariate RR (95% CI) with further 1.00 1.24 (0.82–1.89) 1.44 (0.94–2.23) 1.59 (1.01–2.49) 0.019adjustment for Western diet pattern
Frequency of consumption p for trend
<1/wk 1/wk ≥2/wk
Beef or lamb as a main dish
Cases, No. 269 239 233Person-years 308758 184283 223234Age-adjusted RR (95% CI) 1.00 1.43 (1.20–1.70) 2.11 (1.71–2.62) <0.001Age- and BMI-adjusted RR (95% CI) 1.00 1.15 (0.97–1.37) 1.45 (1.17–1.80) 0.001Multivariate RR (95% CI)a 1.00 1.12 (0.94–1.34) 1.33 (1.06–1.65) 0.021Multivariate RR (95% CI) with further 1.00 1.03 (0.86–1.24) 1.11 (0.87–1.42) 0.41adjustment for nutrientsb
Multivariate RR (95% CI) with further 1.00 1.11 (0.93–1.34) 1.28 (1.02–1.61) 0.052adjustment for Western diet pattern
Pork as a main dish
Cases, No. 518 192 31Person-years 520361 176409 19505Age-adjusted RR (95% CI) 1.00 1.19 (1.01–1.40) 1.96 (1.36–2.82) <0.001Age- and BMI-adjusted RR (95% CI) 1.00 1.07 (0.91–1.27) 1.46 (1.02–2.11) 0.035Multivariate RR (95% CI)a 1.00 1.04 (0.87–1.23) 1.20 (0.82–1.74) 0.33Multivariate RR (95% CI) with further 1.00 0.95 (0.80–1.13) 1.01 (0.69–1.48) 0.91adjustment for nutrientsb
Multivariate RR (95% CI) with further 1.00 1.02 (0.85–1.20) 1.14 (0.78–1.66) 0.51adjustment for Western diet pattern
Hamburgers
Cases, No. 288 316 137Person-years 379956 265572 70749Age-adjusted RR (95% CI) 1.00 1.80 (1.53–2.11) 3.46 (2.80–4.27) <0.001Age- and BMI-adjusted RR (95% CI) 1.00 1.28 (1.09–1.50) 1.70 (1.38–2.11) <0.001Multivariate RR (95% CI)a 1.00 1.19 (1.01–1.41) 1.48 (1.18–1.85) 0.001Multivariate RR (95% CI) with further 1.00 1.12 (0.94–1.34) 1.34 (1.05–1.70) 0.026adjustment for nutrientsb
Multivariate RR (95% CI) with further 1.00 1.18 (0.99–1.40) 1.41 (1.10–1.79) 0.010adjustment for Western diet pattern
Beef, pork, or lamb as a sandwich or mixed dish
Cases, No. 287 292 162Person-years 326788 259683 129805Age-adjusted RR (95% CI) 1.00 1.34 (1.14–1.57) 1.66 (1.36–2.01) <0.001
Professionals Follow-up Study. However, no associa-tions between red meat and poultry intake and risk ofdiabetes were observed. Similarly, intake of processedmeat, but not other meats, was associated with diabe-tes risk in the Nurses’ Health Study I, an analysis inwhich 61 food items were simultaneously modelledcontrolling for BMI, alcohol intake, energy intake,and prior weight change. In another study, diabetesprevalence and incidence (based on death certificates)was higher with higher intakes of total meat [43]. Themajority of our cases were diagnosed after 40 years ofage (79%) and therefore do not represent cases of ear-ly-onset diabetes mellitus, and given the similar re-sults observed in the Health Professionals Follow-upStudy, a cohort of substantially older men (40–75years at baseline), it seems unlikely that our observa-tions apply to younger individuals or women only.
The positive associations between processed meatintake and risk of diabetes that we observed were large-ly independent of the intake of magnesium, glycaemicindex, cereal fibre, fruit fibre, vegetable fibre, folate,and caffeine that might be associated with processedmeat intake. Furthermore, the Western pattern, which ischaracterized by high intakes of red and processed meat[15, 16] and which has been associated with diabetesrisk [17], did not account for the association observed.The association remained strong after further adjust-ment for dietary fatty acids and cholesterol. These re-sults indicate that components of processed meat, otherthan fatty acids and cholesterol, might be relevant in thedevelopment of diabetes. Several possible pathwayshave been proposed in this context. One pathway linksnitrites, frequently used for conservation of processedmeats, via a possible beta-cell toxic effect of nitrosa-mines. Nitrosamines can be formed by interaction ofamino compounds with nitrites either in the stomach oralready within the food product [44]. They have beenfound to be beta-cell toxic as well as to be associatedwith an increased risk of Type 1 diabetes [45]. In addi-tion, low doses of the nitrosamine streptozotocin werefound to induce Type 2 diabetes in animal models [46,47]. Another potential pathway is characterized by tox-ic effects of AGE [14]. Here, animal models and humanstudies suggest that AGE could be involved in the pro-
gression of Type 2 diabetes. The development of Type2 diabetes was reduced by treatment with aminoguani-dine, an AGE inhibitor, in genetically diabetic mice[48] and improvement of various features of insulin re-sistance was shown in mice fed a diet low in AGE [49].In addition, a diet high in AGE was found to promoteinflammatory mediators that might be important in thegenesis of diabetes, such as vascular adhesion mole-cule-1, tumour necrosis factor-alpha, and C-reactiveprotein, in a study among 24 diabetic subjects [50].AGE levels might be particularly high in those animalfoods which are high in protein and fat [51] and whichare processed [14]. Furthermore, there is an indicationthat higher iron stores resulting from frequent meat in-take might impair insulin sensitivity [52]. This hypothe-sis is supported by cross-sectional [53] and cohort stud-ies [54], where higher iron stores were associated withhigher blood glucose concentrations and higher risk ofdiabetes. Furthermore, animal studies suggest that irondepletion enhances glucose disposal [55, 56]. In addi-tion, high meat consumption might be associated withan overall high-protein diet. Although stimulation of in-sulin and glucagon secretion counterbalances the in-creased gluconeogenesis due to postprandial amino ac-id elevations, the gluconeogenetic effect of amino acidsmight be substantial in subjects with impaired insulinsecretion [57]. While this pathway might in part explainthe effect of red meat consumption in our study, it is notlikely to explain the effect observed for processedmeats, because their consumption was not positivelyassociated with total protein intake.
BMI accounted for a large part of the observed as-sociations between red and processed meat intake andrisk of diabetes. We divided the BMI into nine catego-ries to properly control for its confounding effects, andresults were similar using the continuous BMI instead(data not shown). However, body fat distribution, be-sides body size, is an important determinant of insulinsensitivity as well [28] and might therefore represent apotential confounder. Although the results were similarafter additionally controlling for waist-to-hip-ratio in aseparate analysis among 43755 women who reportedwaist and hip circumferences in 1993 (data notshown), residual confounding by body fat might still
M. B. Schulze et al.: Processed meat intake and incidence of Type 2 diabetes in younger and middle-aged women 1471
Table 3. (continued)
Frequency of consumption p for trend
<1/wk 1/wk ≥2/wk
Age- and BMI-adjusted RR (95% CI) 1.00 1.11 (0.94–1.30) 1.16 (0.96–1.42) 0.168Multivariate RR (95% CI)a 1.00 1.05 (0.89–1.24) 1.03 (0.83–1.27) 0.89Multivariate RR (95% CI) with further 1.00 0.97 (0.81–1.15) 0.89 (0.71–1.11) 0.31adjustment for nutrientsb
Multivariate RR (95% CI) with further 1.00 1.03 (0.87–1.23) 0.97 (0.78–1.20) 0.66adjustment for Western diet pattern
a and b: see Table 2
have biased our observations, even though this seemsto be unlikely. In addition, while we adjusted for a his-tory of high blood cholesterol and hypertension in ouranalysis, we were not able to control in more detail fordyslipoproteinaemia or other potential confoundingmeasures of the metabolic syndrome. Misclassificationof disease status should not have biased our observa-tions. We have previously reported that almost 100%of cases identified based on self-reports on a validatedextended questionnaire were confirmed by a medicalrecord review [27, 28]. Diagnostic criteria for Type 2diabetes changed after the time most women in this co-hort were diagnosed [26], so that some women classi-fied as non-diabetic would now be considered cases;however, this would not affect the validity of the find-ings. While screening bias, i.e., greater screening forType 2 diabetes in women with high processed meatintake, might contribute to the observed results, weconsider this an unlikely explanation. It is possible thatwomen with high processed meat intake have seen aphysician more frequently because these women tend-ed to have higher BMI and a higher prevalence of highblood pressure. However, most women in this cohortof health professionals received routine health care,and associations remained strong after controlling forBMI and history of high blood pressure. Imprecise die-tary measurement and residual confounding are possi-ble alternative explanations for some of the observedassociations. However, errors in dietary assessmentmeasures might have accounted for a lack of associa-tion but not the reverse [31]. The repeated dietary mea-surements made in this study were advantageous be-cause they allowed for fewer measurement errors andchanges in behavioural dietary patterns over time to beassessed [31]. Adjustment for the “Western” patternmight represent an overadjustment, since red and pro-cessed meats are components of the “Western” pattern.However, the main purpose for adjustment for the“Western” pattern in our analysis was to control for po-tential confounding by overall dietary patterns. Al-though red and processed meats are components of thepattern, other food items (refined grain, snacks, sweets,French fries, pizza) are important components as well.Adjustment for the “Western” pattern therefore con-trolled for potential confounding by these dietary vari-ables. Since risk estimates were only very moderatelyattenuated adjusting for the “Western” pattern and re-mained unchanged after further adjustment for regularand diet carbonated soft drinks (which might contrib-ute to AGE intake), it is unlikely that confounding byother food groups associated with red and processedmeat intake explain our findings or that overadjust-ment is an important issue in their interpretation.
In conclusion, our findings support the hypothesisthat diets high in processed meat increase risk of Type 2 diabetes. Since processed meats are associatedwith increased risk independent of underlying dietarypatterns and nutrients, these data add to the concern
that components of processed meats, such as nitritesand AGE, could increase the risk of Type 2 diabetes.
Acknowledgements. Funded by a research grant (CA50385)from the National Institutes of Health. Dr. Schulze was alsosupported by an European Association for the Study of Diabe-tes/American Diabetes Association Trans-Atlantic fellowshipand a fellowship within the Programme of the German Aca-demic Exchange Service (DAAD). We thank Dr. Camargo forhis work related to the validation of diabetes self-reports in ourcohort.
References
1. Centers for Disease Control and Prevention (2002) Nation-al diabetes fact sheet: general information and national estimates on diabetes in the United States, 2000. U.S. De-partment of Health and Human Services, Centers for Dis-ease Control and Prevention, Atlanta, GA
2. Mokdad AH, Ford ES, Bowman BA et al. (2003) Preva-lence of obesity, diabetes, and obesity-related health riskfactors, 2001. JAMA 289:76–79
3. Mokdad AH, Ford ES, Bowman BA et al. (2000) Diabetestrends in the US: 1990–1998. Diabetes Care 23:1278–1283
4. Mokdad AH, Bowman BA, Ford ES, Vinicor F, Marks JS,Koplan JP (2001) The continuing epidemics of obesity anddiabetes in the United States. JAMA 286:1195–1200
5. Cho E, Rimm EB, Stampfer MJ, Willett WC, Hu FB(2002) The impact of diabetes mellitus and prior myocar-dial infarction on mortality from all causes and from coro-nary heart disease in men. J Am Coll Cardiol 40:954–960
6. WHO (2002) The World Health Report 2002: reducingrisks, promoting healthy life. WHO, Geneva
7. Anonymous (2003) Economic Costs of Diabetes in the USin 2002. Diabetes Care 26:917–932
8. Astrup A, Finer N (2000) Redefining type 2 diabetes: ‘dia-besity’ or ‘obesity dependent diabetes mellitus’? Obes Rev1:57–59
9. Paffenbarger RS Jr, Lee IM, Kampert JB (1997) Physicalactivity in the prevention of non-insulin-dependent diabe-tes mellitus. World Rev Nutr Diet 82:210–218
10. Wei M, Schwertner HA, Blair SN (2000) The associationbetween physical activity, physical fitness, and type 2 dia-betes mellitus. Compr Ther 26:176–182
11. Hu FB, Manson JE, Stampfer MJ et al. (2001) Diet, life-style, and the risk of type 2 diabetes mellitus in women. NEngl J Med 345:790–797
12. Sherwin RS, Anderson RM, Buse JB et al. (2003) The pre-vention or delay of type 2 diabetes. Diabetes Care 26(Suppl 1):S62–69
13. Dam RM van, Willett WC, Rimm EB, Stampfer MJ, HuFB (2002) Dietary fat and meat intake in relation to risk oftype 2 diabetes in men. Diabetes Care 25:417–424
14. Peppa M, Goldberg T, Cai W, Rayfield E, Vlassara H(2002) Glycotoxins: a missing link in the “Relationship ofDietary Fat and Meat Intake in Relation to Risk of Type 2Diabetes in Men”. Diabetes Care 25:1898–1899
15. Hu FB (2002) Dietary pattern analysis: a new direction innutritional epidemiology. Curr Opin Lipidol 13:3–9
16. Schulze MB, Hu FB (2002) Dietary patterns and risk of hypertension, type 2 diabetes mellitus, and coronary heartdisease. Curr Atheroscler Rep 4:462–467
17. van Dam RM, Rimm EB, Willett WC, Stampfer MJ, HuFB (2002) Dietary patterns and risk for type 2 diabetesmellitus in U.S. men. Ann Intern Med 136:201–209
1472 M. B. Schulze et al.: Processed meat intake and incidence of Type 2 diabetes in younger and middle-aged women
18. Colditz GA, Manson JE, Stampfer MJ, Rosner B, WillettWC, Speizer FE (1992) Diet and risk of clinical diabetes inwomen. Am J Clin Nutr 55:1018–1023
19. Salmeron J, Ascherio A, Rimm EB et al. (1997) Dietary fiber, glycemic load, and risk of NIDDM in men. DiabetesCare 20:545–550
20. Salmeron J, Manson JE, Stampfer MJ, Colditz GA, WingAL, Willett WC (1997) Dietary fiber, glycemic load, andrisk of non-insulin-dependent diabetes mellitus in women.JAMA 277:472–477
21. US Department of Agriculture (1992) Composition offoods: raw, processed, prepared, 1963–1991. US Govern-ment Printing Office, Washington, DC
22. Willett WC, Stampfer M (1998) Implications of total energy intake for epidemiologic analysis. In: Willett WC(ed.) Nutritional epidemiology. Oxford University Press,New York, pp 273–301
23. Salvini S, Hunter DJ, Sampson L et al. (1989) Food-basedvalidation of a dietary questionnaire: the effects of week-to-week variation in food consumption. Int J Epidemiol18:858–867
24. Willett WC, Lenart E (1998) Reproducibility and validityof food-frequency questionnaires. In: Willett WC (ed.) Nutritional epidemiology. Oxford University Press, NewYork, pp 101–156
25. National Diabetes Data Group (1979) Classification and diagnosis of diabetes mellitus and other categories of glu-cose intolerance. Diabetes 28:1039–1057
26. Expert Committee on the Diagnosis and Classification ofDiabetes Mellitus (1997) Report of the Expert Committeeon the Diagnosis and Classification of Diabetes Mellitus.Diabetes Care 20:1183–1197
27. Manson JE, Rimm EB, Stampfer MJ et al. (1991) Physicalactivity and incidence of non-insulin-dependent diabetesmellitus in women. Lancet 338:774–778
28. Hu FB, Leitzmann MF, Stampfer MJ, Colditz GA, WillettWC, Rimm EB (2001) Physical activity and televisionwatching in relation to risk for type 2 diabetes mellitus inmen. Arch Intern Med 161:1542–1548
29. Willett W, Stampfer MJ, Bain C et al. (1983) Cigarettesmoking, relative weight, and menopause. Am J Epidemiol117:651–658
30. Wolf AM, Hunter DJ, Colditz GA et al. (1994) Reproduc-ibility and validity of a self-administered physical activityquestionnaire. Int J Epidemiol 23:991–999
31. Hu FB, Stampfer MJ, Rimm E et al. (1999) Dietary fat andcoronary heart disease: a comparison of approaches for adjusting for total energy intake and modeling repeated dietary measurements. Am J Epidemiol 149:531–540
32. Hu FB, Rimm E, Smith-Warner SA et al. (1999) Reproduc-ibility and validity of dietary patterns assessed with a food-frequency questionnaire. Am J Clin Nutr 69:243–249
33. Hu FB, Rimm EB, Stampfer MJ, Ascherio A, SpiegelmanD, Willett WC (2000) Prospective study of major dietarypatterns and risk of coronary heart disease in men. Am J Clin Nutr 72:912–921
34. Fung TT, Rimm EB, Spiegelman D et al. (2001) Associa-tion between dietary patterns and plasma biomarkers ofobesity and cardiovascular disease risk. Am J Clin Nutr73:61–67
35. Fung TT, Willett WC, Stampfer MJ, Manson JE, Hu FB(2001) Dietary patterns and the risk of coronary heart dis-ease in women. Arch Intern Med 161:1857–1862
36. Bentler PM (1980) Mutivariate analysis with latent vari-ables: causal modeling. Annu Rev Psychol 31:11–21
37. Joreskog KG, Sorbom D (1986) LISREL VI: analysis oflinear structural relationships by maximum likelihood, in-
strumental variables, and least squares methods. Universityof Uppsala Department of Statistics, Uppsala, Sweden
38. Bentler PM, Bonett DG (1980) Significance tests andgoodness of fit in the analysis of covariance structures.Psychol Bull 88:588–606
39. Bentler PM (1990) Comparative fit indexes in structuralmodels. Psychometrika 107:238–246
40. Browne MW, Cudeck R (1993) Alternative ways of assess-ing model fit. In: Bollen KA, Long JS (eds) Testing struc-tural equation models. Sage, Newbury Park, CA
41. Schulze MB, Hoffmann K, Kroke A, Boeing H (2003) Anapproach to construct simplified measures of dietary pat-terns from exploratory factor analysis. Br J Nutr 89:409–419
42. Comrey AL (1988) Factor-analytic methods of scale devel-opment in personality and clinical psychology. J ConsultClin Psychol 56:754–761
43. Snowdon DA, Phillips RL (1985) Does a vegetarian dietreduce the occurrence of diabetes? Am J Public Health75:507–512
44. Lijinsky W (1999) N-Nitroso compounds in the diet. MutatRes 443:129–138
45. Dahlquist G (1998) The aetiology of type 1 diabetes: anepidemiological perspective. Acta Paediatr Suppl 425:5–10
46. Ito M, Kondo Y, Nakatani A, Naruse A (1999) New modelof progressive non-insulin-dependent diabetes mellitus inmice induced by streptozotocin. Biol Pharm Bull 22:988–989
47. Portha B, Blondel O, Serradas P et al. (1989) The rat mod-els of non-insulin dependent diabetes induced by neonatalstreptozotocin. Diabet Metab 15:61–75
48. Piercy V, Toseland CD, Turner NC (1998) Potential benefitof inhibitors of advanced glycation end products in the pro-gression of type II diabetes: a study with aminoguanidinein C57/BLKsJ diabetic mice. Metabolism 47:1477–1480
49. Hofmann SM, Dong HJ, Li Z et al. (2002) Improved insu-lin sensitivity is associated with restricted intake of dietaryglycoxidation products in the db/db mouse. Diabetes 51:2082–2089
50. Vlassara H, Cai W, Crandall J et al. (2002) Inflammatorymediators are induced by dietary glycotoxins, a major riskfactor for diabetic angiopathy. Proc Natl Acad Sci USA99:15596–15601
51. Koschinsky T, He CJ, Mitsuhashi T et al. (1997) Orally ab-sorbed reactive glycation products (glycotoxins): an envi-ronmental risk factor in diabetic nephropathy. Proc NatlAcad Sci USA 94:6474–6479
52. Hua NW, Stoohs RA, Facchini FS (2001) Low iron statusand enhanced insulin sensitivity in lacto-ovo vegetarians.Br J Nutr 86:515–519
53. Tuomainen TP, Nyyssonen K, Salonen R et al. (1997)Body iron stores are associated with serum insulin andblood glucose concentrations. Population study in 1,013eastern Finnish men. Diabetes Care 20:426–428
54. Salonen JT, Tuomainen TP, Nyyssonen K, Lakka HM, Punnonen K (1998) Relation between iron stores and non-insulin dependent diabetes in men: case-control study. BMJ317:727
55. Borel MJ, Beard JL, Farrell PA (1993) Hepatic glucoseproduction and insulin sensitivity and responsiveness iniron-deficient anemic rats. Am J Physiol 264:E380–E390
56. Farrell PA, Beard JL, Druckenmiller M (1988) Increasedinsulin sensitivity in iron-deficient rats. J Nutr 118:1104–1109
57. Krebs M, Brehm A, Krssak M et al. (2003) Direct and indi-rect effects of amino acids on hepatic glucose metabolismin humans. Diabetologia 46:917–925
M. B. Schulze et al.: Processed meat intake and incidence of Type 2 diabetes in younger and middle-aged women 1473