Embed Size (px)
Citation preview

Journal of Engineering Science and Technology EURECA 2014 Special Issue April (2015) 113 - 137 © School of Engineering, Taylor’s University
113
PROCESS SYNTHESIS AND DESIGN FOR EXTRACTION OF BIOACTIVE COMPOUNDS FROM STROBILANTHES
CRISPUS LEAVES (SC)
JOANNE W.R. CHAN1, CHIEN HWA CHONG
1*, DENNY K. S. NG
2
1School of Engineering, Taylor’s University, Taylor’s Lakeside Campus,
No 1, Jalan Taylor‘s, 47500 Subang Jaya, Selangor DE, Malaysia 2 Department of Chemical and Environmental Engineering/ Centre of Excellence for Green
Technologies, University of Nottingham Malaysia Campus, Broga Road, 43500 Semenyih,
Selangor, Malaysia.
*Corresponding Author: [email protected]
Abstract
Herbs are well known for medicinal purposes throughout human history.
Benefits and applications of herbs have been well known and used in traditional
medicine since centuries ago, including healing of different diseases,
maintaining and restoring body balances. Bioactive compounds in the herbs is
recognised as compounds that help in defencing human body by deterring
formation of free radical chain reactions that attack human body’s cells.
However, postharvest processing of herbs via drying and extraction methods
affected the quality and quantity of the bioactive compounds. Therefore, in this
work, a systematic process synthesis and design approach for extraction of
bioactive compounds from herbs is presented. Commercial process simulation
software, PRO/II 9.1 was used to simulate and analyse the performance of
bioactive compounds extraction from the herbs. To demonstrate the proposed
approach, a case study on Strobilanthes Crispus leaves (SC) production is
presented. Selection of technologies and design parameters can be used to
maximise the productivity and minimise the operation cost for bioactive
compounds production. Based on the optimised result, the optimum process
configuration consists of convective air drying- supercritical fluid extraction
and ultrafiltration. In this process, it is estimated to retain 23.89% of phenolic
acids. The annual operating cost of this process is located as US 29,304, which
is 1.26 times lower than combined microwave vacuum drying- supercritical
fluid extraction- ultrafiltration. Meanwhile, the final product flow rate is
56,494 kg/year, which is 5.23 times higher than convective air drying-
conventional solvent extraction - ultrafiltration.
Keywords: Bioactive compounds, Process synthesis, Strobilanthes Crispus,
Extraction, Drying.

114 Joanne W.R. Chan et al.
Journal of Engineering Science and Technology Special Issue 4/2015
Nomenclatures
CAD
C/MVD
CSE
C
Convective air drying
Microwave vacuum drying
Conventional solvent extraction
Raw material cost
DES
DM
E
LP
Deep eutectic solvent
Dry matter
Respective technologies’ energy costs
Low pressure
MW Microwave drying
NaDES Natural deep eutectic solvent
IL
I
SFE
VD
UF
FP
FPL
FPU
F
OC
OCU
OCL
TOC
Y
J
K
L
n
Ionic liquid
Binary Integer
Supercritical fluid extraction
Vacuum distillation
Ultrafiltration
Final product flow rate
Lower limit of each process flow rate
Upper limit of each process flow rate
Flow rate
Operating sost
Upper limit of operating cost
Lower limit of operating cost
Total operating cost
Yield
Pre-treatment
Output from technology j
Extraction
Purification
Greek Symbols
λ Level of satisfaction
1. Introduction
For centuries, natural herbs have been used in traditional medicine throughout
human history. Natural antioxidants are considered as more favourable option
compare to synthetic drugs that contain possibility of side effects when consumed
long term. Moreover, modern medicines are more expensive compare to
traditional medicine which mainly derives from herbals that can be grown and
gathered with little or no cost. Therefore, in recent years, there is an increase of
development and inventing bioactive compounds extraction technologies from
herbs. World Health Organization (WHO) estimated that 80% of the world
populations are depended on traditional medicine for their primary health care [1].
Meanwhile, herbs which found in Malaysia have the potential to produce high
antioxidant activity, anti-AIDS, and anticancer properties [2]. However, shelf life
of the herbs is relatively short and the bioactive compounds degraded during the
harvesting and extraction processes.

Process Synthesis and Design for Extraction of Bioactive Compounds from . . . . 115
Journal of Engineering Science and Technology Special Issue 4/2015
Most of the researchers studied the retention performance of polyphenol
compounds in herbs via different technologies. Chong et al., [3] and Khorshidi et
al., [4] performed quantity and quality studies of retained bioactive components
after postharvest processing. However, there are limited studies on development
of systematic approach and process intensification for bioactive compound
extraction.
Recently, Ponce-Ortega et al. [5] presented novel methods to improve the
existing processes for production of bioactive compound. Accordingly to Lutze et
al. [6], there are some strategies can be used for Process Intensification (PI),
which are reduction of equipment size, minimisation of waste generation and
energy consumption, increase production efficiency, etc. As shown in Cerón et
al., [7], a process for antioxidant polyphenolic compounds production from
Matisia cordata Bonpl. (zapote) pulp is synthesized. Conventional unit operations
and solvents was used to analyse the productivity and operating cost.
The objective of this work is to present a systematic approach for synthesis of
a large scale extraction process of bioactive compounds from Strobilanthes
crispus leaves (SC). Different process alternatives and technologies are analysed
in this work. In this study, hybrid and modern unit operations and natural solvents
are analysed to maximise the productivity and minimise the operation cost for
bioactive compounds production. To trade off the optimisation objective of
maximising the production yield and minimising production cost, fuzzy
optimization approach is adapted in the proposed approach.
In the following sections, alternative technologies on drying and extraction
process for bioactive compounds from the SC are presented. Next, a systematic
approach for process synthesis and design of bioactive compound is presented. A
case study on production of phenolic compounds from the SC is used to illustrate
the proposed approach.
1.1. Drying technology
Drying is the process of reducing water content from the products. The objectives
of drying include preservation of products from decomposition of microbial
growth, reduction of weight for transportation to reduce of storage space [8].
Cerón et al. [7], reported that the application of drying as a pre-treatment process
of extraction retained higher amount of antioxidant. By applying drying as a pre-
treatment process, the tissue of raw materials will be more brittle, which enhance
the breakdown of cell wall during grinding and homogenization processes. With a
proper pre-treatment process, more bioactive components can be extracted into
the solvents and minimised enzymatic degradation and loss of antioxidants
compounds.
Most of the previous works [3] stated that bioactive compounds are not stable
at high temperature and long drying duration. Based on Antal et al. [9], high
pressure freeze drying (FD) for herbs is recommended as it preserved the major
volatile compounds such as carvone, citronellol, limonene and methone within the
ranged of 43.78 to 519 mg/100g DM. Therefore, the FD method is commonly
used in the pharmaceutical industry. Note that the main limitations of the FD are
time-consuming, high energy consumption and operation cost [9]. Other than the
FD, convective air drying (CAD) is also commonly used in the industry as it has
the lowest operating cost. However, the CAD is not suitable for drying of herbs

116 Joanne W.R. Chan et al.
Journal of Engineering Science and Technology Special Issue 4/2015
as it destroys bioactive compounds during the drying process. Due to the
abovementioned limitations of the conventional drying processes, advanced
technologies such as ultrasonic, microwave, heat pump, vacuum and hybrid
system are developed [3].
As reported in Routray et al. [10], microwave assisted drying technologies
have shorter drying time as compare to the CAD. The microwave in the dryer
remove the moisture of the samples at 60℃ and retain relatively similar amount
of total phenolic and total monomeric anthocyanin in the FD highbush
blueberry leaves [10]. To further enhance the performance of microwave drying
technique, hybrid system that integrates other technologies as a whole is
developed. For example, a combined vacuum microwave drying (C/MVD) is
developed to reduce the drying time with the absence of oxygen. The C/MVD
can generate a rapid removal of internal moisture due to large vapour pressure
difference between the outer and inner of the targeted substances [3]. The water
molecules with permanent dipolar moment rotate rapidly in the change of
electric field that give rise to friction force and collision of free ions. Since
water molecule is categorised as polar component, it is suitable to use
microwave energy for dehydration process. According to Cui et al. [11], the
C/MVD is suitable for raw material with sticky, heat-sensitive liquid or paste
like characteristics. In addition, the C/MVD can use to dry heat sensitive
products as the vacuum condition reduces the vapour pressure. The C/MVD
also reduces structural changes by preventing shrinkage and induces porous
tissues [12]. Comparing the C/MVD with the CAD drying, the C/MVD has
higher drying rate. In the CAD, the samples surface has to be dried first and
subsequently water molecule is transferred from inner of the samples to external
surface. Note that the external surface is a poor conductor of heat throughout
the drying process, only in the C/MVD, the microwave can penetrate the
external surface and heat the samples consistently.
1.2. Extraction technology
Bioactive compounds are easily disintegrated during processing time. Studies
have been conducted throughout the year to preserve and ways to glean high
amount of bioactive compounds [2, 13, 14]. In the industry, there are two types of
extraction processes are commonly used, which are supercritical fluid extraction
(SFE) and solvent extraction.
Supercritical carbon dioxide (CO2) is commonly used as the extraction fluid in
the SFE. Such fluid has high diffusivity than other fluids which enhance the mass
transfer and higher rate of extraction [2, 11, 13, 21, 23]. However, the significant
drawback of this technology is the high capital and operation costs. Therefore,
process optimisation is needed to improve the process performance and
feasibility. On the other hand, studies [2] show that by adding solvent into SFE
process can reduce the operating cost of the process. Hence, ethanol can be added
as solvent to increase the polarity of CO2 which eventually increase the extraction
yield [2]. Liza et al. [2] applied the proposed extraction technology (ethanol in
SFE) for extraction of flavonoid bioactive compounds from Strobilanthes
Crispus. Based on the previous work [2], the solubility of the supercritical fluid
can be manipulated by changing pressure and temperature for increasing the
selectivity. According to Liza et al. [2], pressure has high impact on the yield of
bioactive compound extraction followed by extraction duration and temperature.

Process Synthesis and Design for Extraction of Bioactive Compounds from . . . . 117
Journal of Engineering Science and Technology Special Issue 4/2015
Other than SFE, solvent extraction is also commonly used in the industry.
This is a traditional and state of the art method in extract bioactive compound
from herbs. In solvent extraction, solute (bioactive compounds) is transferred
from one phase (raw materials) into another one (solvent) until it reaches the final
equilibrium distribution. As reported in Dai et al. [14], natural product
components such as sugars, organic acids, amino acid, choline and urea are
excellent solvent in extraction of bioactive compounds. Such solvents are known
as natural deep eutectic solvents (NaDES). NaDES is beneficial for extraction of
bioactive compounds compared to deep eutectic solvent (DES) and ionic liquid
(IL) as it have adjustable viscosity, more sustainable and exist as liquid state even
below 0°C, 14% higher than water and ethanol [14]. However, NaDES inherits
high viscosity properties hinder the extraction efficiency. To further enhance the
extraction efficiency, mixture of water and NaDES was suggested to increase the
operating temperature or increase the transport rate by mechanical agitation [14].
To determine the optimum extraction process, alternative extraction processes are
considered in this work.
2. Systematic Approach
Figure 1 represents a flow chart of a systematic approach used to retain bioactive
compounds during processing. As shown, the approach is divided into four stages,
which are process synthesis, process simulation, process optimisation and multi-
objective optimisation.
In Stage 1, the flowsheet of the process is first synthesized. The operating
condition of the process can either determined from the experimental results or
literature. Based on the synthesized flowsheet, process simulation is performed to
analyse the performance of the process (Stage 2). Next, the process economic
evaluation can be performed based on the simulated process. To further enhance
the process performance, process optimisation can be performed (Stage 3). In the
event there is conflict of optimisation objectives, multi-objective optimisation
approach can be adapted to trade off the objectives (Stage 4). This systematic
approach is useful for design engineers and decision makers to compare and
design various process alternatives to reach the same objective. The detailed
discussion about the proposed approach is presented in the following section.
3. Case Study
A case study on production of phenolic compounds from Strobilanthes Crispus
leaves (SC) is solved to illustrate the proposed approach. Based on the available
technologies in the literature and market, six unit operations were selected for
three stages in the process [2- 3, 7]. In the first stage, convective air drying (CAD)
and combined vacuum microwave drying (C/MVD) technologies were selected
for further analysis. After the pre-treatment process, the bioactive compounds
were extracted via conventional solvent extraction (CSE) via NaDES (sucrose-
choline chloride) or supercritical fluid (SFE). Next, to increase the yield of the
products, purification process is needed. In this work, the products were purified
using vacuum distillation (VD) or ultrafiltration (UF). Figure 2 shows the possible
processing steps of production of bioactive compound from herbs based on the
selected technologies. In this work, it is expected to design an optimum process
with a capacity of 1000 kg/h of SC and working hours of 8330 per year.

118 Joanne W.R. Chan et al.
Journal of Engineering Science and Technology Special Issue 4/2015
Fig. 1. Flow chart for synthesis of extraction process for bioactive compounds.
Fig. 2. Superstructure for process synthesis design.
3.1. Process synthesis
As shown in Fig 2, the processing steps are divided into three stages, which are pre-
treatment, extraction and purification stages. As shown, six technologies are
Fk Fm Fi Fp
Purification Extraction
SFE
VD
UF
Final Products
Pre-treatment
C/MVD
CSE
CAD
Raw Materials
Process Synthesis and Design for Extraction of Bioactive Compounds from . . . . 119
Journal of Engineering Science and Technology Special Issue 4/2015
analysed in this work. Note that the operating conditions for each technologies are
collected from literature and summarised in Table 1. Different parameters were
selected based on different technologies. For the pre-treatment stage, temperature
and velocity setting of the CAD were 50°C and 0.8 m/s, respectively. Referring to
literature, the proposed operating conditions can reduce degradation of bioactive
compounds. According to Jałoszyński et al. [15], the optimum temperature that
yielded highest extracts of phenols was 30°C. However, the author suggested to use
50°C to reduce thermal degradation temperature and drying duration. In terms of air
velocity, it was proposed to set it at 0.8 m/s as high air velocity will reduced the
amount of bioactive compounds [15]. Another pre-treatment technology, the
C/MVD, microwave power and pressure were set at 480 W and 4 kPa, respectively.
Jałoszyński et al. [15] claimed that higher microwave power can reduce the overall
drying duration from 24 to 15 min at power ranged of 240 to 480 W.
For the extraction stage, temperature was set at 40°C with a ratio of 75%
NaDES solutions in water (v/v) for CE process. Natural Deep Eutectic Solvents
have prominent effect of high extracting power. Nevertheless, most of the Deep
Eutectic Solvents, (DESs) at room temperature have relatively high viscosities
(>100 cP) due to the presence of an extensive hydrogen bond network between
each component. This results in a lower mobility of free species within the DES
that restrict the effectiveness of extraction. Therefore, Dai et al., [14] propose to
mixed it with water and increased the temperature to 40°C. Choline chloride is
chosen as one of the NaDES component as it is cheap and non-toxic. Besides, the
properties of this chemical is not reactive to water and easily prepared when
mixing of choline chloride and water [16]. Second extraction technology selected
in this study was the SFE. The operating conditions for the SFE ethanol
purification, temperature and pressure were set at 60%, 45°C and 30 MPa,
respectively [17]. The pressure was set at 30 MPa is to minimise the energy
consumption by referring to pressure applied in industry [2,7,15]. For this case
study, the temperature was kept constant and a depressurize column was used to
separate the extracted product from CO2.
The final stage is purification process. VD was used in this study to concentrate
extracted products. This method can minimise the thermal degradation of bioactive
compounds. It was operated at pressure of 0.6 atm that gives a reflux drum
temperature for a water reference of 326 K [7]. Another unit operation selected for
purification process was the UF. The optimum trans-membrane pressure (TMP)
gave a higher permeates flux at short time scale was 160-240 kPa. Therefore, the
TMP and temperature were set at 240 kPa and 25°C, respectively.
3.2. Process simulation
Based on the proposed approach, once the flowsheet is synthesized, process
simulation is performed. In this work, commercial process simulation software
PRO/II 9.1 (Invensys Software, USA) is used to simulate the bioactive production
process. Based on the simulation results, techno-economic evaluation can be
performed for the process. The detail simulation procedure is discussed in the
following section.
Table 1. Operating Conditions of Selected Technologies.
Unit operations Parameter Value References

120 Joanne W.R. Chan et al.
Journal of Engineering Science and Technology Special Issue 4/2015
Unit operations Parameter Value References
Pre-treatment:
C/MVD
Pressure, kPa
4-6
[18]
Microwave power, W 480
CAD Air velocity, m/s 0.8 [15]
Temperature, °C 50
Extraction:
SFE
CSE
Ethanol concentration, %
60
[17]
Temperature, °C 45
Pressure, MPa 30
NaDES concentration, % 75 [11]
Temperature 40
Purification:
UF
Pressure, kPa
240
[19]
Temperature, °C 25
VD Temperature, °C 45 [7]
3.2.1 Defining feedstock
In this process, the major bioactive compounds of SC were selected as feedstock.
Figure 3 shows different types of phenolic compounds present in SC. The input
stream of the feedstock consists of lignin, cellulose, sugars (glucose), protein
(lysine) and the other biological molecules, such as caffeic acid, ferulic acid,
gentisic acid, vanillic acid, syringic acid, p-coumaric acid and p-hydroxy acid
[20]. Note that some components like phenolic acids and cellulose are not
available in the simulation components library; therefore, both components were
created using the hypo function. To create these components into the simulation
database, physical properties such as normal boiling point, molecular weight,
critical temperature and critical pressure are required. Table 2 shows the values of
calculated normal boiling point and molecular weight for each phenolic acids.
3.2.2 Selection of fluid packages
The fluid packages that selected for this process simulation are Non-Random Two
Liquid model (NRTL) and Peng-Robinson. The NRTL model was used to model
phase behavior of vapour-liquid extraction (VLE) and liquid-liquid extraction
(LLE), while the Peng-Robinson model was used for the supercritical fluid
extraction to calculate solubility of CO2 [21].
3.2.3 Construction flowsheet in process simulation environment
The operating conditions of selected unit operations were set based on Table 1
in the simulation environment. Note that these data were reviewed and acquired
from secondary source from journals that have investigated comprehensively
the optimum conditions of each technology. The outputs of the simulator
including mass and energy balance were obtained for further evaluation of the
feasibility of the process.

Process Synthesis and Design for Extraction of Bioactive Compounds from . . . . 121
Journal of Engineering Science and Technology Special Issue 4/2015
Fig. 3. Chemical structure of phenolic acids in Strobilanthes Crispus [20].
Table 2. Physical Properties for Phenolic Components.
Components
Estimated
Normal Boiling
Point
Molecular
Weight
(g/mol)
Critical
Temperature
(°C)
Critical
Pressure
(kPa)
(K) (°C)
Gentisic acid 677.67 404.52 117.15 650.21 7280.2
p-coumaric
acid 652.62 379.48 164.16 614.22 5037.1
p-hydroxy
benzoic acid 626.70 353.55 138.12 602.52 5730.5
Ferulic acid 682.81 409.66 194.19 679.65 4233.0
Caffeic acid 699.59 426.44 180.16 657.49 6298.8
Vanillic acid 659.20 386.05 168.15 620.26 4762.8
Syringic acid 689.55 416.40 198.18 637.42 4021.0
3.3. Process optimisation
Select the best result from a set of alternatives given by constraints using Fuzzy
optimization. The fuzzy goal was to obtain high yield of phenolic compounds and
the constraint was production cost. Mixed integer linear program (MILP) with
multiple objectives was developed to analyse economic sustainability. LINGO
version 15.0 was the optimization software used in this study. The objectives of
maximising yield and minimising operating cost from different possible

122 Joanne W.R. Chan et al.
Journal of Engineering Science and Technology Special Issue 4/2015
combination are challenging as some conditions both objectives contradicted to
each other. For instance, some high end equipment can produce products with
high yield and at the same time it will increase the operating cost. Hence,
optimisation comes in place to find a balance between these parameters. In the
optimisation model, the λ represented the level of satisfaction. The range of λ is
between 0 and 1. When final product flow rate (Fp), comes close to the upper
limit, λ will be near to 1 and operating cost (OC) reaches the lower limit. On the
other hand, the OC is the constraint with inverse response compare to Fp.
Therefore, lower and upper limit has to be pre-determined to reach a satisfaction
degree for the fuzzy goals to be maximised [7, 19]. The fuzzy optimisation Eqs.
(1) and (2) are as follow:
𝑶𝑪𝑼− 𝑶𝑪
𝑶𝑪𝑼 − 𝑶𝑪𝑳 ≥ 𝝀 (1)
𝑭𝒑− 𝑭𝑷𝑳
𝑭𝒑𝑼− 𝑭𝒑
𝑳 ≥ 𝝀 , (𝟎 ≤ 𝝀 ≤ 𝟏) (2)
where OCU and OC
L are the upper and lower limits of operating cost (OC), 𝐹𝑝
𝑈and
𝐹𝑝𝐿is the upper and lower limits of each process flow rate respectively. The upper
limits of yield is set to the highest values taken from process simulation results.
While OC is based on calculated highest cost among the various process
alternatives. For this work, the optimization models are used to maximize product
flow rate, Fp and minimizes operating cost, OC is shown in Eqs. (3-5).
𝑭𝒋 ≤ 𝑰𝒋𝑭𝒊 𝒎𝒂𝒙 ; ∑ 𝑰𝒋 = 𝟏𝒛
𝒋=𝟏 (3)
𝑭𝒍 ≤ 𝑰𝒍𝑭𝒌 𝒎𝒂𝒙 ; ∑ 𝑰𝒍 = 𝟏𝒛
𝒍=𝟏 (4)
𝑭𝒎 ≤ 𝑰𝒏𝑭𝒎 𝒎𝒂𝒙 ; ∑ 𝑰𝒏 = 𝟏𝒛
𝒏=𝟏 (5)
where Ij , Il and In is the binary integer which represent the presence (= 1) or
absence (= 0) of the technology from pre-treatment, extraction and purification
stages. 0-1 binary integer is to represent the what-if scenario. This model is
important so that the discrete decisions are made without repeating the same
technology in the stage itself. Therefore the maximum number of technology will
be restricted by this eq. 3-5. The maximum flow rate of 𝐹𝑖 𝑚𝑎𝑥 is depended on the
raw material input while 𝐹𝑘 𝑚𝑎𝑥 and 𝐹𝑚
𝑚𝑎𝑥 is depended on the type of technology
chosen and yield.
Six models were designed to represent the fuzzy constraint (operating cost) of
each process configuration are shown in Eqs. (6 ̶ 11) (Appendix A). The cost of
raw materials is included in the estimation of operating cost are shown in Table 3.
TOC01 = CADE + SFEE + VDE + (EtohC + CO2C) x I0301; (6)
TOC02 = MVDE + SFEE + VDE + (EtohC + CO2C) x I0302; (7)
TOC03 = CADE + SFEE + UFE + (EtohC + CO2C) x I0301M; (8)
TOC04 = MVDE + SFEE + UFE + (EtohC + CO2C) x I0302M; (9)

Process Synthesis and Design for Extraction of Bioactive Compounds from . . . . 123
Journal of Engineering Science and Technology Special Issue 4/2015
TOC05 = CADE + CSEE + VDE + SUCHC x I0303; (10)
TOC06 = MVDE + CSEE + VDE + SUCHC x I0303M; (11)
where TOC is Total Operating Cost, E represent respective technologies’ energy
costs, C is the raw material cost and I is the binary integer. There are a total of 6
models for total operating cost of each process configurations. In order to achieve
the objective of this study, TOC has to be minimised.
Table 3. Cost of Raw Materials.
Item Unit Cost References
Strobilanthes
Crispus (SC)
leaves
US/kg 7 Direct quotation
from market in
2014
Ethanol US/kg 1.07 [7]
Carbon dioxide US/kg 1.55 [7]
SUCH US/kg 1.16 Direct quotation
from market in
2014
Electricity US/MWh 60 [24]
LP steam US/ MWh 4.25 [24]
Cooling water US/ MWh
33.7 [24]
Based on the hierarchy diagram of Fig. 4, the production yield models are also
designed which is shown in Appendix A. The models for final levels are shown in
Eqs. (12 ̶ 17):
F0301<Input0301*Y0301 (12)
F0301M<Input0301M*Y0301M (13)
F0302<Input0302*Y0302 (14)
F0302M<Input0302M*Y0302M (15)
F0303<Input0303*Y0303 (16)
F0303M<Input0303M*Y0303M (17)
where F represented the final product flow rate (phenolic acids), Input represent
the flow rate enter the technologies and Y is the yield of the technologies. The
final product has to be maximized.
4. Results and Discussion
Six different configuration paths are designed to produce phenolic compounds
using SC as a raw material. Figure 4 shows the possible pathways for phenolic
acid productions structure viz., the C/MVD-SFE-UF, the CAD-SFE-UF, the
C/MVD-SFE-VD, the CAD-SFE-VD, the C/MVD-CSE-BE and the CAD-CSE-
BE configuration.

124 Joanne W.R. Chan et al.
Journal of Engineering Science and Technology Special Issue 4/2015
Fig. 4. Alternative pathway for bioactive compounds production where
CAD: convective air drying, SFE: supercritical extraction, UF:
ultrafiltration, C/MVD: convective microwave vacuum drying, VD: vacuum
distillation, CSE: conventional solvent extraction
4.1. Process flow sheeting for different pathway of bioactive
compounds production
Total of six process configurations for optimisation to render the best pathway are
shown in Figs. 5 - 10. Note that phenolic compounds like caffeic acid, ferulic
acid, gentisic acid, vanillic acid, syringic acid, p-coumaric acid, and p-hydroxy
acid are obtained from six different process configurations. Only six process
configurations are simulated as NaDES, sucrose-choline chloride (SUCH) is
unable to be recovered at the purification stage of ultrafiltration. This is due to
ultrafiltration is unable to separate the SUCH with high density value. Therefore,
two configurations are omitted in the study.
Lowest amount of CO2 was produced from the CAD-SFE-UF configuration.
Figure 5 shows a process flow sheeting of the CAD-SFE-UF configuration. Raw
materials were dried using the CAD unit (E-1). SC were ground into small
particles using a grinder (E-2) after dehydration process. Then, all ground SC
were mixed with co-solvents and recycled solvents using a mixer (E-3). Phenolic
acids was extracted using the SFE (E-4) unit supplied with fresh CO2 and
recycled CO2. At the final stage of the process, phenolic acids with impurities
were separated using the membrane unit (E-7). Referring to the amount of CO2
produced at the production stream, it was found that 26.9 kg/hr CO2 unable to
recycle back to the SFE unit. However, it is the lowest compared to the other
configurations which produce as high as 47.2 kg/hr of CO2. The amount of CO2
that unable to recycle back to the system is arranged in the following order:
CAD-SFE-VD > C/MVD-SFE-VD> C/MVD-SFE-UF > CAD-SFE-UF
Highest amount of solvents recycled through the CAD-SFE-UF process
compared to other process configurations. The CAD-SFE-UF (Fig. 5) configuration
ethanol flow rates at the product stream is 13.4 kg/hr. It is 12 times of the amount of
solvent recycled back to the process based on 160 kg/hr of solvent supply to the
SFE unit. This process is more environmental friendly compared to other
configurations using a SFE unit. The capability of the configured process recycle
back most of the solvent are arranged in the following order:
Process Synthesis and Design for Extraction of Bioactive Compounds from . . . . 125
Journal of Engineering Science and Technology Special Issue 4/2015
CAD-SFE-VD > C/MVD-SFE-UF > CAD-SFE-VD > C/MVD-SFE-VD
Four configurations can retain all types of phenolic acids at the end of the
process. Out of six configurations, only the CAD-SFE-VD, the C/MVD-SFE-UF,
the CAD-SFE-VD and the C/MVD-SFE-VD configurations able to retain all types
of phenolic acids after processing. Referring to Table 3, the CAD-SFE-VD
configuration retained 32.82 kg/hr, 0.92 kg/hr, 2.01 kg/hr, 1.26 kg/hr, 1.28 kg/hr,
1.58 kg/hr, 1.42 kg/hr and 1.016 kg/hr of lysine, caffeic acid, ferulic acid, gentisic
acid, vanillic acid, syringic acid, p-coumaric acid, and p-hydroxy acid, respectively.
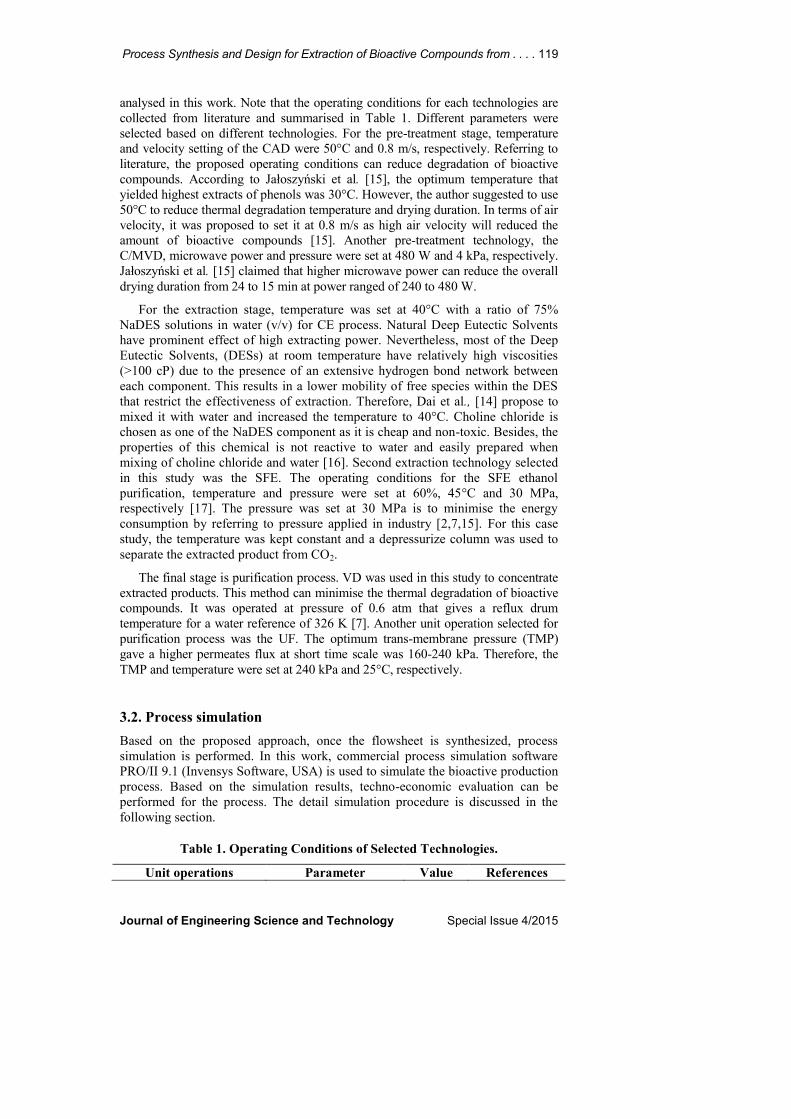
For the C/MVD-SFE-UF configuration, SC was dried using the C/MVD (E-1)
unit. Then, it was ground into small particles before subjecting to the extraction
process using the SFE (E-4) unit. During the extraction process, CO2 was
supplied through new CO2 inlet and recycle stream of a depressurizing unit (E-5).
Amount of CO2 produced from this process was 31.28 kg/hr. After the SFE (E-4)
extraction process, all bottom products of E-5 were sent to a membrane separator
to separate co-solvent from final products. At the end of the process, 37.99 kg/hr,
0.92 kg/hr, 2.01 kg/hr, 1.26 kg/hr, 1.31 kg/hr, 1.58 kg/hr, 1.47 kg/hr and 1.12
kg/hr of lysine, caffeic acid, ferulic acid, gentisic acid, vanillic acid, syringic acid,
p-coumaric acid, and p-hydroxy acid, respectively.
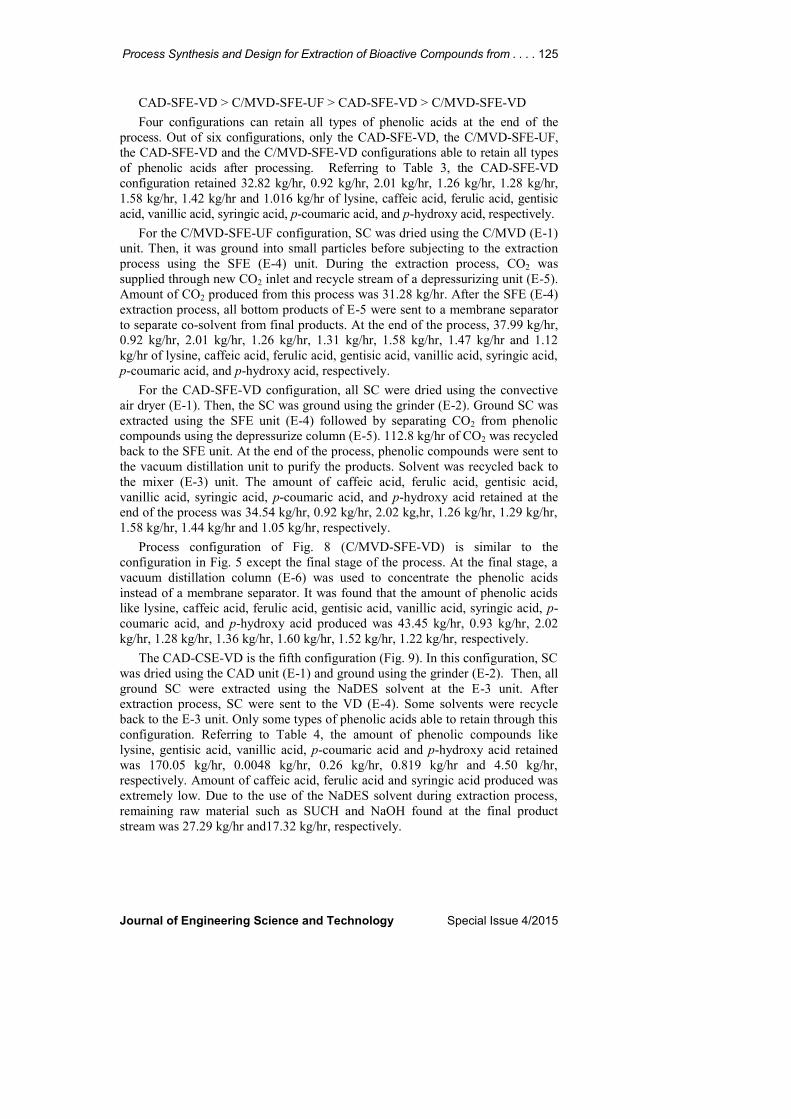
For the CAD-SFE-VD configuration, all SC were dried using the convective
air dryer (E-1). Then, the SC was ground using the grinder (E-2). Ground SC was
extracted using the SFE unit (E-4) followed by separating CO2 from phenolic
compounds using the depressurize column (E-5). 112.8 kg/hr of CO2 was recycled
back to the SFE unit. At the end of the process, phenolic compounds were sent to
the vacuum distillation unit to purify the products. Solvent was recycled back to
the mixer (E-3) unit. The amount of caffeic acid, ferulic acid, gentisic acid,
vanillic acid, syringic acid, p-coumaric acid, and p-hydroxy acid retained at the
end of the process was 34.54 kg/hr, 0.92 kg/hr, 2.02 kg,hr, 1.26 kg/hr, 1.29 kg/hr,
1.58 kg/hr, 1.44 kg/hr and 1.05 kg/hr, respectively.
Process configuration of Fig. 8 (C/MVD-SFE-VD) is similar to the
configuration in Fig. 5 except the final stage of the process. At the final stage, a
vacuum distillation column (E-6) was used to concentrate the phenolic acids
instead of a membrane separator. It was found that the amount of phenolic acids
like lysine, caffeic acid, ferulic acid, gentisic acid, vanillic acid, syringic acid, p-
coumaric acid, and p-hydroxy acid produced was 43.45 kg/hr, 0.93 kg/hr, 2.02
kg/hr, 1.28 kg/hr, 1.36 kg/hr, 1.60 kg/hr, 1.52 kg/hr, 1.22 kg/hr, respectively.
The CAD-CSE-VD is the fifth configuration (Fig. 9). In this configuration, SC
was dried using the CAD unit (E-1) and ground using the grinder (E-2). Then, all
ground SC were extracted using the NaDES solvent at the E-3 unit. After
extraction process, SC were sent to the VD (E-4). Some solvents were recycle
back to the E-3 unit. Only some types of phenolic acids able to retain through this
configuration. Referring to Table 4, the amount of phenolic compounds like
lysine, gentisic acid, vanillic acid, p-coumaric acid and p-hydroxy acid retained
was 170.05 kg/hr, 0.0048 kg/hr, 0.26 kg/hr, 0.819 kg/hr and 4.50 kg/hr,
respectively. Amount of caffeic acid, ferulic acid and syringic acid produced was
extremely low. Due to the use of the NaDES solvent during extraction process,
remaining raw material such as SUCH and NaOH found at the final product
stream was 27.29 kg/hr and17.32 kg/hr, respectively.

126 Joanne W.R. Chan et al.
Journal of Engineering Science and Technology Special Issue 4/2015
Ta
ble
4.
Ma
ss F
low
Ra
te o
f P
rod
uct
Bre
ak
do
wn
in
Ea
ch P
roce
ss C
on
fig
ura
tio
n.
S
olv
en
t
SF
E
So
lven
t
CS
E
Pro
du
ct
(kg
/hr)
CA
D-S
FE
-UF
(Fig
. 5
)
C/M
VD
-S
FE
-UF
(Fig
. 6
)
CA
D-S
FE
-VD
(Fig
. 7
)
C/M
VD
-SF
E-V
D
(Fig
. 8
)
CA
D-C
SE
-VD
(Fig
. 9
)
C/M
VD
-CS
E-V
D
(Fig
. 1
0)
Ma
ss f
low
ra
te a
t th
e
pro
du
ct
strea
m (
kg
/hr)
160
100
85.3
9
8.7
8
85
200
845
.4
835
.26
Mas
s F
ract
ion,
wt.
%
Eth
an
ol
0.9
5
1
5.7
1
15.8
9
42.1
3
50.0
0
CO
2
31.0
2
31.6
7
1
5.8
9
Wa
ter
0.5
0
.25
0.4
6
0.5
3
0.5
8
0.6
1
52.7
9
53.1
9
Ly
sin
e
3
8.4
7
38.4
6
40.6
4
21.7
2
20.1
1
20.3
0
Ca
ffeic
Acid
1
.08
0.9
3
1.0
8
0.4
6
Feru
lic
Acid
2
.36
2.0
4
2.3
7
1.0
1
Gen
tisi
c A
cid
1
.47
1.2
8
1,4
8
0.6
4
0.0
0
V
an
illi
c A
cid
1
.50
1.3
3
1.5
2
0.6
8
0.0
3
0.0
3
Sy
rin
gic
Acid
1
.84
1.6
0
1.8
6
0.8
0
0.0
0
0.0
0
p-c
ou
ma
ric
Aci
d
1.6
6
1.4
8
1.6
9
0.7
6
0.1
0
0.1
0
p-h
yd
roxy A
cid
1
.19
*
1.1
3
1.2
4
0.6
1
0.5
3
0.5
4
SU
CH
0.7
5
2.0
5
2.0
7
Na
OH
3
.23
3.2
7
Cell
ulo
se
0
0

Process Synthesis and Design for Extraction of Bioactive Compounds from . . . . 127
Journal of Engineering Science and Technology Special Issue 4/2015
E-5
Raw Materials
E-7E-4
E-3
E-6
Co-Solvent
Fresh Co-solvent
Waste
E-2E-1
CO2 recycle stream
CO2 Input
Supercritical CO2
E-9
E-8
Final Product
E-10
E-5
Raw Materials
E-7E-4
E-3
E-6
Co-solvent
Fresh Co-solvent
Waste
E-2E-1
CO2 recycle stream
CO2 Input
Supercritical CO2
E-9
E-8
Final Product
E-10
The C/MVD-CSE-VD configuration is shown in Fig. 10. SC was dried using
the C/MVD (E-1) unit and ground using the grinder (E-2). Then, all SC were
extracted using the NaDES solvent. The final stage of this configuration was
distillate all output of unit E-3 to remove and recycle the NaDES solvent.
Referring to Table 4, the amount of phenolic acids like lysine, vanillic acid, p-
coumaric acid and p-hydroxy acid retained was 169.58 kg/hr, 0.28 kg/hr, 0.83
kg/hr, 4.5 kg/hr, respectively. Sodium hydroxide (NaOH) with flow rates of 17.33
kg/hr was retained in the production stream but it will not cause harm as the
concentration was 0.02 M.
E-5
Raw Materials
E-4E-3
CO2 recycle stream
CO2 Input
Supercritical CO2
Waste
E-2
E-6
Solvent
Final Products
Fresh Co-solvent
E-1
E-8
E-7
E-5
Raw Materials
E-4E-3
Waste
E-2E-1
E-6
Co-solvent
Final ProductsFresh Co-solvent
CO2 recycle stream
CO2 Input
Supercritical CO2
E-8
E-7
Fig. 8. Process configuration 4
(C/MVD-SFE-VD) where E-1:
combined vacuum microwave
dryer, E-2: grinder, E-3: mixer,
E-4: supercritical fluid extractor,
E-5: depressurize column, E-6:
vacuum distillation column, E-7:
heat exchanger, E-8:
compressor.
Fig. 5. Process configuration 1
(CAD-SFE-UF) where E-1:
convective air dryer, E-2: grinder,
E-3: mixer, E-4: supercritical fluid
extractor, E-5: depressurize
column, E-6&10: pump, E-7:
membrane separator, E-8: heat
exchanger, E-9: compressor.
Fig. 7. Process configuration 3
(CAD-SFE-VD) where E-1:
convective air dryer, E-2:
grinder, E-3: mixer, E-4:
supercritical fluid extractor, E-
5: depressurise column, E-6:
Pump, E-7: vacuum distillation
column, E-8: heat exchanger, E-
9: compressor.
Fig. 6. Process configuration 2
(C/MVD-SFE-UF) where E-1:
combined vacuum microwave
dryer, E-2: grinder, E-3: mixer,
E-4: supercritical fluid extractor,
E-5: depressurize column, E-
6&10: pump, E-7: membrane
separator, E-8: heat exchanger, E-
9: compressor.

128 Joanne W.R. Chan et al.
Journal of Engineering Science and Technology Special Issue 4/2015
Raw Materials
E-3
Recycle solvent
E-5
Fresh Solvent
Waste
E-2E-1E-4
Final Product
Solvent
Raw Materials
E-3
Recycle solvent
E-5
Fresh Solvent
Waste
E-2
P-47
E-4Final Product
E-1
Solvent
4.2. Process performance
Energy consumption of unit operations contributes the major cost of each
configuration. Table 5 shows the energy consumption of hot (low pressure steam),
cold (cooling water) and electricity supplied to each major unit operations. Hot
utilities energy consumptions data were estimated using reboilers and heat
exchangers while the cooling utilities energy consumptions data were obtained
from cool streams. For the pre-treatment process, energy consumptions of CAD
and C/MVD are relatively similar, which was 6.89 x 10⁻⁴
MWh/kg and 6.24 x 10⁻⁴
MWh/kg, respectively. A significant different in terms of energy consumption can
be found in extraction and purification process. The SFE and VD energy
consumptions rate were 5.39 x 10⁻⁵
MWh/kg and 7.83 x 10⁻⁴
MWh/kg,
respectively. The usage of electricity for pumps and compressors also show the
same trend for process that involved both unit operations. Total energy
consumptions of pumps and compressors are shown in the electricity column in
Table 5.
Table 5. Energy Consumption of Pre-treatment, Extraction
and Purification.
Unit
Operations
*Energy Consumption, MWh/kg
Hot Cold Electricity
CAD 6.98 x 10⁻⁴
Nil 3.05 x 10⁻⁵
C/MVD 6.24 x 10⁻⁴
Nil 3.89 x 10⁻⁴
SFE 5.39 x 10⁻⁵
2.28 x 10⁻³
5.96 x 10⁻⁴
CSE 1.37 x 10⁻⁴
0 1.68 x 10⁻⁴
Fig. 9. Process configuration 5
(CAD-CSE-VD ) where E-1:
convective air dryer, E-2:
grinder, E-3: conventional
solvent extraction, E-4:
vacuum distillation column, E-
5: heat exchanger.
Fig. 10: Process configuration 6
(C/MVD-CSE-VD) where E-1:
combined vacuum microwave
dryer, E-2: grinder, E-3:
conventional solvent extraction,
E-4: vacuum distillation column,
E-5: heat exchanger.

Process Synthesis and Design for Extraction of Bioactive Compounds from . . . . 129
Journal of Engineering Science and Technology Special Issue 4/2015
Unit
Operations
*Energy Consumption, MWh/kg
VD 7.83 x 10⁻⁴
3.79 x 10⁻⁴
4.42 x 10⁻⁴
UF 2.39 x 10⁻⁵
0 2.42 x 10⁻⁴
*Energy consumption are divided by the total mass input of 1000 kg
The C/MVD treated SC have higher yield compared to the CAD SC. Table 6
shows the percentage yield and operating cost for each process configurations.
The yields of the C/MVD-SFE-UF were 10.28% and 10.23% different from the
C/MVD-CSE-VD and the CAD-CSE-VD configurations, respectively. When
comparing the pre-treatment technologies, C/MVD dried samples have higher
yield compared to the CAD dried samples due to oxidation of phenolic acid when
O2 exist during the drying process [22]. In term of drying rates, the CAD method
is less effective compared to the C/MVD method, which in turn needed long
drying time. According to Chong et al. [3], microwave drying is more effective in
removing water as the water molecules rotate in a microwave conditions as it
increases the kinetic energy for internal heating. Therefore, the C/MVD method
shows better removal of water and in turn preserving the heat sensitive phenolic
compounds is in-line with the literature reviewed compare to the CAD method It
can be concluded that the % yield of different configurations are arranged in a
descending order for total phenolic acids produced from the SC:
C/MVD-SFE-UF > CAD-SFE-UF > C/MVD-SFE-VD > CAD-SFE-VD >
C/MVD-CSE-VD > CAD-CSE-VD
Table 6. Yield and Operating Cost of Different Process Configurations.
Configurations Yield, % OC,
US/hr
OC,
US/yr
CAD-SFE-VD 23.58 4.436 36953.35
C/MVD-SFE-VD 23.92 4.444 37017.18
CAD-SFE-UF 23.89 4.368 36383.24
C/MVD-SFE-UF 24.41 4.375 36447.07
CAD-CSE-VD 14.08 1.296 10795.69
C/MVD-CSE-VD 14.13 1.304 10859.53
Operating cost of the C/MVD-SFE-VD was as high as US 37017 per annual.
The highest operating cost for phenolic acids production was the C/MVD-SFE-
VD followed by the CAD-SFE-VD, the C/MVD-SFE-UF and then the CAD-
SFE-UF. The operating cost for conventional solvent extraction was lower with
US 10860 and US 10795 for the C/MVD-CSE-VD and the CAD-CSE-VD,
respectively. It is elucidated that technology with the SFE required a higher
production cost. However, this high end technology can extract highest amount of
phenolic acids. The cost of the SFE is extremely high compare to the CSE due to
high pressure vessel needs high electricity and maintenance cost. In term of
benefits of the SFE unit, it can reduce the extraction duration. Referring to the
literature, the CSE unit processing duration was 6 hour longer than the SFE
process as it only needs 2 hour [23].

130 Joanne W.R. Chan et al.
Journal of Engineering Science and Technology Special Issue 4/2015
4.3. Multi-objective optimisation
Fuzzy target selected for optimisation were the C/MVD-SFE-UF, the CAD-CSE-
VD and the CAD-SFE-UF configuration. Selection of the above configurations is
based on highest production yield and lowest operating cost. The fuzzy targets are
summarised in Table 6 including yield of phenolic acids, calculated operating cost
and energy consumption cost of respective technologies. The first and second
columns are the upper limit and lower limit for the optimization models. The third
column shows the results generated from the Lingo optimization software. This
optimisation tool showed a process configuration that satisfies both contradicting
objective functions (product yield, Fp and operating cost, OC) simultaneously.
The detailed coding and solution for fuzzy optimization in Lingo are attached in
Appendix A and B respectively.
4.3.1 Fuzzy limits
High production yield obtained from high-end technologies. The production yield
and the total operating cost for configuration 1 are 9.683 kg/hr (196428 kg/year)
and US 4.444 kg/hr ( US 37017/year) from 83.3 ton per year of SC. This process
configuration has the highest production yield with the high-end technologies of
the convective vacuum microwave dryer (C/MVD), the supercritical fluid
extractor (SFE) and the ultrafiltration (UF) for the pre-treatment, extraction and
purification technology, respectively. The operating cost is mostly influence by
the SFE of 48.8% follow by the C/MVD with 1.15% of the total operating cost
due to the high pressure vessel and microwave generation requires lots of energy.
Table 7. Fuzzy Target for Respective Configurations.
Fuzzy Target C/MVD-SFE-UF CAD-CSE-VD CAD-SFE-UF
NOTE/ Result Upper Limit Lower Limit λ = 0.294
Fp (kg/hr) 9.683 5.603 6.782
Fp (kg/year) 196428 10795.7 56494.06
OC (US kg/hr) 4.444 1.296 3.518
OC (US/year) 37017 10859.53 29304.94
Energy costj
(US/year)
421.29 357.46 214.6
Energy costl
(US/year)
17800 115.59 7535.32
Energy costn
(US/year)
79.74 649.85 528.08
j: pretreatment technology , l : extraction technology and n: purification
technology
To determine the lower limit, the CAD-CSE-VD configuration has lower cost
and purity compared to others. The estimated operating cost is US 1.296 kg/hr
(US 10859.53/year) and production yield of 1.296 kg/hr (10795.7 kg/year). This
configuration can minimise the OC as it operates at atmospheric pressure. The OC
is lower due to the absent of the high-end technology like the SFE, which has

Process Synthesis and Design for Extraction of Bioactive Compounds from . . . . 131
Journal of Engineering Science and Technology Special Issue 4/2015
high energy consumption. It is clearly shows that the total operating cost is mostly
affected by the technology pathway chosen.
4.3.3 Optimised results
As shown above, both configurations show a huge contrast for phenolic acids
yield and operating cost. Therefore, optimisation was conducted to satisfy the
objective function of maximizing Fp and minimizing OC. From Equations (18)
and (19), the fuzzy model was constructed as follow:
𝟒.𝟒𝟒𝟒 − 𝑶𝑪
𝟒.𝟒𝟒𝟒 – 𝟏.𝟐𝟗𝟔≥ 𝝀 (18)
𝑭𝒑− 𝟓.𝟓𝟖𝟑
𝟗.𝟔𝟖𝟑− 𝟓.𝟓𝟖𝟑≥ 𝝀 , (𝟎 ≤ 𝝀 ≤ 𝟏) in kg/h (19)
The λ is the degree of satisfaction for minimising operating cost and maximising
production yield, where the λ value is 0.29 (Table 7). It was found that the
optimised process configuration was the CAD-SFE-UF with operating cost of
US3.518 kg/hr (US29304.94/year) and product yield of 3.518 kg/hr (56494.06
kg/year). As compare to previous configuration, this process generates 3.5 times
lesser and 5.23 times higher than the C/MVD-SFE-UF and the CAD-CSE-VD,
respectively. The operating cost was 1.26 times lesser and 2.7 times higher than
the C/MVD-SFE-UF and the CAD-CSE-VD, respectively. This shows that the
high-end technology has a better economic viability. The chosen technologies
able to generate high production yield with less degradation without overshooting
the operating cost. Figure 12 depicts clearly the final optimized process pathway
that satisfied the λ value. The SC is dried by the conventional air dryer (CAD).
Then, phenolic acids are extracted using the supercritical fluid extractor (SFE)
and finally concentrated by the ultrafiltration membrane (UF).
Fig. 12. Optimized pathway that satisfied both yield and operating cost
llimits.
5. Conclusions
In this work, a systematic approach of designing process for extracting bioactive
compounds from herb was presented. Various possible process configurations
were investigated and evaluated. The optimised result showed that combinations

132 Joanne W.R. Chan et al.
Journal of Engineering Science and Technology Special Issue 4/2015
of conventional and high-end technologies such as the CAD-SFE–UF can retain
most of the phenolic acids without overshooting the operating cost during
processing. The operating cost of this process was US 29304.94/year, 1.26 times
lower than the C/MVD-SFE-UF and product yield of 56494.06 kg/year is 5.23
times higher than the CAD-CSE-UF. This approach provide informative data to
help chemical engineers in selecting appropriate design process with high
production yield and low operating cost. However, there is a limitation in this
study due to the natural solvents with high density value which can be addressed
in the future works.
References
1. Ranilla, L.G.; Kwon, Y.-I.; Apostolidis, E.; and Shetty, K. (2010). Phenolic
compounds, antioxidant activity and in vitro ihibitory potential against key
enzymes relevant for hyperglycemia and hypertension of commonly used
medicinal plants, herbs and spices in Latin America. Bioresource
Technology, 101(12), 4676-4689.
2. Liza , M.S.; Abdul Rahman, R.; Mandana, B.; Jinap, S.; Rahmat, A.; Zaidul,
I. S.M., and Hamid, A. (2010). Supercritical carbon dioxide extraction of
bioactive flavonoid from Strobilanthes Crispus (Pecah Kaca). Food and
Bioproducts Processing, 88(2–3), 319-326.
3. Chong, C.H.; Figiel, A.; Law, C.L.; and Wojdyło, A. (2014). Combined
drying of apple cubes by using of heat pump, vacuum-microwave, and
intermittent techniques. Food and Bioprocess Technology, 7(4), 975-989.
4. Khorshidi, J.; Mohammadi, R.; Fakhr, T.; and Nourbakhsh, H. (2009).
Influence of drying methods, extraction time, and organ type on essential oil
content of rosemary (Rosmarinus officinalis L.). Natural Science, 7(11), 42-
44.
5. Ponce-Ortega, J.M.; Al-Thubaiti, M.M.; and El-Halwagi, M.M. (2012).
Process intensification: New understanding and systematic approach.
Chemical Engineering and Processing: Process Intensification, 53, 63-75.
6. Lutze, P.; Babi, D.K; and Woodley, J. M. (2013). Phenomena based
methodology for process synthesis incorporating process intensification.
Industrial & Engineering Chemistry Research, 52, 7127-7144.
7. Cerón, I.; Ng, R.; El-Halwagi, M.; and Cardona, C. (2014). Process synthesis
for antioxidant polyphenolic compounds production from Matisia cordata
Bonpl.(zapote) pulp. Journal of Food Engineering, 134, 5-15.
8. Karimi, F.; Rafiee, S.; Taheri-Garavand, A.; and Karimi, M. (2012).
Optimization of an air drying process for Artemisia absinthium leaves using
response surface and artificial neural network models. Journal of the Taiwan
Institute of Chemical Engineers, 43(1), 29-39.
9. Antal, T.; Figiel, A.; Kerekes, B.; and Sikolya, L. (2011). Effect of drying
methods on the quality of the essential oil of Spearmint Leaves (Mentha
Spicata.L). Drying Technology, 29, 1836-1844.
10. Routray, W.; Orsat, V.; and Gariepy, Y. (2014). Effect of different drying
methods on the microwave extraction of phenolic components and
antioxidant of highbush blueberry leaves. Drying Technology, 32, 1888-1904.
11. Cui, Z.; Xu, S.; Sun, D.; and Chen, W. (2007). Dehydration of concentrated
Ganoderma lucidum extraction by combined microwave-vacuum and
conventional vacuum drying. Drying Technology, 24, 595-599.

Process Synthesis and Design for Extraction of Bioactive Compounds from . . . . 133
Journal of Engineering Science and Technology Special Issue 4/2015
12. Schulze, B.; Hubbermann, E. M.; and Schwarz, K. (2014). Stability of
quercetin derivatives in vacuum impregnated apple slices after drying
(microwave vacuum drying, air drying, freeze drying) and storage. LWT-
Food Science and Technology, 57(1), 426-433
13. Chen, K.; Yin, W.; Zhang, W.; and Pan, J. (2011). Technical optimization of
the extraction of andrographolide by supercritical CO2. Food and
Bioproducts Processing, 89(2), 92-97.
14. Dai, Y.; Witkamp, G.-J.; Verpoorte, R.; and Choi, Y. H. (2013). Natural deep
eutectic solvents as a new extraction media for phenolic metabolites in
Carthamus tinctorius L. Analytical chemistry, 85(13), 6272-6278.
15. Jałoszyński, K.; Figiel, A.; and Wojdyło, A. (2008). Drying kinetics and
antioxidant activity of oregano. Acta Agrophysica, 11(1), 81-90.
16. Zhang, Q.; Vigier, K.D.O.; Royer, S.; and Jérôme, F. (2012). Deep eutectic
solvents: syntheses, properties and applications. Chemical Society Reviews,
41(21), 7108-7146.
17. Lenucci, M.S.; Caccioppola, A.; Durante, M.; Serrone, L.; Leonardo, R.,
Piro, G.; and Dalessandro, G. (2010). Optimization of biological and physical
parameters for lycopene supercritical CO2 extraction from ordinary and high‐pigment tomato cultivars. Journal of the Science of Food and Agriculture,
90(10), 1709-1718.
18. Wojdyło, A.; Figiel, A.; and Oszmianski, J. (2009). Effect of drying methods
with application of vacuum microwaves on the bioactive compounds, color,
and antioxidant activity of strawberry fruits. Journal of Agricultural and
Food Chemistry, 57(4), 1337–1343.
19. Vladisavljević, G.; Vukosavljević, P.; and Bukvić, B. (2003). Permeate flux
and fouling resistance in ultrafiltration of depectinized apple juice using
ceramic membranes. Journal of Food Engineering, 60(3), 241-247.
20. Afrizal. (2008). "Bioactivity and Stability Studies on Strobilanthes Crispus".
Universiti Sains Malaysia. PhD Thesis, Pp. 5.
21. Kondo, M.; Goto, M.; Kodama, A.; and Hirose, T. (2002). Separation
performance of supercritical carbon dioxide extraction column for the citrus
oil processing: Observation using simulator. Separation Science and
Technology, 37(15), 3391-3406.
22. Cerón Salazar, I.X. (2013). Design and Evaluation of Processes to Obtain
Antioxidant-Rich Extracts from tropical fruits cultivated in Amazon, Caldas
and Northern Tolima Regions, Ph.D. Thesis, Facultad de Ingenieria y
Arquitectura, Universidad Nacional de Colombia-Sede Manizales, Colombia.
23. Catchpole, O., Tallon, S., Dyer, P., Montanes, F., Moreno, T., Vagi, E.,
Eltringham, W., and Billakanti, J. (2012). Integrated supercritical fluid
extraction and bioprocessing. American Journal of Biochemistry and
Biotechnology, 8(4), 263-87.
24. Čuček, L.; Martín, M.; Grossmann, I.E.; and Kravanja, Z. (2011). Energy,
water and process technologies integration for the simultaneous production of
ethanol and food from the entire corn plant. Computers & Chemical
Engineering, 35(8), 1547-1557.
APPENDIX A
Lingo Optimization Code

134 Joanne W.R. Chan et al.
Journal of Engineering Science and Technology Special Issue 4/2015
!Price of Products and Raw Materials;
PriceHot = 60; !$/wet ton;
PriceCool = 4.25; !$/MWh ;
PriceEE = 33.7; !$/MWh ;
EtohC = 0.23; !$/KG;
CO2C = 1.108; !$/KG;
SUCHC = 1.612; !$/KG;
!Yield of Path 0101 in (kg/hr phenolic);
Y0101 = 0.97;
!Yield of Path 0102 in (kg/hr phenolic);
Y0102 = 0.99;
!Yield of Path 0201 in (kg/hr phenolic);
Y0201 = 0.25;
!Yield of Path 0201 in (kg/hr phenolic);
Y0202 = 0.14;
!Yield of Path 0203 in (kg/hr phenolic);
Y0203 = 0.25;
!Yield of Path 0204 in (kg/hr phenolic);
Y0204 = 0.14;
!Yield of Path 0301 in (kg/hr phenolic);
Y0301 = 0.97;
!Yield of Path 0301M in (kg/hr phenolic);
Y0301M = 0.97;
!Yield of Path 0302 in (kg/hr phenolic);
Y0302 = 0.99;
!Yield of Path 0302M in (kg/hr phenolic);
Y0302M = 0.99;
!Yield of Path 0303 in (kg/hr phenolic);
Y0303 = 0.97;
!Yield of Path 0303M in (kg/hr phenolic);
Y0303M = 0.97;
!Total Amount of Phenolic acid (PA) Feedstock in kg/s;
PAIn = 39.66;
!Objective function;
max = LAMDA;
(4.444 - TOC)/(4.444-1.296) >= LAMDA;
Fp = 5.583+ LAMDA * (9.683 - 5.603); !Maximum PA flow
product: 9.683, Minimum Score: 5.583;
LAMDA < =1;
!Total Operating Cost;
TOC = (TOC01 + TOC02 + TOC03 + TOC04 + TOC05 + TOC06);
!Product Flow Rate;
Fp = (F0301 + F0301M + F0302 + F0302M + F0303 + F0303M );
TOC01 = CADE + SFEE + VDE + (EtohC + CO2C)*I0301;
TOC02 = MVDE + SFEE + VDE + (EtohC + CO2C)*I0302;
TOC03 = CADE + SFEE + UFE + (EtohC + CO2C)*I0301M;
TOC04 = MVDE + SFEE + UFE + (EtohC + CO2C)*I0302M;
TOC05 = CADE + CSEE + VDE + SUCHC * I0303;
TOC06 = MVDE + CSEE + VDE + SUCHC * I0303M;
!ENERGY COST for each technology;
CADE =PriceHot*(6.98e-4*InputCAD) + PriceCool*0 +
PriceEE*(3.05E-5*InputCAD) ;
MVDE =PriceHot*(6.24E-4*InputMVD) + PriceCool*0 +
PriceEE*(3.89E-4*InputMVD) ;

Process Synthesis and Design for Extraction of Bioactive Compounds from . . . . 135
Journal of Engineering Science and Technology Special Issue 4/2015
CSEE =PriceHot*(1.37E-4*InputCSE) + PriceCool*0 +
PriceEE*(1.68E-4*InputCSE) ;
SFEE =PriceHot*(5.39E-5*InputSFE) + PriceCool*(2.28E-
3*InputSFE) + PriceEE*(5.96E-04*InputSFE) ;
VDE =PriceHot*(7.83E-4*InputVD) + PriceCool*(3.79E-4*InputVD)
+ PriceEE*(4.42E-04*InputVD) ;
UFE =PriceHot*(2.39E-5*InputUF) + PriceCool*0 +
PriceEE*(2.32E-4*InputUF) ;
!Distribution of PAIn (to know the max input of phenolic
acid);
!Choices for Level 1;
Input0101 <=PAIn*I0101;
Input0102 <=PAIn*I0102;
InputCAD =Input0101;
InputMVD =Input0102;
@Bin (I0101);
@Bin (I0102);
I0101+I0102 =1;
!Choices for Level 2;
Input0201<=Input0101*Y0101*I0201;
Input0202<=Input0101*Y0102*I0202;
Input0203<=Input0102*Y0102*I0203;
Input0204<=Input0102*Y0102*I0204;
InputCSE= Input0101*Y0102 + Input0102*Y0102;
InputSFE= Input0101*Y0101 + Input0102*Y0102;
@Bin(I0201);
@Bin(I0202);
@Bin(I0203);
@Bin(I0204);
( I0201 + I0202 + I0203 + I0204) =1;
I0101=I0201+I0202;
I0102=I0203+I0204;
!Choices for Level 3;
Input0301<=Input0201*Y0201*I0301;
Input0301M<=Input0203*Y0203*I0301M;
Input0302<=Input0201*Y0201*I0302;
Input0302M<=Input0203*Y0203*I0302M;
Input0303<=Input0202*Y0202*I0303;
Input0303M<=Input0204*Y0204*I0303M;
InputVD=Input0201*Y0201 + Input0202*Y0202 +Input0203*Y0203 +
Input0204*Y0204;
InputUF=Input0201*Y0201 + Input0203*Y0203;
@Bin(I0301);
@Bin(I0301M);
@Bin(I0302);
@Bin(I0302M);
@Bin(I0303);
@Bin(I0303M);

136 Joanne W.R. Chan et al.
Journal of Engineering Science and Technology Special Issue 4/2015
(I0302M + I0302 + I0301 + I0301M + I0303 + I0303M)=1;
I0201=I0301+I0302;
I0203=I0301M+I0302M;
I0202=I0303;
I0204=I0303M;
!Final Production Rate;
F0301<Input0301*Y0301;
F0301M<Input0301M*Y0301M;
F0302<Input0302*Y0302;
F0302M<Input0302M*Y0302M;
F0303<Input0303*Y0303;
F0303M<Input0303M*Y0303M;
APPENDIX B
Lingo Optimization Solution
Local optimal solution found.
Objective value: 0.2940656
Objective bound: 0.2940656
Infeasibilities: 0.2746217E-06
Extended solver steps: 0
Total solver iterations: 28
Elapsed runtime seconds: 0.12
Model Class: MIQP
Total variables: 51
Nonlinear variables: 22
Integer variables: 12
Total constraints: 51
Nonlinear constraints: 16
Total nonzeros: 154
Nonlinear nonzeros: 28
Variable Value Reduced Cost
PRICEHOT 60.00000 0.000000
PRICECOOL 4.250000 0.000000
PRICEEE 33.70000 0.000000
ETOHC 0.2300000 0.000000
CO2C 1.108000 0.000000
SUCHC 1.612000 0.000000
Y0101 0.9700000 0.000000
Y0102 0.9900000 0.000000
Y0201 0.2500000 0.000000
Y0202 0.1400000 0.000000
Y0203 0.2500000 0.000000
Y0204 0.1400000 0.000000
Y0301 0.9700000 0.000000
Y0301M 0.9700000 0.000000
Y0302 0.9900000 0.000000
Y0302M 0.9900000 0.000000
Y0303 0.9700000 0.000000
Y0303M 0.9700000 0.000000
PAIN 39.66000 0.000000
LAMDA 0.2940656 0.000000

Process Synthesis and Design for Extraction of Bioactive Compounds from . . . . 137
Journal of Engineering Science and Technology Special Issue 4/2015
TOC 3.518281 0.000000
FP 6.782788 0.000000
TOC01 0.000000 0.000000
TOC02 0.000000 0.000000
TOC03 3.518281 0.000000
TOC04 0.000000 0.000000
TOC05 0.000000 0.000000
TOC06 0.000000 0.1189881E-01
F0301 0.1201395E-06 0.000000
F0301M 0.000000 0.000000
F0302 6.782788 0.000000
F0302M 0.000000 0.000000
F0303 0.000000 0.000000
F0303M 0.2099172E-07 0.000000
CADE 1.212266 0.000000
SFEE 0.9046239 0.000000
VDE 0.4349627 0.000000
I0301 0.000000 0.9319855E-01
MVDE 0.000000 0.1449673
I0301M 0.000000 0.8332161E-01
UFE 0.6339098E-01 0.000000
I0302 1.000000 0.000000
I0302M 0.000000 0.000000
CSEE 0.3882720 0.000000
I0303 0.000000 0.3008162
I0303M 0.000000 0.000000
INPUTCAD 28.25279 0.000000
INPUTMVD 0.000000 0.000000
INPUTCSE 27.97026 0.000000
INPUTSFE 27.40521 0.000000
INPUTVD 6.851301 0.000000
INPUTUF 6.851301 0.000000
INPUT0101 28.25279 0.000000
I0101 1.000000 0.000000
INPUT0102 0.000000 0.000000
I0102 0.000000 0.000000
INPUT0201 27.40520 0.000000
I0201 1.000000 -0.6917621
INPUT0202 0.000000 0.000000
I0202 0.000000 0.000000
INPUT0203 0.000000 0.5186918E-03
I0203 0.000000 0.000000
INPUT0204 0.000000 0.000000
I0204 0.000000 0.000000
INPUT0301 0.1238551E-06 0.000000
INPUT0301M 0.000000 0.000000
INPUT0302 6.851301 0.000000
INPUT0302M 0.000000 0.000000
INPUT0303 0.000000 0.000000
INPUT0303M 0.2164095E-07 0.000000