Embed Size (px)
Citation preview

PROCESS SIMULATION OF AN AMINE-NATURAL GASTREATING PLANT
ADEMOLA S. OLUFEMI
ABSTRACT
1. INTRODUCTION
In the research for a CO removal process from natural gas stream, process simulation tools as Aspen Hysys andProMax are used to evaluate absorption processes. The absorption and water wash columns have been simulatedseparately as well as combined withthe use of the process simulating tools Aspen Hysys and ProMax. The KentEisenberg, Li-Mather, Wilson, NRTL and Electrolytic-NRTL models have been used to simulate the absorber andwater wash sections. The MEA concentration in the decarbonized gas has been limited to 3 ppm throughvariation of column height, exhaust gas temperature, lean amine circulation rate and lean amine concentration.The Wilson model is better for water wash simulation in Aspen Hysys to calculate MEA concentration in thedecarbonized gas. ProMax is a better simulation tool than Aspen Hysys to calculate MEA concentration in thedecarbonized gas with either Kent Eisenberg or Electrolytic-NRTL model. In ProMax, the water wash columncan be implemented using 1or 2 equilibrium stages with Kent Eisenberg or Li-Mather model. The most consistentway to simulate an absorption and water wash column is to use Aspen Hysys with Kent Eisenberg or Li-Mathermodel of the CO absorption part and Wilson or NRTL model of the water wash part.
2
2
Keywords:-CO -removal; Aspen Hysys; ProMax; Process-simulation, MEA2
The possibility of removing acid gas such as hydrogen sulfide (H S) and carbon dioxide (CO )from natural gas or natural gas liquid (NGL) is often necessary in gas plants, petrochemicalcompanies and in oil refineries and has got increased interest due to environmental reasons. Themost common method for H S and/or CO removal is by absorption in an amine based solventfollowed by desorption. The principle of the removal process is shown in Figure 1. The simplestand most used amine for H S and/orCO removal is MEA(monoethanol amine).
2 2
2 2
2 2
39
Figure 1:Principle for CO removal process based on absorption in amine solution (Alie., 2005)
2 etal
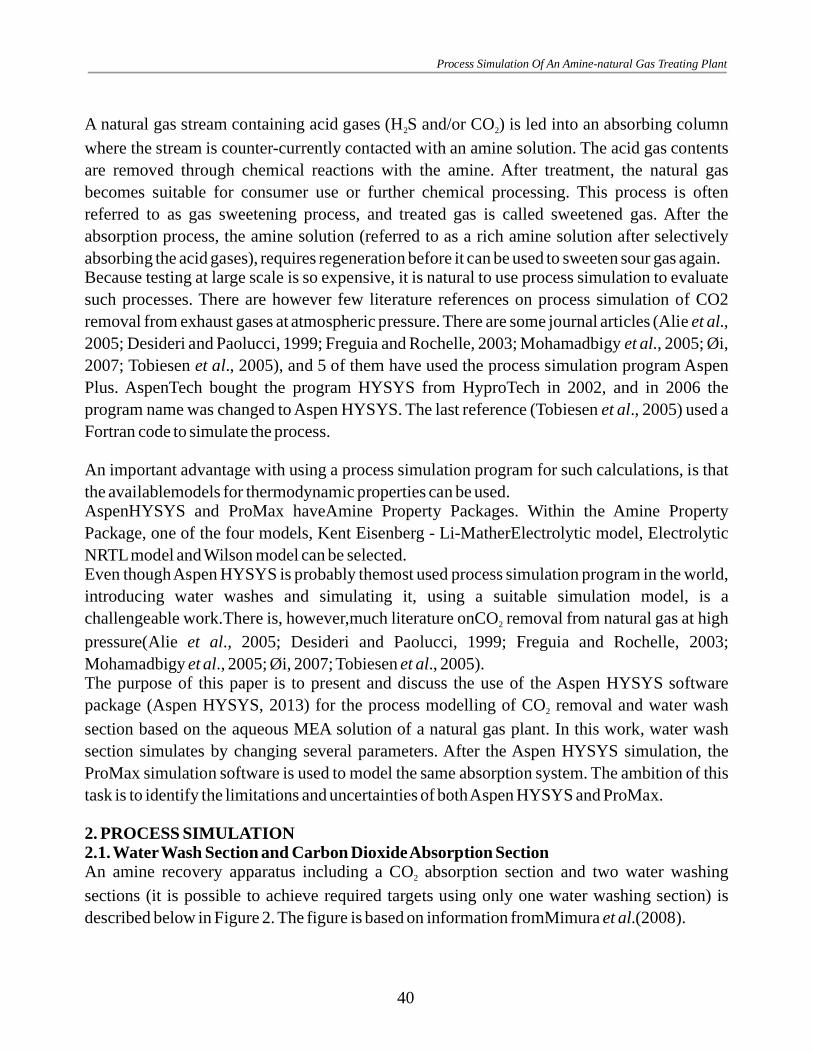
A natural gas stream containing acid gases (H S and/or CO ) is led into an absorbing columnwhere the stream is counter-currently contacted with an amine solution. The acid gas contentsare removed through chemical reactions with the amine. After treatment, the natural gasbecomes suitable for consumer use or further chemical processing. This process is oftenreferred to as gas sweetening process, and treated gas is called sweetened gas. After theabsorption process, the amine solution (referred to as a rich amine solution after selectivelyabsorbing the acid gases), requires regeneration before it can be used to sweeten sour gas again.Because testing at large scale is so expensive, it is natural to use process simulation to evaluatesuch processes. There are however few literature references on process simulation of CO2removal from exhaust gases at atmospheric pressure. There are some journal articles (Alie .,2005; Desideri and Paolucci, 1999; Freguia and Rochelle, 2003; Mohamadbigy ., 2005; Øi,2007; Tobiesen ., 2005), and 5 of them have used the process simulation program AspenPlus. AspenTech bought the program HYSYS from HyproTech in 2002, and in 2006 theprogram name was changed to Aspen HYSYS. The last reference (Tobiesen ., 2005) used aFortran code to simulate the process.
An important advantage with using a process simulation program for such calculations, is thatthe availablemodels for thermodynamic properties can be used.AspenHYSYS and ProMax haveAmine Property Packages. Within the Amine PropertyPackage, one of the four models, Kent Eisenberg - Li-MatherElectrolytic model, ElectrolyticNRTLmodel and Wilson model can be selected.Even thoughAspen HYSYS is probably themost used process simulation program in the world,introducing water washes and simulating it, using a suitable simulation model, is achallengeable work.There is, however,much literature onCO removal from natural gas at highpressure(Alie ., 2005; Desideri and Paolucci, 1999; Freguia and Rochelle, 2003;Mohamadbigy ., 2005; Øi, 2007; Tobiesen ., 2005).The purpose of this paper is to present and discuss the use of the Aspen HYSYS softwarepackage (Aspen HYSYS, 2013) for the process modelling of CO removal and water washsection based on the aqueous MEA solution of a natural gas plant. In this work, water washsection simulates by changing several parameters. After the Aspen HYSYS simulation, theProMax simulation software is used to model the same absorption system. The ambition of thistask is to identify the limitations and uncertainties of bothAspen HYSYS and ProMax.
An amine recovery apparatus including a CO absorption section and two water washingsections (it is possible to achieve required targets using only one water washing section) isdescribed below in Figure 2. The figure is based on information fromMimura .(2008).
2 2
2
2
2
et alet al
et al
et al
et alet al et al
et al
2. PROCESS SIMULATION2.1.WaterWash Section and Carbon DioxideAbsorption Section
40
Process Simulation Of An Amine-natural Gas Treating Plant

Figure 2:Amine Recovery Apparatus including Absorber and Water Washing Section
2.2 Absorption and Reaction MechanismsThe details of the mechanisms of CO absorptioninto an amine solution in an absorption columnarequite complex. There are many references about thechemistry involved in the process, andmany referencesand models comprising mass transfer mechanismsand chemical reactionkinetics. Reviews werewritten by Danckwerts and Sharma, 1966 and Versteeg ., 1996.First, CO has to be transported from the gas to theliquid surface, and then it is absorbed in theliquidsolution. The gas-liquid (CO -Amine) interface area, (in m /m )and liquid holdup, (inm ) are the main parametersin describing such mechanisms.
In the liquid, the CO may react chemically withother components. The following reactions arenormally assumed to take place when CO reacts in a primary amine like MEA in an aqueoussolution.
2
2
2
2
2
et al
a h2 3
3
41
Nigerian Journal Of Oil And Gas Technology

According to equation (2), two moles ofMEA are necessary to absorb one mole of CO .A simpleoverall description of the combined absorptionand reaction process is simply expressed as:
2
The removal of CO is not 100 %. The percentage of CO removal is limited both by lowabsorption and reaction rates and by the equilibrium conditions. If the kinetics in the reactionsshould be calculated, more details about the intermediate reactions in equation (1) and (2) shouldbe included. This is done in the MEA property insert model in Aspen Plus.Figure 3 shows aschematic of the absorber tower that L,X and L,X is inlet and outlet side- streamrelated tray ,respectively.
2 2
0 N j
Figure 3: Schematic of Absorber Tower
2.3 Equilibrium models
The simulation program Aspen HYSYS is mainly based on equilibrium calculations. In thatcase, equation (4) is sufficient to calculate the absorption process.
In Aspen HYSYS, gas/liquid equilibrium for a component(i) is normally calculated using k-values definedby the equation
42
Process Simulation Of An Amine-natural Gas Treating Plant

2.4 Column Models in Simulation ProgramsA CO absorption column is a unit whereCO gas flows up and liquid (e.g. an amine solution)flows down. CO is transferred from the gas phase to the liquid phase where it reacts with theamine solution. The gas and liquid phases are made to get in contact with the help of columnplates or random or structured packing.
The CO stripping column also has plates or packing, and this column also has a reboiler at thebottom to provide heating, and a condenser at the top to provide cooling. The traditional way tomodel such columns is by using equilibrium stages. One plate can be calculated assumingequilibrium between the CO concentration in the gas and liquid leaving the plate. In a packedcolumn, a certain height of packing can be modeled as one equilibrium stage. The equilibriumstage model can be refined by introducing a stage efficiency. Murphree efficiency for stagenumber n is defined by
2 2
2
2
2
43
Nigerian Journal Of Oil And Gas Technology

Figure 4: Definition of Murphree efficiency
2.5. Calculations
The Amines property package in Aspen HYSYS has a special estimation method for predictingthis Murphree efficiency. This is based on the work of Tomcej and Otto, 1986. This model isbased on experience with CO removal from high pressure natural gas.
TheAspen HYSYS software has been used to calculate monoethanolamine concentration in theoutlet decarbonized exhaust gas. These calculations are mainly implemented to analyze thebehavior of the simulation models when those are applying to simulate the water wash section.The monoethanolamine concentration in the outlet decarbonized exhaust gas is calculated byaltering the column operating temperature, lean amine feeding flow rate for different columnheights and lean amine feeding flow rate for different lean amine concentrations.The water wash column, which is having only one stage was separately simulated by varying thecolumn operating temperature. The Wilson model was used as simulating model. Beforetreating fromthe wash water, the exhaust gas consisted of 350 ppm concentration MEA.The Murphree efficiency E is set at 70%. The wash liquid categorized into threedifferentconcentrations such as pure water, 0.5 M MEA and 1 M MEA. The temperatures of thetwo streams werealtered from 30 to 60°C along with column operating temperature. Theexhaust gas molar flow and washliquid mass flow are set at 85000 kmol h and 105 kg hrespectively.
2
M
2.5.1. Aspen HYSYS Implementations
-1 -1
44
Process Simulation Of An Amine-natural Gas Treating Plant

2.5.2. ProMax ImplementationsThe MEA concentrations variation in the decarbonized exhaust gas according to the number ofabsorber stages were calculated under conditions for every number of stages such as exhaust gastemperature 40 °C, lean amine circulation rate as 135000 kmol h and Murphree efficiency E ,25 %. The exhaust gas contains H O, MEA, N and CO are set at 6.71 %, 0 %, 89.56 % and 3.73% respectively. The Kent Eisenberg is used as simulation model. The numbers of stages werealtered from 5 to 15.
Figure 5 shows the process flow simulation result in Aspen HYSYS.
-1M
2 2 2
3. SIMULATION RESULTS AND DISCUSSION
Figure 5: Process Flow Diagram of Amine-Sweetening Unit
A. Effect of MEAon Operating TemperatureAccording to Figure 6, pure water does not contribute to increase in the MEA concentration inthe decarbonized exhaust gas with temperature increase. However, 0.5 M and 1 M MEAsolutions have or showother behavior than pure water. These two streams show that MEAconcentration increases in the decarbonized exhaust gas with temperature rise.
Figure 6: MEA Concentration in Decarbonized Exhaust Gas versus Column OperatingTemperature
45
Nigerian Journal Of Oil And Gas Technology

At 30 °C, three streams gave MEA concentrations 0, 1and 2 ppm respectively; and at 60 °C,
same streams gave MEA concentrations 1, 4 and 8 ppmrespectively. In addition,Nath and
Bender(1983), suggested that the activity coefficient must be laid inbetween 0.1-0.2 range for
these temperatures.The separate water wash column with 2 stages and 6 stages is simulated separately withoutusingamine property package. Wilson model is used as a simulation model. The amine liquid which isfedto column as lean amine was set to 1M concentration. The column operating temperature andE is set at60 C and 70% respectively. The lean amine solution is fed to first stage in the column.The MEAconcentration in the decarbonized exhaust gas is calculated by varying lean aminefeeding flow rates for each height. According to the simulation results for 2 stages, the lowestMEA concentration in the decarbonized exhaust gas was 2.96 ppm. In fact, this concentrationcan be achieved by setting lean amine flow rate which is laid in the range 7 x 10 – 8 x 10 kg h .The lean amine flow rate which is below orhigher than this range cause the MEA concentrationin the decarbonized exhaust gas to increase above 3 ppm.According to the simulation results for6 stages, the lowest MEAconcentration in the decarbonized exhaust gas was 3 ppm at the 6 x 10kg h lean amine feeding flow rate. The lean aminefeeding flow rates below or higher than thisvalue couldnot achieve MEA concentration in the decarbonized exhaust gas below 3 ppm.However, the difference in between two different stagessimulations is that six stages columncan achieve 3 ppm MEA concentration in the decarbonized exhaust gas relevant to low leanamine flow rate than 2 stages simulations.
The water wash column is simulated for three different lean amine concentrations, such as 0.03M,0.1 M and 1 M. Wilson model is used as simulation model. The solver and damping areselected asModified HYSIM Inside-Out and Adaptive respectively. The simulations areconducted to two differentcolumn heights such as 6 and 7 stages. All simulations are carried outat 60°C temperature and 70% stageefficiency. The MEA concentration in the decarbonizedexhaust gas is calculated by varyingthe lean amine feeding flow rate for each of the above threeconcentrations given above. According to the simulation resultsfor 6 stages, the lowest MEAconcentrations in the decarbonized exhaust gas are 3, 0.5 and 0.3 ppm for0.03 M, 0.1 M and 1 Mlean amine concentrations respectively. The most observation here isthat such MEAconcentrations in decarbonized exhaust gas are appearing relevant to approximately6-7 x 10kgh lean amine feeding flow rate. According to the simulation results for 7 stages, thelowestMEA concentrations in the decarbonized exhaust gas are 0.07, 0.24 and 2.75 ppm for 0.03 M,0.1M and 1 M lean amine concentrations respectively. The most significant observation here isthat suchMEA concentrations in decarbonized exhaust gas are appearing relevant toapproximately in between4.7 – 5 x 10 kg h lean amine feeding flow rate. The MEAconcentration in decarbonized exhaust gas is lower for the 7 stages than 6 stages for 0.03 M, 0.1M and 1 M, respectively.
M0
4 4 -1
4
-1
4
-1
4 -1
46
Process Simulation Of An Amine-natural Gas Treating Plant

Figure 7: MEAConcentration in the Decarbonized Exhaust Gas versus Number of Stages
The water wash column is implemented in the top stages of the absorber column.However,simulations did not converge. Hence, the absorber column and water wash columnwere implementedseparately. The number of stages is selected as 10 for the absorber column.The wash water stream flowrate is set at 90000 kg h .
Kent Eisenberg is used as simulation model. The MEAconcentration in theoutlet decarbonizedexhaust gas is calculated according to altering the exhaust gas temperature. Thecalculatedresults are shown in the figure 8.
-1
C. Effect of MEAconcentration on number of stages
Figure 8: MEA Concentration in the Sweet Gas versus Temperature in the Exhaust Gas
47
Nigerian Journal Of Oil And Gas Technology

Table 1. The Kent Eisenberg model
MEA
Concentration
Vapour phase
mole fraction
Total
pressure(Pa)
Partial
pressure(Pa)
Activity
Coefficient ( )
Pure MEA 1 164 164
MEAX= 0.1 2.47 X 10⁻³ 6659 16.4 1.002
MEAX = 0.01 2.25 X 10⁻⁴ 7309 1.64 1.002
Table 2. The Li -Mather model
MEA
Concentration
Vapour phase
mole fraction
Total
pressure(Pa)
Partial
pressure(Pa)
Activity
Coefficient ( )
Pure MEA 1 164 164
MEAX= 0.1 2.78 X 10⁻³ 6682 19 1.132
MEAX = 0.01 Outside - - -
In addition, 10 stages absorber with one-equilibrium stage water wash column was simulatedwithoutlean amine recirculation by using Electrolytic-NRTL model. Simulation conditionswere asprevious calculation. For in this case, the behavior of the MEA concentration in thedecarbonized exhaustgas according to the temperature in the exhaust gas is remained similar tothe Kent Eisenberg results.
The MEA-Water vapour-liquid equilibrium mixture was simulated to compare the KentEisenberg,Li-Mather, Wilson and NRTL models with each other. All the simulations wereconducted at 40 °Ctemperature. Tables 1, 2, 3 and 4 show the calculations for Kent Eisenberg,Li-Mather, Wilsonand NRTLmodels respectively.
D. Models Comparison inAspen HYSYS
48
Process Simulation Of An Amine-natural Gas Treating Plant
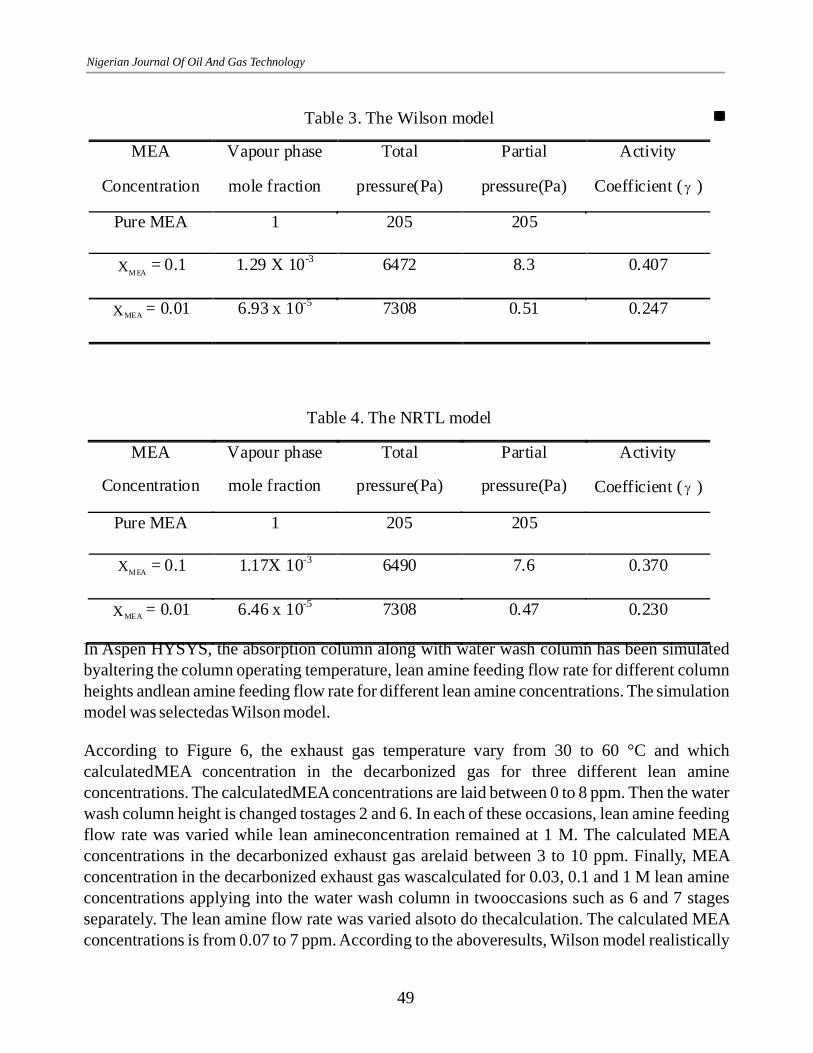
Ta ble 3.T he Wilso n m ode l
MEACo nc entr atio n
Va po urp has em ole frac tio n
To talpr ess ure( Pa)
Pa rtia lpr ess ure( Pa)
A ctiv ityCo eff icie nt( )
Pu re ME A 1 20 5 20 5
ME AX = 0.1 1. 29 X 10-3
64 72 8. 3 0. 407
ME AX = 0.0 1 6. 93 x10 -5 73 08 0. 51 0. 247
Ta ble 4 .T heN RTL m ode l
MEACo nc entr atio n
Va po urp has em ole frac tio n
To talpr ess ure( Pa)
Pa rtia lpr ess ure( Pa)
A ctiv ityCo eff icie nt( )
Pu re ME A 1 20 5 20 5
ME AX = 0.1 1. 17 X 10-3 64 90 7. 6 0.3 70
ME AX = 0.0 1 6. 46 x10 -5 73 08 0. 47 0. 230Table 3. The Wilson model
MEA
Concentration
Vapour phase
mole fraction
Total
pressure(Pa)
Partial
pressure(Pa)
Activity
Coefficient ( )
Pure MEA 1 205 205
MEAX = 0.1 1.29 X 10⁻³ 6472 8.3 0.407
MEAX = 0.01 6.93 x 10⁻⁵ 7308 0.51 0.247
Table 4. The NRTL model
MEA
Concentration
Vapour phase
mole fraction
Total
pressure(Pa)
Partial
pressure(Pa)
Activity
Coefficient ( )
Pure MEA 1 205 205
MEAX = 0.1 1.17X 10⁻³ 6490 7.6 0.370
MEAX = 0.01 6.46 x 10⁻⁵ 7308 0.47 0.230
In Aspen HYSYS, the absorption column along with water wash column has been simulatedbyaltering the column operating temperature, lean amine feeding flow rate for different columnheights andlean amine feeding flow rate for different lean amine concentrations. The simulationmodel was selectedas Wilson model.
According to Figure 6, the exhaust gas temperature vary from 30 to 60 °C and whichcalculatedMEA concentration in the decarbonized gas for three different lean amineconcentrations. The calculatedMEA concentrations are laid between 0 to 8 ppm. Then the waterwash column height is changed tostages 2 and 6. In each of these occasions, lean amine feedingflow rate was varied while lean amineconcentration remained at 1 M. The calculated MEAconcentrations in the decarbonized exhaust gas arelaid between 3 to 10 ppm. Finally, MEAconcentration in the decarbonized exhaust gas wascalculated for 0.03, 0.1 and 1 M lean amineconcentrations applying into the water wash column in twooccasions such as 6 and 7 stagesseparately. The lean amine flow rate was varied alsoto do thecalculation. The calculated MEAconcentrations is from 0.07 to 7 ppm. According to the aboveresults, Wilson model realistically
49
Nigerian Journal Of Oil And Gas Technology
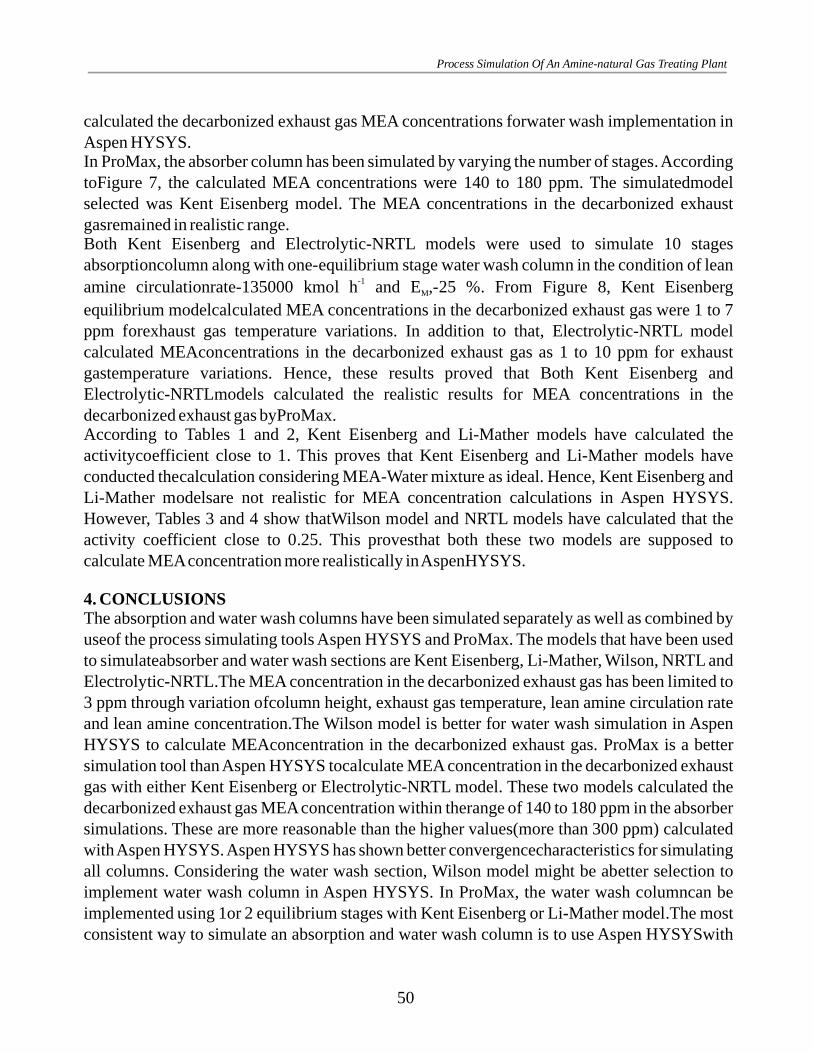
calculated the decarbonized exhaust gas MEA concentrations forwater wash implementation inAspen HYSYS.In ProMax, the absorber column has been simulated by varying the number of stages.AccordingtoFigure 7, the calculated MEA concentrations were 140 to 180 ppm. The simulatedmodelselected was Kent Eisenberg model. The MEA concentrations in the decarbonized exhaustgasremained in realistic range.Both Kent Eisenberg and Electrolytic-NRTL models were used to simulate 10 stagesabsorptioncolumn along with one-equilibrium stage water wash column in the condition of leanamine circulationrate-135000 kmol h and E ,-25 %. From Figure 8, Kent Eisenbergequilibrium modelcalculated MEA concentrations in the decarbonized exhaust gas were 1 to 7ppm forexhaust gas temperature variations. In addition to that, Electrolytic-NRTL modelcalculated MEAconcentrations in the decarbonized exhaust gas as 1 to 10 ppm for exhaustgastemperature variations. Hence, these results proved that Both Kent Eisenberg andElectrolytic-NRTLmodels calculated the realistic results for MEA concentrations in thedecarbonized exhaust gas byProMax.According to Tables 1 and 2, Kent Eisenberg and Li-Mather models have calculated theactivitycoefficient close to 1. This proves that Kent Eisenberg and Li-Mather models haveconducted thecalculation considering MEA-Water mixture as ideal. Hence, Kent Eisenberg andLi-Mather modelsare not realistic for MEA concentration calculations in Aspen HYSYS.However, Tables 3 and 4 show thatWilson model and NRTL models have calculated that theactivity coefficient close to 0.25. This provesthat both these two models are supposed tocalculate MEAconcentration more realistically inAspenHYSYS.
The absorption and water wash columns have been simulated separately as well as combined byuseof the process simulating tools Aspen HYSYS and ProMax. The models that have been usedto simulateabsorber and water wash sections are Kent Eisenberg, Li-Mather, Wilson, NRTL andElectrolytic-NRTL.The MEA concentration in the decarbonized exhaust gas has been limited to3 ppm through variation ofcolumn height, exhaust gas temperature, lean amine circulation rateand lean amine concentration.The Wilson model is better for water wash simulation in AspenHYSYS to calculate MEAconcentration in the decarbonized exhaust gas. ProMax is a bettersimulation tool than Aspen HYSYS tocalculate MEA concentration in the decarbonized exhaustgas with either Kent Eisenberg or Electrolytic-NRTL model. These two models calculated thedecarbonized exhaust gas MEAconcentration within therange of 140 to 180 ppm in the absorbersimulations. These are more reasonable than the higher values(more than 300 ppm) calculatedwithAspen HYSYS.Aspen HYSYS has shown better convergencecharacteristics for simulatingall columns. Considering the water wash section, Wilson model might be abetter selection toimplement water wash column in Aspen HYSYS. In ProMax, the water wash columncan beimplemented using 1or 2 equilibrium stages with Kent Eisenberg or Li-Mather model.The mostconsistent way to simulate an absorption and water wash column is to use Aspen HYSYSwith
-1M
4. CONCLUSIONS
50
Process Simulation Of An Amine-natural Gas Treating Plant

Kent Eisenberg or Li-Mather model for the CO absorption part and Wilson or NRTL model forthewater wash part.
Versteeg, G., Van Dijck, L., & Van Swaaij, W. (1996). On the kinetics between CO2 andalkanolamines both in aqueous and non-aqueous solutions. An overview.
(1), 113-158.
2
REFERENCESAlie, C., Backham, L., Croiset, E., & Douglas, P. L. (2005). Simulation of CO2 capture using MEA
scrubbing: a flowsheet decomposition method.(3), 475-487.
Danckwerts, P. V., & Sharma, M. M. (1966).:
Institution of Chemical Engineers.Desideri, U., & Paolucci, A. (1999). Performance modelling of a carbon dioxide removal system
for power plants. (18), 1899-1915.Freguia, S., & Rochelle, G. T. (2003). Modeling of CO2 capture by aqueous monoethanolamine.
(7), 1676-1686.HYSYS, A. (2007). AspenTech: Calgary.Mimura, T., Nojo, T., Ishida, K., Nakashoji, H., Tanaka, H., & Hirata, T. (2008). Amine recovery
apparatus and decarbonation apparatus having same: Google Patents.Mohamadbigy, K., Bazmi, M., Behradi, R., & Binesh, R. (2005). Amine absorption column design
using mass transfer rate simulation. (2), 39-46.Nath, A., & Bender, E. (1983). Isothermal vapor-liquid equilibriums of binary and ternary
mixtures containing alcohol, alkanolamine, and water with a new static device.(4), 370-375.
Øi, E. L. (2007).. Paper presented at the SIMS2007 Conference, Gøteborg.
Peng, D.-Y., & Robinson, D. B. (1976). A new two-constant equation of state.(1), 59-64.
Tobiesen, F. A., Svendsen, H. F., & Hoff, K. A. (2005). Desorber energy consumption amine basedabsorption plants. (2), 201-215.
Tomcej, R., & Otto, F. (1986).Paper presented at the World Congress III of Chemical Engineering,
Tokyo, September.
Energy Conversion and Management,46
The absorption of carbon dioxide into solutions ofalkalis and amines:(with some notes on hydrogen sulphide and carbonyl sulphide)
Energy Conversion and Management, 40
AIChE Journal, 49
Petroleum & Coal, 47
JournalOf Chemical And Engineering Data, 28
Aspen HYSYS Simulation of CO2 Removal by Amine Absorption from a Gas BasedPower Plant
Industrial &Engineering Chemistry Fundamentals, 15
International Journal of Green Energy, 2Improved Design of Amine Treating Units by Simulation Using
Personal Computers.
ChemicalEngineering Communications, 144
51
Nigerian Journal Of Oil And Gas Technology