Embed Size (px)
Citation preview

��
Process Segmentation Typology in Czech Companies
Tuček David
AbstractThis article describes process segmentation typology during business process management im-plementation in Czech companies. Process typology is important for a manager’s overview of process orientation as well as for a manager’s general understanding of business process man-agement. This article provides insight into a process-oriented organizational structure. The first part analyzes process segmentation typology itself as well as some original results of quantitative research evaluating process segmentation typology in the specific context of Czech company strategies. Widespread data collection was carried out in 2006 and 2013. The analysis of this data showed that managers have more options regarding process segmentation and its selection. In terms of practicality and ease of use, the most frequently used method of process segmentation (managerial, main, and supportive) stems directly from the requirements of ISO 9001. Because of ISO 9001:2015, managers must now apply risk planning in relation to the selection of proc-esses that are subjected to process management activities. It is for this fundamental reason that this article focuses on process segmentation typology.
Keywords: business process management, quantitative research, implementation, process segmentation typolog y, Czech Republic JEL Classification: M11, M15, M100
1. INTRODUCTION – FUNCTIONAL APPROACHTraditional – functional management model is based on a hierarchical decomposition of the organizational structure. It resulted into a division of the enterprise into individual departments, sections and individual functional sites. This means that each department has a largely separated agenda, power and responsibility. The concept of functional management concentrates on the question of labour division in the enterprise and also workers´ specialization as well as their com-petences. In other words, these are task – oriented or skill – oriented groups through which our activities are organized, e.g. production, finance, sales and distribution (Coulson et al., 2010).
Function or even functional management (from now on both terms will be used in this context as synonyms) is typically presented by organizational scheme. This scheme expresses hierarchi-cal links between staff and organizational units. Common complaints of functional management are mostly defined by unclear boundaries of powers and responsibilities among various depart-ments, especially in the situation when the real process runs through multiple departments.
The main problem of traditional management and its functional hierarchies remains in its de-velopment of barriers among individual departments (Robson & Ullah, 1996). This is called functional silos, which means that employees across an organization including managers and their work are fragmented. The same applies to software applications, information, databases, resources or even business goals. (Smith & Fingar, 2007)
▪
Vol. 8, Issue 1, pp. 79 - 94, March 2016 ISSN 1804-171X (Print), ISSN 1804-1728 (On-line), DOI: 10.7441/joc.2016.01.06
Journal of Competitiveness
joc1-2016_v2.indd 79 31.3.2016 20:30:00

Journal of Competitiveness �0
Under these circumstances, the processes are invisible and unmanaged (Hammer and Stanton, 1995).
However, the purpose of this article is to analyse Business Process Management approach The data were collected in 2006 and 2012/2013. Because of the extensive research, not all the results can be presented. That is the reason why this paper focuses only on evaluating of the process segmentation typology in the context of company strategies in Czech enterprises. Eight main goals (MG) of this research were defined in accordance with the research from the year 2006 so that it would be possible to see the comparison in time in different application areas of process management. But the main goal of this article is only one: Evaluate which process segmenta-tion is preferred by the company (i.e. for example segmentation according to ISO 900X, BSC, Porter or others) and to highlight the process areas in which the rated companies hides their imperfections.
Hypothesis of this part of research: H0: „The size of the company according to number of em-ployee (and turnover) is not linked with the fact what kind of process segmentation it is used in company”
The influence of the company’s size according to number of employee (and turnover) can be interpreted by confirmation of the alternative hypothesis H1, i.e.:
„The size of the company according to number of employee (and turnover) is significantly linked with the fact what kind of process segmentation it is used in company”
Based on the chi-square test, it can be stated that variables are in dependent relationship at the significance level of 5%. Therefore, the strength of interdependence can be confirmed by p-value = 0,006.
2. THEORETICAL BACKGROUND – BUSSINES PROCESS MANAGEMENTBusiness process management is a bit different management style in comparison with tradi-tional approach. Řezáč (2009) explains that process approach focuses on the identification of the causes of processes´ bad results both inside and outside of the company with the emphasis on change. The aim of this change is to eliminate processes with no added value or to increase the process efficiency that adds value to the customer. In terms of process approach, it is not primary essential to reduce costs or number of employees, but mainly to increase the value added to the customer.
Many other authors agree with this statement, too (Nesheim, 2011). They claim that process approach is based on the assertion that the cause of poor economic results resides in inefficient ongoing processes in the company.
In some articles authors define (Segatto et al., 2013) process management as “the systematic identification, visualization, measurement, evaluation and continuous improvement of business processes using the methods and principles that are based on process approach”.
joc1-2016_v2.indd 80 31.3.2016 20:30:00

�1
The objective of business process management can be defined (Lewellyn & Armistead, 2000) as the development and optimization running of the organization to ensure effective, efficient and economical reaction to customer requirements. A process-driven company is focused either on the outcome of its activities, or on the added value for the customer who has paid for them. Such company is more flexible and able to respond more quickly to market changes and customer preferences. BPM principles are applicable in the quaternary sector, too (Tučková, 2012).
BPM principles are applicable and can be used in different areas such as:
Typically in production systems, like some energy efficiency models for the mini-load AS/RS, for support of the design process of warehouses (Lehrer, Edl & Rosi, 2013; Lehrer et al., 2010) or logistics processes (Trebuňa, Fiľa & Pekarčíková, 2013), also in the quaternary sector (Tučková, 2012) and services such as health care systems (Tučková, Fialová & Strouhal, 2012) and in man-agement controlling system of companies (Zámečník, 2014).
Regarding the process measurement performance, some authors, such as Rajnoha & Chromja-ková (2009) or Novák & Popesko (2014), recommend implementation of Activity-Based-Costing (ABC) method within the enterprise.
Additionally, the implementation of calculation based on processes and activities causes also non-quantified effects such as: transparency and rationalisation of performed activities and proc-esses, more responsible proceeding of enterprise work, identification of enterprise’s competitive advantages or disadvantages, information support for strategic management and goal oriented management, assignment of overhead costs to performance on case-by-case basis, support of price policy and production-sales programme optimization (Rajnoha & Chromjaková, 2009).
According to Smith and Fingar (2002), every modern management theory such as Six Sigma, Lean, Reengineering or Activity Based Costing has stressed processes and their management. In addition, Davenport (in Jeston & Nelis, 2014) refers to BPM as an amalgam of previous methods. For these reasons, in this paper, BPM refers to the managerial discipline and BPMS to the Business Process Management Systems or Suites, i.e. software applications supporting BPM initiatives. As indicated, BPM is a holistic and systemic management discipline. End-to-end processes can be viewed as systems (Smith & Fingar, 2002). Activities are taken as parts of a process with connections and loops among each other, including applications, roles, documen-tation etc. Altogether they characterize process behaviour. Adding interfaces between processes, an organization can conceptualize its value chain (Harmon, 2014) and thus processes become subsystems of wider systems. In their paper, Segatto, Pádua and Martinelli (2013) identified several characteristics of BPM as a systemic discipline: enterprise is viewed as an open system with inputs, processing and output, it ensures alignment with strategic goals, feedback is valued for improving the processes, it focuses on integrating the activities and their inter-relationships, it goes beyond the functional silos, allowing a full image of the organization and processes to be constructed.
2.1 Definition of the process and process typologyThe definitions of processes are focused on particularly different items. Etjnen G. Rummler and A. Brache (1995) define a business process with the focus on external customers of an organisa-
joc1-2016_v2.indd 81 31.3.2016 20:30:00

Journal of Competitiveness ��
tion: “a business process is a series of steps designed to produce a product or service”. Business process managers use processes as means for achieving organization’s objectives through their management, improvement and governance ( Jeston & Nelis, 2014). The authors agree that a business process is any set of interrelated activities that create results valuable to their custom-ers (Hammer, 2003) or simply the way how things are done (Lehmann, 2012; Jeston & Nelis, 2014).
There are so many ways how we can sort the processes. Most often managers divided processes to ISO 900X (Classified by: Control, Key, Support), process triangel of Edwards and Peppard, Porter s value chain model, „Y“ model of professor Scheer, value chain according to the authors of the Balanced Scorecard and processes classified by: Earl.
In the context of processes, human factor plays the most important role. The human factor is es-sential in the position of a process owner. The integral part of his work is also ensuring the right resources and responsibility matrix for activities and competence development (Nesheim, 2011). The empirical research of Kohlbacher and Gruenwald (2011) confirmed that organizations which appointed process owners and delegated them with process performance measurement reached higher performance than organizations which implemented only one of these compo-nents. Process ownership also reduces organizational complexity that grows with number of workers in a process, their freedom and number of interactions (Siemieniuch & Sinclair, 2002).
According to the research of Rosemann et. al (2013), process owners are the leading force behind the BPM. Almost 75 % of respondents reported that process owners are having an official role in their organization which makes it the most frequently reported role connected with BPM.
2.2 Porter´s value chain model and BSC modelIn these chapters, some types of the process segmentation has been analysed. The research itself seeks the answers to the following questions: “How many groups of processes do companies usually have?” or “How do managers proceed with process segmentation?” and other.
Porter’s value chain model is another process model that is used in the study of the competi-tive advantage in companies. Specifically, it is a model of process structure which depicts value chain and is often used in the study of the competitive advantages of the company as well as in implementation of SWOT analysis. Porter divides business processes into two groups, namely primary and supportive.
Primary – core business processes. These are operational processes which result in produc-tion of outputs required by the customer (input logistics, production, output logistics, sales and services).
Supportive - enabling the existence of primary processes, e.g. top human resources man-agement, marketing, research and development and provided activities. The model demon-strates a lack of manager’s attention to primary processes (production and logistics). This leads to a lower ability to respond to customer’s needs. Another shortage resides in the lack of process innovation that is required by the customer. (Porter, 2008)
Another approach dealing with the process segmentation is a process model – the value chain model from the creators of BSC (Balanced Scorecard). Kaplan & Norton (2001) recommend
1.
2.
joc1-2016_v2.indd 82 31.3.2016 20:30:00

��
managers to define the complete value-chain. This starts with innovation process revealing the current and future customer needs and developing new ways for solving these needs. Further-more, it continues with operating process, i.e. delivery of existing products and services to exist-ing customers. Finally, it ends with after sales service, i.e. supply of services after the sale that adds additional value to purchased products and services.
2.3 Y model of prof. ScheerInterestingly, the segmentation of processes according to Professor A.W. Scheer is not used in practice as a method for process segmentation. However, it is particularly suitable for proc-ess identification in manufacturing companies since it emphasizes the connection of logistics (within production) with selling of the products. It also depicts the continuity of operational and long-term management (Hejduk, 2003; Scheer et al., 2002). Both chains, i.e. trade and logistics, have a character of knowledge processes in its upper part. Though they can be referred to as so called existential processes. Under them, they are so called data processes. The extent of exis-tential triangle opening defines the openness of the company to opportunities. In other words, it defines the ability to capture potential of both the market and its own innovative ability with regard to usage of hidden assets. Simultaneously, completing the triangle with information and knowledge defines future prosperity of the company. (Tuček & Zámečník, 2007)
As stated by Stankevičus and Vasilencas (2014), the evaluation of all models will lead us to the conclusion that process classification, which these models suggest, is not applicable and suitable for small and medium companies. Literally, it separates professional shaped structures from managerial activities, mostly those with competence character. Thus, it does not allow determi-nation of one basic process management component, namely competence management. There-fore, these authors describe the process structure for segment of small and medium companies that would be based on value chain of internal business processes.
3. OBJECTIVES AND RESEARCH METHODOLOGYWe did an extensive research on the utilization level of business process management in 144 Czech manufacturing companies in 2006 and in 2012/2013.
A scaling method based on the principle of quantifying qualitative data was used in the research. The reason for this usage is that managers’ responses involve subjective statements that must be subsequently converted using a verbally, numerically or graphically expressed scale. To be more specific, the Likert scale method was used. Likert scales are used to indicate the degree (level) of agreement or disagreement with the specified statements, from which it is subsequently possible to deduce the attitudes and opinions of respondents (Slack et al. 2004). Respondents expressed their agreement or disagreement with the given statements using a 5-point scale, where 1 ex-presses an absolute disagreement and, conversely, 5 represents an absolute agreement with the relevant statement. These values were subsequently converted to values 0-100% or 0-1, where 0 represents an absolute disagreement of respondents and 1 stands for an absolute agreement. The calculated values of confidence intervals are quantified directly in charts especially for evalua-tion of research from the year 2006.
joc1-2016_v2.indd 83 31.3.2016 20:30:00

Journal of Competitiveness ��
The research specialized in the area of goals, factors, components, support, benefits and barriers of process management. The utilization level of BPM in the Czech companies was determined by self-assessment of managers and according to the actual utilization of BPM components.
The aim of the whole research was to answer research questions in the context of all eight main goals mentioned above. However, in this article, I analyse specifically the evaluation of the proc-ess segmentation typology. This issue is connected with my main goal MG 4: “To evaluate which process segmentation is preferred by the company (i.e. segmentation according to ISO 900X, BSC, Porter or others) and to highlight the process areas in which the rated companies hide their imperfections.”
A part of this article presents a comparison of the results of our previous research done and pub-lished in 2006 , e.g. in articles (Tuček, Tučková & Zamečník, 2009), and the current research. The comparison of these findings allows identifying some interesting trends in business process management in Czech companies for the past 6 years. A sample of 300 randomly chosen compa-nies was used. 144 questionnaires were delivered back which is 48%.
The aim of this research was to explore attitudes, opinions and judgments of managers of Czech companies regarding individual aspects of business process management. Based on the char-acter of quantifying qualitative data, a scaling method was used in this research. The reason for this is that managers’ responses include subjective statements which must be subsequently converted using a verbally, numerically or graphically expressed scale. In fact, the original Lik-ert scale method was used. Likert scales are used to indicate the degree (level) of agreement or disagreement with the specified statements, from which it is subsequently possible to deduce the attitudes and opinions of respondents (Croasmun & Ostrom, 2011).
For the purpose of describing the research results from 2013, I used the descriptive statistics methods such as description and others. A relative representation in the responses was detected and the basic characteristics of location and variability were identified. Median was chosen as an ordinal mean value ( ) and discrete ordinal variance (dorvar) was used as the characteristic of variability. Calculation of both variables was implemented in accordance with VŠE © 2014. Other tool which was used was Excel software. It was used for organization and arrangement of the findings obtained by using a questionnaire survey. It helped to prepare and organize data for a further statistical evaluation. The actual statistical evaluation was carried out using JMP 10 (in 2006) and application R, SPSS Statistics (in 2013).
At ordinal variable, median category (Me) belongs to measures of position. It is the category for which the cumulative frequency (P) is 0,5 or higher whereas for the previous category, the cu-mulative frequency was less than 0,5. This means that PMe-1< 0,5 and PMe ≥ 0,5. Furthermore, the median can be calculated, more specifically, according to the formula:
(1)
For variability rate of the basic set, we may use so-called dorvar ordinal scattering (discrete ordi-nal variance) (VŠE © 2014) determined by the formula:
(1)
joc1-2016_v2.indd 84 31.3.2016 20:30:00
��
(2)
This rate expresses the exact difference in all pairs. While rewriting the interval from 0 to 1, I will get normalized norm. dorvar ordinal scattering for which the following formula is applied: norm. dorvar = 2×dorvar / (K - 1), norm. dorvar Î <0;1>
Null and alternative hypotheses were developed and tested by different non-parametrical means. When investigating dependency of nominal and ordinal data, Pearson’s Chi Square test was used at the selected significance level of α = 0,05 where dependency between the selected ordi-nal variables was proven at the selected significance level of α = 0,05- A null hypothesis about independency was rejected in favour of an alternative hypothesis supporting the assumption of relationship between variables.
4. RESULTS AND DISCUSSION4.1 Evaluation of the process segmentation typologyIn the area of evaluation of the process segmentation, my results show that the highest number of companies, 59,6%, use the separation of process groups into managerial (top), main (key) and supportive ones. This is also clearly supported by ISO 9001 standards. This requirement of segmentation regulation can be further found in practical form in the very first table in this collective monograph. Just a little over one fifth of respondents (21,3%) use Porter s value chain model (primary and supportive processes). Approximately one tenth of respondents (11,35%) use value chain approach based on Balanced Scorecard principles (innovative, operational and after-sales processes). 6,38% of respondents use Earl division, not so often occurring. Even in terms of practicality and ease of use, the most used method of process segmentation (managerial, main and supportive) comes directly from the requirements of ISO 9001.
The positive aspects of clear process segmentation reside mainly in improving their perform-ance. However, in practice, this process classification may cause that some highly appreciated specialists from the past will play the role of those who are not in the spotlight anymore.
Tab. 1 depicts the types of processes that managers stated as being managing, key and support-ive. This evaluation is expressed as relative percentage to all 90 companies. In 2006, managers of these companies stated that they implement this process classification to 84 companies. These 84 companies identified this segmentation in survey in 2013. This evaluation is applied in per-centage regarding all 90 evaluated companies in Table 3. These managers had stated that they use this process classification. In 2013, only 84 managers of companies declared that. Therefore, it is the summary evaluation for all 174 respondents.
It should be noted that each of these companies does not always define all three processes, i.e. managing, key and supportive.
Therefore, in Tab. 1, sorting out of groups of processes is referred to as managing, key and sup-portive, both in 2006 and in 2013. Based on the information that was already known about the
(2)
joc1-2016_v2.indd 85 31.3.2016 20:30:00

Journal of Competitiveness ��
process segmentation (managing, key and supportive), it is obvious that this segmentation is very individual. This means that a universal method of process segmentation does not exist. Moreo-ver, such aim would be irrational due to the way of process division.
Tab. 1 – Classification of groups of processes in companies presented as: managing, key and supportive in 2006 and in 2013. Source: own processing.
Managing processes
Rel
. fre
quen
cy %
Key processes
Rel
. fre
quen
cy %
Supportive processes
Rel
. fre
quen
cy %
Management of the company 29,31
Production (manage-ment and planning of production process and its changes, often divided into several groups of processes
59,19 Human Resource Management 27,01
Strategic man-agement (and planning of resources)
17,81 Purchase, SCM, selec-tion of subcontractors 47,13
Economic manage-ment, finance, control-ling, accounting
24,7
Human Resource Man-agement
7,47
Sales (in the Czech Republic or abroad), customer satisfaction and its evaluation
42,53 Maintenance and repair of equipment 21,26
Audits (inter-nal, others) 6,32
Design and development of the product, (innova-tion), research
14,94 IT support, ICT 17,24
Quality management processes
5,17 Logistics (Distribution) 13,79 Care for environment 13,79
Marketing 4,60
Providing services (e.g.the service of the product, after-sales serv-ices, etc.)
12,64 Health and safety at work 13,22
Operational management (and planning)
4,59Quality management processes, product test-ing
9,77
Documentation man-agement (or contract formation or statistical data processing)
11,49
Receiving of orders and planning of production
3,45Technical preparation of production, technologi-cal processes
8,62 Purchase, SCM, selec-tion of subcontractors 9,77
joc1-2016_v2.indd 86 31.3.2016 20:30:00

��
Investment and documentation management
2,87 Marketing 7,47Technical preparation of production, techno-logical processes
6,90
Finance, con-trolling 2,30
Documentation man-agement (or contract formation or statistical data processing)
5,84 Quality management 6,89
Continuous improvement 2,30 Warehouse management 5,17 Logistics (distribution) 7,47
Environmental management system
2,30
Contractual manage-ment, communication with customer, CRM, processing of orders
5,17
Providing services (e.g.the service of the product, after-sales services, etc.)
7,47
Control and management of discrepancies
1,15 Human Resources Man-agement 5,17 Management of dis-
crepancies 7,47
IT 1,72
Audits (internal, others) 4,6 Metrology 5,74Energetics 4,02 Marketing 5,74Contract and project management 3,45 Trust 4,59
Finance, controlling 3,45
Monitoring (record-ing), measurement, managing and meas-urement devices
3,45
Planning 3,45Design and develop-ment of the product, (innovation),
2,87
Development and analy-sis of processes 2,87 Warehouse
management 2,87
Trade 1,15 Customer s care, customer s satisfaction 2,30
IT 0,57 Audits (internal, oth-ers) 2,30
Sales 1,72
Transportation 0,57 Contract and project management 1,15
Monitoring and measurement of processes
0,57 Processes of competitiveness 1,15
Administrative processes 1,15
Complaints and their resolving 1,15
joc1-2016_v2.indd 87 31.3.2016 20:30:00

Journal of Competitiveness ��
Continuous improvement 0,57
Energetics 0,57Workflow 0,57
Tab. 1 depicts the mainstream practice in the segmentation of groups of processes in Czech companies according to ISO 9001. From the results (140 companies), it is evident that the same group of processes may occur both in managing, key and also supportive processes. For exam-ple, the processes of the human resources management or recruitment in typically manufactur-ing companies are perceived as supportive processes which should detect the functioning of the main process, i.e. production. On the contrary, this same process in a typical HR agency is classified as the main (key) process since it generates revenues to the agency. Similar examples can be found in Tab.3. The results are organized in descending order according to the relative frequency of their existence in those 174 companies. Moreover, the method of process allocation of these three primary groups (managing, key and supportive) has changed very little since 2006 in comparison with 2013. A slight change was made in some positions of the given groups (man-aging, key and supportive). Therefore, the following values of relative frequencies are introduced in relation to these 174 respondents.
4.2 Criteria of the Process Selection for BPM activitiesIn the next question, we evaluated what processes managers focus on with regard to the selection of processes which are subjected to process management activities. The results from 2006 are shown in Fig.1. It is visible that most managers concentrate on processes that have the greatest impact on external customers (at the level of about 0.77).
Fig. 1 - Criteria of the Process Selection for BPM activities (in 2006) Source: Tuček and Zámečník, 2007
00,10,20,30,40,50,60,70,80,9
11,11,2
Mira
sou
hlas
u(v
yzna
mu)
1:14C 2:14D 3:14B 4:14A
Kriteria vyberu procesu
The
degr
ee o
f im
porta
nce
Criteria of the Process Selection
joc1-2016_v2.indd 88 31.3.2016 20:30:01

��
Tab. 2 - Criteria of the Process Selection for BPM activities (in 2006)- Reliability intervals (to estimate reliability 1 – α = 0,95). Source: Tuček and Zámečník 2007.
Criteria of the Process Selection for BPM activities
AverageStandard deviation
Lower int. Upper int.
1:14C – processes that have the greatest impact on external customers
0,765152 0,274136 0,71795 0,81235
2:14D – the highest priority in the context of strategic goals
0,712121 0,277125 0,66440 0,75984
3:14B – processes with the highest impact on internal customers
0,492424 0,274452 0,44517 0,53968
4:14A - dysfunctional processes and the processes with low performance
0,462121 0,314237 0,40801 0,51623
As it is evident from Tab.2 and Tab.3, priority in 2013 is exactly the same as in 2006.
Tab. 3 – Criteria of the Process Selection for BPM activities (in 2013) – descriptive statistics and its graphical representation. Source: own analysis.The variant of the answer
X14.1
dysfunctional processes and the processes with low per-formance
X14.2
processes with the high-est impact on internal customers
X14.3
processes that have the greatest impact on exter-nal customers
X14.4
the highest priority in the context of strategic goals
X14.5
most easily manageable processes
Median value
3,638 3,337 4,554 4,182 3,177
OR 1,426 1,177 0,950 0,805 1,250NOR 0,713 0,588 0,475 0,402 0,625modus 4 3 5 4 3
According to the values in Tab.3, the sequence of priorities did not change regarding medians and variance (dorvar respectively OR). In terms of theory and maximal effects of process en-gineering theory, an orientation on the external customer is desirable. According to priorities, this is on the first place in 2013. Majority of process management activities are subjected to the processes with the greatest impact on external customers = 4,554 and for variance: dorvar = 0,950 a modus = 5: it is possible to state that in terms of respondents´ main focus, it is the most important even though the scattering is relatively high. It is followed by a focus on the processes that have the highest priority in terms of strategic objectives: = 4,182, (modus = 4): variance: dorvar = 0,805.
For non-functional processes and processes with poor performance, there is the biggest disper-sion of responses, the increased value of discrete ordinal variance (dorvar = 1,426) with values:
= 3,638; a modus = 4: it is greater dispersion than in the previous variety. The high average value of responses = 3,638 expresses a more active orientation on these processes.
joc1-2016_v2.indd 89 31.3.2016 20:30:01

Journal of Competitiveness �0
Median and modus values listed in the Tab.3 and density of responses from the graphic rep-resentation, which is a part of the table for the future focus of process management activities, confirm the sequence. Moreover, this result also confirms the fact that in 2013, managers were focused neither on the activities dealing with the greatest impact on internal customers nor on those most easily manageable for the company.
5. CONLUSIONSTo sum up, the method of allocation of processes into three main groups (Control, Key, Support) has changed only very little since 2006 in comparison with 2013. Perhaps only a partial swapping at some positions of the groups (control, key support) occurs. The following values of relative frequencies are therefore entered in relation to those 174 respondents.
The general evaluation of questions No. 12 and No. 13 in the survey from the year 2006 and 2013 showed that the control group processes are mainly in those companies that deal with these classification processes (90 respondents in the year 2006 and 84 respondents in the year 2013) at the level of group of processes an average of two. Tab. 1 also confirms that these are mainly process control (in 30 % of companies), and strategic management (incl. Resource plan-ning for about 18% of respondents).
In the same way, by evaluating the key processes, I have found out that the average number of groups are four groups of processes in the following categories:
manufacturing processes (management and planning of manufacturing process and its changes of ten structured into several groups and processes), which nearly 60% of respondents reported;
purchase, SCM, and selection of subcontractors (about 47%);
sale (in the Czech Republic or abroad), customer satisfaction - reported by 42.5% of managers;
the fourth position replaced Logistics (from 2006) group of processes: design and product development (innovation), research (15% of respondents).
Managers also give an average four for groups of supporting processes. These are mostly human resource management, economic management, finance, controlling, accounting, maintenance, repair and repair of equipment. The fourth position occupied by environmental management from 2006 was replaced: by the group processes: IS / ICT support in 2013
According to our results from the overall evaluation of the 2006 research and the 2013 research, the conclusions obtained from respondents in the year 2006 were confirmed. It is to state that the total number of defined groups of processes in Czech companies is around 9-10 (Tuček & Zámečník, 2007).
This means that the Czech companies fulfil one of the basic principles defined during the golden era of reengineering which says that the number of process groups should be at a minimum level of approximately 12 process groups (Coulson, 1996).
joc1-2016_v2.indd 90 31.3.2016 20:30:01
�1
The same value is stated by Hejduk (2003). Following Coulson, he affirms that the number of defined groups of processes at manufacturing companies varies from eight to ten up to twelve.
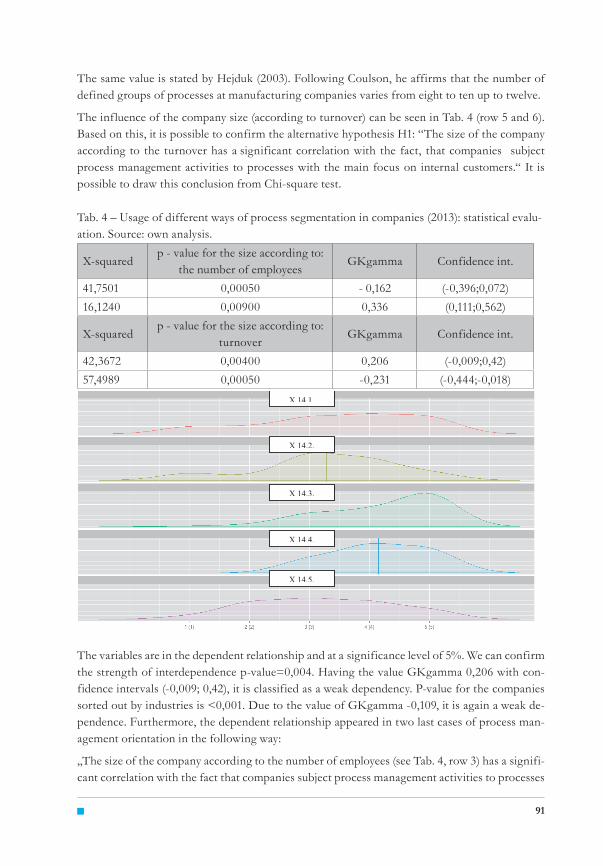
The influence of the company size (according to turnover) can be seen in Tab. 4 (row 5 and 6). Based on this, it is possible to confirm the alternative hypothesis H1: “The size of the company according to the turnover has a significant correlation with the fact, that companies subject process management activities to processes with the main focus on internal customers.“ It is possible to draw this conclusion from Chi-square test.
Tab. 4 – Usage of different ways of process segmentation in companies (2013): statistical evalu-ation. Source: own analysis.
X-squaredp - value for the size according to:
the number of employeesGKgamma Confidence int.
41,7501 0,00050 - 0,162 (-0,396;0,072)16,1240 0,00900 0,336 (0,111;0,562)
X-squaredp - value for the size according to:
turnoverGKgamma Confidence int.
42,3672 0,00400 0,206 (-0,009;0,42)57,4989 0,00050 -0,231 (-0,444;-0,018)
The variables are in the dependent relationship and at a significance level of 5%. We can confirm the strength of interdependence p-value=0,004. Having the value GKgamma 0,206 with con-fidence intervals (-0,009; 0,42), it is classified as a weak dependency. P-value for the companies sorted out by industries is <0,001. Due to the value of GKgamma -0,109, it is again a weak de-pendence. Furthermore, the dependent relationship appeared in two last cases of process man-agement orientation in the following way:
„The size of the company according to the number of employees (see Tab. 4, row 3) has a signifi-cant correlation with the fact that companies subject process management activities to processes
X 14.2.
X 14.3.
X 14.4.
X 14.5.
X 14.1.
joc1-2016_v2.indd 91 31.3.2016 20:30:01

Journal of Competitiveness ��
with the highest priority in terms of strategic objectives.” From Chi-square test, it can be stated that the variables are in a dependent relationship and at the significance level of 5%, the strength of interdependence p-value=0,009 can be confirmed. Having the value GKgamma 0,336 with confidence intervals (0,111; 0,562), it is a weak (medium-strength) dependence.
The influence of the company size can be seen in Tab. 4 (row 2) so that it is possible to confirm the alternative hypothesis H1: “The size of the company and the turnover has a significant as-sociation with the fact how the company considers its main processes within process manage-ment activities, mainly processes most easily manageable in terms of a range of processes or in terms of investment in the system, or in terms of processing information, etc. “. From Chi-square test, it can be stated that the variables are in a dependent relationship and at the significance level of 5%, the strength of interdependence p-value<0,001 can be confirmed. Having the value GKgamma -0,162 with confidence intervals (-0,396; 0,072), it is a weak dependence. P-value for the companies sorted out by industries is <0,001. Due to the value of GKgamma -0,231, it is again a weak dependence (Tab. 4, row 6). The influence of the particular industry was also expressed by p-value <0,001 and by GKgamma -0,285 which is again seen as a very weak de-pendence.
ReferencesCoulson, T. C. (1996). Business Process Re-engineering: myth and reality, Kogan Page, London.
Coulson, T., Olfman, L., Ryan, T., & Shayo, C. (2010). Enterprise Systems Training Strategies: Knowledge Levels and User Understanding. Journal of Organizational and End User Computing (JOEUC), 22(3), 22-39. doi:10.4018/joeuc.2010070102
Croasmun, J. T., & Ostrom, L. (2011).Using Likert-Type Scales in the Social Sciences. Journal of Adult Education, 40(1), 19-22.
Fingar, P., Smith, H. (2002).Business Process Management: The Third Wave, Tampa: Meghan-Kiffer Press.
Hammer, M., & Stanton, S. (1995). The reengineering revolution: A handbook. New York: Harper Business.
Harmon, P. (2014). Business process change: A business process management guide for managers and process professionals (Third ed.). Amsterdam: Elsevier/Morgan Kaufmann.
Hejduk, J. (2003). Smrtelné hříchy procesního řízení. In Business World, 4(5), 8-12.
Jeston, J., & Nelis, J. (2014). Business process management: Practical guidelines to successful implementations (Third ed.). New York: Routledge.
Kaplan, R. S., & Norton, D. P. (2001). The strateg y-focused organization: How balanced scorecard companies thrive in the new business environment. Harvard Business Press.
Kohlbacher, M., & Gruenwald, (2011). Process ownership, process performance measurement and firm performance, In International Journal of Productivity and Performance Management, 60 (7), 709-720.
Lehmann, C. (2012). Strateg y and business process management: Techniques for improving execution, adaptability, and consistency. Boca Raton, FL: CRC Press.
1.
2.
3.
4.
5.
6.
7.
8.
9.
10.
11.
joc1-2016_v2.indd 92 31.3.2016 20:30:01
��
Lehrer, T., Edl, M., & Rosi, B. (2013). Energy efficiency model for the mini-load automated storage and retrieval systems. International Journal of Advanced Manufacturing Technolog y, 70, 97–115, DOI: 10.1007/s00170-013-5253-x.
Lehrer, T., Sraml, M., Potrc, I., & Tollazzi, J. (2010). Travel time models for double-deep automated storage and retrieval systems. International Journal of Production Research, 48(11), 3151-3172. DOI: 10.1080/00207540902796008.
Lewellyn, N., & Armistead, C. (2000). Business process management: Exploring social capital within processes, In: International Journal of Service Industry Management, 11(3), 225-243.
Nesheim, T. (2011). Balancing process ownership and line management in a matrix-like organization. Knowledge and process management: the journal of corporate transformation, 18(2), 109-119.doi: 10.1002/kpm.377
Porter, M. E. (2008). Competitive Advantage: creating and sustaining performance. Amazon Digital Services, Incorporated.
Novák, P., & Popesko, B. (2014). Cost Variability and Cost Behaviour in Manufacturing Enterprises, Economics and Sociolog y, 7 (4), 89-103. DOI: 10.14254/2071-789X.2014/7-4/6
Rajnoha, R., & Chromjaková, F. (2009). Activity based costing and efficiency of its application in the wooden houses production. In: DREWNO-WOOD. Poznaň: Instytut Technologii Drewna, Poland, 52(181), 105 – 127.
Robson, M., & Ullah, P. (1996). A practical guide to business process re-engineering. Aldershot, England: Gower.
Rosemann, M., Lehmann, S., zur Muehlen, M. & Laengle (2013). BPM Governance in Practice – Reserach Study. Accenture.
Rummler, G., & Brache, A. (1995). Improving performance: how to manage the white space on the organization chart. San Francisco: Jossey-Bass.
Řezáč, J. (2009). Moderní management: Manažer pro 21.století, Brno:Computer Press.
Segatto, M., de Pádua, S. I. D., & Martinelli, D. P. (2013). Business process management: a systemic approach? Business Process Management Journal, 19(4), 698-714. doi: 10.1108/BPMJ-Jun-2012-0064
Scheer, A. W., Kruppke, H., Jost, W. & Kindermann, H. (2006). Agility by ARIS Business Process Management. Berlin: Springer-Verlag.
Siemieniuch, C. E., & Sinclair, M. A. (2002). On complexity, process ownership and organisational learning in manufacturing organisations from an ergonomics perspective, In Applied Ergonomics, 33 (5), 449–462.
Slack, N., Chambers, S., & Johntson, R. (2004). Operations management. New Jersey: Prentice Hall.
Smith, H., & Fingar, P. (2007).Business process management: The third wave (4th Anniversary ed). Tampa, Fla.: Meghan-Kffer Press.
Stankevičus, K., & Vasilencas, O. (2014). Research on rules-based business process modelling and simulation. Science: Future of Lithuania, 6(2), 147-150. doi: 10.3846/mla.2014.19
12.
13.
14.
15.
16.
17.
18.
19.
20.
21.
22.
23.
24.
25.
26.
27.
28.
joc1-2016_v2.indd 93 31.3.2016 20:30:01

Journal of Competitiveness ��
Tuček, D., & Zámečník, R. (2007). Řízení a hodnocení výkonnosti podnikových procesů v praxi. Zvolen: Technická univerzita vo Zvolene.
Tuček, D., Tučková, Z., & Zámečník, R. (2009). Business Process Management with Software Support. In Knowledge Management and Innovation in Advancing Economies Analyses & Solutions 2009 (pp.1060-1072). Marrakech (Marocco):International Business Information Management Association (IBIMA).
Trebuňa, P., Fiľo, M., & Pekarčíková, M. (2013). Supply and distribution logistics. 1.ed., Ostrava: Amos.
Tučková, Z. (2012) Importance of Knowledge Services in the Czech Republic and Germany: A Case Study In: Proceedings of the 13th European Conference on Knowledge Management., 2012 (pp. 1202-1210). (Spain): ISSN 2048-8963
Tuckova, Z, Fialova, S., & Strouhal, J. (2012) Health Care Systems: Comparative Analysis from Czech Perspective, International Journal of Mathematical Models and Methods in Applied Sciences, 6(2), 297-304.
Zamecnik, R. (2014). The measurement of employee motivation by using multi-factor statistical analysis In: 2nd World Conference on Business, Economics and Management (BEM). Antalya: Science Park Res, Org & Counseling Ltd; Acad World Educ & Res Ctr; Hacettepe University, Turkey, Vol. 109, 851-857. DOI: 10.1016/j.sbspro.2013.12.553.
Contact informationAssoc. prof. Ing. David Tuček, Ph.D.Tomas Bata University in Zlín, Faculty of Management and EconomicsMostní 5139, 76001 Zlín, Czech RepublicE-mail: [email protected]
29.
30.
31.
32.
33.
34.
joc1-2016_v2.indd 94 31.3.2016 20:30:01