Embed Size (px)
Citation preview
Session 16
Process-Oriented Data Handling
Combining performance, flexibility, code reuse, and collaboration
Igor Morozov

Outline
Examples are provided and also available from
http://seisweb.usask.ca/igeos/pubs/USArray2009
Six rules of the processing game Overview of IGeoS (SIA) system Examples of USArray data handling Homework Appendix: topics not covered today

Rule #1: Make processing reproducible
Design your processing to be easily repeatable in 10 years
Use batch flows Use self-documentation Maintain the software
4
Rule #2: Separate “processing” from “programming”
Not all good geophysicists are good programmers
Good code requires a lot of specialized effort Data organization may become daunting when
hardwired in code Code becomes not portable

5
Rule #3: Use “software system”
Combination of many simple components “User” focuses on data an tool interactions, not code New code can benefit many tasks Little duplication of coding High code reuse and chance for spotting problems
Common parameterization – easy to learn Example: “sia job_name” – the only command I ever use
Software maintained in consistent manner “sia-update build <item>– ” - the only command needed to
compile anything Many library classes readily available Documentation and test examples
http://seisweb.usask.ca/igeos/index

6
Rule #4: Think “process”
“Data access,” “filtering,” “modeling,“ “inversion” are all special cases of “processing” Use maximum (reasonable) data abstraction
“Processing” is just using a combination of tools to achieve a certain result To produce data files, images, publications,
interaction with the user, etc. If we learn to manage complex “processes,” we can
probably solve any problem Note that the success of UNIX is due to a similar
abstraction

7
Rule #5: Make redundant effort
Generalize tasks to help with other tasks in the future For example, when reading a file:
think of reading many files at once think of using UNIX pipeline filters.
Use flexible parameterization (trace headers, databases)
This requires a lot of additional effort initially, but eventually magnifies the ability to handle data

8
Rule #6: Utilize powerful external applications
SQL databases GMT (Generic Mapping Tools) PVM (Parallel Virtual Machine) OpenGL (open graphical modeling library) Qt (probably the most powerful cross-platform
C++ graphics library and IDE)
9
Challenge
Obeying these rules is not so easy It requires years of consistent development It requires a group of developers

10
Quiz
You have learned about the “traditional” (UNIX shell), “database-driven,” and “reflection processing” approaches Which of them can incorporate the other two?

11
Quiz
You have learned about the “traditional” (UNIX shell), “database-driven,” and “reflection processing” approaches Which of them can incorporate the other two?
“Commercial Reflection,” because it allows building custom executables for each processing task But only if we generalize it to “academic” research
problems

12
IGeoS system
http://seisweb.usask.ca/igeos
Used in all applications I have encountered so far GPR, hi-res, reflection 2D/3D/4D, wide-angle, nuclear-
explosion, earthquake, real-time seismic data Field quality control and processing
Largest to date 3D survey with over 600 PASSAL “Texans” deployed daily
Potential-field and non-geophysical applications Over 250 plug-in tools
Now, principally a framework for code development, reuse and maintenance

13
Long-range PNE projects in U.S.S.R.
Note: controlled-source projects are not always small and simple!
22 PNEs
600 chemical explosions

14
Data example (PNE)

15
Learn from seismic industry
Modern datasets: 3D, 4D 3C (three-component) > 30,000 recording channels per shot ~20,000 shots per survey
Culture of digital data analysis Culture of software development

16
IGeoS History
Over 15 years of intensive development Originally a replacement for DISCO (now
Echos) reflection processing package Started as a multicomponent wide-angle seismic
interface for DISCO on VAX Still supports DISCO job scripts Much more general data and processing models
Formerly called “SIA” (this name still mostly used inside)

17
Scope
Basic seismic processing (like Seismic Unix)
Synthetic waveform modeling (1D/2D/3D)
2D ray tracing (including Receiver Functions!)
Migration (2D and 3D RF), Q tomography
Well-log package
Potential-field package
Visualization system (3D, OpenGL)
Real-time data system
Web services
Code-development collaboration system

18
Traditional seismic processing model
The tools are connected by “data files” or “pipes” of some common format
Data are fed in through an “input” and discarded on exit
Examples: SAC, Seismic UNIX, ProMAX, DISCO

19
IGeoS processing model Instead of “pushing” trace data through, try “pulling”
some kind of general “result” from the end
There may not be any seismic traces in the flow!

20
Seismic traces in IGeoS
Arbitrary user-defined headers (as in ProMAX) Headers are very extensively used in tool
parameterization
Variable time starts and sampling Multicomponent (can also represent data grids
for potential-field work or multiple well logs) Automatically arranged in multicomponent
“ensembles” and “gathers” This makes coding multicomponent applications
easy

21
“Datasets” “Dataset” in IGeoS can be anything that can fetch
“seismic” traces Formats are resolved individually
Examples: One or many files (e.g., SAC/*/*.SAC_ASC.gz) File directory trees (as in PASSCAL data) Linear series of files with (optionally) restricted sizes
(e.g., file1.sia, file2.sia,...) Database file indexes Trace buffers stored in memory UNIX pipes, Internet connections Combination of other datasets

22
Tool interactions
All tools reside in common address space (like in ProMAX but not SAC or SU)
Any tool can talk to any other
In most cases, a tool simply passes trace objects to the next tool when they are ready Can pass them backward, discard or create
No notion of input tools (unlike ProMAX, SAC, or SU)
Tools can work without any 'traces' at all
Some tools can provide “functions” to the user Example: tool “refmod” computes IASP91
travel times broadly used in our exercises

23
Portability Originally developed on Vax, Sun (Solaris), SGI (IRIX),
and IBM servers
Now mostly Linux Mandrake, Mandriva, Fedora, Red Hat Enterprise,
SUSE, Ubuntu Laptops, workstations, clusters, field boxes
Darwin (on your iMacs)
With GNU compilers, portability does not seem to be a problem Its own build system Auto-detection and self-testing
Type sia-update –test .modules on your iMac

24
Collaboration We all have to develop new code when working
on new problems IGeoS system has an automatic code updater
from multiple repositories Almost like yum or apt-get Works from source code If someone develops a new tool, it automatically
becomes available to everyone Example: IGeoS distribution on
http://seisweb.usask.ca is a demo data processor and code distributor
Type sia-install - --redo agc on your iMac

25
Code update dialog in the GUI
Selecting code repositories
Selecting components to
update.These can be
modules, libraries, demo examples, etc.

26
Today's exercises
USArray data handling using IGeoS Reformatting and organizing data Using SQL databases Extracting events, corridors, and other data subsets
Gathering, sorting, component rotations Creating maps and record-section plots Using SOD-like capability and web service for “data
mining”
1D synthetic waveform modeling example Using parallel computation
27
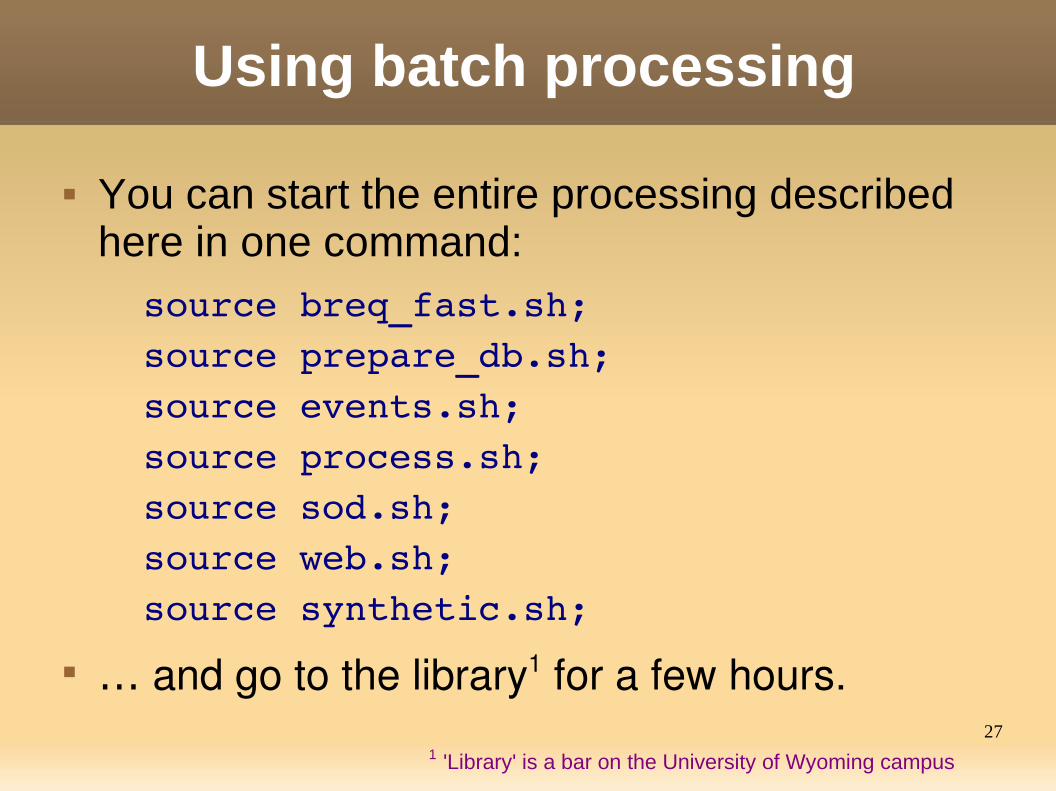
Using batch processing
You can start the entire processing described here in one command:
source breq_fast.sh;source prepare_db.sh;source events.sh;source process.sh;source sod.sh;source web.sh;source synthetic.sh;
… and go to the library1 for a few hours.1 'Library' is a bar on the University of Wyoming campus

28
Example #1: getting data from IRIS
Look into breq_fast.sh: request.job creates breq_fast requests for emailing
to IRIS rdseed.job uses rdseed to break SEED into many
SAC files Use gzipped ASCII SAC - it is more compact
than binary SAC and platform-independent!

29
Example #2: populating your database
Look into prepare_db.sh: make_tables.job creates all database tables read_sac.job reads in gzipped SAC files, collects
metadata from them, writes waveforms and database out
Note that it won't fail with “Arguments too long” with too many SAC files
However, you don't want the output waveform files to get too big – hence save one year at a time
edit_tables.job and connect_waveforms.job perform QC and final tuning of the database

30
Example #3: extracting event windows
Look into events.sh: event-gather.job extracts time gates for a specified
arrival and collects them in a separate file Note the built-in IASP91 travel-time calculator
(tool refmod) to which you can add your custom “arrivals”, like Lg
Note the horizontal component rotation (tool rotate)
event_gathers.job queries the db for all ~400 events and collects gathers for each of them
This takes 4 – 18 hours on our machines

31
Example #4: working with the database
Look into process.sh: show_db.job shows how to make arbitrary db calls
and view results extract-waveforms.job gets all ~60,000 waveforms
in the processing flow, so that you can try doing various things with them
make_corridor.job creates “station corridors” along the specified paths and saves them in db tables
Various list-*.job's show how to list various items by creating empty data traces and using the normal trace-handling machinery

32
Example #5: making maps using GMT
Look into process.sh: An easy general approach is to generate a
synthetic trace for each item you want to plot and make it print headers in a file
This is not the only way; there also is a direct GMT interface (modules image, gmt, graphic)
Several map-*.job's show how to obtain various subsets from the database and plot their coordinates
map-event.job shows how to plot stations that have recorded a selected arrival from any event

33
Example #6: plotting time sections
Look again into process.sh: An easy general approach is to generate a
synthetic trace for each item you want to plot and make it print headers in a file
Several map-*.job's show how to obtain various subsets from the db and plot their coordinates
map-event.job shows how to plot stations that have recorded a selected arrival from any event

34
Data access
Can we solve the problem of data access from a remote data source in principle (so that no other mechanism would need to be developed)?

35
Data access
Can we solve the problem of data access from a remote data source in principle (so that no other mechanism would need to be developed)?
Yes, if we learn to do two things: Deploy our own processing onto the server Retrieve data files/streams from it

36
Data access
Can we solve the problem of data access from a remote data source in principle (so that no other mechanism would need to be developed)?
Yes, if we learn to do two things: Deploy our own processing onto the server Retrieve data files/streams from it
Then: User can entirely control the result. Pre-processing
(e.g., QC, filtering, rotation, RF deconvolution, can be done on the server)
Data center staff involvement is minimized Internet traffic is minimized

37
Example #7: SOD-like data access
Look into sod.sh: sod-list.job generates SQL queries based on user's
specifications of event and station ranges, distances and azimuths
It generates an “anchor trace” for each available time window and lists its attributes
Saves the results in text files It again creates maps of events, stations, and
raypaths – just in case you may need them sod.job also actually retrieves the requested
waveforms and saves them in files
38
Example #8: web service
Problem: I have an exactly the same package plus another
dataset named USArray installed on seisweb.usask.ca
We now want to execute some processing with this dataset and obtain some data from it
We will implement this via a web (HTTP) connection
Think of this as doing processing on a data center's computer
Look into web.sh

39
Example #8: web service (cont)
Look into web.sh: several web-info-*.job obtain general settings of the
server Names, directories available Usage examples for various tools
web-flow-usage.job gives a usage example of one of the installed jobs
web-flow-exec.job executes a remote job with your parameters and retrieves results (files)
web-flow-send.job send your job to the server and executes it there
Think of this as the “SOD” job above

40
Example #9: Modeling
Modeling is another type of “processing” which may require special resources Through the web-service capability, you could use
someone else's super-computer
Look into synthetic.sh: reflect-synthetic.job performs 1D “reflectivity”
modeling of 3-component seismograms in a layered Earth model

41
Conclusions
Process-oriented approach allows solving most earthquake data-handling problems Uniform approach to data access, processing,
modeling, and inversion Fully reproducible, self-documented processing USArray data handling tasks are feasible on
common hardware
A large software system suitable for passive and active-source seismology is available
With web collaboration, sharing data and computer resources is practical
42
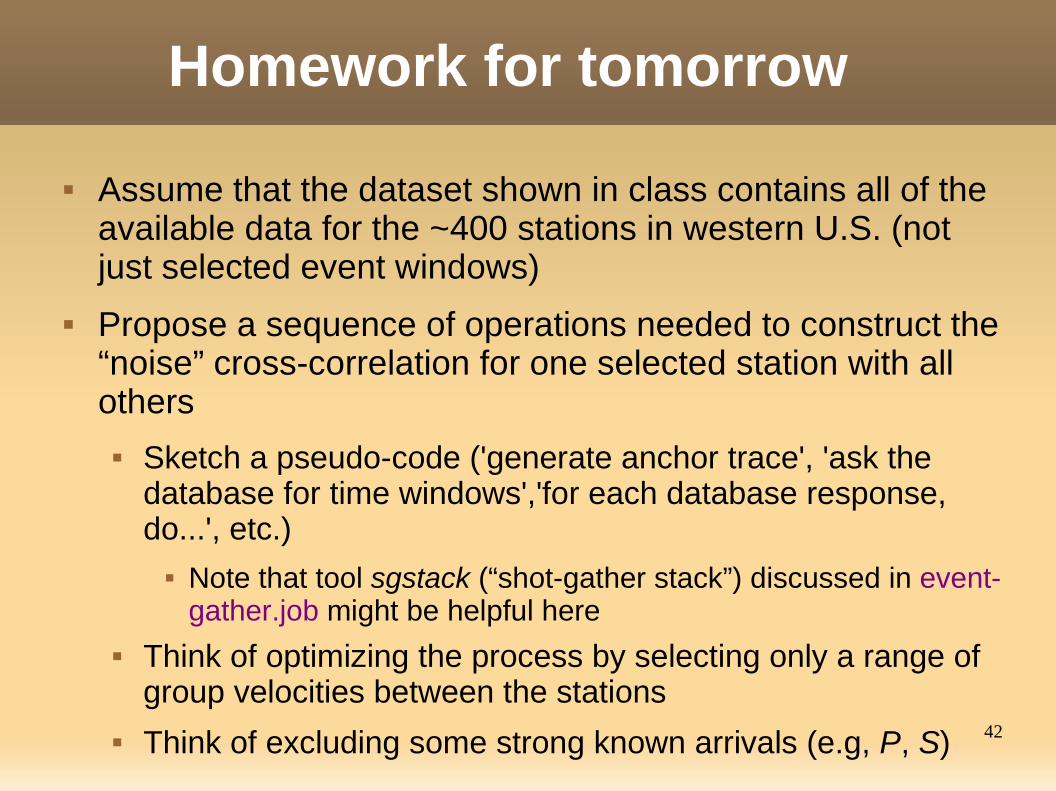
Homework for tomorrow
Assume that the dataset shown in class contains all of the available data for the ~400 stations in western U.S. (not just selected event windows)
Propose a sequence of operations needed to construct the “noise” cross-correlation for one selected station with all others
Sketch a pseudo-code ('generate anchor trace', 'ask the database for time windows','for each database response, do...', etc.)
Note that tool sgstack (“shot-gather stack”) discussed in event-gather.job might be helpful here
Think of optimizing the process by selecting only a range of group velocities between the stations
Think of excluding some strong known arrivals (e.g, P, S)

43
Appendix: topics not covered today

44
Web service
This is how this web service looks in the GUI

45
Graphical User Interface

46
Interactive trace display
47
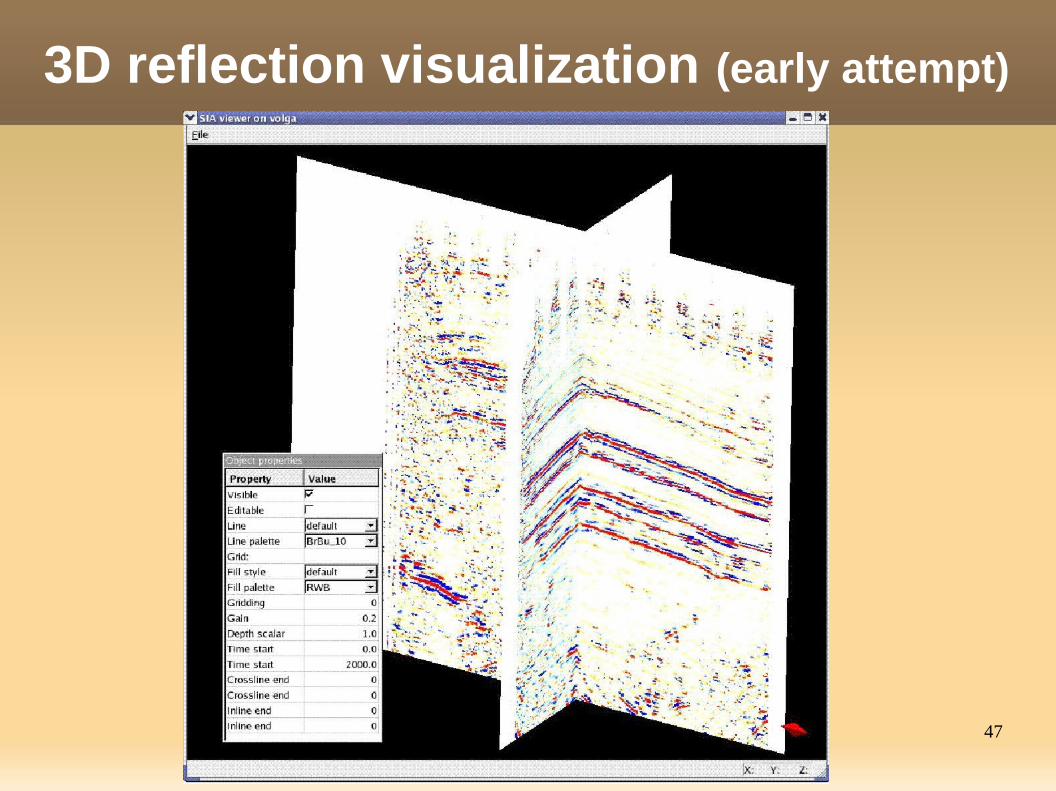
3D reflection visualization (early attempt)

48
2-D Ray tracing and gravity modeling

49
Interactive Receiver Function modeling and inversion (work in progress)

50
Real-time data display (event in Saskatchewan)

51
Real-time display (early attempt)

52
Animated 3D display of 75000 earthquake hypocenters.Georeference data directly from GMT

53
Web processing interface