Embed Size (px)
Citation preview
BIOSCIENCES BIOTECHNOLOGY RESEARCH ASIA, December 2015. Vol. 12(3), 2333-2344
* To whom all correspondence should be addressed.Fax: +98 21 82884931; Tel.: +98 21 82884917;E-mail: [email protected]
Process Optimization and Modeling of AnaerobicDigestion of Cow Manure for Enhanced Biogas Yield in a
Mixed Plug-flow Reactor using Response Surface Methodology
Majid Rasouli1*, Yahya Ajabshirchi2, Seyyed Mohammad Mousavi3,Mohsen Nosrati4 and Soheila Yaghmaei5
1Department of Biosystem Engineering, Faculty of Agricultural Engineering,University of Tabriz, Tabriz, Iran.
2 Department of Biosystem Engineering, Faculty of Agricultural Engineering,University of Tabriz, Tabriz, Iran.
3 Biotechnology Group, Chemical Engineering Department,Tarbiat Modares University, Tehran, Iran.
4 Biotechnology Group, Chemical Engineering Department, Tarbiat Modares University, Tehran, Iran.5 Department of Chemical and Petroleum Engineering, Sharif University of Technology, Tehran, Iran.
DOI: http://dx.doi.org/10.13005/bbra/1909
(Received: 12 May 2015; accepted: 10 July 2015)
Pilot scale experiments were performed on the digestion of dairy cow manure ina semi-continuous process using a mixed plug flow reactor (MPFR) to determine theeffects of organic loading rate (OLR), temperature and mixing levels on production biogasand methane yield. Response surface methodology (RSM) was applied for the design andanalysis of experiments with the optimization of OLR, temperature and mixing levelduring the biogas production process. Experiments were designed as per the centralcomposite design technique. Four cubic mathematical models were derived for predictionof the responses. The optimization study has been carried out to identify the highestyields achievable when the factors temperature and mixing are minimized. In processoptimization, maximum values of biogas production and methane yield were achieved as0.570 m3/m3 day and 0.113 m3/kgVS added, respectively, with an OLR of 3.15 kgVS/m3 day,temperature of 37.66 °C and mixing regime of 20.32 rpm for 10 min per 2 hours.
Keywords: Anaerobic digestion; Bio-gas; Mixed plug flow reactor (MPFR);Response surface methodology (RSM); Optimization.
Environmental contamination is one ofthe most serious problems of the world existenceface in the 21 century. We are also faced with theconsequences of climate change, increased globaldemand on fossil fuels, energy insecurity, andcontinual exploitation of limited natural resources1. The International Panel on Climate Change
(IPCC) and World Energy Council (WEC) haveestimated the consumption of energy in 2100 willbe 3-fold and 4.2-fold higher than in 1990, providinga high demand respectively 2.
Animal waste (such as excreta of dairyand beef cattle) is most mismanagement andunderutilized, leading to many environmentalproblems such as surface and ground waterpollution and greenhouse gas (such as methane)emissions. Thus, an efficient, economical, and eco-friendly approach to animal waste management isessential needed. The most prevalent applied

2334 RASOULI et al., Biosci., Biotech. Res. Asia, Vol. 12(3), 2333-2344 (2015)
animal waste management option is biotechnologyof anaerobic digestion 3.
Biotechnology of anaerobic is a eco-friendly procedure that integrates waste treatmentwith the recuperation of advantageous by productsand renewable bioenergy 1, 4, and suggestion a itsseveral environmental and economic advantage, itwill make better the health of users, decreasingpathogen and organic waste, could be asustainable source of bioenergy, advantages theenvironment and prepared a way to treatment andreuse various wastes-animal, human, agricultural,municipal and industrial 5.
Several previous anaerobic digestionstudies were conducted on Taiwanese-model,which are plug-flow systems and are not heated,or contain any mixed mechanisms 6, 7. There havebeen only few studies on bio-gas production wereconducted on mixed plug flow reactor (MPFR) 8.Plug-flow reactors are limited to applications withlow amounts of dirt, sand, or grit, because thesesubstances will leaning to laminate and settle outinside the reactor, requiring significant endeavorto clean out 9, 10. After five years of operation, aplug-flow reactor in New York was discharge for acompulsive repair. During this process it was foundthat settled solids and crusting had decreased theoperational volume of the reactor by 16% 11. Plug-flow reactors are also subject to crusting, the resultof lighter solids floating to the top of the slurry inthe reactor and drying to form a skin 9. In this study,a mixed plug flow reactor set-up was used to avoidproblems with a thick/rigid floating layer or largeamounts of sediments. Mixing conditions are: 1)No axial mixing (in the flow direction), 2) perfectradial mixing (perpendicular to the flow direction).
According to previous research, theperformance of animal waste-fed anaerobicdigesters is affected by important processparameters such as the temperature 12, 13, organicloading rate (OLR) 14, and mixing regime 15.
In the past literature, The technique ofRSM has been used to optimize, evaluate andanalyze the interactive effects of autonomousagents in numerous biochemical, bioenvironmentalprocesses and chemical , but its use to themodeling of anaerobic digestion processes andanalysis has been presented only few studies 16, 17.In this study, unlike most of the previous anaerobicdigestion research, the RSM was applied to model
the process and analyze with respect to thesynchronous effects of four parameters (methaneyield, methane production, bio-gas yield and bio-gas production) and three operating variables(temperature, organic loading rate (OLR) and mixingregime) were assessed as responses. Thesignificant factors and a continual response surfaceof the main parameters were developed to providean optimal area that fulfils the processspecifications. The concept of RSM is that ofsequential experimentation for building appropriatemodels that enable one to understand theengineering system. The target of RSM toaccomplish a map of response, either in the form ofcontours or as a 3-D rendering 18, 19.
The objectives of this research were toexplore the effect of temperature, organic loadingrate and different mixing regime on anaerobicdigestion of cow dung in mixed plug-flow reactorusing response surface methodology, proposemodels, and try to find the optimum conditions formaximizing bio-gas production rate and methaneyield.
MATERIALS AND METHOD
Substrate Collection and PreparationFresh cow dung used in the present study
was obtained from a dairy farm with 100 cowslocated in Divin (a village in Hamadan Province,Iran). The dung was screened to take away coarsematerials such as straws and other large fibrousmaterials. The screened manure was collected in a100 L tank, diluted with water to obtain the desiredsolid concentration and then mixed thoroughly.Analytical methods
Total solids (TS), total Kjeldahl nitrogen(TKN) volatile solids (VS), pH, , total organiccarbon (TOC), phosphorus and potassium weredistinguished pursuant to standard procedure 20.The pH was measured applying the Metrohm 620pH meter (Metrohm Inc., Germany). Bio-gas flowrate was measured using a diaphragm gas meterG4-AL 25cm (E.G.C Inc., Iran). Methaneconcentrations in bio-gas were distinguished witha Figaro TGS 2611 methane sensor (FIGARO Inc.,USA).Experimental setup
The experiment was performed in a pilot-measure mixed plug flow reactor (MPFR) with total

2335RASOULI et al., Biosci., Biotech. Res. Asia, Vol. 12(3), 2333-2344 (2015)
volume of 1.35 m3 and working volume of 0.9 m3
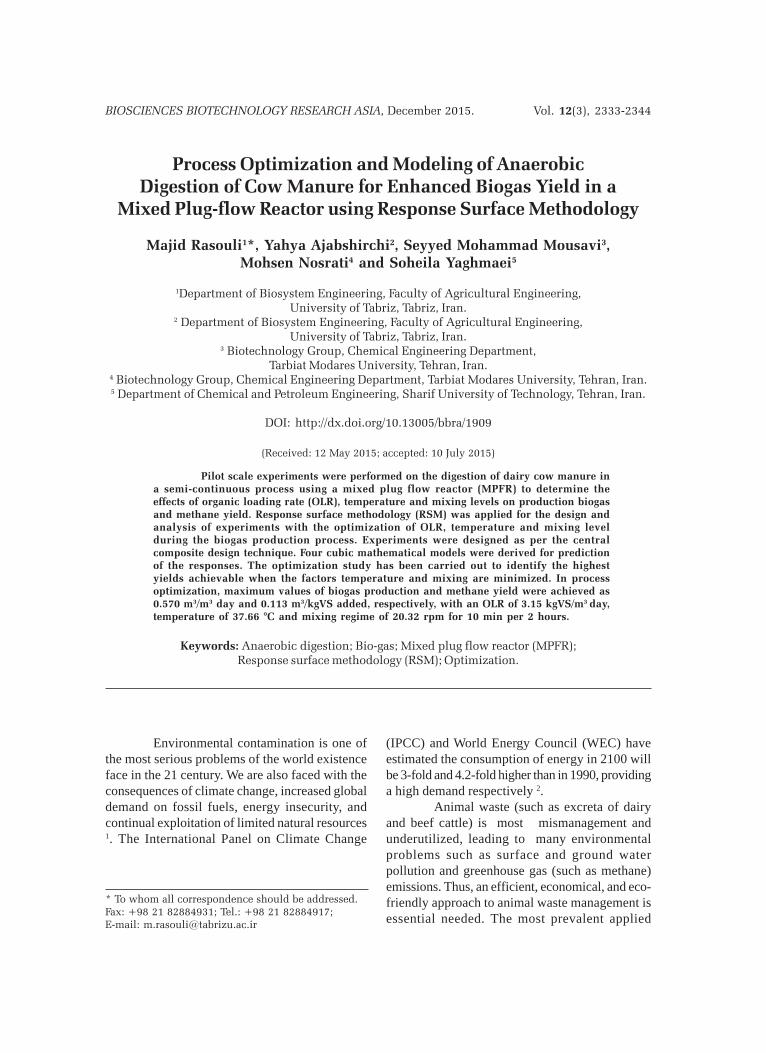
and was operated semi-continually with dailymanure feeding for 15 days hydraulic retentiontime. The MPFR was made with a cylindrical inshape, entirely of stainless steel (INOX 316), 350cm in length, and external and internal diameters of73 and 70 cm, respectively. the ratio of diameter tothe length of digester was about 1:5 that isapperceived generally in the plug-flow systems 9.An electric motor-driven, flat-bladed turbineimpeller was used to mix the contents of the mixedplug flow reactor and enables smoothhomogenization, re-suspension of heavier material,optimal degassing and temperature distribution.The impeller had 32 blades and operated at 20-100rpm range. A thermostatically controlled electricheating strip attached to the outer surface of thereactor was used to maintain the temperature inthe digesters at the desired levels. The glass woolwas used on the surface of the reactor to beinsulated and minimize the heat losses from thesurface. The temperature was monitored with anexcavator conjunct to a sender. The feedstock wasstored in a tank and 60 L/day were fed to the reactorvia an electro submersible slurry pumps. Fig. 1shows picture and schematic of the mixed plugflow pilot-measure anaerobic digestion system.Reactor start-up and operation
For start-up, the reactor was filled up with900 L of feed consisting of 88% and 22% (v/v) ofwater and cow dung respectively (similar run 1),and was operated anaerobically at a batch modefor 16 days. The reactor was subsequentlyswitched to continual mode at the designated HRT(15 days). The reactor was then operated accordingto design of experiment (DOE) for 271 days.Experimental designs
We investigated factors influencing bio-gas and methane production and optimized theconditions for uttermost bio-gas and methaneproduction and methane yield using centralcomposite design (CCD) and response surfacemethodology (RSM).
Response surface methodology consistsof an accumulation of statistical and mathematicaltechniques that are based on the fitting of ansuitable empirical model, generally a first- or asecond- order polynomial model, to observedresponses which depend on a number of
explanatory variables in order to investigate thenature of the response surface in the proximity ofthe optimum operating conditions and evaluatethe relative importance of several affecting factors,even in the attendance of complex interactions 18,
19, 21.Central composite design is the most popularresponse surface method for fitting second-ordermodels 19, 22, which was used in the present studyto design of the experiment (DOE). Full uniformlyroutable central compound designs contain thefollowing experimental runs: (1) a 2k full factorialruns during which factors are studied at +1 and -1levels; (2) a nc center points that all factors are attheir center levels, that aids in specifying thecurvature, and repetition helps to approximatepure error; and (3) a 2k axial or star points, that areexactly to center point, but one factor takes thevalues above and below the median of the twofactorial levels, generally both outside their range(at a distance α from its center). Axial points createthe design rotatable 19, 21. Three independent factorsand their levels were used in the CCD are presentedin Table 1.
Therefore, 18 experiments wereconducted, according to N=k²+2k+cp, where k isthe factor number and cp is the replicate number ofthe central point. Each factor was varied at fivelevels (-, -1, 0, +1, +). -values depend on the numberof variables and can be calculated by. For threevariable, it is 1.68 21. Table 2 presents the codedand actual values of the experimental matrices forthe application of these designs, sorted bystandard order. Model parameters were estimatedusing a cubic equation as follows 23:
εβββ
βββββ
++++
++++=
∑ ∑∑
∑∑∑∑
<< <<<<<
=<<==
k
n
ji
n
kjijiijkjiijj
n
jijiiij
n
iiiii
n
jijiij
n
iiii
n
iii
xxxxxxx
xxxxxY
1 1
2
1
2
1
3
11
2
10
where Y is the expected value of theresponse variable, k is the number of variables, β0,βi, βii, βij, βiii, βiij, βijk, are the model parameters, xi, xj,xk are the coded factors evaluated and ε residualassociated to the experiments.
The software Design-Expert (State- EaseInc., version 7.0.0) was used to analyze the results.

2336 RASOULI et al., Biosci., Biotech. Res. Asia, Vol. 12(3), 2333-2344 (2015)
RESULTS AND DISCUSSION
The characteristics of the substrate usedThe characteristics of the substrate (Cow dung),used for this study are as shown in Table 3.Central composite design and fitted regressionmodels
The CCD for current study utilized a 23=8(i.e., three factors) full factorial design completedby 2×3=6 axial points at (±α, 0, 0, … , 0), (0, 0, ±α,… , 0), … , (0, 0, 0, … , ) and 4 center points at (0, 0,… , 0), where is the distance of the axial point fromthe center. Random error (standard deviation) isestimated from the center points. The choice ofestablishes the central composite design rotatable.The distance of the axial points from the centerpoint is calculated by. For three-factor designvariable, it is 1.68. Therefore, 18 (8 factorial points+ 8 axial points + 6 center points) run were
implementation to satisfy a central compositedesign. The RSM coded and actual design matrix,sorted by standard order, and the correspondingresults of CCD experiments to distinguish theeffects of the three independent variables areshown in Table 2.
The reduced cubic correlationsassociated to the response in terms of coded factorsdistinguished by the software can be written asfollows (Eqs. (2)– (5)):Y1p = 0.51+0.15A+0.050B+0.042AB-0.047A2-0.12B2-0.034C2+0.089A2B-0.077AB2 ...(2)Y2p = 0.20+0.020B-0.018A2-0.044B2-0.011C2+0.038A2B-0.025AB2 ...(3)Y3p = 0.31+0.079A+0.025B+0.020AB-0.036A2-0.072B2-0.022C2+0.050A2B-0.045AB2 ...(4)Y4p = 0.12+9.809E-003B-0.012A2-0.028B2-7.448E-003C2+0.022A2B-0.018AB2 ...(5)
where Y1p, Y2p, Y3p and Y4p are,
Table 1. The factors and their levels in the CCD
Factor Units -1.68 -1 0 +1 +1.68
A: OLR Kg VS/m3day 0.82 1.5 2.5 3.5 4.2B: Temperature °C 8.1 20 37.5 55 66.9C: Mixing rpm 0 20.27 50 79.73 100
Table 2. RSM design of experiments and obtained results
Std A B C Bio-gas Bio-gas Methane Methaneproduction yield production yield rate rate
Coded Coded Coded m3/m3day m3/kgV m3/m3day m3/kgV(Actual) (Actual) (Actual) Sadded Sadded
1 -1(1.5) -1(20) -1(~20) 0.148 0.099 0.093 0.0622 +1(3.5) -1(20) -1(~20) 0.219 0.063 0.124 0.0363 -1(1.5) +1(55) -1(~20) 0.348 0.232 0.205 0.1374 +1(3.5) +1(55) -1(~20) 0.581 0.166 0.312 0.0895 -1(1.5) -1(20) +1(~80) 0.15 0.1 0.094 0.0636 +1(3.5) -1(20) +1(~80) 0.215 0.061 0.121 0.0357 -1(1.5) +1(55) +1(~80) 0.338 0.225 0.201 0.1348 +1(3.5) +1(55) +1(~80) 0.578 0.165 0.312 0.0899 -1.68(~0.8) 0(37.5) 0(50) 0.113 0.138 0.071 0.08710 +1.68(~4.2) 0(37.5) 0(50) 0.627 0.15 0.337 0.08111 0(2.5) -1.68(~8) 0(50) 0.092 0.037 0.059 0.02412 0(2.5) +1.68(~67) 0(50) 0.259 0.104 0.143 0.05713 0(2.5) 0(37.5) -1.68(0) 0.449 0.18 0.269 0.10814 0(2.5) 0(37.5) +1.68(100) 0.365 0.146 0.218 0.08715 0(2.5) 0(37.5) 0(50) 0.525 0.21 0.315 0.12616 0(2.5) 0(37.5) 0(50) 0.503 0.201 0.307 0.12317 0(2.5) 0(37.5) 0(50) 0.503 0.201 0.307 0.12318 0(2.5) 0(37.5) 0(50) 0.523 0.209 0.314 0.126

2337RASOULI et al., Biosci., Biotech. Res. Asia, Vol. 12(3), 2333-2344 (2015)
Table 3. Characteristics of fresh cow dung(before diluted) used in the experiments
Parameter Measurement Value
Total solids (% wet) 18.3(4.7)Volatile solids (% TS) 72.9(1.8)Total Kjeldahl nitrogen (% TS) 1.6(0.3)Total organic carbon (% TS) 26.8(4.7)P-P2O5 (%TS) 0.5(0.1)K-K2O (%TS) 1.2(0.2)pH 7.2(0.4)Density (kg/m3) 1032 (8)
Parameter mean and standard deviation (Values inparentheses) are comprised of 3 data points. Manureswere sampled in June, July, and August, 2014.
Table 4. Statistical results of the ANOVA for response surface models
Statistical result Y1p Y2p Y3p Y4p
Model F-value 123.55 52.15 121.81 52.92Model p-Value < 0.0001 < 0.0001 < 0.0001 < 0.0001Lack of fit F-value 5.04 10.41 13.23 30.57Lack of fit p-Value 0.1063 0.0399 0.0291 0.0086R-Squared 0.9910 0.9660 0.9908 0.9665Adj R-Squared 0.9830 0.9475 0.9827 0.9482Pred R-Squared 0.9129 0.5920 0.9315 0.6522Std. Dev 0.023 0.014 0.013 8.217E-003C.V% 6.43 9.24 6.23 9.32Adeq precision 19.521 18.331 29.877 19.516
respectively, predicted bio-gas production rate,bio-gas yield, methane production rate andmethane yield and; A is organic loading rate; B istemperature; and C is mixing.
The statistical significance of the modelequations (Eqs. (2)– (5)) was evaluated by the F-test for analysis of variance (ANOVA), whichindicated that the regressions were statisticallysignificant. As shown in Table 4, the ‘Prob > F’value for the models were <0.0001 (p-value < 0.05),which indicates that the models were statisticallysignificant with a confidence interval of 99.99%.The model F-values (123.55 for Y1P, 52.15 for Y2P,121.81 for Y3p and 52.92 for Y14) imply that themodels were significant and that there was only a0.01% chance that a ‘Model F-value’ could occurbecause of noise. The actual and the predictedbio-gas and methane production are shown in Fig.2. Actual values are the measured response data
for a particular run, and the predicted values areevaluated using the approximating functionsgenerated for the models (Eqs. (2)– (5)). Theadjacency of the points to the 45æ% line shows thatthe models are appropriate for predicting theresponses. The quality of fit of the model equations(Eqs. (2)– (5)) were expressed by the coefficient ofdetermination (R2). The coefficient of determination(R2) provided the proportion of the total variationin the response variable described by the predictorsincluded in the model. The relatively high R2 valuesindicated that the reduced cubic models for thebio-gas and methane production rate, bio-gas andmethane were very capable of representing thesystem under the given experimental domain.Adequate precision is a measure of the range ofthe predicted response relative to its associatederror or, in other words, a signal-to-noise ratio. Itsdesired value is four or more 24. The adequateprecision value was found to be in the range of18.33-29.88, which indicates good modeldiscrimination (Table 4). However, low responsevalues for the coefficients of variation (CVs)indicated good accuracy and dependability of theexperiments. As a general rule, a model can beconsidered reasonably reproducible if the CV isnot greater than 10%.
The relative contribution of each term ofthe independent variable to each dependentvariable (i.e., the predictor) was directly measuredby the respective coefficient in the fitted models(Eqs. (2)– (5)). The significance of each coefficientwas distinguished by p-values (data not shownfor all models). A model term with a p-value < 0.05is considered to be significant. The coefficientestimates and significance levels (p-values) of

2338 RASOULI et al., Biosci., Biotech. Res. Asia, Vol. 12(3), 2333-2344 (2015)
factors for the reduced cubic model (Y1p) are shownin Table 5. According to the p-values of the modelterms, independent variables A (organic loadingrate) and B (temperature), interaction variable AB,quadratic variables A2, B2 and C2, cubic variablesA2B and AB2 were taken as significant terms andthe insignificant terms were dropped from themodel. The correlation adequacy was tested bythe F-test for lack of fit 19. The lack of fit F-statisticswere not statistically significant because the p-values (0.1063) were greater than 0.05.
According to the p-values of the modelterms (data not shown), independent variables A(organic loading rate) and B (temperature),interaction variable AB, quadratic variables A2, B2
and C2, cubic variables A2B and AB2 are commonsignificant terms in Y1p and Y3p fitted models. Theseterms have high effect in obtaining the optimizedcondition in which bio-gas and methaneproduction rate are as high as possible.Independent B (temperature), quadratic variablesA2, B2 and C2, cubic variables A2B and AB2 are themost significant factors affecting the bio-gas and
methane yield (Y2p and Y4p).Interpretation of Contour plots and 3D responsesurfaces
Using Design Expert software, contourplots and 3D surface plots were generated to findthe optimum operating conditions of the anaerobicdigestion process for cow dung in a mixed plugflow reactor. Contour and surface plots are usefulfor establishing desirable response values. Acontour plot provides a two-dimensional viewwhere all points that have the same response areconnected to produce contour lines of constantresponses. A surface plot provides a three-dimensional view that may provide a clearer pictureof the response surface 25. Fig. 3 and Fig. 4(a) showthe three-dimensional response surfaces of bio-gas production rate and methane yield as well ascontour plots of the relationship between differentparameters at the optimized values. According tothe models, interactions between variables havesignificant effects on the responses; therefore,results were presented and discussed in terms ofinteractions. Organic loading rate (OLR) and
Table 5. ANOVA for Response Surface Reduced Cubic Model (Bio-gas production rate)
Source Statistics
SS Df MS F-value p-Value
Model 0.54 8 0.067 123.55 < 0.0001A 0.13 1 0.13 242.32 < 0.0001B 0.014 1 0.014 25.57 0.0007AB 0.014 1 0.014 26.04 0.0006A2 0.028 1 0.028 51.60 < 0.0001B2 0.17 1 0.17 311.83 < 0.0001C2 0.015 1 0.015 26.95 0.0006A2B 0.027 1 0.027 48.67 < 0.0001AB2 0.019 1 0.019 35.75 0.0002Residual 4.906E-003 9 5.451E-004 - -Lack of Fit 4.463E-003 6 7.439E-004 5.04 0.1063Pure Error 4.430E-004 3 1.477E-004 - -Cor. Total 0.54 17 - -
Table 6. Point prediction of the responses at the optimal conditions
Response Target Prediction SE 95% CI 95% CI SE Pred 95% PI 95% PIMean low high low high
Y1p Maximize 0.570 0.010 0.54 0.59 0.026 0.51 0.62Y2p Maximize 0.193 5.039E-003 0.18 0.20 0.015 0.16 0.22Y3p Maximize 0.332 5.801E-003 0.32 0.34 0.014 0.30 0.36Y4p Maximize 0.113 3.001E-003 0.11 0.12 8.748E-003 0.096 0.13

2339RASOULI et al., Biosci., Biotech. Res. Asia, Vol. 12(3), 2333-2344 (2015)
Fig. 1. Picture and schematic of the mixed plug flow pilot-measure anaerobic digestion system
Fig. 2. Predicted vs. actual plot for: (a) bio-gas production rate and (b) methane yield
Fig. 3. Contour plots (a) and Response surface plot (b) showing the effectof Temperature and OLR on bio-gas production rate at mixing=50 rpm
temperature are shown to have major effects onthe bio-gas production rate and methane yield, asshown in the results.
The perturbation plot in Fig. 5 (a and b)shows that factors OLR, temperature and mixing
affect the bio-gas production and methane yieldresponse in a convex way. It is indicated that bio-gas production rate and methane yield dependsmore on the interaction between OLR andtemperature rather than mixing.

2340 RASOULI et al., Biosci., Biotech. Res. Asia, Vol. 12(3), 2333-2344 (2015)
Fig. 4. Response surface plots (a) the effect of temperature and OLR on methaneyield at mixing=50 rpm, (b) the effect of mixing and OLR on methane yield at 37.5 °C
Fig. 5. Perturbation plot showing the effect of processparameters on bio-gas production rate (a) and methane yield (b)
Effect of temperature on responseFig. 3 and Fig. 4(a) illustrates the effects
of temperature and OLR on bio-gas productionand methane yield. Increasing the temperature from20 °C to 37.5 °C or decreasing it from about 66 °C to55 °C has a consistent positive effect on the bio-gas production rate and methane yield. Thereforein the case of bio-gas production rate and methaneyield, the desirable temperatures are around either37.5 °C or 55 °C. The average volumetric bio-gasproduction rate for reactor operation at 20 °C (3.5kgVS/m3day OLR) was 0.217 m3/m3day with a yieldof 0.036 m3 CH4/kgVS added, whereas for operationat 55 °C the volumetric bio-gas production rateincreased by 62.59% (to 0.580 m3/m3day with ayield of 0.089 m3 CH4/kgVS added). As to beexpected, the volumetric bio-gas production rateand methane yield decreased as the temperaturewas degraded. The methane production rate andbio-gas yield followed the same pattern.
Nevertheless, an increase of the temperature inthe reactor to 67 °C caused an instant drop in thevolumetric bio-gas production and a change in thequality of bio-gas (55% methane). This result is inaccordance with other investigations. Ahring,Ibrahim 12, showed that the consequence of thetemperature shift from 55 to 65 °C is a lower methaneyield (165 ml/gVS day compared to 200 ml/gVS dayat 55 °C).
Clearly, the anaerobic digestion is aprocess that is strongly dependent on temperature.On the other hand, the methane content in the bio-gas increased at low temperature. The methanecontent in the bio-gas increased from 59.3% to63% between 55 and 20 °C (at 1.5 kgVS/m3dayOLR), which partly counteracted the decrease involumetric bio-gas production rate. Similar resultswere obtained by Alvarez and Lidén 26, Hansen,Angelidaki 27 and Zeeman, Wiegant 28, where themethane production rate in psychrophilic digesters

2341RASOULI et al., Biosci., Biotech. Res. Asia, Vol. 12(3), 2333-2344 (2015)
is reduced compared to mesophilic and thermophilicreactors treating cow dung.Effect of OLR on response
The effect of varying the organic loadingrates on the bio-gas productivity in anaerobicdigestion was studied. According to the result,digesters’ performance in terms of daily bio-gasproduction would improve by increasing the OLRabove 1.5 kgVS/m3day (Fig.4). However, thedigesters with higher OLR values were moresensitive. Fluctuating behavior caused difficultiesin stabilizing the experiments with high VS add-upin the feed (in experiments 4, 8, 6, 2, 10). Similarbehavior has been reported previously 29-31.
On the other hand, bio-gas and methaneyields decrease with increased in organic loadingrate from 1.5 to 4.2 kgVS/m3day (see also Fig. 4(a)).The uttermost bio-gas and methane yield of 0.232and 0.137 m3/kgVS added was obtained at 1.5 kgVS/m3day OLR. These results are in accord with 31 anapparent decrease in the methane content wasobserved after the OLR increase. The lowestrecorded value was 53.7% at 4.2 kgVS/m3day OLR.The observed results suggest that the uttermostOLR value occurs between 1.5 and 2.5 kgVS/m3dayfor a system digesting dairy cow dung attemperatures between 20 and 37 °C and between2.5 and 3.5 kgVS/m3day for a system digesting
dairy cow dung at temperatures between 37 °Cand 55 °C.Effect of mixing levels on response
The effect of intermittent mixing (20, 50,80 rpm for 10 min per 2hr), continual mixing (100rpm) and non-mixing on bio-gas production wasinvestigated. Results from the present studyshowed that impeller mixing strategies andintensities affect process performance and bio-gasproduction during anaerobic digestion of dairy cowdung. Pilot-measure studies in MPFR showed thatintermittent mixing improved bio-gas productioncompared to continual mixing or non-mixing (Fig.4(b)). These results are in accord with Kaparaju,Buendia 15 and Stroot, McMahon 32. The improvedbio-gas production under intermittent mixingcompared to continuous mixing in the pilot-measure plant can be attributed to better solidsand biomass retention in the reactor 15. Oncomparison to continual mixing, intermittent andnon- mixing strategies improved bio-gasproductions by 28.99% and 18.71%, respectively.On the other hand, the data obtained showed thatat intermittent mixing, the degree of mixing (20, 50,80 rpm) did not affect the bio-gas production andoperation of the reactor. For the three conditionsstudied, reactor operation was almost identical withsimilar bio-gas production.
Desirability=0.803
Fig. 6. Ramps of the numerical optimization

2342 RASOULI et al., Biosci., Biotech. Res. Asia, Vol. 12(3), 2333-2344 (2015)
The highest methane yield obtained inthe present study for dairy cow dung is 0.137m3CH4/kgVS added. Previous anaerobic digestionstudies on cow dung report methane yields of 0.1m3CH4/kgVS added 31, 0.148 m3CH4/kgVS added 33
and 0.16 m3CH4/kgVS added 34 . The reason ofdifferent is likely caused by the differences inmanure composition and bioreactor operatingconditions which affects the degradation process.Process optimization
In order to anticipation the best factorlevels that will maximize the bio-gas and methaneproduction and yield; the optimizing functioninclude the maximization of Y1p, Y2p, Y3p and Y4p, butit is restricted from an economical point of view(minimum temperature and mixing). A numericaloptimization provided by Design-Expert wasemployed to the RSM dataset, followed by a rampsof the numerical optimization. The numerical studywill offer the ideal factor levels to attainment theuppermost the methane and bio-gas production andyield, while the ramps of solutions tool investigationwill result in a ramp that associates the factor levelsto an area of main target defined by the user. In thenumerical optimization, levels of significance wereassigned to each factor and response criteria.Factors temperature and mixing were minimized withimportance 4, while the four responses weremaximized with importance 5. Factor OLR was left inthe same range as the experiment of RSM.
Table 6 shows the optimum anaerobicdigestion operation conditions for objectiveaccording to numerical optimization by Design-Expert. As to be expected, the volumetric bio-gasproduction rate and methane yield decreased asthe temperature was degraded. Even so, athermophilic range of temperature causesenhancement operating costs due to upper energyconsumption of the heating units. On the otherhand, energy requirement for impeller mixing causesincreased operating costs. Therefore anoptimization study has been carried out to identifythe highest yields achievable when the factorstemperature and mixing are minimized.
In Fig. 6, the ramps view shows thedesirability for each factor (OLR, temperature andmixing) and each response (Y1p, Y2p, Y3p and Y4p), aswell as the combined desirability. A highlighted(red and blue) point shows both the precise valueof the factor or response (horizontal movement of
the point) and how well that target was satisfied(how high up the ramp). The advisability of theoptimization of process was found to be 0.803, andthe value is thoroughly dependent on howproximity the lower and upper limits are set relativeto the real optimum. It should be noted that theoptimization target is to trade a good set ofconditions that will meet all of the goals, not justget to an advisability value of 1.0. Advisability is amathematical method to trade the optimum.Point prediction
The final step in any experiment is topredict the response at the optimal settings (Table6), which allows entering levels for each factor orcomponent into the current model. The softwarethen calculates the expected responses andattendant confidence intervals based on theanticipation equation shown in the ANOVA output.The 95% confidence interval (C.I.) is the range inwhich the process average was expected to fall95% of the time, while the 95% prediction interval(P.I.) is the range in which it was expected that anyindividual value to fall 95% of the time. As shown(Table 6), the P.I. is larger (a wider spread) than theC.I. since more scatter in individual values isexpected than in averages. In this table, SE meanmention to the standard deviation attendant withthe anticipation of an average value at the selectedcomponent levels, while the standard deviationassociated with SE pred. demonstrate theanticipation of an individual observation at theselected factor or component levels 35.
CONCLUSION
The optimization study has beenimplementation to identify the uppermost yieldsachievable when the factors temperature and mixingare minimized. In this process optimization,uttermost values of bio-gas production andmethane yield were proceeds as 0.570 m3/m3dayand 0.113 m3/kgVS added, respectively, with anOLR of 3.15 kgVS/m3day, temperature of 37.66 °Cand mixing regime of 20.32 rpm.
The influence of temperature and OLR onbio-gas production and methane yield was moresignificant than the influence of mixing level.
The best models for bio-gas productionrate and methane yield were the reduced cubicmodel.

2343RASOULI et al., Biosci., Biotech. Res. Asia, Vol. 12(3), 2333-2344 (2015)
RecommendationBiomass retention capacity is an
important consideration when using a mixed plugflow reactor because anaerobes grow slowly duringmetabolic generation of methane. It is frequentlyessential to select a bioreactor configuration thatdecouples the hydraulic retention time (HRT) fromthe solids retention time (SRT). Control mixingregime is an approach for decoupling SRT fromHRT. Such decoupling can maintain a significantlyhigh SRT/HRT ratio and prevents washout of slow-growing anaerobes. Further work is required toevaluation the effect of mixing regime on decouplingHRT from SRT in order to optimize gas productionand methane yield whilst minimizing overall energyinput.
ACKNOWLEDGEMENTS
Iran Small Industries and Industrial ParkOrganization (ISIPO) is gratefully acknowledgedfor partial funding of this project (contracteconomic No. 4111-7993-1741).
REFERENCES
1. Khanal, S.K. Anaerobic biotechnology forbioenergy production: Principles andApplications. A John Wiley & Sons, Ltd.Publication, USA, 2008.
2. Dueblein, D.,Steinhauser, A., Biogas from wasteand renewable resources. KGaA: Wiley-VCHVerlag GmbH and Co, 2008.
3. Karim, K., et al., Mesophilic digestion kineticsof manure slurry. Appl Biochem Biotechnol,2007; 142(3): 231-42.
4. Neves, L., Oliveira, R.,Alves, M.M., Co-digestion of cow manure, food waste andintermittent input of fat. Bioresour Technol,2009; 100(6): 1957-62.
5. Bond, T.,Templeton, M.R., History and futureof domestic biogas plants in the developingworld. Energy Sustain Dev, 2011; 15(4): 347-354.
6. Masse, D.I., et al., Low-temperature anaerobicdigestion of swine manure in a plug-flow reactor.Environ Technol, 2013; 34(17-20): 2617-24.
7. Ferrer, I., et al., Biogas production in low-costhousehold digesters at the Peruvian Andes.Biomass Bioenerg, 2011; 35(5): 1668-1674.
8. Cournoyer, M., Chagnon, R.,Eng, P., A mixedplug flow anaerobic digester for dairy manure.ASAE, paper No.84-4562., 1984(84-4562).
9. Lusk, P.,Wiselogel, A. Methane recovery fromanimal manures: the current opportunitiescasebook. Vol. 3. National Renewable EnergyLaboratory Golden, CO, 1998.
10. Kaparaju, P.,Angelidaki, I., Effect of temperatureand active biogas process on passive separationof digested manure. Bioresour Technol, 2008;99(5): 1345-1352.
11. Inglis, S.F., Gooch, C.A.,Aneshansley, D.Cleanout of a Plug-Flow Anaerobic Digesterafter Five Years of Continuous Operation. inProceedings of the International Symposium onAir Quality and Waste Management forAgriculture. Presented at the InternationalSymposium on Air Quality and WasteManagement for Agriculture, ASABE,Broomfield, CO. 2007.
12. Ahring, B.K., Ibrahim, A.A.,Mladenovska, Z.,Effect of temperature increase from 55 to 65degrees C on performance and microbialpopulation dynamics of an anaerobic reactortreating cattle manure. Water Res, 2001; 35(10):2446-52.
13. Divya, D., Gopinath, L.R.,Merlin Christy, P., Areview on current aspects and diverse prospectsfor enhancing biogas production in sustainablemeans. Renew Sustain Energy Rev, 2015; 42(0):690-699.
14. Mähnert, P.,Linke, B., Kinetic study of biogasproduction from energy crops and animal wasteslurry: Effect of organic loading rate and reactorsize. Environmental Technology, 2008; 30(1):93-99.
15. Kaparaju, P., et al., Effects of mixing on methaneproduction during thermophilic anaerobicdigestion of manure: Lab-scale and pilot-scalestudies. Bioresour Technol, 2008; 99(11): 4919-4928.
16. Amani, T., Nosrati, M.,Mousavi, S.M., Usingenriched cultures for elevation of anaerobicsyntrophic interactions between acetogens andmethanogens in a high-load continuous digester.Bioresour Technol, 2011; 102(4): 3716-23.
17. Tedesco, S., Marrero Barroso, T.,Olabi, A.G.,Optimization of mechanical pre-treatment ofLaminariaceae spp. biomass-derived biogas.Renew Energ, 2014; 62(0): 527-534.
18. Khuri, A.I. Response surface methodology andrelated topics. World scientific publishing Co.Pte. Ltd., 2006.
19. Montgomery, D.C. Design and analysis ofexperiments. New York: John Wiley & Sons,2008.
20. APHA, AWWA,WPCF Standard methods forthe examination of water and wastewater.Washington DC: American Public Health

2344 RASOULI et al., Biosci., Biotech. Res. Asia, Vol. 12(3), 2333-2344 (2015)
Association., 1998.21. Bezerra, M.A., et al., Response surface
methodology (RSM) as a tool for optimizationin analytical chemistry. Talanta, 2008; 76(5):965-77.
22. Myers, R.H., Montgomery, D.C.,Anderson-Cook, C.M. Response surface methodology:process and product optimization using designedexperiments. Vol. 705. John Wiley & Sons,2009.
23. Bazrafshan, Z., Ataeefard, M.,Nourmohammadian, F., Modeling the effect ofpigments and processing parameters inpolymeric composite for printing inkapplication using the response surfacemethodology. Progress in Organic Coatings,2015; 82: 68-73.
24. Mason, R.L., Gunst, R.F.,Hess, J.L. Statisticaldesign and analysis of experiments: withapplications to engineering and science, seconded. New York: John Wiley & Sons, 2003.
25. Rao, P.V.,Baral, S.S., Experimental design ofmixture for the anaerobic co-digestion of sewagesludge. Chemical Engineering Journal, 2011;172(2-3): 977-986.
26. Alvarez, R.,Lidén, G., The effect of temperaturevariation on biomethanation at high altitude.Bioresource Technology, 2008; 99(15): 7278-7284.
27. Hansen, K.H., Angelidaki, I.,Ahring, B.K.,Anaerobic digestion of swine manure: Inhibitionby ammonia. Water Res, 1998; 32(1): 5-12.
28. Zeeman, G., et al., The influence of the total-ammonia concentration on the thermophilic
digestion of cow manure. Agr Wastes, 1985;14(1): 19-35.
29. Hill, D.,Bolte, J., Methane production from lowsolid concentration liquid swine waste usingconventional anaerobic fermentation.Bioresource Technology, 2000; 74(3): 241-247.
30. Salminen, E.A.,Rintala, J.A., Semi-continuousanaerobic digestion of solid poultryslaughterhouse waste: effect of hydraulicretention time and loading. Water research, 2002;36(13): 3175-3182.
31. Alvarez, R.,Lidén, G., Low temperatureanaerobic digestion of mixtures of llama, cowand sheep manure for improved methaneproduction. Biomass Bioenerg, 2009; 33(3):527-533.
32. Stroot, P.G., et al., Anaerobic codigestion ofmunicipal solid waste and biosolids undervarious mixing conditions—I. digesterperformance. Water Research, 2001; 35(7): 1804-1816.
33. Møller, H.B., Sommer, S.G.,Ahring, B.K.,Methane productivity of manure, straw and solidfractions of manure. Biomass Bioenerg, 2004;26(5): 485-495.
34. Kalia, A.K.,Singh, S.P., Horse dung as a partialsubstitute for cattle dung for operating family-size biogas plants in a hilly region. BioresourceTechnology, 1998; 64(1): 63-66.
35. Mafi Gholami, R., Mousavi, S.M.,Borghei, S.M.,Process optimization and modeling of heavymetals extraction from a molybdenum rich spentcatalyst by Aspergillus niger using responsesurface methodology. J Ind Eng Chem, 2012;18(1): 218-224.