Embed Size (px)
Citation preview

PROCESS INTEGRATION OF
A GAS TO LIQUID PLANT AND A POWER PLANT
A Thesis
by
DONGHAK KIM
Submitted to the Office of Graduate and Professional Studies of
Texas A&M University
in partial fulfillment of the requirements for the degree of
MASTERS OF SCIENCE
Chair of Committee, Mahmoud El-Halwagi
Committee Members, M. Sam Mannan
Waruna Kulatilaka
Interdisciplinary Program Chair, Efstratios N. Pistikopoulos
August 2018
Major Subject: Energy
Copyright 2018 Donghak Kim

ii
ABSTRACT
The gas-to-liquid (GTL) industry is vulnerable to the variation of the oil and gas market
price. This shortcoming has forced future GTL projects to be suspended and even cancelled. As
one of the measures to overcome the challenge the GTL industry faces, process integration of a
GTL plant and a power plant via a F-T tail gas supply line is proposed.
The process integration allows an integrated plant to adjust F-T tail gas distribution that
affects the production rates of two products, oil and electricity. The first result shows that recycling
F-T tail gas to the GTL plant is superior to supplying tail gas to the power plant in the perspectives
of power generation and utility consumption. However, recycling all F-T tail gas to the GTL plant
is not feasible due to the constraints that both plants require. One constraint is the requirement to
reduce nitrogen compound build up in F-T tail gas, whereas the other constraint is the limitation
of modified wobbe index range from gas turbine fuel specification. Since the latter constraint
covers the former constraint, the modified wobbe index limitation governs the allowable range of
F-T tail gas fraction.
Despite the constraints, the integrated plant still has the flexibility on the adjustment of tail
gas distribution. Within the feasible region, the integrated plant can be designed and operated by
balancing multiple parameters including power generation, utility consumption and nitrogen
compound buildup that have a trade-off relationship.

iii
ACKNOWLEDGEMENTS
I would like to thank people for full supports on preparing my thesis. Above all, I really
appreciate the guidance of Mahmoud El-Halwagi, my advisor, of the Department of Chemical
Engineering. Without his guidance, I would not start and finalize my study. I will never forget his
willingness to help my research.
I want to extend my gratitude to my Advisory Committee, Dr. Mannan and Dr. Kulatilaka,
for their advice. I further have to thank Dr. Hilaly, the substitute of Dr.Mannan for my defense,
Jinyoung Choi and Changwoo Lee for their support.
I would like to sincerely appreciate for the director of Energy Institute, Professor Efstratios
Pistikopoulos, the academic program coordinator, Dr. Valentini Pappa, and the administrative
staffs of the Energy Institute for their assistance and support during energy master’s program.
Thanks also go to my friends and colleagues and the department faculty and staff for
making my time at Texas A&M University a great experience. Finally, thanks to my mother and
father for their encouragement.

iv
CONTRIBUTORS AND FUNDING SOURCES
Contributors
This study was conducted under the guidance of my research advisor, Professor Mahmoud
El-Halwagi, advisory committee members, Professor Sam Mannan of the Artie McFerrin
Department of Chemical Engineering and Professor Waruna Kulatilaka of the Department of
Mechanical Engineering. As the substitute of Professor Sam Mannan, Professor Ahmad Hilaly
attended my defense for master’s thesis.
All work for the thesis was carried out independently by the student.
Funding Sources
My graduate study is supported by a scholarship from Engineering Development Research
Center in South Korea.

v
NOMENCLATURE
ATR Auto Thermal Reforming
DLN Dry Low NOx
DR Dry Reforming
F-T Fischer-Tropsch
GTL Gas to Liquid
HTFT High temperature Fischer-Tropsch
LHV Lower Heating Value
LTFT Low temperature Fischer-Tropsch
MNQC Multi-Nozzle Quiet Combustor
MWI Modified Wobbe Index
POX Partial Oxidation
PSA Pressure Swing Adsorption
SCR Selective Catalytic Reduction
SMR Steam Methane Reforming
TG Tail Gas

vi
TABLE OF CONTENTS
Page
ABSTRACT .................................................................................................................................... ii
ACKNOWLEDGEMENTS ........................................................................................................... iii
CONTRIBUTORS AND FUNDING SOURCES ......................................................................... iv
NOMENCLATURE ....................................................................................................................... v
TABLE OF CONTENTS ............................................................................................................... vi
LIST OF FIGURES ..................................................................................................................... viii
LIST OF TABLES .......................................................................................................................... x
1. INTRODUCTION ...................................................................................................................... 1
2. PROCESS BACKGROUND ...................................................................................................... 2
2.1 Syngas production process ................................................................................................... 2
2.2 Syngas conditioning for CO2 removal ................................................................................. 5 2.3 Fischer-Tropsch synthesis .................................................................................................... 5 2.4 Syncrude upgrading ............................................................................................................. 6
2.5 F-T tail gas utilization and nitrogen compound buildup ...................................................... 7 2.6 Heavy-duty gas turbine features........................................................................................... 9 2.7 Selection of power plant configuration .............................................................................. 10
3. PROBLEM STATEMENT ....................................................................................................... 12
4. METHODOLOGY ................................................................................................................... 13
5. PROCESS DEVELOPMENT ................................................................................................... 16
5.1 Syngas production process ................................................................................................. 17
5.2 CO2 removal and hydrogen separation process ................................................................. 18 5.3 F-T Synthesis Process ........................................................................................................ 19 5.4 Syncrude upgrading process .............................................................................................. 21 5.5 Combined cycle power generation process ........................................................................ 22 5.6 The consideration of an off-design condition for a combined cycle power plant .............. 26

vii
6. CASE STUDY AND RESULT ................................................................................................ 31
6.1 The integrated plant performance based on different fuels without blending ................... 31 6.2 F-T tail gas flow profile in accordance with tail gas fraction ............................................ 34 6.3 The review of nitrogen buildup in the F-T tail gas ............................................................ 37 6.4 The evacuation route of nitrogen ....................................................................................... 40 6.5 The review of power plant fuel compositions .................................................................... 42
6.6 Modified wobbe index variation from fuel blending ......................................................... 46 6.7 The result of process integration with constraints ............................................................. 48
7. CONCLUSION AND DISCUSSION....................................................................................... 50
REFERENCES ............................................................................................................................. 52

viii
LIST OF FIGURES
Page
Figure 1 F-T tail gas utilization loops ............................................................................................. 7
Figure 2 Base configuration of the GTL plant and the combined cycle power plant ................... 13
Figure 3 Alternative configuration of an integrated plant ............................................................ 14
Figure 4 Syngas production process flow diagram ....................................................................... 17
Figure 5 CO2 removal and hydrogen generation process flow diagram ...................................... 19
Figure 6 Fischer-Tropsch synthesis process flow diagram ........................................................... 20
Figure 7 Syncrude upgrading process flow diagram .................................................................... 22
Figure 8 Combined cycle power generation process flow diagram .............................................. 23
Figure 9 Pinch point temperature in HRSG .................................................................................. 25
Figure 10 The relationship diagram of fuel variation and power plant performance ................... 27
Figure 11 Air compressor flow control scheme ............................................................................ 28
Figure 12 Natural gas constituents in Case I ................................................................................ 32
Figure 13 Recycled tail gas constituents in Case I ....................................................................... 33
Figure 14 Tail gas flow rate based on compositions..................................................................... 34
Figure 15 F-T tail gas flow profile ................................................................................................ 35
Figure 16 Tail gas constituents flow profile (mass basis) ............................................................. 36
Figure 17 The graph for recirculated tail gas constituents flow (mol basis) ................................ 37
Figure 18 Nitrogen compound buildup on upstream F-T process flow ........................................ 39
Figure 19 Nitrogen gas flow diagram ........................................................................................... 40
Figure 20 The steps to calculate nitrogen flow in main stream .................................................... 41

ix
Figure 21 Blended fuel composition (hydrocarbons) ................................................................... 43
Figure 22 Blended fuel flow (mol basis) ...................................................................................... 44
Figure 23 blended fuel composition (H2, CO and inert gases) ..................................................... 44
Figure 24 The composition of F-T tail gas supplied to power plant (mol basis) .......................... 45
Figure 25 Modified wobbe index of blended fuel (with 7E.03 variation) .................................... 47
Figure 26 Process integration result with constraints ................................................................... 48

x
LIST OF TABLES
Page
Table 1 The comparison of HTFT and LTFT ................................................................................. 6
Table 2 The comparison of power plants by capacity, specific price and efficiency ................... 11
Table 3 Natural Gas Composition................................................................................................. 16
Table 4 Gas turbine input parameters ........................................................................................... 24
Table 5 Heat recovery steam generator input parameters ............................................................. 24
Table 6 Steam turbine input parameters ....................................................................................... 26
Table 7 Integrated plant performance (Case I and II) ................................................................... 31
Table 8 The information of nitrogen concentration in natural gas ............................................... 38
Table 9 The relationship of nitrogen mole % in between the natural gas and the F-T tail gas .... 38
Table 10 The allowable MWI ranges............................................................................................ 46
Table 11 Trade-off among power output, utility consumption and nitrogen buildup .................. 49

1
1. INTRODUCTION
A gas-to-liquid (GTL) process is one of the processes to monetize natural gas.1 With the
attention of the process, the number of GTL projects has increased throughout the years.2 Also, it
is expected that the GTL process will contribute to increase total liquid supplies by 2040.3
However, recently the recession of the GTL industry occurred. For instance, Shell
cancelled a 140,000 bbl/day GTL project in 2013.4 Sasol decided not to develop a $15 billion GTL
project in 2017.5 Both imply that the profit of a future GTL project is not guaranteed due to the
uncertainties of oil and gas market prices and the variability of the gap between the prices.6 While
the GTL process has been improved in the perspective of water and energy sustainability,1,7 it is
not likely to break through the challenge the GTL industry has faced. In addition to improving
process efficiency internally, a way to decrease dependence on oil and gas market conditions is
needed. In this regard, an integrated plant that consists of a GTL plant and a power plant is
proposed to alleviate the risk that exists under volatile oil and gas market prices.
The objective of this study is to evaluate the flexibility and feasibility of the integrated
plant. A simulation model in ASPEN Plus is developed to reflect a process design modification
and visualize the process of the integrated plant. The model helps to analyze the performance of
the integrated plant with the adjustment of F-T tail gas distribution. With the simulation results,
constraints that limit the split control range of F-T tail gas are included to find out feasible
solutions.

2
2. PROCESS BACKGROUND
This study requires the understanding of the GTL plant, the power plant and the connection
between the two. In particular, there are two ways to utilize the F-T tail gas generated by the
Fischer-Tropsch synthesis. One way is that it is recycled to a syngas production unit in the GTL
plant to enhance the productivity of GTL products, and the other way is that it is sent to a gas
turbine in the power plant to generate electricity. Before the process configuration of the integrated
plant is described, background information with respect to the GTL process, F-T tail gas utilization
and the power generation process is given as below.
2.1 Syngas production process
A syngas production process is one of the most important processes in the GTL plant. The
cost of a syngas production unit accounts for around 40% of total cost of the GTL plant.7
Furthermore, downstream processes for GTL products are affected by syngas compositions. The
syngas compositions need to maintain a desired ratio between hydrogen and carbon monoxide of
2:1 that a F-T reactor requires.8 These aspects emphasize the selection of the syngas production
process.
There are various kinds of ways to produce the syngas: steam methane reforming (SMR),
partial oxidation reforming (POX), and dry reforming (DR).9 Combined technologies such as auto-
thermal reforming (ATR) and tri-reforming are also in development.10 The combined technologies
as well as SMR, POX and DR are involved with basic reactions.11

3
Steam methane reforming reaction
CH4 + H2O → CO +3H2 ∆H298 = 206 kJ/mol
Partial oxidation reforming reaction
CH4+ 1
2 O2 → CO + 2H2 ∆H298 = -36 kJ/mol
Dry reforming reaction
CH4 + CO2 ↔ 2CO + 2H2 ∆H298 = 247 kJ/mol
Water-gas shift reaction
CO + H2O ↔ CO2 + 2H2 ∆H298 = -41 kJ/mol
To begin with, the steam methane reforming is one of the most prevalent processes in the
chemical industry in that it provides around 50% of total production of hydrogen.12 The syngas
that has a ratio between hydrogen and carbon monoxide of 3:1 is obtained through the steam
methane reforming with catalysts.13 In addition to the steam methane reforming reaction, the
water-gas shift reaction helps adjusting the hydrogen content in the syngas.14 However, the SMR
reaction is an endothermic reaction that absorbs external energy to keep reactor temperature
constant, which indicates that additional fuel and relevant equipment to provide heat energy are
required. To overcome this disadvantage, an alternative method to supply the heat from the flue
gas of another process has been proposed.15
When it comes to partial oxidation reforming, it produces syngas that consists of hydrogen
and carbon monoxide of 2:1.16 Compared to SMR, POX is not suitable to generate syngas that has
a high concentration of hydrogen. However, it is a recommended ratio for Fischer-Tropsch (F-T)
synthesis.17 Moreover, an external heat source is not necessary because the POX reforming
reaction is exothermic.

4
On the other hand, POX reforming demands pure oxygen provided from an air separation
unit.18 In terms of catalyst usage, the POX reforming reaction can occur regardless of the usage of
catalysts.16 However, the absence of the catalysts raises concerns about the formation of soot and
nitrogen compounds such as ammonia and hydrogen cyanide (HCN), which are harmful to cobalt
catalysts for F-T synthesis.19, 20
Dry reforming produces syngas that has a hydrogen and carbon monoxide ratio of 1:1.
Despite the lowest ratio among three basic reactions, it is useful when combined with SMR to meet
the requirement of H2:CO ratio for F-T synthesis.21 Moreover, the usage of carbon dioxide for
syngas production can contribute to reduce carbon emission.22 For example, carbon dioxide in flue
gas leaving a power plant serves as a reactant for syngas production.23
Auto thermal reforming (ATR) is composed of SMR and POX. This reforming method
uses oxygen and steam to generate syngas. Since the operating temperature for ATR is relatively
low compared to that for POX reforming, ATR mitigates the formation of soot and nitrogen
compounds.19 Moreover, the amount of fuel for heating decreases, which is attributed to a
combination of the endothermic reaction and the exothermic reaction.24
Tri-reforming is involved with all reforming reactions. This technology has three methods
for syngas production, which are useful to adjust the H2:CO ratio for F-T synthesis.10 The various
kinds of tri-reforming process configurations are developed including KOGAS tri-reformer.
In the view of energy utilization, combined processes such as ATR and tri-reforming
process are more favorable than single reaction processes. Thermal efficiencies of the combined
processes are likely to be 1 – 2 % higher than those of single reaction processes.19 On the other
hand, the processes associated with ATR or tri-reforming are so complex that it should be
considered to balance the supplying of each source.

5
2.2 Syngas conditioning for CO2 removal
The syngas generated by different types of reforming comprises carbon dioxide as well as
main compositions, hydrogen and carbon monoxide. The carbon dioxide is not negligible because
around 20 % of carbon in feed natural gas forms carbon dioxide.25 Moreover, carbon dioxide is
not likely to participate in F-T synthesis through water-gas shift activity if cobalt catalysts are
applied.18,20,26 Even the presence of CO2 reduces the selectivity of heavy hydrocarbons on F-T
synthesis.27 For these reasons, the carbon dioxide in the syngas should be removed in advance of
a F-T synthesis process if F-T tail gas is recycled to the syngas production process.19
2.3 Fischer-Tropsch synthesis
For the purpose of converting syngas to hydrocarbon chains, Fischer-Tropsch (F-T)
synthesis is used. The representative formula of F-T synthesis is described as follows.6
CO + 2H2 → (-CH2-)n + H2O (highly exothermic)
The hydrocarbons that have a wide range of carbon numbers are created though this
synthesis. The formation of hydrocarbon chain growth is expressed by Equation 1), Anderson–
Schulz–Flory (ASF) distribution equation.28
xi = (1 − 𝛼) × 𝛼𝑖−1…………………….……………………………………………Equation 1)
The term α is the possibility of hydrocarbon chain growth, which governs hydrocarbon
distribution according to carbon number i. When one alpha value does not represent all

6
hydrocarbon formulation, two alpha values are introduced to describe different chain
probabilities.28, 29
F-T synthesis is divided into two categories by operating temperature of a F-T reactor. The
difference between two categories are presented in Table 1.6, 25, 27, 29
Type HTFT LTFT
Operating temperature 300 - 350 ℃ 220 – 240 ℃
Operating pressure Around 25 bar 20 – 25 bar
Conversion rate Above 85 % Around 60%
Alpha value 0.65 – 0.7 0.85 – 0.95
Main products Gasoline and low molecular
mass olefins
High molecular mass waxes
(synthetic fraction of diesel)
Catalyst Fe Co (or Fe)
Temperature control Steam is supplied as a coolant to maintain operating temperature
during exothermic F-T synthesis reaction.
Table 1 The comparison of HTFT and LTFT
2.4 Syncrude upgrading
The syncrude generated from the F-T synthesis process goes into the syncrude upgrading
process. This process converts the syncrude to various GTL products such as naphtha, gasoline,
diesel, kerosene and other desired products through hydrocracking and fractionation.1, 18 However,
in this study the GTL products are not separated, and they are represented by one constant value.
Also, the process is simplified by applying an assumption based on normal distribution probability
for C20 or heavier hydrocarbons’ cracking.1 Since the separation of GTL products is not the focus

7
of this study, the simulation model for the syncrude upgrading process is developed in a
uncomplicated manner.
2.5 F-T tail gas utilization and nitrogen compound buildup
The main purpose of F-T synthesis is to produce heavier hydrocarbons. However, F-T
synthesis also generates residual gases including methane, hydrogen, carbon monoxide and
nitrogen. The mixture of residual gases is defined as F-T tail gas.
The F-T tail gas can be discharged or utilized. It is simple to discharge the F-T tail gas to
the atmosphere because it is not associated with any process. However, the disposal is not an
adequate approach in terms of energy and environment sustainability. In addition to the disposal
route, there are alternative routes for utilization presented in Figure 1.29
Figure 1 F-T tail gas utilization loops

8
The first alternative route is the internal recycling loop without conditioning through which
the F-T tail gas is recycled to the F-T process. It improves the productivity of the F-T process
because the F-T tail gas still contains hydrogen and carbon monoxide that are conducive to F-T
synthesis. However, this route has an issue with adjusting the ratio of hydrogen and carbon
monoxide. The ratio is not identical with the desired ratio for the F-T process. Furthermore,
compared to iron catalysts, cobalt catalysts for the F-T process are not likely to encourage a water-
gas shift reaction that can adjust the ratio.26
The second alternative route can resolve the issue on syngas constituents. The route
includes the tail gas conditioning unit to meet the ratio for the F-T process. However, it has other
problems such as high cost and residual methane. Installing the tail gas conditioning unit increases
the total cost of a GTL process. Moreover, the residual methane still remains although the F-T tail
gas passes through the tail gas conditioning unit.
The third alternative route resolves these problems. Since the route is connected to the
syngas production unit, the desired ratio between hydrogen and carbon monoxide for F-T synthesis
is achieved regardless of tail gas compositions. It does not need any additional conditioning unit.
Furthermore, the residual methane mixed with natural gas can be converted to syngas via syngas
reforming.29 However, the route has an inherent disadvantage of recycling that F-T tail gas is not
able to escape from a GTL process boundary. In particular, inert gases are confined in a GTL
process. Carbon dioxide is separated by a carbon dioxide removal unit. Nitrogen, however, has no
choice but to be accumulated in the GTL process.29 Even a nitrogen separation unit is not
preferable to the carbon dioxide removal unit because it is energy intensive and expensive.30
Although the nitrogen is unreactive, the buildup of nitrogen flow has an impact on the F-T
process if partial pressure of carbon monoxide and hydrogen is changed.31, 32, 33 In this regard, a

9
route for evacuating nitrogen is necessary to avoid establishing large nitrogen flow, rather than
applying the F-T synthesis technology involved with nitrogen-rich syngas.34 The paper that deals
with this matter suggests to meet the ‘soft maximum’ specification of nitrogen flow as 15 %.30
And lower nitrogen flow rate is preferred because nitrogen flow buildup increases the required
capacity of equipment in the GTL plant.30
2.6 Heavy-duty gas turbine features
A gas turbine is one of the main equipment in a combined cycle power plant in addition to
a heat recovery steam generator and a steam turbine. The gas turbine generates electricity and high
temperature flue gas that allows the heat recovery steam generator to produce steam. In turn, the
steam rotates the steam turbine to generate electricity. In this regard, a gas turbine has a vital role
in generating electricity in a combined cycle power plant.
The gas turbine is capable of rapidly respond to variations in electricity demand. In the
condition of peak load and cyclic load of electricity, the gas turbine can follow this load change
and supply required electricity. This ability is expected to be more significant because it can offset
the fluctuate power generated from renewable energy resources.35
While the gas turbine becomes prevalent in the power industry due to these advantages, it
has the issue of fuel-flexibility. The fuel of the gas turbine is typically natural gas of which the
main content is methane. However, fuel constituents are diversified, which requires fuel-flexible
design on the gas turbine to expand its application. The design modification of a gas turbine
combustor is inevitable to utilize low calorific fuel with flame stability.36, 37, 38 When it comes to
gas turbine material, the materials of major components of the gas turbine need to be improved for
syngas firing.39

10
In addition to the gas turbine material, the fuel flexibility is related to the type of a gas
turbine combustor. For instance, the applications of Dry Low NOx (DLN) combustors with fuel-
air premixing are restricted due to the risk of flashback around the burner.37 The DLN combustors
can cover up to 48% of hydrogen content fuels with holding flame.40 On the other hand, a Multi-
Nozzle Quiet Combustor (MNQC), one of the diffusion type combustors, has the capability to
cover a wider range of syngas fuel that contains a hydrogen content up to 90%.41 Moreover, the
MNQC H2 testing is conducted with fuels that have low heating values and high hydrogen
concentrations. With the advancements of gas turbine technology, gas turbine manufacturers have
gained operating experience on the projects where fuel-flexible gas turbines are installed. 42
2.7 Selection of power plant configuration
The gas turbine features described in Section 2.6 support that a combined cycle power plant
is an appropriate configuration for process integration. The fuel-flexible gas turbine can accept the
fuel mixture containing hydrogen, carbon monoxide, methane and other compositions.41, 43
Moreover, the power plant with the gas turbine outweighs that with a boiler in terms of efficiency
and specific price (tariff). Several power plants are evaluated based on capacity, specific price and
net efficiency in Table 2.44

11
Type of plant Capacity Specific price
(US$/kW)
Net efficiency (%)
- LHV basis
Combined cycle power plant 800 MW 550 – 650 55 – 59
Combined cycle power plant 60 MW 700 – 800 50 – 54
Gas turbine plant (simple cycle) 250 MW 300 – 400 38 – 40
Gas turbine plant (simple cycle) 60 MW 500 – 600 35 – 42
Steam power plant (coal) 800 MW 1200 – 1400 (42 – ) 47
Steam power plant (coal) 60 MW 1000 – 1200 30 – 35
Table 2 The comparison of power plants by capacity, specific price and efficiency
Since a power plant is supposed to be operated continuously for supplying auxiliary power
of a GTL plant as well as making a profit, the net efficiency is the highest priority among the key
specifications described in Table 2. Therefore, a combined cycle power plant is superior to a simple
cycle power plant or a steam power plant for process integration.44

12
3. PROBLEM STATEMENT
In this study, process integration of a GTL plant and a power plant is investigated. Process
integration establishes an alternative configuration to produce oil and power. It provides an initial
result after simulation and modeling. The result, however, is involved with constraints that are
derived from the limitation of each plant design and operation. The constraints revise the initial
result and eventually give feasible solutions. On the progress of this process integration, there are
key issues to consider as follows:
• What are features of an alternative configuration?
• What is the result of process integration in the perspectives of power output and utility
consumption?
• Are there any constraints that prevent a simulation model from being feasible?
• How is the allowable range of F-T tail gas fraction with constraints?
• What is the difference between an initial result and a revised result?

13
4. METHODOLOGY
Process integration takes several steps to develop an integrated plant model. To begin with,
a base configuration and an alternative configuration are both defined. The base configuration
consists of two individual plants, the GTL plant and the combined cycle power plant, that are not
combined with each other. This configuration is illustrated in Figure 2.
Figure 2 Base configuration of the GTL plant and the combined cycle power plant
The only aspect that both plants have in common is to use natural gas as a source. The GTL
plant converts natural gas to GTL products such as naphtha, gasoline, diesel, kerosene and others,
whereas the combined cycle power plant consumes natural gas to generate electricity. This aspect
gives a benefit that both plants are accessible to a natural gas pipeline. The other benefit that the
base configuration has is power sustainability. Auxiliary power of the GTL plant can be supplied
from the power plant, which allows the GTL plant to be a self-sufficient plant with regard to

14
electricity. In the GTL plant, the F-T tail gas from the F-T process is recycled to the syngas
production unit to increase GTL products’ rate. Otherwise, the tail gas is emitted to the atmosphere.
Other tail gases and liquid drains are discharged.
On the other hand, an alternative configuration is composed of two interconnected plants
through the F-T tail gas supply line. Figure 3 shows the configuration.
Figure 3 Alternative configuration of an integrated plant
The main difference between both configurations is the methods of utilizing the F-T tail
gas. In the base configuration, all the F-T tail gas goes back to the syngas production unit. The
alternative configuration, however, has another route to supply the F-T tail gas to the gas turbine
in the power plant. With this connection, the tail gas is utilized not only as a source for enhancing
the productivity of the GTL plant but also as fuel for the power plant. The alternative configuration
also has the advantages such as power sustainability and natural gas accessibility. On the contrary,
the fuel gas treatment system in the power plant becomes complicated in that the tail gas as well

15
as natural gas is provided. Whether the power plant has the capability to cover fuel variation is
important to establish the alternative configuration.
The next step is to create and develop a simulation model in ASPEN Plus. In the power
engineering field, the programs such as GT Pro and Thermoflex are commonly used. However,
they do not have functions to implement chemical reactions. Moreover, a limited number of fluid
properties are available in the programs. Thus, the power plant process is created in ASPEN Plus
flowsheet with the GTL process.
After the implementation of the simulation of an integrated plant, simulation results of two
cases are evaluated. One case is to recycle all F-T tail gas to a GTL plant, whereas the other case
is to supply all the F-T tail gas to a power plant. Power plant fuel is not blended together, and both
cases are compared based on power output, steam consumption and oxygen consumption.
The former results are analyzed without any constraints and fuel blending. However,
constraints need to be considered for the results to be more feasible. The constraints that limit
process integration come from both the GTL process and the power plant process. On the GTL
process, unnecessary nitrogen flow is built up in the main stream. This phenomenon is mitigated
by adjusting F-T tail gas fraction that is the amount of F-T tail gas sent to a power plant. Identifying
the allowable range of the F-T tail gas fraction defines the first constraint.
Adjusting the F-T tail gas fraction implies blending F-T tail gas and natural gas. The
adjustment leads to the variation of fuel compositions, which in turn changes the Modified Wobbe
Index (MWI) value. It should be within its permissible range that a gas turbine has. Complying
with this requirement settles the second constraint.
Last, the simulation results are revised by two constraints from each plant. The
performance of an integrated plant is assessed based on the revised results.

16
5. PROCESS DEVELOPMENT
The first step of process integration is to define the conditions at plant boundary. One of
the conditions is natural gas compositions described in Table 3.1, 45
Component Mol %
Methane 95.39
Ethane 3.91
Propane 0.03
Carbon Dioxide 0.59
Nitrogen 0.08
Temperature (℉) 79
Pressure (psia) 310
Table 3 Natural Gas Composition
The composition of natural gas supplied to the GTL plant is identical with that supplied to
the power plant. The total flow rate of natural gas supplied to both plants is constant.
The other boundary condition is GTL production rate, which is assumed as 4,000 bbl/day.6
The scale of simulation is smaller than that of recent projects.18 However, actual GTL plants with
similar capacity exist and are in operation.46 Also, the capacity is appropriate for process
integration with one gas turbine when considering the capacity. For these reasons, the small-scale
GTL plant is developed in a flowsheet.

17
5.1 Syngas production process
The syngas production process in a GTL plant is based on tri-reforming, which requires
three sources: steam, oxygen and carbon dioxide. High-pressure steam of which pressure and
temperature are 435 psia and 79℉ is necessary for steam methane reforming. Pure oxygen from
an air separation unit is provided to the syngas production unit for partial oxidation reforming.
Carbon dioxide gas is from a CO2 removal unit located in between the syngas production process
and the F-T synthesis process. Thus, there is no external CO2 source. Its origins are natural gas
and the product of tri-reforming reactions.
The syngas production process starts with compressing natural gas. The natural gas is
pressurized up to the operating pressure of reformer, 435 psia. Then it is heated by the heat
exchanger to 300 ℉ and mixed with water on the saturator. In the saturator, heat energy that the
natural gas contains vaporizes the water, and the natural gas temperature is decreased accordingly
Figure 4 Syngas production process flow diagram1

18
due to latent heat of vaporization of water.47 The saturated natural gas is combined with the high
pressure steam before going to the pre-reformer. The pre-reformer plays a role in changing
hydrocarbons except methane to hydrogen and carbon monoxide and preventing the coking
phenomenon in the main reformer.29 Ethane and propane constituents in the natural gas react with
steam, which produces syngas. The exiting fluid from the pre-reformer is mixed with carbon
dioxide and F-T tail gas. Then the mixture passes through the heat exchanger and the main
reformer. The heat exchanger upstream of the reformer is required to keep the reformer in adiabatic
condition. The reformer temperature is 1950 ℉, which maintains constant by balancing an
endothermic and exothermic reaction.48 The oxygen gas supplied by the oxygen compressor reacts
with methane, which generates syngas and heat. The steam that moves with the natural gas
concurrently consumes the heat for the steam methane reforming reaction. The oxygen to carbon
ratio is 0.6,29 and the syngas from the reformer meets the ratio between hydrogen and carbon
monoxide of 2.1 to 1.49, 50 Since the temperature of the syngas from the reformer is high, it is
cooled to 122 ℉ by the downstream heat exchanger and sent to the separator. In the separator, the
syngas with CO2 and residual methane is separated from condensed liquid. It goes into the CO2
removal unit.
5.2 CO2 removal and hydrogen separation process
In the CO2 removal unit, CO2 is removed from the syngas. The removal rate is set as
99.96%.7 Most of the separated CO2 is discharged to the atmosphere if the CO2 gas is not used.
However, the syngas production unit utilizes CO2 for the dry reforming process. Thus, it is
compressed by the CO2 compressor to meet the operating pressure of the reformer and mixed with
other gases.
19
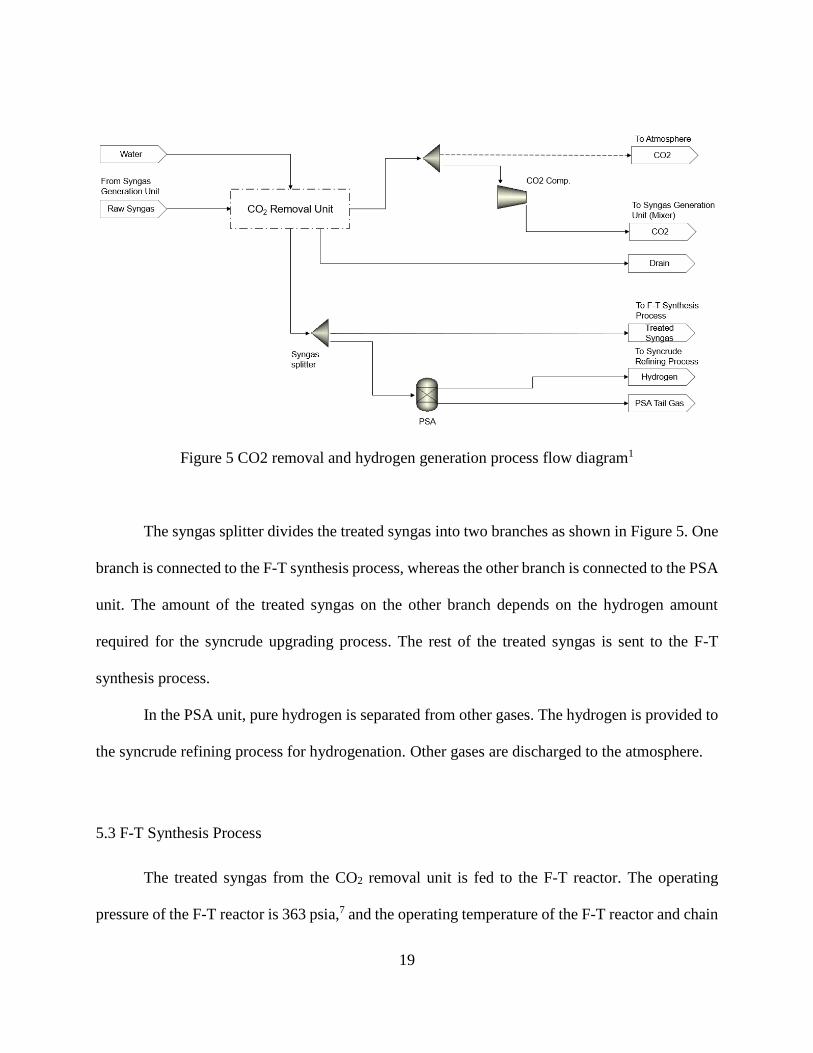
Figure 5 CO2 removal and hydrogen generation process flow diagram1
The syngas splitter divides the treated syngas into two branches as shown in Figure 5. One
branch is connected to the F-T synthesis process, whereas the other branch is connected to the PSA
unit. The amount of the treated syngas on the other branch depends on the hydrogen amount
required for the syncrude upgrading process. The rest of the treated syngas is sent to the F-T
synthesis process.
In the PSA unit, pure hydrogen is separated from other gases. The hydrogen is provided to
the syncrude refining process for hydrogenation. Other gases are discharged to the atmosphere.
5.3 F-T Synthesis Process
The treated syngas from the CO2 removal unit is fed to the F-T reactor. The operating
pressure of the F-T reactor is 363 psia,7 and the operating temperature of the F-T reactor and chain

20
growth probability (alpha value) are 428 ℉ and 0.92, respecitvely.51, 52, 53, 54 Since the reaction that
occurs in the F-T reactor is exothermic, the operating temperature can increase without any
external heat. A cooling fluid prevents the increase in the operating temperature. In terms of F-T
synthesis, the F-T reactor block implements the F-T synthesis reactions that produce only from C1
to C30 hydrocarbons.1
Figure 6 Fischer-Tropsch synthesis process flow diagram1
The separation of the F-T reaction products takes place through two steps. First, the 2-
phase separator separates heavy hydrocarbons’ liquid, which is called wax, from the products.
Nonetheless, it still has heavy hydrocarbons to be supplied to the syncrude refining process. Before
going to the 3-phase separator, its temperature is decreased by the downstream heat exchanger,
which leads to the condensation of residual heavy hydrocarbons and water. The fluid fed to the 3-
phase separator is divided into three fluids that are F-T tail gas, oil and water. The residual heavy
hydrocarbons are pumped to the syncrude refining process while the water is drained. The F-T tail

21
gas leaving the separator can be supplied to the syngas production unit, a power plant or the
atmosphere. The fraction values are controlled by the F-T tail gas splitter. In this study, the route
to disposing the F-T tail gas to the atmosphere is disregarded. Instead, the F-T tail gas is sent
through two other routes. The underlying reason is to maximize the utilization of the F-T tail gas.
In addition to the three routes described in Figure 6, There is a route through which the F-
T tail gas is used as heating fuel for the GTL process. However, the route is excluded, which
underlies the information that the minimum heat requirement is zero through heat integration.1
5.4 Syncrude upgrading process
The wax and F-T condensate from the F-T synthesis process are fed to the hydrocracker
that serves to convert long hydrocarbon chains to short hydrocarbon chains. The short hydrocarbon
chains react with the hydrogen supplied from the PSA unit, which primarily produces the mixture
of desired hydrocarbons. As it leaves the hydrocracker, the mixture passes through the hot
separator and the cold separator and coolers between the hydrocrackers and the cold separator.54
Some gases vaporized on the cold separator are recycled to the hydrocracker with hydrogen,
whereas other gases are emitted to the atmosphere.1 The mixture from the cold separator is heated
by the heat exchanger and enters the fractionator. Consequently, the final GTL products are
obtained. In addition to the products, the light gas is vaporized and discharged to the atmosphere,
while residual heavy hydrocarbons are recycled to the hydrocracker.55

22
Figure 7 Syncrude upgrading process flow diagram1
5.5 Combined cycle power generation process
The other process integrated with the GTL process is the combined cycle power generation
process illustrated in Figure 8. The process consists of three main equipment, the gas turbine, the
heat recovery steam generator and the steam turbine, and relevant auxiliary equipment.
The gas turbine operates on the mixture of the natural gas and the F-T tail gas. The flow of
each gas depends on the GTL plant operation. For example, the F-T tail gas flow for the power
plant increases as the F-T tail gas flow for the GTL plant decreases. Since the decrease in the F-T
tail gas recirculation to the GTL plant reduces the plant productivity, the GTL plant consumes
more natural gas. In turn, the natural gas flow for the power plant decreases while keeping total
flow of natural gas constant. In summary, in terms of power plant fuel, F-T tail gas flow increases
as natural gas flow decreases, and vice versa.
Once two types of gases are blended, the blended fuel is heated by the performance heater
up to 338 ℉ before combining with air. The air is compressed by the air compressor of which

23
pressure ratio on the design condition is 13.56 The air compressor flow rate is controlled by the
function to maintain the constant temperature, 2218 ℉, at the gas turbine inlet. The isentropic
efficiency and mechanical efficiency of the air compressor are 91.5 % and 99.6% at design point,
respectively.57
Figure 8 Combined cycle power generation process flow diagram58
The blended fuel and air are mixed and supplied to the combustor that is represented by
RGibbs model in ASPEN Plus. The combustor changes the gas compositions and raises the gas
temperature to provide heat energy to the gas turbine. On the other hand, the pressure in the
combustor remains constant by ignoring the pressure loss across the combustor.
The combustion gas is sent to the gas turbine. The gas transfers heat energy to the gas
turbine, which generates electricity. The input parameters of the gas turbine are presented in Table
4.

24
Parameters Value Remark
Isentropic Efficiency 59 0.88
Mechanical Efficiency 0.996 It is assumed as the same value from air compressor
mechanical efficiency.
Outlet Pressure 1 atm The pressure drop of subsequent equipment is ignored.
Table 4 Gas turbine input parameters
In addition to generating power, the gas turbine discharges exhaust flue gas that has less
energy than the combustion gas. However, it still has sufficient heat for utilization. Before being
discharged to the atmosphere, the flue gas provides heat to the heat recovery steam generator.
The heat recovery steam generator is composed of three components: the economizer, the
evaporator and the superheater. For the single pressure HRSG, 60 each component is represented
by one block in ASPEN Plus flowsheet. The key parameters regarding the components are
described in Table 5.
Parameters Value Remarks
Superheated steam temperature 968 ℉ Assumed
Superheated steam pressure 1450 psia Assumed
Pinch point temperature
difference 14.4 K Assumed.
Water temperature at
economizer inlet 91 ℉
It is derived from the water temperature at
the boiler feedwater pump outlet.
Table 5 Heat recovery steam generator input parameters

25
When it comes to the superheated steam temperature and pressure, they indicate the
properties of the steam supplied to the steam turbine. The pressure is also associated with water
saturation temperature on the evaporator. The water saturation temperature is one of the values for
calculating pinch point temperature difference. The definition of pinch point temperature
difference is the gap between the water saturation temperature and the temperature of flue gas
leaving the evaporator, which is illustrated in Figure 9. In addition to the pinch point temperature
difference, the water temperature at the economizer inlet is defined. These values determine the
steam flow rate.
Figure 9 Pinch point temperature in HRSG 61
The steam exiting the heat recovery steam generator goes to the steam turbine. The steam
turbine is the other equipment that generates electricity with the gas turbine. The input parameters
for the steam turbine is specified in Table 6.

26
Parameters Value
Steam turbine exhaust pressure 59 0.696 psia
Steam turbine isentropic efficiency 62 0.8098
Steam turbine mechanical efficiency 63 0.9532
Table 6 Steam turbine input parameters
The steam turbine exhaust pressure is identical with downstream condenser pressure. The
latent heat of steam is removed on the condenser where the exhaust steam is condensed. The
subcooled temperature of the condenser is set as 1 ℉ , which is referred from HEI Surface
Condenser Standard. The water stored in the condenser is pumped by the boiler feedwater pump.
By supplying the water to the heat recovery steam generator, a power plant cycle is set up in
ASPEN Plus flowsheet.
5.6 The consideration of an off-design condition for a combined cycle power plant
The established power plant cycle is based on the design condition. The key parameters in
the flowsheet are appropriate to investigate the combined cycle power plant at one specific
condition. However, they do not cover off-design conditions in which fuel composition and flow
rate varies. The simulation model needs to be equipped with additional functions that modify the
parameters for off-design conditions.
As described in Section 5.5, the mixture of natural gas and F-T tail gas varies in its
composition and flow rate, which results in a change in heat input to the power plant. A design
condition is defined as the state that the heat input is the highest value. Conversely, off-design

27
conditions correspond to all other states in which the heat input is below maximum. Based on these
definitions, the sequence of changes in the key parameters is described in Figure 10.
Figure 10 The relationship diagram of fuel variation and power plant performance
Figure 10 shows how the major parameters of the power plant are changed sequentially.
To begin with, the change in heat input affects two parameters: air flow rate and turbine inlet
pressure. The air flow rate is manipulated in order to maintain a constant temperature. When the
heat input decreases, turbine inlet temperature will decrease. However, the temperature is not
changed by reducing the air flow rate. The function that keeps the temperature constant is included
in the simulation model, which is described in Figure 11.

28
Figure 11 Air compressor flow control scheme
The change in the air flow rate influences air compressor’s isentropic efficiency. Since the
air compressor is designed to have the highest efficiency at the design point, the efficiency in an
off-design condition is lower than that in the design condition. The efficiency of the air compressor
is expressed by Equation 2) and Equation 3).64
ηcomp = ηcomp,d × 0.3337+1.0917 ×𝑀𝑟−0.5254 ×𝑀𝑟2
0.9 …………...……………………… Equation 2)
Mr = ��𝑐𝑜𝑚𝑝
��𝑐𝑜𝑚𝑝,𝑑 …………………………………………………….….……………… Equation 3)
The efficiency (ηcomp) is the function of air mass flow ratio (Mr), and the air mass flow
ratio is obtained by an air flow rate divided by the air flow rate in the design condition. The air
mass flow ratio is 1 or less because the design condition has the largest air capacity that is required
for keeping the turbine inlet temperature constant with the highest heat input.
29
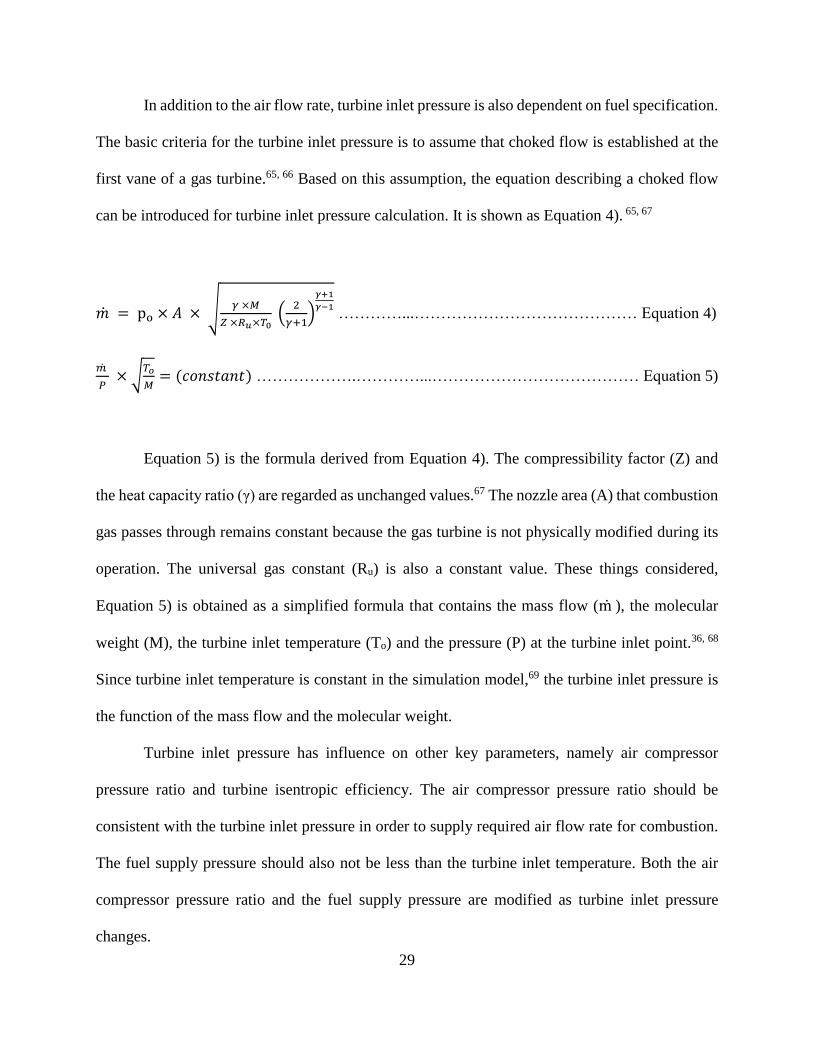
In addition to the air flow rate, turbine inlet pressure is also dependent on fuel specification.
The basic criteria for the turbine inlet pressure is to assume that choked flow is established at the
first vane of a gas turbine.65, 66 Based on this assumption, the equation describing a choked flow
can be introduced for turbine inlet pressure calculation. It is shown as Equation 4). 65, 67
�� = po × 𝐴 × √𝛾 ×𝑀
𝑍 ×𝑅𝑢×𝑇0 (
2
𝛾+1)
𝛾+1
𝛾−1 …………...…………………………………… Equation 4)
𝑚
𝑃 × √
𝑇𝑜
𝑀= (𝑐𝑜𝑛𝑠𝑡𝑎𝑛𝑡) ……………….…………...………………………………… Equation 5)
Equation 5) is the formula derived from Equation 4). The compressibility factor (Z) and
the heat capacity ratio (γ) are regarded as unchanged values.67 The nozzle area (A) that combustion
gas passes through remains constant because the gas turbine is not physically modified during its
operation. The universal gas constant (Ru) is also a constant value. These things considered,
Equation 5) is obtained as a simplified formula that contains the mass flow (m ), the molecular
weight (M), the turbine inlet temperature (To) and the pressure (P) at the turbine inlet point.36, 68
Since turbine inlet temperature is constant in the simulation model,69 the turbine inlet pressure is
the function of the mass flow and the molecular weight.
Turbine inlet pressure has influence on other key parameters, namely air compressor
pressure ratio and turbine isentropic efficiency. The air compressor pressure ratio should be
consistent with the turbine inlet pressure in order to supply required air flow rate for combustion.
The fuel supply pressure should also not be less than the turbine inlet temperature. Both the air
compressor pressure ratio and the fuel supply pressure are modified as turbine inlet pressure
changes.
30
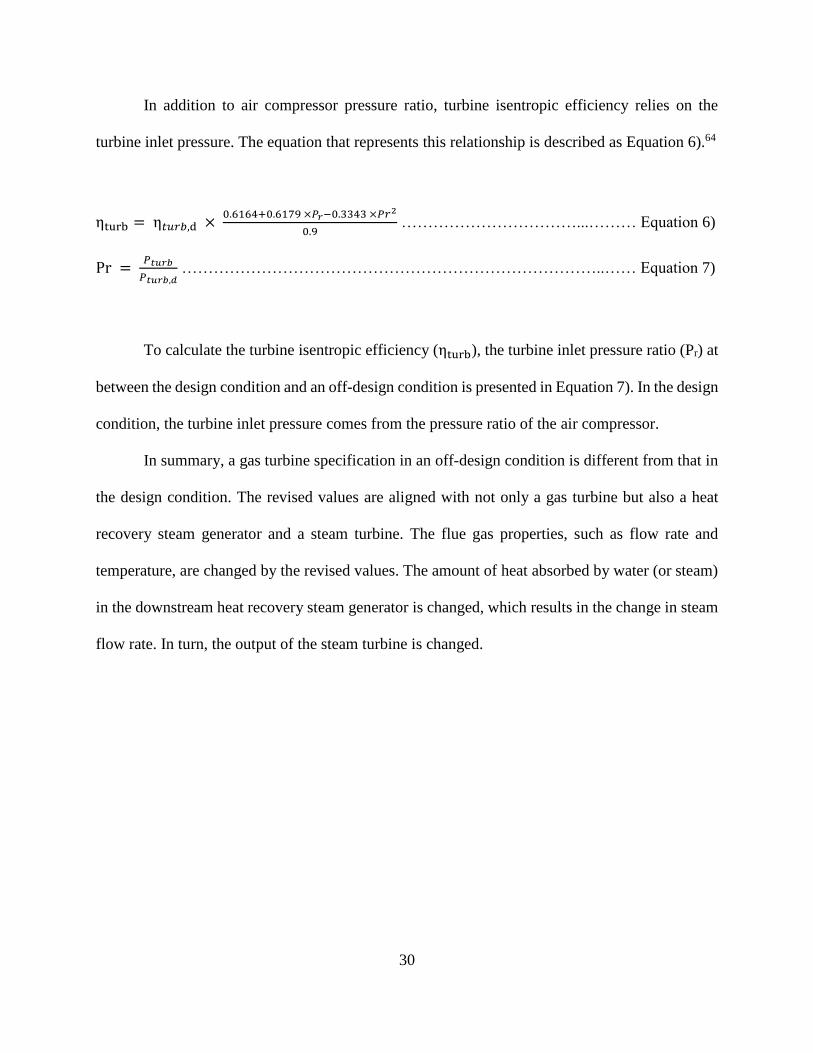
In addition to air compressor pressure ratio, turbine isentropic efficiency relies on the
turbine inlet pressure. The equation that represents this relationship is described as Equation 6).64
ηturb = η𝑡𝑢𝑟𝑏,d × 0.6164+0.6179 ×𝑃𝑟−0.3343 ×𝑃𝑟2
0.9 ……………………………...……… Equation 6)
Pr = 𝑃𝑡𝑢𝑟𝑏
𝑃𝑡𝑢𝑟𝑏,𝑑 ……………………………………………………………………..…… Equation 7)
To calculate the turbine isentropic efficiency (ηturb), the turbine inlet pressure ratio (Pr) at
between the design condition and an off-design condition is presented in Equation 7). In the design
condition, the turbine inlet pressure comes from the pressure ratio of the air compressor.
In summary, a gas turbine specification in an off-design condition is different from that in
the design condition. The revised values are aligned with not only a gas turbine but also a heat
recovery steam generator and a steam turbine. The flue gas properties, such as flow rate and
temperature, are changed by the revised values. The amount of heat absorbed by water (or steam)
in the downstream heat recovery steam generator is changed, which results in the change in steam
flow rate. In turn, the output of the steam turbine is changed.

31
6. CASE STUDY AND RESULT
6.1 The integrated plant performance based on different fuels without blending
The first investigation is the evaluation of the integrated plant performance according to
fuel types for the power plant. As described in the section 4, the power plant receives either F-T
tail gas or natural gas. Under the condition that the gases are not mixed, two cases are compared.
Case I is to supply only the F-T tail gas to the power plant, whereas Case II is to supply only the
natural gas to the power plant with setting up the F-T tail gas recycle loop through which all the
F-T tail gas is recirculated to the GTL plant. The study result is summarized in Table 7.
Results Case I Case II Remarks
Natural Gas (total, lb/hr) 93,249 93,249
to GTL Plant (lb/hr) 58,738 93,246
to Power Plant (lb/hr) 34,511 3 1) Natural gas flow rate conversion
: 34,511 lb/hr = 2,057 lbmol/hr
Tail Gas (total, lb/hr) 63,746 55,726
to GTL Plant (lb/hr) 63,746 0 1) Without nitrogen, the tail gas flow
rate in Case I would be 56,709 lb/hr.
to Power Plant (lb/hr) 0 55,726
1) Tail gas flow rate conversion
: 55,726 lb/hr = 4,932 lbmol/hr
2) Without nitrogen, the tail gas flow
rate in Case II would be 55,602 lb/hr.
Steam Consumption (lb/hr) 58,026 79,999
Oxygen Consumption (lb/hr) 73,520 108,921
GT Fuel LHV (MMBtu/scf) 931 346 1) The values are referred to ASTM
D3588-98.
Heat Input to Power Plant
(MMBtu/hr) – LHV Basis 727 647
Gross Power Output (MW) 118 106
Auxiliary Power (MW) 16 22
Net Power (MW) 102 84
Table 7 Integrated plant performance (Case I and II)

32
Table 7 presents switching the power plant fuel from the natural gas to the F-T tail gas
decreases net power output by 17%. The causes of this result are heat input to the power plant and
auxiliary power consumption. In case of the heat input, it is the function of a fuel flow rate and a
fuel LHV. The flow rate of the F-T tail gas is higher than that of the natural gas, whereas the natural
gas LHV is higher than the F-T tail gas LHV. Between the flow rate and the LHV, the latter
outweighs the former, which determines the heat input. In turn, the net power output has a higher
value in Case I than Case II.
Auxiliary power consumption encourages the gap between each net power output to be
larger. The major power consumers are the air separation unit and its downstream oxygen
compressor. Since oxygen is consumed more in Case II than Case I, the power consumption of the
air separation unit and the oxygen compressor is also higher in Case II than Case I. It is the other
factor that cuts down on the net power output.
Figure 12 Natural gas constituents in Case I
C3H8 0.59%
N2 0.08%
CH4 95.39%
C2H6…
CO2 0.03%
Natural Gas Compositionsin Case I (mol %)
CO2 N2 CH4 C2H6 C3H8

33
In terms of the consumption of utilities including oxygen and steam, Case I is superior to
Case II as well. In other words, both utilities are required more in Case II than in Case I. It results
from the composition difference between the recycled F-T tail gas and the natural gas. The F-T
tail gas shown in Figure 13 is a kind of syngas, the mixture primarily of hydrogen and carbon
monoxide. The gases account for nearly 90% of total mole fraction. Compared to natural gas
compositions illustrated in Figure 12, they are beneficial for the syngas production process because
reforming reactions are not necessary. The only methane residual in the recycled tail gas reacts
with oxygen or steam. On the other hand, Case II entails more oxygen and steam to generate the
F-T tail gas supposed to go to the power plant.
Figure 13 Recycled tail gas constituents in Case I
When it comes to tail gas flow rates in both cases, they are quite different. However, their
gap decreases if nitrogen is disregarded from each flow rate. In particular, the tail gas flow rate in
Case I is reduced from 63,746 lb/hr to 56,709 lb/hr, which is similar with the tail gas flow rate in
CO 28.5%
H2O 0.8%H2 61.3%
N2 4.8%Hydrocarbons 4.6%
Recycled Tail Gas Constituents (mol %)

34
Case II, 55,602 lb/hr. Furthermore, the flow rate of each tail gas component in Case I is almost
identical with that in Case II except nitrogen flow rate, which is illustrated in Figure 14. In this
regard, nitrogen flow rate is a dominant factor that differentiates each tail gas flow rate.
Figure 14 Tail gas flow rate based on compositions
6.2 F-T tail gas flow profile in accordance with tail gas fraction
While the F-T tail gas internal loop has advantage of generating power and reducing
oxygen and steam consumption, it creates abnormal nitrogen flow simultaneously. The nitrogen
flow is not enough to be neglected, which drives further investigation of tail gas utilization. Figure
15 presents the F-T tail gas flow profile according to F-T tail gas distribution.
0 10000 20000 30000 40000 50000
CO
CO2
H2O
H2
N2
H.C
Mass flow rate (lb/hr)
Tail
Gas
Co
nst
itu
ents
Tail Gas Flow Rate based on Compositions
Case I Case II
35
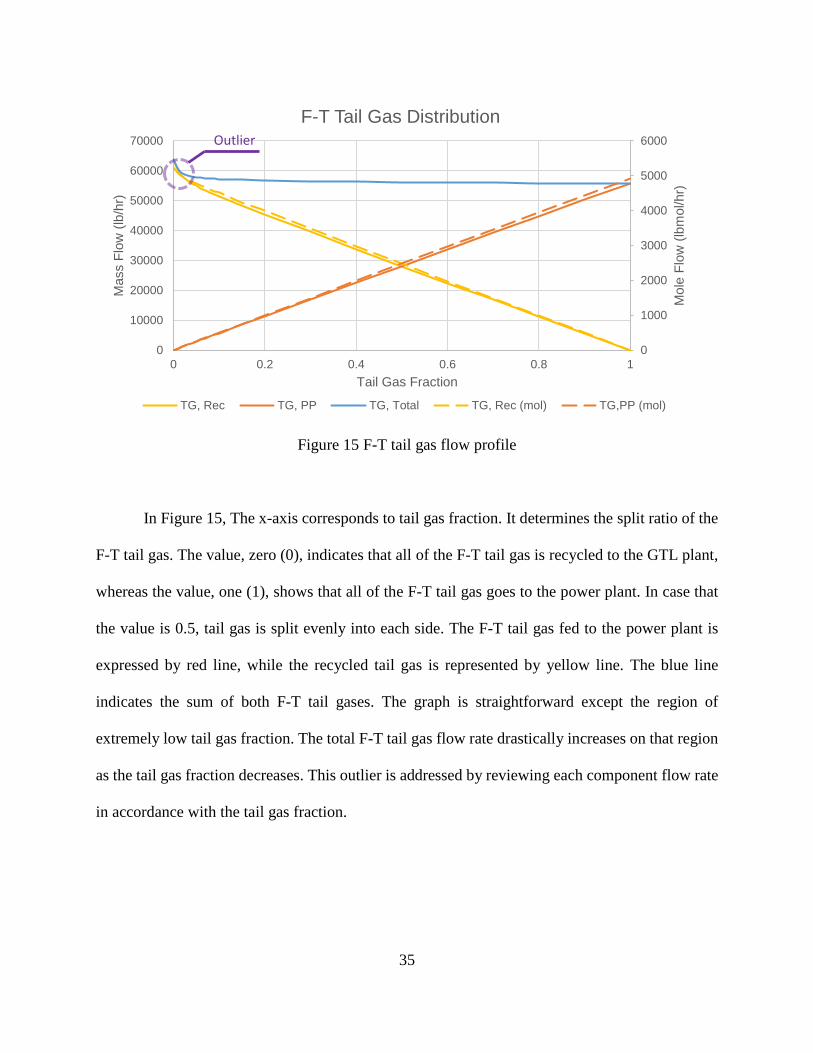
Figure 15 F-T tail gas flow profile
In Figure 15, The x-axis corresponds to tail gas fraction. It determines the split ratio of the
F-T tail gas. The value, zero (0), indicates that all of the F-T tail gas is recycled to the GTL plant,
whereas the value, one (1), shows that all of the F-T tail gas goes to the power plant. In case that
the value is 0.5, tail gas is split evenly into each side. The F-T tail gas fed to the power plant is
expressed by red line, while the recycled tail gas is represented by yellow line. The blue line
indicates the sum of both F-T tail gases. The graph is straightforward except the region of
extremely low tail gas fraction. The total F-T tail gas flow rate drastically increases on that region
as the tail gas fraction decreases. This outlier is addressed by reviewing each component flow rate
in accordance with the tail gas fraction.
0
1000
2000
3000
4000
5000
6000
0
10000
20000
30000
40000
50000
60000
70000
0 0.2 0.4 0.6 0.8 1
Mole
Flo
w (
lbm
ol/hr)
Mass F
low
(lb
/hr)
Tail Gas Fraction
F-T Tail Gas Distribution
TG, Rec TG, PP TG, Total TG, Rec (mol) TG,PP (mol)
Outlier

36
Figure 16 Tail gas constituents flow profile (mass basis)
Figure 16 shows the profile of each composition in mass flow basis. Most constituents
increase as tail gas fraction decreases with different slopes. Among the constituents, nitrogen soars
around zero (0) tail gas fraction. It results in the increase in the total F-T tail gas. Also, the graph
for tail gas constituents in mole flow basis is consistent with that in mass flow basis. Figure 17
shows that nitrogen mole flow rate also rises steeply. The graphs in the Figure 16 and Figure 17
emphasizes the importance of nitrogen evacuation. It is noted that the nitrogen flow is abnormally
high only in the range of low tail gas fraction values, which allows that even small increase in tail
gas fraction can relieve unnecessary nitrogen accumulation in the GTL process.
Before limiting the tail gas fraction to avoid atypical nitrogen flow establishment, it is
necessary to discuss the difference of nitrogen flow percentage between Figure 16 and Figure 17.
Nitrogen flow accounts for 11% of total flow on the mass flow basis, while it is below 5% on the
0
1000
2000
3000
4000
5000
6000
7000
8000
0
10000
20000
30000
40000
50000
60000
70000
0 0.2 0.4 0.6 0.8 1
Nit
rogen
mas
s fl
ow
(lb
/hr)
Mas
s fl
ow
(lb
/hr)
Tail gas fraction
The constituents of recirculated tail gas (mass basis)
TG,Rec_Total TG,Rec_CO TG,Rec_CO2TG,Rec_H2O TG,Rec_H2 TG,Rec_C1TG,Rec_N2
N2 11%

37
mole flow basis. Between two properties, mole flow rather than mass flow governs equipment
sizing in real projects because it is associated with volumetric flow. In this regard, it needs to
review whether neglecting nitrogen mole flow in F-T tail gas is applicable.
Figure 17 The graph for recirculated tail gas constituents flow (mol basis)
6.3 The review of nitrogen buildup in the F-T tail gas
The nitrogen in the F-T tail gas comes from natural gas only. Other sources such as steam,
water and oxygen do not supply nitrogen to the GTL plant. Since natural gas is a nitrogen supplier,
it is necessary to find out the relationship between natural gas and F-T tail gas in terms of nitrogen
content.
0
50
100
150
200
250
300
0
1000
2000
3000
4000
5000
6000
0 0.1 0.2 0.3 0.4 0.5 0.6 0.7 0.8 0.9 1
Nit
roge
n m
ole
flo
w (
lbm
ol/
hr)
Mo
le f
low
(lb
mo
l/h
r)
Tail gas fraction
The constituents of recirculated tail gas (mol basis)
TG,Rec_Total TG,Rec_CO TG,Rec_CO2 TG,Rec_H2O
TG,Rec_H2 TG,Rec_C1 TG,Rec_N2
N2 4.8%

38
Parameter Value
The input value of nitrogen concentration in simulation 1, 45 0.08 %
The limit of total inert gas in the U.S. National Pipeline 70 Below 4 %
Table 8 The information of nitrogen concentration in natural gas
Table 8 presents the information on nitrogen concentration and its limitation in the U.S.
national pipeline. This information implies two things: One is the variability of nitrogen
concentration, and the other is that the nitrogen concentration in simulation, 0.08%, is too low to
represent actual natural gas composition. As the way of supplementing former study results, the
additional values of the nitrogen concentration are selected between 0% to nearly 1 %. In this
range, the trend of nitrogen mole percentage in F-T tail gas is shown as Table 9.
N2 in Natural Gas
(% mol)
N2 in Natural Gas
(% mass)
N2 in Tail Gas
(% mol)
N2 in Tail Gas
(% mass)
0% 0% 0% 0%
0.08% 0.13% 4.8% 11.0%
0.14% 0.24% 8.3% 18.2%
0.29% 0.48% 15.3% 30.8%
0.43% 0.71% 21.5% 40.2%
0.57% 0.95% 26.8% 47.4%
0.71% 1.19% 31.5% 53.0%
0.85% 1.42% 35.7% 57.6%
0.99% 1.66% 39.4% 61.4%
Table 9 The relationship of nitrogen mole % in between the natural gas and the F-T tail gas

39
According to the former result in Figure 17, the nitrogen mole percentage in the F-T tail
gas is 4.8 %. However, it reaches 39.4% in the case that the nitrogen content in the natural gas is
about 1%. Moreover, it is expected that the higher the nitrogen concentration in the natural gas is,
the higher the nitrogen mole percentage in the F-T tail gas is.
As the worst case described in Table 8, the nitrogen mole concentration is considered as
4% and other constituents are normalized. In this condition, the nitrogen constituent of the fluid
upstream of F-T reactor is shown in Figure 18.
Figure 18 Nitrogen compound buildup on upstream F-T process flow
The nitrogen mole percentage rises considerably at low tail gas fraction, which is consistent
with the graph in Figure 18. Based on the ‘soft maximum’ specification of nitrogen flow, 15 %, 30
around 0.05 or above for tail gas fraction is acceptable. Moreover, it is preferred to set the tail gas

40
fraction as high as possible.30 Reducing the nitrogen mole percentage enables to downsize
equipment in the GTL plant.
6.4 The evacuation route of nitrogen
In addition to the nitrogen concentration in natural gas, the GTL plant configuration is the
other factor that increases nitrogen flow. Since nitrogen comes into the GTL plant with other
natural gas compositions, a discharging route is required. Originally, the F-T tail gas path
expressed as the dotted line in Figure 19 is a route through which inert gases go out of the GTL
plant. However, it becomes a close loop when all tail gas is recycled. The loop cannot serve to
evacuate nitrogen. Instead, the nitrogen is emitted to atmosphere through other routes illustrated
in the Figure 19.
Figure 19 Nitrogen gas flow diagram

41
According to Figure 19, three (3) pathways still exist when F-T tail gas is fully recycled.
However, two (2) lines from the syncrude upgrading process are not effective for the evacuation.
The underlying reason is that heavier hydrocarbons are main constituents of the fluid transferred
from the F-T process to the syncrude upgrading process. Instead of these lines, the discharge line
for the PSA tail gas undertakes the role.
Figure 20 The steps to calculate nitrogen flow in main stream1
While the PSA tail gas line prevents the worst scenario that no route exists for evacuation,
the issue is not resolved completely. It results in the accumulation of nitrogen concentration in the
syngas production process and the F-T process. The three steps to calculate the nitrogen
concentration are described in Figure 20. In the first step, hydrogen required by the syncrude
upgrading process is defined. Then the hydrogen determines the flow in the branch line for the
PSA unit. By using this flow, the nitrogen mole fraction in the main stream is calculated in the last

42
step. These steps imply the evacuation is executed indirectly. In other words, it is unavoidable to
resolve this issue under the current configuration.
In summary, the role of the F-T tail gas route as evacuation is essential to stop increasing
nitrogen gas flow. It is difficult to take over the role to other existing routes. At least, a part of the
F-T tail gas should be evacuated from the GTL process in order to minimize the impact on
equipment sizing. For process integration, this factor is one constraint that limits the adjustment
of the tail gas fraction.
6.5 The review of power plant fuel compositions
In the GTL plant, the range of the tail gas fraction is restricted due to nitrogen buildup.
Likewise, the power plant has the issue on fuel compositions that hinder process integration. The
gas turbine, one of main equipment in the combined cycle power plant, requires to follow standards
given by gas turbine manufacturers. Thus, it is necessary to analyze blended fuel compositions and
confirm it complies with the requirement.
The power plant fuel is the mixture of the F-T tail gas and the natural gas. The power plant
receives this mixture except the case that either F-T tail gas or the natural gas is supplied. Figure
21 and Figure 22 present the compositions of blended fuel.

43
Figure 21 Blended fuel composition (hydrocarbons)
In Figure 21, methane mole fraction is the highest at zero (0) tail gas fraction whereas it is
the lowest at one (1) tail gas fraction. It results from that the concentration of methane in the natural
gas is much higher than that in the F-T tail gas. The reason that the graph for methane is not a
straight line but a curve is that the slope of tail gas flow is steeper than that of natural gas, which
is described in Figure 22. Likewise, the graph for ethane is not linear. Ethane also goes down as
natural gas flow rate increases. On the other hand, propane and C4+ hydrocarbons have opposite
trends, which are derived from the origin of the compositions. The propane is mostly from the F-
T tail gas. All C4+ hydrocarbons are from the F-T tail gas.
0.00%
0.50%
1.00%
1.50%
2.00%
2.50%
3.00%
3.50%
4.00%
4.50%
0%
20%
40%
60%
80%
100%
120%
0 0.1 0.2 0.3 0.4 0.5 0.6 0.7 0.8 0.9 1
Oth
er c
onst
ituen
ts (
mo
l %
)
Met
han
e C
onst
ituen
ts (
mo
l %
)
Tail gas fraction to power plant
Blended Fuel Composition for Power Plant (hydrocarbons)
Methane Ethane Propane C4+

44
Figure 22 Blended fuel flow (mol basis)
According to Figure 23, the graphs of hydrogen and carbon monoxide are similar with
those of propane and C4+ hydrocarbons. However, their variations are quite different. Even the
hydrogen and carbon monoxide account for 95% of the tail gas flow when tail gas fraction is one.
Figure 23 blended fuel composition (H2, CO and inert gases)
0
1000
2000
3000
4000
5000
6000
0 0.2 0.4 0.6 0.8 1
Mo
le F
low
Rat
e (l
b/h
r)
Tail Gas Fraction to Power Plant
Blended fuel flow (mol basis)
Natural Gas Tail Gas
0.00%
0.10%
0.20%
0.30%
0.40%
0.50%
0.60%
0.70%
0.80%
0%
20%
40%
60%
80%
100%
120%
0 0.2 0.4 0.6 0.8 1
Inte
rt g
ases
(m
ol
%)
Co
nst
ituen
ts (
mo
l %
)
Tail gas fraction to power plant
Blended Fuel Composition for Power Plant
(H2, CO and inert gases)
H2 CO Inert gases (N2+CO2)

45
When it comes to inert gases, it reaches the highest point when tail gas fraction is around
0.02, and it starts to decrease after the peak. When tail gas fraction is very low, the trend of this
graph is due to the nitrogen flow rate in tail gas. In Figure 24, the inclination of nitrogen flow rate
in tail gas is comparable to that of other compositions’ flow rates. However, the inert gas mole
fraction in blended gas at peak is small because it is mixed with large amount of natural gas. After
the peak, the inert gases mole percentage decreases because the flows of other components in tail
gas keep increasing. Moreover, the increase rate of nitrogen mole flow is lower than that of other
components’ mole flow. For these reasons, the nitrogen mole percentage on the blended gas is
negligible throughout the range of the tail gas fraction. In addition to the nitrogen, carbon dioxide
is small enough to be neglected.
Figure 24 The composition of F-T tail gas supplied to power plant (mol basis)
0
0.5
1
1.5
2
2.5
3
3.5
4
4.5
5
0
1000
2000
3000
4000
5000
6000
0 0.1 0.2 0.3 0.4 0.5 0.6 0.7 0.8 0.9 1
Nit
rogen
mo
le f
low
(lb
mo
l/hr)
Mo
le f
low
(lb
mo
l/hr)
Tail gas fraction to power plant
The composition of tail gas supplied to power plant (mol basis)
Tail Gas_Total CO CO2 H2O H2 C1 N2

46
6.6 Modified wobbe index variation from fuel blending
Modified wobbe index (MWI) is one of the most important parameters on a gas turbine. It
should be within an allowable range for the gas turbine to accommodate fuel variation. The MWI
formula is expressed as Equation 7).40
MWI = 𝐿𝐻𝑉
√𝑇 ×𝑆𝑝𝑒𝑐𝑖𝑓𝑖𝑐 𝐺𝑟𝑎𝑣𝑖𝑡𝑦=
𝐿𝐻𝑉
√𝑇 ×𝑀𝑊𝑓𝑢𝑒𝑙
28.96
…………………………………...……… Equation 7)
Equation 7) indicates that the MWI relies on three properties: fuel temperature, lower
heating value (LHV) and molecular weight (MW). The fuel temperature is fixed in this study. On
the contrary, both the MW and the LHV are calculated based on the property of each fuel
composition, which is referred from ASTM D 3588. Blending the natural gas and the F-T tail gas
leads to the change of both properties, which requires to confirm MWI values are within allowable
MWI ranges of gas turbines. The allowable MWI ranges are specified in Table 10.56, 71
Gas turbine 7E.03 7F.04 7F.05, 7F.06 7HA.01, 7HA.02
MWI variation ±30% +20%, -10% (5ppm NOx) ±7.5% ±10%
Table 10 The allowable MWI ranges
Among gas turbines specified in Table 10, the 7E.03 gas turbine has the widest MWI
range. In other words, it is adequate to cover fuel variation compared to other gas turbines. For
this reason, the 7E.03 gas turbine is selected for the following analysis.

47
Figure 25 Modified wobbe index of blended fuel (with 7E.03 variation)
The plots for the MWI range is presented in Figure 25. When it comes to molecular weight,
it goes down when the tail gas fraction increases. It is caused by the fact that the molecular weight
of the F-T tail gas is lower than that of the natural gas. Modified wobbe index also decreases as
tail gas fraction goes up despite the trend of the molecular weight. This result implies that the effect
of the lower heating value is much more than that of the molecular weight for modified wobbe
index calculation. From the graph of MWI variation, it is confirmed that the 7E.03 gas turbine
allows the adjustment of the tail gas fraction from around 0.19 to 1.

48
6.7 The result of process integration with constraints
The two issues, nitrogen buildup and MWI limitation, create constraints that restrict
process integration. With these constraints, the result of the process integration is illustrated in
Figure 26.
Figure 26 Process integration result with constraints
Originally, the F-T tail gas is freely distributed to two discrete plants by selecting any tail
gas fraction value. However, the allowable range of F-T tail gas distribution is limited by the
constraints derived from both the GTL plant and the power plant. Between two constraints, the
constraint from the power plant regarding modified wobbe index range limit is stricter than the
other constraint from the GTL plant. Thus, the MWI limit defines the allowable range of the tail
gas fraction.

49
Within the allowable range, any value of the tail gas fraction can be selected. However, it
There is a tradeoff among power output, utility consumption and nitrogen compound buildup,
which is summarized in Table 11.
Tail gas fraction (to a power plant) Low High
Power output ↑ ↓
Steam and oxygen consumption ↓ ↑
Nitrogen compound buildup ↑ ↓
Table 11 Trade-off among power output, utility consumption and nitrogen buildup

50
7. CONCLUSION AND DISCUSSION
Through this study, it is confirmed that process integration of a GTL plant and a power
plant is feasible within the constraints. Despite the constraints from both plants, the integrated
plant still has the allowable range to control F-T tail gas fraction. Since each tail gas fraction value
has pros and cons in the perspective of power output, utility consumption and nitrogen buildup, it
is necessary to analyze the effect of the adjustment to decide the extent of flexibility.
In addition to the result of the simulation, remaining issues are described as follows:
• The 7E.03 gas turbine is a suitable model for process integration because it has the widest
range of MWI. However, its capacity is not sufficient to be integrated with a large-scale
GTL plant. Improving fuel-flexibility on large capacity gas turbines is necessary.72
• In case of diffusion type combustors, they have several methods such as steam injection,
nitrogen injection and SCR to reduce NOx emission.73, 74 Since each method needs a
relevant utility source, the utility consumption of a power plant should be considered. In
case of NOx abatement with the nitrogen injection, the air separation unit of a GTL plant
for pure oxygen generation can provide high concentration nitrogen gas to the power plant.
• In the simulation model, all off gases including PSA tail gas, separator tail gas and light
gas are discharged to the atmosphere except F-T tail gas. The purpose of this setting is to
focus on F-T tail gas utilization. However, it is not reasonable in terms of energy
sustainability. The utilization of the off gases in a power plant can increase power output.
• F-T tail gas has heavy hydrocarbon contents. If they are not acceptable to a gas turbine, tail
gas treatment system should be prepared.

51
• If nitrogen gas buildup in a GTL process reduces the partial pressure of syngas, reaction
rate in F-T synthesis process can be affected negatively.32 It can be one reason that the
nitrogen gas buildup should be minimized. If the minimum allowable F-T tail gas fraction
from a GTL plant is higher than that from a power plant, the allowable range for integrated
plant operation will decrease.

52
REFERENCES
1. Gabriel, K. J.; Linke, P.; Jimenez-Gutierrez, A.; Martínez, D. Y.; Noureldin, M.; El-
Halwagi, M. M., Targeting of the water-energy nexus in gas-to-liquid processes: A comparison of
syngas technologies. Industrial & Engineering Chemistry Research 2014, 53 (17), 7087-7102.
2. Fleisch, T.; Sills, R.; Briscoe, M., A review of global GTL developments. journal of
natural gas chemistry 2002, 11, 1-14.
3. Sieminski, A. In International Energy Outlook. Energy Information Administration (EIA),
2014.
4. Shell SHELL WILL NOT PURSUE US GULF COAST GTL PROJECT.
https://www.shell.com/media/news-and-media-releases/2013/shell-will-not-pursue-us-gulf-coast-
gtl-project.html#vanity-
aHR0cHM6Ly93d3cuc2hlbGwuY29tL2dsb2JhbC9hYm91dHNoZWxsL21lZGlhL25ld3MtYW5
kLW1lZGlhLXJlbGVhc2VzLzIwMTMvc2hlbGwtd2lsbC1ub3QtcHVyc3VlLXVzLWd1bGYtY
29hc3QtZ3RsLXByb2plY3QuaHRtbA (accessed January 16th, 2018).
5. Sasoal SASOL UNVEILS STRATEGY TO DRIVE FUTURE VALUE-BASED
GROWTH. http://www.sasol.com/media-centre/media-releases/sasol-unveils-strategy-drive-
future-value-based-growth (accessed January 16th, 2018).
6. Wood, D. A.; Nwaoha, C.; Towler, B. F., Gas-to-liquids (GTL): A review of an industry
offering several routes for monetizing natural gas. Journal of Natural Gas Science and
Engineering 2012, 9, 196-208.
7. Martínez, D. Y.; Jimenez-Gutierrez, A.; Linke, P.; Gabriel, K. J.; Noureldin, M. M.; El-
Halwagi, M. M., Water and energy issues in gas-to-liquid processes: assessment and integration

53
of different gas-reforming alternatives. ACS Sustainable Chemistry & Engineering 2013, 2 (2),
216-225.
8. Wilhelm, D.; Simbeck, D.; Karp, A.; Dickenson, R., Syngas production for gas-to-liquids
applications: technologies, issues and outlook. Fuel processing technology 2001, 71 (1-3), 139-
148.
9. Cho, W.; Song, T.; Mitsos, A.; McKinnon, J. T.; Ko, G. H.; Tolsma, J. E.; Denholm, D.;
Park, T., Optimal design and operation of a natural gas tri-reforming reactor for DME synthesis.
Catalysis Today 2009, 139 (4), 261-267.
10. Majewski, A. J.; Wood, J., Tri-reforming of methane over Ni@ SiO2 catalyst.
International Journal of Hydrogen Energy 2014, 39 (24), 12578-12585.
11. Noureldin, M. M.; Elbashir, N. O.; El-Halwagi, M. M., Optimization and selection of
reforming approaches for syngas generation from natural/shale gas. Industrial & Engineering
Chemistry Research 2013, 53 (5), 1841-1855.
12. Barbieri, G.; Violante, V.; Di Maio, F. P.; Criscuoli, A.; Drioli, E., Methane steam
reforming analysis in a palladium-based catalytic membrane reactor. Industrial & engineering
chemistry research 1997, 36 (8), 3369-3374.
13. Sehested, J., Four challenges for nickel steam-reforming catalysts. Catalysis Today 2006,
111 (1-2), 103-110.
14. Hickman, D.; Schmidt, L., Production of syngas by direct catalytic oxidation of methane.
science 1993, 259 (5093), 343-346.
15. Ghoneim, S. A.; El-Salamony, R. A.; El-Temtamy, S. A., Review on innovative catalytic
reforming of natural gas to syngas. World Journal of Engineering and Technology 2015, 4 (01),
116.

54
16. Bao, B.; El-Halwagi, M. M.; Elbashir, N. O., Simulation, integration, and economic
analysis of gas-to-liquid processes. Fuel Processing Technology 2010, 91 (7), 703-713.
17. Bharadwaj, S.; Schmidt, L., Catalytic partial oxidation of natural gas to syngas. Fuel
processing technology 1995, 42 (2-3), 109-127.
18. Al-Douri, A.; Sengupta, D.; El-Halwagi, M. M., Shale gas monetization–A review of
downstream processing to chemicals and fuels. Journal of Natural Gas Science and Engineering
2017, 45, 436-455.
19. Vosloo, A. C., Fischer–Tropsch: a futuristic view. Fuel processing technology 2001, 71 (1-
3), 149-155.
20. Moodley, D.; Van De Loosdrecht, J.; Saib, A.; Niemantsverdriet, H., The formation and
influence of carbon on cobalt-based Fischer-Tropsch synthesis catalysts. Advances in Fischer-
Tropsch synthesis, catalysts, and catalysis 2010.
21. Ross, J.; Van Keulen, A.; Hegarty, M.; Seshan, K., The catalytic conversion of natural gas
to useful products. Catalysis Today 1996, 30 (1-3), 193-199.
22. Raju, A. S.; Park, C. S.; Norbeck, J. M., Synthesis gas production using steam
hydrogasification and steam reforming. Fuel Processing Technology 2009, 90 (2), 330-336.
23. Minutillo, M.; Perna, A., A novel approach for treatment of CO2 from fossil fired power
plants. Part B: The energy suitability of integrated tri-reforming power plants (ITRPPs) for
methanol production. international journal of hydrogen energy 2010, 35 (13), 7012-7020.
24. Murmura, M.; Diana, M.; Spera, R.; Annesini, M., Modeling of autothermal methane steam
reforming: Comparison of reactor configurations. Chemical Engineering and Processing: Process
Intensification 2016, 109, 125-135.

55
25. Dry, M. E., The fischer–tropsch process: 1950–2000. Catalysis today 2002, 71 (3-4), 227-
241.
26. Riedel, T.; Claeys, M.; Schulz, H.; Schaub, G.; Nam, S.-S.; Jun, K.-W.; Choi, M.-J.;
Kishan, G.; Lee, K.-W., Comparative study of Fischer–Tropsch synthesis with H2/CO and
H2/CO2 syngas using Fe-and Co-based catalysts. Applied Catalysis A: General 1999, 186 (1-2),
201-213.
27. Kim, S.-M.; Bae, J. W.; Lee, Y.-J.; Jun, K.-W., Effect of CO2 in the feed stream on the
deactivation of Co/γ-Al2O3 Fischer–Tropsch catalyst. Catalysis Communications 2008, 9 (13),
2269-2273.
28. Patzlaff, J.; Liu, Y.; Graffmann, C.; Gaube, J., Studies on product distributions of iron and
cobalt catalyzed Fischer–Tropsch synthesis. Applied Catalysis A: General 1999, 186 (1-2), 109-
119.
29. De Klerk, A., Fischer-tropsch refining. John Wiley & Sons: 2012.
30. Boerrigter, H.; Calis, H. P.; Slort, D. J.; Bodenstaff, H., Gas cleaning for integrated biomass
gasification (BG) and Fischer-Tropsch (FT) systems; experimental demonstration of two BG-FT
systems. Acknowledgement/Preface 2004, 51.
31. Lu, Y.; Lee, T., Influence of the feed gas composition on the Fischer-Tropsch synthesis in
commercial operations. Journal of Natural Gas Chemistry 2007, 16 (4), 329-341.
32. Kuntze, T. In From natural gas to liquid hydrocarbons. Part 3. Kinetics of the Fischer-
Tropsch synthesis using a nitrogen-rich synthesis gas, Fuel and Energy Abstracts, 1995; p 416.
33. Jess, A.; Hedden, K.; Popp, R., Diesel Oil from Natural Gas by Fischer‐Tropsch Synthesis
Using Nitrogen‐Rich Syngas. Chemical Engineering & Technology: Industrial Chemistry‐Plant
Equipment‐Process Engineering‐Biotechnology 2001, 24 (1), 27-31.

56
34. Jess, A.; Popp, R.; Hedden, K., Fischer–Tropsch-synthesis with nitrogen-rich syngas:
fundamentals and reactor design aspects. Applied Catalysis A: General 1999, 186 (1-2), 321-342.
35. Baumgärtner, M.; Sattelmayer, T., Improvement of the turn-down ratio of gas turbines by
autothermal on board syngas generation. Journal of the Global Power and Propulsion Society
2017, 1, D0HPA5.
36. Chacartegui, R.; Sánchez, D.; de Escalona, J. M.; Muñoz, A.; Sánchez, T., Gas and steam
combined cycles for low calorific syngas fuels utilisation. Applied energy 2013, 101, 81-92.
37. Asai, T.; Miura, K.; Akiyama, Y.; Karishuku, M.; Yunoki, K.; Dodo, S.; Horii, N. In
Development Of Fuel-Flexible Gas Turbine Combustor, Proceedings of the 45th Turbomachinery
Symposium, Turbomachinery Laboratories, Texas A&M Engineering Experiment Station: 2016.
38. Chacartegui, R.; Sánchez, D.; de Escalona, J. M.; Jimenez-Espadafor, F.; Munoz, A.;
Sánchez, T., SPHERA project: Assessing the use of syngas fuels in gas turbines and combined
cycles from a global perspective. Fuel processing technology 2012, 103, 134-145.
39. Wright, I. G.; Gibbons, T., Recent developments in gas turbine materials and technology
and their implications for syngas firing. International Journal of Hydrogen Energy 2007, 32 (16),
3610-3621.
40. Campbell, A.; Goldmeer, J.; Healy, T.; Washam, R.; Molière, M.; Citeno, J. In Heavy duty
gas turbines fuel flexibility, ASME Turbo Expo 2008: Power for Land, Sea, and Air, American
Society of Mechanical Engineers: 2008; pp 1077-1085.
41. Payrhuber, K.; Jones, R. M.; Scholz, M. H. In Gas turbine flexibility with carbon
constrained fuels, ASME Turbo Expo 2008: Power for Land, Sea, and Air, American Society of
Mechanical Engineers: 2008; pp 937-943.

57
42. Brdar, R. D.; Jones, R. M., GE IGCC technology and experience with advanced gas
turbines. GE Power Systems, Schenectady, NY, Paper No. GER-4207 2000.
43. Gadde, S.; Wu, J.; Gulati, A.; McQuiggan, G.; Koestlin, B.; Prade, B. In Syngas capable
combustion systems development for advanced gas turbines, ASME Turbo Expo 2006: Power for
Land, Sea, and Air, American Society of Mechanical Engineers: 2006; pp 547-554.
44. Kehlhofer, R.; Hannemann, F.; Rukes, B.; Stirnimann, F., Combined-cycle gas & steam
turbine power plants. Pennwell Books: 2009.
45. Srivatsan, J. S.; Amani, M., Feasibility study of using excess heat from GTL process for
seawater desalination. Energy and Environment Research 2012, 2 (1), 182.
46. Gas-To-Liquid (GTL) Technology Assessment in support of AEO2013.
https://www.eia.gov/outlooks/documentation/workshops/pdf/AEO2013_GTL_Assessment.pdf
(accessed June 1st, 2018).
47. Aasberg-Petersen, K.; Nielsen, C. S.; Dybkjær, I.; Perregaard, J., Large scale methanol
production from natural gas. Haldor Topsoe 2008, 22.
48. Aasberg-Petersen, K.; Dybkjær, I.; Ovesen, C.; Schjødt, N.; Sehested, J.; Thomsen, S.,
Natural gas to synthesis gas–catalysts and catalytic processes. Journal of Natural gas science and
engineering 2011, 3 (2), 423-459.
49. Tristantini, D.; Lögdberg, S.; Gevert, B.; Borg, Ø.; Holmen, A., The effect of synthesis gas
composition on the Fischer–Tropsch synthesis over Co/γ-Al2O3 and Co–Re/γ-Al2O3 catalysts.
Fuel processing technology 2007, 88 (7), 643-649.
50. Tsakoumis, N. E.; Voronov, A.; Rønning, M.; van Beek, W.; Borg, Ø.; Rytter, E.; Holmen,
A., Fischer–Tropsch synthesis: An XAS/XRPD combined in situ study from catalyst activation to
deactivation. Journal of catalysis 2012, 291, 138-148.

58
51. Dry, M. E., High quality diesel via the Fischer–Tropsch process–a review. Journal of
Chemical Technology and Biotechnology 2002, 77 (1), 43-50.
52. Kim, Y. H.; Jun, K.-W.; Joo, H.; Han, C.; Song, I. K., A simulation study on gas-to-liquid
(natural gas to Fischer–Tropsch synthetic fuel) process optimization. Chemical Engineering
Journal 2009, 155 (1-2), 427-432.
53. Gabriel, K. J.; Noureldin, M.; El-Halwagi, M. M.; Linke, P.; Jiménez-Gutiérrez, A.;
Martínez, D. Y., Gas-to-liquid (GTL) technology: Targets for process design and water-energy
nexus. Current Opinion in Chemical Engineering 2014, 5, 49-54.
54. de Klerk, A., Fischer–Tropsch refining: technology selection to match molecules. Green
Chemistry 2008, 10 (12), 1249-1279.
55. Dancuart, L.; De Haan, R.; De Klerk, A., Processing of primary Fischer-Tropsch products.
In Studies in Surface Science and Catalysis, Elsevier: 2004; Vol. 152, pp 482-532.
56. GEA32932 7E Power Plants - GE.com. https://www.ge.com/content/dam/gepower-
pgdp/global/en_US/documents/product/gas%20turbines/Fact%20Sheet/2018-prod-specs/7E-
power-plants.pdf (accessed June 1st, 2018).
57. Jonsson, M.; Bolland, O.; Bücker, D.; Rost, M., Gas turbine cooling model for evaluation
of novel cycles. Proceedings of ECOS 2005, 20-22.
58. Kim, T.; Ro, S., Power augmentation of combined cycle power plants using cold energy of
liquefied natural gas. Energy 2000, 25 (9), 841-856.
59. Thattai, A. T.; Wittebrood, B.; Woudstra, T.; Geerlings, J.; Aravind, P., Thermodynamic
system studies for a natural gas combined cycle (NGCC) plant with CO2 capture and hydrogen
storage with metal hydrides. Energy Procedia 2014, 63, 1996-2007.

59
60. Kim, T., Comparative analysis on the part load performance of combined cycle plants
considering design performance and power control strategy. Energy 2004, 29 (1), 71-85.
61. Casarosa, C.; Donatini, F.; Franco, A., Thermoeconomic optimization of heat recovery
steam generators operating parameters for combined plants. Energy 2004, 29 (3), 389-414.
62. Arrieta, F. R. P.; Lora, E. E. S., Influence of ambient temperature on combined-cycle
power-plant performance. Applied Energy 2005, 80 (3), 261-272.
63. Ion, D.; Codrut, P., Efficiency Assessment of Condensing Steam Turbine. Advances in
Environment, Ecosystems and Sustainable Tourism 2013, 203e208.
64. Christian M. Gomes, W. L. R. G. In Modeling part-load performance of a gas turbine,
Proceedings of COBEM 2003, Sao Paulo, SP, Sao Paulo, SP, 2003.
65. Johnson, M. S., Prediction of gas turbine on-and off-design performance when firing coal-
derived syngas. Journal of engineering for gas turbines and power 1992, 114 (2), 380-385.
66. Razak, A., Industrial gas turbines: performance and operability. Elsevier: 2007.
67. Sánchez, D.; Chacartegui, R.; Munoz, J.; Muñoz, A.; Sanchez, T., Performance analysis of
a heavy duty combined cycle power plant burning various syngas fuels. international journal of
hydrogen energy 2010, 35 (1), 337-345.
68. Oluyede, E. O.; Phillips, J. N. In Fundamental impact of firing syngas in gas turbines,
ASME Turbo Expo 2007: Power for Land, Sea, and Air, American Society of Mechanical
Engineers: 2007; pp 175-182.
69. He, F.; Li, Z.; Liu, P.; Ma, L.; Pistikopoulos, E. N., Operation window and part-load
performance study of a syngas fired gas turbine. Applied energy 2012, 89 (1), 133-141.
70. Foss, M. M.; Head, C., Interstate Natural Gas--Quality Specifications & Interchangeability.
Center for Energy Economics, Bureau of Economic Geology, University of Texas at Austin 2004.

60
71. GE Power 2016 Product catalog.
https://powergen.gepower.com/content/dam/gepowerpgdp/global/en_US/documents/product/201
6-gas-powersystems-products-catalog.pdf (accessed June 1st, 2018).
72. Jones, R.; Goldmeer, J.; Monetti, B., Addressing gas turbine fuel flexibility. GE Energy
Report GER4601 rev. B, October 2011, 29, 2012.
73. Forzatti, P., Present status and perspectives in de-NOx SCR catalysis. Applied catalysis A:
general 2001, 222 (1-2), 221-236.
74. Chiesa, P.; Lozza, G.; Mazzocchi, L. In Using hydrogen as gas turbine fuel, ASME Turbo
Expo 2003, collocated with the 2003 International Joint Power Generation Conference, American
Society of Mechanical Engineers: 2003; pp 163-171.