Embed Size (px)
Citation preview

ACTAUNIVERSITATIS
UPSALIENSISUPPSALA
2017
Digital Comprehensive Summaries of Uppsala Dissertationsfrom the Faculty of Pharmacy 228
Process-induced disorder ofpharmaceutical materials
Mechanisms and quantification of disorder
SAMANEH PAZESH
ISSN 1651-6192ISBN 978-91-554-9860-3urn:nbn:se:uu:diva-317801

Dissertation presented at Uppsala University to be publicly examined in B22, BMC,Husargatan 3, Uppsala, Friday, 12 May 2017 at 09:15 for the degree of Doctor of Philosophy.The examination will be conducted in Swedish. Faculty examiner: Professor Niklas Sandler.
AbstractPazesh, S. 2017. Process-induced disorder of pharmaceutical materials. Mechanisms andquantification of disorder. Digital Comprehensive Summaries of Uppsala Dissertationsfrom the Faculty of Pharmacy 228. 69 pp. Uppsala: Acta Universitatis Upsaliensis.ISBN 978-91-554-9860-3.
One of the most important prerequisites in the drug development is to attain a reproducibleand robust product in terms of its nature, and its chemical and physical properties. This can bechallenging, since the crystalline form of drugs and excipients can be directly transformed intothe amorphous one during normal pharmaceutical processing, referred to as process-inducedamorphisation or process-induced disorder. The intention of this thesis was to address themechanisms causing disorder during powder flow and milling and, in association with this, toevaluate, the ability of Raman spectroscopy and atomic force microscopy (AFM) to quantifyand characterize process-induced disorder.
The amorphisation mechanisms were controlled by stress energy distribution duringprocessing, which in turn was regulated by a series of process parameters. Compression andshearing stress caused by sliding were stress types that acted on the particles during powderflow and ball milling process. However, sliding was the most important inter-particulate contactprocess giving rise to amorphisation and the transformation was proposed to be caused byvitrification. The plastic stiffness and elastic stiffness of the milling-induced particles weresimilar to a two-state particle model, however the moisture sorption characteristics of theseparticles were different. Thus the milled particles could not be described solely by a two-stateparticle model with amorphous and crystalline domains.
Raman spectroscopy proved to be an appropriate and effective technique in the quantificationof the apparent amorphous content of milled lactose powder. The disordered content below1% could be quantified with Raman spectroscopy. AFM was a useful approach to characterizedisorder on the particle surfaces.
In summary, this thesis has provided insight into the mechanisms involved in process-inducedamorphisation of pharmaceutical powders and presented new approaches for quantification andcharacterization of disordered content by Raman spectroscopy and atomic force microscopy.
Keywords: Milling, Comminution, Powder flow, Amorphisation, Raman spectroscopy,Atomic force microscopy, Plastic stiffness, Elastic stiffness
Samaneh Pazesh, Department of Pharmacy, Box 580, Uppsala University, SE-75123 Uppsala,Sweden.
© Samaneh Pazesh 2017
ISSN 1651-6192ISBN 978-91-554-9860-3urn:nbn:se:uu:diva-317801 (http://urn.kb.se/resolve?urn=urn:nbn:se:uu:diva-317801)

To my mother and to the memory of my father

...Perfection is a gift, few can boast they possess it And most of you, my dear particles, don't!

List of Papers
This thesis is based on the following papers, which are referred to in the text by their Roman numerals.
I Pazesh, S., Heidarian Höckerfelt, M., Bramer, T., Berggren, J.,
Alderborn G. Mechanism of amorphisation of micro-particles of griseofulvin during powder flow in a mixer. Journal of Phar-maceutical Sciences, (2013), 102 (11): 4036-4045.
II Pazesh, S., Gråsjö, J., Berggren, J., Alderborn G. Comminu-tion-amorphisation relationships during ball milling of lactose at different stress energies, Manuscript submitted.
III Pazesh, S., Persson, A.-S., Berggren, J., Alderborn G. Influence of degree of disorder on the Heckel yield pressure: a compari-son between milled and physical mixtures of lactose, In manu-script.
IV Pazesh, S., Lazorova, L., Berggren, J., Alderborn G. Gråsjö, J. Considerations on the quantitative analysis of apparent amor-phicity of milled lactose by Raman spectroscopy. International Journal of Pharmaceutics, (2016), 511(1): 488-504.
V Badal Tejedor, M., Nordgren, N., Schuleit, M., Pazesh, S., Alderborn G., Millqvist-Fureby, A., Rutland, M. W. Determina-tion of interfacial amorphicity in functional powders. Langmuir, (2017), 33(4): 920-926.
Reprints were made with permission from the respective publishers. I was highly involved in the planning, study design, experimental work, data analysis and writing of paper I- IV. However, I did not perform the devel-opment of spectral treatment for quantification of amorphous fraction in paper IV. I was involved in planning, study design and partly involved in experimental work and data analysis in paper V. I did not perform the atomic force microscopy experiments and the calculation of dissipations data.


Contents
Introduction ................................................................................................... 11
Chapter 1 ...................................................................................................... 13 Pharmaceutical solids ............................................................................... 13
Crystalline solid ................................................................................... 13 Partially disordered solid ..................................................................... 14 Amorphous solid .................................................................................. 14
Moisture sorption characteristics of solid ................................................ 15
Chapter 2 ...................................................................................................... 17 Disorder in pharmaceuticals ..................................................................... 17
Melt- and fluid-mediated amorphisation ............................................. 18 Mechanical activation .............................................................................. 19
Milling-induced disorder ..................................................................... 20 Planetary ball mill ................................................................................ 20 Dry mixing ........................................................................................... 23
The mechanisms of mechanical-induced disorder ................................... 23 Types of particle stresses .......................................................................... 24
Chapter 3 ...................................................................................................... 25 Quantification and characterisation of disorder ....................................... 25
Raman spectroscopy ............................................................................ 26 X-ray powder diffraction ..................................................................... 29 Calorimetry .......................................................................................... 30 Atomic force microscopy .................................................................... 32
Chapter 4 ...................................................................................................... 33 The thesis in the perspective of pertinent research ................................... 33 Aims of the thesis ..................................................................................... 34
Chapter 5 ...................................................................................................... 35 Experimental methods .............................................................................. 35 Particle characterisation ........................................................................... 35
Size distribution ................................................................................... 35 Morphology ......................................................................................... 36 External particle specific surface area ................................................. 36 Apparent density .................................................................................. 36

Mechanical characteristics ....................................................................... 37 The Heckel model and plastic stiffness ............................................... 37 Elasticity .............................................................................................. 38
Chapter 6 ...................................................................................................... 40 Results and discussion .............................................................................. 40 Process-induced disorder .......................................................................... 40
Powder flow-induced disorder ............................................................ 40 Milling-induced disorder .................................................................... 43
Mechanical characteristics ....................................................................... 46 Methodology development for quantification and characterisation of process-induced disorder .......................................................................... 48
Quantification of disorder by Raman spectroscopy ............................ 48 Characterisation of disorder by AFM ................................................. 52
Conclusions ................................................................................................... 56
Future perspective ......................................................................................... 58
Populärvetenskaplig sammanfattning ........................................................... 59 Processinducerad oordning....................................................................... 59
Acknowledgements ....................................................................................... 61
References ..................................................................................................... 63

Abbreviations
AFM Atomic force microscopy BPM Ball-to-powder mass ratio CLS Classical least square analysis DVS Dynamic vapour sorption DSC Differential scanning calorimetry
Distance between the planes in the crystal Elastic modulus
Elastic recovery EMSC Extended multiple scattering correction IGC Inverse gas chromatography ℎ Height under decompression ℎ0
Height at maximum pressure MTDSC Modulated temperature differential scanning calorimetry
Compression pressure Maximum pressure
Yield pressure PCA Principal component analysis PLS Partial least square regression RH Relative humidity SEM Scanning electron microscopy ss-NMR Solid state nuclear magnetic resonance SNV Standard normal variate Tm Melting temperature Tg Glass transition temperature XRPD X-ray powder diffraction
Diffraction angle Powder bed porosity Order of reflection Wavelength


11
Introduction
Solid-dosage manufacturing involves a range of processing techniques to take a drug candidate and excipients through to a finished dosage form. For development of a stable pharmaceutical formulation, information on the characteristics and the physical nature of solid is required. Typically, drug and excipients enter the pharmaceutical development process in a crystalline state, which tends to ensure a high level of purity and stability, particularly if the crystal is in its most thermodynamically stable form. However, the crys-talline form of drugs and excipients can unintentionally be transformed to the disordered state (amorphous) during processing. The loss of crystallinity induced by processing is known as process-induced disorder or mechanical activation/amorphisation.
The disordered solid is thermodynamically and structurally unstable owing to the disruption of the molecular arrangement of the solid, displaying an increased enthalpy and Gibbs free energy compared to the corresponding crystals. The formation of a thermodynamically unstable disordered fraction during processing may influence the physical and chemical properties [1, 2] of the drugs and excipients and have undesired consequences for the stability of the eventual product. Hence, a thorough understanding of both the drug and the processing technique are required for optimization.
In the past decade, quality-by-design (QbD) has entailed a new focus on the understanding of the raw material, its formulation and the processing param-eters that impact the quality of the pharmaceutical products. Regularity is-sues require that the solid state of a drug substance is monitored during the various stages of product development [3].
The intentional use of disordered solid can be of great interest in the phar-maceutical formulation owing to the beneficial formulation properties of this form, such as increased powder compactibility [4] and enhanced solubility and dissolution capabilities [5-7]. Whether the presence of a disordered frac-tion in pharmaceutical materials is intentional or unintentional, this may cause significant challenges in the processing, storage, and delivery of these materials. Thus, in order to prepare drugs with tailored formulation proper-ties, an understanding of the disordered solid is required. Such knowledge may aid in successful manufacturing and in obtaining a product with a re-

12
producible quality. Consequently, it is important to monitor and characterise the physical nature of the solid phase of the drug during the various steps of processing and development to ensure that a robust and safe formulation is produced. Different techniques may detect the disordered fraction of a solid differently, thereby potentially leading to different results in the determina-tion of the degree and the nature of disorder of a given solid. Current re-search in this area is focused on identification of the applicability of different techniques for quantifying low levels of disorder in the mechanically pro-cessed material. This thesis is intended to shed some light on the mechanisms involved in process-induced disorder and the inter-particulate contact processes that causing process-induced disorder of pharmaceutical powders. The physical nature of process-disordered particles and their mechanical properties are discussed. Moreover, two promising approaches are introduced for the measurement of the overall disordered content and the surface disorder. In the first chapter, some relevant basic concepts will be described. The fol-lowing two chapters focus on the disordering routes, mechanisms causing disorder and the techniques available to measure the disordered contents. In the last three chapters, a short review of current research and the experi-mental work performed in connection with this thesis will be presented, after which the main results of the five papers will be discussed. Finally the con-clusions of the thesis are summarized.

13
Chapter 1
Pharmaceutical solids Solid is one of the three classical states of matter. It is characterised by struc-tural rigidity and resistance to volume and shape change. The molecular solid can be classified into major categories based on the order of molecular packing, order (crystalline), partially disorder and disorder (amorphous), (Figure 1).
Figure 1. An illustration of the concept of molecular order in solids.
Crystalline solid
In a crystalline molecular solid, the molecules are arranged in an ordered and symmetrical pattern that is repeated throughout the entire crystal. Crystalline solids tend to have relatively sharp, well-defined melting points because the molecules have the same distance from their neighbours; that is, the regulari-ty of the crystalline lattice creates local environments that are the same prac-tically all over the crystalline solid. As a consequence of the repeat geomet-rical structure of the crystal, the intermolecular forces holding the solid to-gether are uniform and have equal strength. Thus the amount of thermal energy needed to break every interaction simultaneously is similar through-out the solid. A crystalline solid is thermodynamically stable and has quite distinct physical properties.

14
A crystalline molecular solid can exist in several sub-phases because of the different packing patterns, such as polymorphs, solvates or hydrates, salts and cocrystals. Crystalline polymorphs have the same chemical composition as one another, but different internal crystalline structure. Solvates or hy-drates, salts and cocrystals are similar in that they contain more than one type of molecule, one of which is the drug while the other can be a solvent, water, counterion or another crystalline solid, respectively forming solvates, hydrates, salts and cocrystals. The difference in packing pattern of crystal-line solids generally leads to different physicochemical properties, mechani-cal properties and other thermodynamic and kinetic properties (Table 1) [8].
Table 1. Properties that may vary depending on the molecular packing pattern of solid. Modified from [8].
Thermodynamic propertiesEnthalpy, entropy, heat capacity, melting/glass transition temperature, chemical poten-tial, thermodynamic activity, solubility
Kinetic propertiesDissolution rate, physical and chemical stability
Packing propertiesDensity, refractive index, conductivity, hygroscopicity
Mechanical propertiesHardness, tensile strength, compressibility, flowability
Surface propertiesSurface energy, interfacial tension
Partially disordered solid In a partially disordered solid, the molecules are arranged in a manner with less order than a crystalline solid, but not as much disorder as an amorphous solid, i.e. they have less long-range order than crystalline solids. An example of such a solid is a crystalline material containing imperfections or local disorder in the form of crystal defects. The presence of defects in the crystal-line solid yields a higher overall free energy of the molecules and greater molecular mobility, which give rise to a variety of physical properties [9]. Further, defective regions can serve as sites for the initiation of a variety of chemical reactions in the crystal. In these cases the rate of reactivity can be directly related to the defect density.
Amorphous solid
A non-crystalline solid is termed disordered or amorphous. Amorphous sol-ids are sometimes referred as super-cooled liquids and glasses owing to their random order molecular packing and absence of a repeating lattice pattern.

15
The symmetry of the long-range order that is characteristic of a crystal is lacking in an amorphous solid, but some local short-range order is retained [10]. As a result of the random arrangement of molecules in amorphous sol-ids, the distances of each molecule to its neighbours varies throughout a solid, and thus different amounts of thermal energy are needed to overcome these different interactions. Consequently, amorphous solids tend to soften slowly over a wide temperature range rather than having a well-defined melting point like a crystalline solid.
Amorphous solids can exist in two states, as a metastable super-cooled liq-uid, which is a viscous equilibrium liquid form of the solid, and as an unsta-ble glass, which is a solid non-equilibrium form of the same solid. The tem-perature at which one form converts to the other is called the glass transition temperature (Tg). The latter is an important characteristic of an amorphous material.
The amorphous solids are inherently unstable, consequently, the molecules in an amorphous solid strive to arrange into thermodynamically stable state i.e. to become crystalline through a recrystallisation process. The tempera-ture at which recrystallisation processes occur is called the crystallisation temperature. The excess enthalpy and entropy of the amorphous solids some-times reduce without recrystallisation. The phenomenon of an amorphous solid relaxing towards a lower energy state while the disordered form still remains is called relaxation. This relaxation behaviour can be seen as an indication that mobility is low below the Tg, but that it still exists [11].
From a formulation perspective, the use of amorphous solid is beneficial because of the increasing compactibility and dissolution rate of a compound. However, it is unfavourable to use amorphous solids because of their lower physical and chemical stability. Crystallization inhibitors [12-14] have, therefore, been used in most cases in amorphous pharmaceutical formula-tions.
Moisture sorption characteristics of solid Pharmaceutical solids can sorb water from the atmosphere, which affects the physical, chemical and mechanical properties of the solid and thus the per-formance of solid dosage forms. Hence moisture sorption characteristics of pharmaceutical solids are an important factor for manufacturing of drug.
The moisture sorption characteristic of a solid is dependent on the physical nature of the solid. Crystalline solids generally adsorb moisture onto the surface owing to the high degree of order of their crystal lattice. However, it

16
is possible that defects or imperfections exist in crystalline solids, which leads to moisture absorption in addition to adsorption. The moisture adsorp-tion at the surface of crystalline solids may alter their bulk properties, like flowability [15, 16] and compressibility [17], which depend upon inter-particle attractions and surface properties, or it could cause degradation [18].
Disordered solids absorb the moisture that acts as a plasticizer in lowering the Tg of the solid. The excess free volume in disordered solid caused by randomly arranged molecules can be considered as micro-voids in which the moisture can be absorbed. If the amount of sorbed moisture is enough high, the molecular mobility increases because of the breakage of hydrogen bonds between molecules and hence Tg will be lowered [19]. Expressly lowering Tg below the storage temperature could cause various changes, e.g. recrystalli-sation [18, 20].
Figure 2. Thermodynamic relationship of a crystalline and an amorphous solid as a function of temperature. Shown are the melting temperature (Tm) and the glass tran-sition temperature (Tg) (Adopted from Hancock et al. [2]. Reproduced with permis-sion of Elsevier).

17
Chapter 2
Disorder in pharmaceuticals The major routes by which a crystalline solid is transformed into an amor-phous one can be categorized according two principal transformation mech-anisms (Figure 3). In most cases, a crystalline solid is transformed interme-diately to a non-crystalline form, i.e. solution or melt which then solidifies to an amorphous solid through melt-quenching, spray-drying and freeze-drying techniques. The transformation is referred as fluid-mediated transformation and vitrification [21]. The other approach to transformation involves direct conversion of a crystalline solid to an amorphous/disordered solid through mechanical treatment, termed mechanical activation or solid state amor-phisation [22]. Both approaches can give particles that are partially disor-dered or completely amorphous. However, the method of preparation influ-ences the physical properties of an amorphous solid [23, 24]. In both trans-formation-based mechanisms, the creation of an amorphous solid can be straightforward for compounds with a good glass-forming ability, but diffi-cult for poor glass-forming ones. Solids comprised of larger molecules with a low degree of molecular symmetry can be presumed to have a greater abil-ity to form a glass [25].
Figure 3. Schematic representation of transformation routes from crystalline to an amorphous solid. (Adopted from Feng et al. [26]. Reproduced with permission of Elsevier).

18
Melt- and fluid-mediated amorphisation
Melting and quench cooling
The preparation of amorphous solids by rapidly cooling a melt of the solid is, was the earliest method established and is still the most widely used for the preparation of amorphous materials. However, many factors appear to be crucial to convert a crystalline solid to its amorphous state by the melt-quenched technique. The cooling rate of the melt is one of the most im-portant processing parameters that can influence the degree of disorder and avoidance of crystallisation. In general, the faster the rate of cooling of the melt, the greater is the probability of forming an amorphous solid and not a crystalline one [27]. The melt-quenched technique can be applied only to solid compounds that are thermally stable upon melting [28, 29]. Owing to the high temperatures required, there is potential for chemical degradation during the melting step, and thus the use of the melt-quenching approach may not be suitable for thermally unstable compounds.
Spray-Drying
Spray-drying has been used quite commonly in the past decade as a tech-nique for preparing amorphous active substances and excipients [30-32]. In a spray-drying process, a liquid solution, suspension or an emulsion is pumped into an atomizer where it breaks into small droplets in a drying chamber. In the drying chamber, the droplets meet a stream of hot air or nitrogen, usually at 100-200°C. The solvent evaporates on a timescale of milliseconds [33] as the material passes through the drying chamber. At the bottom of the spray-ing chamber, the particles pass into a cyclone where they are separated from the drying gas, and the amorphous product is collected.
The shape of most spray-dried particles is spherical, which gives the product favourable properties such as making them free-flowing, which makes many downstream operations (such as handling) easier and less costly.
Freeze-Drying
Freeze-drying has been one of the most useful methods for producing dry amorphous powder from a liquid solution of thermo-sensitive drugs and excipients [34, 35]. Freeze-drying is also referred as lyophilization. In the freeze-drying process, the liquid is frozen and then placed in a vacuum chamber with a reduced pressure. The frozen solvent in the material is re-moved by sublimation; once the solvent has been removed completely in this way, an amorphous solid is obtained.

19
The low operating temperature used in freeze-drying in comparison to other dehydration methods diminishes the potential for chemical degradation. The disadvantages of this approach are that freeze-drying has high capital and processing costs and the process time is long.
Mechanical activation The activation of material using mechanical treatment dates back to the Stone Age when mechanical processes were used to initiate fire with flints. The first systematic investigation of the effect of mechanical treatment on a material was published in the 19th Century by Matthew Carey Lea who in-vestigated the decomposition of gold, silver and platinum during grinding in a mortar [36]. During the same period, Ostwald wrote a book in which he classified various methods for simulation of chemical reactions by mechani-cal treatment and introduced the term “mechanochemical reaction”. Later, Smekal (1942) introduced for first time the term “mechanical activation” but restricted the meaning to process which increases the reaction ability of a material without changing it chemically and structurally [37]. In pharmaceu-tics in 1985 Hüttenrauch used the term “mechanical activation” for disorder-ing of structure as result of particle processes, namely, particle deformation, particle breakage and friction [22] and this terming with this meaning is also used in this thesis. Nowadays, the mechanical activation is also termed as mechanical amorphisation, solid state amorphisation and process-induced amorphisation.
The mechanical activation of solids has a wide range of potential applica-tions including mechanical alloying and mechano-chemical reactions [38, 39], preparation of cocrystals and coamorphous systems [40, 41] and the preparation of an amorphous form of a crystal solid [42, 43]. When a solid is subjected to high energy or stress during processing, its structural and microstructural character may change considerably. Conse-quently, the molecular mobility and thus the physical and chemical stability of the solid is altered [1], which in turn has an impact on some biopharma-ceutical properties e.g. hygroscopicity and dissolution capabilities [5, 6]. However, the degree of disorder induced during processing can vary widely depending on the stress-energy distribution during processing and the pro-portion of the material that is affected.

20
Milling-induced disorder
Milling of solids is commonplace, and is most frequently used unit operation in chemical and pharmaceutical manufacturing. Various terms such as crush-ing, comminution, grinding and pulverization have been used synonymously with the term milling [44]. Milling is a unit operation where mechanical energy is applied to physically break down coarse particles to finer ones. A variety of different types of commercially available milling equipment is available; the classification of this equipment is generally made according to the way in which stresses are applied on the solid. The choice of equipment depends on the magnitude of the stress and the properties of the solids, i.e. their fragmentation propensity, elasticity, hardness and the finished product specification. An obvious and frequent purpose of milling is the size reduc-tion of particles (comminution) to obtain a suitable particle size distribution, e.g. to improve the dissolution properties of a drug [45]. However, the high stress level that particles are subjected to during milling may induce changes in other physical characteristics of the solid, such as inducing crystal defects [26] and transforming them into an amorphous solid or another polymorphic phase [38, 39]. There are, thus, three main applications of milling, i.e. parti-cle size reduction, mechano-chemical synthesis including the preparation of cocrystals [40, 41] and solid state disorder in solids [46, 47].
Although several theories have been put forward for transformation of a crystalline solid to an amorphous one during milling, the physical mecha-nisms of milling-induced disorder are not clearly understood to date. How-ever, hypotheses have been presented including vitrification and an increase in entropy of the crystal lattice attributable to defect induction. Nevertheless, comminution and amorphisation processes in a mill are complex and mostly depend upon complicated interactions between material characteristics and operational conditions. Hence, to achieve the desired combination of pro-cessed particles, in terms of size and amorphisation of the particles, in a mill-ing process a comprehensive optimization of a variety of process and materi-al-related variables is often required.
Planetary ball mill
Amongst the various types of ball milling equipment, planetary ball mills are known as the most powerful, and have been used to great effect in industrial and scientific milieux. The ball motion pattern in a planetary ball mill is dependent on the rotation speed of the milling jar and can be categorized in three types, i.e. cascading, cataracting and centrifugation or rolling (Figure 4) [48, 49]. At lower speeds, the cascading ball motion occurs through the balls being caught along by the milling jar wall and unrolls upon each other

21
from the bulk top to its base. At medium rotational speed, a cataracting ball motion occurs, whereby the balls detach themselves from the wall and im-pact the bulk or another part of milling wall with high intensity. At high rotation speed, a centrifugal ball motion occurs, where the balls are fixed to the wall by the centrifugal effect with almost no velocity relative to that of the wall [48, 49]. The ball motion pattern is affected by the choice of other milling operational parameters as well, among them, the ball filling ratio, the mill speed and the ball-to-powder mass ratio (charge ratio) are critical [49, 50]. These parameters are not themselves completely independent and play an important role in the optimization to obtain the best yield. The motion of the balls influences the number of collisions in the milling jar, and so the different categories of ball motion patterns are associated with different en-ergies which in turn affect the comminution and disordering process. The energy in the milling jar can be described by stress models based on two parameters, i.e. the frequency of stress events and the stress energy. The stress energy is defined as the energy supplied by the mill to the powder in a single collision [51]. These parameters combined give a stress energy distri-bution which describes the milling conditions [48, 49, 52]. The total stress energy transferred to the powder depends on the frequency of stress events, the average stress energy transferred to the particles per stress event and the milling time. The type of stress exerted on the particles and the level of stress in a plane-tary ball mill are also affected by the patterns of the ball motion. It has been suggested that a cascading ball motion gives the most effective comminu-tion, where the particles of the solid are stressed by compression and shear stress [49]. In cataracting ball motion, the particles are also stressed by im-pact in addition to compression and shear stress, whereas in a centrifugal ball motion, compression and shear stress stresses the particles at an impressively low level.
Figure 4. Schematics illustration of ball motion pattern in a planetary ball mill.

22
Duration of milling
In a milling operation, the particle size reduction ceases when a critical threshold is reached [53, 54]. Beyond this threshold, the particles in the solid become difficult to comminute even if the milling time is extended. The time required to reach this critical threshold varies depending on the milling in-tensity, the ball-to-powder mass ratio, and the temperature of milling. A further transfer of mechanical energy by extending the milling time tends to cause further deformation of the particles, leading to accumulation of defects in the solid and disorder of solid structure. It is expected that amorphisation upon milling will occur over long time periods whilst short milling times only lead to a size reduction of the crystalline particle and crystallites (small single crystals), without inducing any noticeable amorphisation of the mate-rial [43]. Until now, little has been known about the structure and the micro-structure of the milled disordered particles and when and how the accumula-tion of crystalline defects gives rise to an amorphous state upon milling.
Temperature of milling
The milling temperature is a difficult parameter to control in an absolute way since ball collisions produce a temperature rise that is extremely difficult to estimate. The increase in the local temperature pulses or “hot spots”, caused by the collisions due to milling may lead to an amorphisation through a tran-sient melting [55]. Nevertheless, determining the local temperature and the size of the hot region experimentally is difficult; however some theoretical models are available to estimate the local temperature [56, 57]. In addition, it is possible to limit the temperature increase in the milling jar by alternating between milling periods and pauses. The milling temperature can be con-trolled by controlling the temperature of the milling jar, which will affect the nature of the final state of the product [58, 59].
The relationship between the milling temperature and the intrinsic properties of the solid, such as the glass transition temperature (Tg), govern the nature state of the milled product. Compounds milled at temperatures below their Tg generally transform to the amorphous state, whereas compounds milled at temperatures above their Tg transform to a polymorph of the solid [60]. In addition, many hydrate forms of the solid may show a lower propensity to amorphise compared to their anhydrous counterparts. This is caused by the plasticizing effect of the structural water molecules, which generally de-presses the Tg of the corresponding amorphous solid to below the milling temperature. In this condition any disordering is followed by a rapid recrys-tallisation, which thus prevents their apparent amorphisation [60]. However, the propensity to amorphise is affected by both the number of water mole-cules in each unit cell and the Tg of the anhydrous form of solid. The greater

23
the number of water molecules in each unit cell, the lower is the propensity to amorphise, if the Tg of the anhydrous form of solid is low [61].
Dry mixing
Dry mixing of powder is an important step in the manufacturing of pharma-ceuticals. There are different kinds of commercially available mixing equipment. Mixing devices can be equipped with a jar that rotates around one axis or more (tumbling mixer), a paddle (convective mixer) or a baffle (motionless). Amongst the different designs of tumbling mixer, the turbula shaker-mixer is one of the more sophisticated and lead to more efficient mix-ing [62]. In a tumbling mixer, the flow of the particles is dominated by gravitational forces.
The mixing efficiency is dependent on the mixer geometry and the rotational speed, because these properties influence the movement of the particles in the mixing jar. At sufficiently great rotational speeds, shear mixing occurs where particles slide along each other or over other surfaces. At very high rotational speeds the particles will be held on the jar walls by centrifugal forces, and in contrast, at very low rotational speeds, the particles fall in a cascading motion, and the shear mixing is minimized. The motion of parti-cles influences the number of collisions in the mixing jar, and so the differ-ent categories of motion patterns are associated with different energies which in turn affect the mixing and disordering process.
The mechanisms of mechanical-induced disorder The nature and the degree of disorder depend on the intrinsic properties of the material under consideration, and on the particular process used to ma-nipulate (stress) the material. However, to examine the nature of disorder in a solid, it is prerequisite to know the mechanisms that give rise to disorder-ing in general. There are two conceptions as to how the transformation from a crystalline solid to an amorphous one takes place during mechanical pro-cessing. The first mechanism is the formation of an amorphous domain through melting (caused by frictional heat when the particles are sliding against each other) followed by a solidification process, i.e. vitrification [21, 63]. In this instance, the nature of the disordered particle is thus represented by two-state particle model with amorphous and crystalline domains [10].
The other mechanism for the formation of disorder is the generation of de-fects and the formation of amorphous regions at a critical defect density [10, 26, 64, 65]. In this instance, the nature of the disordered particle represents a
24
one-state particle model, i.e. defective particle. The defects can be in the form of point defects, line defects, plane defects [26] or defects induced by fragmentation of crystallites. However, the presence of any imperfections in a solid may lead to changes in the lattice energy and thus also in the physical and chemical potential of the solid.
The defect disordering mechanism has also been described in terms of crys-tallite fragmentation followed by a transformation of crystallites into an amorphous phase at a critical crystallite (small single crystal) size [66]. In addition, the removal of the water or organic solvents from the crystal lattice of hydrate and solvent drugs and excipients during processing may result in collapse of the lattice into the amorphous state [67]; this has been described as a defect disordering mechanism [10].
Types of particle stresses During a mechanical process the particles of the solid are stressed by two main stress types, namely, compression and shear (Figure 5). Compression results in a lower rate of stress application, resulting in slower generation of cracks inside the particle; the particles respond to the applied stress by ex-hibiting ductile behaviour or fracturing. Shear stress occurs when the parti-cles of a solid slide along other particles and/or other surfaces, resulting in attrition of particles caused by the friction generated by sliding.
Figure 5. Schematic illustration of particle stresses acting during mechanical pro-cessing.

25
Chapter 3
Quantification and characterisation of disorder The amount of unintended disordered fraction generated during mechanical processes may constitute only a small percentage of the powder mass exist-ing in the bulk or in the form of disorder on crystalline surfaces [68, 69], which put requirements on the measuring techniques with respect to accura-cy and precision. These requirements disqualify many of the conventional techniques used on pharmaceutical materials or put demands on refinement on measurements and analysis. There are, however, many analytical tech-niques that can be used to characterise and quantify modest to high levels of disorder in solids. All existing techniques have some limitations and are different in terms of their sensitivity in detecting and quantifying the disor-dered fraction (Table 2). Thus effective characterisation and an accurate quantification of disorder require the use of a combination of complementary analytical techniques. Different techniques will detect disordered solid forms differently, thus potentially leading to different results for the determination of the degree of disorder in a given sample (Table 2). Techniques such as Raman spectroscopy, solid state nuclear magnetic resonance (ss-NMR) and X-ray powder diffraction (XRPD) analyse the solid on the molecular level. Differential scanning calorimetry (DSC) [70], solution calorimetry [70], isothermal micro-calorimetry [68] and dynamic vapour sorption (DVS) [71, 72], probing the solid at the particulate level. Further there are a variety of surface analysis techniques that probe disorder on the surface of a particulate solid, including atomic force microscopy (AFM) [73, 74] and inverse gas chromatography (IGC) [75].

26
Table 2. Comparison of various techniques used for the characterisation and quanti-fication of disordered content in the solid.
Technique Destructive Processing time Detection limit Phase detection
Molecular level
Raman spectroscopy No 10 s ˂1% [76, 77] Both
NIR spectroscopy No 10 s 1-2% [78, 79] Both
ss-NMR No 0.5-10 h 0.5 % [80] Both
XRPD No 10-60 min ~10% [81, 82] Crystalline Particulate level Conventional DSC Yes 10-30 min ~10% [83] Both MTDSC Yes 1-2 h 1% [84] Both High speed DSC Yes 1min -5 h 0.2-1% [85, 86] Both Isothermal calorimery Yes 0.5-4h ˂1% [68] Amorphous Solution calorimetry Yes 0.5-1 min 1% [70, 87] Both DVS Yes 24-48 h ˂1% [88] Amorphous At surface IGC Yes - 1% [75, 89] Amorphous
Both: Crystalline and amorphous.
Raman spectroscopy The applications of different spectroscopic techniques for characterisation and quantification of disordered content in pharmaceutical materials have been widely investigated in the past few decades. These techniques offer several advantages compared to the traditional ones such as non-invasiveness, rapid measurement, non-destructiveness and requiring no or minimal sample preparation. Among these, Raman spectroscopy has gained increasing interest [90-92] owing to its poor moisture interference of the Raman signal that is normally present in solids during product manufactur-ing and analysis.
Raman spectroscopy is based on the inelastic scattering of monochromatic light or infrared radiation. In the scattering process most of the radiation is scattered elastically, i.e. energetically unshifted (Rayleigh scattering). How-ever for a smaller portion of the scattered light, the energy will be shifted either to lower energy (Stokes scattering) due to induced vibrational excita-tions in the material or to higher energies (anti-Stokes scattering) due to in-duced vibrational de-excitations in the material (Figure 6).

27
Figure 6. Energy state diagram for Raman spectroscopy.
Mechanistically by a quantum mechanical model these processes could be seen as electronic excitation to a virtual level where a succeeding de-excitation to the electronic ground state giving rise to Rayleigh scattering. De-excitation to electronic ground state together with an excited vibrational state or de-excited vibrational state giving rise to Stokes scattering and anti-Stokes scattering respectively. In the measurements the sample is illuminated with laser light and the scat-tered radiation from the illuminated spot is collected. The elastic scattered radiation is then filtered, while the rest of the collected light (inelastic) is dispersed by a prism or grating to spatially separate the scattered light of different wavenumber (wavelengths) (Figure 7). The intensity of scattered light at the different wavenumbers is then recorded by a detector giving rise to Raman spectrum. A Raman spectrum shows the intensity of the Raman scattered radiation as function of wavenumber differences from the incident radiations. The latter being called the Raman shift. The vibrations of different compound and solid forms result in unique and characteristic Raman spectra (Figure 8), which can be utilized to quantify disorder in the solids. However, the large data set each Raman spectrum consists of, poses a challenge when attempting to extract useful information from the data. In general, there are two approaches that can be used to quan-titative analyses of Raman data, uni-or/and bivariate analysis and multivari-ate analysis. The uni-or/and bivariate analysis approach is considered to be the easiest. It uses the intensity ratios of different bands of the spectra ob-

28
tained from the peak intensities or peak areas of the characteristic peaks. The most common multivariate methods include principal component analysis (PCA), partial least square regression (PLS), classical least square analysis (CLS) and inverse classical least square analysis [92]. Prior to performing the quantitative analysis, various pre-processing methods are usually used to subtract the background in order to obtain a reliable quantitative analysis.
Figure 7. Schematic of the Raman spectroscopy.
Figure 8. Raman spectra of pure crystalline α-lactose monohydrate (the black line) and pure amorphous lactose (red dashed line) before baseline correction. (Adopted from Pazesh et al. [paper IV]. Reproduced with permission of Elsevier).

29
X-ray powder diffraction
The X-ray powder diffraction (XRPD) is based on X-rays interacting with the electrons of the molecules and interference of the resulting scattered X-rays. It is a widely used technique for characterising the crystallinity of dif-ferent materials and can also be used for quantifying degree of crystallinity.
In crystalline materials the molecules are periodically arranged and forms planes (crystal planes) in different directions and at different separations. This enables constructive interference of the scattered radiation in certain directions and the XRPD diffractogram is obtained as X-ray intensity peaks at different angles relative to the incident X-ray beam. The angular positions of the peaks are depending on the distance between crystal planes ( ) ac-cording to Bragg’s law:
2 sin Equation 1
where is the order of reflection, is the wavelength of the X-ray, is the distance between the crystal planes and is the angle of incidence of the X-ray (Figure 9).
Figure 9. Schematic of the X-ray diffraction and Bragg’s law.
In contrast, in amorphous materials where the molecules are randomly ar-ranged and do not form any crystal planes, the X-ray light incident is scat-tered in random directions, thus do not result in an interference pattern but gives a broad peak as referred to “halo” (Figure 10).

30
Figure 10. XRPD diffractogram of α-lactose monohydrate, crystalline (black line), partially disorder (green line) and amorphous (purple line). (Adopted from Pazesh et al. [paper IV]. Reproduced with permission of Elsevier).
Three approaches can be used for the quantification of disordered content by PXRD [93]. The first one involves the characteristic crystalline peak intensi-ties being measured, i.e. the degree of crystallinity is measured by taking the area under the peaks. In the second approach, the integrated peak areas of the principal crystalline peaks are measured. Finally, the third approach uses the intensity of the characteristic region of amorphous scattering; of physical mixtures of known crystallinity to create a calibration curve that is used for further quantification studies [82].
Calorimetry Calorimetric techniques are based on the measurement of heat flow which may cause phase transitions in a sample such as recrystallisation and melt-ing.
Differential scanning calorimetry Differential scanning calorimetry (DSC) is commonly used to investigate the phase behaviour of pharmaceutical solids. DSC measures the difference be-tween the heat flow to a sample and to a reference sample as a function of temperature. A typical DSC scan of a partially or an amorphous solid shows a glass transition endotherm, crystallisation exotherm, and melting endo-therm (Figure 11a) [83]. Depending on the instrument type, several method-ologies can be employed to quantify the degree of disorder with the DSC
31
technique. Using conventional DSC, the disordered content of a solid can be estimated either from the heat of crystallisation (crystallisation enthalpy) [83, 94] or from the enthalpy of fusion [95, 96]. However, the disordered content in highly crystalline solids can be difficult to detect by the conven-tional DSC technique, in which case the high speed DSC (hyper-DSC) tech-nique [85], that operates at an extremely high scan rate, could be an alterna-tive [85]. Quantification of the disordered content using modulated tempera-ture DSC (MTDSC) is based on the measurement of the heat capacity jump that an amorphous solid displays as it passes through the glass transition. The difference between heat capacity is linearly proportional to the amor-phous content.
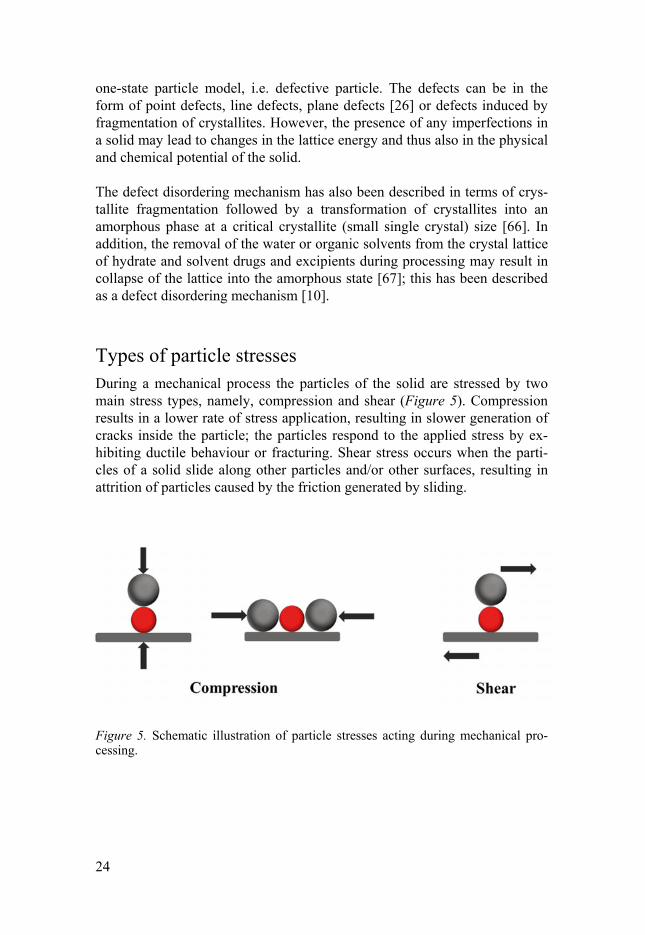
Isothermal microcalorimetry Isothermal microcalorimetry was one of the earliest techniques to be investi-gated as a tool for quantifying the disordered content in solids [68]. In iso-thermal calorimetry, the difference between the heat flow to a sample and a reference sample is measured as a function of time at a constant temperature when the relative humidity or the relative vapour pressure surrounding the sample is controlled [97]. The output is in the form of rate of change of power (heat flow) as function of time (Figure 11b). The transformation from the amorphous to crystalline form is detected as an exothermic peak, the integrated peak area of which is directly proportional to the degree of disor-der.
Figure 11. Typical differential scanning calorimetry (DSC) thermogram (a) and isothermal calorimetry thermogram (b) of amorphous lactose. (Adopted from [97]. Reproduced with permission of Elsevier).

32
Atomic force microscopy Atomic force microscopy (AFM), developed in 1986, is a scanning probe technique which provides a means of directly visualizing the surface struc-ture of solids by scanning a tip, mounted on cantilever, across the surface [98]. The sample is placed on a stage attached to a piezoelectric scanner and, above it, the cantilever is mounted in a holder. The force between the tip and the sample surface causes the cantilever to deflect towards the surface. These deflections are mapped by letting a laser beam reflecting on the back of the cantilever. Depending of the deflection of the cantilever, the reflected beam hits different spots on a detector. In this way, the topography of the sample surface can be detected at a nano-scale which displaying surface properties of the sample [99]. Depending on the application, the AFM can be operated in different com-monly used imaging modes. The modes are characterised according to the nature of the tip motion: a contact mode (continuous contact with surface), tapping mode (where the surface is tapped intermittently) and non-contact mode (hanging above the surface) [98]. The contact mode can damage the sample and distort the image, therefore, the non-contact mode or tapping mode, where the cantilever is vibrated or oscillated at a given frequency are preferred. The non-contact imaging generally provides low resolution, how-ever a higher resolution without inducing destruction is obtained using the tapping mode techniques. AFM is widely used in materials science and has found many applications in biological and polymer sciences. The technique also has considerable poten-tial in the field of pharmaceutics including investigation of changes on the surface during recrystallisation of disordered regions.
Figure 12. Schematic of the Atomic force microscopy (AFM) and the force-separation profile generated with AFM. Blue dashed line (trace) and black line (re-trace).
33
Chapter 4
The thesis in the perspective of pertinent research During the past decade, the pharmaceutical industry has increasingly estab-lished a quality-by-design approach to drug development to ensure the de-sired product quality and performance is attained. Consequently, the func-tional relationship between material attribute and unit process has become an area of great interest. Understanding the impact of mechanical processing on pharmaceutical materials and how to implement analytical technologies to increase the science-based process has been the subject of several pharma-ceutical studies. This because the energy associated with any step in the drug manufacturing process could serve to overcome the energy barriers between different forms of solids and could give rise to unanticipated changes in the solid state characteristics of the drug itself, and the drug in the final dosage form. Thus, in order to prepare a solid dosage form with modified formula-tion properties and reproducible characteristics, it is vital to identify the mechanisms causing instability in the materials during processing. As the literature review conducted in the previous part of the thesis revealed, a number of explanations have been given for the mechanisms causing dis-order in the solid. By the same token, the understanding of the physical na-ture of the processed particles remains particularly poor, whether the pro-cessed particles can be considered to contain particles comprised of two-state with crystalline and amorphous domains or one-state, i.e. defective particles. Thus, there is still uncertainty regarding the mechanisms of disor-der and the physical nature of disordered particles.
The uncertainties associated with disordered mechanisms and the physical nature of processed particles may also present challenges for the detection and quantification of disordered content. Consequently, the techniques by which the disordered content is quantified remain the subject of many inves-tigations pertaining to sensitivity of techniques to detect and quantify a low degree of disorder as well as determining the extent to which completely disordered reference material is truly indicative of process-induced disorder material entrenched in a crystalline particle.

34
There is also a pertinent issue associated with the location of the disordered material. It is argued that a small amount of disorder located entirely at the surface of particles of processed material [69, 100], can be indicative of dis-order being initiated at the surface of the particle that would subsequently penetrate into the bulk e.g. if the processing time were increased. However, the knowledge of location of disorder on the surface is poor, indeed the un-derstanding of how disorder is distributed throughout a particle remains ex-tremely limited at present. This kind of knowledge is of great importance for the implementation of automated processes and plays a central role in con-trolling during manufacturing since the disordered region on the surface may act as interaction position and has an impact on the physical and chemical properties of compounds and the final performance of the product.
Aims of the thesis The overall aims of this thesis were divided into two sub-objectives. The first of these was to gain a further understanding of the disordered mecha-nisms involved in process-induced disorder, as well as understanding the particle processes causing process-induced disorder. More specifically, the disordering mechanisms during dry mixing and milling were investigated. Additionally, the effect of degree of apparent amorphous content on the me-chanical properties was investigated. The second objective of the thesis was to develop approaches to quantify disordered fraction in the bulk and on the surface of mechanically processed particles. In association with this, the ability of Raman spectroscopy and atomic force microscopy (AFM) to quantify and characterise a low degree of disorder was investigated.

35
Chapter 5
Experimental methods This section contributes a general overview of the methods that were used for the majority of the experimental work in this thesis. The preparation and quantification methods were described in previous chapters. For a detailed description of the methods, the reader is referred to the method sections of the attached papers.
Particle characterisation The main characteristics of powders are the particle size, particle shape (morphology) and the surface area of the particle; together these provide basic information on the nature of particulate material. The size and shape of the particles can affect bulk properties, product performance, processability and stability of the final product.
Size distribution There are a number of analytical techniques available with which to charac-terise the particle size. A commonly used technique is laser diffraction, where the light obscuration is used to measure size of individual particles passing through the laser. Different techniques use different operating prin-ciples and have difference ways of performing the calculations for the data treatment to determine the particle size. For irregular shaped particles, the equivalent diameter is often determined. The equivalent diameter is defined as the diameter of a sphere that has the same value, e.g. area and volume as the irregularly shaped particle. There is always some variation in particle size in a given sample, thus, the particle size measurement is often described as a distribution in which the proportion of particles is given as function of particle size. There are multiple ways of representing a particle size distribu-tion depending on the principles of the measurement technique. Usually the particle size characterises are stated by number, area, volume, or weight. The degree of fineness of a powder is of the utmost importance for particle size measurement. Fine powders are difficult to handle owing to their cohe-

36
sive properties, which may cause agglomeration of primary particles. Thus it is necessary to de-aggregate and detach particles before measurement since the agglomerate would be determined to be large particles by most particle sizing technique [101].
Morphology The shape of primary particles will change during mechanical processing which can affect their mechanical properties [102], thus it is necessary to obtain evidence of the shape of the particles. Information on the particle shape can be readily obtained by observing the particles in the scanning elec-tron microscope (SEM). SEM is a type of electron microscope that produces images of a sample by scanning it with an electron beam. The electrons in-teract with the atoms in the sample and produce signals that contain infor-mation about the sample’s surface topography.
External particle specific surface area The external surface area is defined as the sum of the surface areas of all particles considered as a group of nonporous particles, it may be determined by air permeametry methods [103]. For fine particles, Blaine air permeabil-ity apparatus can be used with transient mode [104] and for large particles, a steady-state air permeability device may be used [105]. The relationship between the flow rate and the pressure drop is used for the calculation of the volume specific surface area for large particles using the Kozeny-Carman equation [105] and for fine particles the Kozeny-Carman equation corrected for slip flow is used [106].
Apparent density The apparent density, often referred to as the true density, is the density of powder excluding the volume of open pores and including the volume of closed pores. Apparent density is measured using a helium displacement pycnometry [107]. Depending on the molecular arrangement of the material, the apparent density can equal the theoretical density of the material and therefore be indicative of how close the material is to a crystalline state. In general, the crystalline materials have higher density than their amorphous counterparts because the atoms in the crystal lattice are located at a mini-mum distance from each other.

37
Mechanical characteristics The properties of a solid are generally defined as those characteristics that determine its nature, and are typically categorized as the physical, chemical and mechanical attributes. However, as previously mentioned, the properties of a particulate solid can be altered during various steps of the manufactur-ing process and there might be considerable variation in the mechanical properties of the activated (processed) solid. However, the mechanical prop-erties of a solid can be characterised both on the microscopic scale, when the properties of a single particle is evaluated or/and at macroscopic scale, i.e. through the properties of the bulk, which represents an average behaviour. On the macroscopic scale, the important mechanical properties of pharma-ceutical solids are related to the degree of volume reduction under a given stress [108, 109], which describes the elasticity, plasticity and fracture prop-erties of the solid.
The Heckel model and plastic stiffness The compression mechanics of a material can be studied by the relation be-tween powder bed porosity and applied pressure under compression, for example by using the so called Heckel profile. A Heckel profile is normally divided into three regions, with each region being characterised by the dom-inate process occurring in the die as the powder is compressed (Figure 13). In the first region (low pressure), an initial non-linear part arises from parti-cle rearrangement in the powder bed [108, 110] or particle fragmentation [109]. The second region (intermediate pressure), the linear part of the Heckel profile represents plastic or elastic deformation of the particles. The third region (high pressure), another non-linear part, has been attributed to elastic deformation of compact [111, 112]. The characteristics of the second region can be explained by the Heckel model, which is based on the assumption that the particles undergo plastic deformation under pressure, with the volume reduction of the powder sup-posedly following first-order kinetics phenomena in which the pores consti-tute the reactant. The model corresponds to a linear relationship between the natural logarithm of the reciprocal of the powder bed porosity and the ap-plied pressure: = ∙ + Equation 2
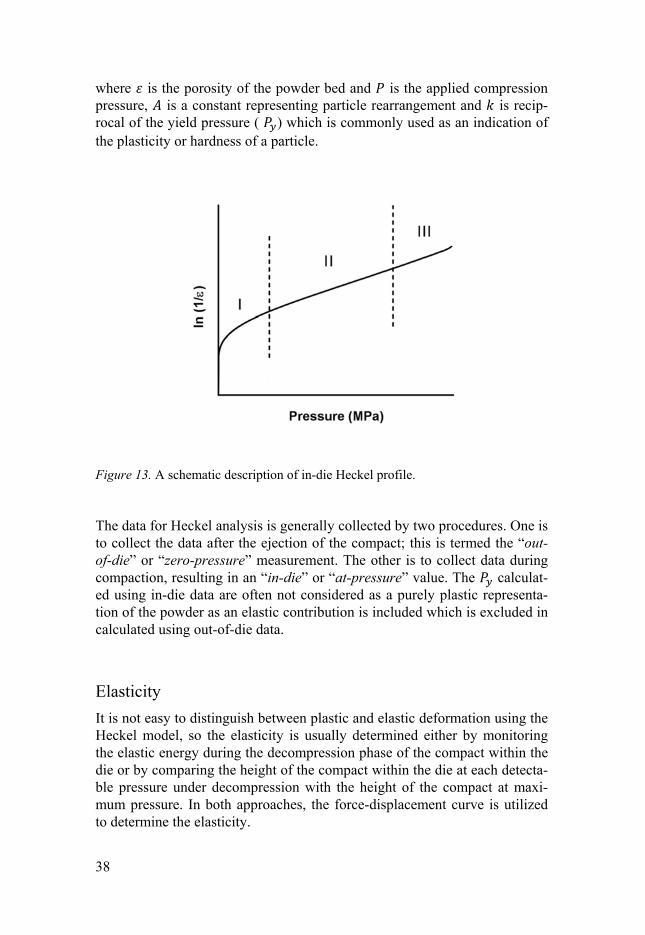
38
where is the porosity of the powder bed and is the applied compression pressure, is a constant representing particle rearrangement and is recip-rocal of the yield pressure ( ) which is commonly used as an indication of the plasticity or hardness of a particle.
Figure 13. A schematic description of in-die Heckel profile.
The data for Heckel analysis is generally collected by two procedures. One is to collect the data after the ejection of the compact; this is termed the “out-of-die” or “zero-pressure” measurement. The other is to collect data during compaction, resulting in an “in-die” or “at-pressure” value. The calculat-ed using in-die data are often not considered as a purely plastic representa-tion of the powder as an elastic contribution is included which is excluded in calculated using out-of-die data.
Elasticity
It is not easy to distinguish between plastic and elastic deformation using the Heckel model, so the elasticity is usually determined either by monitoring the elastic energy during the decompression phase of the compact within the die or by comparing the height of the compact within the die at each detecta-ble pressure under decompression with the height of the compact at maxi-mum pressure. In both approaches, the force-displacement curve is utilized to determine the elasticity.

39
A force-displacement curve is attained by plotting the punch forces devel-oped during compression and decompression against the punch tip separa-tion. A curve with increasing slope is obtained with a maximum at the point corresponding to the minimum punch separation i.e. at highest application of force. As the punch is retracted when the compaction force is unloaded, the compact will expand through elastic recovery (Figure 14). The amount of elastic recovery depends on the elastic properties of the particles and the bonding between the particles. The energy involved in the compression or decompression phase can then be calculated by integrating the force-displacement curve [113, 114]. In the approach based on the dimensions of the compact, the elasticity is calculated by the percentage elastic recovery ( ) [115]:
− = ℎ × 100 Equation 3
where ℎ is the height at each detectable pressure under decompression and ℎ is the height at maximum pressure.
Figure 14. A typical force-displacement curve.
In addition the relationship between and pressure difference − can be used to determine the elastic modulus using the reciprocal of the slope of the linear part of the plot.

40
Chapter 6
Results and discussion The following section gives a brief overview of the main results of the sur-veys that are included in this thesis.
Process-induced disorder Mechanisms of disordering during processing are controlled by the proper-ties of the material and the stress energy distribution during a specific pro-cess. The stress energy distribution is regulated by a series of process param-eters and the type of stress may be different depending on the type of process [49]. Compression and shearing stress are common types of stressing parti-cles during powder flow and the ball milling process.
Powder flow-induced disorder I The micro-particles of griseofulvin (~2 μm) generally become disordered during mixing in a range from about 6% to 86% depending on the mixture’s composition (Table 3 and Figure 15). The degree of apparent amorphous content was increased with increased mixing time as the number of colli-sions and the stress level of the inter-particulate collisions increased with an increased mixing time. Mixing of the large batch size displayed a higher degree of amorphous con-tent, possibly because the higher level of stress caused by particle motion pattern in the mixing jar. In order to create a less complex contact process characterized by impact with minute particle sliding, three additional experiments were conducted: dry mixing of griseofulvin with pre-lubricated carrier beads (glass beads), compression experiments with two compaction machines with and without an ejection mode and compact wear test experiments. The degree of apparent amorphous content was reduced when the pre-lubricated carrier beads (glass
I Paper I

41
beads) were used. Since the glass bead was covered with lubricant prior to mixing, the griseofulvin particles were existed both as an adhered fraction and as free powder (free fraction) in the mixture. It was reasonable that the contact processes during powder flow in the mixer differed between griseo-fulvin in the adhered-state and in the free powder. As the particle in the ad-hered-state is larger and heavier, it was expected that the stress level of the contact processes was higher for these particles compared with the free pow-der. This corresponded with the findings that the degree of disorder was lower for mixtures containing pre-lubricated carrier beads.
Figure 15. The degree of disordered content of griseofulvin particles during (a) dry mixing and (b) repeated compaction at 60, 120 and 180 MPa.
Table 3. Composition of the powder mixtures.
Mixture Griseofulvin
(g)Glass beads
(g) MgSta (mg)
(w/w %) Mixture weight
(g) Mixing time
(h)
Mixture I 0.5 49.5 0 (0%) 50 5 Mixture II 0.5 49.5 0 (0%) 50 24 Mixture III 0.5 49.5 5.4 (0.01%) 50 5 Mixture IV 0.5 49.5 5.4 (0.01%) 50 24 Mixture V 0.5 49.5 10.7 (0.02%) 50 5 Mixture VI 0.5 49.5 10.7 (0.02%) 50 24 Mixture VII 2 198 0 (0%) 200 24 Mixture VIII 2 198 42.8 (0.02%) 200 24 aMgSt: magnesium stearate
42
Repeated compression I
The fragmentation of griseofulvin particles was considered to be minute since the size of the primary griseofulvin particles was below the reported values of the critical particle size at which a brittle-plastic transition typically occurs [115]. Thus the main responses during compression of griseofulvin were presumed to be elastic and plastic deformation. However, repeated compaction using the press with ejection mode showed a limited degree of disorder where the compact was sliding in the die between strokes whereas repeated compaction without an ejection mode and thus less sliding of com-pact, gave a minute degree of apparent amorphous content. The limited dis-order attributable to compression indicated that particle deformation did not cause disorder. In contrast, sliding of the compact in the die gave rise to sub-stantial amorphisation, i.e. shearing and friction generated by sliding can be supposed to be the most important inter-particulate contact process during mechanical processing.
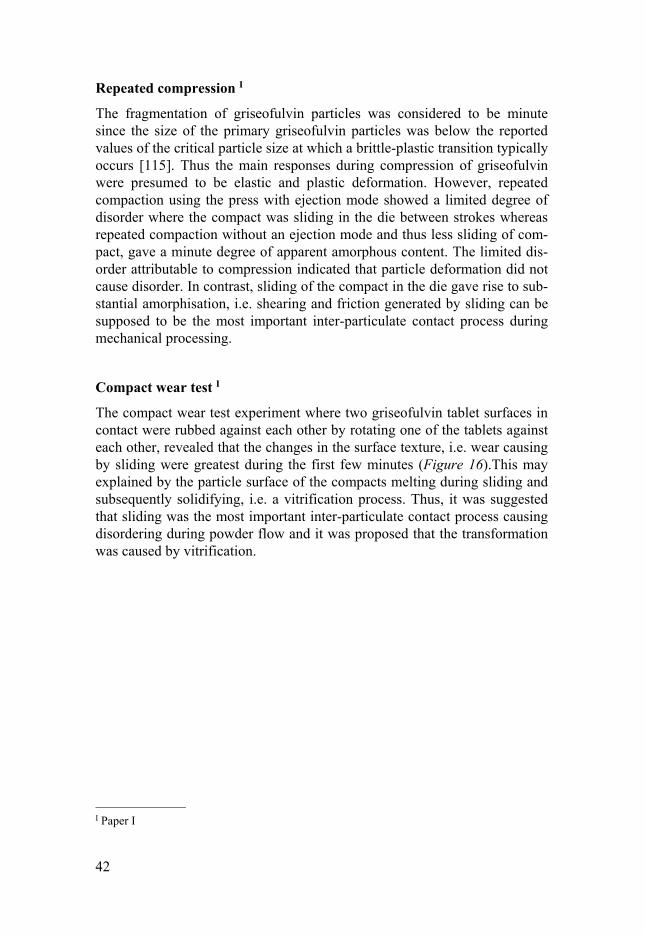
Compact wear test I
The compact wear test experiment where two griseofulvin tablet surfaces in contact were rubbed against each other by rotating one of the tablets against each other, revealed that the changes in the surface texture, i.e. wear causing by sliding were greatest during the first few minutes (Figure 16).This may explained by the particle surface of the compacts melting during sliding and subsequently solidifying, i.e. a vitrification process. Thus, it was suggested that sliding was the most important inter-particulate contact process causing disordering during powder flow and it was proposed that the transformation was caused by vitrification.
I Paper I
43
Figure 16. Scanning electron microscopy images of griseofulvin compacts, (A) untreated, (B) treated by rotation for 5 min, (C) treated by rotation for 15 min and (D) treated by rotation for 25 min.
Milling-induced disorder II
The disordering process of α-lactose monohydrate during ball milling was investigated using different milling conditions, including ball-to-powder mass (BMP) ratios, milling times and ball diameters. At a constant ball-filling ratio, a ball-to-powder mass ratio of 25:1 gave rise to the lowest min-imum particle size of ~5 μm and the highest degree of apparent amorphous content (82%). The rate of comminution was high during the early stage of milling and the rate constant decreased with a decreased BPM ratio (Table 4). The time to reach the final particle diameter was increased with de-creased BPM ratio. Based on these observations it was proposed that the rate of comminution was proportional to the frequency of the effective collisions during milling, and thus an increased BPM ratio corresponded to an in-creased maximum stress energy provided by the mill as result of which, fragmentation of particles will increase (Figure 17).
II Paper II

44
Table 4. The effect of the ball-to-powder mass ratio on the comminution and amor-phisation rate constant of α-lactose monohydrate of quality 200M during milling.
Ball-to-powder mass ratio
25:1 13:1 6:1 Comminution rate constant (min-1) 0.664 0.561 0.010 Minimum particle diameter (µm) ~5 ~9 ~12 tDl (min) 5 7 1200 Amorphisation rate constant (min-1) 0.003 0.002 2.9e-04 Maximum disordered content (%) 82.4 36.8 5.8 tAACmax (min) 1200 1200 1200
tDl: Time at which the minimum particle diameter was reached. tAACmax: Time at which the maximum apparent amorphous content was reached.
Figure 17. Hypothetical illustration of the stress energy distributions using ball-to-powder mass ratios of 25:1 (blue line), 13:1 (red line) and 6:1 (green line).
Turning to the amorphisation, the rate constant was considerably lower and the degree of apparent amorphous content increased gradually with an in-creased milling time. The increase in BPM ratio also affected the amorphisa-tion process, i.e. the increased stress energy provided by the mill (Table 4 and Figure 17). As differences in the rate constant for comminution and the amorphisation process were large, the relationship between comminution and the amor-phisation process could be described as two regimes, comminution followed by amorphisation. The extent of the regimes was controlled by the energy

45
available in the milling jar, which in turn was affected by the process param-eters such as BPM ratio and ball diameter.
Types of particle stress during milling II
The stress energy transferred to the particles may differ depending on the type of contact process taking place. In order to explore the role of compres-sion and shearing contact events on the comminution and amorphisation processes, additional milling trials were conducted where balls of different diameters were used whilst the filling ratio and BPM ratio were kept con-stant. A reduction in the ball diameter increases the frequency of stress events [51], but simultaneously decrease the stress energy arising from im-pact [52]. However, a change in the ball size affected the degree of apparent amorphous content of the particles although the particle diameter remained unchanged (Figure 18). Thus it was suggested that for lactose the dominat-ing response to compression stresses is particle fragmentation while the dominating response to shearing stresses is amorphisation by vitrification.
Figure 18. The effect of ball size on the (A) median particle diameter and (B) appar-ent amorphous content (AAC) during milling of lactose of quality 200M using a ball-to-powder mass ratio of 25:l.
II Paper II

46
Mechanical characteristics In order to survey the nature of mechanically disordered particles and the mechanisms inducing the disorder, the effect of the degree of disorder on the plastic stiffness and elastic stiffness of α-lactose monohydrate milled for different time periods were compared with physical mixtures representing a two-state disordered particle model.
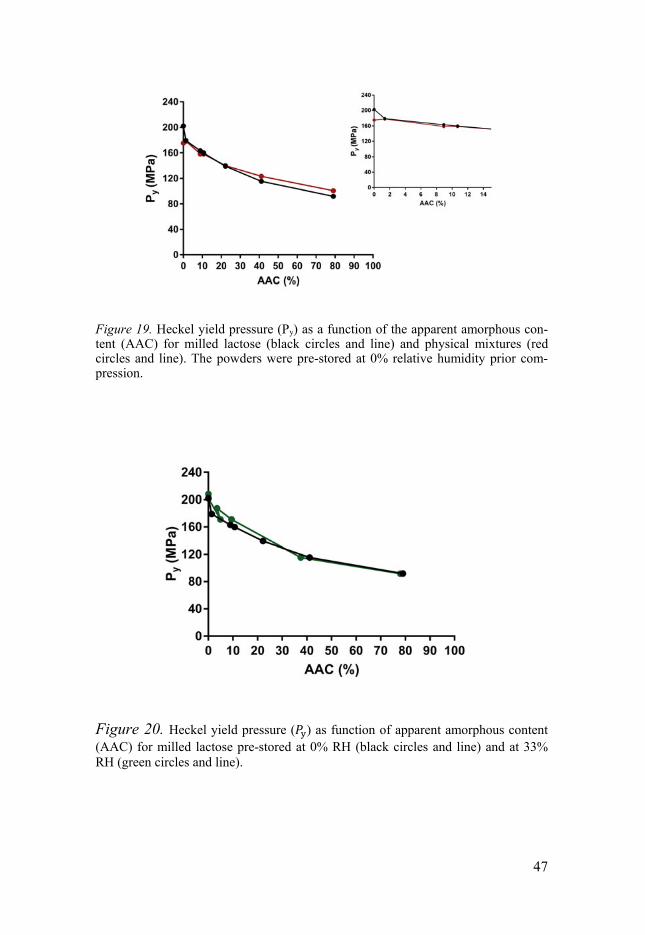
Plastic stiffness of milled particles III
In comminution-dominated regimes during the milling process where degree of disorder was minuteII, the plastic stiffness of disordered particles in-creased with decreased particle size. In the amorphisation regime, in con-trast, where the median particle diameter of the disordered particles re-mained unchanged, the plastic stiffness decreased with increased degree of disorder, i.e. a decrease in particle plastic stiffness was associated with the creation of structural defects of the particles. Similarly, the plastic stiffness of the physical mixtures particles containing crystalline and amorphous do-mains decreased with increased amorphous content (Figure 19). It was thus concluded that the physical nature of milling-induced lactose particles can with regard to plastic stiffness be explained by a two-state system containing crystalline and amorphous domains. However, the difference in physical nature between the milling-induced dis-ordered particles and physical mixtures was attributed to different moisture sorption characteristics (Figure 20). For milling-induced disordered particles moisture sorption had small effect on the plastic stiffness and the presence of moisture caused a recrystallisation of milled particles with low degree of disorder which increased their plastic stiffness. For physical mixtures, the amorphous particles became softer due to moisture sorption which caused reduction in plastic stiffness of these particles rendering a lower plastic stiff-ness of the blend. Thus, the change in particle plastic stiffness due to mois-ture sorption may depend on a combined effect of hardening due to crystalli-sation and softening due to moisture sorption in amorphous regions.
III Paper III II Paper II
47
Figure 19. Heckel yield pressure (Py) as a function of the apparent amorphous con-tent (AAC) for milled lactose (black circles and line) and physical mixtures (red circles and line). The powders were pre-stored at 0% relative humidity prior com-pression.
Figure 20. Heckel yield pressure ( ) as function of apparent amorphous content (AAC) for milled lactose pre-stored at 0% RH (black circles and line) and at 33% RH (green circles and line).
48
Elastic stiffness of milled particles III
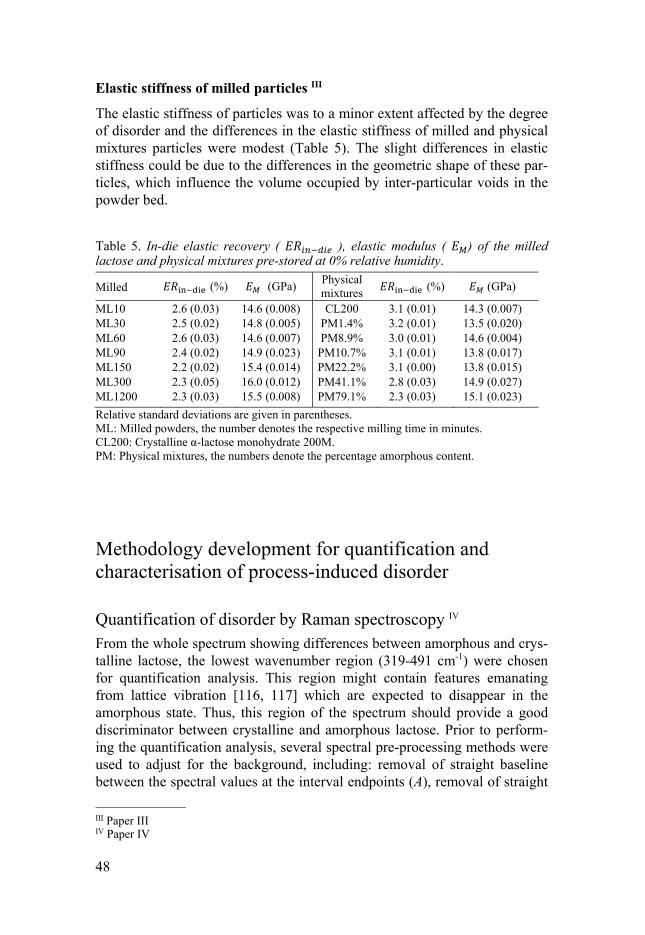
The elastic stiffness of particles was to a minor extent affected by the degree of disorder and the differences in the elastic stiffness of milled and physical mixtures particles were modest (Table 5). The slight differences in elastic stiffness could be due to the differences in the geometric shape of these par-ticles, which influence the volume occupied by inter-particular voids in the powder bed.
Table 5. In-die elastic recovery ( ), elastic modulus ( ) of the milled lactose and physical mixtures pre-stored at 0% relative humidity.
Milled (%) (GPa) Physical mixtures
(%) (GPa)
ML10 2.6 (0.03) 14.6 (0.008) CL200 3.1 (0.01) 14.3 (0.007) ML30 2.5 (0.02) 14.8 (0.005) PM1.4% 3.2 (0.01) 13.5 (0.020) ML60 2.6 (0.03) 14.6 (0.007) PM8.9% 3.0 (0.01) 14.6 (0.004) ML90 2.4 (0.02) 14.9 (0.023) PM10.7% 3.1 (0.01) 13.8 (0.017) ML150 2.2 (0.02) 15.4 (0.014) PM22.2% 3.1 (0.00) 13.8 (0.015) ML300 2.3 (0.05) 16.0 (0.012) PM41.1% 2.8 (0.03) 14.9 (0.027) ML1200 2.3 (0.03) 15.5 (0.008) PM79.1% 2.3 (0.03) 15.1 (0.023)
Relative standard deviations are given in parentheses. ML: Milled powders, the number denotes the respective milling time in minutes. CL200: Crystalline α-lactose monohydrate 200M. PM: Physical mixtures, the numbers denote the percentage amorphous content.
Methodology development for quantification and characterisation of process-induced disorder
Quantification of disorder by Raman spectroscopy IV From the whole spectrum showing differences between amorphous and crys-talline lactose, the lowest wavenumber region (319-491 cm-1) were chosen for quantification analysis. This region might contain features emanating from lattice vibration [116, 117] which are expected to disappear in the amorphous state. Thus, this region of the spectrum should provide a good discriminator between crystalline and amorphous lactose. Prior to perform-ing the quantification analysis, several spectral pre-processing methods were used to adjust for the background, including: removal of straight baseline between the spectral values at the interval endpoints (A), removal of straight
III Paper III IV Paper IV

49
baseline between the Savitsky-Golay filtered spectral values at the interval endpoints (B), removal of polynomial baseline according to the polyfit algo-rithm (C) [118], standard normal variate (SNV) method (D), extended multi-ple scattering correction (EMSC) methods (E, F) and pre-processing method provided by PeakFit software, with removal of straight baseline where the second derivative of the data was used to identify the interval endpoints (G).The influence of these pre-processing methods on the several quantifica-tion approaches were evaluated. Among these, the two straight baseline pre-processing methods (A and B) gave the best and almost equal performance in combination with principal component analysis (PCA), and were able to quantify the overall apparent amorphous content below 1% (Table 6). Using the peak parameter analysis for quantification of the apparent amorphous content was inferior to the multivariate methods most, probably due to the fact that only a part of the wavenumber region was used in these cases, using less of the available spectral information in the quantification procedure.
Table 6. The apparent amorphous fraction determined in lactose milled for 10 min using different pre-processing methods and different quantification approaches.
Pre-processing methods
A B C D E F G
Calculated apparent amorphous fraction (w/w%)
PCA 0.84 0.86 3.57 1.64 2.37 2.36 - CLS 1.21 1.24 4.12 2.68 2.40 2.89 - Peak amplitude1 -0.04 -0.04 2.26 - - 1.81 0.17 Peak areas2 0.14 0.16 2.68 - - 1.88 -0.11 Ratios of peak areas3 0.01 0.04 1.41 - - 1.34 -0.29 Ratios of peak amplitude4 0.28 0.29 2.71 - - 2.15 0.43 PCA: Principal component analysis. CLS: Classical least square analysis. 1Single peak amplitude of peak 6 (Figure 21). 2Integrated peak areas of peaks 5 and 6 (Figure 21). 3Ratios of integrated peak areas of peak 6 and summed areas of peaks 6 and 7 (Figure 21). 4Ratio of peak amplitudes for peak 7 and 6 (Figure 21).
Representativeness of calibration method IV
In order to explore the applicability of calibration method containing of crys-talline and amorphous domains for quantification analysis of the disorder brought about by mechanical processing, the Raman spectra of milled sam-ples were compared to synthesised theoretical spectra with the corresponding amorphous content. The synthesised spectra generally captured the overall profiles of the measured spectra well (Figure 21), however minor systematic
IV Paper IV

50
discrepancies were noted for more disordered samples. For the lowest appar-ent amorphous content, the two spectra overlapped, as expected, since the sample was almost entirely crystalline. For the higher apparent amorphous content, the peaks with a high relative intensity in the crystalline sample (peaks labelled with black numbers), rather well overlapped with the corre-sponding physical mixture, while the peaks with a high relative intensity in the amorphous sample (peaks labelled with red numbers) were merged and offset relative to those for the corresponding physical mixture. It was con-cluded that by synthesising a spectrum using the crystalline and amorphous spectra, it is possible to obtain a reasonable description of the spectroscopic pattern of the milled material. Thus one can think that the disorder of the milled particles is caused by vitrification, i.e. by the formation of amorphous regions at the surface or dispersed within the particles as amorphous do-mains. However, there were noticeable differences between the measured and synthesised Raman spectra, which may indicate that the nature of the milled particles cannot be described solely by a two-state system with amor-phous and crystalline domains.

51
Figure 21. Pre-processed Raman spectra of milled lactose (red dashed line) and the synthesised spectra (the black line) with the corresponding amorphous content. (A) Shows spectra for lactose milled for 10 min; (B) shows spectra for lactose milled for 300 min and (C) shows spectra for lactose milled for 1200 min milled lactose. The Raman spectra of milled samples are pre-processed using pre-processing method A and quantified by PCA. The synthesised spectra are derived from the amorphous content obtained for lactose using PCA. Peaks co-varying with increasing amount amorphous content are labelled with red numbers and peaks co-varying with increas-ing amount crystalline content are labelled with black numbers. (Adopted from Paz-esh et al. [paper IV]. Reproduced with permission of Elsevier).

52
Characterisation of disorder by AFM V
The transformation of crystalline particles to disordered ones during me-chanical treatment occurs by a melt mediated solid transformation caused by friction developed at inter-particle contacts during processing, and might therefore be described as a surface process. Thus with the aim of furthering the understanding of the mechanisms of disorder and subsequently identify-ing the nature of disordered particles, the capability of the AFM technique to probe changes in surface properties of milled lactose particles was evaluated as these are indicative of surface amorphisation. Two approaches were used to characterise the disorder on the surface of milled particles by AFM and in both approaches the surface energy dissipa-tion (the area between loading and unloading curves in the force-separation profile, Figure 12) was studied. In the first approach, energy dissipation data of milled lactose particles were compared to data for the completely crystal-line and for amorphous lactose (spray-dried). In the other approach, the changes in dissipation data over time under ambient conditions favourable for recrystallisation of the amorphous regions of the milled lactose particles were evaluated. Since the amorphous and crystalline solids differ in their structural confor-mation, the differences in energy dissipation were expected to be significant. However, the energy dissipation of the lactose milled for 1 hour (and there-fore partially amorphous) fell between the dissipation energy of the crystal-line and the completely amorphous reference samples. Thus it was suggested that the energy dissipation was a useful parameter for studying disorder on the surface of particles. In order to obtain a representative assessment of the surface properties of samples, multiple areas were analysed from different particles of each sam-ple and an average dissipation value was determined for each scanned area. The cumulative number of scanned areas vs. the binned average dissipation plot was then used to evaluate the degree of disorder (Figure 22a). A thresh-old value of 1000 eV was chosen to characterise the differences for amor-phous and crystalline regions. Even though the average dissipation value of the scanned area was useful for evaluating the disorder, in some cases the average could be skewed by regions with significant deviation from the mean value, therefore the percentage area of the scan above the threshold value was preferred to use, instead of the average value (Figure 22b).The degree of surface disorder for the evaluated sample was estimated by the area percentage with dissipation values above the threshold value (crystal-
V Paper V
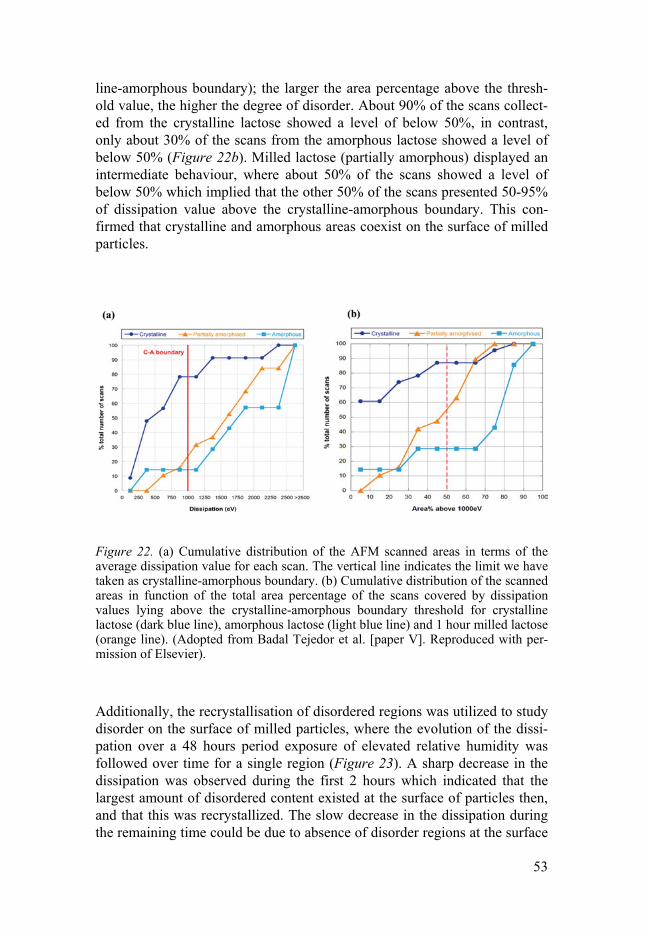
53
line-amorphous boundary); the larger the area percentage above the thresh-old value, the higher the degree of disorder. About 90% of the scans collect-ed from the crystalline lactose showed a level of below 50%, in contrast, only about 30% of the scans from the amorphous lactose showed a level of below 50% (Figure 22b). Milled lactose (partially amorphous) displayed an intermediate behaviour, where about 50% of the scans showed a level of below 50% which implied that the other 50% of the scans presented 50-95% of dissipation value above the crystalline-amorphous boundary. This con-firmed that crystalline and amorphous areas coexist on the surface of milled particles.
Figure 22. (a) Cumulative distribution of the AFM scanned areas in terms of the average dissipation value for each scan. The vertical line indicates the limit we have taken as crystalline-amorphous boundary. (b) Cumulative distribution of the scanned areas in function of the total area percentage of the scans covered by dissipation values lying above the crystalline-amorphous boundary threshold for crystalline lactose (dark blue line), amorphous lactose (light blue line) and 1 hour milled lactose (orange line). (Adopted from Badal Tejedor et al. [paper V]. Reproduced with per-mission of Elsevier).
Additionally, the recrystallisation of disordered regions was utilized to study disorder on the surface of milled particles, where the evolution of the dissi-pation over a 48 hours period exposure of elevated relative humidity was followed over time for a single region (Figure 23). A sharp decrease in the dissipation was observed during the first 2 hours which indicated that the largest amount of disordered content existed at the surface of particles then, and that this was recrystallized. The slow decrease in the dissipation during the remaining time could be due to absence of disorder regions at the surface

54
after recrystallisation. After 48 hours exposure to elevated relative humidity, the dissipation value was comparable to the value characteristic of the crys-talline lactose sample. A comparison of the energy dissipation data from AFM with quantification data using Raman spectroscopy substantiates the conclusion that milled lac-tose particles are more disordered at the surface than in the bulk (Figure 24). Thus it seems natural to think that milling results in the formation of amor-phous regions and that the apparent amorphous content of the milled parti-cles is explained predominately by the formation of amorphous regions lo-cated at the surface.
Figure 23. Continuous measurement on the same area of a particle of the partially amorphous lactose (lactose milled for1 hour) under conditions of 55-66% relative humidity for 48 hours. (Adopted from Badal Tejedor et al. [paper V]. Reproduced with permission of Elsevier).

55
Figure 24. The apparent amorphous content of crystalline, 1 hour milled (partially amorphous) and amorphous (spray-dried) lactose using Raman spectroscopy (red bars) and atomic force microscopy (grey bars).

56
Conclusions
The work performed for this thesis investigated the mechanisms involved in process-induced disorder and the types of particle contact processes that caused disorder during mechanical processing of pharmaceutical powders. The most important inter-particulate contact process giving rise to disorder during powder flow and ball milling was sliding caused by shear stress. On the molecular scale, this transformation is thought to be caused by the melt-ing of solid due to generation of heat during shearing followed by solidifica-tion into an amorphous phase, i.e. vitrification. The studies revealed that the plastic stiffness and elastic stiffness of milling-induced disordered particles and particles exhibiting a two-state particle model representing amorphous and crystalline domains were similar. It was thus concluded that the physical nature of milled lactose particles can with regard to plastic stiffness be explained by a two-state system containing crystalline and amorphous domains. However these particles showed differ-ent moisture characteristics in the presence of moisture, which may indicate that, the nature of the milled particles cannot be described solely by a two-state particle model.III This was also indicated by the difference between Raman spectra of milled samples and of synthesised theoretical spectra with the corresponding amorphous content.IV The studies demonstrate that the relationship between comminution and amorphisation during powder milling in a ball mill can be described as con-sisting of two regimes, a comminution dominated regime followed by an amorphisation dominated regime. The rate constant of comminution and amorphisation can be controlled by a combination of properties of the mate-rial and the stress energy distribution in the milling jar. The stress energy in a ball mill is regulated by ball motion pattern in the milling jar, which in turn is affected by a series of process parameters. Thus the process parameters used, regulate if milling occurs in comminution regime or will proceed into amorphisation regime.
III Paper III IV Paper IV
57
Finally, two promising approaches for the quantification and characterisation of process-induced disorder have been demonstrated. Raman spectroscopy proved to be an appropriate and effective technique in the quantification of the apparent amorphous content of milled lactose powder. This was indicat-ed by the reasonable conformity achieved between spectra of milled sample and synthesised spectra with a corresponding amorphous content. Applying the principal component analysis (PCA) and using a straight baseline ap-proach as pre-processing method make it possible to quantify an overall amorphous content below 1%. To characterise disorder on the particle sur-faces, AFM was a useful approach. The cumulative distributions of dissipa-tion data, either of average dissipation per scan, or the area per scan above a certain threshold were a useful means of graphically comparing the surface of partially disordered particles with the surface of completely amorphous and crystalline lactose particles. In addition, the changes in dissipation data over time under ambient conditions favourable for recrystallisation con-firmed that the dissipation measurement is a quite useful means to estimate the degree of disorder on the surface of particles and that significant recrys-tallisation occurs at the surface, i.e. the largest amount of disordered content exists at the surface of particles.

58
Future perspective
Knowledge of mechanisms causing disorder in the pharmaceutical materials by mechanical processing has been improved over the years. However, there is still considerable uncertainty regarding disordering mechanisms, thus there are still needs for further surveys. For example, it is not clear, whether the disordering upon mechanical processing is triggered by the strong lattice strains resulting from the many structural defects, by the crystallite size re-duction or by the combination of both effects. One great deal of this difficul-ty stems from the fact that the decreasing crystallite size and the increasing defect density both occur simultaneously and are strongly correlated. Another issue that needs to be considered is detection of disordered content. Since there are a variety of techniques available to detect the disordered con-tent in a material, it is important to understand the type of information that is needed and to find the best approach for the system. It is also important to understand which kind of disordered content that is being measured e.g. if it is bulk amorphous, different type of defects and/or crystallites are being measured. The here investigated Raman spectroscopy approach could be combined with theoretical modelling of vibrations spectra for different types of disorder, which might be a way to further characterise the proceeding of structural changes during different type of mechanical processes. More on, to better understand the disordering mechanisms of a crystalline solid during mechanical processing, the use of low frequency Raman that offers a more sensitive probe of the lattice vibration of a crystalline structure could be of potential value.

59
Populärvetenskaplig sammanfattning
Processinducerad oordning Det fasta tillståndets egenskaper av en läkemedelsubstans och hjälpämne har stort inflytande på de fysikaliska och biofarmaceutiska egenskaperna hos en produkt. Jämfört med en oordnad form visar den kristallina formen av en substans ofta lägre löslighet, lägre upplösningshastighet och sämre biotill-gänglighet. Den kristallina formen visar däremot en högre fysikalisk och termodynamisk stabilitet, särskilt om substansen är i dess mest stabila form. Det är därför gynnsamt att använda den kristallina stabila formen av läkeme-delsubstanser och hjälpämnen då man utvecklar ett läkemedel, eftersom en av de viktigaste förutsättningarna i läkemedelsutvecklingen är att uppnå en reproducerbar och robust produkt. Detta kan vara en utmaning i praktiken då de inneboende egenskaperna hos en substans kan förändras under de delpro-cesser, som den genomgår innan den ingår i en färdig produkt. Ett exempel på en sådan delprocess är malning dvs. finfördelning, där den mekaniska påfrestningen som substansen utsätts för kan omvandla den stabila kristallina formen av substansen till en oavsiktligt oordnad form. Denna fasövergång från kristallin till oordnad form kallas processinducerad oordning. Den oordnade formen av en substans har emellertid ofta gynnsamma formu-leringsegenskaper, som förbättrad kompakterbarhet, ökad löslighet, förbätt-rad upplösningshastighet. Det kan därför vara fördelaktigt att använda denna form i formuleringen av läkemedel. Dock innebär detta stora utmaningar för utvecklingen av en produkt på grund av minskad kemisk och fysikalisk sta-bilitet i denna form. Oavsett om den oordnade formen erhållits avsiktligt eller oavsiktligt i tillverkningen, så bör den kontrolleras och karakteriseras. För att erhålla strategier för kontroll eller för att förhindra uppkomsten av oordning under tillverkningen så är det önskvärt att förstå de bakomliggande mekanismer som är involverade vid mekanisk bearbetning. Den övergripande målsättningen med denna avhandling är att bidra till att klargöra de bakomliggande mekanismer, som orsakar oordning i en substans vid den tekniska hantering som förekommer i en formuleringsprocess, såsom blandning och finfördelning. Vidare syftar avhandlingen till att undersöka tekniker för kvantifiering av lågt oordnat innehåll i mekanisk bearbetad sub-stans och karakterisering av oordning på ytan av pulverpartiklar. Utöver

60
detta avser avhandlingen att även utreda den fysikaliska uppbyggnaden av substansen efter mekanisk bearbetning. Resultaten visar att den viktigaste interpartikulära processen som orsakade oordning under blandning och finfördelning var nötning av partiklar. På molekylär nivå orsakas omvandlingen av smältning på grund av utvecklad friktionsvärme under nötning följt av stelnande till en oordnad fas. Plastiska och elastiska egenskaper av mekanisk bearbetade partiklar visade sig vara lika som för fysikaliska blandningar, som här använts som en tvåfas parti-kelmodell för partiklar bestående av kristallina och amorfa områden. Dock hade dessa olika fuktupptagningsförmåga och därför kunde inte den fysika-liska uppbyggnaden av de mekanisk bearbetade partiklarna beskrivas enbart som en tvåfas partikel. Studien visar att förhållandet mellan finfördelning och uppkomsten av oordning under malning kan beskrivas som bestående av två regimer, först en finfördelningsdominerad regim följt av en oordnadsdo-minerad regim. Hastighetskonstanten för finfördelning och utvecklingen av oordning i de olika regimerna kan kontrolleras genom en kombination av egenskaperna hos en substans dvs. dess benägenhet att fragmenteras och bli oordnad, och fördelningen av spänningsenergi under processen som regleras av en rad processparametrar. Ramanspektroskopi visade sig vara en lämplig och effektiv teknik för kvantifiering av låga halter av oordnat innehåll i me-kanisk bearbetad substans. Atomkraftmikroskopi visade sig också vara en användbar teknik för att studera oordning på ytan av pulverpartiklar. Sammanfattningsvis har erhållna resultat i avhandlingen bidragit till kunskap om bakomliggande mekanismer som orsakar oordning i läkemedelsubstanser och hjälpämnen under tillverkningsprocesser. Vidare har studierna även gett en ökad förståelse för den fysikaliska uppbyggnaden av substansen efter mekanisk bearbetning. Två lovande analystekniker har också utvärderats för att kvantifiera låga halter av oordnat innehåll i mekanisk bearbetad substans och för att karakterisera oordning på ytan av pulverpartiklar.

61
Acknowledgements
The work in this thesis was carried out at the department of pharmacy, Fac-ulty of pharmacy, Uppsala University, Sweden. The Recipharm Pharmaceutical Development AB is gratefully acknowl-edged for their financial support for this work.
The travel grants from Apotekarsocieteten, IF:s stiftelse, is gratefully acknowledged that made it possible for me to participate at various confer-ences. I would like to express my sincere gratitude to all of the people who contrib-uted to make this work possible: Professor Göran Alderborn, min handledare, för att du har stöttat mig ge-nom din varsamma och engagerade handledning och gett mig utrymme att utvecklas som forskare. Genom att jobba med dig har jag fått ta del av ditt förhållningssätt som genomsyras av respekt, noggrannhet, skärpa, glädje och nyfikenhet inför alla delar i forskningsprocessen. På ett sätt är det sorgligt att den här perioden i mitt liv är över eftersom jag har så mycket kvar att lära av dig. Dr. Jonas Berggren, min biträdande handledare, för alla stimulerande dis-kussioner och givande möten. Dr. Tobias Bramer, för din glada entusiasm för mina projekt och för all hjälp jag fick av dig under mitt första år som doktorand. Professor Peter Lazor, för din vänlighet och generositet med att låna ut ditt Raman instrument. Professor Hans Lennernäs, för din vänlighet med att låna ut din kulkvarn. Professor Mark Rutland, Dr. Anna Millqvist-Fureby, Dr. Nicklas Nordgren och Dr. Maria Badal Tejedor, för ett givande samarbete och för att ni visade intresse för mina oordnade partiklar.

62
Stort tack till Ulla, Eva NA, Eva L, Birgitta, Heléne, Pernilla, Annette, och alla andra som har hjälpt till med administrativa genom åren.
Tack alla nuvarande och gamla kollegor på institutionen för alla trevliga fika stunder och luncher. Ett varmt tack till er alla gamla och nuvarande kollegor i galenikgruppen. Jag vill särskilt uppmärksamma: Dr. Lucia Lazorova, för din omtanke, kärlek och för lyckat samarbete i Ra-man projektet. Christin Magnusson, för att du lät mig att vara salvtant tillsammans med dig och för allt du lärt mig om extemporetillverkning. Dr. Johan Gråsjö, för din proffsiga insats i Raman projektet och för allt stöd jag fått av dig. Det har varit kul att jobba med dig. Tack även för PG-boxen, det är så fantastiskt skönt att kunna jobba i dagsljuset. Dr. Foad Mahmoodi, för ditt stöd, tips och uppmuntran under avhandlings-skrivandet. Dr. Ann-Sofie Persson, för att du alltid trott på mig och har påmint mig om stort och smått i livet när jag mentalt har varit borta i någon avhandlingsfun-dering. Tack för allt stöd och de roliga stunder som vi har haft på kontoret och annat håll. Kenth Persson, civilingenjören från KTH, för att du hade koll på oss och gjorde ett schema för utförandet av arbete III i avhandlingen. ~ Jag vill även tacka min familj, släkt och vänner för att ni alltid finns där och uppmuntrar mig. Mamma, tack för att du alltid uppmuntrat mig och stöttat mig, vad jag än har fått för mig. Du är den bästa mamma man kan ha. Dostet daram! Mina syskon, tack för alla skratt, glada minnen och roliga stunder vi tillbrin-gat på skype. Ni känns så nära och ni är min styrka, utan er hade den här resan varit omöjligt. Min kära systerson Arian, tack för att du är så förstående och för de nätter som du satt uppe för min skull och läste franska när jag skrev mina manu-skript.
Samaneh

63
References
1. Guo, Y., S.R. Byrn, and G. Zografi, Physical characteristics and chemical degradation of amorphous quinapril hydrochloride. J Pharm Sci, 2000. 89(1): p. 128-43.
2. Hancock, B.C. and G. Zografi, Characteristics and significance of the amorphous state in pharmaceutical systems. J Pharm Sci, 1997. 86(1): p. 1-12.
3. Byrn, S., et al., Pharmaceutical Solids: A Strategic Approach to Regulatory Considerations. Pharmaceutical Research, 1995. 12(7): p. 945-954.
4. Sebhatu, T. and G. Alderborn, Relationships between the effective interparticulate contact area and the tensile strength of tablets of amorphous and crystalline lactose of varying particle size. Eur J Pharm Sci, 1999. 8(4): p. 235-42.
5. Murdande, S.B., et al., Solubility advantage of amorphous pharmaceuticals: I. A thermodynamic analysis. Journal of Pharmaceutical Sciences, 2010. 99(3): p. 1254-1264.
6. Bahl, D., J. Hudak, and R.H. Bogner, Comparison of the Ability of Various Pharmaceutical Silicates to Amorphize and Enhance Dissolution of Indomethacin Upon Co-grinding. Pharmaceutical Development and Technology, 2008. 13(3): p. 255-269.
7. Yu, L., Amorphous pharmaceutical solids: preparation, characterization and stabilization. Advanced Drug Delivery Reviews, 2001. 48(1): p. 27-42.
8. Grant, D.J.W., Theory and origin of polymorphism, in Polymorphism in the pharmaceutical solids 1999, Marcel Dekker: New York. p. 1-33.
9. Stillinger, F.H. and T.A. Weber, Packing Structures and Transitions in Liquids and Solids. Science, 1984. 225(4666): p. 983-989.
10. Newman, A. and G. Zografi, Critical considerations for the qualitative and quantitative determination of process-induced disorder in crystalline solids. J Pharm Sci, 2014. 103(9): p. 2595-604.
11. Graeser, K.A., et al., The Role of Configurational Entropy in Amorphous Systems. Pharmaceutics, 2010. 2(2): p. 224-244.
12. Hellrup, J., G. Alderborn, and D. Mahlin, Inhibition of Recrystallization of Amorphous Lactose in Nanocomposites Formed by Spray-Drying. J Pharm Sci, 2015. 104(11): p. 3760-9.

64
13. Hellrup, J. and D. Mahlin, Pharmaceutical micro-particles give amorphous sucrose higher physical stability. Int J Pharm, 2011. 409(1-2): p. 96-103.
14. Mosquera-Giraldo, L.I., et al., Mechanistic Design of Chemically Diverse Polymers with Applications in Oral Drug Delivery. Biomacromolecules, 2016. 17(11): p. 3659-3671.
15. Armstrong, N.A. and R.V. Griffiths, The effects of moisture on the flow properties and compression of phenacetin, paracetamol and dextrose monohydrate. Pharm Acta Helv, 1970. 45(11): p. 692-700.
16. Amidon, G.E. and M.E. Houghton, The effect of moisture on the mechanical and powder flow properties of microcrystalline cellulose. Pharm Res, 1995. 12(6): p. 923-9.
17. Sun, C.C., Mechanism of moisture induced variations in true density and compaction properties of microcrystalline cellulose. Int J Pharm, 2008. 346(1-2): p. 93-101.
18. Ahlneck, C. and G. Zografi, The molecular basis of moisture effects on the physical and chemical stability of drugs in the solid state. International Journal of Pharmaceutics, 1990. 62(2): p. 87-95.
19. Zografi, G., States of Water Associated with Solids. Drug Development and Industrial Pharmacy, 1988. 14(14): p. 1905-1926.
20. Burnett, D.J., F. Thielmann, and J. Booth, Determining the critical relative humidity for moisture-induced phase transitions. International Journal of Pharmaceutics, 2004. 287(1–2): p. 123-133.
21. Willart, J.F., et al., Solid-state vitrification of crystalline griseofulvin by mechanical milling. J Pharm Sci, 2012. 101(4): p. 1570-7.
22. Huttenrauch, R., S. Fricke, and P. Zielke, Mechanical activation of pharmaceutical systems. Pharm Res, 1985. 2(6): p. 302-6.
23. Karmwar, P., et al., Investigation of properties and recrystallisation behaviour of amorphous indomethacin samples prepared by different methods. Int J Pharm, 2011. 417(1-2): p. 94-100.
24. Surana, R., A. Pyne, and R. Suryanarayanan, Effect of preparation method on physical properties of amorphous trehalose. Pharm Res, 2004. 21(7): p. 1167-76.
25. Mahlin, D., et al., Toward in silico prediction of glass-forming ability from molecular structure alone: a screening tool in early drug development. Mol Pharm, 2011. 8(2): p. 498-506.
26. Feng, T., R. Pinal, and M.T. Carvajal, Process induced disorder in crystalline materials: differentiating defective crystals from the amorphous form of griseofulvin. J Pharm Sci, 2008. 97(8): p. 3207-21.
27. Angell, C.A., Structural instability and relaxation in liquid and glassy phases near the fragile liquid limit. Journal of Non-Crystalline Solids, 1988. 102(1): p. 205-221.
28. Patterson, J.E., et al., The influence of thermal and mechanical preparative techniques on the amorphous state of four poorly soluble compounds. J Pharm Sci, 2005. 94(9): p. 1998-2012.

65
29. Forster, A., et al., The potential of small-scale fusion experiments and the Gordon-Taylor equation to predict the suitability of drug/polymer blends for melt extrusion. Drug Dev Ind Pharm, 2001. 27(6): p. 549-60.
30. Chiou, D., T.A.G. Langrish, and R. Braham, The effect of temperature on the crystallinity of lactose powders produced by spray drying. Journal of Food Engineering, 2008. 86(2): p. 288-293.
31. Haque, M.K. and Y.H. Roos, Crystallization and X-ray diffraction of spray-dried and freeze-dried amorphous lactose. Carbohydrate Research, 2005. 340(2): p. 293-301.
32. Vogt, M., K. Kunath, and J.B. Dressman, Dissolution enhancement of fenofibrate by micronization, cogrinding and spray-drying: comparison with commercial preparations. Eur J Pharm Biopharm, 2008. 68(2): p. 283-8.
33. Guns, S., et al., Comparison between hot-melt extrusion and spray-drying for manufacturing solid dispersions of the graft copolymer of ethylene glycol and vinylalcohol. Pharm Res, 2011. 28(3): p. 673-82.
34. O'Donnell, K.P., et al., Atmospheric freeze drying for the reduction of powder electrostatics of amorphous, low density, high surface area pharmaceutical powders. Drug Dev Ind Pharm, 2013. 39(2): p. 205-17.
35. Bhardwaj, S.P. and R. Suryanarayanan, Molecular Mobility as an Effective Predictor of the Physical Stability of Amorphous Trehalose. Molecular Pharmaceutics, 2012. 9(11): p. 3209-3217.
36. Takacs, L., M. Carey Lea, the first mechanochemist. Journal of Materials Science, 2004. 39(16): p. 4987-4993.
37. Mechanochemistry and mechanical activation of solids, in Process Metallurgy, P. BalÁž, Editor. 2000, Elsevier. p. 1-14.
38. Zdujić, M., Jovalekić, Č., Poleti, D., Veljković, I., Karanović, L., Mechanochemically induced amorphous/crystalline phase transition in the Bi4Ti3O12 compound. Materials Letters, 2009. 63(29): p. 2542-2544.
39. Alex, T.C., et al., Mechanically induced reactivity of gibbsite: Part 1. Planetary milling. Powder Technology, 2014. 264: p. 105-113.
40. Sovago, I., et al., Properties of the Sodium Naproxen-Lactose-Tetrahydrate Co-Crystal upon Processing and Storage. Molecules, 2016. 21(4): p. 509.
41. Friščić, T. and W. Jones, Recent Advances in Understanding the Mechanism of Cocrystal Formation via Grinding. Crystal Growth & Design, 2009. 9(3): p. 1621-1637.
42. Karmwar, P., et al., Effect of different preparation methods on the dissolution behaviour of amorphous indomethacin. Eur J Pharm Biopharm, 2012. 80(2): p. 459-64.
43. Caron, V., et al., Solid state amorphization kinetic of alpha lactose upon mechanical milling. Carbohydr Res, 2011. 346(16): p. 2622-8.
44. Parrott, E.L., Milling of pharmaceutical solids. Journal of Pharmaceutical Sciences, 1974. 63(6): p. 813-829.

66
45. Bisrat, M. and C. Nyström, Physicochemical aspects of drug release. VIII. The relation between particle size and surface specific dissolution rate in agitated suspensions. International Journal of Pharmaceutics, 1988. 47(1): p. 223-231.
46. Shakhtshneider, T.P., Phase transformations and stabilization of metastable states of molecular crystals under mechanical activation. Solid State Ionics, 1997. 101: p. 851-856.
47. Dudognon, E., et al., Formation of budesonide/α-lactose glass solutions by ball-milling. Solid State Communications, 2006. 138(2): p. 68-71.
48. Burmeister, C.F. and A. Kwade, Process engineering with planetary ball mills. Chemical Society Reviews, 2013. 42(18): p. 7660-7667.
49. Rosenkranz, S., S. Breitung-Faes, and A. Kwade, Experimental investigations and modelling of the ball motion in planetary ball mills. Powder Technology, 2011. 212(1): p. 224-230.
50. Mio, H., et al., Effects of rotational direction and rotation-to-revolution speed ratio in planetary ball milling. Materials Science and Engineering: A, 2002. 332(1–2): p. 75-80.
51. Stender, H.H., A. Kwade, and J. Schwedes, Stress energy distribution in different stirred media mill geometries. International Journal of Mineral Processing, 2004. 74, Supplement: p. S103-S117.
52. Schmidt, R., et al., Effect of Reaction Parameters on the Synthesis of 5-Arylidene Barbituric Acid Derivatives in Ball Mills. Organic Process Research & Development, 2015. 19(3): p. 427-436.
53. Hickey, A.J. and D. Ganderton, Size reduction and classification in Pharmaceutical process engineering. 2001, Marcel Dekker: New York. p. 174-197.
54. Roberts, R.J. and R.C. Rowe, Brittle-ductile transitions in sucrose and the influence of lateral stresses during compaction. J Pharm Pharmacol, 2000. 52(2): p. 147-50.
55. Delogu, F. and G. Cocco, Weakness of the “hot spots” approach to the kinetics of mechanically induced phase transformations. Journal of Alloys and Compounds, 2008. 465(1–2): p. 540-546.
56. Maurice, D.R. and T.H. Courtney, The physics of mechanical alloying: A first report. Metallurgical Transactions A, 1990. 21(1): p. 289-303.
57. Bhattacharya, A.K. and E. Arzt, Temperature rise during mechanical alloying. Scripta Metallurgica et Materialia, 1992. 27(6): p. 749-754.
58. Otsuka, M., T. Matsumoto, and N. Kaneniwa, Effect of environmental temperature on polymorphic solid-state transformation of indomethacin during grinding. Chem Pharm Bull (Tokyo), 1986. 34(4): p. 1784-93.
59. Crowley, K.J. and G. Zografi, Cryogenic grinding of indomethacin polymorphs and solvates: assessment of amorphous phase formation and amorphous phase physical stability. J Pharm Sci, 2002. 91(2): p. 492-507.

67
60. Descamps, M. and J.F. Willart, Perspectives on the amorphisation/milling relationship in pharmaceutical materials. Adv Drug Deliv Rev, 2016. 100: p. 51-66.
61. Willart, J.F., et al., Amorphization of sugar hydrates upon milling. Carbohydr Res, 2010. 345(11): p. 1613-6.
62. Twitchell, A.M., Mixing, in Aulton's Pharmaceutics: The Design and Manufacture of Medicines, M.E. Aulton, Taylor, Kevin. M. G., Editor. 2013, Churchill Livingstone/Elsevier: Edinburgh. p. 170-186.
63. Okamoto, P.R., N.Q. Lam, and L.E. Rehn, Physics of Crystal-to-Glass Transformations, in Solid State Physics, E. Henry and S. Frans, Editors. 1999, Academic Press. p. 1-135.
64. Defect-induced solid state amorphization of molecular crystals. Journal of Applied Physics, 2012. 111(7): p. 073505.
65. Feng, T., S. Bates, and M.T. Carvajal, Toward understanding the evolution of griseofulvin crystal structure to a mesophase after cryogenic milling. International Journal of Pharmaceutics, 2009. 367(1–2): p. 16-19.
66. Dujardin, N., et al., Mechanism of solid state amorphization of glucose upon milling. J Phys Chem B, 2013. 117(5): p. 1437-43.
67. Saleki-Gerhardt, A., et al., Hydration and dehydration of crystalline and amorphous forms of raffinose. J Pharm Sci, 1995. 84(3): p. 318-23.
68. Buckton, G., P. Darcy, and A.J. Mackellar, The use of isothermal microcalorimetry in the study of small degrees of amorphous content of powders. International Journal of Pharmaceutics, 1995. 117(2): p. 253-256.
69. Hockerfelt, M.H., C. Nystrom, and G. Alderborn, Dry mixing transformed micro-particles of a drug from a highly crystalline to a highly amorphous state. Pharm Dev Technol, 2009. 14(3): p. 233-9.
70. Hogan, S.E. and G. Buckton, The quantification of small degrees of disorder in lactose using solution calorimetry. International Journal of Pharmaceutics, 2000. 207(1–2): p. 57-64.
71. Mackin, L., et al., Quantification of low levels (<10%) of amorphous content in micronised active batches using dynamic vapour sorption and isothermal microcalorimetry. Int J Pharm, 2002. 231(2): p. 227-36.
72. Sheokand, S., S.R. Modi, and A.K. Bansal, Dynamic vapor sorption as a tool for characterization and quantification of amorphous content in predominantly crystalline materials. J Pharm Sci, 2014. 103(11): p. 3364-76.
73. Price, R. and P.M. Young, On the physical transformations of processed pharmaceutical solids. Micron, 2005. 36(6): p. 519-524.
74. Begat, P., et al., The effect of mechanical processing on surface stability of pharmaceutical powders: visualization by atomic force microscopy. J Pharm Sci, 2003. 92(3): p. 611-20.

68
75. Ticehurst, M.D., et al., Characterisation of the surface properties of α-lactose monohydrate with inverse gas chromatography, used to detect batch variation. International Journal of Pharmaceutics, 1996. 141(1): p. 93-99.
76. Murphy, B.M., S.W. Prescott, and I. Larson, Measurement of lactose crystallinity using Raman spectroscopy. Journal of Pharmaceutical and Biomedical Analysis, 2005. 38(1): p. 186-190.
77. Taylor, L.S. and G. Zografi, The quantitative analysis of crystallinity using FT-Raman spectroscopy. Pharm Res, 1998. 15(5): p. 755-61.
78. Seyer, J.J., P.E. Luner, and M.S. Kemper, Application of diffuse reflectance near-infrared spectroscopy for determination of crystallinity. J Pharm Sci, 2000. 89(10): p. 1305-16.
79. Gombás, Á., et al., Quantitative determination of crystallinity of alpha-lactose monohydrate by Near Infrared Spectroscopy (NIRS). International Journal of Pharmaceutics, 2003. 256(1–2): p. 25-32.
80. Gustafsson, C., et al., Comparison of solid-state NMR and isothermal microcalorimetry in the assessment of the amorphous component of lactose. International Journal of Pharmaceutics, 1998. 174(1–2): p. 243-252.
81. Stephenson, G.A., R.A. Forbes, and S.M. Reutzel-Edens, Characterization of the solid state: quantitative issues. Advanced Drug Delivery Reviews, 2001. 48(1): p. 67-90.
82. Shah, B., V.K. Kakumanu, and A.K. Bansal, Analytical techniques for quantification of amorphous/crystalline phases in pharmaceutical solids. J Pharm Sci, 2006. 95(8): p. 1641-65.
83. Saleki-Gerhardt, A., C. Ahlneck, and G. Zografi, Assessment of disorder in crystalline solids. International Journal of Pharmaceutics, 1994. 101(3): p. 237-247.
84. Guinot, S. and F. Leveiller, The use of MTDSC to assess the amorphous phase content of a micronized drug substance. Int J Pharm, 1999. 192(1): p. 63-75.
85. Saunders, M., et al., The potential of high speed DSC (hyper-DSC) for the detection and quantification of small amounts of amorphous content in predominantly crystalline samples. Int J Pharm, 2004. 274(1-2): p. 35-40.
86. Lappalainen, M., I. Pitkänen, and P. Harjunen, Quantification of low levels of amorphous content in sucrose by hyperDSC. International Journal of Pharmaceutics, 2006. 307(2): p. 150-155.
87. Pikal, M.J., et al., Quantitative crystallinity determinations for β-lactam antibiotics by solution calorimetry: Correlations with stability. Journal of Pharmaceutical Sciences, 1978. 67(6): p. 767-773.
88. Buckton, G. and P. Darcy, The use of gravimetric studies to assess the degree of crystallinity of predominantly crystalline powders. International Journal of Pharmaceutics, 1995. 123(2): p. 265-271.

69
89. Newell, H.E., et al., The use of inverse phase gas chromatography to measure the surface energy of crystalline, amorphous, and recently milled lactose. Pharm Res, 2001. 18(5): p. 662-6.
90. Niemela, P., et al., Quantitative analysis of amorphous content of lactose using CCD-Raman spectroscopy. J Pharm Biomed Anal, 2005. 37(5): p. 907-11.
91. Taylor, L.S. and G. Zografi, The Quantitative Analysis of Crystallinity Using FT-Raman Spectroscopy. Pharmaceutical Research, 1998. 15(5): p. 755-761.
92. Strachan, C.J., et al., Raman spectroscopy for quantitative analysis of pharmaceutical solids. J Pharm Pharmacol, 2007. 59(2): p. 179-92.
93. Byard, S.J., et al., Studies on the Crystallinity of a Pharmaceutical Development Drug Substance. Journal of Pharmaceutical Sciences, 2005. 94(6): p. 1321-1335.
94. Ueno, Y., et al., Characterization of amorphous ursodeoxycholic acid prepared by spray-drying. J Pharm Pharmacol, 1998. 50(11): p. 1213-9.
95. Byard, S.J., et al., Studies on the Crystallinity of a Pharmaceutical Development Drug Substance. Journal of Pharmaceutical Sciences. 94(6): p. 1321-1335.
96. Vitez, I.M., Utilization of DSC for Pharmaceutical crystal form quantitation. Journal of Thermal Analysis and Calorimetry, 2004. 78(1): p. 33-45.
97. Gaisford, S., Isothermal microcalorimetry for quantifying amorphous content in processed pharmaceuticals. Advanced Drug Delivery Reviews, 2012. 64(5): p. 431-439.
98. Binnig, G., C.F. Quate, and C. Gerber, Atomic force microscope. Phys Rev Lett, 1986. 56(9): p. 930-933.
99. Etzler, F.M. and M.N. Uddin, Powder Technology and Pharmaceutical Development: Particle Size and Particle Adhesion. KONA Powder and Particle Journal, 2013. 30: p. 125-143.
100. Buckton, G., Characterisation of small changes in the physical properties of powders of significance for dry powder inhaler formulations. Adv Drug Deliv Rev, 1997. 26(1): p. 17-27.
101. de Villiers, M.M., Influence of cohesive properties of micronized drug powders on particle size analysis. J Pharm Biomed Anal, 1995. 13(3): p. 191-8.
102. Rawle, C.B., et al., Towards characterization and identification of solid state pharmaceutical mixtures through second harmonic generation. Journal of Pharmaceutical Sciences, 2006. 95(4): p. 761-768.
103. Armstrong, N.A., Tablet surface area, in Pharmaceutical powder compaction technology, C.N. Göran Alderborn, Editor. 1995, Marcel Dekker: New York. p. 193-218.
104. Kaye, B.H., Permeability techniques for characterizing fine powders. Powder Technology, 1967. 1(1): p. 11-22.

70
105. Eriksson, M., C. Nyström, and G. Alderborn, Evaluation of a permeametry technique for surface area measurements of coarse particulate materials. International Journal of Pharmaceutics, 1990. 63(3): p. 189-199.
106. Alderborn, G., M. Duberg, and C. Nyström, Studies on direct compression of tablets X. Measurement of tablet surface area by permeametry. Powder Technology, 1985. 41(1): p. 49-56.
107. Schumb, W.C. and E.S. Rittner, A Helium Densitometer for Use with Powdered Materials. Journal of the American Chemical Society, 1943. 65(9): p. 1692-1695.
108. Heckel, R.W., Density-pressure relations in powder compaction Transactions of the Metallurgical Society of Aime, 1961. 221(4): p. 671-675.
109. Duberg, M. and C. Nyström, Studies on direct compression of tablets XVII. Porosity—pressure curves for the characterization of volume reduction mechanisms in powder compression. Powder Technology, 1986. 46(1): p. 67-75.
110. Klevan, I., et al., On the physical interpretation of the initial bending of a Shapiro-Konopicky-Heckel compression profile. Eur J Pharm Biopharm, 2009. 71(2): p. 395-401.
111. Sun, C. and D.J. Grant, Influence of elastic deformation of particles on Heckel analysis. Pharm Dev Technol, 2001. 6(2): p. 193-200.
112. Rowe, R.C. and R.J. Roberts, Mechanical properties in Pharmaceutical powder compaction technology, G. Alderborn and C. Nyström, Editors. 1996, Marcel Deeker: New york. p. 283-322.
113. Govedarica, B., et al., The use of single particle mechanical properties for predicting the compressibility of pharmaceutical materials. Powder Technology, 2012. 225: p. 43-51.
114. Busignies, V., et al., Compaction behaviour and new predictive approach to the compressibility of binary mixtures of pharmaceutical excipients. European Journal of Pharmaceutics and Biopharmaceutics, 2006. 64(1): p. 66-74.
115. Armstrong, N.A. and R.F. Haines-Nutt, Elastic recovery and surface area changes in compacted powder systems. Powder Technology, 1974. 9(5): p. 287-290.
116. Carteret, C., et al., Polymorphism Studied by Lattice Phonon Raman Spectroscopy and Statistical Mixture Analysis Method. Application to Calcium Carbonate Polymorphs during Batch Crystallization. Crystal Growth & Design, 2009. 9(2): p. 807-812.
117. Roy, S., B. Chamberlin, and A.J. Matzger, Polymorph Discrimination Using Low Wavenumber Raman Spectroscopy. Organic Process Research & Development, 2013. 17(7): p. 976-980.
118. Lieber, C.A. and A. Mahadevan-Jansen, Automated method for subtraction of fluorescence from biological Raman spectra. Appl Spectrosc, 2003. 57(11): p. 1363-7.


Acta Universitatis UpsaliensisDigital Comprehensive Summaries of Uppsala Dissertationsfrom the Faculty of Pharmacy
Editor: The Dean of the Faculty of Pharmacy
A doctoral dissertation from the Faculty of Pharmacy, UppsalaUniversity, is usually a summary of a number of papers. A fewcopies of the complete dissertation are kept at major Swedishresearch libraries, while the summary alone is distributedinternationally through the series Digital ComprehensiveSummaries of Uppsala Dissertations from the Faculty ofPharmacy. (Prior to January, 2005, the series was publishedunder the title “Comprehensive Summaries of UppsalaDissertations from the Faculty of Pharmacy”.)
Distribution: publications.uu.seurn:nbn:se:uu:diva-317801
ACTAUNIVERSITATIS
UPSALIENSISUPPSALA
2017