Embed Size (px)
Citation preview

Process ImprovementProcess Improvement
Check Do
Act Plan
Time
Qua
lity
leve
l
McGraw-Hill/Irwin Copyright © 2011 by The McGraw-Hill Companies, Inc. All rights reserved.

Learning ObjectivesLearning Objectives Use quality tools for process analysis
and problem solving. Describe and contrast corporate
quality improvement programs. Lead a team in a process improvement
initiative. Conduct a data envelopment analysis
(DEA).
8-2

Quality and Productivity Improvement ProcessQuality and Productivity Improvement Process
Foundations of Continuous Improvement
- Customer Satisfaction- Management by Facts- Respect for People
Plan-Do-Check-Act (PDCA) Cycle
8-3

Quality Tools for Analysis and Problem Solving
Check Sheet Run Chart Histogram Pareto Chart Flowchart Cause-and-Effect Diagram Scatter Diagram Control Chart Benchmarking
8-4

Check Sheet of Problems Month Lost Departure Mechanical Overbooked Other
Luggage Delay
January 1 2 3 3 1
February 3 3 0 1 0
March 2 5 3 2 3
April 5 4 4 0 2
May 4 7 2 3 0
June 3 8 1 1 1
July 6 6 3 0 2
August 7 9 0 3 0
September 4 7 3 0 2
October 3 11 2 3 0
November 2 10 1 0 0
December 4 12 2 0 1
Total 44 84 24 16 12
8-5

Run Chart of Departure Delays
0
2
4
6
8
10
12
14
1 2 3 4 5 6 7 8 9 10 11 12
Months
De
pa
rtu
re D
ela
ys
8-6
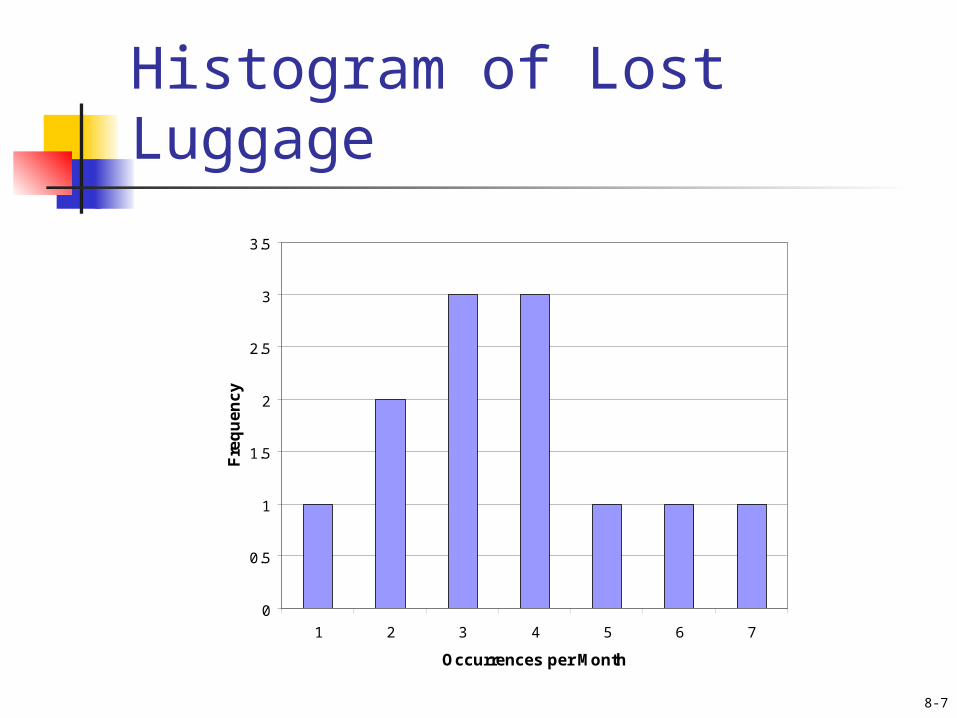
Histogram of Lost Luggage
0
0.5
1
1.5
2
2.5
3
3.5
1 2 3 4 5 6 7
Occurrences per Month
Fre
qu
en
cy
8-7

Pareto Chart of Problems
0102030405060708090
DepartureDelay
LostLuggage
Mech. Over-booked
Other
Number of Problems
8-8

Cause-and-Effect Chart for Flight Departure Delay (Fishbone Chart)
8-9

Pareto Analysis of Flight Departure Delay Causes
Cause Percentage of Incidents Cumulative Percentage
Late passengers 53.3 53.3
Waiting for pushback 15.0 68.3
Waiting for fuel 11.3 79.6
Late weight and balance sheet
8.7 88.3
8-10

Flowchart at Departure GatePassengerArrives at
Gate
Wait for row call
Proper
BoardingPass
Directed to
Appropriate
Gate
OversizeCarry-on
CheckLuggage
PassengerBoards Aircraft
Yes
Yes
No
No
8-11

Scatter Diagram of Departure Delay vs Late Passengers
0
2
4
6
8
10
12
0 1 2 3 4 5 6 7
Late Passengers
Dep
artu
re D
elay
s
8-12

Control Chart of Departure Delays
60
70
80
90
100P
erce
nta
ge
of
on
tim
e fl
igh
ts
expected
Lower Control Limit
1998 1999
n
pppUCL
1(3
n
pppLCL
1(3
8-13

Quality Improvement Programs
Personnel Programs for Quality Assurance
Deming’s 14 Point Program Baldrige National Quality Award ISO 9000 Six-Sigma
8-14

Six Sigma DMAIC Process Steps
Step Definition
Define Define project objectives, internal and external customers
Measure Measure current level of performance
Analyze Determine causes of current problems
Improve Identify how the process can be improved to eliminate the problems
Control Develop mechanisms for controlling the improved process
8-15

Mega Bytes Restaurant
1. How is the Seven-Step Method (SSM) different from Deming’s PDCA cycle?
2. Prepare a cause-and-effect or fishbone diagram for a problem such as “Why customers have long waits for coffee.” Use Figure 7.7 as a guide.
3. How would you resolve the difficulties that study teams have experienced when applying the SSM?
8-16

The Seven-Step Method (SSM)
Step 1: Define the project Step 2: Study the current situation Step 3: Analyze the potential causes Step 4: Implement a solution Step 5: Check the results Step 6: Standardize the improvement Step 7: Establish future plans
8-17

Topics for Discussion Discuss why Deming’s 14-point program was
rejected by U.S. firms but embraced by the Japanese following World War II.
Explain how the application of the DPCA cycle can support a competitive strategy of low cost leadership.
What are the limitations of “benchmarking”? Articulate a process in which DEA can be used
to improve the performance of an elementary school district.
8-18

Interactive Exercise
Perform a walk-through audit of the class experience by recording responses on a five point Likert scale using a show of hands without the professor present. Average the student responses for each statement and use a graph to compare the results with the professor’s own assessment.
8-19


