Embed Size (px)
Citation preview
Process Capability
• Enables successful manufacturing and
sales
• Prevents scrap, sorting, rework
• Allows jobs to run well
• Has major impact on cost and schedule
“Process Capability”
is the ability of a process to make a feature
within its tolerance.
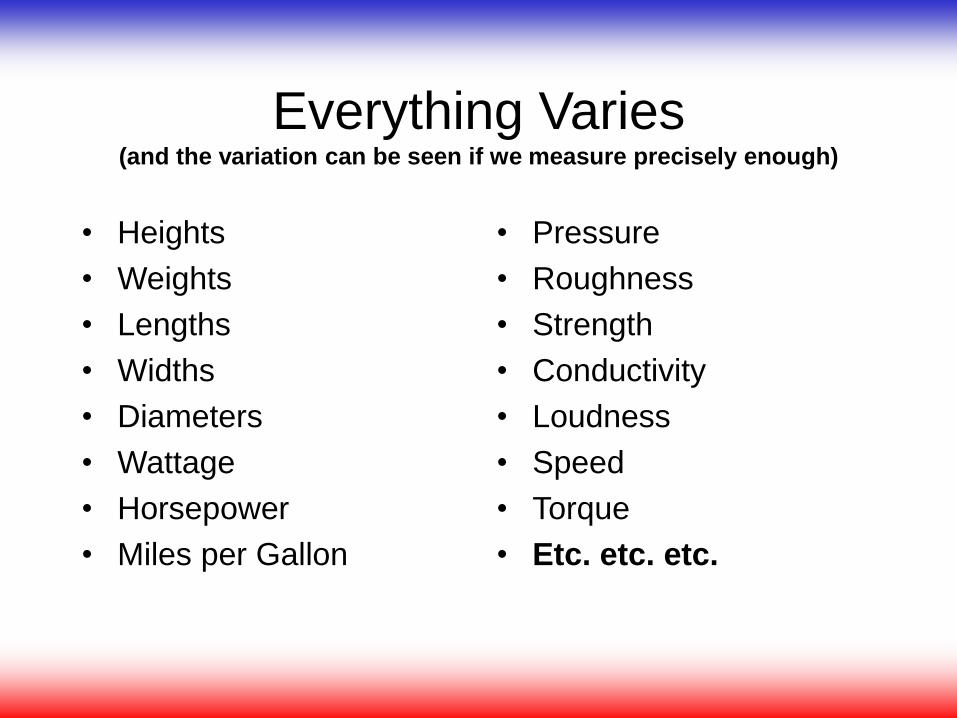
Everything Varies (and the variation can be seen if we measure precisely enough)
• Heights
• Weights
• Lengths
• Widths
• Diameters
• Wattage
• Horsepower
• Miles per Gallon
• Pressure
• Roughness
• Strength
• Conductivity
• Loudness
• Speed
• Torque
• Etc. etc. etc.
Eli Whitney in 1798
• Won a U.S. Military contract to supply 10,000 guns
• Reduced variation and created interchangeable parts for
assembly and service by:
– Installing powered factory machinery
– Using specialized fixtures, tools, jigs, templates, and end-stops
– Creating drawings, routings, operations & training
Manufacturing in the 21st Century
• International competition to provide defect-free products
at competitive cost
• Reducing variation and providing interchangeable parts
for assembly and service by:
– Using machine tools
– Using specialized fixtures, tools, jigs, templates, and end-stops
– Using drawings, routings, operations & training
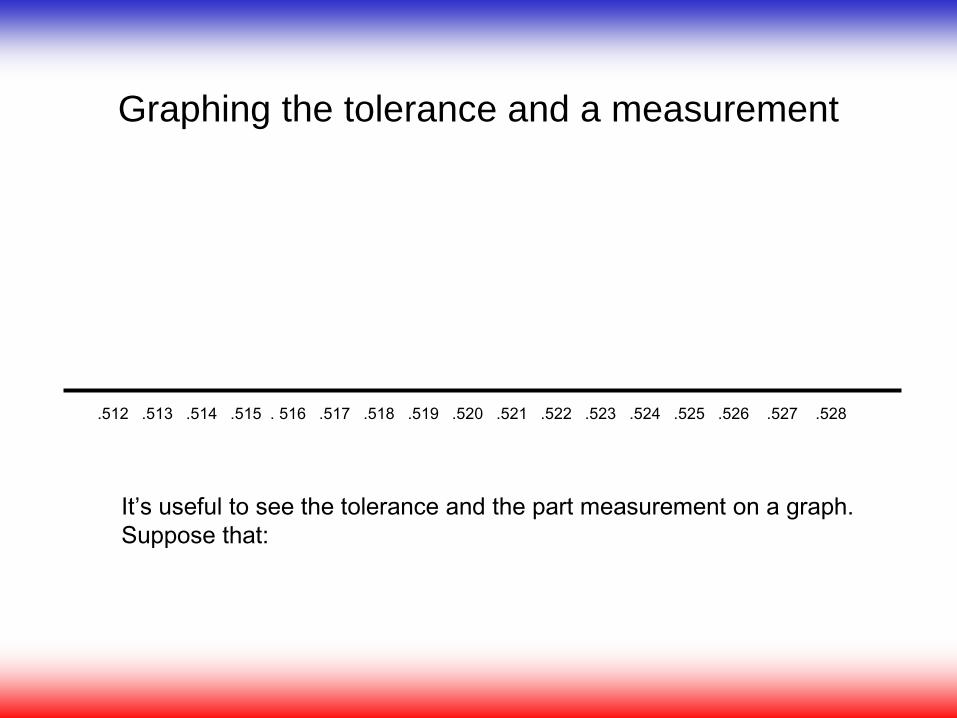
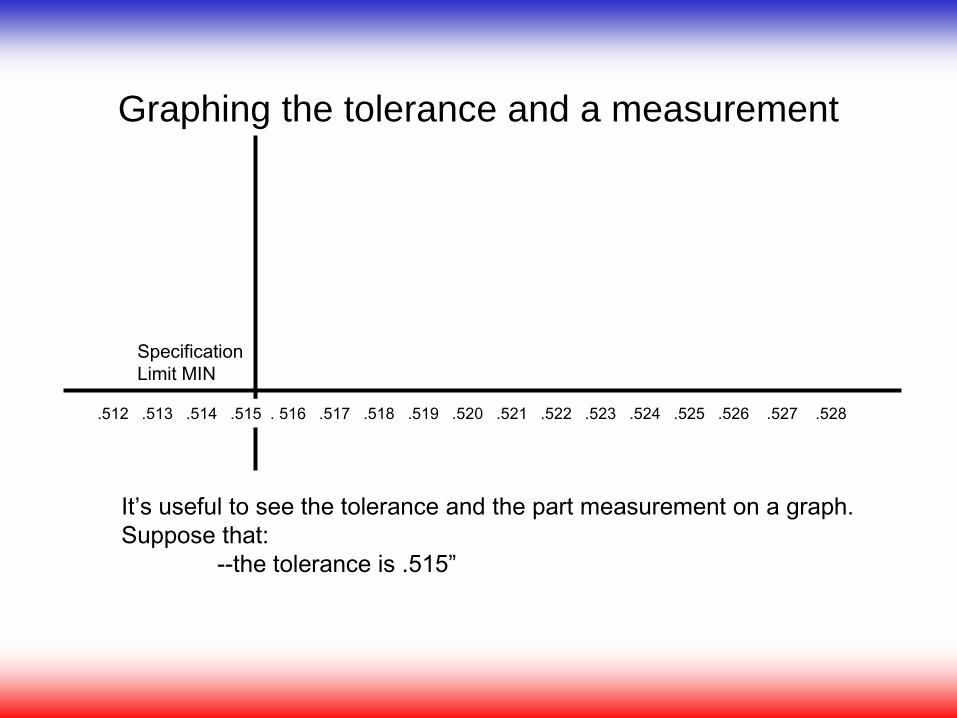
Graphing the tolerance and a measurement
It’s useful to see the tolerance and the part measurement on a graph.
Suppose that:
.512 .513 .514 .515 . 516 .517 .518 .519 .520 .521 .522 .523 .524 .525 .526 .527 .528
Graphing the tolerance and a measurement
It’s useful to see the tolerance and the part measurement on a graph.
Suppose that:
--the tolerance is .515”
Specification
Limit MIN
.512 .513 .514 .515 . 516 .517 .518 .519 .520 .521 .522 .523 .524 .525 .526 .527 .528
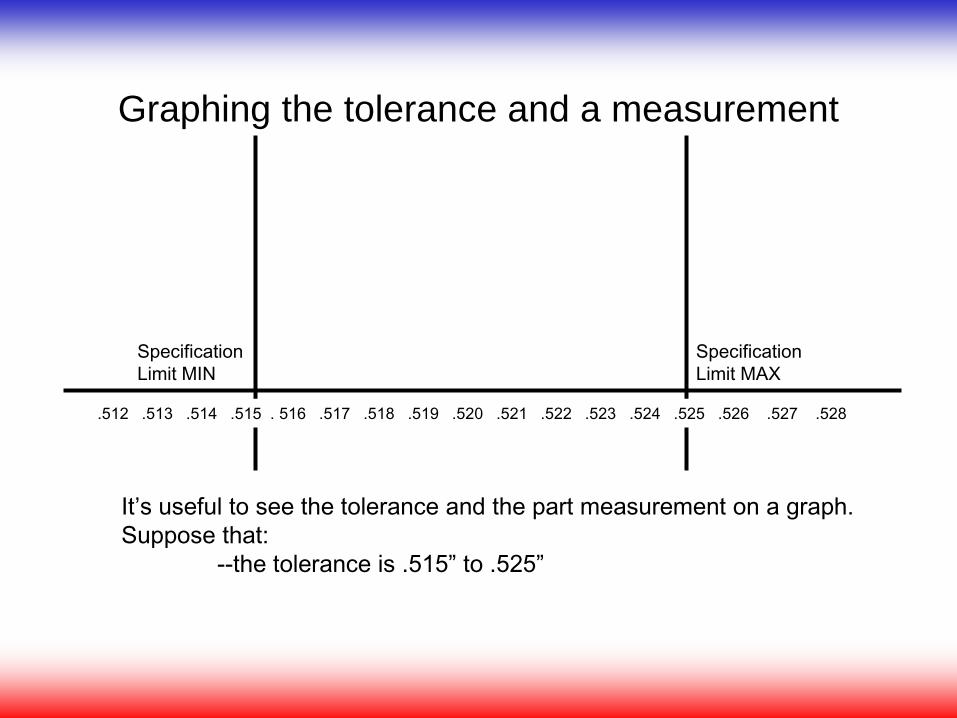
Graphing the tolerance and a measurement
It’s useful to see the tolerance and the part measurement on a graph.
Suppose that:
--the tolerance is .515” to .525”
Specification
Limit MAX
Specification
Limit MIN
.512 .513 .514 .515 . 516 .517 .518 .519 .520 .521 .522 .523 .524 .525 .526 .527 .528
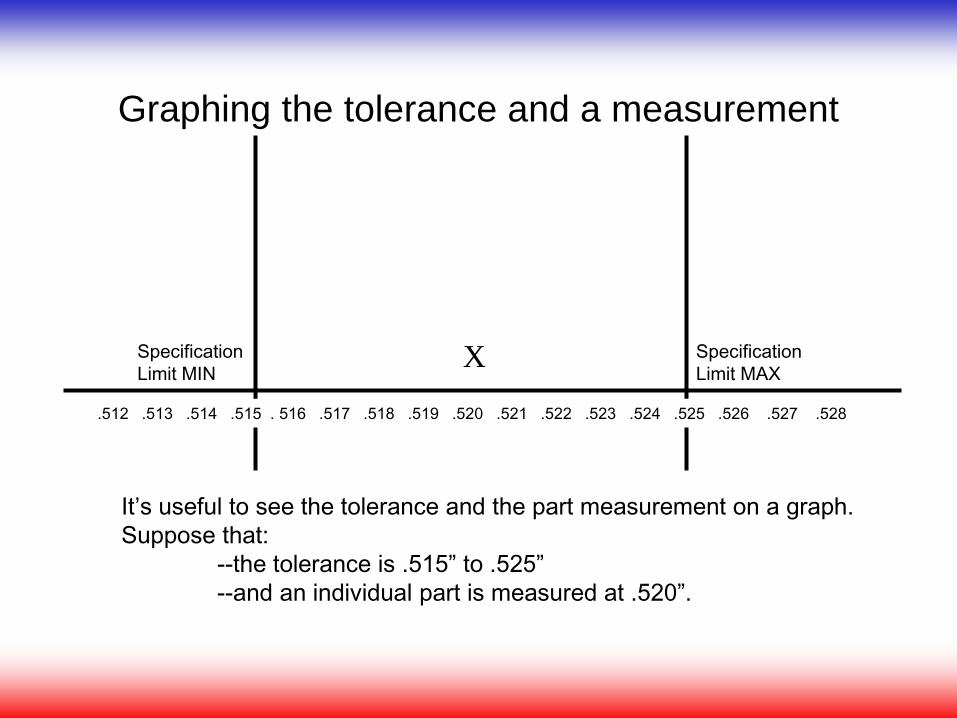
Graphing the tolerance and a measurement
It’s useful to see the tolerance and the part measurement on a graph.
Suppose that:
--the tolerance is .515” to .525”
--and an individual part is measured at .520”.
Specification
Limit MAX
Specification
Limit MIN
.512 .513 .514 .515 . 516 .517 .518 .519 .520 .521 .522 .523 .524 .525 .526 .527 .528
X
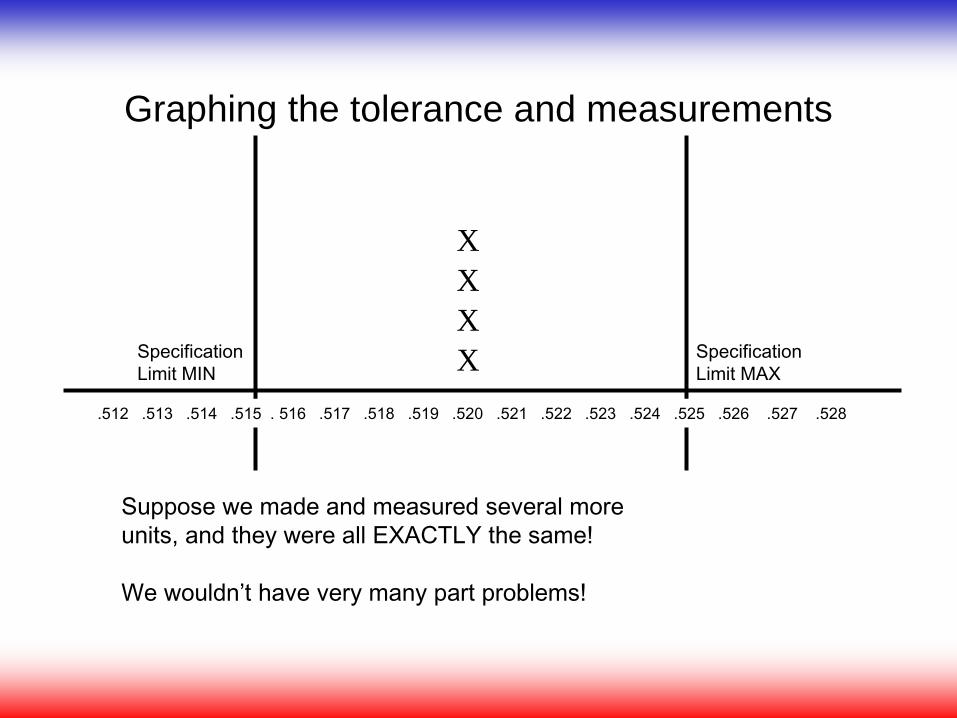
Graphing the tolerance and measurements
Suppose we made and measured several more
units, and they were all EXACTLY the same!
We wouldn’t have very many part problems!
Specification
Limit MAX
Specification
Limit MIN
.512 .513 .514 .515 . 516 .517 .518 .519 .520 .521 .522 .523 .524 .525 .526 .527 .528
X
X
X
X
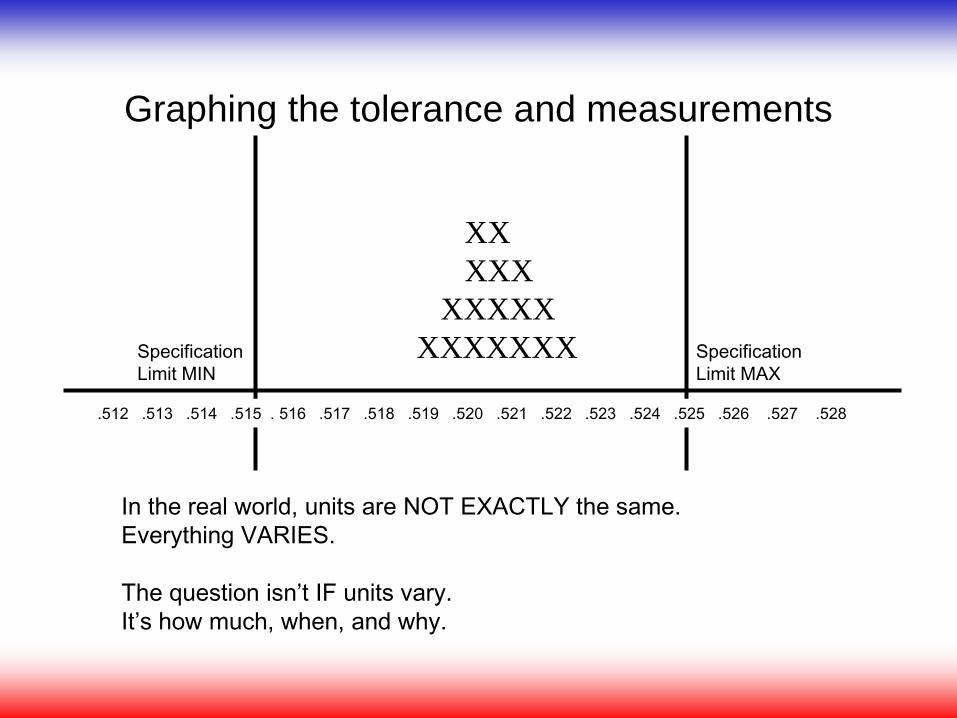
Graphing the tolerance and measurements
In the real world, units are NOT EXACTLY the same.
Everything VARIES.
The question isn’t IF units vary.
It’s how much, when, and why.
Specification
Limit MAX
Specification
Limit MIN
.512 .513 .514 .515 . 516 .517 .518 .519 .520 .521 .522 .523 .524 .525 .526 .527 .528
XX
XXX
XXXXX
XXXXXXX
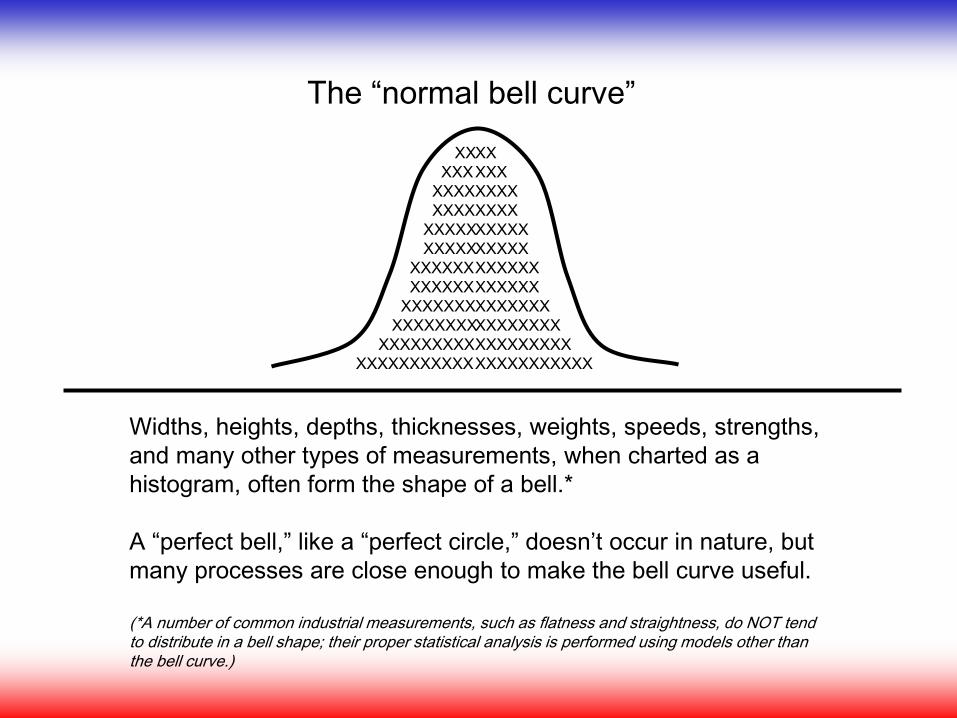
The “normal bell curve”
Widths, heights, depths, thicknesses, weights, speeds, strengths,
and many other types of measurements, when charted as a
histogram, often form the shape of a bell.*
A “perfect bell,” like a “perfect circle,” doesn’t occur in nature, but
many processes are close enough to make the bell curve useful.
(*A number of common industrial measurements, such as flatness and straightness, do NOT tend to distribute in a bell shape; their proper statistical analysis is performed using models other than the bell curve.)
XX
XXX
XXXX
XXXX
XXXXX
XXXXX
XXXXXX
XXXXXX
XXXXXXX
XXXXXXXX
XXXXXXXXX
XXXXXXXXXXX
XX
XXX
XXXX
XXXX
XXXXX
XXXXX
XXXXXX
XXXXXX
XXXXXXX
XXXXXXXX
XXXXXXXXX
XXXXXXXXXXX
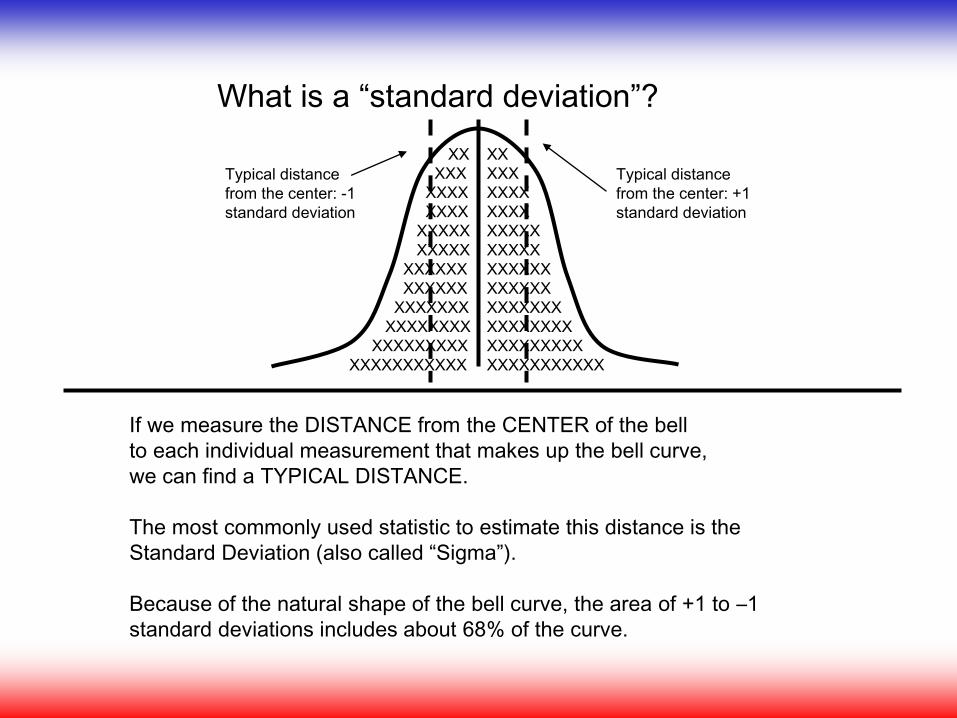
What is a “standard deviation”?
If we measure the DISTANCE from the CENTER of the bell
to each individual measurement that makes up the bell curve,
we can find a TYPICAL DISTANCE.
The most commonly used statistic to estimate this distance is the
Standard Deviation (also called “Sigma”).
Because of the natural shape of the bell curve, the area of +1 to –1
standard deviations includes about 68% of the curve.
XX
XXX
XXXX
XXXX
XXXXX
XXXXX
XXXXXX
XXXXXX
XXXXXXX
XXXXXXXX
XXXXXXXXX
XXXXXXXXXXX
XX
XXX
XXXX
XXXX
XXXXX
XXXXX
XXXXXX
XXXXXX
XXXXXXX
XXXXXXXX
XXXXXXXXX
XXXXXXXXXXX
Typical distance
from the center: +1
standard deviation
Typical distance
from the center: -1
standard deviation
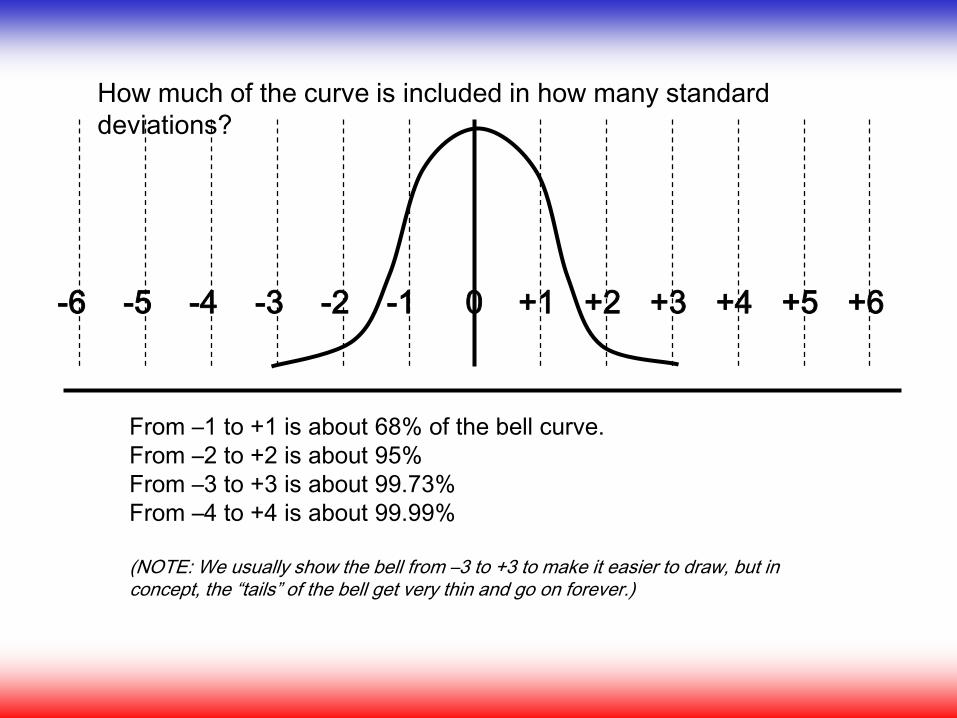
How much of the curve is included in how many standard
deviations?
From –1 to +1 is about 68% of the bell curve.
From –2 to +2 is about 95%
From –3 to +3 is about 99.73%
From –4 to +4 is about 99.99%
(NOTE: We usually show the bell from –3 to +3 to make it easier to draw, but in concept, the “tails” of the bell get very thin and go on forever.)
-6 -5 -4 -3 -2 -1 +1 +2 +3 +4 +5 +60
A
B
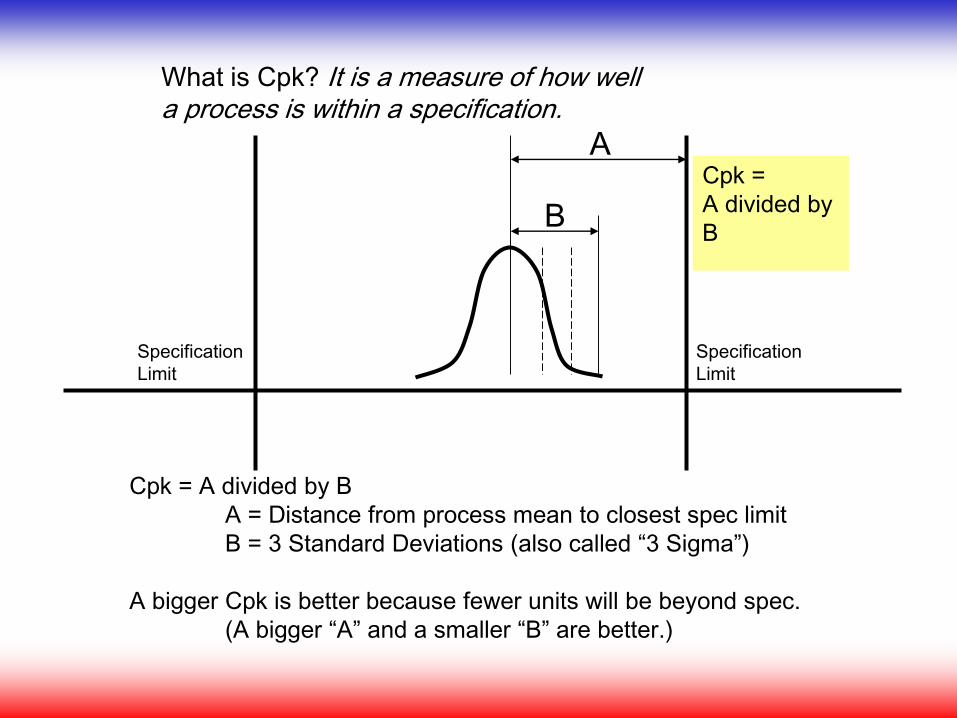
What is Cpk? It is a measure of how wella process is within a specification.
Cpk = A divided by B
A = Distance from process mean to closest spec limit
B = 3 Standard Deviations (also called “3 Sigma”)
A bigger Cpk is better because fewer units will be beyond spec.
(A bigger “A” and a smaller “B” are better.)
Specification
Limit
Specification
Limit
Cpk =
A divided by
B
A
B
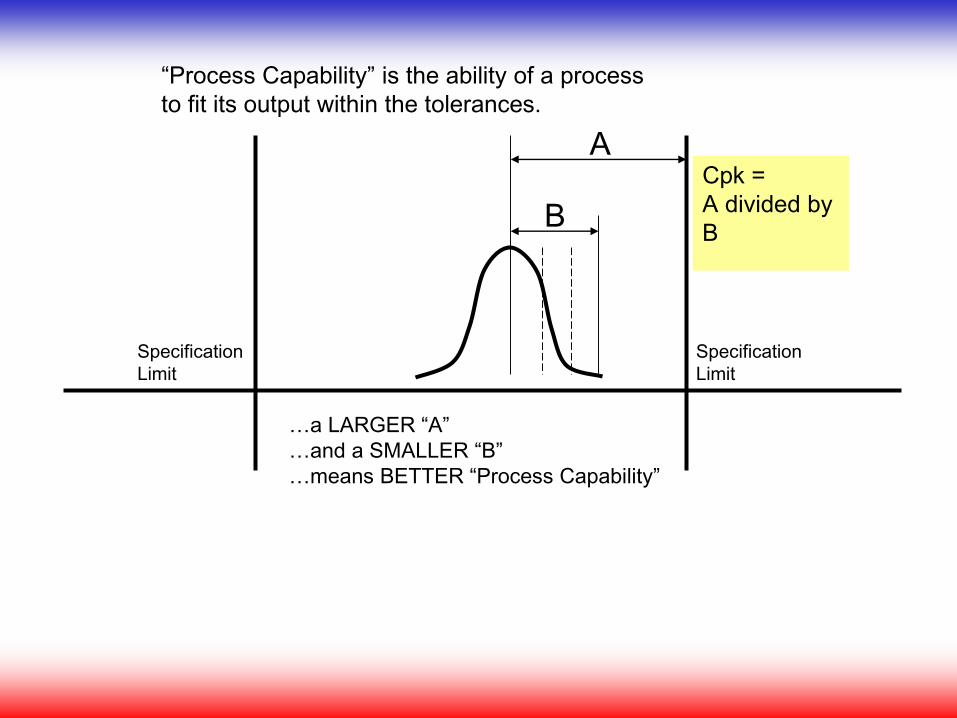
“Process Capability” is the ability of a process
to fit its output within the tolerances.
…a LARGER “A”
…and a SMALLER “B”
…means BETTER “Process Capability”
Specification
Limit
Specification
Limit
Cpk =
A divided by
B
A
B
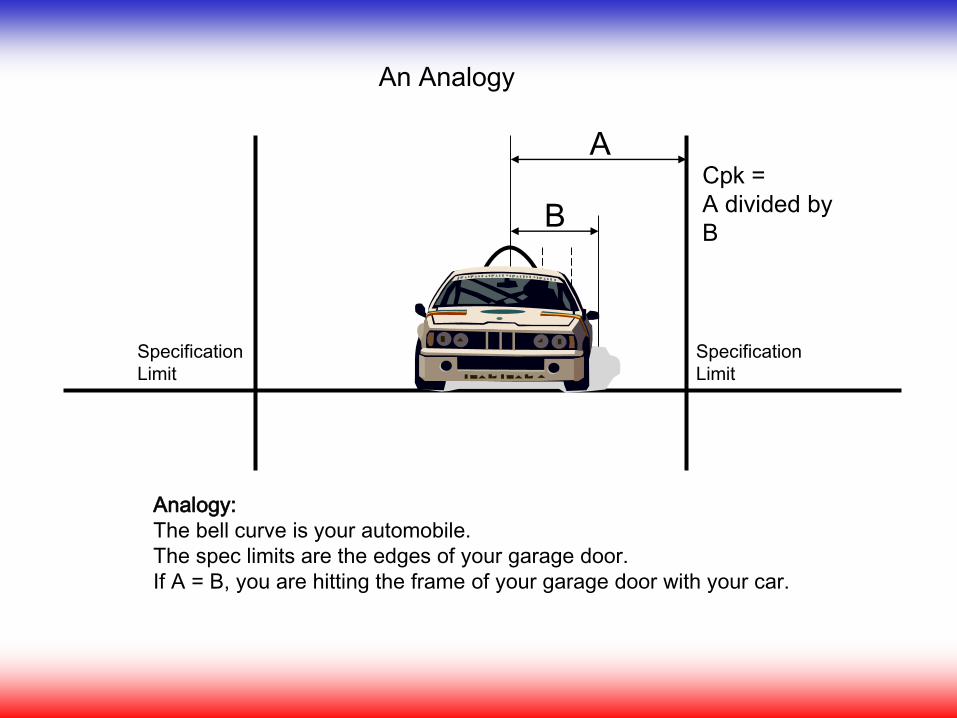
An Analogy
Analogy:
The bell curve is your automobile.
The spec limits are the edges of your garage door.
If A = B, you are hitting the frame of your garage door with your car.
Specification
Limit
Specification
Limit
Cpk =
A divided by
B
A
B
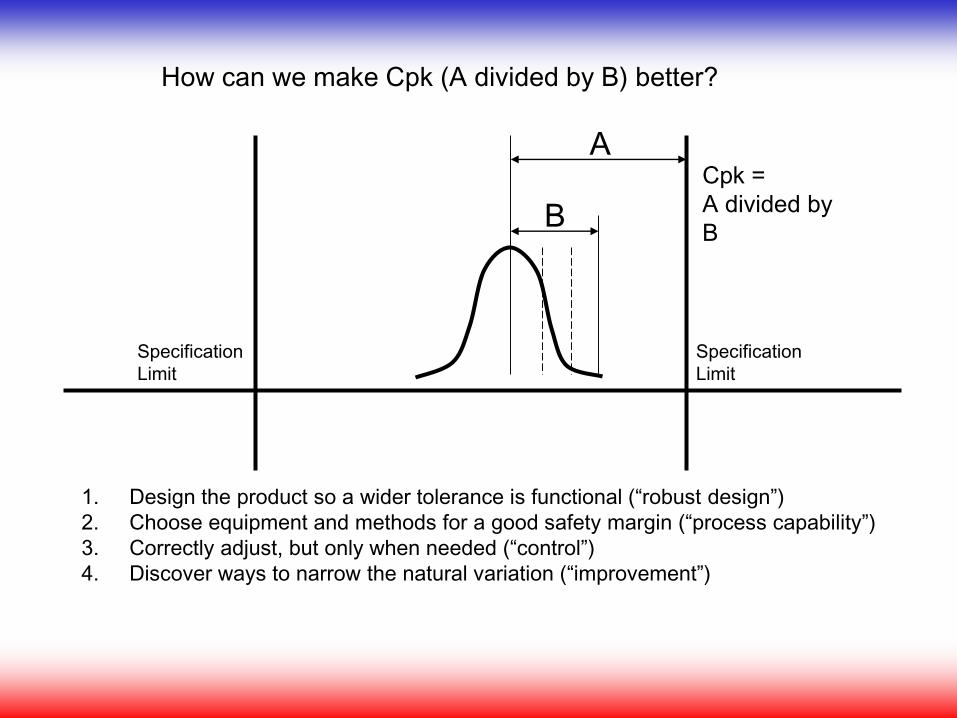
How can we make Cpk (A divided by B) better?
1. Design the product so a wider tolerance is functional (“robust design”)
2. Choose equipment and methods for a good safety margin (“process capability”)
3. Correctly adjust, but only when needed (“control”)
4. Discover ways to narrow the natural variation (“improvement”)
Specification
Limit
Specification
Limit
Cpk =
A divided by
B
A
B
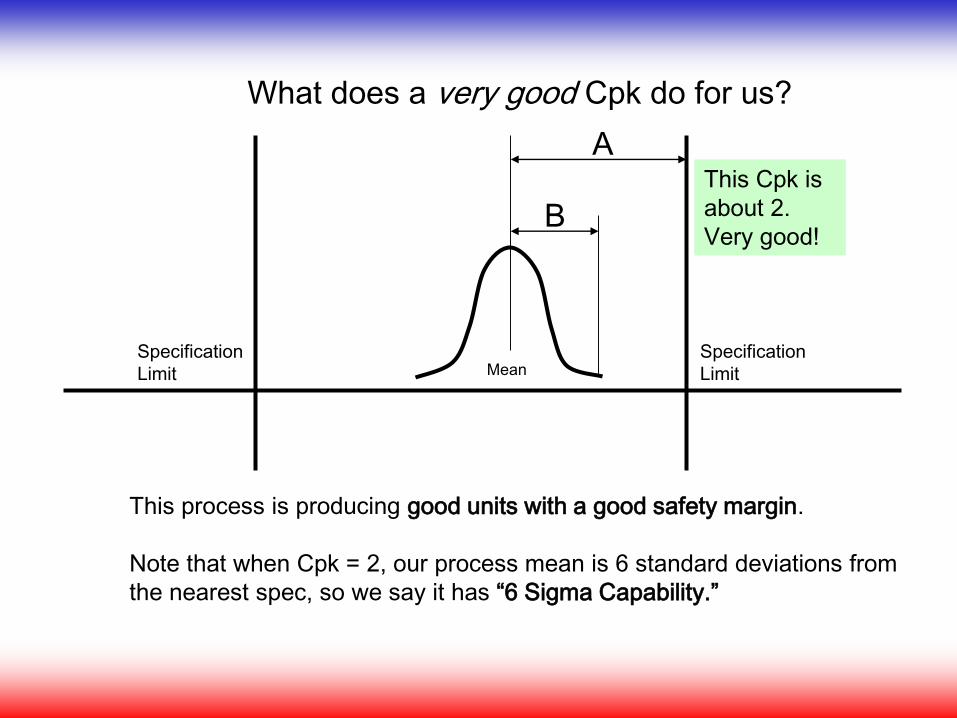
What does a very good Cpk do for us?
This process is producing good units with a good safety margin.
Note that when Cpk = 2, our process mean is 6 standard deviations from
the nearest spec, so we say it has “6 Sigma Capability.”
Specification
Limit
Specification
Limit
This Cpk is
about 2.
Very good!
Mean
A
B
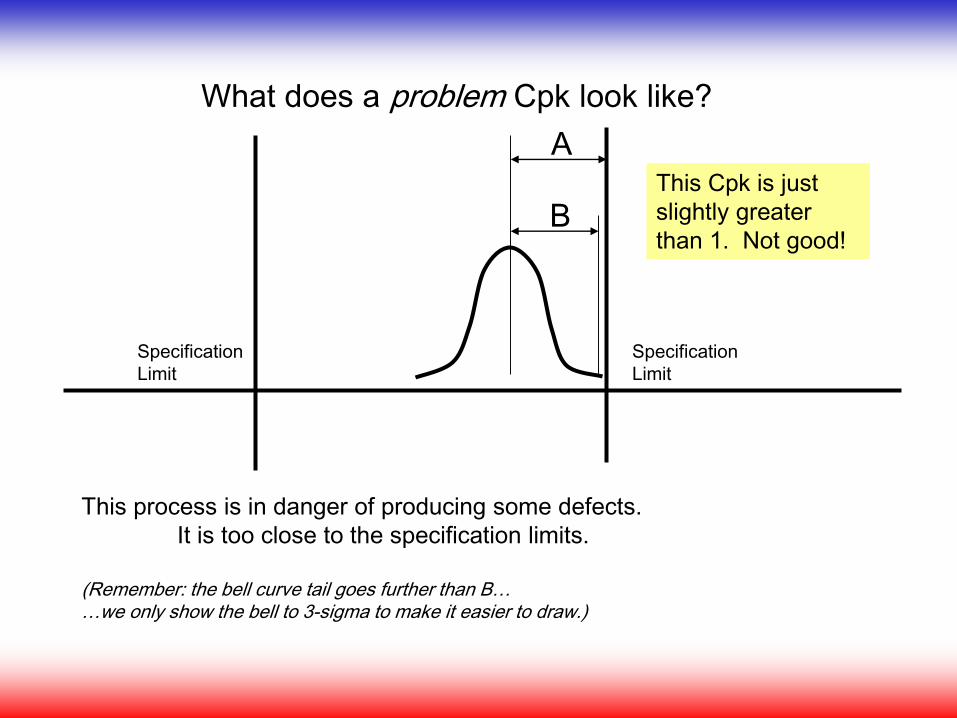
What does a problem Cpk look like?
This process is in danger of producing some defects.
It is too close to the specification limits.
(Remember: the bell curve tail goes further than B……we only show the bell to 3-sigma to make it easier to draw.)
Specification
Limit
Specification
Limit
This Cpk is just
slightly greater
than 1. Not good!
A
B
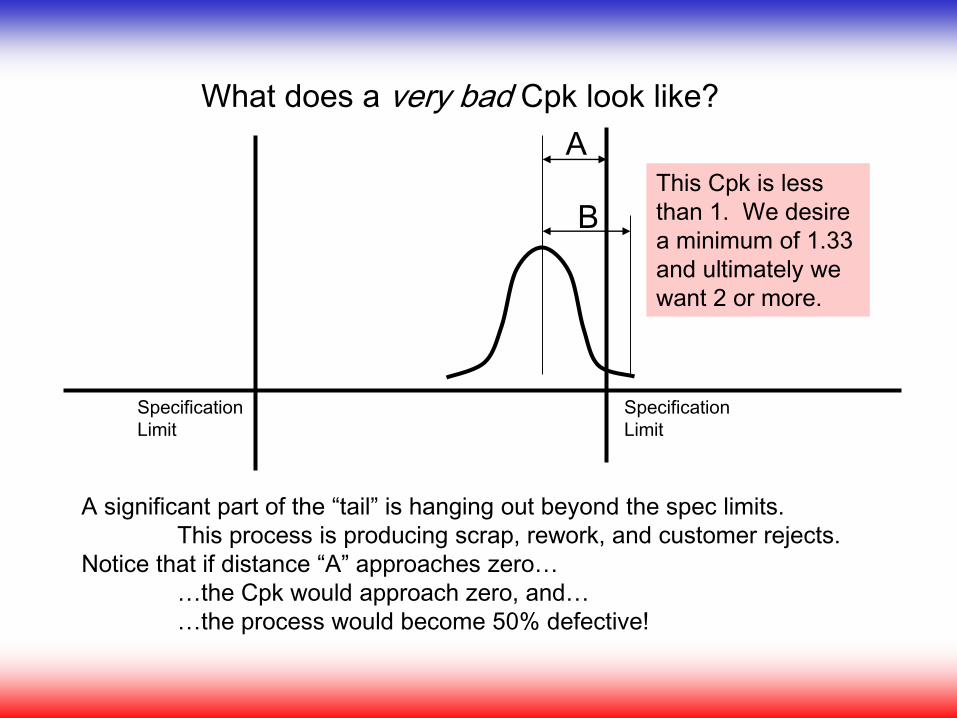
What does a very bad Cpk look like?
A significant part of the “tail” is hanging out beyond the spec limits.
This process is producing scrap, rework, and customer rejects.
Notice that if distance “A” approaches zero…
…the Cpk would approach zero, and…
…the process would become 50% defective!
Specification
Limit
Specification
Limit
This Cpk is less
than 1. We desire
a minimum of 1.33
and ultimately we
want 2 or more.
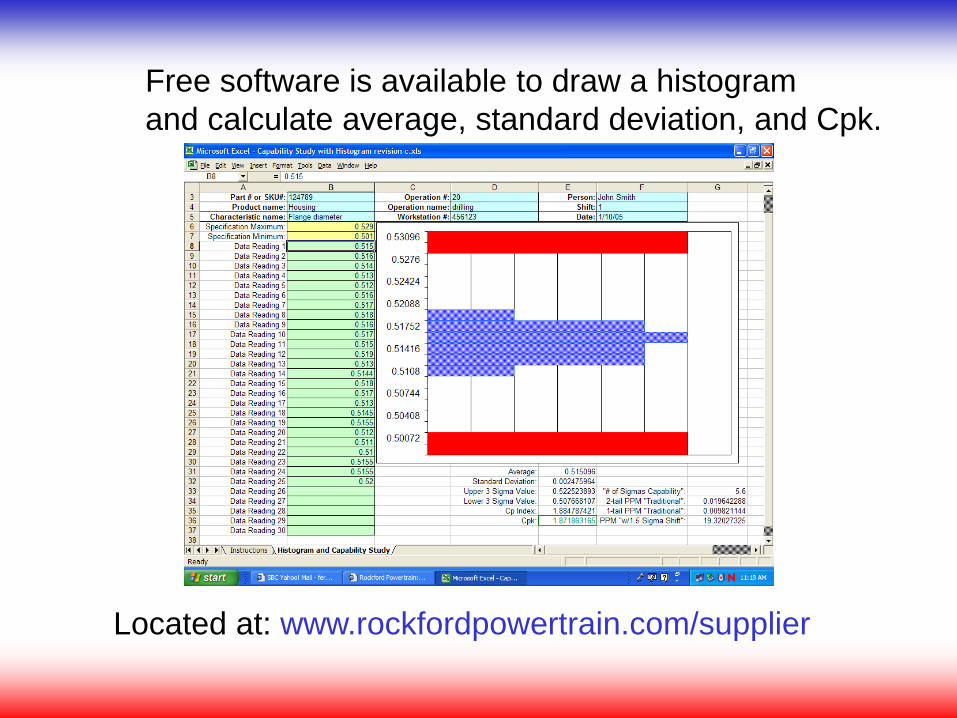
Free software is available to draw a histogram
and calculate average, standard deviation, and Cpk.
Located at: www.rockfordpowertrain.com/supplier
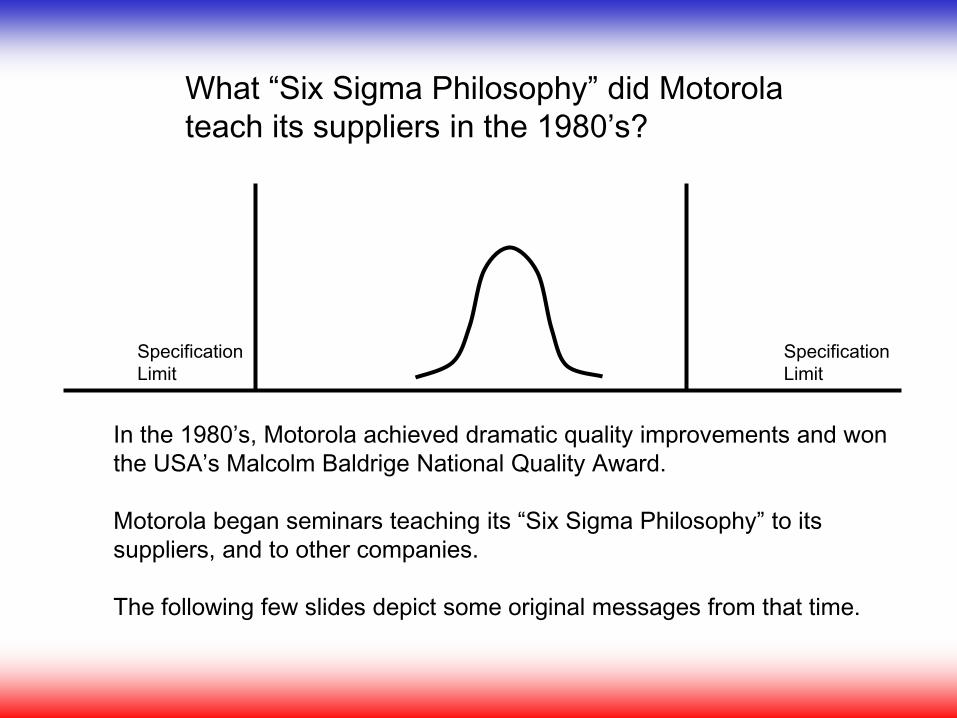
What “Six Sigma Philosophy” did Motorola
teach its suppliers in the 1980’s?
In the 1980’s, Motorola achieved dramatic quality improvements and won
the USA’s Malcolm Baldrige National Quality Award.
Motorola began seminars teaching its “Six Sigma Philosophy” to its
suppliers, and to other companies.
The following few slides depict some original messages from that time.
Specification
Limit
Specification
Limit
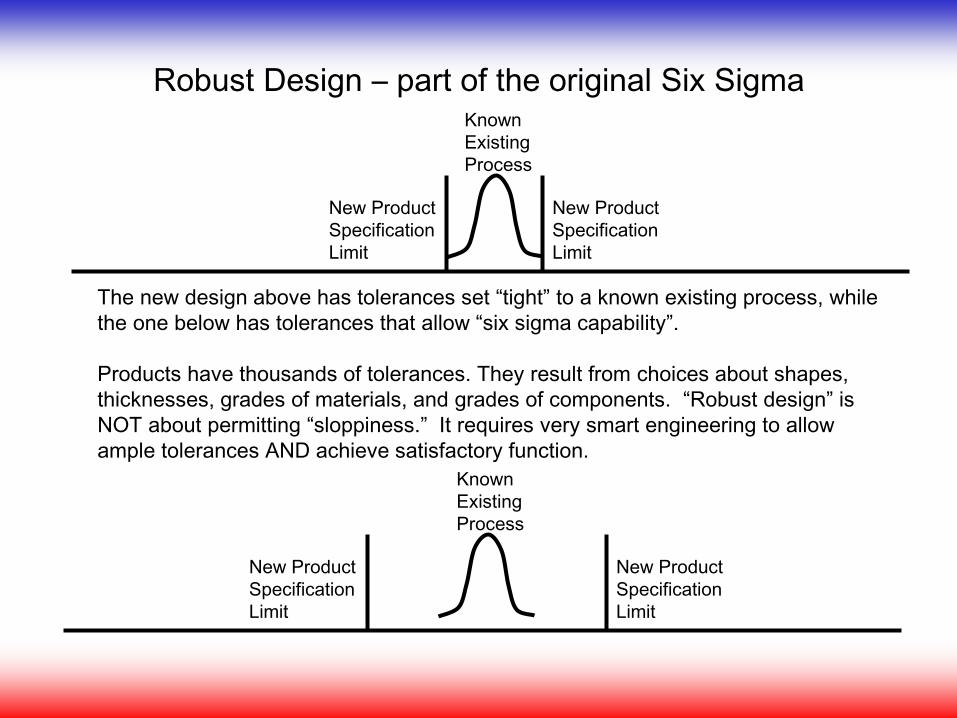
Robust Design – part of the original Six Sigma
The new design above has tolerances set “tight” to a known existing process, while
the one below has tolerances that allow “six sigma capability”.
Products have thousands of tolerances. They result from choices about shapes,
thicknesses, grades of materials, and grades of components. “Robust design” is
NOT about permitting “sloppiness.” It requires very smart engineering to allow
ample tolerances AND achieve satisfactory function.
New Product
Specification
Limit
New Product
Specification
Limit
Known
Existing
Process
New Product
Specification
Limit
New Product
Specification
Limit
Known
Existing
Process
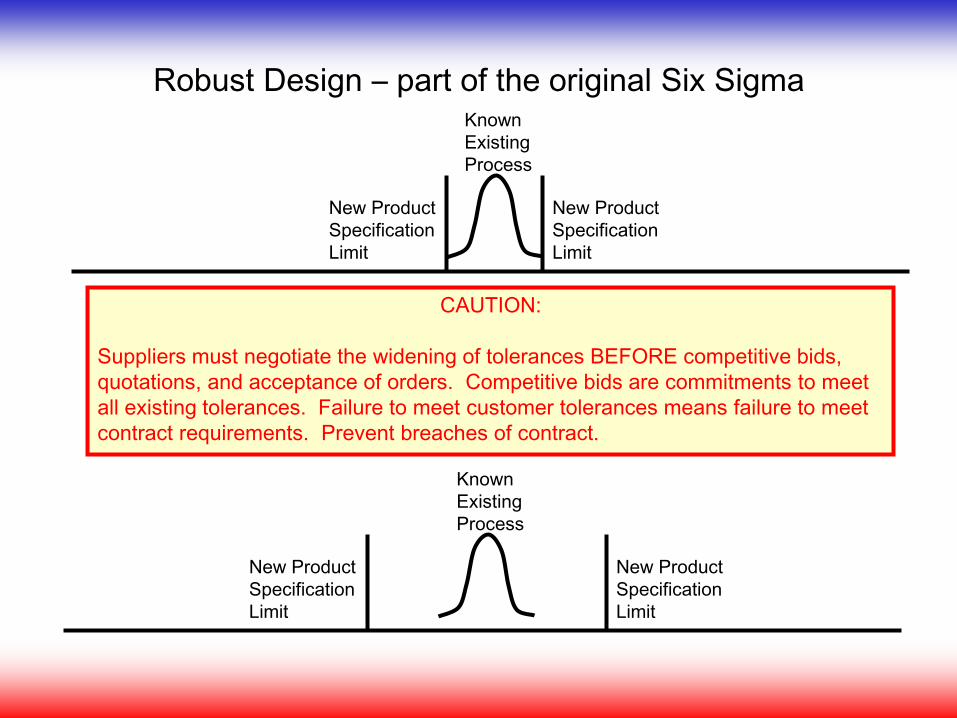
Robust Design – part of the original Six Sigma
CAUTION:
Suppliers must negotiate the widening of tolerances BEFORE competitive bids,
quotations, and acceptance of orders. Competitive bids are commitments to meet
all existing tolerances. Failure to meet customer tolerances means failure to meet
contract requirements. Prevent breaches of contract.
New Product
Specification
Limit
New Product
Specification
Limit
Known
Existing
Process
New Product
Specification
Limit
New Product
Specification
Limit
Known
Existing
Process
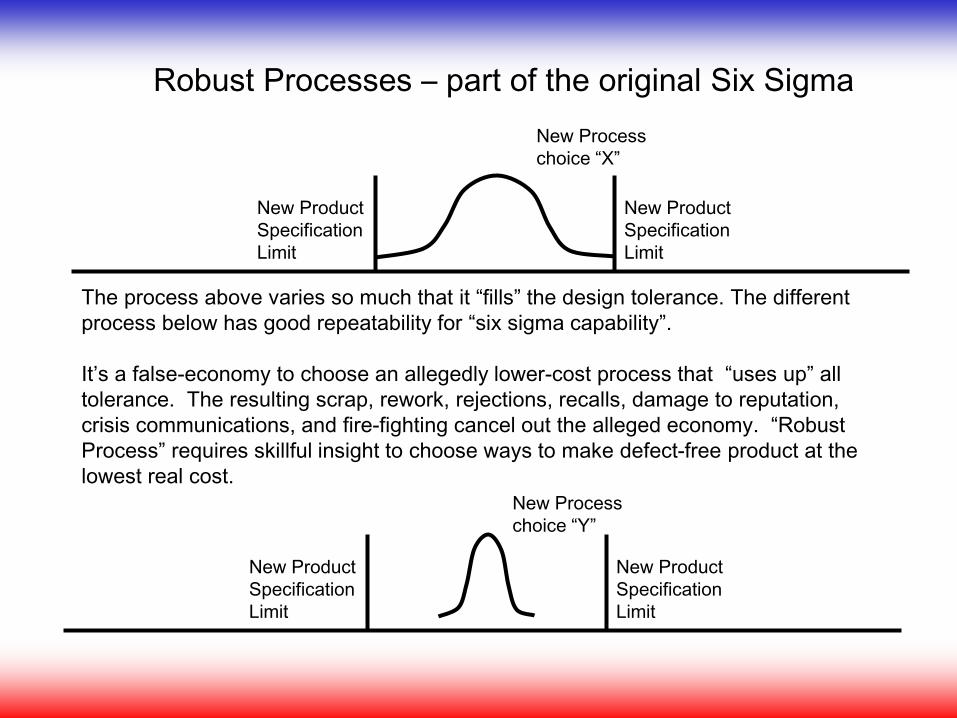
Robust Processes – part of the original Six Sigma
The process above varies so much that it “fills” the design tolerance. The different
process below has good repeatability for “six sigma capability”.
It’s a false-economy to choose an allegedly lower-cost process that “uses up” all
tolerance. The resulting scrap, rework, rejections, recalls, damage to reputation,
crisis communications, and fire-fighting cancel out the alleged economy. “Robust
Process” requires skillful insight to choose ways to make defect-free product at the
lowest real cost.
New Product
Specification
Limit
New Product
Specification
Limit
New Process
choice “Y”
New Product
Specification
Limit
New Product
Specification
Limit
New Process
choice “X”
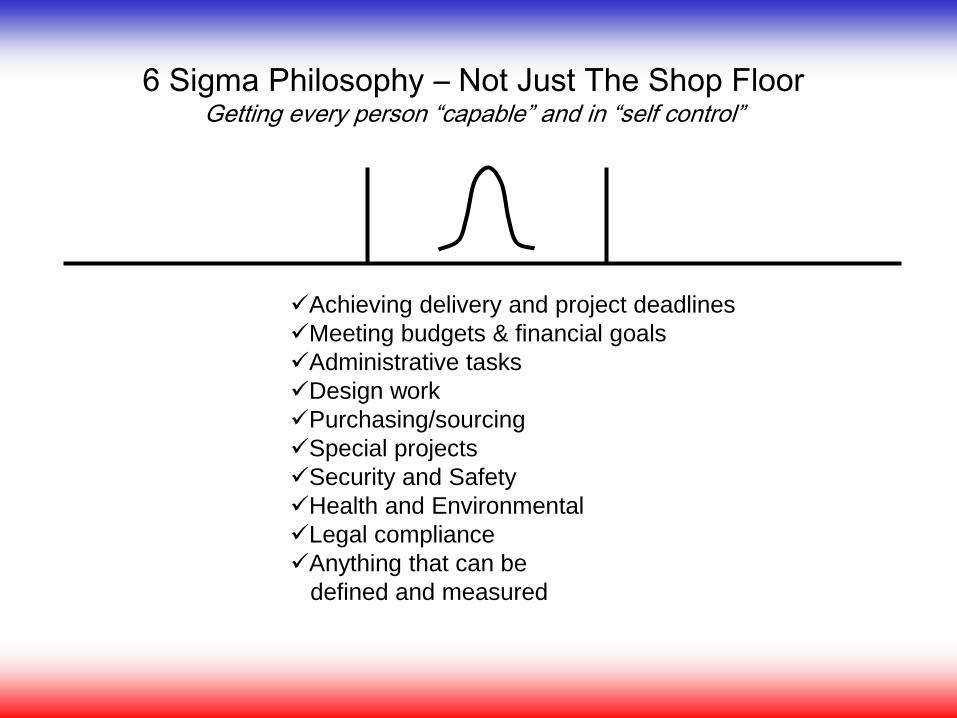
6 Sigma Philosophy – Not Just The Shop FloorGetting every person “capable” and in “self control”
Achieving delivery and project deadlines
Meeting budgets & financial goals
Administrative tasks
Design work
Purchasing/sourcing
Special projects
Security and Safety
Health and Environmental
Legal compliance
Anything that can be
defined and measured
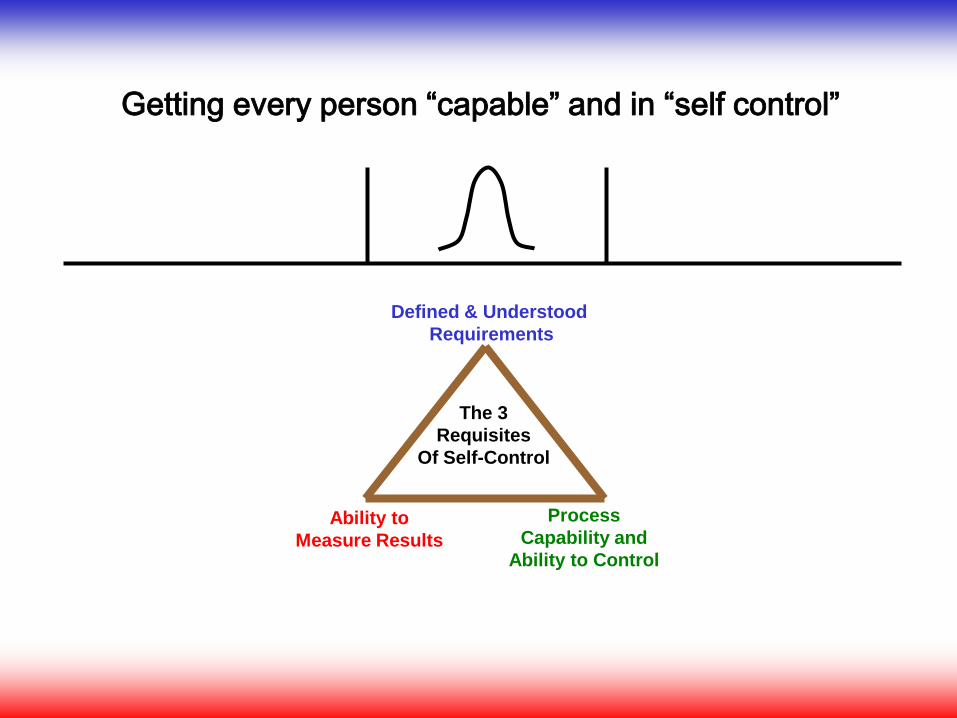
Getting every person “capable” and in “self control”
Defined & Understood
Requirements
Ability to
Measure Results
Process
Capability and
Ability to Control
The 3
Requisites
Of Self-Control
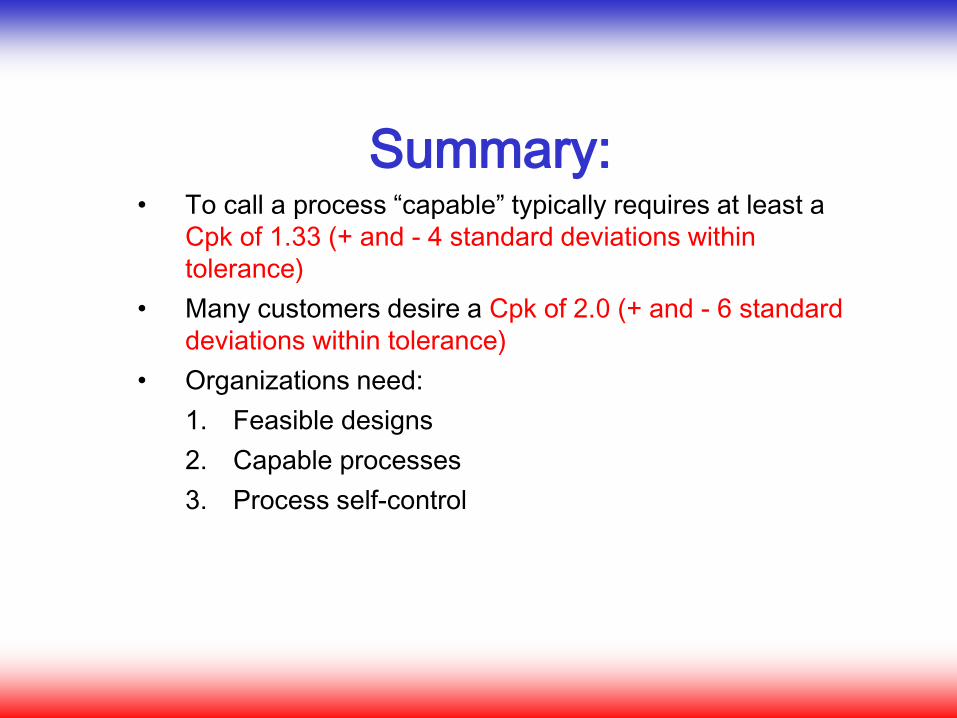
Summary:• To call a process “capable” typically requires at least a
Cpk of 1.33 (+ and - 4 standard deviations within
tolerance)
• Many customers desire a Cpk of 2.0 (+ and - 6 standard
deviations within tolerance)
• Organizations need:
1. Feasible designs
2. Capable processes
3. Process self-control
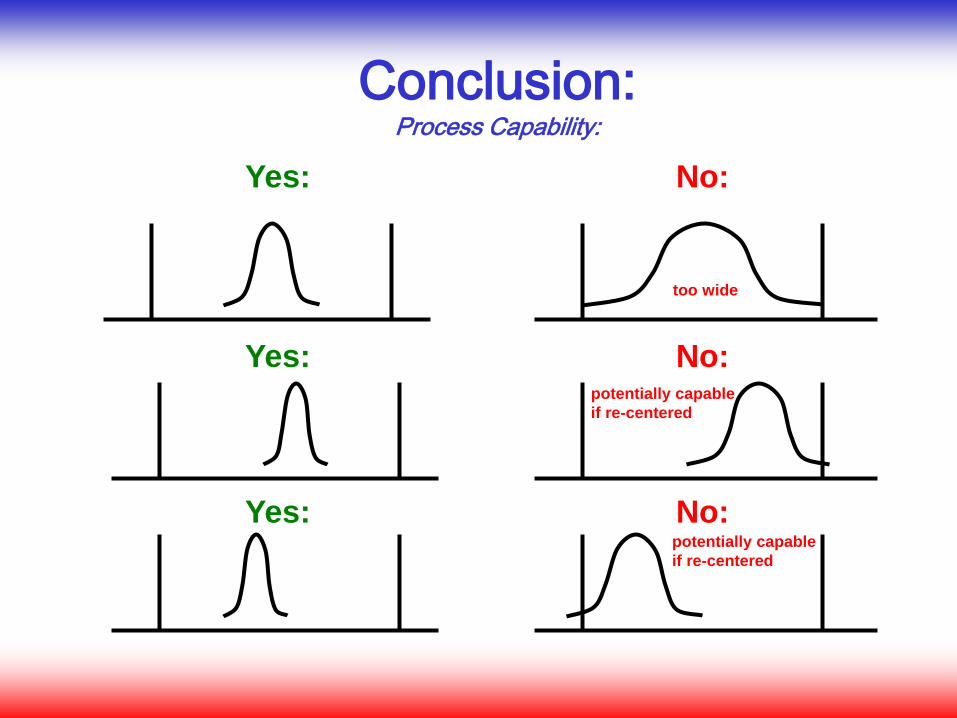
Conclusion:Process Capability:
Yes: No:
No:
No:
Yes:
Yes:
potentially capable
if re-centered
potentially capable
if re-centered
too wide
Review Question 1
What is “Process Capability?”
Review Question 2
How is the “process average” calculated
or estimated?
Review Question 3
What is a “Standard Deviation”?
(also known as a “sigma”)
Review Question 4
What is Cpk used for?
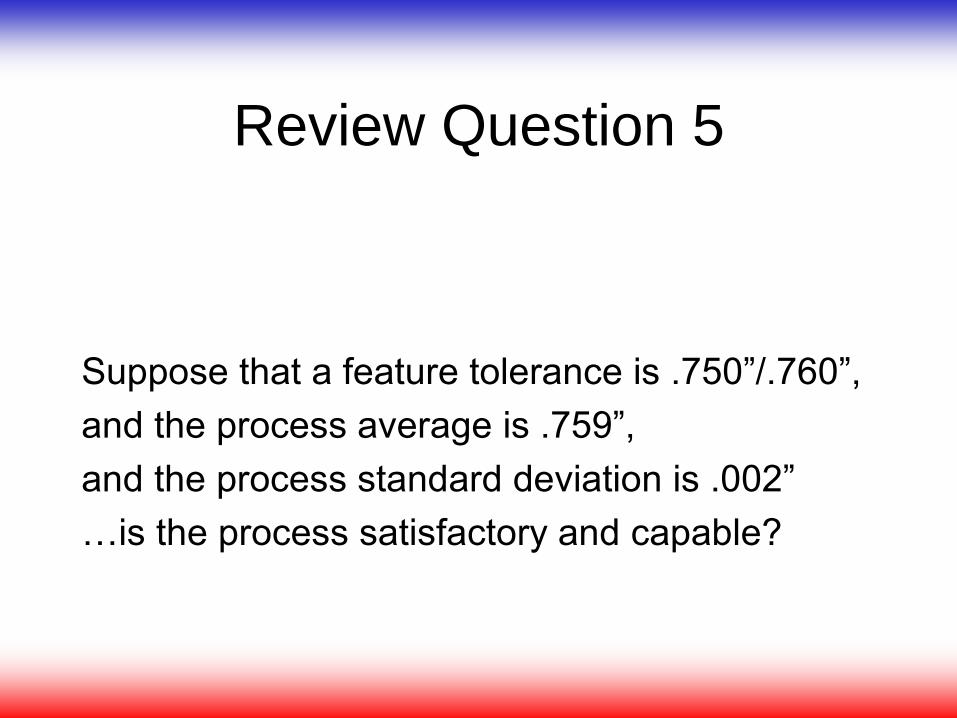
Review Question 5
Suppose that a feature tolerance is .750”/.760”,
and the process average is .759”,
and the process standard deviation is .002”
…is the process satisfactory and capable?
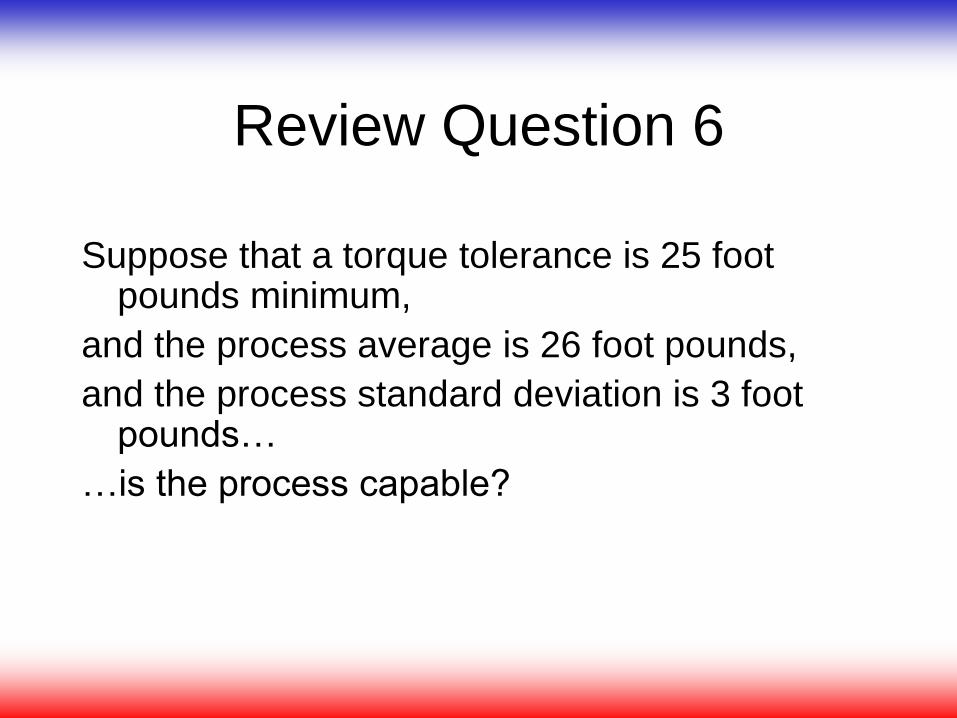
Review Question 6
Suppose that a torque tolerance is 25 foot pounds minimum,
and the process average is 26 foot pounds,
and the process standard deviation is 3 foot pounds…
…is the process capable?
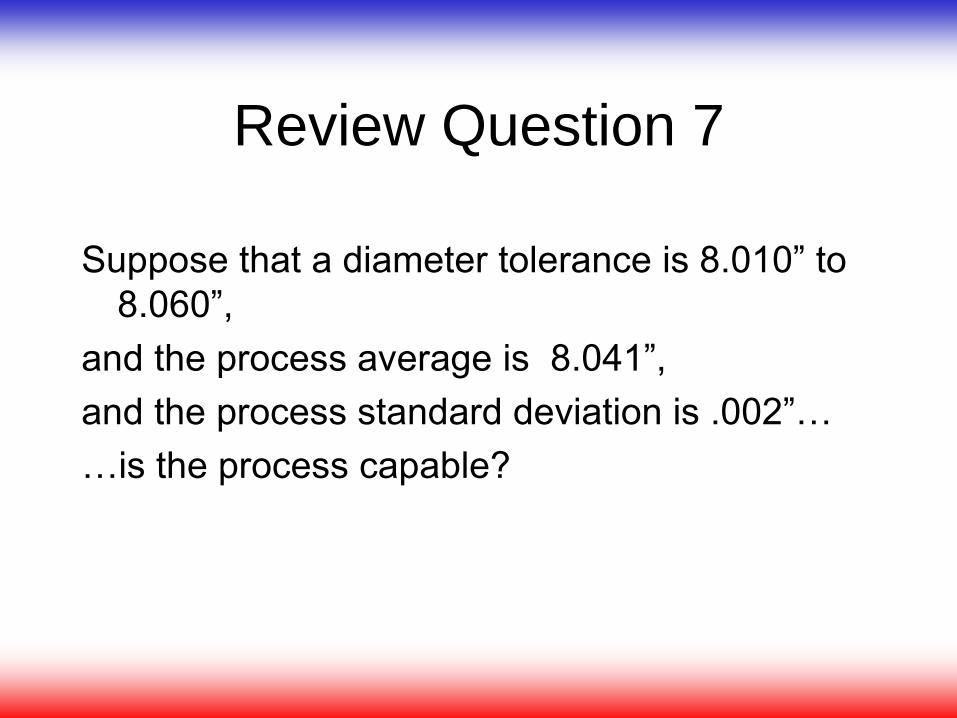
Review Question 7
Suppose that a diameter tolerance is 8.010” to
8.060”,
and the process average is 8.041”,
and the process standard deviation is .002”…
…is the process capable?
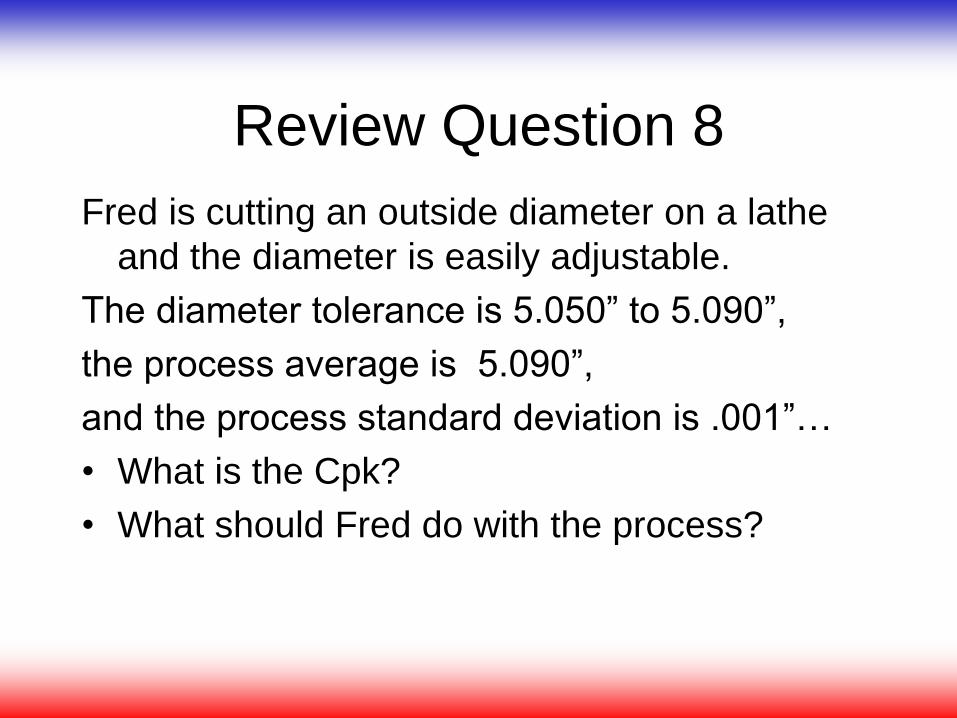
Review Question 8
Fred is cutting an outside diameter on a lathe
and the diameter is easily adjustable.
The diameter tolerance is 5.050” to 5.090”,
the process average is 5.090”,
and the process standard deviation is .001”…
• What is the Cpk?
• What should Fred do with the process?
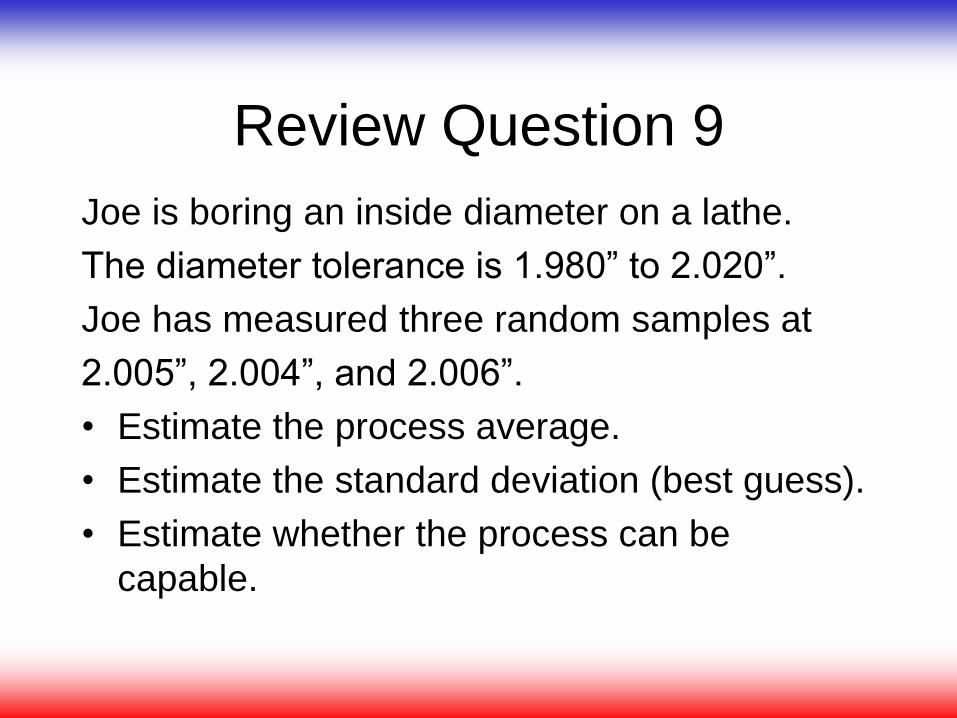
Review Question 9
Joe is boring an inside diameter on a lathe.
The diameter tolerance is 1.980” to 2.020”.
Joe has measured three random samples at
2.005”, 2.004”, and 2.006”.
• Estimate the process average.
• Estimate the standard deviation (best guess).
• Estimate whether the process can be
capable.
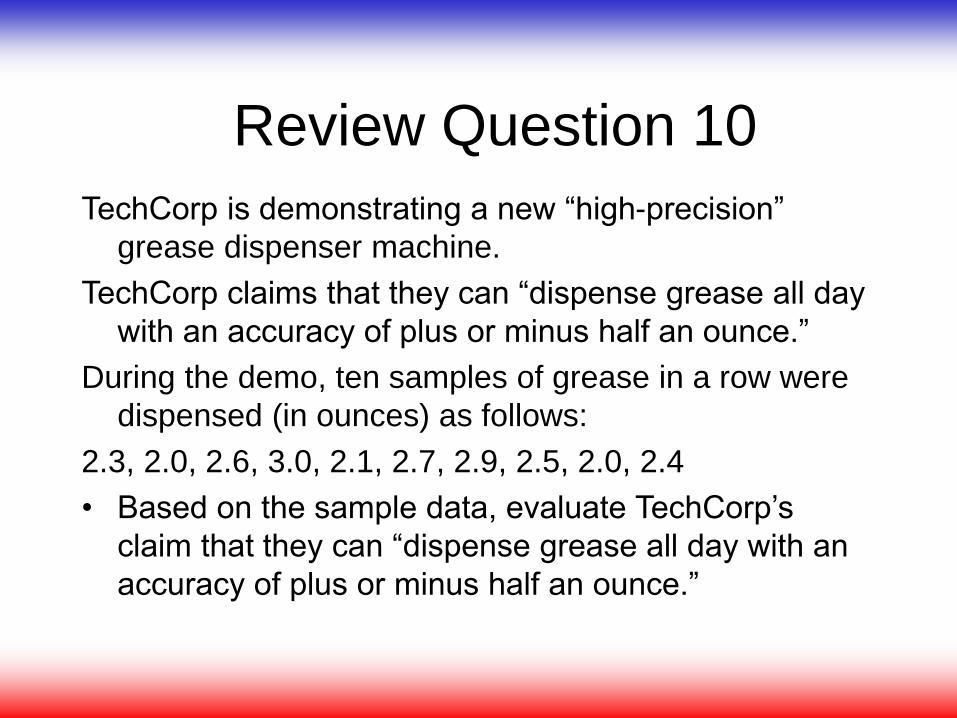
Review Question 10
TechCorp is demonstrating a new “high-precision”
grease dispenser machine.
TechCorp claims that they can “dispense grease all day
with an accuracy of plus or minus half an ounce.”
During the demo, ten samples of grease in a row were
dispensed (in ounces) as follows:
2.3, 2.0, 2.6, 3.0, 2.1, 2.7, 2.9, 2.5, 2.0, 2.4
• Based on the sample data, evaluate TechCorp’s
claim that they can “dispense grease all day with an
accuracy of plus or minus half an ounce.”
Quiz Question 1
True or False?
“Process Capability” can be defined as
the ability of a process
to make a feature
within its tolerance.
Quiz Question 2
True of False?
We can estimate the process average
by taking a set of sample measurements,
adding them up, and dividing by the
number of measurements.
Quiz Question 3
True or False?
A “Standard Deviation” can be thought of
as the “typical” distance of the
measurements from the average;
about 68% of the individuals will fall within
+ or – 1 standard deviation of a bell curve.
Quiz Question 4
True or False?
When using Cpk, the goal is to keep the
Cpk value as low as possible.
Quiz Question 5
True or False?
If the feature tolerance is .350”/.360”,
and the process average is .351”,
and the process standard deviation is .004”
…then the process should be called “capable.”
Quiz Question 6
True or False?
If a pressure tolerance is 250 PSI minimum,
and the process average is 260 PSI,
and the process standard deviation is 4 PSI,
…then the process is “capable.”
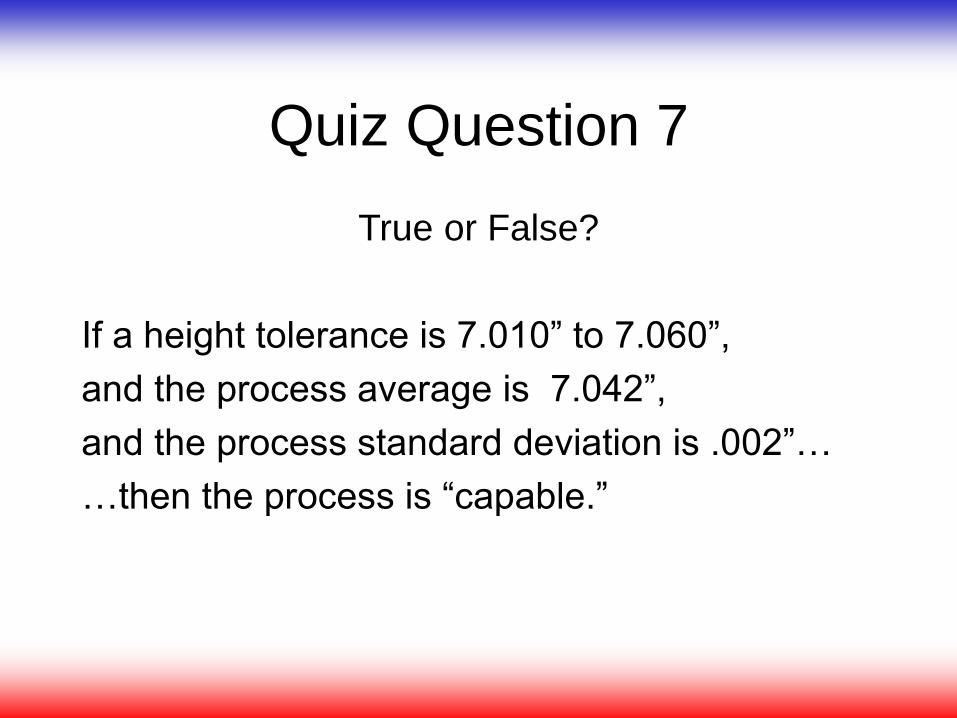
Quiz Question 7
True or False?
If a height tolerance is 7.010” to 7.060”,
and the process average is 7.042”,
and the process standard deviation is .002”…
…then the process is “capable.”
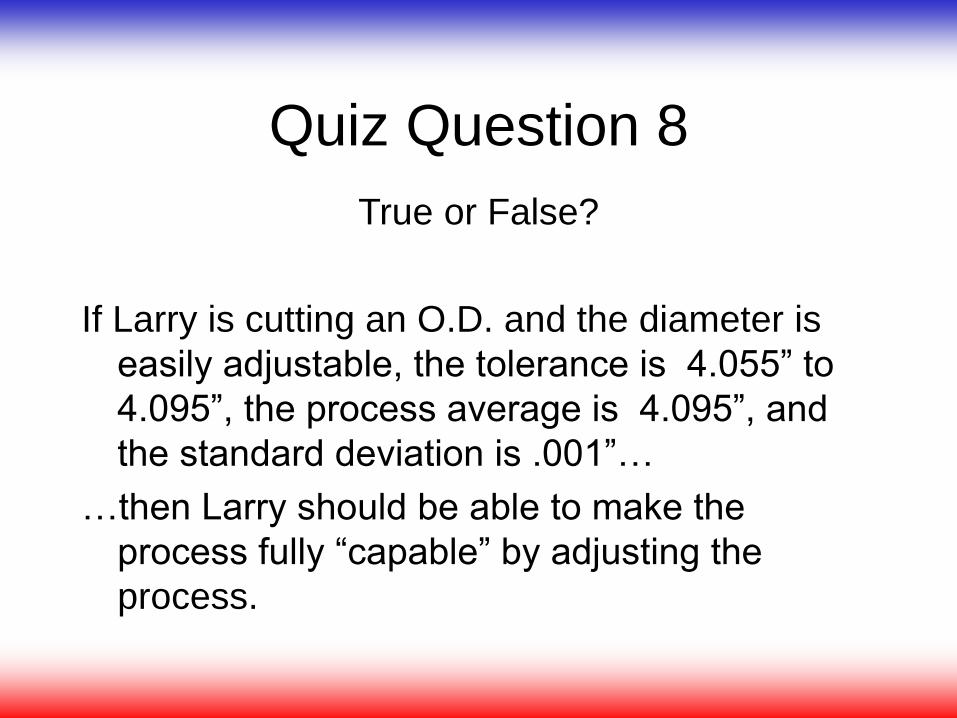
Quiz Question 8
True or False?
If Larry is cutting an O.D. and the diameter is
easily adjustable, the tolerance is 4.055” to
4.095”, the process average is 4.095”, and
the standard deviation is .001”…
…then Larry should be able to make the
process fully “capable” by adjusting the
process.
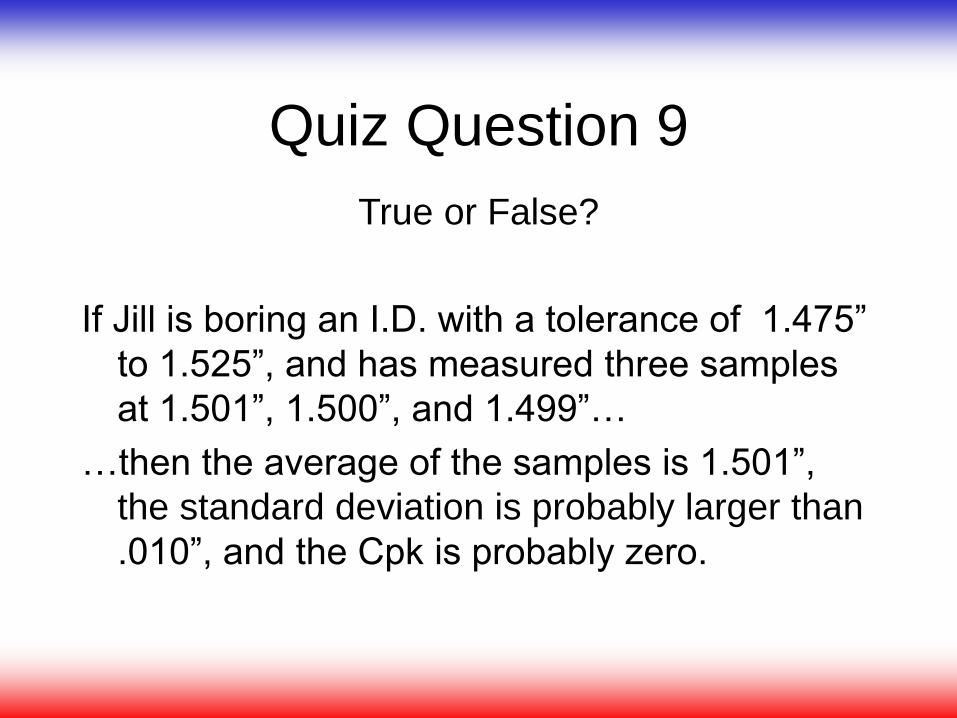
Quiz Question 9
True or False?
If Jill is boring an I.D. with a tolerance of 1.475”
to 1.525”, and has measured three samples
at 1.501”, 1.500”, and 1.499”…
…then the average of the samples is 1.501”,
the standard deviation is probably larger than
.010”, and the Cpk is probably zero.
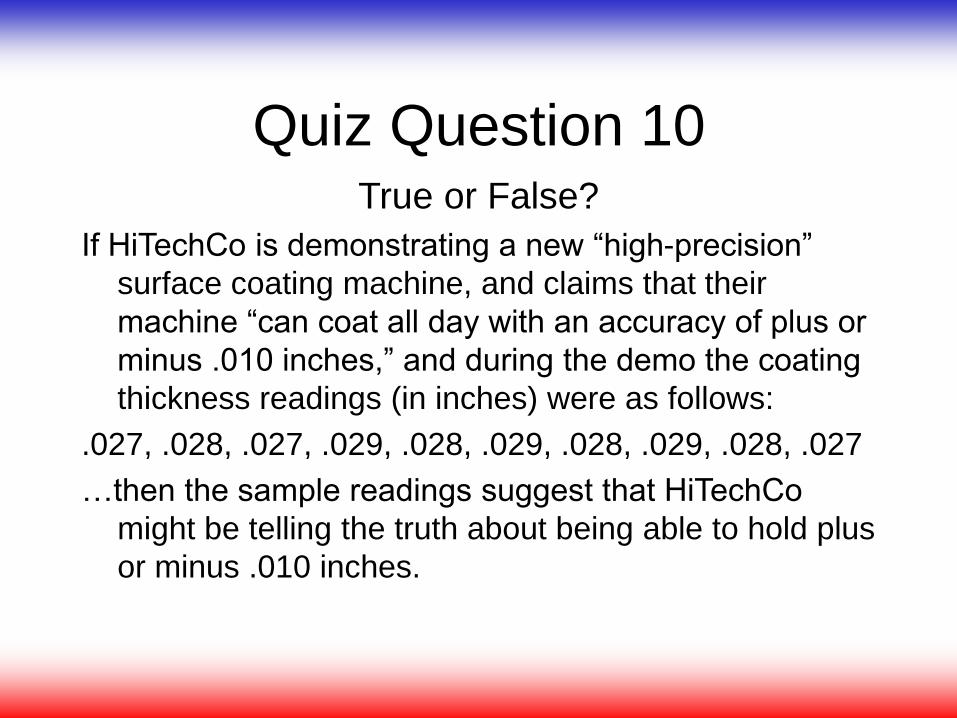
Quiz Question 10True or False?
If HiTechCo is demonstrating a new “high-precision”
surface coating machine, and claims that their
machine “can coat all day with an accuracy of plus or
minus .010 inches,” and during the demo the coating
thickness readings (in inches) were as follows:
.027, .028, .027, .029, .028, .029, .028, .029, .028, .027
…then the sample readings suggest that HiTechCo
might be telling the truth about being able to hold plus
or minus .010 inches.
Appendix
Cpk and PPM
(Parts Per Million Defective)
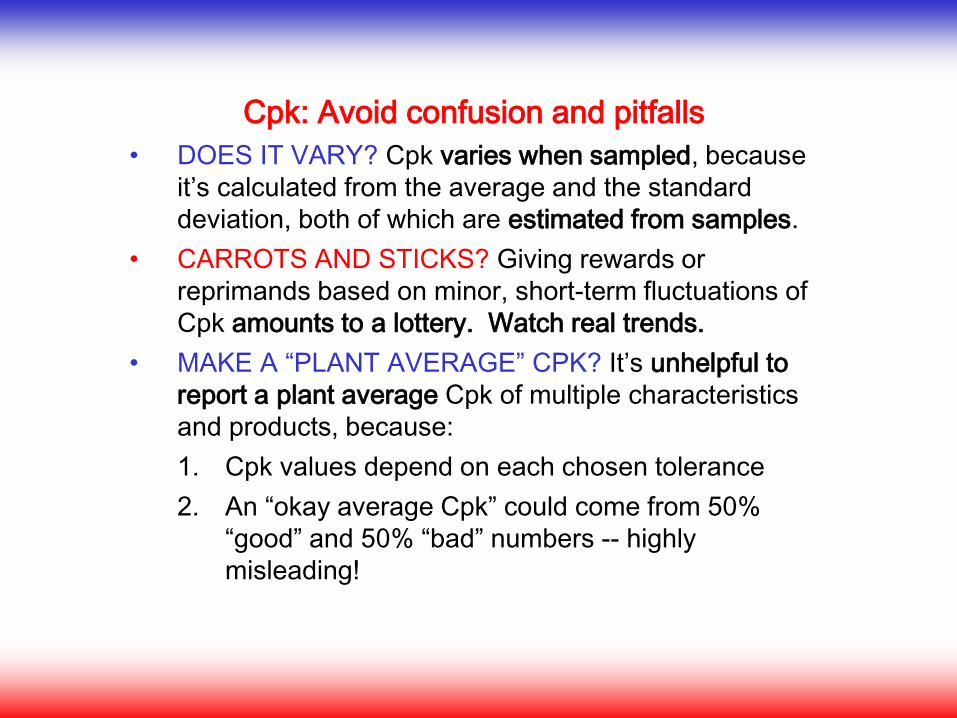
Cpk: Avoid confusion and pitfalls
• DOES IT VARY? Cpk varies when sampled, because
it’s calculated from the average and the standard
deviation, both of which are estimated from samples.
• CARROTS AND STICKS? Giving rewards or
reprimands based on minor, short-term fluctuations of
Cpk amounts to a lottery. Watch real trends.
• MAKE A “PLANT AVERAGE” CPK? It’s unhelpful to
report a plant average Cpk of multiple characteristics
and products, because:
1. Cpk values depend on each chosen tolerance
2. An “okay average Cpk” could come from 50%
“good” and 50% “bad” numbers -- highly
misleading!
A
B
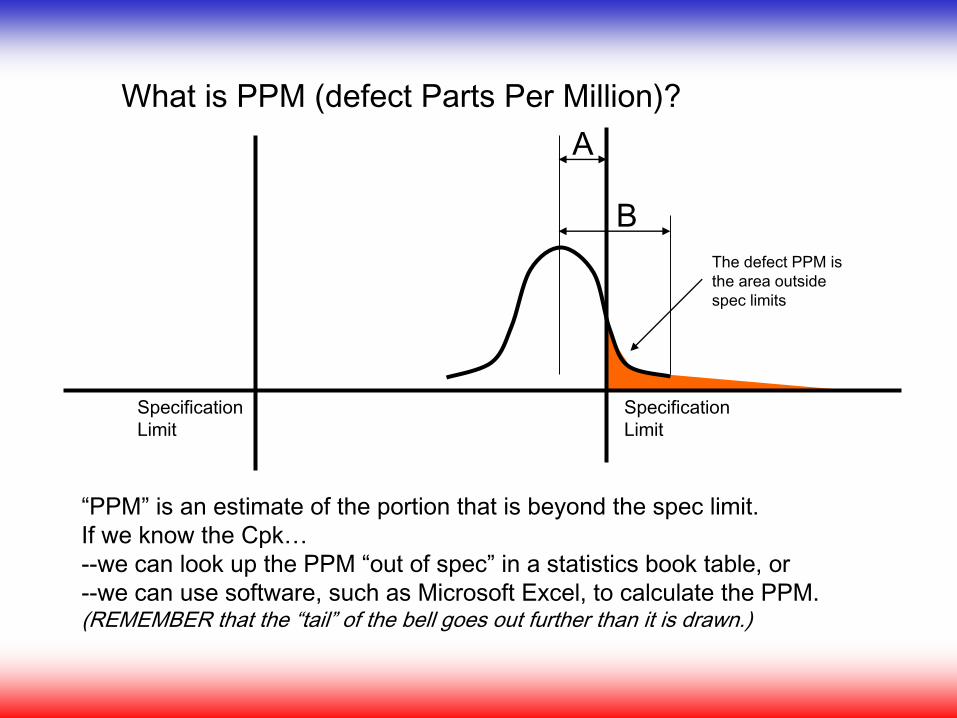
What is PPM (defect Parts Per Million)?
“PPM” is an estimate of the portion that is beyond the spec limit.
If we know the Cpk…
--we can look up the PPM “out of spec” in a statistics book table, or
--we can use software, such as Microsoft Excel, to calculate the PPM.(REMEMBER that the “tail” of the bell goes out further than it is drawn.)
Specification
Limit
Specification
Limit
The defect PPM is
the area outside
spec limits
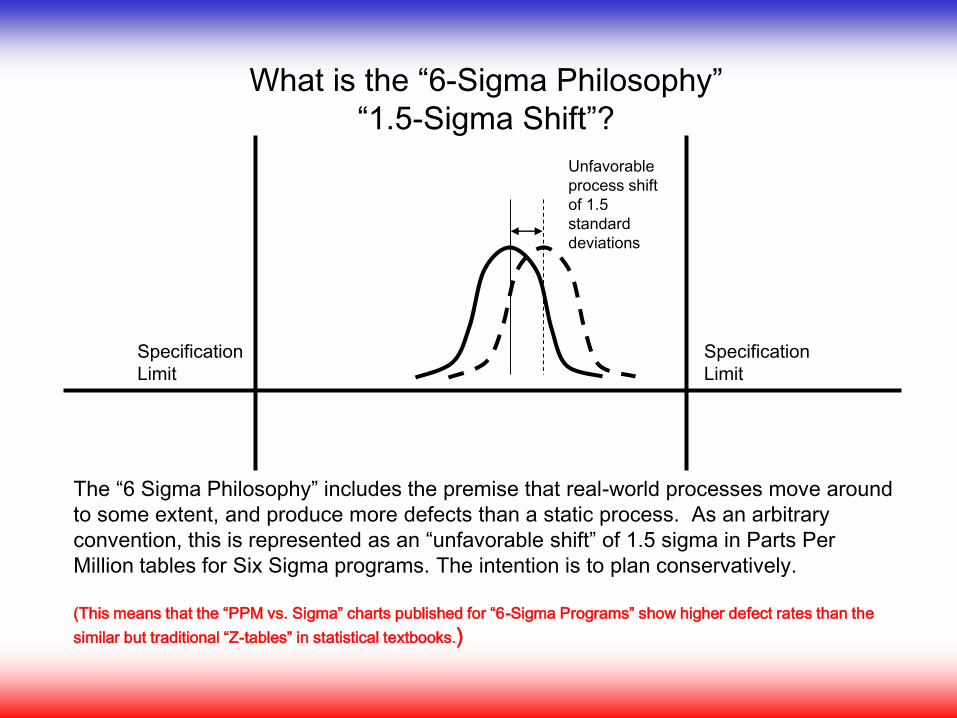
What is the “6-Sigma Philosophy”
“1.5-Sigma Shift”?
The “6 Sigma Philosophy” includes the premise that real-world processes move around
to some extent, and produce more defects than a static process. As an arbitrary
convention, this is represented as an “unfavorable shift” of 1.5 sigma in Parts Per
Million tables for Six Sigma programs. The intention is to plan conservatively.
(This means that the “PPM vs. Sigma” charts published for “6-Sigma Programs” show higher defect rates than the
similar but traditional “Z-tables” in statistical textbooks.)
Specification
Limit
Specification
Limit
Unfavorable
process shift
of 1.5
standard
deviations
The following page is a table showing the relationships
among the following:
• Cpk,
• “How Many Sigma Capability,”
• Parts Per Million according to traditional statistical tables
• Parts Per Million taking into account the “6-Sigma
Philosophy” of an unfavorable shift in the mean of 1.5
Sigma
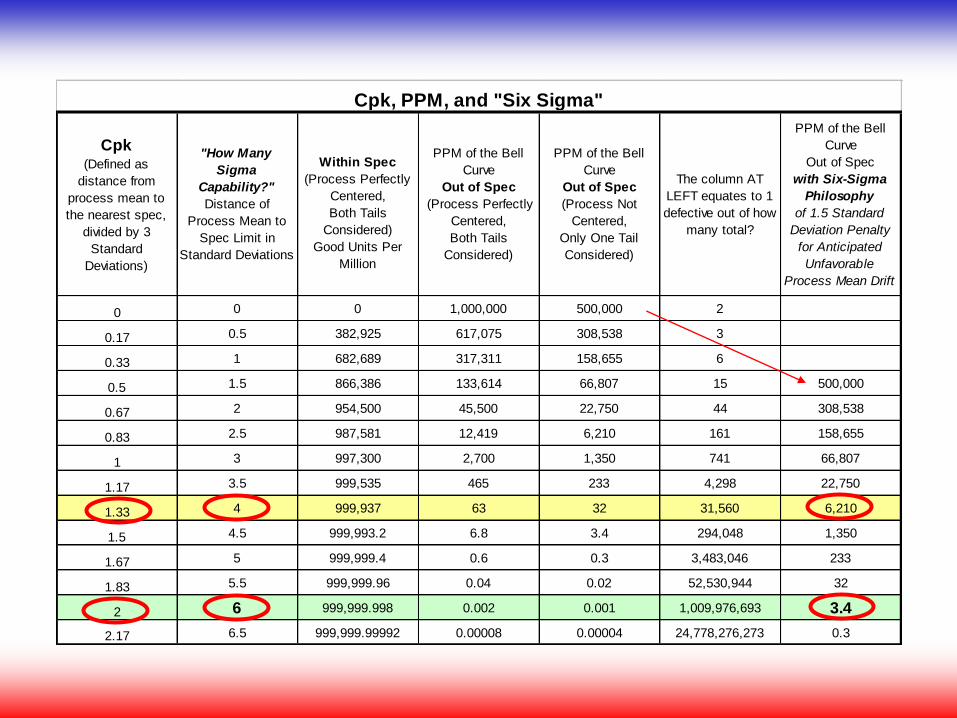
Cpk (Defined as
distance from
process mean to
the nearest spec,
divided by 3
Standard
Deviations)
"How Many
Sigma
Capability?"
Distance of
Process Mean to
Spec Limit in
Standard Deviations
Within Spec
(Process Perfectly
Centered,
Both Tails
Considered)
Good Units Per
Million
PPM of the Bell
Curve
Out of Spec
(Process Perfectly
Centered,
Both Tails
Considered)
PPM of the Bell
Curve
Out of Spec
(Process Not
Centered,
Only One Tail
Considered)
The column AT
LEFT equates to 1
defective out of how
many total?
PPM of the Bell
Curve
Out of Spec
with Six-Sigma
Philosophy
of 1.5 Standard
Deviation Penalty
for Anticipated
Unfavorable
Process Mean Drift
0 0 0 1,000,000 500,000 2
0.17 0.5 382,925 617,075 308,538 3
0.33 1 682,689 317,311 158,655 6
0.5 1.5 866,386 133,614 66,807 15 500,000
0.67 2 954,500 45,500 22,750 44 308,538
0.83 2.5 987,581 12,419 6,210 161 158,655
1 3 997,300 2,700 1,350 741 66,807
1.17 3.5 999,535 465 233 4,298 22,750
1.33 4 999,937 63 32 31,560 6,210
1.5 4.5 999,993.2 6.8 3.4 294,048 1,350
1.67 5 999,999.4 0.6 0.3 3,483,046 233
1.83 5.5 999,999.96 0.04 0.02 52,530,944 32
2 6 999,999.998 0.002 0.001 1,009,976,693 3.4
2.17 6.5 999,999.99992 0.00008 0.00004 24,778,276,273 0.3
Cpk, PPM, and "Six Sigma"


![Ch05a Process Capability[1]](https://img.pdfslide.us/doc/110x75/577d2daf1a28ab4e1eae1c6c/ch05a-process-capability1.jpg)