Embed Size (px)
Citation preview

Process and Politics: IT Governance in Higher Education
Ronald Yanosky, ECARwith
Jack McCredie, University of California, Berkeley, and ECAR
Volume 5, 2008
Research Study from the EDUCAUSE Center for Applied Research

4772 Walnut Street, Suite 206Boulder, Colorado 80301www.educause.edu/ecar/
This research study is available online at the ECAR website (www.educause.edu/ecar). The content of this study is restricted to authorized ECAR subscribers and to those who have separately purchased this study. The username and password below are required to gain access to the online version and are to be used only by those who may legally access the content.
Username: ERS0805Password: ITGOVERNANCE07

Process and Politics:IT Governance inHigher Education

EDUCAUSE is a nonprofit association whose mission is to advance higher education by promoting the intelligent use of information technology.
The mission of the EDUCAUSE Center for Applied Research is to foster better decision making by conducting and disseminating research and analysis about the role and implications of information technology in higher education. ECAR will systematically address many of the challenges brought more sharply into focus by information technologies.
Copyright 2008 EDUCAUSE. All rights reserved. This ECAR research study is proprietary and intended for use only by subscribers and those who have purchased this study. Reproduction, or distribution of ECAR research studies to those not formally affiliated with the subscribing organization, is strictly prohibited unless prior written permission is granted by EDUCAUSE. Requests for permission to reprint or distribute should be sent to [email protected].

EDUCAUSE CENTER FOR APPLIED RESEARCH 3
IT Governance ECAR Research Study 5, 2008
Contents
Foreword ...............................................................................................................................5 A New Unification? ◆ Accidental Governance: A History ◆ Why Is IT Governance So Important,
Now? ◆ The Real Issue Is Service ◆ ECAR Study of IT Governance
Chapter 1 Executive Summary ............................................................................................... 11 Defining IT Governance ◆ Methodology ◆ Key Findings ◆ Conclusion
Chapter 2 Introduction and Methodology ..............................................................................21 What Do We Mean by IT Governance? ◆ IT Governance and Higher Education ◆ Study Objectives
and Scope ◆ Research Approach ◆ Overview of Respondents ◆ Study Organization
Chapter 3 IT Governance Maturity and Context .....................................................................31 Maturity ◆ IT Governance Design and Frameworks ◆ CIO Responsibility and Executive Knowledge ◆ IT Alignment ◆ Drivers and Barriers ◆ Summary and Implications
Chapter 4 Inputs and Decision Making ..................................................................................45 Examining Participation in IT Governance: Methodology ◆ General Patterns: Decision Type ◆
General Patterns: Participants ◆ Participation and CIO Cabinet Membership ◆ Participation and
ITG Measurement ◆ Frequent Participation ◆ Summary and Implications
Chapter 5 IT Governance in Action: Committees and Processes .............................................63 Committees and Processes: An Overview ◆ The IT Steering Committee ◆ Other IT Governance
Committees ◆ IT Governance Processes ◆ Summary and Implications
Chapter 6 IT Governance Performance and Effectiveness .......................................................85 Performance and Effectiveness: An Overview ◆ What Affects ITG Outcomes? ◆ Successful and
Unsuccessful ITG Outcomes: Respondent Views ◆ Summary and Implications
Chapter 7 CIOs and Executives ............................................................................................101 Overview of the Executive Survey ◆ IT Governance Maturity and Context ◆ Performance and
Outcomes ◆ Summary and Implications
Chapter 8 The Future of IT Governance ................................................................................ 111 Catalysts for ITG Change ◆ IT Governance in the Next Generation ◆ Conclusion
Appendix A Institutional Respondents to the Online CIO Survey ..............................................125Appendix B Institutional Respondents to the Online Executive Survey ..................................... 131

4
IT Governance ECAR Research Study 5, 2008
Appendix C Interviewees in Qualitative Research .................................................................... 133Appendix D Statistical Details..................................................................................................137Appendix E Bibliography ........................................................................................................139

EDUCAUSE CENTER FOR APPLIED RESEARCH 5
IT Governance ECAR Research Study 5, 2008
©2008 EDUCAUSE. Reproduction by permission only.
Foreword
Information technology (IT) governance consumes the time and attention of higher education’s IT leaders. In fact, among all is-sues, the management of governance was listed in 2008 as second only to funding as the area in which IT leaders spend the most time.1 Why is that?
The answer to this question is complex. IT in higher education has made a journey. It has moved from the laboratory to the enterprise and now pervades the fabric of higher educa-tion. Managing the institution’s infrastructure, its services, its online resources, and its data has literally become everyone’s responsibility. Everyone has a stake. IT governance is the institution’s approach to acknowledging everyone’s stake and to empowering the academy’s stakeholders in determining the directions IT is to take. To me, IT governance suggests no more and no less than engaging and aligning the ideas and efforts of a diverse community of interested and intelligent skep-tics. A tall order.
A New Unification?The Gospel of Luke contains the story
of a man with two sons. The younger son demands his inheritance while his father is alive, and runs off to another country where he “wastes his substance with riotous living.” The younger son becomes a swineherd and
ultimately resolves to return to seek his father’s forgiveness. His father welcomes him without reproach and counsels the jealous older son to “be glad, for thy brother was dead and is alive again; was lost, and is found.”
The issue of centralizing or decentralizing the management of higher education IT resources bears some resemblance to the story of the prodigal son. If we in central IT are like the prodigal son returning to the academy from whence we came, the challenge of IT governance remains: Will the son return to the family, and will the family embrace him? In our context, we must ask, can we pave the way for a “new unification” in the governance of institutional IT resources?
To answer this question, we must recog-nize that framing the problem as “centraliza-tion versus decentralization” is polarizing, unhelpful, and “out of time.” This dichotomy ignores both the past of IT in higher education and its future.
Accidental Governance: A History
The first modern computers have their roots at universities. The Mark I computer, ENIAC 1, and Manchester’s Baby were fired up within 24 months in the 1940s at Harvard, the University of Pennsylvania, and the University of Manchester, respectively. Their missions

6
IT Governance ECAR Research Study 5, 2008
were scientific and military. Our professional ancestors were scientists and mathematicians who had no need to craft IT governance. Computing was massive. It was centralized by dint of the technology itself, specialized in its purpose, and completely opaque in its opera-tion to all but the expert. It was isolated.
The integrated circuit, the ARPANET, the invention of Ethernet, and other innovations made it possible for computing to move out of the monolithic university computer center and out to the laboratory. The emergence of commercial applications and third-generation programming languages made computing more widely applicable throughout the univer-sity enterprise, accessible to a broader user public, and less opaque to use. ERMA—the first electronic computer-based accounting application—placed this new tool in the service of university administration.
As the administrative uses of computing rose in importance, our prodigal son left the research environment, taking enterprise computing for his inheritance. By the 1970s, enterprise computing came to be dominated by the university financial system, payroll system, and student information system. In the following decades, the son’s attention was largely consumed by the network backbone, IT security, enterprise resource planning, Y2K, and other very real concerns that are largely peripheral to university researchers.
Local IT resources grew and by the early 1980s focused largely on research and departmental administration. This growth has been aided and abetted by the persistence of Moore’s law, the increasing ubiquity of networks, and a contract- and grant-based financing arrangement that vests purchasing authority for much IT in researchers. We spoke of continents (the university data center) and archipelagos—disconnected islands of infor-mation technology.
What has emerged can be fairly charac-terized as the accidental governance of the institutional IT enterprise. No one consciously
decided, “I think what we need is 32 e-mail systems.” Decentralized funding and loosely coupled authority systems (shared gover-nance) have combined to yield IT decision making that is distributed widely throughout the enterprise and often outside the influence of the central IT organization. The question of centralization or decentralization of campus IT is just a reflection of broader university gover-nance. We are reminded that “a university consists of warring academic factions united by a common parking problem!”
As is the case of overall governance in higher education, the accidental or market gover-nance of IT in higher education is not per se a bad thing. For example, university researchers are extraordinarily productive, and it is clear that higher education’s research mission has been transformed profoundly—first in the scientific disciplines, but increasingly in the social sciences and the humanities. As well, many schools and colleges within research universities have evolved highly professional IT organizations which themselves struggle with governing IT environments across disparate academic departments. This is certainly true of our schools of medicine. In many ways, the unplanned localization of institutional IT management smacks of rewarding faculty entrepreneurship and contributes directly and positively to scholarship and discovery.
At the same time, unplanned and unco-ordinated localization of authority does pose great challenges for institution-wide compliance with security, copyright, privacy, identity, and other regulations; it makes it awkward for CIOs to account well for the breadth and depth of overall IT activity, and it can be inefficient.
If it is true that localization of authority in some arenas is critical, the vital governance question for CIOs and other institutional leaders is not “to centralize or not to decen-tralize,” but where to centralize (or not) and how to harmonize institutional efforts and investments in IT. Longer term, as the objects

EDUCAUSE CENTER FOR APPLIED RESEARCH 7
IT Governance ECAR Research Study 5, 2008
of our attention become services and service delivery, the questions of where a service originates or who operates what parts of a service will be subordinated to the ques-tion of whether a service is effective, timely, engaging, secure, or trustworthy.
Why Is IT Governance So Important, Now?
The issue of harmonizing university efforts and investments in IT is gaining importance for some very compelling reasons.
Eroding Funding LandscapeSome institutions will face revenue pressures from declining enrollments and rising expenditures as they outfit labs for a new generation of faculty in the wake of baby boom retirements. Rising federal budget deficits may depress revenues for university-spon-sored research.Central IT organizations are likely to be under heightened pressures to lower costs or at least to hold the line on costs while doing more.
Evolving Research LandscapeMany research endeavors are becoming more centralized. As the cost and complexity of projects like the Earth Simulator, Human Genome Project finding a cure for Parkinson’s Disease, or instruments like the Large Hadron Collider rise, the need to share resources on a wide—possibly global—basis rises.The nature of scientific inquiry in many fields is shifting from a priority on creating massive data sets to one of mining existing data sets for their scientific content. Such a shift also suggests an emphasis on collaboration and on an infrastructure, standards, and reward system that supports access to data, instruments, services,
◆
◆
◆
◆
collaborative tools, and preservation of long-lived data sets.Demand for computationally inten-sive resources in social science and humanities research will rise, without a concomitant rise in localized funding support via contracts and grants.
Teaching Becomes Part of the Enterprise Landscape
Regulatory pressures, new enterprise IT capabilities, and higher education’s drive to lower costs—as well as to enhance, engage, and improve learning outcomes—are conspiring to make teaching a matter of greater institu-tional concern. Where in the past an instructor was king or queen in his or her classroom, institutions are looking increasingly at best practice and at “course reinvention.” Incoming students and faculty members expect to use technology in their instruction. These factors suggest a growing need for central academic and IT engagement in matters related to instruction.A substantial and growing number of institutions have incorporated e-learning into their standard educa-tional delivery and are increasing the footprint of the institution by deliv-ering education at a distance over the network.
Evolving External and Regulatory Environment
IT and data within higher education information systems are becoming increasingly regulated and scrutinized. This regulation ranges from pressures for disclosure and transparency to pressures for privacy. These pres-sures accent the need for common approaches, common solutions, and consistent high-quality data.
◆
◆
◆
◆
◆

8
IT Governance ECAR Research Study 5, 2008
Higher education information systems continue to be subject to a large number of security threats. The ability to secure the gamut of institutional IT resources and data has become a compelling and increasingly urgent need.
Changing IT and Information Resources Landscape
A robust middleware layer that can facilitate and mediate the authentica-tion and authorization of students, teachers, and researchers across a global array of instruments, data, networks, images, and other resources is emerging. The adoption of stan-dards, shared procedures, and trust agreements is making it possible to federate IT solutions, suggesting new IT governance options.Firms like Microsoft, IBM, Oracle, and others are racing to develop enterprise-level e-collaboration environments.The open content and open source movements are growing, reflecting and amplifying the powerful human urge to share resources, knowledge, solutions, and insights.The shift to a services orientation is also a trend designed to dilute the signifi-cance of “who owns what” or “who does what” in the network cloud.Breakthroughs in virtualization tech-nology are making the question of who operates a service less relevant, allowing researchers (and others) to focus on the performance of a service and on the underlying relationship between the provider and consumer of a service.
All of these change drivers suggest the need for colleges and universities to seek a new unification and alignment of IT resources—a renegotiation, if you will, of roles and responsibilities for the management of institutional IT resources.
◆
◆
◆
◆
◆
◆
The Real Issue Is ServiceIf our past can be likened to the uncom-
fortable departure of the prodigal son and our future to an increasingly richly interconnected infrastructure that makes digital learning and research resources available on demand (over high-speed networks) to all members of the community regardless of where those resources are hosted, what becomes of our historical conceptions of IT centralization or decentralization?
I suspect that the answer to this ques-tion is found—as in the story of the prodigal son—in the underlying relationship between father and son or, in our case, between service producer and consumer. At some institutions, the separation of central computing from local computing was an amicable one. In such institutions, responsibilities often seem to flow between central and local campus units in accord with flows of funds, expertise, supply, and demand. In other institutions, mutual trust is low. Time has erased memory of IT providers’ and researchers’ common ancestry. Local IT service providers and faculty at these institutions view central IT providers’ motives with suspicion, and our capacity to deliver services with skepticism. In truth, many of us in central IT roles think more about leveraging resources, saving money, and mitigating risk than we do about contributing to great teaching or research. ECAR studies confirm that we spend much of our time with provosts and business officers but less with deans, academic leaders, and major campus research investigators. Our IT colleagues in campus schools and colleges do not always echo our priorities, and they spend their time focused on different aspects of the mission than we do.
UC Berkeley CIO Shel Waggener argues convincingly that the issue is no longer about where a service is provided. IT-enabled services may be operated at a local campus unit, in the central IT or business organiza-tion, or in the Internet cloud. The issue is

EDUCAUSE CENTER FOR APPLIED RESEARCH 9
IT Governance ECAR Research Study 5, 2008
who provide IT services in local units of the institutions, those who deliver instruction, and those who design and perform the research. Governance without trust is bound by rules and seems likely to promote the politics of divi-sion. Trust, anchored in demonstrated success as a service provider, is the glue that will bind the investments we will need to make.
ECAR Study of IT Governance
I am very proud of the study of IT gover-nance that follows. Its timeliness is indisput-able. In addition to the usual challenge that I place on ECAR Fellows at the beginning of each study to “produce the best contribution to the higher education IT literature, period,” this time I encouraged the investigators to simply “write the best piece of applied research on IT governance anywhere.” I think they have. In many ways, the study that follows represents the first empirical tests of the prevailing models of IT governance in a specific industry. Its results are of clear prac-tical benefit, and the authors have taken pains to incorporate actionable advice systematically throughout the report.
As always, an ECAR research study is an extraordinary team effort. Ron Yanosky, acting as principal investigator, and Jack McCredie, who championed the topic within ECAR and brought his incomparable IT governance expe-rience to bear on our study design and review, deserve the lion’s share of credit for the results of this yearlong effort. But they led a real team. Within ECAR, Fellows Robert Albrecht, Mark Nelson, Gail Salaway, Mark Sheehan, Toby Sitko, and I had the genuine pleasure of reviewing survey and chapter drafts, sounding out hypotheses, developing the study’s framing questions, checking the quantitative mate-rial, and evaluating preliminary findings. Toby coordinated as well the first-rate editorial and production team that included Nancy Hays, Gregory Dobbin, Susan Gollnick, Bob Carlson, Lorretta Palagi, and Stephen Larghi.
the orchestration of the institution’s services and their quality. CIOs first need to establish credibility as service providers; then, reason-able people will support their proposals for new things.
While enterprise computing has become impossibly complex, specialized slices of computing have become less opaque, less costly, and easier to operate. In this environ-ment, it really does come down to two ques-tions: Who can provide the service better, and who can provide the service cheaper? In the current system of academic funding and incentives, service quality will often trump service cost. In research, for example, no one has received a Nobel Prize for conducting the most efficient research.
Changes to the funding system, gover-nance, the incentive system, the service architecture, and the underlying technology are all needed to move higher education to higher levels of performance, accessibility, and accountability. Those of us in central IT need to rediscover the humility of the swine-herd, remember our roots, and rekindle our attachment to the academic purpose. Our IT governance will flow from a “new reunifica-tion.” We need to fulfill our basic charge with distinction, because that earns us the right to seek reunification. We can lobby our leaders for mandates to centralize, but in the meantime we need to win reunification by simply and demonstrably doing a better job. Our first impulse must be to facilitate solu-tions rather than to enforce rules. We need to make the center visible in positive ways where the academic mission of the institution is delivered.
Our ability to realize the vision of an open and richly interconnected and accessible tapestry of information resources and services depends on massive investments in many areas. Such investments are necessary, but not sufficient. Sufficiency depends on the relation-ships between and among those who manage the institution’s enterprise IT resources, those
10
IT Governance ECAR Research Study 5, 2008
California campuses. We are grateful as well to the 28 IT executives, named in Appendix C, who participated in qualitative research to explain, illuminate, and invigorate quantita-tive findings. And we would like to thank the attendees of the IT governance summit that EDUCAUSE sponsored in Denver in September 2007 for their comments on this study’s preliminary findings and the valuable discussions that followed.
It seems it takes a village to produce an ECAR study!
Richard N. KatzBoulder, Colorado
Endnote1. Debra H. Allison, Peter B. DeBlois, and the EDUCAUSE
Current Issues Committee, “Current Issues Survey Report, 2008,” EDUCAUSE Quarterly 31, no. 2 (2008): 17, http://connect.educause.edu/Library/EDUCAUSE+Quarterly/CurrentIssuesSurveyReport/46570.
ECAR studies triangulate on the truth by incorporating the generous thinking and feedback of leaders within the higher educa-tion community at key stages of the research. ECAR would like to thank Andrew Clark, Chief Process Architect, Syracuse University; Brad Reese, Vice President for Technology and CIO, Roosevelt University; and Fred Siff, Vice President, CIO, and Professor of Information Systems, University of Cincinnati, for their generous assistance reviewing our survey drafts. We also wish to express our gratitude to the institutional and consortial IT leaders who partnered with us in arranging the secondary survey of non-IT participants in IT governance analyzed in Chapter 7: David Ernst, then of the California State University, Office of the Chancellor and currently at the University of California System; Bret Ingerman of Vassar College; Joanne Kossuth of the Franklin W. Olin College of Engineering; and the top IT leaders of several University of

EDUCAUSE CENTER FOR APPLIED RESEARCH 11
IT Governance ECAR Research Study 5, 2008
©2008 EDUCAUSE. Reproduction by permission only.
Governance isn’t just about governments. In recent years, financial scandal and a new web of accounting and privacy regulations have brought renewed interest to questions of how corporate and other entities govern themselves—that is, how they distribute high-level decision-making authority and pursue strategic objectives aligned with the interests of shareholders and other stakehold-ers. A good deal of this activity grew out of painful lessons learned in the dot-com col-lapse, and more generally out of the social and economic transformations brought by the Internet. So it’s not surprising that along with the renaissance of interest in corporate governance there’s been a particular flower-ing of attention to how organizations should govern the expensive, complex, indispensable, strategy-enabling domain of information technology (IT).
ECAR’s study of IT governance in higher education is partly a reflection of this broader interest and partly the result of a more paro-chial concern about what appears to be the exploding “politicization” of IT on campuses. Today, IT systems have a heavy impact on how every manner of work gets done, and they shape the campus experience almost as much as the institution’s physical grounds. IT’s constituents are not only numerous, they’re also increasingly confident and vocal about
their technology-related views. It’s neither feasible nor desirable for CIOs, or even top institutional leaders, to make high-level IT decisions without a lot of input and accep-tance from affected stakeholders.
This may help explain why the item “governance, organization, and leadership” has consistently stood among the top-10 issues of strategic importance every year from 2004 to 2008, as measured in EDUCAUSE’s annual member surveys of interest in current IT issues.1 Over the same period, it has also stood among the top-five matters to which CIOs devote their time.
It’s not hard to imagine where much of this time goes: Other survey-topping issues such as security, funding, administrative systems, and strategic planning affect so many constituents and have so many resource impli-cations that collecting advice and achieving the “buy-in” so crucial to success is a major part of getting each done. IT governance is a forum for doing just that. Our study aims to provide CIOs with information about the state of higher education IT governance and to identify practices that are associated with good IT governance outcomes.
Defining IT GovernanceIn IT as in other contexts, governance is
the process that sets top-level goals, assigns
1Executive Summary

12
IT Governance ECAR Research Study 5, 2008
responsibility for meeting them, and assesses the results. The definition we use in this study comes from MIT researchers Peter Weill and Jeanne Ross: IT governance means “speci-fying the decision rights and accountability framework to encourage desirable behavior in using IT.”2
More informally, IT governance (ITG) describes who makes which decisions, who provides input and analyzes the issues, who sets priorities, and who settles disputes when there is no clear consensus. Good governance processes will be actively designed and well understood by participants and will foster timely decisions that are communicated effec-tively. Ultimately, the “desirable behavior” in using IT that our definition mentions means behavior that is aligned with, and helps achieve, institutional strategic goals. Finally, in our view, IT governance is concerned with the whole enterprise IT function, not just the central IT organization.
It’s important to distinguish between IT governance and IT management. Although IT governance should have a pervasive influ-ence, it is not concerned with the details of executing decisions or with day-to-day operations. Nor is it a collection of policies, but rather a process for creating policies. As Weill and Ross put it, “IT governance is not about making specific decisions—manage-ment does that—but rather determines who systematically makes and contributes to those decisions.”
MethodologyOur study of IT governance took a multi-
part approach that consisted ofa literature review to identify issues and establish research questions;consultation with higher education leaders active in IT governance to iden-tify and validate survey questions;a quantitative web-based survey of EDUCAUSE member institutions that received 438 responses, 83% of
◆
◆
◆
which were from the institutions’ senior-most IT leader;a shorter quantitative web-based survey for participants in IT governance who work outside central IT, to which we received 216 responses from 59 institutions;qualitative interviews with 28 IT leaders; andtwo case studies looking at IT gover-nance development and matura-tion at the University of California, Berkeley, and Queensland University of Technology.
Key FindingsOur study focused on how respondent
institutions organized input and decision making relating to high-level IT decisions, what mechanisms and processes they used, and what practices were associated with IT governance performance and effectiveness. The survey questions in our primary (CIO) survey covered
respondents’ perceptions of how mature IT governance was at their institutions;the overall institutional context for IT governance, including drivers, barriers, and participant knowledge about ITG;how frequently different kinds of ITG participants provided input and took part in decision making for each of five different types of IT decisions;committees and other mechanisms involved in IT governance;IT governance involvement in budget processes and project review;use of IT performance measurement and review in ITG processes; andrespondent perceptions of ITG perfor-mance and effectiveness.
In certain questions and in our qualitative interviews, we also examined the “practical politics” of IT governance, asking respondents what factors they felt drove participation in
◆
◆
◆
◆
◆
◆
◆
◆
◆
◆

EDUCAUSE CENTER FOR APPLIED RESEARCH 13
IT Governance ECAR Research Study 5, 2008
ITG processes, how they allocated committee memberships and chair assignments, and what they thought accounted for successful and unsuccessful ITG outcomes. In the following section, we summarize and synthe-size our main findings.
IT Governance MaturityVirtually all of our respondent institutions
reported some kind of IT governance, though most said it was at a relatively low level of maturity. As Figure 1-1 shows, on a six-level maturity scale, only a handful of respondents characterized their institution’s ITG maturity as nonexistent, but almost 6 in 10 chose the next two levels, initial (ITG is informal and uncoordinated) or repeatable (ITG processes follow a regular pattern). Only about 16% chose the two highest levels, managed (ITG processes are monitored and measured) and optimized (employing ITG best practices).
It may be that some institutions delib-erately choose not to pursue higher levels of ITG maturity. However, we found that greater ITG maturity was associated with many desirable institutional characteristics.
For example, respondents reporting higher levels of ITG maturity also tended to report stronger agreement that their institutions were able to develop and implement impor-tant IT decisions and coordinate the activities of IT personnel throughout the institution. They also tended to rate ITG performance and overall effectiveness higher.
Although a slight majority of all respon-dents agreed that IT governance had been actively designed at their institutions, those in the top-two maturity levels agreed much more strongly (mean 4.49, where 1 = strongly disagree and 5 = strongly agree) than those in the bottom two (mean 2.51). This suggests that, at least in some cases, low maturity may be due to inattention to ITG rather than being a deliberate design choice.
Institutional Context for IT Governance
CIOs predominantly hold the IT gover-nance portfolio: 8 in 10 respondents agreed that IT governance was perceived to be the responsibility of the CIO at their institutions. Another result suggests that one of the
1.6
28.829.7
23.7
10.5
5.7
0%
5%
10%
15%
20%
25%
30%
35%
Nonexistent Initial Repeatable Defined Managed Optimized
Maturity Level
Perce
ntage
of In
stitut
ions
Figure 1-1.
Maturity of IT
Governance at
Institution
(N = 438)

14
IT Governance ECAR Research Study 5, 2008
challenges often attached to this responsi-bility is working with ITG participants who aren’t entirely familiar with the process. Respondents averaged a less than neutral response (mean 2.68) on our 5-point scale when asked about their agreement that IT governance could be accurately described by all relevant executives, deans, and depart-ment heads. Agreement, however, rose dramatically with levels of ITG maturity.
Respondents were generally optimistic about IT’s alignment with institutional busi-ness and academic goals (mean agreement 4.00 and 3.86, respectively). Perhaps this was because about 7 in 10 agreed that their institutions had clearly articulated strategic priorities. Agreement about alignment was higher still, however, among institutions reporting higher levels of IT maturity.
These positive responses about IT align-ment seemed to be echoed in our results regarding the top drivers for pursuing IT gover-nance. Asked to name the top-three drivers at their institutions, respondents collectively gave answers that might appear in an ITG textbook: Aligning IT with institutional goals was the most frequently cited driver by a considerable margin, and promoting an insti-tution-wide view of IT was next. Respondents also, however, balanced these responses with practical politics. Ranked next after the top-two drivers were more “people-oriented” drivers such as encouraging and collecting commu-nity input and demonstrating transparency in decision making. A decentralized or informal institutional culture and lack of participation from necessary parties were the top barriers.
ParticipationTrue to higher education’s reputation for
shared governance and decentralization, we found involvement in IT governance to be diverse and widespread, though differentiated by frequency of participation. When we asked respondents to tell us how frequently assorted types of participants (IT managers, presidents,
cabinet executives, students, faculty, and so on) provided input and took part in decision making for different types of IT decisions, we found few cases where the majority response was “very rarely or never” for input, and not a lot more for decision making.
Senior central IT leaders and managers were easily the most active category of participant across all decision types. Cabinet-level executives had the second-highest mean frequency of participation in decisions relating to fundamental IT principles and IT investment and prioritization, while local IT managers had the second-highest participation in IT architec-ture and infrastructure decisions. IT principles, architecture, and infrastructure were the most restrictive categories for decision making; the latter two especially were dominated by IT participants. Applications and IT investment and prioritization reflected more frequent participation from various participant types and from different levels of the organization; in each of these areas, a total of five different participant types had mean decision-making frequencies at or above the scale midpoint of 3.0.
When we averaged frequency of participa-tion across all five decision types, central and local IT stood at the top for mean frequency of participation in decision making (see Figure 1-2). Cabinet executives were the only other participant with a mean overall decision-making participation frequency above 3.0, though several other categories had means above 3.0 for providing input.
Boards were conspicuous for their low levels of reported input and decision making, which in both cases averaged below 2.0 on our 5-point scale. This agrees with a general pattern of quantitative and qualitative results that suggest low board involvement in IT governance. On the other hand, it’s important to note that our respondents characterized frequency of participation, not influence. We presume that boards are highly influential in the rare occasions when they get involved.

EDUCAUSE CENTER FOR APPLIED RESEARCH 15
IT Governance ECAR Research Study 5, 2008
Does higher education’s habit of inclusive-ness work against IT governance effective-ness? Our data suggest just the opposite among our respondent institutions. Those reporting higher ITG maturity levels tended to have higher, not lower, mean frequencies of participation for most IT governance partici-pants. Institutions reporting a greater number of frequent participations in ITG (participant types rated 4 or 5 on our 5-point scale) agreed more strongly that IT was aligned with business and academic goals, that ITG was actively designed, and that key participants could accurately describe ITG. Finally, where an institution’s overall average frequency of participation across all participant and deci-sion types was higher, the institution also tended to report higher overall IT governance effectiveness.
IT Governance CommitteesIT governance-related committees were
abundantly present among our respondent institutions. Two-thirds reported having an
IT steering committee (ITSC) responsible for oversight of major IT policies and initiatives, and similar numbers reported the existence of administrative, teaching/learning-related, and initiative-specific committees. Only about one in five institutions had a board of trustees technology subcommittee.
Virtually all IT steering committees had an advisory role, and about three in four set priorities. Slender majorities had policy-setting powers and the power to adjudicate conflicts, but only about one in four respondents said the ITSC authorized funding. Agreement about ITSC effectiveness was higher where the ITSC had priority-setting and/or policy-setting powers.
Project Review and Institutional Budget Process
Only about 4 in 10 institutions reported that IT governance included a process for formal review and approval of IT projects. Where one existed, projects chosen for review were almost universally evaluated for
1.60
1.67
2.45
2.07
2.63
3.17
2.86
3.38
4.56
1.68
2.19
2.52
2.68
3.11
3.28
3.40
3.85
4.54
0.50.40.30.20.1
Board of regents/trustees (N = 427, 403)
Students (N = 421, 406)
President/chancellor (N = 425, 414)
Faculty (N = 423, 408)
Deans/academic unit leaders (N = 418, 407)
Cabinet-level executives (N = 419, 412)
Business unit leaders (N = 425, 411)
Local IT managers (N = 426, 408)
Sr. inst. IT leader/sr. central IT managers(N = 430, 427)
Mean Overall Frequency of Participation*
Input
Decision making
Figure 1-2. Overall
Frequency of
Input and Decision
Making, by
Participant
*Scale: 1 = very rarely or never, 5 = very frequently or always

16
IT Governance ECAR Research Study 5, 2008
alignment with institutional IT goals, and 8 out of 10 respondents said their institutions evaluated them for compliance with IT archi-tectural standards. Most institutions required a post-completion assessment as well. The relatively low incidence of project review was noteworthy, since institutions that had such a process did better on a wide range of other measures.
IT governance involvement in the institu-tional budgetary process was somewhat more widespread than project review: About 6 in 10 respondents reported such involvement. As with project review, budget process involve-ment was positively associated with a number of good outcomes including, as we report below, overall ITG effectiveness.
Measurement and ReviewThe use of IT performance measurements to
inform and shape IT governance is commonly recommended in the ITG advisory literature. Our survey results confirmed a strong asso-ciation between the use of measurement and assorted governance-related outcomes, including overall ITG effectiveness.
But our respondents also seemed to recognize much potential for improvement in this area. Only 40% said that their institu-tion agreed on measurable goals for IT, and only 28% said that the institution regularly reviewed the effectiveness of ITG processes. Regarding the statement that their institution incorporated measurement and reporting in the ITG process, respondents averaged a 2.93 response, slightly below neutral on our 5-point agreement scale.
Our findings suggest that the incorpora-tion of measurement into IT governance is a fertile area for institutions looking for ways to improve ITG maturity and performance. Incorporation of measurement, like most of our other metrics-related items, was strongly associated with clear articulation of institu-tional strategic priorities, the ability to imple-ment important IT decisions and coordinate
IT personnel throughout the institution, active design of ITG, and overall ITG effectiveness.
IT Governance Performance and Effectiveness
Respondents painted a generally optimistic portrait of how well IT governance worked at their institutions. We asked them to assess it in several different ways. First, we asked them to rate the importance of four institutional performance goals (cost-effective use of IT, and effective use of IT to enhance teaching and learning, research, and administrative processes), as well as the influence ITG had on producing each goal at their institutions. We used these responses to calculate an ITG performance score that ranged from a low of 20 to a high of 100. We also asked them their level of agreement with the statement that IT governance was effective overall at their institutions, using our familiar 5-point agreement scale (1 = strongly disagree, 5 = strongly agree).
The calculated performance scores and the overall effectiveness ratings were strongly correlated. The median performance score was 70 and the mean was 67.7 on the 20-to-100 scale, while the mean overall effective-ness was 3.64, slightly above the midway point between a neutral (= 3) and an agree (= 4) response.
Despite these generally positive results, we did find much variation among institutions in these ITG outcomes, and strong associations with certain ITG mechanisms, processes, and characteristics. Among the items strongly associated with higher performance scores and overall effectiveness ratings were
greater ITG maturity,active design of IT governance,greater overall frequency of participa-tion in input and decision making,incorporation of measurement and reporting in ITG,ability of key participants to describe ITG accurately, and
◆
◆
◆
◆
◆

EDUCAUSE CENTER FOR APPLIED RESEARCH 17
IT Governance ECAR Research Study 5, 2008
participation in the institutional budget process and in formal IT project review.
Table 1-1 shows the differences in mean overall ITG effectiveness for selected items in this list.
One factor often mentioned in our quali-tative interviews as a key to ITG success was CIO membership in the institutional cabinet. Although we did find that cabinet member-ship was modestly associated with higher overall ITG effectiveness, as well as greater mean frequency of participation by the presi-dent and cabinet officers in ITG decisions, the effect was not as strong as any of the associa-tions mentioned above.
At the same time, our respondents seem to think that IT structures and processes can take an institution only so far. When asked what typically was responsible for successful IT governance outcomes, respondents’ top-four choices all dealt with relationships, ranking considerably above such items as formal IT structures and performance metrics.
◆ CIOs and Other IT Governance Participants
Besides the primary survey of IT admin-istrators (mostly CIOs) at 438 institutions, our study included a brief survey on ITG performance and effectiveness among other IT governance participants (mostly institu-tional executives) working outside central IT. Participating CIOs invited up to five other ITG participants to take the second survey. Our analysis compared CIO and executive answers at the 45 institutions from which we received responses to both surveys.
The results generally allay fears that CIOs and their executive colleagues in ITG live in different universes. The two groups rated overall ITG effectiveness in similarly positive ways, and though there were some differ-ences in their assessments of specific factors of ITG performance, their mean overall performance scores did not differ significantly. Executives did not agree quite as strongly as CIOs that IT was aligned with business goals,
Table 1-1. Selected Items Associated with Overall IT Governance Effectiveness
Item Item Agreement Level
ITG is effective overall.
Mean* NStd.
Deviation
ITG at my institution has been actively designed.
Strongly disagree/disagree 3.02 104 1.061
Neutral 3.50 92 1.074
Agree/strongly agree 3.98 225 0.810
We incorporate measurement and reporting in our IT governance process.
Strongly disagree/disagree 3.25 167 1.134
Neutral 3.69 101 0.869
Agree/strongly agree 4.03 160 0.756
IT governance can be accurately described by all relevant executives, deans, and department heads.
Strongly disagree/disagree 3.16 197 1.069
Neutral 3.83 122 0.789
Agree/strongly agree 4.31 99 0.617
Does IT governance at your institution participate in institutional budgetary processes?
No 3.24 180 1.076
Yes 3.93 248 0.853
Does IT governance involve formal review and approval of IT projects at your institution?
No 3.42 254 1.052
Yes 3.97 172 0.848
*Scale: 1 = strongly disagree, 2 = disagree, 3 = neutral, 4 = agree, 5 = strongly agree

18
IT Governance ECAR Research Study 5, 2008
but they still averaged a near-agree (mean 3.87) response, and they gave higher average ratings to the incorporation of measurement into ITG.
ConclusionOur study is not the story of an IT gover-
nance house on fire. Majorities of our respondents agreed that their institution’s IT governance processes made timely decisions, balanced institutional and local/departmental needs, and were effective overall. While few institutions claimed to be in the top tiers of IT governance maturity, it might be argued that given these outcome measures, lower and midrange levels are good enough.
But two lines of argument suggest that many institutions—and not just the low performers—should fortify IT governance by pursuing higher maturity and better perfor-mance. First, nothing about IT is getting less political. Already IT touches virtually every constituency on campus, but the needs those constituents want satisfied, and the tech-nology options available to them, continue to expand in ways that suggest that decisions about information and IT will become still more complex. Cloud computing, software as a service, research cyberinfrastructure, enterprise data management, mobility, privacy regulation, and security are all factors that will put greater stress on the often informal IT governance structures now in place.
What’s more, our research suggests that there’s a good deal that IT leaders can do to improve IT governance performance. Our results can’t demonstrate which way causality runs, but good IT governance outcomes are disproportionately found alongside many practices that are within the practical control of IT administrators. Two stand out because of the relatively poor marks institutions gave themselves in each: the incorporation of IT performance measurement and review into the governance process, and the ability of relevant participants to accurately describe
IT governance. Better metrics and improved engagement with key participants (perhaps, as many of our qualitative interviewees suggested, by recasting IT issues into the busi-ness and academic issues those participants respond best to) may be good places to start when looking for a path toward greater ITG maturity. Actively designing ITG processes rather than just letting them happen is another marker of success. And where insti-tutional realities permit, ITG participation in the budget process and in formal IT project review may both contribute to better ITG performance by empowering it to turn priori-ties into realities.
Finally, our study suggests that higher education IT administrators can and should work within the cultural norms of inclusivity and shared decision making that typify colleges and universities. Tempting as it may sometimes be to yearn for an IT function fully governed within the IT shop, we found that institutions reporting higher ITG maturity and effectiveness also reported more, not less, participation across constituencies. IT gover-nance that effectively harnesses the creative power of the campus community through an enlightened combination of process and poli-tics may be higher education IT’s best chance to advance a proud tradition of innovation and service.
Endnotes1. Debra H. Allison, Peter B. DeBlois, and the EDUCAUSE
Current Issues Committee, “Current Issues Survey Report, 2008,” EDUCAUSE Quarterly 31, no. 2 (2008), http: / /connect.educause.edu /Library /EDUCAUSE+Quarterly/CurrentIssuesSurveyReport/ 46570; John S. Camp, Peter B. DeBlois, and the EDUCAUSE Current Issues Committee, “Current Issues Survey Report, 2007,” EDUCAUSE Quarterly 30, no. 2 (2007), http://connect.educause.edu/Library/EDUCAUSE+Quarterly/CurrentIssuesSurveyReport/40026; Barbara I. Dewey, Peter B. DeBlois, and the EDUCAUSE Current Issues Committee, “Current IT Issues Survey Report, 2006,” EDUCAUSE Quarterly 29, no. 2 (2006), http://connect.educause .edu/Library/EDUCAUSE+Quarterly/CurrentITIssues SurveyRepo/39971; Leslie Maltz, Peter B. DeBlois,

EDUCAUSE CENTER FOR APPLIED RESEARCH 19
IT Governance ECAR Research Study 5, 2008
and the EDUCAUSE Current Issues Committee, “Trends in Current Issues, Y2K–2005,” EDUCAUSE Quarterly 28, no. 2 (2005), http://connect.educause .edu/Library/EDUCAUSE+Quarterly/TrendsinCurrent Issues2000/39912; and Donald Z. Spicer, Peter B. DeBlois, and the EDUCAUSE Current Issues Committee, “Fifth Annual EDUCAUSE Survey Identifies Current IT Issues,” EDUCAUSE Quarterly
27, no. 2 (2004), http://connect.educause.edu/ Library/EDUCAUSE+Quarterly/FifthAnnualEDUCAUSE Survey/39863.
2. Peter Weill and Jeanne Ross, IT Governance: How Top Performers Manage IT Decision Rights for Superior Results (Boston: Harvard Business School Press, 2004), 2.


EDUCAUSE CENTER FOR APPLIED RESEARCH 21
IT Governance ECAR Research Study 5, 2008
©2008 EDUCAUSE. Reproduction by permission only.
Perhaps there was a time when IT gov-ernance (ITG) sounded like an oxymoron. When there was only one computer on cam-pus and only a relative handful of users, big decisions about computing could be decided within a limited circle. Computing just didn’t involve enough people to justify a grand term like governance.
Perhaps. In fact, such decisions have always invited conflict and competition. But there’s little doubt that the complexity and political sensitivity of deciding how to invest in IT has exploded beyond recognition since the mainframe era. If IT governance still has any oxymoronic overtones today, it’s only because IT has attracted so many constituents and so much controversy that it might not seem governable at all.
But of course it’s just such complexity that calls for governance. Today, IT systems have a heavy impact on how every manner of work gets done, and they shape the campus experience almost as much as the institution’s physical grounds. IT’s constituents are not only numerous, but they are also increasingly confident and vocal about their technology-related views. List the strategic concerns that drive institutional agendas—educational performance, research productivity, account-ability, program design and instructional delivery models, recruitment, the student
experience, the cost of education—and IT will have a heavy, perhaps a defining, impact on each. It’s neither feasible nor desirable for CIOs, or even top institutional leaders, to make high-level IT decisions without a lot of input and acceptance from affected stakeholders. Nor can one-on-one contacts or ad hoc deci-sion-making processes ensure a consistent and truly institutional approach to IT.
This may help explain why the item “gover-nance, organization, and leadership” has consistently stood among the top-10 issues of strategic importance every year from 2004 to 2008, as measured in EDUCAUSE’s annual member surveys of interest in current IT issues.1 Over the same period, it has also stood among the top-five matters to which CIOs devote their time. Neither result is surprising in light of the very top items that have dominated these surveys, such as security, funding, administra-tive systems, and strategic planning. These items affect so many constituents and have so many resource implications that collecting advice and achieving the “buy-in” so crucial to success is a major part of getting each done. IT governance is a forum for doing just that.
What Do We Mean by IT Governance?
In IT as in other contexts, governance is the process that sets top-level goals, assigns
2Introduction and
Methodology
To prudent men we commit the government of ourselves more willingly than to others.—Thomas Hobbes

22
IT Governance ECAR Research Study 5, 2008
responsibility for meeting them, and assesses the results. The definition we use in this study (and often cited elsewhere) comes from MIT researchers Peter Weill and Jeanne Ross: IT governance means “specifying the decision rights and accountability framework to encourage desirable behavior in using IT.”2 As Weill and Ross note, their defini-tion is broadly consistent with others, such as those offered by Wim Van Grembergen of the University of Antwerp and by the IT Governance Institute.3
More informally, IT governance describes who makes which decisions, who provides inputs and analyzes the issues, who sets priorities, who implements the results of the decisions, and who settles disputes when there is no clear consensus. Good gover-nance processes will be actively designed and well understood by participants and will foster timely decisions and alignment of an organization’s IT strategy with its overall mission and goals.4
It’s important to distinguish between IT governance and IT management. Although IT governance should have a pervasive influ-ence, it is not concerned with the details of executing decisions or with day-to-day operations. Nor is it a collection of policies, but rather a process for creating policies. As Weill and Ross put it, “IT governance is not about making specific decisions—manage-ment does that—but rather determines who systematically makes and contributes to those decisions.”
Finally, IT governance is concerned with the whole enterprise IT function, not just the central IT organization. True, its component parts may be concerned with specific func-tions, but the “desirable behavior in using IT” that our definition mentions must ulti-mately be behavior that is aligned with, and helps achieve, institutional strategic goals. Governance is therefore a crucial means of establishing effective relationships between central and local IT units, and between the
IT function and business and academic func-tions. A key finding of this study is that percep-tions about effective ITG balance of central and local IT correlate closely with perceptions of overall ITG effectiveness.
IT Governance and Higher Education
Colleges and universities have many characteristics that color and complicate their IT governance needs. Perhaps the most important of these is the concept of “shared governance,” the notion that the faculty (and other constituents) share responsibility with the administration and board for the institution’s direction and performance. One influential faculty view of shared governance is expressed in a statement of the American Association of University Professors: “The faculty has primary responsibility for such fundamental areas as curriculum, subject matter, and methods of instruction, research, faculty status, and those aspects of student life which relate to the educational process.... Agencies for faculty participation in the government of the college or university should be established at each level where faculty responsibility is present.”5
Of course, other governance participants may assert their own primacy. The Association of Governing Boards unsurprisingly asserts that boards “should retain the ultimate responsibility and full authority to deter-mine the mission of institutions” and should establish “the rules by which [stakeholder] voices are considered.”6 A recent spate of faculty votes of no confidence in presidents, especially the drama leading to the 2006 resignation of Lawrence Summers from Harvard’s presidency, has also put a spotlight on authority conflicts between executive leadership, the faculty, and other parties. Yet if the exact division of responsibilities is often contested, prevailing models of higher education governance generally accept shared decision making in principle, and mastering

EDUCAUSE CENTER FOR APPLIED RESEARCH 23
IT Governance ECAR Research Study 5, 2008
its complexities is a key competence of the higher education executive.
If anything, the trend is toward more, not less, “sharing.” Nonacademic staff, adjunct faculty, students, and members of the surrounding community are now often considered to be stakeholders in institutional governance decisions, and increasingly institu-tions have consortial or system-wide relation-ships, perhaps even international partnerships, that require governance consideration. One recent assessment by Dennis John Gayle, Bhoendradatt Tewarie, and A. Quinton White Jr. concludes that “shared governance as traditionally defined is clearly obsolescent and requires reinterpretation.“ The authors argue that the solution lies in more effective sharing, not less sharing—and the key to that is to understand and overcome the different perspectives that different groups bring to governance. “Governance must be shared among all major stakeholders, not just faculty, students, administrators, and trustees, on the basis of mutual respect and open communica-tion,” they write. Institutions, they add, must find ways to “work patiently within identi-fied collegial networks and eventually to fold multiple perspectives together while creating rolling visions of change.”7
The results of this study suggest that IT at our respondent institutions has been drawn deep into the culture of shared governance in its broadest sense. Input into most types of IT governance decisions was spread widely across different constituencies, and while decision making was more restricted to IT and other executives, it was far from monolithic. Keeping constituents well informed about ITG decisions and processes, moreover, proved strongly associated with ITG effectiveness. As the “political” nature of IT increases along with the role of technology in almost every-thing the institution does, higher education IT leaders will increasingly find that they need broad-based inputs and that they must trans-late IT strategic objectives and best practices
into terms that are culturally meaningful—and convincing—to a diverse and sophisticated user community.
Where should IT leaders look for guidance about how to do this? Sources of advice are not hard to find: IT governance has attracted a vigorous research community, and a plen-tiful assortment of IT governance models is available.8 The different ITG models all have common characteristics: Each is concerned with allocating decision-making rights to appropriate parties and defining feedback processes that inform decision makers about how well governance decisions are being carried out. Most suggest structures or mechanisms to operationalize these activities, such as committees, project review processes, balanced scorecards, and service level agree-ments. In all models, the ultimate focus is on improving IT value delivery and alignment with organizational strategy.
Higher education IT leaders will quickly note, however, that existing ITG models are largely based on corporate practice, and that they may assume organizational hier-archies, or identify performance goals, that don’t map directly to such higher education realities as shared governance, decentralized authority and funding, academic freedom, and nonprofit status. IT leaders may be left wondering about the value of particular prac-tices in the context of higher education and how their colleagues at other institutions are carrying out IT governance.
Our aims in this study are to provide CIOs with information about the state of higher education IT governance and to identify practices that are associated with good ITG outcomes. We do not present an ITG model of our own, nor do we attempt to name specific governance configurations as best for colleges and universities. As we will have cause to note throughout the study, IT governance processes and structures must be adapted to institutional, not just generic, higher educa-tion needs.

24
IT Governance ECAR Research Study 5, 2008
We have, however, incorporated many of the concerns and recommendations of stan-dard ITG models into our analysis, drawing on them eclectically and sometimes putting them into a higher education idiom. Thus, in addition to drawing on the IT Governance Institute’s ITG maturity-level descriptions and using both a definition of ITG and a typology of ITG decision types developed by Weill and Ross, we’ve also asked about the participation of constituencies and stakeholders specific to higher education, and about committee types and performance goals likely to be found at most colleges and universities.
We also address an aspect of IT gover-nance that gets surprisingly little attention in the academic and advisory literature: what might be called practical politics—the aspects of IT governance that involve establishing credibility with constituents, demonstrating openness and good faith, empowering users, and developing relationships. Given that inclu-sivity is such a prominent aspect of higher education life, we think that such factors play an especially important role there. In ques-tions about ITG drivers and barriers and about what shapes successful and unsuccessful outcomes, and in our qualitative interviews with IT leaders, we’ve tried to uncover the politics that enliven the structural processes of IT governance in higher education.
Study Objectives and Scope
Our study’s main goal is to understand how our respondent institutions allocate input and decision-making rights in IT gover-nance, what mechanisms and processes they employ, and what practices are associated with ITG performance and effectiveness. Our primary survey’s questions covered four broad categories that roughly map to the chapters in this report:
The institutional context for IT gover-nance: respondent perceptions of how mature their institution’s ITG is, whether
◆
IT goals are aligned with academic and business goals, how actively the institu-tion has designed ITG and how knowl-edgeable key participants are about it, and the drivers and barriers to pursuing formal IT governance.Input and decision making: how frequently institutional executives or constituent groups provide input and take part in decision making regarding various kinds of ITG decisions.IT governance structures and processes: incidence, membership, and role of IT steering committees; other commit-tees related to IT governance, ITG participation in project review and the institutional budget process, and methods of communicating IT gover-nance information.Outcomes: how well IT governance performs in influencing key institutional goals, overall effectiveness of IT, and perceived reasons that are typically responsible for successful and unsuc-cessful IT outcomes.
Finally, in a secondary survey described below, we asked a group of IT governance participants who do not work in the central IT organization about their views of ITG performance and effectiveness, and we compared their responses with those of their institutional CIOs.
Research ApproachOur research consisted of five different
components: a literature review; a quantita-tive web-based survey of IT leaders at higher education institutions among the EDUCAUSE member base; an additional quantitative web-based survey of non-IT participants in IT governance; qualitative interviews with IT executives; and case studies.
The literature review helped identify and clarify issues, suggest hypotheses for testing, and provide supportive secondary evidence. Our review examined articles and monographs
◆
◆
◆

EDUCAUSE CENTER FOR APPLIED RESEARCH 25
IT Governance ECAR Research Study 5, 2008
from journalistic, academic, and IT practitioner sources, as well as IT standards and frame-works such as the IT Governance Institute’s COBIT 4.1 framework.
With input from a number of higher education CIOs, the ECAR research team designed two separate web-based surveys, one for senior IT administrators and one for participants in IT governance who work outside the central IT organization. The first survey asked a wide range of questions about IT governance maturity, participation, struc-tures and processes, and performance and effectiveness. The survey for other partici-pants in IT governance consisted of a small subset of questions from the main survey dealing primarily with IT governance perfor-mance and effectiveness. Because most of the IT administrator survey respondents described themselves as their institution’s CIO or equiva-lent, and the other ITG participant survey respondents were predominantly institutional executives, we refer to the surveys respectively as the CIO and executive surveys. Appendix A lists institutions responding to the surveys.
ECAR used qualitative surveys to gain insight into the quantitative results and to capture additional comments and ideas. We interviewed a total of 28 IT leaders in this process. We also benefited from the input of the 44 participants in an EDUCAUSE-sponsored summit on IT governance, held in September 2007 in Denver, Colorado.
Finally, this study is accompanied by case studies that take an in-depth look at IT gover-nance development and maturation at two insti-tutions: the University of California, Berkeley, and Queensland University of Technology.
Classification SchemesFor comparison, we grouped institutions
using categories derived from the 2000 edition of the Carnegie Classification of Institutions of Higher Education, developed by the Carnegie Foundation for the Advancement of Teaching. To obtain adequate numbers for statistical
and descriptive purposes, we collapsed the Carnegie 2000 classifications as follows:
Doctoral (DR) institutions group the doctoral-extensive and doctoral-inten-sive universities together.Master’s (MA) institutions group master’s colleges and universities I and II together.Baccalaureate (BA) institutions combine the three Carnegie 2000 baccalaureate groups together.Associate’s (AA) institutions are the same as the Carnegie 2000 associate’s category.
To characterize respondent demographics we also report an “Other Carnegie” category that includes specialized institutions and U.S. higher education offices. Owing to the diver-sity and small size of this category, it does not figure in our detailed data analysis by Carnegie class. We also tracked Canadian institutions in a separate, single category.
In November 2005, the Carnegie Foundation for the Advancement of Teaching introduced a new classification scheme employing addi-tional institutional characteristics. We have not provided a crosswalk to the new scheme, in large part because we suspect that our readers will be more familiar with the older 2000 taxonomy.
Analysis and Reporting Conventions
We observed the following conventions in analyzing the data and reporting the results:
Some tables and figures presented in this study have fewer than 438 respon-dents (CIO survey) or 216 respondents (executive survey). They were adjusted for missing information or to reflect some subset of responses.Sums of percentages in some charts and tables may not add up to 100.0% due to rounding.The data for each question in the online survey was analyzed for differences in
◆
◆
◆
◆
◆
◆
◆

26
IT Governance ECAR Research Study 5, 2008
patterns of response among Carnegie classes, Canadian and U.S. institutions, private and public institutions, U.S. region, and institutions of varying size. Institution size is determined by the number of full-time equivalent (FTE) enrollments. We also looked for asso-ciations between other combinations of variables as appropriate. Differences that were both meaningful and statisti-cally significant were noted in the text and/or the supporting figures and tables. Note that a statistically signifi-cant relationship between variables does not necessarily indicate a causal relationship.The Likert scales used in the online surveys are footnoted in the tables and figures showing results for these survey questions.
Overview of Respondents
As noted above, our study involved two quantitative surveys, one designed for IT administrators (CIO survey) and a much
◆
shorter one designed for other participants in IT governance (executive survey). Note that because both surveys relied on volunteers and because the participating institutions were drawn from members of EDUCAUSE (and in the case of the executive survey, from participating consortia and systems) rather than from random samples of all higher education institutions, our results are not generalizable to all U.S. and Canadian higher education institutions.
CIO SurveyWe distributed the IT governance CIO
survey to the ECAR representative or (where the institution was not an ECAR subscriber) the EDUCAUSE institutional representative at each EDUCAUSE member institution. In most cases, the invitee was the CIO. From 1,648 invited EDUCAUSE member institutions we received 438 responses (a 26.6% response rate). Of the 438 respondents, 416 (95.0%) were from the United States or its territories; the remaining 22 were from Canada.
Figure 2-1 shows how respondents’ insti-tutions were distributed among the Carnegie
106 129 77 62 42 22
245
449323 355
232
73
264
622 614
1,743
1,128
0
200
400
600
800
1,000
1,200
1,400
1,600
1,800
DR MA BA AA Other Carnegie Canada
Carnegie Class
Numb
er of
Insti
tution
s
Survey respondents
EDUCAUSE members
Carnegie institutions
0
Figure 2-1.
CIO Survey
Respondents,
by EDUCAUSE
Membership and
Carnegie Class

EDUCAUSE CENTER FOR APPLIED RESEARCH 27
IT Governance ECAR Research Study 5, 2008
categories described above, alongside the distribution of EDUCAUSE members and the overall population within each category at the time we launched our survey in June 2007. As with most ECAR surveys, the respondent base more closely mirrored EDUCAUSE membership by Carnegie class than it did the overall higher education population. We had the highest participation proportionately from doctoral institutions (24.2% of respon-dents). We also had more respondents from public institutions (62.5%) than from private ones (37.5%).
The median FTE enrollment of institutions responding to the CIO survey was 4,452. The higher mean FTE enrollment of 8,137 reflects the fact that, although smaller institutions predominated in number of respondents, larger institutions contributed disproportionately to the total of student enrollments represented across all respondents. As Figure 2-2 shows, institutions with enrollments of 4,000 or fewer FTE students made up 43.7% of respondents, those with more than 15,000 accounted for 17.9%, and those in between made up 38.4%.9
Figure 2-3 shows that the CIO survey was completed predominantly (83.1%) by respon-dents holding the title of CIO or its equivalent. Another 4.6% were in director-level IT posi-tions, and only 6.9% held non-IT titles. Eight out of 10 respondents (81.0%) agreed or strongly agreed that they were personally very involved in IT governance at their institutions, yielding a median 5.0 and a mean 4.11 level of agreement on our 5-point scale (where 1 = strongly disagree and 5 = strongly agree).
Executive SurveyWorking with a number of consortia and
higher education systems, ECAR assembled a group of CIO survey participants who agreed to invite up to five IT governance partici-pants working at their institutions in units outside the central IT organization to take part in a short survey about IT governance performance and effectiveness. We received a total of 216 responses to this survey from individuals representing 59 institutions, but most of our analysis of these data related to the 177 responses from the 45 institutions
1–2,00020.8%
2,001–4,00022.9%
4,001–8,00019.8%
8,001–15,00018.6%
15,001–25,00011.8%
More than 25,0006.1%
Figure 2-2.
CIO Survey
Respondents, by
FTE Enrollment
(N = 424)

28
IT Governance ECAR Research Study 5, 2008
that had both a CIO survey response and one or more executive survey responses. Details about this survey and its respondent demo-graphics appear in Chapter 7; see especially Figures 7-1, 7-2, and 7-3.
Study OrganizationThe remainder of this report presents
the results of our surveys and considers how higher education IT governance may change in the near future.
Chapters 3 through 6 present the findings of the CIO survey along with related insights from qualitative interviews. In Chapter 3, we look at how respondents characterize the maturity of IT governance at their institutions, the institutional context of strategic planning and alignment in which ITG operates, and the factors that respondents name as drivers and barriers for ITG. Chapter 4 examines in detail how input and decision making are allocated, who participates, and how participation is related to ITG maturity and other related institutional characteristics. We look at the
mechanisms and processes that contribute to ITG in Chapter 5, considering such topics as the prevalence and powers of IT steering committees, project review, and IT governance participation in the budget process. Chapter 6 analyzes factors strongly associated with IT governance performance and effectiveness and also looks at respondent views on what accounts for successful and unsuccessful IT governance outcomes.
In Chapter 7, we turn to the results of our executive survey, comparing perceptions of ITG performance and effectiveness from participants outside the central IT organiza-tion with those of their institutional CIO counterparts. We conclude, in Chapter 8, with the views of a group of IT leaders about what challenges IT governance will face in the next 5 to 10 years, and how ITG may evolve to meet them.
Endnotes1. Debra H. Allison, Peter B. DeBlois, and the EDUCAUSE
Current Issues Committee, “Current Issues Survey
Figure 2-3.
CIO Survey
Respondents’
Titles
Senior-most IT leader (e.g.,CIO or equivalent), 83.1%
Other, 0.9%
President/chancellor, 0.5%Vice president/provost/viceprovost or equivalent, 5.3%
Other IT management, 5.5%
Director of academiccomputing, 3.0%
Director of administrativecomputing, 1.6%
Other administrativemanagement, 0.2%
EDUCAUSE CENTER FOR APPLIED RESEARCH 29
IT Governance ECAR Research Study 5, 2008
Report, 2008,” EDUCAUSE Quarterly 31, no. 2 (2008), http: / /connect.educause.edu /Library /EDUCAUSE+Quarterly/CurrentIssuesSurveyReport/ 46570; John S. Camp, Peter B. DeBlois, and the EDUCAUSE Current Issues Committee, “Current Issues Survey Report, 2007,” EDUCAUSE Quarterly 30, no. 2 (2007), http://connect.educause.edu/Library/EDUCAUSE+Quarterly/CurrentIssuesSurveyReport/40026; Barbara I. Dewey, Peter B. DeBlois, and the EDUCAUSE Current Issues Committee, “Current IT Issues Survey Report, 2006,” EDUCAUSE Quarterly 29, no. 2 (2006), http://connect.educause .edu/Library/EDUCAUSE+Quarterly/CurrentITIssues SurveyRepo/39971; Leslie Maltz, Peter B. DeBlois, and the EDUCAUSE Current Issues Committee, “Trends in Current Issues, Y2K–2005,” EDUCAUSE Quarterly 28, no. 2 (2005), http://connect.educause .edu/Library/EDUCAUSE+Quarterly/TrendsinCurrent Issues2000/39912; and Donald Z. Spicer, Peter B. DeBlois, and the EDUCAUSE Current Issues Committee, “Fifth Annual EDUCAUSE Survey Identifies Current IT Issues,” EDUCAUSE Quarterly 27, no. 2 (2004), http://connect.educause.edu/ Library/EDUCAUSE+Quarterly/FifthAnnualEDUCAUSE Survey/39863.
2. Peter Weill and Jeanne Ross, IT Governance: How Top Performers Manage IT Decision Rights for Superior Results (Boston: Harvard Business School Press, 2004), 2.
3. Weill and Ross, IT Governance, 242; Wim Van Grembergen, Introduction to the Minitrack “IT Governance and Its Mechanisms,” Proceedings of the 35th Annual Hawai i I nte rnat iona l Conference on System Sciences (Los Alamitos, CA: IEEE Computer Society, 2002) , ht tp: / / ieeexplore.ieee.org/iel5/7798/21442/00994349.pdf?arnumber=994349; IT Governance Institute, Board Briefing on IT Governance, 2nd ed. (Rolling Meadows, IL: IT Governance Institute, 2003), http: / /www.isaca.org /ContentManagement /ContentDisplay.cfm?ContentID =39649. Van Grembergen puts more emphasis on achieving “the fusion of business and IT,” and the IT Governance Institute more explicitly calls for advancing enterprise strategies and objectives. For a summary of these and other definitions, see Ryan R. Peterson, “Integration
Strategies and Tactics for Information Technology Governance,” in Strategies for Information Technology Governance, ed. Wim Van Grembergen (Hershey, PA: Idea Group Publishing, 2004), 37–80.
4. For a discussion of IT governance in higher education along these lines, see Jack McCredie, “Improving IT Governance in Higher Education” (Research Bulletin, Issue 18) (Boulder, CO: EDUCAUSE Center for Applied Research, 2006), available from http://www .educause.edu/ecar.
5. American Association of University Professors, “Statement on Government of Colleges and Universities,” http://www.aaup.org/AAUP/pubsres/policydocs/contents/governancestatement.htm.
6. Association of Governing Boards of Universities and Colleges (AGB), “AGB Statement on Institutional Governance” (Washington, DC: Association of Governing Boards of Universities and Colleges, 1999), 5, http://www.agb.org/user-assets/Documents/about/statements/governance.pdf.
7. Dennis John Gayle, Bhoendradatt Tewarie, and A. Quinton White Jr., “Governance in the Twenty-First Century University: Approaches to Effective Leadership and Strategic Management,” ASHE-ERIC Higher Education Report 30, no. 1, (November 2003), http://www.wiley.com/WileyCDA/WileyTitle/productCd-078797174X.html.
8. See, for example, Weill and Ross, IT Governance; IT Governance Institute, COBIT 4.1: Framework, Control Objectives, Management Guidelines, Maturity Models (Rolling Meadows, IL: IT Governance Institute, 2007), 165–168; Steven De Haes and Wim Van Grembergen, “IT Governance and Its Mechanisms,” Information Systems Control Journal 1 (2004); Peterson, “Integration Strategies and Tactics for Information Technology Governance”; Tomi Dahlberg and Hannu Kivijärvi, “An Integrated Framework for IT Governance and the Development and Validation of an Assessment Instrument,” Proceedings of the 39th Hawaii International Conference on System Sciences 2006 (Los Alamitos, CA: IEEE Computer Society, 2006), http://csdl2.computer.org/comp/proceedings/hicss/2006/2507/08/250780194b.pdf.
9. Figure 2-2 excludes 14 institutions for which FTE enrollment was unavailable.


EDUCAUSE CENTER FOR APPLIED RESEARCH 31
IT Governance ECAR Research Study 5, 2008
©2008 EDUCAUSE. Reproduction by permission only.
Our study uses the definition of IT governance (ITG) developed by MIT researchers Peter Weill and Jeanne Ross, who describe it as “specifying the decision rights and accountability frame-work to encourage desirable behavior in using IT.”1 As this definition implies, ITG involves decision-making processes and structures,
which we’ll examine in detail in later chapters. But examining the state of IT governance also means looking at its context—whether, for example, the institution even recognizes the need for ITG, who is responsible for it and who knows about it, and what drives it and what holds it back. In this chapter, we examine the
3IT Governance Maturity
and Context
A little kingdom I possess,Where thoughts and feelings dwell;
And very hard the task I findOf governing it well.
—Louisa May Alcott
Key FindingsInstitutions tended to report low (but not nonexistent) levels of IT governance maturity. A majority described ITG maturity as initial or repeatable, the second and third-least mature levels on a six-level scale of increasing maturity.Where respondents reported higher levels of ITG maturity, they also tended to agree more strongly that their institutions were able to develop and implement IT policies applying throughout the institution.A majority of respondents (55%) reported the use of at least one framework such as COBIT, ITIL, and ISO standards in their ITG processes and structures, though no single framework claimed a majority.An overwhelming majority of respondents (81%) said that the CIO was perceived to be responsible for IT governance at their institutions.The top drivers for pursuing formal IT governance were aligning IT goals with institutional goals and promoting an institution-wide view of IT; the top barriers were a decentral-ized/informal institutional culture and lack of participation from necessary parties.Institutions reporting higher levels of IT maturity also tended to agree more that ITG has been actively designed, that relevant participants could accurately describe ITG, and that IT was aligned with institutional goals. They were also less likely to name decentraliza-tion or lack of leadership support as barriers to pursuing ITG at their institutions.
◆
◆
◆
◆
◆
◆

32
IT Governance ECAR Research Study 5, 2008
institutional context in which our respondents’ IT governance practices are situated.
MaturityOne way or another, decisions about how
an institution uses IT will get made. But to what extent does that really mean IT is being governed? Like other activities that orches-trate complex processes, IT governance can be described in terms of its maturity, ranging from the absence of established manage-ment processes to the consistent and rigorous application of best practices. We provided our respondents with a simplified maturity scale modeled on the more detailed COBIT ME4 IT governance control objective, and asked them to choose the level that best described IT governance at their institution.2 The maturity levels were
Nonexistent: IT governance processes are not applied, and the institution has not recognized the need for them.Initial: IT governance processes are informal and uncoordinated.Repeatable: IT governance processes follow a regular pattern.
◆
◆
◆
Defined: IT governance processes are documented and communicated.Managed: IT governance processes are monitored and measured.Optimized: IT governance best prac-tices are followed, and there are provi-sions for amending processes.
As Figure 3-1 shows, our respondents tended to favor the low and middle catego-ries. Though very few (1.6%) described IT governance as nonexistent, nearly 6 in 10 chose the next two least mature categories, initial and repeatable. Most of the other respondents said ITG was defined at their institution, leaving only 16.2% in the two highest maturity categories. If the maturity levels are treated as a scale from 1 (low) to 6 (high), the median maturity level was repeat-able (3), and the mean (3.30) was slightly less than midway between repeatable and defined (4). This leaves our respondents’ self-reported maturity roughly in line with the levels discov-ered in a more detailed 2002 study conducted among purchasers of the COBIT framework. Using a similar maturity model applied to 15 different COBIT processes, the authors found
◆
◆
◆
1.6
28.829.7
23.7
10.5
5.7
0%
5%
10%
15%
20%
25%
30%
35%
Nonexistent Initial Repeatable Defined Managed Optimized
Maturity Level
Perce
ntage
of In
stitut
ions
Figure 3-1.
Maturity of IT
Governance at
Institution
(N = 438)

EDUCAUSE CENTER FOR APPLIED RESEARCH 33
IT Governance ECAR Research Study 5, 2008
weighted maturity averages hovering between repeatable, and the midpoint between repeat-able and defined.3
Bundling together the maturity levels into three groups for reporting convenience (nonexistent/initial, repeatable/defined, and managed/optimized), we found that insti-tutions with FTE enrollments of 4,000 or fewer were more likely to report low matu-rity, midsized institutions with between 4,001 and 15,000 students were slightly more likely to report the highest maturity levels, and institutions with enrollments greater than 15,000 more often reported the middle levels (see Figure 3-2). ITG maturity was not significantly associated with Carnegie class. However, institutions where the CIO was a member of the presi-dent/chancellor’s cabinet were about twice as likely to report a managed or optimized maturity level as those where the CIO was not (20.5% versus 11.1%).
The relationship between institution size and maturity could be due to a number of different factors. It may be that smaller institu-
tions simply don’t feel the need to develop ITG to a higher level of maturity because flatter organizational structures and the relatively greater influence of individual personalities allow ITG to function effectively without much formalization. At Black Hills State University, CIO Warren Wilson describes his institution’s IT governance as “mature in some respects,” though the institution has only recently felt the need to create an IT advisory committee for campus-wide IT policies. “We’re a small campus, and it’s very open,” Wilson says. “People are used to knowing the various indi-viduals and are willing to talk to them about issues. If I have a finance issue, I can just call up the VP of finance or walk to her office.”
At any rate, we don’t want to over-stress differences based on institution size, because the overall story is largely one of respondents perceiving low to moderate ITG maturity. At the same time, we found associations between reported levels of maturity and agree-ment that institutions could conduct institution-wide activities related to IT.
36.8
52.4
10.8
25.822.7
59.2
15.8
51.5
25.0
0%
10%
20%
30%
40%
50%
60%
70%
Nonexistent/initial (N = 129) Repeatable/defined (N = 226) Managed/optimized (N = 69)
Maturity Level
Perce
ntage
of In
stitut
ions
1–4,000
4,001–15,000
More than 15,000
Figure 3-2. ITG
Maturity, by FTE
Enrollment

34
IT Governance ECAR Research Study 5, 2008
Respondents on the whole generally agreed (on a scale from 1 = strongly disagree to 5 = strongly agree) that their institutions were able to develop important IT policies, imple-ment important IT decisions, and coordinate the activities of IT personnel throughout the institution. But as Table 3-1 shows, agreement on these points rose with more advanced maturity levels, from mean agree-ment hovering around the midpoint between neutral (= 3) and agree (= 4) among those with nonexistent or initial maturity, to means well over agree among those reporting managed/optimized maturity.
We’re not able to say whether ITG matu-rity feeds more effective institution-wide activities, or vice versa, or whether some other factors drive them both. Nor do even the least mature institutions report deep dissatisfaction on average in these areas. But higher perceived maturity does seem to travel with stronger agreement about the ability to conduct activities at the institutional scale.
IT Governance Design and Frameworks
Have college and university IT governance structures been built according to a coherent design, or have they sprung up through an uncoordinated mix of accident and impro-visation? The question is important. In their landmark study of IT governance, Weill and Ross put the advice to “actively design” IT governance at the head of their top-10 leader-ship principles of ITG.4
Somewhat surprisingly in light of the repu-tation for process accretion and bureaucratic chaos often associated with higher education, our respondents generally agreed that ITG was actively designed at their institutions (see Figure 3-3). Slightly more than half (53.8%) agreed or strongly agreed, while 24.5% disagreed or strongly disagreed. On our 5-point agreement scale, the mean response was 3.43. If not an overwhelmingly positive characterization, this does suggest that few respondents see ITG as an out-of-control weed patch.
Table 3-1. Ability to Conduct Institution-Wide Activities, by ITG Maturity
Maturity Level
Activity
We are able to develop important IT policies
that apply throughout the institution.
We are able to implement important
IT decisions that apply throughout the
institution.
We are able to coordinate the activities
of IT personnel effectively throughout
the institution.
Nonexistent/Initial
Mean* 3.57 3.60 3.35
N 132 131 133
Std. Deviation 1.057 0.958 1.128
Repeatable/Defined
Mean* 4.15 4.14 3.77
N 234 233 231
Std. Deviation 0.771 0.794 0.961
Managed/Optimized
Mean* 4.52 4.54 4.17
N 71 71 70
Std. Deviation 0.673 0.581 0.851
Total
Mean* 4.04 4.04 3.71
N 437 435 434
Std. Deviation 0.915 0.877 1.035
*Scale: 1 = strongly disagree, 2 = disagree, 3 = neutral, 4 = agree, 5 = strongly agree

EDUCAUSE CENTER FOR APPLIED RESEARCH 35
IT Governance ECAR Research Study 5, 2008
On the other hand, weeding and pruning is often what design of IT governance involves. A number of our interviewees referred to the need to gain control over institutional processes that had become overgrown and unwieldy. Brad Reese, vice president for technology and CIO at Roosevelt University, describes the streamlining he undertook as the university’s first CIO. “I simplified the gover-nance structure,” he says. “There used to be six committees with overlapping responsibili-ties. There were no guiding principles. Now it’s much clearer. We have three advisory commit-tees; the CIO is staff person to the [top-level] IT advisory council, and the president’s execu-tive council is the final decision-making body on policy and high-level strategy.”
Of course, ITG design may mean starting from scratch as well. At the University of Delaware, Susan Foster, vice president for information technologies, recalls that when she first arrived 19 years ago, “there was no IT governance at all.” Today, after bringing Delaware’s IT governance to what she describes as an advanced state of maturity, Foster advises both active attention to ITG
design and a careful regard for the institu-tional culture. “Growth was organic, and we had to learn how to govern,” she says. “A lot of that was rooted in trying to make a peaceful and meaningful transition into governance. You have to be aware of it and watching it all the time, making course corrections. My advice is to look at IT in your institution right now, determine what governance structures and practices are in place, and start to apply some mechanism for flexibility and responsive-ness to the environment.”
Given the relationship between design and optimizing governance, it’s not surprising that we found a strong association between agreement about active design and perceived ITG maturity (see Table 3-2). Respondents characterizing ITG as more mature also tended on average to agree more strongly that ITG had been actively designed. It appears that respondents see maturity at least partly as something that can be actively pursued, rather than purely an outcome of experience or static institutional factors.
Finally, private institutions tended to report somewhat lower agreement about
4.4
20.121.5
35.8
18.0
0%
5%
10%
15%
20%
25%
30%
35%
40%
Strongly disagree Disagree Neutral Agree Strongly agree
Level of Agreement
Perce
ntage
of In
stitut
ions
Figure 3-3. IT
Governance at
Institution Has
Been Actively
Designed
(N = 427)

36
IT Governance ECAR Research Study 5, 2008
active ITG design (mean 3.18, SD = 1.154) than public institutions (mean 3.57, SD = 1.099). This difference seems to be stron-gest among institutions with enrollments of 15,000 or fewer and may be due to the extra bureaucratizing pressures at public institu-tions that we mentioned in the preceding section on maturity.
Since design implies some kind of struc-ture, we also wanted to know to what extent our respondents incorporated formal frameworks into the way they approach IT governance. The ITG advisory literature often recommends adopting formal best practice frameworks, both those that apply directly to ITG and those that are relevant to other aspects of IT. The IT Governance Institute’s COBIT control objectives and the U.K. Office of Government Commerce’s Information Technology Infrastructure Library (ITIL) are the most comprehensive such frameworks, but there are many other standards and tools with potential implications for IT governance.5 We asked our respondents to describe their use of several well-known frameworks—COBIT, ITIL, the ISO 17799
information security management standard, and the ISO 9000 quality management standard—in their IT governance processes and structures.
Some use of frameworks was common. More than half of our respondents (55.2%) reported using at least selected elements of one of the listed frameworks (or “other”). But as Figure 3-4 shows, no single listed frame-work claimed a majority of respondents, and respondents overwhelmingly reported using selected elements rather than most or all of the elements of each item. ITIL and ISO 17799 were the most common frameworks in use, each reported by slightly more than a third of respondents, while COBIT, which most directly addresses ITG processes, was used selectively by 16.8% of respondents but extensively or entirely by only a handful.
Framework use, like ITG active design, was another factor we found associated with perceived ITG maturity. As Figure 3-5 shows, reported use of at least one framework (including “other”) in IT governance processes and structures was higher among respondents who reported relatively higher ITG maturity
Table 3-2. ITG Active Design, by ITG Maturity
Maturity LevelIT governance at my institution
has been actively designed.
Nonexistent/Initial
Mean* 2.51
N 128
Std. Deviation 0.980
Repeatable/Defined
Mean* 3.62
N 229
Std. Deviation 0.936
Managed/Optimized
Mean* 4.49
N 70
Std. Deviation 0.631
Total
Mean* 3.43
N 427
Std. Deviation 1.131
*Scale: 1 = strongly disagree, 2 = disagree, 3 = neutral, 4 = agree, 5 = strongly agree

EDUCAUSE CENTER FOR APPLIED RESEARCH 37
IT Governance ECAR Research Study 5, 2008
levels, ranging from 45.5% among nonex-istent/initial respondents to 69.6% among managed/optimized respondents.
The rate of framework use in ITG processes and structures rose with institutional enroll-
ment size and was higher among public than private institutions. Finally, framework use was considerably higher among our 22 Canadian respondent institutions (81.8%) than among our 413 U.S. institutions (53.8%).
16.8
31.8 30.3
18.9
2.3 4.0
1.4 0.2
0%
5%
10%
15%
20%
25%
30%
35%
40%
COBIT (N = 429) ITIL (N = 428) ISO 17799 (N = 429) ISO 9000 (N = 428)
Framework
Perce
ntage
of In
stitut
ions
Use most or all elements
Use selected elements
Figure 3-4. Use
of Frameworks in
ITG Processes and
Structures
45.5
56.4
69.6
0%
10%
20%
30%
40%
50%
60%
70%
80%
Nonexistent/initial (N = 132) Repeatable/defined (N = 234) Managed/optimized (N = 69)
Maturity Level
Institu
tions
Usin
g at L
east
One F
rame
work
Figure 3-5. ITG
Maturity and
Framework Use
in ITG Processes/
Structures
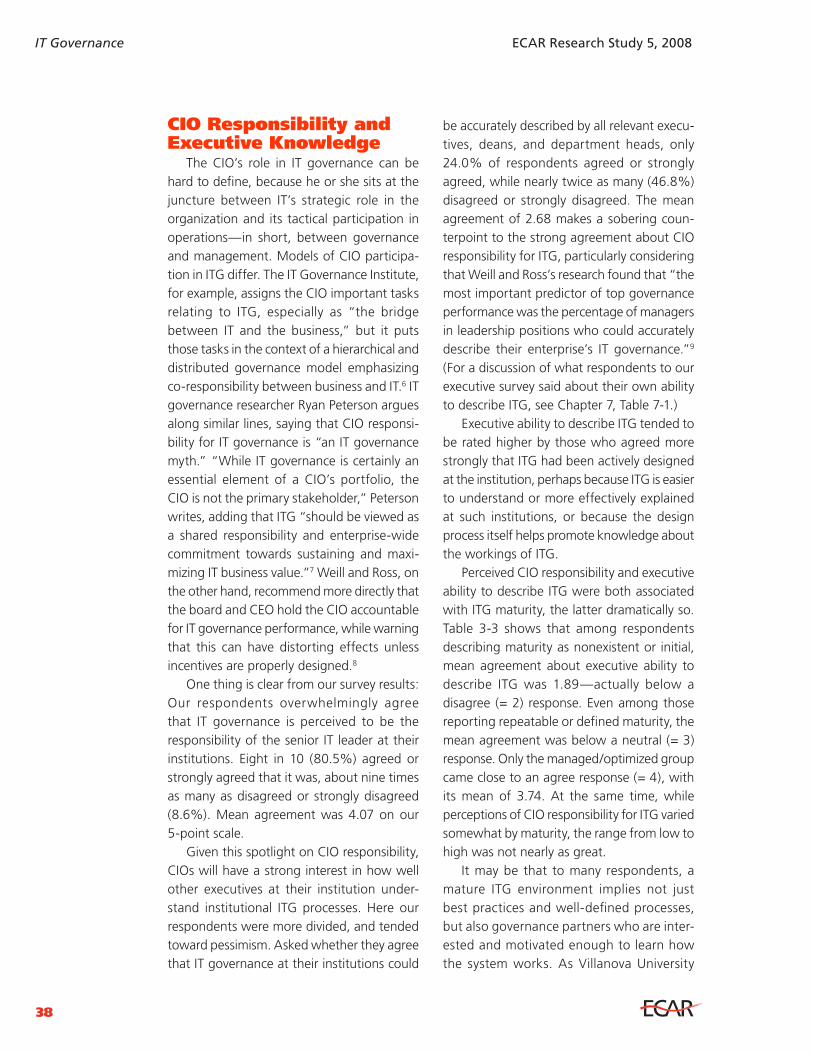
38
IT Governance ECAR Research Study 5, 2008
CIO Responsibility and Executive Knowledge
The CIO’s role in IT governance can be hard to define, because he or she sits at the juncture between IT’s strategic role in the organization and its tactical participation in operations—in short, between governance and management. Models of CIO participa-tion in ITG differ. The IT Governance Institute, for example, assigns the CIO important tasks relating to ITG, especially as “the bridge between IT and the business,” but it puts those tasks in the context of a hierarchical and distributed governance model emphasizing co-responsibility between business and IT.6 IT governance researcher Ryan Peterson argues along similar lines, saying that CIO responsi-bility for IT governance is “an IT governance myth.” “While IT governance is certainly an essential element of a CIO’s portfolio, the CIO is not the primary stakeholder,” Peterson writes, adding that ITG “should be viewed as a shared responsibility and enterprise-wide commitment towards sustaining and maxi-mizing IT business value.”7 Weill and Ross, on the other hand, recommend more directly that the board and CEO hold the CIO accountable for IT governance performance, while warning that this can have distorting effects unless incentives are properly designed.8
One thing is clear from our survey results: Our respondents overwhelmingly agree that IT governance is perceived to be the responsibility of the senior IT leader at their institutions. Eight in 10 (80.5%) agreed or strongly agreed that it was, about nine times as many as disagreed or strongly disagreed (8.6%). Mean agreement was 4.07 on our 5-point scale.
Given this spotlight on CIO responsibility, CIOs will have a strong interest in how well other executives at their institution under-stand institutional ITG processes. Here our respondents were more divided, and tended toward pessimism. Asked whether they agree that IT governance at their institutions could
be accurately described by all relevant execu-tives, deans, and department heads, only 24.0% of respondents agreed or strongly agreed, while nearly twice as many (46.8%) disagreed or strongly disagreed. The mean agreement of 2.68 makes a sobering coun-terpoint to the strong agreement about CIO responsibility for ITG, particularly considering that Weill and Ross’s research found that “the most important predictor of top governance performance was the percentage of managers in leadership positions who could accurately describe their enterprise’s IT governance.”9 (For a discussion of what respondents to our executive survey said about their own ability to describe ITG, see Chapter 7, Table 7-1.)
Executive ability to describe ITG tended to be rated higher by those who agreed more strongly that ITG had been actively designed at the institution, perhaps because ITG is easier to understand or more effectively explained at such institutions, or because the design process itself helps promote knowledge about the workings of ITG.
Perceived CIO responsibility and executive ability to describe ITG were both associated with ITG maturity, the latter dramatically so. Table 3-3 shows that among respondents describing maturity as nonexistent or initial, mean agreement about executive ability to describe ITG was 1.89—actually below a disagree (= 2) response. Even among those reporting repeatable or defined maturity, the mean agreement was below a neutral (= 3) response. Only the managed/optimized group came close to an agree response (= 4), with its mean of 3.74. At the same time, while perceptions of CIO responsibility for ITG varied somewhat by maturity, the range from low to high was not nearly as great.
It may be that to many respondents, a mature ITG environment implies not just best practices and well-defined processes, but also governance partners who are inter-ested and motivated enough to learn how the system works. As Villanova University

EDUCAUSE CENTER FOR APPLIED RESEARCH 39
IT Governance ECAR Research Study 5, 2008
CIO Stephen Fugale puts it, “Any organi-zational or committee design can be made to work if the participants are the right ones. If you don’t represent a constituent area, that’s problematic, but it’s equally problematic if a represented area doesn’t understand the committee’s charter and contribute appropriately.”
IT AlignmentThe common theme in all models of IT
governance is the alignment of IT with orga-nizational goals. “The key question,” the IT Governance Institute maintains, “is whether an enterprise’s investment in IT is in harmony with its strategic objectives...and [whether that investment is] building the capabilities necessary to deliver business value.”10
Aligning IT with institutional strategy, of course, presupposes that there is some-thing to align with. Taken as a whole, our respondents seemed to think that there is. When asked whether they agreed that at their institutions strategic priorities are clearly articulated, 68.2% agreed or strongly agreed,
and most of the rest (18.2%) gave a neutral response rather than disagreeing. Almost three-quarters (73.0%) said their institution had a documented plan outlining strategic priorities for the institution as a whole, and 16.2% more said one was under develop-ment. Though institutional IT strategic plans were less common, they were still reported by a majority of respondents (56.8%, plus 23.3% under development).
Many of our interviewees spoke of stra-tegic institutional goals and alignment with them as the animating, and in some cases defining, forces behind IT governance. One example was the University of Windsor, where the current IT governance structure is essentially an outgrowth of institutional strategic planning. “We’re working off of our second five-year IT strategic plan,” says Roger Lauzon, executive director of IT services at Windsor. “It articulates an alignment with the university strategic plan, and we formed our IT steering committee to implement it.” Similarly, at Saint Francis College in Brooklyn Heights, New York, CIO Guy Carlsen came to
Table 3-3. CIO Responsibility and Executive Ability to Describe ITG, by ITG Maturity
Maturity Level
ITG is perceived to be the responsibility of the senior IT leader.
ITG can be accurately described by all relevant executives, deans, and
department heads.
Nonexistent/Initial
Mean* 3.90 1.89
N 131 128
Std. Deviation 1.007 0.786
Repeatable/Defined
Mean* 4.09 2.81
N 230 229
Std. Deviation 0.867 0.902
Managed/Optimized
Mean* 4.31 3.74
N 70 68
Std. Deviation 0.843 0.785
Total
Mean* 4.07 2.68
N 431 425
Std. Deviation 0.916 1.047
*Scale: 1 = strongly disagree, 2 = disagree, 3 = neutral, 4 = agree, 5 = strongly agree

40
IT Governance ECAR Research Study 5, 2008
his position with a mandate to develop an IT strategic plan in accordance with the college’s institutional plan. He also helped write the charter for a new IT steering committee. “Overall the committee mission is to maximize alignment between IT and institutional priori-ties,” Carlsen says.
On the whole, respondents were positive about IT alignment. Large majorities agreed or strongly agreed that IT was aligned with business and academic goals, and they responded similarly to the statement that local IT goals are aligned with institutional IT goals (see Figure 3-6). Nearly 8 in 10 respondents (79.4%) agreed or strongly agreed that busi-ness goals and IT were aligned.
As Table 3-4 shows, however, there were variations within this general tendency to be positive about IT alignment. For all three areas of alignment, mean agreement was significantly higher among institutions reporting the highest levels of ITG maturity than among those reporting the lowest levels, and those with medium maturity were in between. (A similar relationship between
maturity and alignment was reported in a 2006 PricewaterhouseCoopers study of IT governance at large organizations world-wide.11) This pattern held up for business alignment regardless of whether the institu-tion had a documented plan outlining stra-tegic priorities for the institution as a whole or lacked one. It may be that IT government processes contribute to IT/business alignment even in the absence of formally documented strategic priorities, perhaps because goals are clear enough or few enough to require no formal prioritization, or perhaps because ITG itself sets priorities.
Drivers and BarriersThe positive responses we received about
IT alignment with institutional goals and the ability to get things done institution-wide seemed to be echoed in the importance assigned these matters as drivers for pursuing IT governance. When we asked respondents to select the 3 most important ITG drivers at their institutions from a list of 10 drivers, aligning IT goals with institutional goals and promoting
0.9
7.1
12.6
49.7
29.7
1.6
8.3
15.9
51.0
23.2
1.2
10.8
18.9
46.0
23.1
0%
10%
20%
30%
40%
50%
60%
Strongly disagree Disagree Neutral Agree Strongly agree
Level of Agreement
Perce
ntage
of In
stitut
ions
Business goals and IT are aligned. (N = 437)
Academic goals and IT are aligned. (N = 435)
Local IT goals are aligned with institutional IT goals. (N = 424)
Figure 3-6. IT
Alignment

EDUCAUSE CENTER FOR APPLIED RESEARCH 41
IT Governance ECAR Research Study 5, 2008
an institution-wide view of IT were the most frequently selected (see Figure 3-7).
If the strategically oriented drivers at the top of the list reflected a textbook view of ITG, the drivers immediately following in popularity suggested attention to practical politics. Encouraging/collecting community input and transparency in decision making were selected by 38.1% and 33.3% of respondents, respec-tively. Both hint at the perceived importance of gaining the trust of diverse constituencies. Cost reduction and increased efficiencies stood in the middle of the list, reported by only about one in four respondents. There was little sense of impetus related to regula-tory/audit compliance (14.4%), and despite the prominence that performance metrics and accountability frameworks play in the ITG literature, only 7.5% of respondents reported that applying them was a top-three driver.
We did not find many significant differ-ences among respondents in the drivers they chose, nor any based on ITG maturity or Carnegie class. One intriguing difference depended on whether the senior-most IT
leader was a member of the president’s or chancellor’s cabinet. Where he or she was, 27.2% of respondents chose transparency in decision making as a top driver; elsewhere, 39.7% did. It may be that CIOs lacking cabinet status are more interested in developing formal IT governance as a counterweight to the clubbier and less open decision making of the executive suite.
While political and cultural factors were not as strong as strategic concerns among ITG drivers, they were more prominent in the rankings of barriers to pursuing formal IT governance (see Figure 3-8). At the same time, the top barriers did not dominate the results as dramatically as did the top driver items. There was a virtual tie between the top-two barriers: decentralized/informal institutional culture and lack of participation by necessary parties. These were each chosen by about 4 in 10 respondents. Near the other end of the list, and in logical contrast to the items at the top, only 14.6% selected a top-down, leadership-driven institutional culture as a barrier. It appears that, as far
Table 3-4. IT Alignment, by ITG Maturity
Maturity Level
Business goals and IT are aligned.
Academic goals and IT are aligned.
Local IT goals are aligned with
institutional IT goals.
Nonexistent/Initial
Mean* 3.51 3.48 3.34
N 132 130 128
Std. Deviation 0.961 1.051 1.015
Repeatable/Defined
Mean* 4.16 3.95 3.93
N 234 234 227
Std. Deviation 0.767 0.820 0.877
Managed/Optimized
Mean* 4.41 4.25 4.14
N 71 71 69
Std. Deviation 0.729 0.731 0.809
Total
Mean* 4.00 3.86 3.79
N 437 435 424
Std. Deviation 0.890 0.921 0.958
*Scale: 1 = strongly disagree, 2 = disagree, 3 = neutral, 4 = agree, 5 = strongly agree

42
IT Governance ECAR Research Study 5, 2008
as our respondents are concerned, diffusion of authority and inattention are far more often obstacles to pursuing formal ITG than management by fiat. Finally, in a rare result for an ECAR survey, lack of adequate funding was well down the list of barriers, cited by just under 3 in 10 respondents.
In contrast to our findings about drivers, certain barriers were viewed differently by institutions at different levels of reported ITG maturity. As Figure 3-9 shows, the most frequently named barrier overall, decen-tralized/informal institutional culture, was
reported almost twice as often by institu-tions at the lower rungs of ITG maturity (46.6% for nonexistent/initial and 44.0% for repeatable/defined) than by those at the managed/optimized level (23.9%). Among the managed/optimized institutions, in fact, lack of adequate funding was the most frequently reported barrier, followed by lack of participation by necessary parties. One possible explanation is that ITG funding is a second-order problem that becomes more pressing, or at least more evident, among institutions that have solved the governance
5.5
7.5
14.4
20.8
21.7
25.1
33.3
38.1
50.7
73.5
0% 10% 20% 30% 40% 50% 60% 70% 80%
Resolving disputes
Applying performancemetrics/accountability frameworks to IT
Regulatory/audit compliance
Empowering users/process owners
Coordinating decision processes withseparate origins/purposes
Cost reduction/increased efficiencies
Transparency in decision making
Encouraging/collecting community input
Promoting an institution-wide view of IT
Aligning IT goals with institutional goals
Percentage of Institutions
Figure 3-7. Drivers
for Pursuing
Formal IT
Governance
(N = 438)
7.1
14.6
20.8
20.8
21.9
28.3
30.8
40.4
41.6
0% 5% 10% 15% 20% 25% 30% 35% 40% 45%
IT needs not complex enough tojustify
Top-down/leadership-driveninstitutional culture
Lack of guidance from institutionalstrategic objectives
Lack of institutional leadershipsupport
Difficulty developing campus policiesand procedures
Lack of adequate funding
Governance structures/processesinsufficiently coordinated
Lack of participation from necessaryparties
Decentralized/informal institutionalculture
Percentage of Institutions
Figure 3-8. Barriers
to Pursuing Formal
IT Governance
(N = 438)

EDUCAUSE CENTER FOR APPLIED RESEARCH 43
IT Governance ECAR Research Study 5, 2008
challenges of a decentralized higher education culture. Figure 3-9 also shows that levels of ITG maturity were associated with stark differ-ences in how often respondents reported barriers relating to lack of institutional lead-ership support and insufficiently coordinated governance structures/processes.
Summary and Implications
Our respondents did not, on the whole, perceive IT governance at their institutions as highly mature. Most placed themselves in the lower half of the maturity range we provided, though very few chose the lowest level of all, nonexistent. This tendency toward some sort of IT governance, but not a highly refined sort, provides important context for the rest of this study. It suggests that almost every institution recognizes the need for ITG and that most acknowledge that ITG could be taken to a higher level. Most importantly for purposes of context, our results provide clear evidence that ITG maturity makes a difference.
Respondents who reported higher levels of ITG at their institutions were also more likely to report stronger agreement about the ability to get things done institution-wide, about the degree to which ITG has been actively designed and can be accurately described by relevant participants, and about IT alignment with institutional goals. Those reporting the highest (managed or optimized) levels of maturity were much less likely to see barriers in decentralization, uncoordinated processes, and lack of leadership support. In contrast, they did not choose different top factors driving their institutions to pursue ITG. Although we did find some differences here and there related to FTE enrollment size and Carnegie class, for the most part ITG maturity was a stronger and more consistent differentiator than these attributes.
As we noted in discussing individual find-ings, none of this demonstrates causality or the direction in which associated factors are influenced—whether, for example, ITG maturity promotes participant knowledge
46.6
34.6
41.444.0
16.7
30.8
23.9
8.511.3
0%
10%
20%
30%
40%
50%
60%
Decentralized/informal institutional culture Lack of institutional leadership support Governance structures/processes insufficientlycoordinated
Barrier
Perce
ntage
of In
stitut
ions
Nonexistent/initial (N = 133)
Repeatable/defined (N = 234)
Managed/optimized (N = 71)
Figure 3-9.
Selected Barriers
to Pursuing
Formal ITG, by ITG
Maturity

44
IT Governance ECAR Research Study 5, 2008
of governance processes, or vice versa. But it does suggest that institutions reporting relatively high levels of ITG maturity are on to something. In succeeding chapters, we’ll look in more detail at the way our respon-dents organize decision making within IT governance processes and structures, and at the practices associated with higher levels of ITG performance.
Endnotes1. Peter Weill and Jeanne Ross, IT Governance: How Top
Performers Manage IT Decision Rights for Superior Results (Boston: Harvard Business School Press, 2004), 2.
2. Our survey question was based on the maturity-level short descriptions in Erik Guldentops, Wim Van Grembergen, and Steven de Haes, “Control and Governance Maturity Survey: Establishing a Reference Benchmark and a Self-Assessment Tool,” Information Systems Control Journal 6 (2002), http://www.isaca.org/Template.cfm?Section=Home&CONTENTID=16122&TEMPLATE=/ContentManagement/ContentDisplay.cfm. These in turn are based on the COBIT IT governance maturity mode in IT Governance Institute, COBIT 4.1: Framework, Control Objectives, Management Guidelines, Maturity Models (Rolling Meadows, IL: IT Governance Institute, 2007), 165–168. For a discussion of this maturity model in a broader context, see Steven De Haes and Wim Van Grembergen, “IT Governance and Its Mechanisms,” Information Systems Control Journal 1 (2004), http://www.isaca.org/Template.cfm?Section=Home&CONTENTID=16700&TEMPLATE=/ContentManagement/ContentDisplay.cfm; and IT Governance Institute,
Board Briefing on IT Governance, 2nd ed. (Rolling Meadows, IL: IT Governance Institute, 2003), 36, http://www.isaca.org/ContentManagement/ContentDisplay.cfm?ContentID=39649. Note that the formal COBIT maturity model provides a detailed description of each maturity level and specifies that an organization must meet all requirements of one level before it can begin to ascend to the next. Our respondents’ self-assessments should not be under-stood as equivalent to the maturity assessment an institution might arrive at following this formal and rigorous approach.
3. Guldentops, Van Grembergen, and de Haes, “Control and Governance Maturity Survey.”
4. Weill and Ross, IT Governance, 222–223.5. For a discussion of the full spectrum of available tools,
see Michael Holm Larsen, Mogens Kühn Pedersen, and Kim Viborg Andersen, “IT Governance: Reviewing 17 IT Governance Tools and Analysing the Case of Novozymes A/S,” Proceedings of the 39th Hawaii International Conference on System Sciences (Los Alamitos, CA: IEEE Computer Society, 2006), http://ieeexplore.ieee.org/iel5/10548/33368/01579689.pdf?arnumber=1579689.
6. IT Governance Institute, Board Briefing, 18; see also 50–52.
7. Ryan R. Peterson, “Integration Strategies and Tactics for Information Technology Governance,” in Strategies for Information Technology Governance, ed. Wim Van Grembergen (Hershey, PA: Idea Group Publishing, 2004), 37–80, quote p. 42.
8. Weill and Ross, IT Governance, 228, 231–234.9. Ibid., 124, 218.10. IT Governance Institute, Board Briefing, 22.11. PricewaterhouseCoopers, IT Governance in Practice:
Insight from Leading CIOs (2006), http://www .pwc.com/extweb/pwcpublications.nsf /docid /790d48a25a3505008525726d00567783.

EDUCAUSE CENTER FOR APPLIED RESEARCH 45
IT Governance ECAR Research Study 5, 2008
©2008 EDUCAUSE. Reproduction by permission only.
Whether it’s formally documented or simply a part of the culture, every higher education institution will have a sort of IT governance constitution. The process of “specifying the decision rights and accountability framework
to encourage desirable behavior in using IT,” as Peter Weill and Jeanne Ross define IT governance,1 requires some of the same understandings and agreements needed when governing a state: What decisions are
4Inputs and Decision Making
All animals are equal, but some animals are more equal than others.—George Orwell
Key FindingsIT governance at our respondent institutions involved many participants. Central IT was by far the most frequent participant in both input and decision making, followed by local IT. Business unit leaders and cabinet executives were the most frequent non-IT participants, and students and boards were the least frequent.Central and local IT tended to dominate input and decision making in technical areas like IT architecture and infrastructure, suggesting an “IT monarchy” approach to governance. In more strategic and business areas, participation was more diverse and crossed organizational levels, suggesting a “federal” pattern or possibly a variety of “IT duopoly” (IT plus one other party) arrangements.Despite their low ratings for frequency of participation, boards were involved in decision making at near parity to their involvement in input, whereas students and faculty contributed to input more often than to decision making. It appears that board involvement, though not common, is likely to involve decision making when it does happen.Higher IT governance maturity was associated with higher participation in IT governance.CIO cabinet membership was modestly associated with higher levels of executive participant input into IT governance, and with greater presidential participation in decision making.Institutions reporting a greater number of frequent participations in ITG tended also to give higher ratings to IT alignment, executive ability to describe ITG accurately, active design of ITG, and use of measurement and review in ITG processes.
◆
◆
◆
◆
◆
◆

46
IT Governance ECAR Research Study 5, 2008
to be made, who can make them, and what rights of input and expression are granted to constituents. And as with real constitutions, practical politics will have much to say about how governance actually is conducted, and there may be a big difference between stated and de facto powers.
This chapter looks at some of these “consti-tutional” issues by examining who provides input and contributes to decision making in IT governance. We begin with an overview of how we examined this sort of involvement and what the major findings were. We then look in detail at what the findings say about how different kinds of decisions are made and how different participants take part.
Examining Participation in IT Governance: Methodology
Our study looked at four different dimen-sions of participation in IT governance: what sorts of decisions governance makes (decision types), who takes part (participants), whether participation takes the form of providing input or making decisions (participation type), and how often participants take part (frequency of participation). Because this chapter looks in detail at how these dimensions interact, we start with a brief description of each.
Decision TypesTo map out the different kinds of decisions
that an IT governance process might have to make, we used a typology developed by Weill and Ross that is often used in IT governance assessments.2 The ITG decision types we asked about were
IT principles, which are high-level state-ments about how IT will be used to achieve institutional goals;IT investment and prioritization, which are concerned with how much the insti-tution spends on IT investment, what it spends on, and how competing needs are reconciled;
◆
◆
application needs, which involve specifying the requirements of major IT applications and choosing applications to meet them;IT infrastructure strategies, which address shared IT services used by multiple systems and applications, providing a foundation for enterprise-wide IT capabilities; andIT architecture, which is concerned with the technical guidelines and standards used to achieve a desired level of busi-ness/academic and technical integra-tion and standardization.
ParticipantsWe asked about nine different categories
of ITG participants: board of regents/trustees, president/chancellor, cabinet-level executives, senior institutional IT leader and/or senior central IT managers, local IT managers, business unit leaders, deans/academic unit leaders, faculty, and students. Note that in this chapter the term “participant” may mean a collective entity such as the board or the faculty and does not necessarily imply a single individual.
Participation TypeTo get a sense of how institutions allo-
cate ITG responsibilities, our survey distin-guished between two different types of participation: seeking advice or receiving input (referred to here simply as input) and making final decisions, whether individually or as part of a group (which we refer to as decision making).
Frequency of ParticipationFinally, we asked respondents to use a
5-point frequency scale (ranging from 1 = very rarely or never to 5 = very frequently or always) to describe, for each decision type, how often their institution sought advice/received input from each participant, and how often each participant took part in making
◆
◆
◆

EDUCAUSE CENTER FOR APPLIED RESEARCH 47
IT Governance ECAR Research Study 5, 2008
final decisions (individually or as part of a group). Because we asked about frequency of participation in input and decision making for nine different categories of participants across five decision types, our survey collected a total of 90 frequencies, 45 for input and 45 for decision making.3
General Patterns: Decision Type
It’s clear that IT governance at our respon-dent institutions calls on governance leaders to manage a wide variety of constituents. Notwithstanding strong contrasts between different decision types and participants (see Tables 4-1 and 4-2), both input and decision making were extensively distributed, and there was scant evidence of institutions governing within a small, closed circle. (See Appendix D for the detail Ns and standard deviations for these data.) Only 4 out of 90 possible combinations of decision type, input/decision frequency, and participant fell below a mean frequency of 1.5, the midway point between the two lowest values in the scale.
Looking at it another way, among the 45 decision type/participant combinations involving frequency of input, there were only 3 in which a majority of respondents said that some participant “very rarely or never” had input, all involving the board of regents/trustees (applications needs, IT architecture, and infrastructure strategies). Among the 45 decision-making combinations, there were 7 in which a majority reported that some participant “very rarely or never” took part, all involving either the board (IT principles, application needs, IT architecture, and infrastructure strategies) or students (investment/prioritization, IT architecture, and infrastructure strategies).
Central IT InvolvementOne constant stood out across all decision
types: Central IT leadership was the most heavily involved participant. Respondent ratings of the frequency of participation in both input and decision making for the senior institutional IT leader and senior central IT managers averaged in excess of 4.4 (where 5
Table 4-1. How Often Participants Provide Input/Make Final Decisions: IT Principles, Investment,
Applications (N = 422)
Participant
Decision Type
IT PrinciplesIT Investment and
Prioritization Applications
Input* Decision*Dec. Rank Input* Decision*
Dec. Rank Input* Decision*
Dec. Rank
Sr. inst. IT leader/sr. central IT managers
4.41 4.44 1 4.58 4.53 1 4.48 4.52 1
Cabinet-level executives 3.64 3.43 2 3.82 3.83 2 3.34 3.23 4
Local IT managers 3.85 3.17 3 3.60 3.21 3 3.92 3.59 2
Business unit leaders 3.59 2.84 4 3.43 2.99 5 3.95 3.54 3
Deans/academic unit leaders 3.44 2.76 5 3.19 2.83 6 3.50 3.07 5
President/chancellor 2.97 2.68 6 3.10 3.15 4 2.26 2.28 7
Faculty 3.09 2.32 7 2.52 2.07 7 3.07 2.39 6
Students 2.65 1.92 8 2.00 1.62 9 2.40 1.81 8
Board of regents/trustees 1.84 1.68 9 1.99 2.02 8 1.49 1.49 9
*Scale: 1 = very rarely or never, 5 = very frequently or always

48
IT Governance ECAR Research Study 5, 2008
= very frequently or always) in every decision type. These were the only mean participation frequencies to exceed 4.0, and they back up the finding, reported in Chapter 3 (see Table 3-3), of strong agreement that IT gover-nance is perceived to be the responsibility of the institution’s senior IT leader. Though mean participation frequency for local IT managers was not as high, it still exceeded the scale midpoint (= 3) in every category. As the decision-making (“Dec. Rank”) columns in Tables 4-1 and 4-2 indicate, the senior institutional IT leader/senior central IT manager category was ranked number one in decision-making frequency, and local IT managers ranked either second or third, for all decision types.
Comparing Decision TypesThe pattern of near-universal central IT
leadership involvement aside, we found a clear bifurcation among decision types, especially in decision making. For IT principles, IT invest-ment/prioritization, and applications decisions (see Table 4-1), respondents tended to report higher frequency of participation in decision making for non-IT participants, and more
participants overall with greater than midpoint (= 3.0) frequency means, than in the more “technical” decision types involving architec-ture and infrastructure (Table 4-2).
Among the decision types shown in Table 4-1, IT principles (the creation of high-level statements about how to use IT to achieve institutional goals) had the most restricted participation in decision making. The results suggest that such decisions tend to be made via focused executive–IT collaborations appropriate to their strategic nature. Only the two IT participants (central and local) and cabinet-level executives had mean deci-sion-making participation frequencies above the scale midpoint of 3.0. It’s worth noting, however, that input into IT principles was widespread, with five different categories of non-IT participants rated at or near a mean frequency of 3.0.
We found this pattern of comparatively narrow top-level decision making about IT principles common among our interviewees. CIOs at smaller institutions tended to report relying mainly on their own and executive judgment. “I’m the primary decision maker, and the president’s cabinet is the major
Table 4-2. How Often Participants Provide Input/Make Final Decisions: IT Architecture and
Infrastructure (N = 423)
Participant
Decision Type
IT Architecture IT Infrastructure Strategies
Input* Decision* Dec. Rank Input* Decision* Dec. Rank
Sr. inst. IT leader/sr. central IT managers 4.56 4.65 1 4.63 4.67 1
Cabinet-level executives 2.59 2.54 3 2.97 2.81 3
Local IT managers 3.95 3.46 2 3.91 3.46 2
Business unit leaders 2.96 2.44 4 3.05 2.54 4
Deans/academic unit leaders 2.64 2.21 5 2.77 2.28 5
President/chancellor 2.03 1.97 6 2.23 2.18 6
Faculty 2.40 1.85 7 2.38 1.81 7
Students 1.97 1.52 8 1.95 1.53 8
Board of regents/trustees 1.51 1.39 9 1.54 1.49 9
*Scale: 1 = very rarely or never, 5 = very frequently or always

EDUCAUSE CENTER FOR APPLIED RESEARCH 49
IT Governance ECAR Research Study 5, 2008
stakeholder” on IT principles, reports Steve Conway, director of computing and infor-mation services at Texas A&M University at Galveston. At St. Mary’s College in Notre Dame, Indiana, CIO Janice Thomasson says that, confronted with an IT principles deci-sion, “my management team and I would come to a consensus first. If we needed non-IT input, I’d share the recommendations with the VP of the faculty and the VP of finance and ask them whom else on campus we needed input from.”
Brad Reese, vice president for technology and CIO, Roosevelt University, describes a more layered process that reflects the contrast in our results between broad input and more restricted executive-level decision making. Reese says that the university’s IT principles flow from the IT strategic plan-ning process, which he sees as “an inverted triangle. The broad stripe at the top is the institutional strategic plan, and the IT stra-tegic plan is somewhere in the middle.” The university’s most recent IT strategic plan began with asking staff in town meetings to describe how they used IT and how they wanted to use it. Further exercises winnowed the ideas and linked them to strategic goals, and the university’s three key IT advisory committees prioritized them. “So we got broad-based input,” Reese says. “Then the IT strategic plan went to the president’s executive council for review, modification, and sign-off.”
By contrast, IT investment and prioritiza-tion—concerning how much is spent on IT, what it’s spent on, and how competing needs are reconciled—was a more multilevel, multiplayer decision type. It had the highest reported frequency means among all decision types for cabinet executive (3.83) and presi-dential (3.15) participation in decision making, as well as business and academic unit partici-pation frequency means close to 3.0. This pattern suggests what Weill and Ross (and others) call a “federal” approach—that is,
one involving both central executives and local units—perhaps driven by zero-sum spending dynamics and by the wide-ranging impact of high-level IT investment decisions.
One possible factor in spreading out deci-sion making on investment and prioritization is the fact that IT governance is often sepa-rate from, or loosely linked to, budgeting; as we report in Chapter 5, only 58.0% of respondents said that ITG participated in their institution’s budget processes. Yet another factor is the complex web of funding sources found at many institutions. Roosevelt University’s Reese explains how matching IT priorities to budgets adds steps to the governance process: “I present new initia-tives I want for the coming year to a separate planning committee chaired by the provost, and the endorsed initiatives are consolidated with a budget and brought to the board of trustees. IT initiatives are balanced against all the other institutional requests.” Joel L. Hartman, vice provost for information tech-nologies and resources at the University of Central Florida, also notes that decentralized funding often makes investment decisions inherently distributed. “The research groups have their own money,” he notes. “And only two-thirds of institutional IT investment is represented in central IT. There’s a lot of decentralized IT decision making and local priority setting.”
We also found broad decision-making participation in specifying requirements for and choosing IT applications. Besides the central and local IT groups, three other participants had decision-making participa-tion frequencies above 3.0: cabinet-level executives, business unit leaders, and deans/academic unit leaders. This pattern suggests the somewhat messier, wider-ranging process that one would expect concerning decisions with implications that run deep into the operations of specific business and academic units. It’s possible that our results reflect multiple “IT duopoly” arrangements, Weill

50
IT Governance ECAR Research Study 5, 2008
and Ross’s term for IT units making decisions jointly with specific individual groups. The fact that decision-making frequency means above the midpoint occur at multiple levels of the institutional hierarchy, however, suggests a predominantly “federal” style of decision making in applications.
The picture was quite different for the two decision types that could be considered the most technical in nature, IT architecture and IT infrastructure strategies (see Table 4-2). No participants outside the central and local IT categories had decision-making frequency means above 3.0, and input was also circum-scribed in comparison to other decision types. If central and local IT are considered as one functional entity—admittedly a big “if” at many institutions—decision making in these areas appears to constitute what Weill and Ross call an “IT monarchy.”
Our CIO interviewees confirmed that they had a high degree of control over architecture and infrastructure decisions. “My director of networking and I make the decision,” says Thomasson at St. Mary’s College. “No one second guesses us on that.” At Villanova University, CIO Stephen Fugale went so far as to disband the university’s IT architecture committee. “I think you can overgovern,” Fugale explains. “Having the faculty debate Oracle versus Sequel Server is a waste of time. It’s IT’s responsibility to deliver an IT architecture well.”
Most interviewees did add, though, that they looked to the governance process to inform their decisions and to handle excep-tional circumstances. Despite eliminating Villanova’s dedicated architecture committee, Fugale notes that he relies on committee input when making architectural decisions. Chuck Currier, vice president of information technology at the College of DuPage, says that “we decide in IT based upon input from our technology advisory councils. The councils help us understand what’s coming and why.” Eileen Cusick, chief information technology
officer at Springfield Technical Community College, says that she normally makes such decisions but will take them to her steering committee “if it’s something I can’t do within budget or has high priority on campus.”
As natural as it may seem for IT to predominate in decision making about archi-tecture and infrastructure, there are risks to this pattern. It implies that these aspects of the IT environment are operational details rather than strategic resources, and it raises the question of whether anyone outside IT understands the extent to which these deci-sions hinder or promote larger institutional goals. One has only to consider the execu-tive, presidential, and board engagement typically devoted to more traditional kinds of “architecture” to recognize the potential for misalignment of IT and institutional strategy when IT concerns dominate decisions of this type.
General Patterns: Participants
Besides looking at ITG participants’ frequency of involvement in different kinds of IT decisions, we wanted to gauge their relative overall involvement across all deci-sion types—in effect, their total frequency of participation in IT governance. To do this, for each participant category we averaged all the input participation frequency means across the five decision types to create a single overall input participation mean. Likewise, we also created an overall decision-making participa-tion mean for all the participant categories.4 Figure 4-1 shows these overall means.
Not surprisingly, given their very high involvement in all decision types, senior insti-tutional IT leaders/senior central IT managers were the participant category with the highest mean overall frequencies of both input and decision making. They were also the only group for which mean decision making slightly exceeded mean input. Local IT managers followed as the next most involved category in

EDUCAUSE CENTER FOR APPLIED RESEARCH 51
IT Governance ECAR Research Study 5, 2008
both input and decision making. At the other end of the scale, boards of regents/trustees had strikingly low mean overall participation frequency, and presidents/chancellors were third from the bottom in input and fourth from the bottom in decision making.
We did not find much difference in these patterns on the basis of Carnegie class or institutional FTE enrollment. Mean overall frequency of presidential/chancellor input and decision making was somewhat higher on average in AA and MA institutions compared with doctoral and baccalaureate institutions, while that of business unit leaders tended to increase with enrollment size. We also found that presidential /chancellor and cabinet-level executive overall mean participation frequency was generally higher in U.S. than in Canadian institutions.
Maturity and Decision MakingThere was a more intriguing relationship
between ITG maturity and frequency of participation in decision making. As Table 4-3 shows, institutions reporting more mature
IT governance also tended to report higher mean overall frequency of decision-making participation from non-IT groups. It may be that more mature IT governance leads to a more inclusive approach to decision making or helps encourage more active participation.
At Adelphi University, CIO Jack Chen has made a point of designing the university’s administrative computing committee to be widely inclusive. There are 25 members altogether, including the admissions director and registrar, and representatives from the provost’s office, business affairs, public safety, and facilities. Chen reports that the process is now mature and the meetings well attended, but he notes that it’s necessary to manage participation. “The key is to provide direct value to the constituents,” Chen says. “My basic question is, do you want me to spend two million dollars in capital funds myself? Or do you want to have input?” Though unit self-interest is clearly a factor in the process, Chen adds that “since most issues are cross-func-tional, the input happens in a cross-functional environment—the committee meeting.”
1.60
1.67
2.45
2.07
2.63
3.17
2.86
3.38
4.56
1.68
2.19
2.52
2.68
3.11
3.28
3.40
3.85
4.54
0.50.40.30.20.1
Board of regents/trustees (N = 427, 403)
Students (N = 421, 406)
President/chancellor (N = 425, 414)
Faculty (N = 423, 408)
Deans/academic unit leaders (N = 418, 407)
Cabinet-level executives (N = 419, 412)
Business unit leaders (N = 425, 411)
Local IT managers (N = 426, 408)
Sr. inst. IT leader/sr. central IT managers(N = 430, 427)
Mean Overall Frequency of Participation*
Input
Decision making
Figure 4-1. Overall
Frequency of
Input and Decision
Making, By
Participant
*Scale: 1 = very rarely or never, 5 = very frequently or always

52
IT Governance ECAR Research Study 5, 2008
Contrasts between Input and Decision Making
When examining our participation results, it’s important to remember that we asked about the frequency of participant input and decision making, not influence. There’s a difference, of course. One way to infer the relationship between frequency of participa-tion and degree of influence is to consider the gap between mean frequency of input and the mean frequency of decision making.
It’s notable in the frequency results shown in Tables 4-1 and 4-2 and in Figure 4-1, for example, that presidents and boards were not, on average, rated very highly either for frequency of providing input or making decisions. Boards, in particular, seem far removed from the ITG process: Their overall mean frequency of decision making was lower than that of students, and considerably lower than that of faculty. (Board participation was somewhat higher at institutions where the board had a tech-nology subcommittee, but not dramatically so.) While this probably suggests a real pattern of deliberately infrequent presiden-tial or board participation in IT governance decisions, it also seems likely that when these entities do get involved, they have
disproportionate influence. As one open text response put it, “At the end of the day, the board of regents has to approve major decisions, but they have chosen not to be part of the process.”
One way to approach this issue is to consider who contributes to decisions in near proportion to providing input. While this is far from a definitive measure of influence, we speculate that participants who frequently provide input but less often contribute to decisions are more likely to be treated as customers or constituents, while those whose frequency of decision making matches (or exceeds) their input are more likely to be key (if possibly infrequent) influencers. To see how these differences played out among our respondent institutions, we subtracted the mean overall input frequency from the mean overall decision-making frequency for each participant category (as shown in Figure 4-1) and graphed the differences in Figure 4-2. A negative value there indicates that the participant, on average, was rated as taking part in decision making less often than providing input.
The results fall starkly into two basic groups: what might be called the central administrative hierarchy, including the senior IT leader/senior
Table 4-3. Overall Frequency of Decision Making, by ITG Maturity Level
Participant
Maturity Level
Nonexistent/Initial Repeatable/Defined Managed/Optimized
Mean* NStd.
Deviation Mean* NStd.
Deviation Mean* NStd.
Deviation
Cabinet-level executives 2.95 126 1.024 3.20 222 0.902 3.51 64 1.104
Business unit leaders** 2.76 127 0.899 2.88 221 0.805 3.03 63 0.912
Deans/academic unit leaders 2.44 126 0.872 2.66 218 0.768 2.87 63 0.849
President/chancellor 2.27 128 1.003 2.45 223 1.017 2.78 63 1.057
Faculty 1.88 127 0.697 2.09 219 0.769 2.41 62 0.916
Students 1.54 124 0.631 1.66 221 0.713 2.00 61 0.925
Board of regents/trustees 1.43 123 0.574 1.59 219 0.786 1.93 61 0.983
*Scale: 1 = very rarely or never, 5 = very frequently or always
**Association with ITG maturity level not statistically significant

EDUCAUSE CENTER FOR APPLIED RESEARCH 53
IT Governance ECAR Research Study 5, 2008
central IT managers, the board, president/chancellor, and cabinet executives, where input and decision making means are closely matched; and the participants farther from the center—local IT, deans/academic unit leaders, students, business unit leaders, and faculty—where mean input exceeds mean decision making by a much greater factor.
While this simple difference does not directly measure the influence wielded by specific IT governance participants, it does illus-trate that the rather widespread involvement of all parties at some level of the ITG process masks a distinction between central and distrib-uted units on the basis of parity of input and decision making. And, although the absolute participation of boards and presidents may be
low, it seems likely that when they get involved, it is to add their weight to a decision.
Participation and CIO Cabinet Membership
CIOs commonly observe that their effec-tiveness depends heavily on whether they have “a seat at the table”—that is, the cabinet table. One open text survey response, reflecting a common theme, said that “the greatest problem at my campus is that the CIO is not on the cabinet. This issue reduces IT governance effectiveness by half. IT issues come to leader-ship in spurts that prevent cabinet members from effectively responding.”
The “chief” in “chief information officer” was originally intended to identify the head of
0.02
-0.07 -0.08-0.10
-0.47-0.48
-0.51-0.54
-0.61
-0.7
-0.6
-0.5
-0.4
-0.3
-0.2
-0.1
0.0
0.1
Sr. inst. IT leader/sr. central
IT managers
President/chancellor
Board ofregents/trustees
Cabinetexecutives
Deans/academicunit leaders Students
Mean
Dec
ision
-Mak
ing F
requ
ency
Minu
s Mea
n Inp
ut Fr
eque
ncy
Local ITmanagers FacultyBusiness unit leaders
Figure 4-2. Difference between Mean Input and Mean Decision-Making Frequency, by ITG
Participant

54
IT Governance ECAR Research Study 5, 2008
IT as a peer with such other C-level officers as the CFO and COO, but in practice the term CIO is often used loosely to mean the senior-most IT leader within an organization, regardless of whether the position comes with a right to the proverbial cabinet seat. Among our respon-dent institutions, there was a near-perfect split between those where the senior-most IT leader was (50.2%) or was not (49.8%) a member of the president/chancellor’s cabinet.
Our quantitative survey results lent weight to the hypothesis that CIO cabinet member-ship makes a difference to ITG participation. There were some nuances to the answer, but in sum, the mean overall participation frequency of several key top-level ITG players tended to be higher where the senior-most IT leader sat on the cabinet.
The association was stronger for input than for decision making. As Table 4-4 shows, mean overall input frequencies for the board, president, and cabinet were higher where the senior IT leader was a cabinet member than where he or she was not. When we unpacked these results to look at specific decision types, the strongest associations were for presiden-tial and cabinet-level executive participation in IT principles: Mean presidential input
frequency for IT principles was 2.57 where CIOs were not cabinet members and 3.34 where they were, while mean cabinet input frequency was 3.38 versus 3.89. Presidential input participation, in fact, was at least modestly higher in every decision type where the CIO sat on the cabinet, and board input participation was higher in every area except IT principles.
CIO cabinet membership was less strongly associated with decision making. Of all the different participant types, only presidents had significantly higher overall decision-making frequencies where the CIO was a cabinet member. We also, however, found some mild associations for specific deci-sion types: Boards, presidents, and cabinet members had slightly higher decision-making frequencies for IT principles and applications decisions at institutions where the CIO was a cabinet member.
It’s worth noting here that this pattern of significant but modest differences based on CIO cabinet membership is evident in certain ITG outcome measures as well. In particular, respondents reporting a CIO on the cabinet tended to agree more strongly that their insti-tution’s IT governance made timely decisions
Table 4-4. Overall Input Frequency of Executive Officers, by CIO Cabinet Membership
Participant
Senior-Most IT Leader Is...
Not Member of Cabinet Member of Cabinet Total
Mean Overall Input
Frequency* NStd.
Deviation
Mean Overall Input
Frequency* NStd.
Deviation
Mean Overall Input
Frequency* NStd.
Deviation
Board of regents/trustees
1.53 213 0.671 1.80 212 0.882 1.67 425 0.794
President/chancellor
2.23 210 0.907 2.79 213 0.966 2.51 423 0.978
Cabinet-level executives
3.08 209 0.960 3.45 208 0.852 3.27 417 0.926
*Scale: 1 = very rarely or never, 5 = very frequently or always

EDUCAUSE CENTER FOR APPLIED RESEARCH 55
IT Governance ECAR Research Study 5, 2008
and built support for IT through inclusion. They also had a slight advantage in overall ITG performance and perceived effectiveness.
In short, while CIO cabinet membership is hardly a panacea for all that might ail ITG, it is associated with greater frequency of participation from key leadership constitu-ents such as cabinet executives, boards, and, above all, presidents. It seems reasonable as well to speculate that the modestly better ITG outcomes noted above are related to this enhanced level of participation. Perhaps the gains stem from matters as simple as more CIO opportunity to explain IT issues, more lead time in knowing about important initiatives, and better relationships with institutional leaders. ECAR studies have repeatedly found that executive support is closely associated with success in many varieties of IT initia-tives, and if being seated at the table can boost that support even by a small margin, it could well have a systemic positive effect on IT governance.
Participation and ITG Measurement
Governance that makes decisions in an empirical vacuum or never follows up on project progress is hardly governing at all. Not surprisingly, then, performance measurement and reporting are hallmarks of IT governance best practices. The COBIT IT governance control objective, for example, specifies that organizations should “report relevant portfolio, programme, and IT perfor-mance to the board and executives in a timely and accurate manner.”5
We look in detail at performance measure-ment and reporting among our respondent institutions in Chapters 5 and 6, but a bit of advance summary here will illuminate some important aspects of ITG participation. On the whole, our respondents gave themselves mediocre marks on measurement questions. Asked their level of agreement that their institution makes IT decisions on the basis of
measured IT results and performance, only about a third (34.0%) agreed/strongly agreed, and 39.5% disagreed/strongly disagreed. Mean agreement was a lackluster 2.89. Results were similar for a question about whether the institution incorporates measurement and reporting in its IT governance process: 37.1% were in agreement, 39.2% disagreed, and the mean was 2.93.
The use of measurement and reporting in ITG implies participation from assorted constituents, whether as suppliers of metrics or consumers of them, and we wondered to what extent such use is related to ITG partici-pation. As Figure 4-3 shows, we found strong evidence that institutions that make greater use of measurement and reporting also enjoy (if that is the word) more frequent input from the whole range of ITG participants. The asso-ciation was particularly strong for academic deans, faculty, and students.
While the degree of difference was smaller for decision-making means than for input, the pattern was very similar: For most types of participants (excepting local IT and business unit leaders), overall participation frequency in decision making was higher among institu-tions agreeing about ITG use of measurement and reporting than among those disagreeing. What’s more, with a few variations by specific participant type, the same broad pattern extended across all of our measurement and reporting questions: higher participation frequencies along with higher agreement about measurement and its use, with input showing a somewhat stronger effect than decision making.
The association between measurement/reporting and participation is, at one level, no great surprise: Measurement endeavors have to be carried out by someone, and the differences we found may simply reflect that activity. But there are some intriguing implications to the relationship. First, the roughly equal division of responses regarding measurement/reporting on both sides of a near-neutral mean shows

56
IT Governance ECAR Research Study 5, 2008
that some institutions feel they have gone much further than others in meeting the chal-lenges of defining, collecting, and employing performance measures. Perhaps their success is somehow related to their ability to mobilize constituents through the ITG process.
More concretely, as we show in the section below and in Chapter 6, ITG partici-pation is itself closely related to a number of desirable outcomes, including articulation of priorities, active design and executive knowledgeability of ITG processes, ITG maturity, and overall ITG performance. While we cannot say whether the use of measure-
ment and reporting drives participation, or vice versa, it does seem that enhanced participation, at least up to some level and among the right constituents, is a worthy goal to pursue. Instituting measurement and reporting protocols may be a way to drive it.
Finally, and more speculatively, it seems reasonable to hypothesize that the use of measurement and reporting is related to qualitative as well as quantitative differ-ences in ITG participation levels. Defining, capturing, and interpreting performance metrics—and arguing over them—may
1.53
2.32
3.04
3.68
3.23
2.83
2.42
1.97
1.59
2.52
3.28
3.86
3.49
3.20
2.65
2.16
1.89
2.75
3.54
4.01
3.553.37
2.98
2.46
1.0
2.0
3.0
4.0
5.0
Regents (N = 423) Business UnitLeaders (N = 422)
Deans (N = 414)
Over
all In
put F
requ
ency
*
Strongly disagree/disagreeNeutral
Agree/strongly agree
Local IT (N = 422)Cabinet (N = 415)President (N = 421) Students (N = 417)Faculty (N = 419)
Figure 4-3. Overall Input Frequency, by Agreement That Institution Incorporates Measurement into ITG
*Scale: 1 = very rarely or never, 5 = very frequently or always

EDUCAUSE CENTER FOR APPLIED RESEARCH 57
IT Governance ECAR Research Study 5, 2008
be a way to promote interaction among participants and turn them into something like an IT governance team. In this sense, measurement and reporting, though often resisted on the grounds that they dehu-manize management issues, may actually serve relationship-building and practical ITG politics.
Frequent ParticipationEarlier sections of this chapter looked at
patterns among different kinds of decisions and participants at all levels of participation frequency, from 1 (very rarely or never) to 5 (very frequently or always). In this section, we look at the activity of the more frequent participants in IT governance as a whole to see whether frequent participation is associated with specific ITG practices and outcomes.
We defined participation as frequent if it was rated at 4 or 5 on our scale, and we counted the number of frequent participations each respondent reported for both input and
decision making across all ITG decision types.6 Since there were five decision types and nine participant types, there was a maximum possible total of 45 frequent participations each for input and decision making.
Note that this is a count of participations, not individual participants. Not only were most of our participant types plural in nature (for example, board of regents or students), but also because we asked about five different decision types, each participant could have contributed up to five times to the frequent participation count. For example, a count of 10 frequent participations might represent two participants each rated 4 or 5 in all five decision types, or five participants each rated 4 or 5 in two decision types, or any other combination of 10 frequent participations.
How Much Frequent Participation?
Figure 4-4 shows how the counts of frequent participations reported by our respondents were distributed across three
*Scale: 1 = very rarely or never, 5 = very frequently or always
0%
10%
20%
30%
40%
50%
60%
0–10 (N = 75, 111) 11–20 (N = 176, 179) 21–45 (N = 134, 62)
Mean Count of Participants Rated 4 or 5*
Perce
ntage
of In
stitut
ions
Input (N = 385)
Decision making (N = 352)
Figure 4-4.
Frequent
Participation in
ITG Input and
Decision Making

58
IT Governance ECAR Research Study 5, 2008
ranges: 0–10, 11–20, and 21–45 frequent participations. Input tended to be more inclusive than decision making: The mean number of frequent input participations was 17.93 (median = 17, SD = 8.453), while for decision making it was 14.20 (median = 14, SD = 6.792).
We found no significant differences on the basis of FTE enrollment, Carnegie class, or public/private control. This doesn’t mean that the actual number of people frequently involved in ITG isn’t larger at bigger institu-tions; as we noted earlier, our questions captured categories of participation, not the number of individuals involved. Also, the participant categories we asked about were common constituents likely to be found at almost any institution, so participation by Carnegie-specific players such as research administrators was not specifically captured. It is striking, however, that at least when it comes to our listed participant categories, the number of frequent participations in ITG overall looks similar regardless of institution size or type.
Maturity and Frequent Participation
Notwithstanding the lack of difference by Carnegie class or size, we did find significant differences in frequent participation associ-ated with other factors. One source of varia-tion was IT governance maturity: Institutions
reporting ITG maturity at higher levels tended to have a higher count of frequent participa-tions. As Figure 4-5 shows, maturity was positively associated with greater counts of frequent input and decision-making participa-tions. The largest effect of increased maturity was upon input participations.
These results for frequent participation parallel those reported in Table 4-3, adding the finding that the association between inclusiveness and ITG maturity holds up at the high end of the frequency scale. While a given count of frequent participations might be achieved by many different ways of matching participants and decision types, it appears that higher maturity may be gained by, or may be the effect of, a broader rather than a narrower level of overall participation.
ITG Context and Frequent Participation
Frequent participation was also associated with a number of circumstances that set a good context for mature IT governance or that are related to good ITG outcomes.
We examined these relationships by grouping our respondents into three levels of frequent participation count (low = 1–10, medium = 11–20, high = 21–45) and then looking at the mean agreement in each group regarding institutional strategic prioritization, alignment, ITG design and knowledgeability, and performance measurement.
16.4
14.5
12.6
22.5
18.1
15.1
0 5 10 15 20 25
Managed/optimized (N = 52)
Repeatable/defined (N = 190)
Nonexistent/initial (N = 110)
Matur
ity Le
vel
Mean Count of Participants Rated 4 or 5*
Input
Decision making
Figure 4-5.
Frequent Input
and Decision-
Making
Participation, by
ITG Maturity Level
*Scale: 1 = very rarely or never, 5 = very frequently or always

EDUCAUSE CENTER FOR APPLIED RESEARCH 59
IT Governance ECAR Research Study 5, 2008
The first set of these relationships involved an association between frequent participa-tions and both clearly articulated institutional priorities and IT alignment with business and academic goals—a key finding because strategic goals define what success looks like and tell the IT unit and IT governance process what to align with. As with most other results reported in this chapter, the pattern was strongest for input: Institutions with 10 or fewer frequent input participations reported substantially lower agreement about strategic prioritization and alignment than did those reporting more than 20 (see Table 4-5). The same association held for decision making, though it was not as pronounced.
These differences, though significant, existed against a backdrop of generally high agreement about strategic prioritization and alignment. Not so, however, for our ques-tions about ITG active design, participant knowledgeability, measurement, and review, all areas where respondents tended to give lackluster or low ratings to their institutions (Table 4-6). For ITG active design, the insti-tutions with high (21–45) frequent input participation counts averaged nearly a full point (0.84) higher agreement than those
at the low (1–10) end. The difference was only slightly lower (0.69) for decision-making participations. For ability of relevant leaders to describe ITG accurately and for the questions about measurement and ITG effectiveness review, being in the high-frequency participa-tion group meant having a mean agreement at or above the midpoint of the scale (= 3) for both input and decision making, while the medium and low groups were all below it.
On the whole, then, it seems reasonable to speculate that IT leaders who do what they can to drive ITG participation frequency to higher levels will discover benefits in such matters as designing ITG rather than just letting it happen, working with informed participants rather than ones just taking up space on a committee, and incorporating measurement and review into ITG rather than relying on anecdote and instinct. The very fact that these are generally low-rated areas suggests that institutional IT governance processes can use all the help they can get.
What can IT leaders do to encourage engaged, high-quality participation? Many of our interviewees admitted that participa-tion ranged from passionate to somnolent in different parts of their IT governance struc-
Table 4-5. Prioritization and Alignment, by Count of Frequent ITG Participations
Strategic priorities are
clearly articulated.Business goals and IT
are aligned.Academic goals and IT
are aligned.
Count of Frequent ITG Participations Mean* N
Std. Deviation Mean* N
Std. Deviation Mean* N
Std. Deviation
Input
1–10 3.45 74 1.036 3.65 75 0.878 3.47 73 0.959
11–20 3.64 176 0.981 3.90 176 0.886 3.80 176 0.877
21–45 4.10 133 0.815 4.36 134 0.750 4.17 134 0.836
Decision Making
1–10 3.48 110 1.011 3.77 111 0.884 3.63 109 1.015
11–20 3.80 178 0.904 4.03 179 0.864 3.91 179 0.898
21–45 4.00 62 0.923 4.35 62 0.655 4.08 62 0.816
*Scale: 1 = strongly disagree, 2 = disagree, 3 = neutral, 4 = agree, 5 = strongly agree

60
IT Governance ECAR Research Study 5, 2008
tures, but they also told us that committee powers and agendas, and the way issues are framed, can have a big impact. Douglas E. Hurley, vice president for information tech-nology and CIO at the University of Memphis, says that committees should have real powers and substantive, relevant issues to consider, especially to draw the institution’s key leaders. “There needs to be recognition of empower-ment and contribution,” Hurley says. “If it’s a rubber-stamp, perfunctory committee, members will send their underlings to the meetings.” Chen at Adelphi agrees. “The members have to relate to the agenda topics,” Chen argues. “We approach the agenda from the service and/or problem perspective first, not the technical perspective. What can we do to increase enrollment? What are students upset about? The focus is ‘How can we address these issues together?’”
Of course, while meaty assignments may make ITG committees purposeful and engaging, they’re also demanding. Debra Brum, vice president of instructional and information technology and CIO at California
State Polytechnic University, Pomona says it takes constant attention from the CIO to make sure committees stay on track. “If I didn’t have the commitment and really push,” she says, “we could fall apart like some of the other campus governance structures. We’re assigning some fairly ambitious tasks to committees that consist of people who have day jobs. I think any committee needs a really strong driver on it.”
Summary and Implications
Our most basic finding in this chapter will make sense to anyone who is familiar with the decentralized and often consensus-seeking world of higher education: Participation in IT governance is widespread. True, in IT architec-ture and infrastructure, a majority of respon-dents told us that students and boards “very rarely or never” took part, and there were a few other cases of exclusion, but on the whole respondents seemed loath to rate any partici-pation, whether for input or decision making, at the bottom of our 5-point scale.
Table 4-6. ITG Characteristics, by Count of Frequent ITG Participations
ITG has been actively
designed.
ITG can be accurately described by all
relevant executives, deans, and department
heads.
We incorporate measurement and reporting in our IT
governance process.
We regularly review the effectiveness of IT governance processes.
Count of Frequent ITG Participations Mean* N
Std. Deviation Mean* N
Std. Deviation Mean* N
Std. Deviation Mean* N
Std. Deviation
Input
1–10 3.01 73 1.173 2.45 73 1.055 2.53 73 1.042 2.47 73 0.973
11–20 3.27 172 1.102 2.45 172 1.016 2.82 176 1.111 2.60 176 1.042
21–45 3.85 131 0.996 3.07 130 1.013 3.31 133 0.971 3.13 132 1.022
Decision Making
1–10 3.07 107 1.139 2.43 108 1.043 2.68 108 1.092 2.53 109 0.958
11–20 3.48 177 1.056 2.66 176 1.007 2.93 178 1.077 2.72 178 1.062
21–45 3.76 59 1.072 2.98 59 1.058 3.27 62 1.074 3.15 62 1.038
*Scale: 1 = strongly disagree, 2 = disagree, 3 = neutral, 4 = agree, 5 = strongly agree

EDUCAUSE CENTER FOR APPLIED RESEARCH 61
IT Governance ECAR Research Study 5, 2008
Undoubtedly, higher education’s traditions of inclusiveness have their potential downside in confusion and indecisiveness; just as certainly, in practice they often follow the rule of George Orwell’s Animal Farm, where “some animals are more equal than others.” IT units both central and local were the more-equal Comrade Napoleons of our ITG farm: They had the highest frequency-of-participation ratings, followed by key players such as cabinet-level executives and business unit leaders. Logically, if perhaps dangerously, IT tended especially to dominate architecture and infrastructure decisions, while participation frequencies in the more strategic and business-oriented domains suggested a multilevel “federal” (or perhaps a two-party “duopoly”) pattern. We found some clues suggesting that the participants closer to the central administration—presidents, executives, boards, and central IT—were included relatively more often as deciders, while the more distributed participants—local IT, business units, deans, faculty, and students—were called on more for input than decision making. This was a relative, not an absolute, difference; for example, boards had far lower participation frequency means than business unit leaders, but board input and decision-making frequencies were much closer to parity.
Does this mean, then, that the solution to higher education’s instinctive inclusivity is to squeeze the ITG process down to a few serious players, relegating the others to staged exer-cises in “sharing”? We found no evidence to suggest that this is an effective or desirable ITG strategy. On the contrary, institutions reporting more mature ITG and better measures on such matters as IT alignment, clear strategic priorities, use of measurement in decision making, and executive knowledgeability of ITG tended to report more frequent participation. By contrast, we found little to no variation by some variables commonly assumed to determine the character of an institution, such as Carnegie class, enroll-ment size, and public/private control.
How can IT leaders use these findings? Our techniques do not permit definitive
conclusions about causation or the way that statistical associations might play out in any given institution, but some heuristic and commonsensical (if in some cases speculative) advice would include the following:
Develop competencies for managing complex and diverse ITG inputs.Recognize that getting boards involved in input is likely to open the door to their participation in decision making.CIO cabinet membership seems to help with input participation and especially with presidential involvement in deci-sion making, but not dramatically so, and it is not a prerequisite for ITG maturity or success.Work with the culture of inclusion rather than against it; encourage frequent participation and use it to drive ITG maturity and team-building.
Endnotes1. Peter Weill and Jeanne Ross, IT Governance: How Top
Performers Manage IT Decision Rights for Superior Results (Boston: Harvard Business School Press, 2004), 2.
2. For a detailed explanation of the decision types, see Weill and Ross, IT Governance, 25–55. We shortened the category definitions slightly and modified them to suit our higher education respondent base.
3. Weill and Ross take a different approach to assess the kind of governance characterizing the five types of decisions, using a “governance arrangements matrix” to map input and decision rights in the decision types to a set of quasi-political “decision archetypes” (busi-ness monarchy, IT monarchy, duopoly, feudal, federal, and so forth). See IT Governance, 10–12 and 57–83. Because of the decentralized and often consensual nature of higher education decision making, we chose to ask about the frequency of participation and to focus on specific decision makers rather than the more abstract governance archetypes. For an applica-tion of the Weill and Ross matrix in a higher educa-tion context, see Andrew J. Clark, “IT Governance: Determining Who Decides” (Research Bulletin, Issue 24) (Boulder, CO: EDUCAUSE Center for Applied Research, 2005), available from http://www .educause.edu/ecar/.
4. Responses that did not have a full set of five input answers or five decision-making answers for a given participant were excluded from the mean calculation for that participant.
◆
◆
◆
◆

62
IT Governance ECAR Research Study 5, 2008
5. IT Governance Institute, COBIT 4.1: Framework, Control Objectives, Management Guidelines, Maturity Models (Rolling Meadows, IL: IT Governance Institute, 2007), 168.
6. We excluded responses that did not provide a full set of input and decision-making answers, which is why the N’s in this section are lower than in preceding sections.

EDUCAUSE CENTER FOR APPLIED RESEARCH 63
IT Governance ECAR Research Study 5, 2008
©2008 EDUCAUSE. Reproduction by permission only.
There’s an old saying that a camel is a horse designed by a committee. That may be, but it’s just as appropriate to say that committees are the workhorses of higher education. As we report in this chapter, they play a conspicuous role in IT governance as they do in so many other areas of institutional life.
Committees are not, however, the only
sort of formal structure involved in IT gover-nance. Authorities on IT governance refer to assorted “leadership [and] organizational structures and processes,” “relational mecha-nisms,” or simply “mechanisms” needed to give concrete shape and operational life to IT governance precepts.1 Besides committees, these include project review processes, service
5IT Governance in Action:
Committees and Processes
A committee is an animal with four back legs.—John le Carré
Key FindingsTwo-thirds of institutions report having an IT steering committee (ITSC) for oversight of major IT policies and initiatives. Institutions that have them tend to rate active design of ITG, key participant knowledge of it, and regular review of ITG processes at higher levels than those without such committees.The presence of major ITG committees and processes is positively associated with more timely ITG decision making and agreement that ITG builds support for IT through inclusion.Slightly more than one in five institutions report a board of trustees/regents technology subcommittee. The presence or absence of such committees made little difference to other ITG-related measures.Institutions that involve ITG in formal project review tend to report better ability to conduct activities institution-wide. Those with ITSCs rate the effectiveness of those committees higher where ITG involves project review.Taking part in the institutional budgetary process and communicating about ITG effec-tively are strongly associated with doing better on a range of ITG-related measures, including overall ITG effectiveness.Use of measurement and process review in ITG is strongly associated with a variety of good outcomes, but institutions generally give themselves low marks for such use.
◆
◆
◆
◆
◆
◆

64
IT Governance ECAR Research Study 5, 2008
level agreements, performance metrics, external reviews, ITG-related communica-tion, and other devices that ensure, as the IT Governance Institute puts it, “that the organization’s IT sustains and extends the organization’s strategy and objectives.”2
In this chapter, we look at a variety of IT governance mechanisms. We start with a comparative overview of major ITG commit-tees and processes, considering how wide-spread they are and what their relationship is to certain ITG outcomes. Next we look in detail at specific mechanisms, beginning with what seems to be the most popular forum for top-level ITG guidance, the IT steering committee. Additional sections assess other sorts of committees, institutional project review processes, performance measures, and ways of keeping constituents informed about ITG processes and decisions.
Committees and Processes: An Overview
IT governance-related committees were abundantly present among our respondent institutions. As Figure 5-1 shows, two-thirds or more reported that their IT gover-nance structures had a top-level IT steering committee for oversight of major IT policies and initiatives, IT advisory committees for administration and teaching and learning, and/or IT initiative-specific committees for items like enterprise resource planning, secu-rity, or business continuity. In contrast, board of trustee subcommittees for technology were fairly rare, reported by only 22.2% of respondents. (For information on other types of committees, see Figure 5-8.)
Our interviews with CIOs commonly uncovered multitiered and multitracked governance structures in which the presence
22.2
67.068.9 67.5
70.0
58.0
40.5
0%
10%
20%
30%
40%
50%
60%
70%
80%
Board technologysubcommittee
(N = 410)
IT steeringcommittee(N = 433)
Administrative ITadvisory committee
(N = 421)
Teaching/learning ITadvisory committee
(N = 422)
IT initiative-specificcommittees(N = 414)
ITG participates inbudgetary processes
(N = 436)
ITG involves formalproject review
(N = 432)
Perce
ntage
of In
stitut
ions
Figure 5-1. Major ITG Committees and Processes

EDUCAUSE CENTER FOR APPLIED RESEARCH 65
IT Governance ECAR Research Study 5, 2008
of one committee implied the existence of others. For example, institutions with ITSCs typically structure them to receive input from more specialized committees, using the ITSC as a broader and more authoritative (though often still advisory) forum. This may explain the roughly similar incidence of the commit-tees we asked about.
The committee structure described by Villanova University CIO Stephen Fugale is a good example, though it enjoys an unusually high level of executive participa-tion and authority. Villanova’s university IT committee acts as the top-level forum, consisting of several cabinet-level vice presidents, and representatives from the university’s four undergraduate colleges. This committee, chaired by Fugale, makes strategic decisions and approves policies and budgets. It receives input from an academic IT committee, chaired by the vice president of academic affairs and heavy on faculty and college dean representation, and an administrative IT committee, chaired by the vice president of finance and administra-tion and populated by key vice presidents and directors of administrative areas. The committees all meet monthly, and despite the higher-level concerns of the university IT committee, Fugale says he views them all as “vitally important to governance for the university.” Critical to the successful interaction of the committees is appropriate representation. Choice of members is in the hands of the chairs, Fugale says, but a common element is that “we spend a lot of time to ensure the groups have the right representation, understand the committee’s charter, and don’t bypass other processes. We ensure that the committee members are actively engaged and have an institutional, not personal, interest and understand the bidirectional nature of their position.”
IT governance participated in the institu-tional budgetary process at a modest majority of institutions (58.0%), but only about 4 in
10 respondents said that IT governance at their institution involved formal review and approval of IT projects. The institutions that lacked these mechanisms for influencing or at least learning about key IT-related institutional decisions may be able to compensate in other ways, but we found that on average they did not do as well on ITG outcomes as institutions that have them.
Incidence of most of the items in Figure 5-1 differed at least moderately by Carnegie class or FTE enrollment size; in general, doctoral and larger institutions were more likely to have the item in place. But these differences were weaker than those related to reported IT governance maturity level. As Figure 5-2 shows, in every case, institutions at a higher level of maturity were more likely to report the item. The maturity difference was relatively small for the most commonly reported item, IT initiative-specific committees, but the gaps were dramatic for others. Institutions with managed/optimized (high) maturity reported ITG involvement in project review at almost four times the rate of those with nonexistent/initial (low) maturity.
We inquired about another set of processes in a different way, asking respondents to express their level of agreement about prac-tices relating to the use of measurement and review in IT governance. Figure 5-3 shows the responses for two of these items: incorpora-tion of measurement and reporting in the ITG process, and regular review of the effective-ness of ITG processes. Respondents weren’t especially enthusiastic: In each case, those disagreeing/strongly disagreeing outnumbered those agreeing/strongly agreeing, while a substantial number said they were neutral. As with the committees and processes reported above, these measures too were positively asso-ciated with ITG maturity, and they accounted for some of the strongest associations we found with good outcomes measures.
Substantial numbers of respondent insti-tutions, then, conduct IT governance in the

66
IT Governance ECAR Research Study 5, 2008
13.7
35.4
46.550.8
63.2
40.2
19.124.2
78.576.2
71.5 71.1
63.5
41.6
31.3
87.1 86.6 86.4
79.7
73.277.1
0%
10%
20%
30%
40%
50%
60%
70%
80%
90%
100%
Board technologysubcommittee
(N = 410)
IT steeringcommittee(N = 433)
Administrative ITadvisory committee
(N = 421)
Teaching/learning ITadvisory committee
(N = 422)
IT initiative-specificcommittees(N = 414)
ITG participates inbudgetary processes
(N = 436)
ITG involves formalproject review
(N = 432)
Perce
ntage
of In
stitut
ions
Nonexistent/initial
Repeatable/definedManaged/optimized
Figure 5-2. Major ITG Committees and Processes, by ITG Maturity Level
9.912.0
29.330.5
23.7
29.6
32.5
24.5
4.63.5
0%
5%
10%
15%
20%
25%
30%
35%
40%
We incorporate measurement and reporting We regularly review the effectiveness in our ITG process. (N = 434) of ITG processes. (N = 433)
Perce
ntage
of In
stitut
ions
Strongly disagree
Disagree
NeutralAgree
Strongly agree
Figure 5-3.
Incorporation of
Measurement and
Review in ITG

EDUCAUSE CENTER FOR APPLIED RESEARCH 67
IT Governance ECAR Research Study 5, 2008
absence of certain committees, processes, and measurement practices. But isn’t it possible that some institutions are deliberately keeping IT governance lightweight, avoiding commit-tees and formal processes that might slow them down and dilute decision making?
No doubt ITG tactics like that do work for some institutions, but on the whole we found that institutions reporting the existence of key committees and processes think that IT gover-nance is better at making timely decisions and that their IT governance builds support for IT through inclusion. As Table 5-1 shows, mean agreement on these measures was higher among those with an IT steering committee and where IT governance involved budgetary
process participation and project review. Similarly, respondents who agreed that their institution incorporated measurement and reporting into ITG, and/or that they regularly reviewed the effectiveness of ITG processes, also gave higher ratings to timeliness and support through inclusion.
Because committees and formal processes unquestionably exact some toll in exertion and delay, it’s interesting to ponder why institu-tions that use them don’t at least describe institutional ITG decisions as less timely. It may be, of course, that bureaucracy and formality so pervade the culture that they distort the very notion of timeliness, in effect making slow progress look acceptable. But especially
Table 5-1. Timeliness of ITG Decisions and Support Built through Inclusion, by Committee, Process, and
Measurement Status
At my institution...
ITG makes timely decisions.ITG builds support for IT through
inclusion.
Mean* NStd.
Deviation Mean* NStd.
Deviation
We have a top-level IT steering committee for oversight of major IT policies and initiatives.
No 3.30 142 1.084 3.42 142 1.125
Yes 3.58 289 0.947 3.97 289 0.847
IT governance participates in institutional budgetary processes.
No 3.23 182 1.078 3.50 182 1.050
Yes 3.67 251 0.906 4.00 251 0.867
IT governance involves formal review and approval of IT projects.
No 3.33 255 1.039 3.63 255 1.026
Yes 3.73 175 0.906 4.02 175 0.868
We incorporate measurement and reporting in our IT governance process.
Strongly disagree/disagree 3.10 170 1.102 3.39 170 1.111
Neutral 3.62 102 0.833 3.93 102 0.812
Agree/strongly agree 3.83 161 0.818 4.12 161 0.740
We regularly review the effectiveness of IT governance processes.
Strongly disagree/disagree 3.11 183 1.065 3.42 183 1.091
Neutral 3.64 128 0.928 3.96 128 0.788
Agree/strongly agree 3.90 121 0.723 4.17 121 0.734
All respondents
3.49 435 1.003 3.79 435 0.980
*Scale: 1 = strongly disagree, 2 = disagree, 3 = neutral, 4 = agree, 5 = strongly agree

68
IT Governance ECAR Research Study 5, 2008
in light of the relationship of these items to ITG maturity, we speculate that the number of institutions that clearly see the benefits of “lightweight” or informal ITG is small compared with the number for whom the resources and time to create ITG mechanisms simply hasn’t been adequate. By rational-izing decision making, requiring interaction on a regular basis, broadening the circle of informed people, and giving IT decisions a stronger political base, ITG mechanisms may more than compensate for their cost in complexity and delay.
The IT Steering Committee
We reported above and in Chapter 4 that IT governance typically shares the character-istic inclusivity of higher education admin-istration. But how do institutions collect all that participant input and drive institutionally oriented decisions when there are so many interested parties, each potentially ready to advance its own agenda?
The dominant means for doing this appears to be an assembly of executives, IT leaders, business/academic leaders, and (in
many cases) faculty and/or student repre-sentatives, known by such names as the IT steering committee, IT council, executive committee, or IT strategy committee. In this section, we look at the incidence, scope, role, and membership of these bodies. We use the term IT steering committee here to refer to all manifestations of a top-level committee charged with oversight of major IT policies and initiatives.
IncidenceThe IT steering committee is a popular
IT governance mechanism. Two-thirds of our respondents (67.0%) said that their institutions have a top-level committee for oversight of major IT policies and initiatives. As Figure 5-4 shows, the incidence of such committees tended to rise with institution FTE enrollment, ranging from about half of institutions with 2,000 or fewer students to about three-quarters of those with more than 8,000.
Differences between public and private institutions turned out to be insignificant when controlled for size, with one exception: Among institutions of 4,000 or fewer students, 70.6%
51.8
64.9 66.7
76.974.7
0%
10%
20%
30%
40%
50%
60%
70%
80%
90%
1–2,000 (N = 85) 2,001–4,000 (N = 97) 4,001–8,000 (N = 84) 8,001–15,000 (N = 78) More than 15,000 (N = 75)
FTE Enrollment
Perce
ntage
of In
stitut
ions
Figure 5-4.
Institution Has
IT Steering
Committee, by
Institution Size

EDUCAUSE CENTER FOR APPLIED RESEARCH 69
IT Governance ECAR Research Study 5, 2008
of public institutions reported IT steering committees, while only 51.8% of private ones did. This is reminiscent of results we reported in Chapter 3, where we noted that small private institutions reported lower levels of ITG matu-rity than small public institutions (see Figure 3-2 and related text). As we suggested there, it may be that public control tends to push small institutions toward bureaucracy or formality, while similar-sized private institutions don’t see the need—or lack the resources.
In the overview section above, we noted the strong relationship between ITSC status and IT maturity level (Figure 5-2). Some further hints about the ITSC/maturity relation-ship appear in the reasons respondents gave for not having an IT steering committee. When respondents without ITSCs were asked to pick their institution’s top-three reasons (from a list of eight), the reason most often chosen was that the IT governance process was not suffi-ciently formalized (see Figure 5-5). The next two most chosen reasons suggest deliberate alternatives to the ITSC, including a more top-down approach (relevant decisions made at executive level) and a more distributed approach (prefer using ad hoc committees as needed).
The University of Central Florida (UCF) is an example of an institution that eschews a top-level steering committee in favor of an alternative that Joel Hartman, vice provost for information technologies and resources at UCF, describes as a “high touch” approach. “I consider the stakeholders as a matrix, including students, faculty, and staff, and I think decision making requires input from all of their voices.” Some constituen-cies, such as the faculty senate and board, have their own mechanisms for input, and Hartman makes frequent use of ad hoc advisory committees to address specific issues. But he also relies on lots of personal contact. “I’m on the cabinet, dean’s council, and similar groups around the campus, and I hold one-on-one meetings annually with the individuals from each of these high-level groups. We have frank discussions of unit issues and priorities, and the results are formally scored according to a rubric. These meetings go a long way to building commu-nity trust. I prefer this infused approach to a high-level steering committee.”
Despite the number of institutions appar-ently pursuing an alternate strategy, there are suggestions that for a substantial group
Figure 5-5.
Why Institution
Does Not Have
IT Steering
Committee
(N = 143)
7.7
14.0
19.6
20.3
26.6
31.5
41.3
55.9
0% 10% 20% 30% 40% 50% 60%
Prefer personal advisory relationships
IT governance needs not complexenough to justify
Prefer multiple standing committees
Prefer to preserve IT managementfreedom of action
Insufficient stakeholderinterest/willingness to participate
Prefer using ad hoc committees asneeded
Relevant decisions made at executivelevel
IT governance process not sufficientlyformalized
Percentage of Institutions

70
IT Governance ECAR Research Study 5, 2008
of others, immaturity rather than choice is the key factor. Among the 80 respondents who said that insufficiently formalized IT governance was a top reason why their institutions did not have an ITSC, 31 (38.8%) named no other reason that suggested an alternative approach, such as making rele-vant decisions at the executive level, prefer-ring ad hoc or multiple standing commit-tees, wishing to preserve IT management freedom of action, or preferring personal advisory relationships. It seems reasonable to speculate that many of these institutions would institute an ITSC if conditions favored a more formal approach to ITG.
And trying to change those conditions may be a good idea. We already noted earlier, in Table 5-1, that institutions with ITSCs tend on average to agree more strongly than those without them that ITG builds support for IT through inclusion. Institutions with ITSCs also were more likely to agree that IT governance was actively designed, that key participants could describe it accu-rately, and that their institutions conducted regular reviews of IT governance processes. As we’ll see in Chapter 6, these variables in turn were strongly associated with overall IT governance effectiveness.
ITSC EffectivenessFor the most part, respondents from
institutions that have ITSCs seem to be happy with their effectiveness. Their mean agree-ment (1 = strongly disagree, 5 = strongly agree) to the statement that their institution’s IT steering committee contributed effectively to institutional IT governance was 3.64 (SD = 1.110), and the median was 4.0. Only 13.8% of respondents disagreed or strongly disagreed that their ITSC was effective, while 22.5% were neutral, leaving nearly two-thirds (63.7%) to agree or strongly agree. We’ll investigate in the following sections how ITSC effectiveness was associated with other variables.
Scope and RoleOne of the challenges of IT governance is
to articulate an institutional view of IT rather than one rooted in the parochial interests of central IT. The IT steering committee could be seen as a means to that end, and most institutions seem to use them that way. At the University of Delaware, for example, Susan Foster, vice president for information technolo-gies, describes the Committee on Information Resource Planning and Management as “a recommending group particularly focused on gathering broad input and developing policy decisions.” A large membership of about 30 includes representatives from every college, the academic senate, the library, students, and administrators, as well as IT.
Despite many variations in authority and membership, the vast majority of survey respondents with ITSCs reported a similar concept of committee scope. Almost 9 out of 10 (86.1%) said that their institution’s ITSC addressed institution-wide IT issues and initiatives, while only 13.9% said it primarily addressed central IT issues and initiatives. Respondents reporting institution-wide scope agreed much more strongly than their IT-centric counterparts that the activities of IT personnel could be coordinated effectively throughout the institution (see Table 5-2).
Institution-wide ITSCs were more preva-lent among institutions with a smaller propor-tion of IT personnel reporting to departments outside central IT, suggesting that to some extent institutions choosing a broader ITSC scope may just have fewer local IT constituents to coordinate and therefore an easier path to an “institutional” view of IT. Or they may be using the committee because there is less opportunity for central IT and local IT to estab-lish direct contacts and thus a central–local information conduit. Among those where 0% to 10% of FTE IT personnel reported to outside departments, 95.0% had institu-tion-wide ITSCs. Where the outside-reporting proportion was 50% or greater, only 66.0%

EDUCAUSE CENTER FOR APPLIED RESEARCH 71
IT Governance ECAR Research Study 5, 2008
did. Nonetheless, the positive relationship between institution-wide ITSCs and greater agreement that IT personnel could be coor-dinated effectively institution-wide held up when we controlled for this factor.
Aside from having institutional or IT-centric scope, what does the ITSC do? We asked respondents to tell us about the role of their IT steering committee by selecting applicable items from a list of possible roles. As Figure 5-6 shows, virtually all respondents with an ITSC reported that it played an advisory role, and about three in four said it set priorities. Small majorities of ITSCs were empowered to set policy (57.1%) or adjudicate conflicts (53.1%). Two roles were positively associ-ated with agreement that the IT steering committee contributed effectively to institu-tional IT governance: Those where the ITSC set policies and/or set priorities had slightly higher ITSC effectiveness means.
The power of the purse was more restricted: Only about one in four respondents said their ITSC authorized funding. This role tended to travel with policy setting. Of those with funding authorization power, 84.1% also set policy, versus 48.8% of institutions where the ITSC lacked such power. Institutions where the ITSC authorized funding also tended to report higher ITG maturity.
These patterns proved remarkably consis-tent. There was no significant difference in ITSC roles between ITSCs on the basis of ITSC scope, Carnegie class, FTE enrollment, private/public control, or CIO cabinet status.
RepresentationWhen we asked respondents to tell us
which parties from a list of 10 possible partici-pants were permanently represented on their IT steering committees (whether directly or through delegates), we discovered a pattern of widespread participation (see Figure 5-7). Representation of the institution’s senior IT leader was all but universal, followed by repre-sentation rates above 75% for a variety of administrative and academic officers. Faculty representation was quite high, at 81.9%. The median number of participants selected from the list was six.
Surprisingly, local IT managers were less often represented than such other noncen-tral parties as faculty and deans/academic unit leaders. Indeed, their representation was in roughly the same 50/50 territory as that of students. This may be due to our question’s emphasis on permanent representation; it is possible that local IT managers take part more often on an ad hoc basis. Some might also be “included” in the sense that their affiliated business or academic unit leaders were on the ITSC. Still, this ran somewhat contrary to our finding that the great majority of ITSCs have institu-tion-wide scope.
Such scope proved significant to only a few participant representation rates. Deans, faculty, and students were all more likely to be represented where the ITSC had institution-wide scope, and less likely where it primarily addressed central IT issues and initiatives.
Table 5-2. Ability to Coordinate IT Personnel throughout Institution, by IT Steering
Committee Scope
ITSC Scope
We are able to coordinate the activities of IT personnel effectively
throughout the institution.
Mean* N Std. Deviation
Primarily addresses central IT issues and initiatives 3.05 39 1.099
Addresses institution-wide IT issues and initiatives 3.79 246 0.978
*Scale: 1 = strongly disagree, 2 = disagree, 3 = neutral, 4 = agree, 5 = strongly agree

72
IT Governance ECAR Research Study 5, 2008
We did not find any significant association between the number of participants reported and agreement that the ITSC contributes effectively to IT governance.
The chief exceptions to the general pattern of inclusion came at the top levels of the institution: Only about one in four ITSCs include presidential representation, and board of regents/trustee representation was almost nil. Both of these results were consis-tent with the generally low presidential and board participation in ITG that we reported in Chapter 4. Such participation, however, can have great impact. At California State Polytechnic University, Pomona, the president
not only sits on the top-level IT governance committee but also chairs it. “Without the direct involvement of our president, the IT governance committee structure would not be nearly as successful as it is,” says Debra Brum, vice president of instructional and information technology and CIO at California State Polytechnic University, Pomona. “The governance structure would not have had legitimacy when it started without his involve-ment. The culture at the time distrusted IT, and he needed to be there.”
Presidential leadership of the ITSC may be unusual, but while CIOs predominate as chairs, they don’t do so as often as might
23.0
53.1
57.1
74.7
98.2
0% 10% 20% 30% 40% 50% 60% 70% 80% 90% 100%
Authorizes funding (N = 278)
Adjudicates conflicts (N = 271)
Sets policy (N = 280)
Sets priorities (N = 281)
Has advisory role (N = 283)
Percentage of Institutions
Figure 5-6. Role
of IT Steering
Committee
Figure 5-7.
Permanent
Representation
on IT Steering
Committee
2.8
24.5
51.2
56.4
76.3
78.3
79.7
81.5
81.9
97.6
0% 10% 20% 30% 40% 50% 60% 70% 80% 90% 100%
Board of regents/trustees (N = 286)
President/chancellor (N = 286)
Local IT managers (N = 283)
Students (N = 280)
Senior central IT managers (N = 287)
Business unit leaders (N = 286)
Deans/academic unit leaders (N = 286)
Cabinet-level executives (N = 286)
Faculty (N = 287)
Institution’s senior IT leader (N = 289)
Percentage of Institutions

EDUCAUSE CENTER FOR APPLIED RESEARCH 73
IT Governance ECAR Research Study 5, 2008
be expected. The institution’s senior IT leader chaired the ITSC at 61.2% of institu-tions, leaving nearly 4 in 10 to be chaired by someone else.
We found no statistically significant differ-ences among other ITG measures on the basis of whether or not the CIO chaired the ITSC, but a number of our interviewees shared their rationales for assigning chair responsi-bility. At Villanova, Stephen Fugale feels that chairing the university’s steering committee permits him to ensure that advisory committee feedback works its way back up to senior administration. He feels, on the other hand, that it’s important for the academic advisory committee in particular to be “owned by the academic area so the committee isn’t perceived as pushing IT, but rather explores how IT enables the academic world.”
Several of our CIO interviewees extended this reasoning to the ITSC itself, preferring that another officer lead their top-level governance committees because it made the process more open and impartial. At Roosevelt University, Brad Reese, vice president for technology and CIO, appoints members to the university’s IT advisory council but doesn’t chair it. “A governance structure has to be very much a reflection of the structure and values of the university,” Reese says. “In my opinion, IT staff can be ex officio members, but can’t be voting members. The chair of our council is usually a faculty member.” At Cal Poly Pomona, Brum expresses a similar sentiment. “Our IT division now has a good rapport with most areas, but still, if I ran IT governance, it would be suspect. I would highly recommend that if you have a need for a high-level IT governance committee, that your president, provost, or some other senior administrator lead it.”
Other IT Governance Committees
While the IT steering committee is a common vehicle for top-level oversight of
major IT policies and initiatives, it’s hardly the only mechanism used in IT governance. We found a variety of other, more specialized, committees in use, some of them about as common as the ITSC.
Committees Involved in IT Governance
As Figure 5-8 shows, three types of committees involved in IT governance were each reported by about two-thirds of respon-dents: IT initiative-specific committees dealing with such issues as enterprise resource plan-ning or security, IT advisory committees dealing with administrative issues, and IT advisory committees dealing with teaching and learning. Only one of these committee types was associated significantly with IT steering committee status: Standing adminis-trative IT advisory committees were reported by 80.0% of institutions with ITSCs but only 46.0% of institutions without one. Institutions with ITSCs also tended on average to report more IT governance committees in total than those without one.
We had wondered if the opposite might be true, hypothesizing that institutions lacking an ITSC might rely instead on a number of more specialized committees. But as we reported above in Figure 5-5, relatively few institutions (19.6%) named a prefer-ence for multiple standing committees as a reason for not having an ITSC, and others said that relevant decisions were made by executives—thus, perhaps, bypassing committees altogether. By contrast, many of our interviewees described their IT steering committees as standing above administra-tive and academic advisory subcommittees, often supplemented by other functional or project-oriented committees.
At Emory University, for example, the steering committee for the university sits organizationally above a total of eight func-tional committees dedicated to such areas as finance, student services, research adminis-

74
IT Governance ECAR Research Study 5, 2008
tration, and instructional technology, mostly staffed by non-IT participants. “The proposal review and decision-making environment is intentionally cross-unit and cross-disci-plinary,” says Linda Erhard, coordinator for IT governance and strategic planning at Emory. “Resulting IT decisions are grounded in both awareness of business need and techno-logical innovation. Committee members also walk away empowered—knowing how IT is working for them.”
Next in popularity below the triad of initia-tive-specific, administrative, and teaching/learning-oriented committees, institutional budget committees were involved in ITG at 47.3% of institutions and faculty senate committees at 41.1% (see Figure 5-8). Though research IT advisory committees were uncommon at 19.0% of institutions overall, they were far more common among doctoral institutions, 44.4% of which had them. Among the other Carnegie categories, none exceeded the 11.0% reported by MA institutions.
The prevalence of most of these committee types was positively associated with FTE enrollment. (The exceptions were IT archi-tecture and budget committees.) As Figure 5-9 shows, the top triad of initiative-specific, administrative, and teaching and learning committees were reported by the majority of respondents at institutions of all sizes,
reaching or exceeding 70% at midsize and large institutions.
By contrast, and somewhat surprisingly, only 29.8% of institutions with 4,000 or fewer students reported the involvement of a faculty senate committee in IT gover-nance, compared with more than twice as many (62.5%) at institutions with more than 15,000 students. Since there was no corresponding difference in the reported frequency of participation by faculty in ITG input and decision making between small and large institutions, we speculate that faculty participation at smaller institutions tends to take the form of individual faculty members sitting on other committees, or that it oper-ates through informal contacts rather than through the faculty senate.
Board of Trustees Technology Committee
Separately from our questions about committees involved in IT governance, we asked respondents whether their institution’s board of trustees/regents/governors has a technology subcommittee. The creation of a board-level “IT strategy committee” to parallel the executive-level IT steering committee is one of the signature recommendations of the IT Governance Institute, which advises that the committee should “ensure that IT governance is addressed in a structured manner and that
18.5
19.0
41.1
47.3
67.5
68.9
70.0
0% 10% 20% 30% 40% 50% 60% 70% 80%
IT architecture committee (N = 399)
Research IT advisory committee (N = 400)
Faculty senate committee (N = 406)
Institutional budget committee (N = 404)
Teaching/learning IT advisory committee(N = 422)
Standing administrative IT advisorycommittee (N = 421)
IT initiative-specific committees, e.g., ERP(N = 414)
Percentage of Institutions
Figure 5-8.
Committees
Involved in IT
Governance
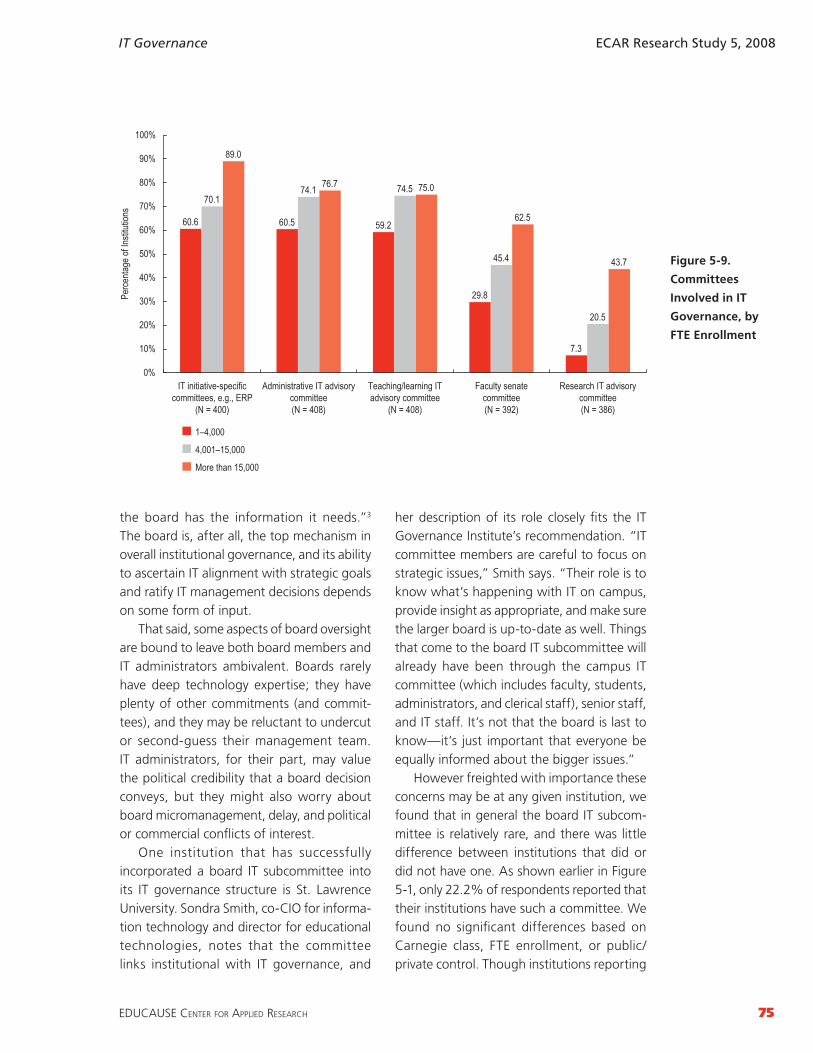
EDUCAUSE CENTER FOR APPLIED RESEARCH 75
IT Governance ECAR Research Study 5, 2008
the board has the information it needs.”3 The board is, after all, the top mechanism in overall institutional governance, and its ability to ascertain IT alignment with strategic goals and ratify IT management decisions depends on some form of input.
That said, some aspects of board oversight are bound to leave both board members and IT administrators ambivalent. Boards rarely have deep technology expertise; they have plenty of other commitments (and commit-tees), and they may be reluctant to undercut or second-guess their management team. IT administrators, for their part, may value the political credibility that a board decision conveys, but they might also worry about board micromanagement, delay, and political or commercial conflicts of interest.
One institution that has successfully incorporated a board IT subcommittee into its IT governance structure is St. Lawrence University. Sondra Smith, co-CIO for informa-tion technology and director for educational technologies, notes that the committee links institutional with IT governance, and
her description of its role closely fits the IT Governance Institute’s recommendation. “IT committee members are careful to focus on strategic issues,” Smith says. “Their role is to know what’s happening with IT on campus, provide insight as appropriate, and make sure the larger board is up-to-date as well. Things that come to the board IT subcommittee will already have been through the campus IT committee (which includes faculty, students, administrators, and clerical staff), senior staff, and IT staff. It’s not that the board is last to know—it’s just important that everyone be equally informed about the bigger issues.”
However freighted with importance these concerns may be at any given institution, we found that in general the board IT subcom-mittee is relatively rare, and there was little difference between institutions that did or did not have one. As shown earlier in Figure 5-1, only 22.2% of respondents reported that their institutions have such a committee. We found no significant differences based on Carnegie class, FTE enrollment, or public/private control. Though institutions reporting
60.6 60.5 59.2
29.8
7.3
70.174.1 74.5
45.4
20.5
89.0
76.7 75.0
62.5
43.7
0%
10%
20%
30%
40%
50%
60%
70%
80%
90%
100%
IT initiative-specificcommittees, e.g., ERP
(N = 400)
Administrative IT advisorycommittee(N = 408)
Teaching/learning ITadvisory committee
(N = 408)
Faculty senatecommittee(N = 392)
Research IT advisorycommittee(N = 386)
Perce
ntage
of In
stitut
ions
1–4,000
4,001–15,000
More than 15,000
Figure 5-9.
Committees
Involved in IT
Governance, by
FTE Enrollment

76
IT Governance ECAR Research Study 5, 2008
higher levels of ITG maturity were more likely to have a board technology subcommittee, even among the managed/optimized (high) maturity group only about 3 in 10 institutions (31.3%) reported one.
Not too surprisingly, institutions with a board technology subcommittee did tend to report higher participation by the board in various input and decision-making catego-ries. This, however, should be understood in the context of the very low board participa-tion we reported in Chapter 4 (see Tables 4-1, 4-2, and 4-4). Except for some modest associations with the use of metrics, we did not find strong associations between board technology subcommittee status and other ITG-related performance outcomes or insti-tutional characteristics.
In short, we found few indicators that board technology subcommittees have much influence on IT governance, or vice versa. It could be that boards find other ways to exercise oversight, such as in direct rela-tionships with executives or by assigning IT issues to other committees. It is tempting to speculate, however, that board involvement in IT governance simply implies a greater degree of either institutional ITG maturity or high-level IT strategic significance than most institutions have achieved. However, the fact that most institutions reporting high ITG maturity don’t have board IT subcommittees suggests that they do not see this form of board involvement as a necessary ingredient of ITG maturity.
IT Governance ProcessesCommittees aren’t the only mechanisms
that translate IT governance principles into action; processes do too. We looked at four key processes as they relate to IT governance:
formal review and approval of IT projects;participation in institutional budgetary processes;
◆
◆
measurement, reporting, and review of IT performance; andcommunication of IT governance deci-sions and processes.
Project ReviewThe involvement of IT governance in the
formal review and approval of IT projects proved to be strongly associated with ITG maturity and a number of other IT gover-nance-related measures. It was far from a universal practice among our respondents: Overall, as we showed in Figure 5-1, 40.5% reported such involvement. Interestingly, the practice was most common at doctoral (50.0%) and associate’s (49.2%) institutions, a rare pairing of those two Carnegie types. Only about a third of BAs (32.4%) and a quarter of MAs (26.4%) reported ITG involvement in project review. It may be that such review lends itself to either very layered or very flat organizational environments, but less so in a middle ground.
We did not find differences in project review involvement on the basis of FTE enrollment or private/public control. ITG project review involvement was also, as seen in Figure 5-2, strongly associated with ITG maturity. Regardless of whether this means that project review processes somehow stim-ulate ITG maturity, or vice versa, it suggests that one of the key objectives of mature IT governance structures is to improve visibility and control over the risks and costs associ-ated with IT projects.
Other associations with ITG involvement in project review are reminiscent of previously reported findings about synergies between frequent participation (see Table 4-6) and ITG-related institutional characteristics. In particular, respondents from institutions where ITG involves formal project review and approval agree much more strongly that ITG has been actively designed (see Table 5-3)—so much so that one wonders whether the review process is one of the prominent elements being designed.
◆
◆
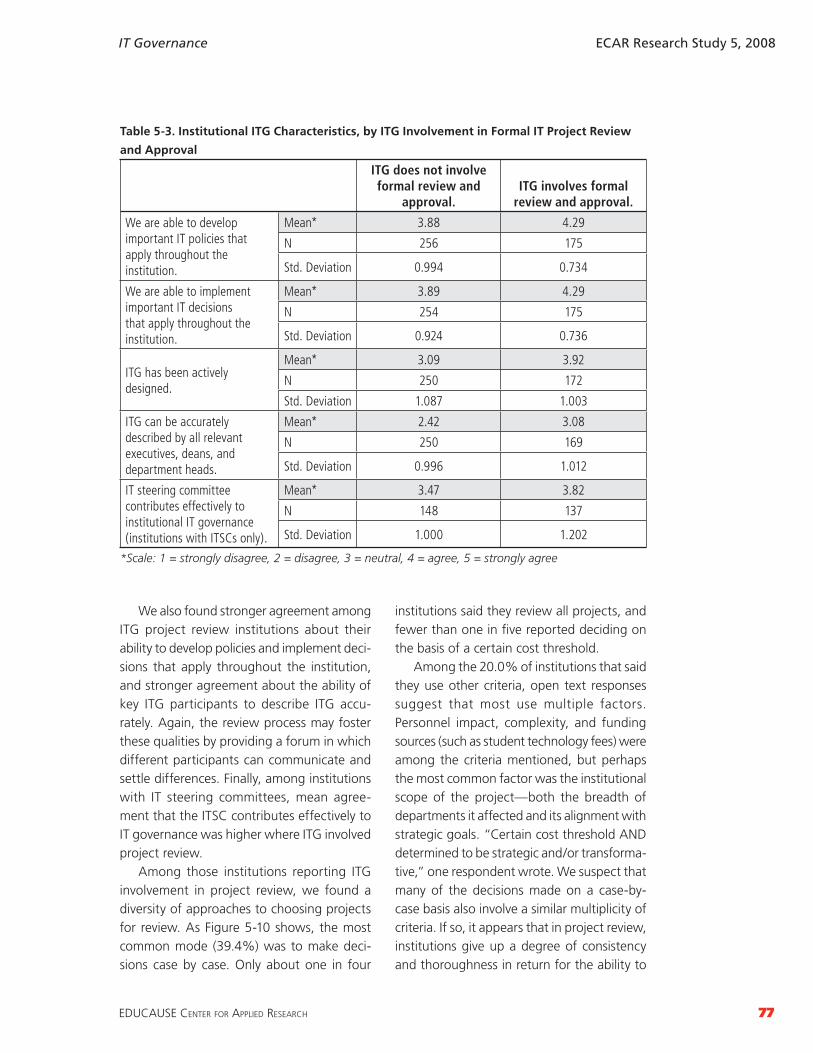
EDUCAUSE CENTER FOR APPLIED RESEARCH 77
IT Governance ECAR Research Study 5, 2008
We also found stronger agreement among ITG project review institutions about their ability to develop policies and implement deci-sions that apply throughout the institution, and stronger agreement about the ability of key ITG participants to describe ITG accu-rately. Again, the review process may foster these qualities by providing a forum in which different participants can communicate and settle differences. Finally, among institutions with IT steering committees, mean agree-ment that the ITSC contributes effectively to IT governance was higher where ITG involved project review.
Among those institutions reporting ITG involvement in project review, we found a diversity of approaches to choosing projects for review. As Figure 5-10 shows, the most common mode (39.4%) was to make deci-sions case by case. Only about one in four
institutions said they review all projects, and fewer than one in five reported deciding on the basis of a certain cost threshold.
Among the 20.0% of institutions that said they use other criteria, open text responses suggest that most use multiple factors. Personnel impact, complexity, and funding sources (such as student technology fees) were among the criteria mentioned, but perhaps the most common factor was the institutional scope of the project—both the breadth of departments it affected and its alignment with strategic goals. “Certain cost threshold AND determined to be strategic and/or transforma-tive,” one respondent wrote. We suspect that many of the decisions made on a case-by-case basis also involve a similar multiplicity of criteria. If so, it appears that in project review, institutions give up a degree of consistency and thoroughness in return for the ability to
Table 5-3. Institutional ITG Characteristics, by ITG Involvement in Formal IT Project Review
and Approval
ITG does not involve formal review and
approval.ITG involves formal
review and approval.
We are able to develop important IT policies that apply throughout the institution.
Mean* 3.88 4.29
N 256 175
Std. Deviation 0.994 0.734
We are able to implement important IT decisions that apply throughout the institution.
Mean* 3.89 4.29
N 254 175
Std. Deviation 0.924 0.736
ITG has been actively designed.
Mean* 3.09 3.92
N 250 172
Std. Deviation 1.087 1.003
ITG can be accurately described by all relevant executives, deans, and department heads.
Mean* 2.42 3.08
N 250 169
Std. Deviation 0.996 1.012
IT steering committee contributes effectively to institutional IT governance (institutions with ITSCs only).
Mean* 3.47 3.82
N 148 137
Std. Deviation 1.000 1.202
*Scale: 1 = strongly disagree, 2 = disagree, 3 = neutral, 4 = agree, 5 = strongly agree

78
IT Governance ECAR Research Study 5, 2008
balance various institutional demands and stay focused on strategic concerns.
While the front-end filtering involved in choosing projects for review is probably necessary and even productive, a more worri-some drop-off of attention once projects have been chosen for review suggests that some institutions struggle to assess project results (see Figure 5-11). Virtually all respon-dents where ITG was involved in project review (93.7%) said that their institutions evaluated projects for alignment with insti-tutional IT goals, and 8 out of 10 (79.7%) also evaluated them for compliance with IT architectural standards. Almost as many said they tracked the progress of projects once approved; but somewhat inconsistently, fewer said their process typically involved more than a single review (say, multiple reviews for concept, full proposal, and mile-stones), and only about 6 in 10 said that their reviews required assessing the results of completed projects. This contrast between
scrutiny at the front end and at the back end implies a break in the feedback loop that allows IT governance to discover where institutional goals are and aren’t being met, and it may compromise the ability to make appropriate corrections.
This relative decline in attention across the life span of projects, however, pales in signifi-cance to the finding we began this section with: IT governance involves formal review and approval of IT projects at only about 4 in 10 institutions. Yet as we’ve also reported here, ITG involvement in project review is strongly and positively associated with ITG maturity, design, participant knowledge-ability, and performance outcomes. Many of these items, as we’ll show in Chapter 6, are also associated with overall ITG performance. With its implications for mastering change management, risk management, and align-ment, project review appears to be a good place to start for institutions pursuing more effective IT governance.
17.1
20.0
23.4
39.4
0% 5% 10% 15% 20% 25% 30% 35% 40% 45%
Projects meeting a certain costthreshold
Projects meeting other specifiedcriteria
All projects
Decision made case by case
Percentage of Institutions Where ITG Is Involved in Project Review
Figure 5-10. How
Projects Are
Chosen for Review
(N = 175)
62.9
66.5
73.8
79.7
93.7
0% 10% 20% 30% 40% 50% 60% 70% 80% 90% 100%
Requires assessing the results ofcompleted projects (N = 170)
Typically involves more than a singlereview (N = 170)
Requires tracking the status ofprojects once approved (N = 172)
Evaluates projects for compliance withIT architectural standards (N = 172)
Evaluates projects for alignment withinstitutional IT goals (N = 175)
Percentage of Institutions Where ITG Is Involved in Project Review
Figure 5-11.
Project Review
Characteristics

EDUCAUSE CENTER FOR APPLIED RESEARCH 79
IT Governance ECAR Research Study 5, 2008
Participation in Institutional Budgetary Processes
It’s hard to make meaningful decisions about using IT to address institutional objec-tives in isolation from the decisions that allocate resources. Where the two are discon-nected, the danger of conflict between de jure and de facto priorities is always present; nothing indicates commitment like funding. But that divide appears to be a fact of life at many of our respondent institutions. As we noted in Figure 5-8, just under half of respon-dents told us that an institutional budget committee was involved in IT governance at their institutions. We also asked more broadly whether IT governance participated in insti-tutional budgetary processes, and not quite 6 in 10 institutions (58.0%) said that it did (see Figure 5-1).
This is unfortunate, because budget participation was associated with a wide array of ITG outcomes and desirable insti-tutional characteristics. As we’ll report in detail in Chapter 6, institutions where ITG participated in the budget process rated the overall effectiveness of ITG considerably higher and earned higher ITG performance scores. Likewise, as Table 5-4 shows, ITG participation was positively associated with
respondent agreement that their institutions were able to coordinate the activities of IT personnel effectively across the institu-tion, that ITG had been actively designed, and that key participants could accurately describe ITG.
We found no significant pattern for ITG participation in budgetary processes on the basis of Carnegie class, FTE enrollment, or private/public control.
Metrics and Performance Review
IT governance is typically described as an iterative and circular, not a linear, process. To meet the ultimate purpose of aligning IT to institutional strategic goals, institu-tions must be able to determine the degree of alignment at a given time, take steps to improve it where it’s lacking, and ascertain whether those steps are effective or further adjustment is needed. All of this implies agreed-on metrics that are collected on an ongoing basis, a management culture accustomed to using such inputs to make decisions, and a willingness to review not just discrete outcomes but the process of review itself. To Villanova University’s Fugale, good inputs are an essential part of a high-quality
Table 5-4. Institutional Characteristics, by ITG Participation in Budgetary Processes
ITG does not participate.
ITG participates.
We are able to coordinate the activities of IT personnel effectively throughout the institution.
Mean* 3.54 3.84
N 181 251
Std. Deviation 1.057 0.993
ITG has been actively designed.
Mean* 3.18 3.62
N 181 244
Std. Deviation 1.143 1.088
ITG can be accurately described by all relevant executives, deans, and department heads.
Mean* 2.36 2.92
N 180 243
Std. Deviation 1.039 0.991
*Scale: 1 = strongly disagree, 2 = disagree, 3 = neutral, 4 = agree, 5 = strongly agree

80
IT Governance ECAR Research Study 5, 2008
governance process. “Discussion cannot be purely complaint or anecdotes. You have to do your homework, and it’s clear when a committee member isn’t spending time on it. When committee members speak from a point of view that’s properly vetted, it mini-mizes personal agendas.”
Yet measurement and performance assessment seem to be elusive goals among many IT units, and perhaps for institutional administration generally. ECAR studies often find that institutions giving them-selves somewhat rosy self-assessments of important aspects of IT performance will nonetheless rate themselves more harshly on questions relating to metrics and their use in decision making. This study is no exception. For example, in Chapter 3 we reported the generally optimistic average assessments we collected on such items as agreement that business goals and IT are aligned (mean 4.00 on a 5-point scale), that academic goals and IT are aligned (3.86), and that institutions could implement important IT decisions that apply throughout the institution (4.04).
Compare these means to those in Table 5-5, which presents respondent agreement with a set of statements relating to the measurement of IT performance and its rela-tionship to IT management and governance.4 Most of the measures fall short of a neutral (= 3) mean response, and the one exception only slightly exceeds it. The statement that
attracted the largest combined agree and strongly agree (4 and 5) responses was that the institution agreed on measurable goals for IT (40.0%), while the statement attracting the least agreement was that the institu-tion regularly reviewed the effectiveness of IT governance processes (28.0%). Despite these variations, and as the narrow range of means suggests, these items tended to track together. That is, respondent answers were generally similar from one item to the next, and when one item was associated with some other study variable, most or all of the others often were as well.
We found statistically significant positive associations between all five of the measure-ment items shown in Table 5-5 and
clear articulation of institutional stra-tegic priorities,ability to implement important IT decisions that apply throughout the institution,ability to coordinate activities of IT personnel throughout the institution,existence of an IT steering committee,active design of IT governance, andability of key participants to describe IT governance accurately.
In addition, as we’ll report in Chapter 6, three measurement items—making IT deci-sions on the basis of results and performance, incorporating measurement and reporting into ITG, and regularly reviewing the effective-
◆
◆
◆
◆
◆
◆
Table 5-5. IT Measurement and Decision Making
At my institution... Mean* N Std. Deviation
We agree on measurable goals for IT. 3.13 433 1.056
We organize regular measurement and reporting of IT performance. 2.98 435 1.142
We make IT decisions on the basis of measured IT results and performance.
2.89 435 1.068
We incorporate measurement and reporting in our IT governance process.
2.93 434 1.093
We regularly review the effectiveness of IT governance processes. 2.77 433 1.057
*Scale: 1 = strongly disagree, 2 = disagree, 3 = neutral, 4 = agree, 5 = strongly agree

EDUCAUSE CENTER FOR APPLIED RESEARCH 81
IT Governance ECAR Research Study 5, 2008
ness of ITG processes—were all strongly asso-ciated with overall ITG effectiveness. Taken together, these associations suggest that the IT governance advisory literature’s emphasis on metrics-based performance assessment is well founded.
Not surprisingly, given these relationships, the institutions reporting higher levels of ITG maturity also tended to report higher—in fact, much higher—agreement about all of the measurement and performance review items. This was, however, something of a definitional certainty, since our survey ques-tions described higher levels of maturity with phrases such as “ITG processes are monitored and measured” and “there are provisions for amending processes.” Perhaps it is also due to the way our respondents think about matu-rity that where institutions had IT steering committees, all the measurement and review items were rated somewhat higher.
More notably, it ’s worth repeating here a finding we reported in Chapter 4 (Figure 4-3): There was a broad association between participation and the incorpora-tion of measurement and reporting in ITG. A similar association held for regular review of IT governance processes. In each case, respondents agreeing with the item reported higher mean frequency of participation by constituents, both for input and decision making, than those who disagreed or were neutral. It may be that a deliberate effort to bring measurement and review into ITG stimulates participation, both by requiring input from more parties and by raising the incentives for active engagement. Of course, it may also be that it’s easier to implement measurement and review where there is a culture of participation.
Comments from our qualitative inter-viewees were generally in accord with the quantitative results; a number of CIOs said that they wished the institutional culture was more receptive. “Sometimes I think this campus is measurement-averse,” said
one. But many also insisted that well-chosen metrics could achieve results even where the culture resisted a measurement-driven style of decision making. At the College of DuPage, Chuck Currier, vice president of information technology, says that he tries to be an agent for change, stemming from his background in manufacturing. “We did a small proof of concept for our invoicing process using methods I had learned previously,” Currier says. “We had an 80% improvement in our process. We’re trying to introduce that as a way of doing things.”
Cal Poly Pomona’s Brum notes that selective use of assessment has to balance project needs and the institution’s habits. “We have strong assessment tools for some projects,” she says, “but don’t use a formal assessment methodology for many of our projects. We have outcomes for each project subcommittee, assessing the degree to which they’ve completed their charge. But it’s not part of our culture to deliberately assess each governance decision.”
Besides asking about general practices relating to measurement and review, we wanted to know about specific kinds of metrics and tools our respondents use in IT governance. As Figure 5-12 shows, the results were largely parallel to the generally lackluster ratings about measurement and review shown in Table 5-5. While about three-quarters of our respondents (76.1%) used constituent satisfac-tion surveys in IT governance, this was the only item we asked about that a clear majority of respondents reported. External reviews and service level agreements were used in ITG at about half of institutions, while balanced scorecards, often mentioned in the context of governance,5 were reported by only about 1 in 10 institutions. In most cases, use of these tools was positively associated with higher respondent ratings in the measurement and decision-making items shown in Table 5-5.
In Chapter 3, we reported on institutions’ use of broad IT best practice frameworks

82
IT Governance ECAR Research Study 5, 2008
such as COBIT, ITIL, and the ISO 17799 and 9000 standards (see Figures 3-4 and 3-5). Even though respondents tended to make selective rather than thorough use of these frameworks, their use was associated with higher agreement on general measurement and review practices and higher incidence of the specific tools we asked about. It may be that when institutions look for ways to incorporate measurement and review into IT governance, they go to the frameworks for ideas about best practices and tools.
IT Governance CommunicationRespondents were generally positive if
not enthusiastic in their agreement that their institutions kept relevant constituencies well informed about IT governance and processes. As Figure 5-13 shows, a slight majority (52.0%) agreed or strongly agreed, while most of the rest (31.4%) were neutral rather than disagreeing. Agreement averaged 3.39 on our 5-point scale (1 = strongly disagree, 5 = strongly agree).
While these results hardly describe a dire situation, they do suggest that many institu-tions could improve their performance. And we found good reasons to believe that ITG communication is an area that makes a differ-ence. As we’ll report in Chapter 6, agreement on this item was strongly associated with overall ITG effectiveness. It also had a strong and positive association with the reported
ability of key participants to describe ITG accurately, itself another variable strongly associated with overall ITG effectiveness.
Respondents reported a wide range of methods used to communicate about IT governance processes and decisions (see Figure 5-14). Web documentation and announcements by senior leadership were the most often reported, but majorities also reported using staff and faculty orientations and faculty senate councils to spread the word. All of these methods were positively associated with agreement about keeping constituencies well informed; those institu-tions that used each method had higher mean agreement than those that did not. In addi-tion, the more of the methods that institutions reported using, the higher their agreement about keeping constituencies well informed tended to be.
Summary and Implications
Though we found a good deal of diver-sity among our respondents, we also found much evidence that formal mechanisms of IT governance, in the form of both commit-tees and processes, contribute to effective governance and institutional operations. ITG maturity was positively associated across the board with greater prevalence of major committees, as were such desirable circum-stances as better-informed ITG participants,
5.5
9.4
35.3
49.8
50.0
76.1
0% 10% 20% 30% 40% 50% 60% 70% 80%
Malcolm Baldrige process and criteria(N = 418)
Balanced scorecard(N = 424)
Institution-designed performance measures(N = 422)
Service level agreements(N = 432)
External review of the IT function(N = 430)
Constituent satisfaction surveys(N = 431)
Percentage of Institutions
Figure 5-12. IT
Performance
Metric Tools Used
in IT Governance

EDUCAUSE CENTER FOR APPLIED RESEARCH 83
IT Governance ECAR Research Study 5, 2008
designed rather than accidental IT gover-nance processes, ability to carry out institu-tion-wide activities, and coordination of IT personnel across the institution. Surprisingly, if committees add to bureaucratic delay, it was not reflected in our results, where institutions with IT steering committees and other common forums rated ITG timeliness higher than did those that lacked them. Institutions with these mechanisms also gave higher ratings to their ability to build support for IT through inclusion.
Not all committees were created equal. Board of trustees technology subcommittees were not common, and where they did exist they were not significantly associated with
important differences in outcomes. If institu-tions with IT steering committees tended to think they did a better job in many areas, none of these were significantly affected by the chairmanship or institutional-versus-central IT scope of the ITSC. In each case, however, we found interviewees who felt that choices made in these areas helped shape IT gover-nance better to institutional culture, and so made it more effective.
If committees are the building blocks of IT governance, processes are the mortar. Here, too, having processes in place tended to accompany greater maturity and better outcomes. Participation in the institutional budget process and ITG involvement in
5.3
11.2
31.4
43.3
8.7
0%
5%
10%
15%
20%
25%
30%
35%
40%
45%
50%
Strongly disagree Disagree Neutral Agree Strongly agree
Perce
ntage
of In
stitut
ions
Figure 5-13.
Constituencies
Are Kept Well
Informed about
ITG Decisions and
Processes
(N = 436)
39.6
58.6
66.2
75.7
85.8
87.6
0% 10% 20% 30% 40% 50% 60% 70% 80% 90% 100%
Campus newspaper (N = 399)
Faculty senate/council (N = 406)
Staff/faculty orientation (N = 408)
Periodic newsletters/e-mails (N = 416)
Senior leadership announcements (N = 422)
Documentation on web (N = 427)
Percentage of Institutions
Figure 5-14.
Methods Used
to Communicate
about IT
Governance
Processes and
Decisions

84
IT Governance ECAR Research Study 5, 2008
project review were both part of the matrix of good practices associated with better cross-institutional coordination, ITG design, and participant knowledgeability. But the “killer processes” we identified were the incorporation of performance measurement and review into ITG, and keeping constitu-ents well informed about IT governance processes and decisions. These items were strongly associated not only with ITG-related institutional characteristics but also with ITG effectiveness overall.
Perhaps it will seem self-evident that well-known best practices should turn out to be at least good practices. But the generally low levels of ITG maturity we discovered, highlighted by key areas of weak or mediocre self-assessed performance, suggest that such practices ought, indeed, to form an action list for many institutions. Four in 10 institutions report IT governance that is uninvolved in institutional budget processes, and 6 in 10 lack involvement in project review. Another 40% or so disagree that their institutions incorporate measurement and review into ITG, and half either disagree or are merely neutral about whether they keep constituents well informed. While cultural issues may block aggressive change in some of these areas, others, including some of the
potentially most influential, are more readily implemented or improved. These suggest good starting places for a march toward more mature and effective IT governance.
Endnotes1. The terms in quotes and explanations of them can
be found, respectively, in IT Governance Institute, Board Briefing on IT Governance, 2nd ed. (Rolling Meadows, IL: IT Governance Institute, 2003), 10; Steven De Haes and Wim Van Grembergen, “IT Governance and Its Mechanisms,” Information Systems Control Journal 1 (2004); and Peter Weill and Jeanne Ross, IT Governance: How Top Performers Manage IT Decision Rights for Superior Results (Boston: Harvard Business School Press, 2004), 85–116.
2. IT Governance Institute, Board Briefing, 10.3. Ibid., 16; see also 53–57.4. Several of these items, including agreement on
IT goals, regular measurement and reporting of IT performance, and making decisions on the basis of measured results and performance, were adapted from items described in Tomi Dahlberg and Pirkko Lahdelma, “IT Governance Maturity and IT Outsourcing Degree: An Exploratory Study,” Proceedings of the 40th Annual Hawaii International Conference on Systems Sciences (Los Alamitos, CA: IEEE Computer Society, 2007).
5. Wim Van Grembergen, “The Balanced Scorecard and IT Governance,” Information Systems Control Journal 2 (2000), http://www.isaca.org/Template .cfm?Section=Home&CONTENTID=17467&TEMPLATE =/ContentManagement/ContentDisplay.cfm.
EDUCAUSE CENTER FOR APPLIED RESEARCH 85
IT Governance ECAR Research Study 5, 2008
©2008 EDUCAUSE. Reproduction by permission only.
Our respondent institutions embodied all of the diversity of mission, public/private control, organizational structures, and cultures that typify North American higher education. As we’ve noted from time to time in this study, there is plenty of room, and plenty of direction from common sense, to adapt IT governance structures to institutional needs and norms.
Yet we also thought it was important to identify practices that seem to be associated with good IT outcomes across this diverse and numerous group. In this chapter we look at how good a job respondent institutions think they’re doing with IT governance and what factors distinguish better from weaker performers.
6IT Governance Performance
and Effectiveness
We ain’t all bookworms and college professors. If we were,Tammany might win an election once in four thousand years.
—George Washington Plunkitt
Key FindingsMost institutions reported moderately good IT governance performance and agree that ITG was effective at their institutions. Performance and effectiveness were higher, however, among institutions reporting higher levels of ITG maturity.Among our respondents, IT governance performance and effectiveness were posi-tively associated with frequent constituent participation, effective communication of ITG decisions and processes, and the ability of key participants to describe ITG accurately.Processes and mechanisms strongly associated with good ITG outcomes included the active design of ITG, participation in institutional budgetary processes, involve-ment in project review, and the incorporation of measurement and review into ITG. Institutions reporting that they had an IT steering committee did modestly better than those without one.Respondents characterizing the factors responsible for successful ITG outcomes tended to favor people over processes: Relationship-oriented factors such as leadership support, skills/personalities of key individuals, and participation of stakeholders were the top success items chosen. Structures and processes were, however, more promi-nent in the factors selected for unsuccessful ITG outcomes, suggesting that respon-dents often feel the impact of these items through their absence or inadequacy.
◆
◆
◆
◆

86
IT Governance ECAR Research Study 5, 2008
We measured IT governance outcomes using several different but parallel approaches:
First, we asked respondents to rate the importance they assigned to effective use of IT in key areas of institutional performance, and the influence they thought IT governance had in each area. We combined these inputs to create an overall IT governance perfor-mance score.Separately, we asked respondents to report their level of agreement with two statements: that ITG at their insti-tution was effective overall, and that it balanced institutional and local/depart-mental needs.Finally, we provided lists of reasons for successful and unsuccessful outcomes in IT governance and asked respon-dents to choose the ones they thought were typically most responsible for each type of outcome.
In the following sections, we’ll report in depth on the main outcome measures described in the first two bullet points above (performance score, ITG effectiveness, and institutional/local balance) and the charac-teristics we found strongly associated with them. Then we’ll investigate our respondents’ perceptions about success and failure in ITG to see how they line up with the patterns in the empirical outcomes results.
It’s important to note that we haven’t attempted to report here every statistically significant finding we discovered related to ITG outcomes. We focus instead on the stron-gest relationships and those of special interest, with an eye toward identifying actions institu-tions might take in designing and managing IT governance.
Performance and Effectiveness: An Overview
Respondents painted a generally opti-mistic portrait of IT governance’s influence
◆
◆
◆
on institutional performance and of its overall effectiveness and ability to balance institu-tional and local needs. Before we begin to unpack how institutions differed in these areas and what seemed to influence those differences, we start with an overview.
IT Governance Performance Score
To create a score that could be used to compare institutional performance in IT governance, we asked respondents about four institutional outcomes:
cost-effective use of IT,effective use of IT to enhance teaching and learning,effective use of IT to enhance research, andeffective use of IT to enhance admin-istrative processes.
In each case, respondents used a 5-point scale to rate the importance of the outcome at their institutions, and how influential IT governance was in producing that outcome.1 The importance rating helped us calculate performance scores that reflected how institu-tions were doing relative to their own needs. For example, a university might rate the impor-tance of enhancing research at 5 (very impor-tant), and a community college might rate it at 1 (not important). If both rate the influence of ITG on enhancing research as a 3 (midrange on the influence scale), the university is not performing as well, relative to the importance of the goal, as the community college, even though its influence rating is the same.
We calculated an institution’s ITG perfor-mance score according to the following steps:
Multiplied each individual outcome importance rating by 5, the highest possible influence rating, and summed the results. This gave the maximum possible performance total an institu-tion could receive.Multiplied each individual outcome importance rating by the corresponding
◆
◆
◆
◆
◆
◆
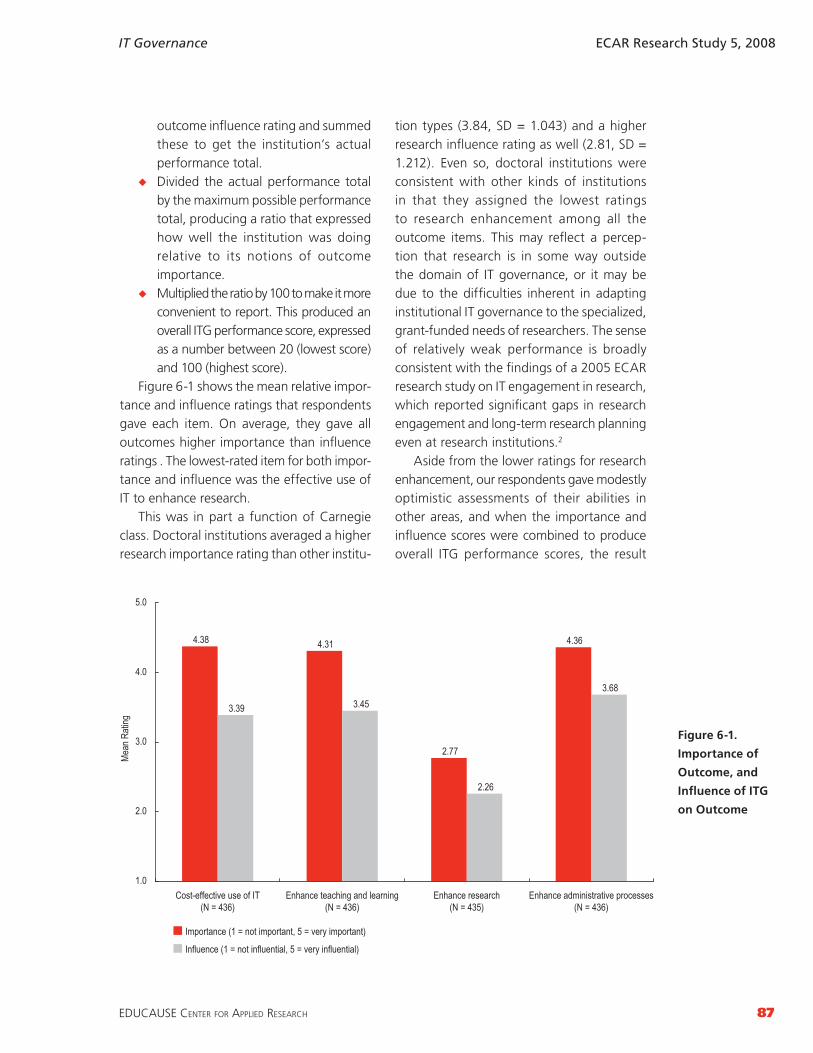
EDUCAUSE CENTER FOR APPLIED RESEARCH 87
IT Governance ECAR Research Study 5, 2008
outcome influence rating and summed these to get the institution’s actual performance total.Divided the actual performance total by the maximum possible performance total, producing a ratio that expressed how well the institution was doing relative to its notions of outcome importance.Multiplied the ratio by 100 to make it more convenient to report. This produced an overall ITG performance score, expressed as a number between 20 (lowest score) and 100 (highest score).
Figure 6-1 shows the mean relative impor-tance and influence ratings that respondents gave each item. On average, they gave all outcomes higher importance than influence ratings . The lowest-rated item for both impor-tance and influence was the effective use of IT to enhance research.
This was in part a function of Carnegie class. Doctoral institutions averaged a higher research importance rating than other institu-
◆
◆
tion types (3.84, SD = 1.043) and a higher research influence rating as well (2.81, SD = 1.212). Even so, doctoral institutions were consistent with other kinds of institutions in that they assigned the lowest ratings to research enhancement among all the outcome items. This may reflect a percep-tion that research is in some way outside the domain of IT governance, or it may be due to the difficulties inherent in adapting institutional IT governance to the specialized, grant-funded needs of researchers. The sense of relatively weak performance is broadly consistent with the findings of a 2005 ECAR research study on IT engagement in research, which reported significant gaps in research engagement and long-term research planning even at research institutions.2
Aside from the lower ratings for research enhancement, our respondents gave modestly optimistic assessments of their abilities in other areas, and when the importance and influence scores were combined to produce overall ITG performance scores, the result
4.38 4.31
2.77
4.36
3.39 3.45
2.26
3.68
1.0
2.0
3.0
4.0
5.0
Cost-effective use of IT(N = 436)
Enhance teaching and learning(N = 436)
Enhance administrative processes(N = 436)
Mean
Rati
ng
Importance (1 = not important, 5 = very important)
Influence (1 = not influential, 5 = very influential)
Enhance research(N = 435)
Figure 6-1.
Importance of
Outcome, and
Influence of ITG
on Outcome

88
IT Governance ECAR Research Study 5, 2008
was roughly bell shaped but skewed toward the upper end of the scale (see Figure 6-2). The mean performance score was 67.7 (SD = 19.128), and the median was 70. Three-quarters of respondents scored above the scale midpoint at 60, while the top one-third of institutions scored above 76.3
ITG Effectiveness, and Balance of Institutional and Local Needs
ITG performance scores correlated closely with respondent ratings of the overall effec-tiveness of IT governance, so it’s not surprising that the latter showed the same general pattern of positive assessment. As Figure 6-3 shows, about two-thirds of respondents (64.4%) agreed or strongly agreed that IT governance was effective overall, and most of the rest were neutral. Respondents gave very similar ratings to the statement that ITG balances institutional and local or depart-mental needs.
This rather rosy picture of IT governance
stood somewhat in tension with our finding, reported in Chapter 3 (Figure 3-1), that insti-tutions characterized ITG maturity at low or middle levels. Does this mean that maturity isn’t related to effectiveness—that some institutions with low maturity nonetheless feel they have enough to be effective?
This may be the case for a few. Of the small group of seven that reported nonexistent ITG, for example, four nonetheless agreed that ITG was effective overall at their institu-tion. But on the whole, maturity was strongly associated with effectiveness, as it was with ITG performance score and institutional/local balance (see Table 6-1). Each of them was higher among institutions having higher ITG maturity. Interestingly, we found no significant associations between these outcomes and Carnegie class, FTE enrollment, or private/public control. Maturity, with its implications that governing IT means creating formal mechanisms and processes, did, then, seem to be a factor in how well ITG performed at our respondent institutions.
5.3
3.5
7.48.6
24.1
22.2
16.7
12.3
0%
5%
10%
15%
20%
25%
30%
20–29 30–39 40–49 50–59 60–69 70–79 80–89 90–100
ITG Performance Score
Perce
ntage
of In
stitut
ions
Figure 6-2. IT
Governance
Performance Score
(N = 432)

EDUCAUSE CENTER FOR APPLIED RESEARCH 89
IT Governance ECAR Research Study 5, 2008
4.2 3.9
9.37.2
22.1
17.9
47.0
52.4
17.4 18.6
0%
10%
20%
30%
40%
50%
60%Pe
rcenta
ge of
Insti
tution
s
Strongly disagree
Disagree
Neutral
Agree
Strongly agree
ITG is effective overall (N = 430) ITG balances institutional and local/departmental needs (N = 431)
Figure 6-3. ITG
Effectiveness and
Institutional/Local
Balance
Table 6-1. ITG Performance Score, Effectiveness, and Institutional/Local Balance, by
Maturity Level
Maturity Level ITG performance
score*ITG is effective
overall.**
ITG balances institutional and local/departmental
needs.**
Nonexistent/Initial
Mean 57.11 3.04 3.36
N 128 131 131
Std. Deviation 20.426 1.091 1.164
Repeatable/Defined
Mean 69.54 3.76 3.80
N 233 229 230
Std. Deviation 16.648 0.867 0.834
Managed/Optimized
Mean 80.54 4.37 4.30
N 71 70 70
Std. Deviation 13.917 0.569 0.645
Total
Mean 67.66 3.64 3.74
N 432 430 431
Std. Deviation 19.128 1.009 0.972
*Scale: 20 (low) to 100 (high)
**Scale: 1 = strongly disagree, 5 = strongly agree

90
IT Governance ECAR Research Study 5, 2008
What Affects ITG Outcomes?
Institutions that did well in our IT gover-nance performance scoring and that gave high marks to their effectiveness and balance of institutional/local needs also tended to share other characteristics that made up a sort of constellation of IT governance success. Some of these characteristics may just be alternate ways of saying that IT is governed well. For example, we found that institutions that had better ITG outcomes tended also to agree more strongly that their institutions were able to conduct activities throughout the institu-tion, such as
developing important IT policies (for example, security, privacy, and business continuity);implementing important IT decisions; andcoordinating the activities of IT personnel effectively.
In addition, institutions whose CIOs were members of the cabinet tended to report slightly better overall ITG effectiveness. Good ITG performers also tended to agree more strongly that institutional business and academic goals were aligned with IT.
It’s impossible to distinguish chicken from egg in these relationships—that is, whether these characteristics are causes or effects, or a mixture of the two, of good IT governance. But it is hard not to favor the notion that these are just the kinds of ends that institutions try to accomplish when they turn to formal IT governance. In the following sections, we’ll look at structures and processes that are strongly associated with good IT governance outcomes and that might inform a practical IT governance program—in short, “things you can do something about.”
ITG Processes and CommitteesFrom time to time in this study, we’ve
noted assorted variables that are positively associated with respondent agreement that
◆
◆
◆
IT governance at their institutions was actively designed. This may seem like a minor point, given that one might expect the more impor-tant factors in governance to be less ambig-uous or vague, such as inclusion in a budget process or a CIO’s cabinet status. Design, after all, can lead in many directions; presumably active design can be bad design.
Yet, in common with others studying IT governance, we found that respondent agreement about active design had one of the strongest associations with perceived IT governance effectiveness of all the variables we examined.4 As Table 6-2 shows, it was also strongly related to the ITG performance score and institutional/local balance.
What’s so great about active design? In some cases, it may just be a case of some-thing being better than nothing. But we suspect that active design is often a matter of introducing a simpler and more orderly “something” where a patchwork of uncoor-dinated processes has previously held sway. Higher education institutions are notorious for creating ad hoc processes that live on beyond their original mandates, often getting repurposed and linked together through what might be called “passive design.”
While such systems might enjoy a sort of organic connection to the institution and function well for a time, because they aren’t purpose-built they are likely to suffer from redundancies, obsolete or ill-defined respon-sibilities, exposure to loss of key personnel, and other deficiencies. We speculate that active design tends to rationalize such systems and replace diffusion with focus. As Weill and Ross note in relation to the organiza-tions they studied, “Patching up problems as they arise is a defensive tactic that limits opportunities for strategic impact from IT. Instead, management should actively design IT governance around the enterprise’s objec-tives and performance goals.”5 Active design also implies participation, communication, and measurement—all practices that, as we

EDUCAUSE CENTER FOR APPLIED RESEARCH 91
IT Governance ECAR Research Study 5, 2008
report later, are strongly associated with posi-tive ITG outcomes.
Active design (including periodic rede-sign), in short, deserves to be considered one of the key processes of IT governance, even if different institutions design different ITG structures. That’s not to say that ITG outcomes are process- or mechanism-neutral. As Table 6-3 shows, ITG participation in the institutional budgetary process and ITG review and approval of IT projects were both positively associated with better performance, overall effectiveness, and institutional/local balance. These results suggest that ITG benefits from being “active” in another way—enjoying the influence that comes from engagement with budget discussions and project prioritization.
We also found several associations between the existence of specific commit-tees and better ITG outcomes, though none of these was as strong as the relationships involving active design, participation in the budgeting process, and project review. Institutions that reported having an IT steering committee (ITSC) averaged higher results on all of our three outcome measures than those without one, and those whose
ITSCs had institution-wide scope did a little better than those dealing mainly with central IT issues. So, too, did those with ITSCs whose role was to set priorities and policies, compared with those lacking such powers. As for committees besides the ITSC, there was a modest correlation between a greater number of such committees (among the committee types we asked about) and better ITG outcomes.
ParticipationIn Chapter 4, we looked at our respon-
dents’ ratings of how frequently different kinds of participants provided input or made final decisions in different ITG decision-making domains. Our questions specified nine different kinds of participants and asked respondents to rate each one’s frequency of participation in input or decision making regarding five decision domains, yielding 45 ratings for input and another 45 for deci-sion making. (See Tables 4-1 and 4-2 for the detailed results.) We noted that having a higher level of frequent participation was positively associated with such other factors as ITG maturity, active design of ITG and key participant ability to describe it accurately,
Table 6-2. ITG Performance Score, Effectiveness, and Institutional/Local Balance, by Active Design of ITG
ITG at my institution has been actively designed.
ITG performance score*
ITG is effective overall.**
ITG balances institutional and local/departmental needs.**
Strongly disagree/disagree
Mean 55.54 3.02 3.30
N 102 104 105
Std. Deviation 20.451 1.061 1.102
Neutral
Mean 67.60 3.50 3.63
N 91 92 90
Std. Deviation 18.600 1.074 1.043
Agree/strongly agree
Mean 73.09 3.98 3.99
N 229 225 226
Std. Deviation 16.343 0.810 0.794
*Scale: 20 (low) to 100 (high)
**Scale: 1 = strongly disagree, 5 = strongly agree

92
IT Governance ECAR Research Study 5, 2008
IT alignment, and the use of measurement in ITG.
Given this background, it was hardly surprising to find positive associations with IT governance outcomes as well. Even so, the extent of the relationship was striking. For ITG input, every combination of participant and decision domain was significantly related to ITG performance score: Institutions reporting higher levels of participation had higher scores. For ITG decision making, higher ITG performance scores were associated with higher participation in 41 of the 45 partici-pant/decision domain combinations.
Because there were so many different combi-nations of participants and decision domains, we created summary measures to characterize overall input and decision-making participa-tion.6 As Table 6-4 shows, higher means in these measures were strongly associated with higher ITG performance, ITG effectiveness, and institutional/local balance outcomes.
This finding suggests that frequent partici-pation across constituencies should be valued not simply for the sake of appearances, but also because it is actually related to improved IT governance performance. As we noted in Chapter 4, there are no doubt some limits to how much participation a governance process can handle; ITG, in the end, is about making decisions, not collecting viewpoints. In their study of IT governance, Weill and Ross recommend as a default or starting position “federal” arrangements representing multiple levels of the organization for input, but they warn against these arrangements for decision making because of the potential confusion that results from trying to recon-cile too many conflicting interests. Instead, they recommend (again as a default) more focused “duopoly” or joint decision-making arrangements that involve IT with the busi-ness leaders concerned with the particular issue being resolved.7
Table 6-3. ITG Performance Score, Effectiveness, and Institutional/Local Balance, by
Involvement in Budgetary Process and Project Review
ITG performance score*
ITG is effective overall.**
ITG balances institutional and local/departmental needs.**
Does IT governance at your institution participate in institutional budgetary processes?
No
Mean 61.96 3.24 3.43
N 179 180 180
Std. Deviation 19.859 1.076 1.073
Yes
Mean 71.93 3.93 3.97
N 251 248 249
Std. Deviation 17.300 0.853 0.827
Does IT governance at your institution involve formal review and approval of IT projects?
No
Mean 63.32 3.42 3.60
N 252 254 253
Std. Deviation 19.420 1.052 1.040
Yes
Mean 73.74 3.97 3.95
N 174 172 173
Std. Deviation 17.038 0.848 0.827
*Scale: 20 (low) to 100 (high)
**Scale: 1 = strongly disagree, 5 = strongly agree

EDUCAUSE CENTER FOR APPLIED RESEARCH 93
IT Governance ECAR Research Study 5, 2008
Our data are not granular enough to distinguish between federal, joint/duopoly, or other kinds of arrangements, because the participation we asked about might be taking place in a small number of highly inclusive processes, a larger number of more restricted ones, or a combination of the two. But we suspect that organizational dynamics drive ITG in higher education toward federal arrangements to a greater degree than would be found elsewhere.8 Both structurally and culturally, higher education institutions are places where authority is devolved, consensus is valued, and collaboration is a practical
necessity. Strategic goals often call for opti-mizing creativity and expressing community values rather than realizing efficiency or return on assets. Some of the biggest headaches in a higher education CIO’s life flow from what Weill and Ross call “feudal” arrangements—business units acting independently without coordination. Federal IT governance, for all its weaknesses, may be a good compromise position in these circumstances.
What does seem clear is that frequent participation overall travels together with ITG performance. Keeping cards close to the vest, or trying to preserve too much IT
Table 6-4. ITG Performance Score, Effectiveness, and Institutional/Local Balance, by Overall
Participation in ITG Input and Decision Making
ITG performance
score*ITG is effective
overall.**ITG balances institutional and local/departmental needs.**
Mean Input Participation (1 = very rarely or never, 5 = very frequently or always)
Less than 2.5
Mean 53.34 3.16 3.33
N 76 76 75
Std. Deviation 18.889 1.071 1.018
2.5–3.5
Mean 68.63 3.62 3.72
N 265 265 265
Std. Deviation 17.647 0.975 0.979
Greater than 3.5
Mean 77.75 4.12 4.17
N 86 84 86
Std. Deviation 15.785 0.827 0.739
Mean Decision-Making Participation (1 = very rarely or never, 5 = very frequently or always)
Less than 2.5
Mean 58.60 3.39 3.51
N 145 145 146
Std. Deviation 20.073 1.107 1.097
2.5–3.5
Mean 70.51 3.67 3.79
N 236 235 235
Std. Deviation 16.691 0.915 0.900
Greater than 3.5
Mean 82.11 4.28 4.27
N 44 43 44
Std. Deviation 14.992 0.766 0.694
*Scale: 20 (low) to 100 (high)
**Scale: 1 = strongly disagree, 5 = strongly agree

94
IT Governance ECAR Research Study 5, 2008
dominance in decisions appropriate for a governance process, would therefore appear to be counterproductive. Furthermore, as we note later, communication is a critical compo-nent of ITG success, and active participants are in a good position to both receive and propagate information about ITG processes and decisions. Keeping in mind that every institution will find it necessary to shape governance to suit its circumstances and culture, it seems that encouraging frequent participation from many constituents is a good default policy, and it may well be prudent to err on the side of more rather than less participation.
Measurement and ReviewThe ITG literature puts a strong emphasis
on performance measurement and review. Because governance encompasses many interests and makes high-level decisions, it needs data inputs that can be compared across units and over time, and it must work at a relatively high level of abstraction that synthesizes many detailed processes. Collecting metrics feeds this process; employing them (perhaps the more difficult challenge) realizes it.
In Chapter 5, we reported that incor-poration of measurement and review into ITG processes was associated with better coordination of institution-wide activities, more active ITG design, and ability of key participants to describe ITG accurately. We can also extend this principle to our ITG outcomes measures, which were strikingly consistent with (though not proof of) the literature’s assertion that measurement and reporting improve IT governance.
This relationship was evident for all of our outcomes measures (see Table 6-5), but a look at mean agreement that ITG was effec-tive best makes the case. On three different measurement-related propositions—that the institution makes IT decisions on the basis of measured IT results and performance, that
it incorporates measurement and reporting into ITG, and that it regularly reviews the effectiveness of ITG processes—respon-dents disagreeing had mean overall ITG effectiveness ratings of between 0.78 and 0.91 points lower (on a 5-point scale) than those who agreed.
This is especially noteworthy because insti-tutions generally gave themselves unimpres-sive marks for measurement and reporting (see Table 5-5). To reiterate a point we made in Chapter 5, although the cultural and practical challenges of instituting a regime of empirically based decision making may be considerable, institutions that overcome them may realize a handsome payoff. It’s an area, in short, where there is both reason and room for improvement.
CommunicationA final area that deserves special mention
for its strong association with ITG outcomes is the effective communication of ITG infor-mation. As Table 6-6 shows, respondents who thought their institutions kept relevant constituents well informed about IT gover-nance processes and decisions did better across all outcome measures than those who disagreed.
Furthermore, another finding implies the special importance of making key partici-pants knowledgeable about IT governance. Respondents who disagreed that relevant executives, deans, and department heads could accurately describe IT governance at their institutions averaged overall ITG effec-tiveness ratings over a point lower (on a 5-point scale) than those who agreed. This simple precondition to informed participa-tion proved to have the strongest association with overall ITG effectiveness of all of the nonoutcome variables in the study. (Weill and Ross’s classic IT governance study reported a similar finding.9) The association was similar, though slightly weaker, for ITG performance and institutional/local balance.

EDUCAUSE CENTER FOR APPLIED RESEARCH 95
IT Governance ECAR Research Study 5, 2008
Table 6-5. ITG Performance Score, Effectiveness, and Institutional/Local Balance, by Use of
Measurement and Review
At my institution...ITG performance
score*ITG is effective
overall.**ITG balances institutional and local/departmental needs.**
We make IT decisions on the basis of measured IT results and performance.
Strongly disagree/disagree
Mean 59.04 3.20 3.39
N 168 170 171
Std. Deviation 19.814 1.102 1.124
Neutral
Mean 68.80 3.72 3.85
N 114 112 113
Std. Deviation 16.541 0.841 0.782
Agree/strongly agree
Mean 76.56 4.11 4.10
N 148 147 146
Std. Deviation 15.805 0.741 0.718
We incorporate measurement and reporting in our IT governance process.
Strongly disagree/disagree
Mean 58.55 3.25 3.41
N 166 167 169
Std. Deviation 20.582 1.134 1.105
Neutral
Mean 70.26 3.69 3.89
N 102 101 101
Std. Deviation 16.564 0.869 0.847
Agree/strongly agree
Mean 75.33 4.03 4.02
N 161 160 159
Std. Deviation 14.979 0.756 0.750
We regularly review the effectiveness of IT governance processes.
Strongly disagree/disagree
Mean 59.08 3.25 3.49
N 181 181 182
Std. Deviation 20.751 1.100 1.050
Neutral
Mean 71.63 3.75 3.80
N 126 126 127
Std. Deviation 15.168 0.894 0.891
Agree/strongly agree
Mean 76.25 4.13 4.08
N 121 120 119
Std. Deviation 14.848 0.660 0.783
*Scale: 20 (low) to 100 (high)
**Scale: 1 = strongly disagree, 5 = strongly agree

96
IT Governance ECAR Research Study 5, 2008
Successful and Unsuccessful ITG Outcomes: Respondent Views
The empirical relationships we noted earlier strongly suggest that among the factors that matter to ITG success are active design; involvement in certain institutional processes; the incorporation of measurement and review; and effective communication and knowledgeable, engaged participants. But is this how IT administrators see it? Do they acknowledge these factors of ITG success?
To find out, and to explore some possible elements of success that other questions didn’t include, we asked respondents to choose the three factors typically most responsible for successful and unsuccessful ITG outcomes at their institutions. As with all such questions, the “pick three” limitation may have forced some respondents to leave out factors they thought relevant, but it also required them to prioritize their responses to some degree.
The results, shown in Figures 6-4 and 6-5, broadly agree with our findings related to ITG performance score, overall ITG effectiveness,
Table 6-6. ITG Performance Score, Effectiveness, and Institutional/Local Balance, by
Knowledge and Communication Measures
At my institution...ITG performance
score*ITG is effective
overall.**
ITG balances institutional and local/departmental needs.**
Relevant constituencies are kept well informed about IT governance processes and decisions.
Strongly disagree/disagree
Mean 59.81 3.01 3.23
N 70 70 71
Std. Deviation 21.380 1.268 1.333
Neutral
Mean 62.32 3.36 3.60
N 135 134 135
Std. Deviation 19.808 0.961 0.964
Agree/strongly agree
Mean 73.64 4.01 4.00
N 225 224 223
Std. Deviation 15.586 0.766 0.726
IT governance can be accurately described by all relevant executives, deans, and department heads.
Strongly disagree/disagree
Mean 60.24 3.16 3.36
N 195 197 198
Std. Deviation 20.278 1.069 1.080
Neutral
Mean 70.17 3.83 3.88
N 123 122 121
Std. Deviation 15.865 0.789 0.787
Agree/strongly agree
Mean 78.25 4.31 4.31
N 102 99 100
Std. Deviation 14.682 0.617 0.563
*Scale: 20 (low) to 100 (high)
**Scale: 1 = strongly disagree, 5 = strongly agree

EDUCAUSE CENTER FOR APPLIED RESEARCH 97
IT Governance ECAR Research Study 5, 2008
and institutional/local balance. But they also suggest that respondents feel the absence of some of the most important factors more often than they enjoy their presence.
The top items chosen as success factors (Figure 6-4) could be summarized with the phrase “the political is the personal.” Each of them—support of executive leadership, skills and personalities of key individuals, and inclusion/participation of stakeholders—reflected a perceived need to mobilize people and maintain relationships. So too did the fourth item—informal relationships among concerned parties—which stood well above the items reflecting the more structural and procedural aspects of ITG, such as formal ITG
structures and processes, communication, and performance metrics and frameworks.
The results for success aligned with our finding about the association between participation and good ITG outcomes, but they depart from the still stronger associa-tions with communications and performance measurement. In fact, only 14.8% of respon-dents identified communications as one of their chosen three success factors, and fewer than 2%—6 out of 438 respondents—chose performance metrics/frameworks.
Yet these factors were far more promi-nent in the results regarding unsuccessful outcomes (Figure 6-5). Here again, practical politics took the lead, with noninclusion of
1.8
14.8
18.5
21.9
43.2
59.4
61.4
63.9
0% 10% 20% 30% 40% 50% 60% 70%
Performance metrics/frameworks
Communication of IT governance processes and decisions
Formal IT governance structures and processes
Guidance from institutional strategic objectives
Informal relationships among concerned parties
Inclusion/participation of stakeholders
Skills/personalities of key individuals
Support of executive leadership
Percentage of Institutions
Figure 6-4. Factors
Typically Most
Responsible for
Successful ITG
Outcomes
(N = 438)
Figure 6-5. Factors
Typically Most
Responsible for
Unsuccessful ITG
Outcomes
(N = 438)
18.5
25.1
26.7
29.0
30.8
33.3
34.0
48.9
0% 10% 20% 30% 40% 50% 60%
Informal relationships among concerned parties
Absence or inadequacy of performancemetrics/frameworks
Lack of guidance from institutional strategic objectives
Absence or inadequacy of formal ITgovernance structures and processes
Failure to communicate IT governanceprocesses and decisions
Lack of support of executive leadership
Skills/personalities of key individuals
Noninclusion/nonparticipation of stakeholders
Percentage of Institutions
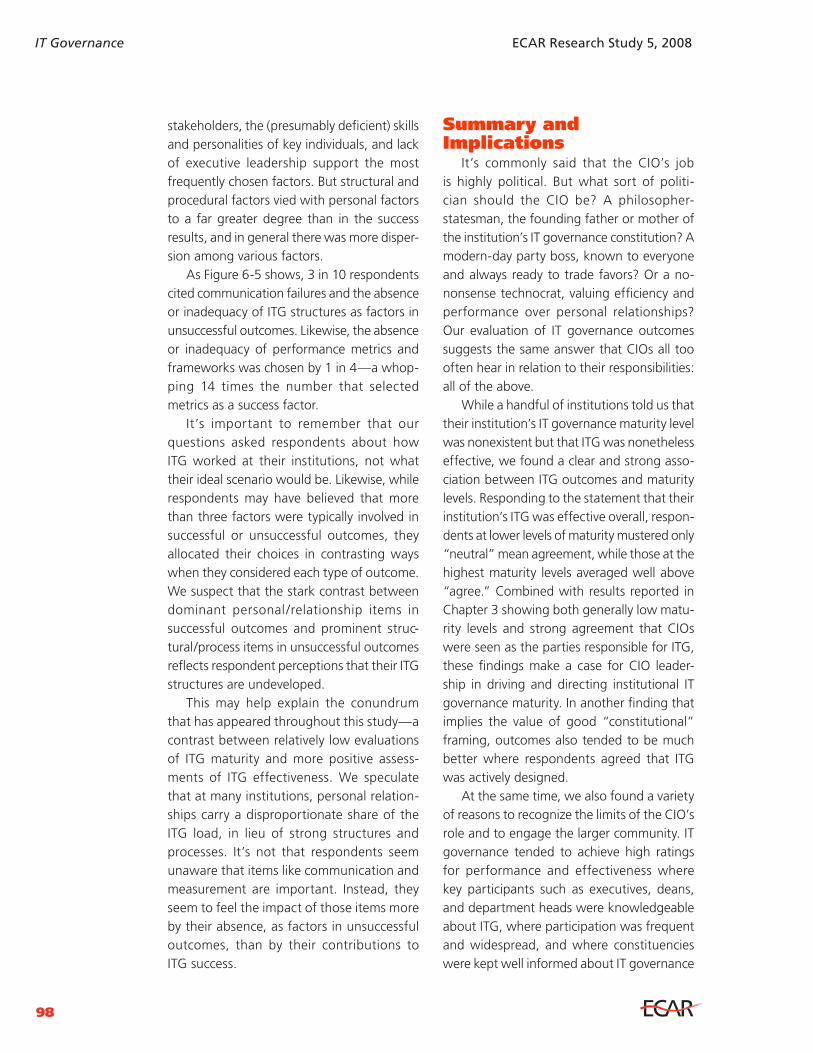
98
IT Governance ECAR Research Study 5, 2008
stakeholders, the (presumably deficient) skills and personalities of key individuals, and lack of executive leadership support the most frequently chosen factors. But structural and procedural factors vied with personal factors to a far greater degree than in the success results, and in general there was more disper-sion among various factors.
As Figure 6-5 shows, 3 in 10 respondents cited communication failures and the absence or inadequacy of ITG structures as factors in unsuccessful outcomes. Likewise, the absence or inadequacy of performance metrics and frameworks was chosen by 1 in 4—a whop-ping 14 times the number that selected metrics as a success factor.
It’s important to remember that our questions asked respondents about how ITG worked at their institutions, not what their ideal scenario would be. Likewise, while respondents may have believed that more than three factors were typically involved in successful or unsuccessful outcomes, they allocated their choices in contrasting ways when they considered each type of outcome. We suspect that the stark contrast between dominant personal /relationship items in successful outcomes and prominent struc-tural/process items in unsuccessful outcomes reflects respondent perceptions that their ITG structures are undeveloped.
This may help explain the conundrum that has appeared throughout this study—a contrast between relatively low evaluations of ITG maturity and more positive assess-ments of ITG effectiveness. We speculate that at many institutions, personal relation-ships carry a disproportionate share of the ITG load, in lieu of strong structures and processes. It’s not that respondents seem unaware that items like communication and measurement are important. Instead, they seem to feel the impact of those items more by their absence, as factors in unsuccessful outcomes, than by their contributions to ITG success.
Summary and Implications
It’s commonly said that the CIO’s job is highly political. But what sort of politi-cian should the CIO be? A philosopher-statesman, the founding father or mother of the institution’s IT governance constitution? A modern-day party boss, known to everyone and always ready to trade favors? Or a no-nonsense technocrat, valuing efficiency and performance over personal relationships? Our evaluation of IT governance outcomes suggests the same answer that CIOs all too often hear in relation to their responsibilities: all of the above.
While a handful of institutions told us that their institution’s IT governance maturity level was nonexistent but that ITG was nonetheless effective, we found a clear and strong asso-ciation between ITG outcomes and maturity levels. Responding to the statement that their institution’s ITG was effective overall, respon-dents at lower levels of maturity mustered only “neutral” mean agreement, while those at the highest maturity levels averaged well above “agree.” Combined with results reported in Chapter 3 showing both generally low matu-rity levels and strong agreement that CIOs were seen as the parties responsible for ITG, these findings make a case for CIO leader-ship in driving and directing institutional IT governance maturity. In another finding that implies the value of good “constitutional” framing, outcomes also tended to be much better where respondents agreed that ITG was actively designed.
At the same time, we also found a variety of reasons to recognize the limits of the CIO’s role and to engage the larger community. IT governance tended to achieve high ratings for performance and effectiveness where key participants such as executives, deans, and department heads were knowledgeable about ITG, where participation was frequent and widespread, and where constituencies were kept well informed about IT governance

EDUCAUSE CENTER FOR APPLIED RESEARCH 99
IT Governance ECAR Research Study 5, 2008
processes and decisions. When asked what typically was responsible for successful IT governance outcomes, respondents mainly picked items with a strong flavor of practical politics. The top-four choices all dealt with relationships, ranking considerably above such items as formal IT structures and performance metrics. It seems there is much to be gained by the careful attention to relationships and alliances that many of our qualitative interviewees described. Yet the absence or inadequacy of structural and procedural items was more prominent in the results regarding factors that produce unsuccessful outcomes.
The very fact that personality and rela-tionship factors stood at the top of the lists regarding both successful and unsuccessful outcomes reinforces our sense that relation-ships are critical but volatile. That’s why CIOs need to leaven the party boss role with that of the technocrat. Our outcomes results suggest that personal relationships and constituent inclusivity benefit when they are accompanied by the discipline of empirical performance measurement and regular review of IT governance processes. And while there is no doubt ample room in a well-designed governance structure for concessions to insti-tutional culture, we found that certain other formal ITG mechanisms and processes, such as participation in the institutional budgetary process and involvement in project review, were strongly and positively associated with ITG performance and effectiveness. CIOs must, in short, bring both process and politics into the IT governance domain.
Endnotes1. We adapted our performance score from a question-
naire designed by Peter Weill and Jeanne Ross and presented in their book IT Governance: How Top Performers Manage IT Decision Rights for Superior Results (Boston: Harvard Business School Press, 2004), 239–240. Our outcome categories differ from those in Weill and Ross in order to reflect the specific concerns of higher education.
2. Harvey Blustain, Sandra Braman, Richard N. Katz, and Gail Salaway, IT Engagement in Research: A Baseline Study (Research Study, Vol. 5) (Boulder, CO: EDUCAUSE Center for Applied Research, 2006), 97–101, available from http://www.educause .edu/ecar.
3. Interestingly, using a similar scoring method but different outcome items, Weill and Ross reported very similar scores for the 256 enterprises they assessed: a mean of 69 and break point of 74 for the top third. Weill and Ross, IT Governance, 240.
4. Only key participant ability to accurately describe ITG was more strongly associated with ITG effectiveness.
5. Weill and Ross, IT Governance, 222.6. These measures are the means of all input ratings and
all decision-making ratings. A higher mean represents higher overall frequency of participation.
7. Weill and Ross, IT Governance, 130–133, 145–146. The authors also add that enterprises should “moderate these general principles according to the enterprise’s dominant performance goals” and “further customize [them] with the enterprise’s unique strategy and desirable behaviors.”
8. Note, however, that IT governance researcher Ryan Peterson describes federal governance as the dominant model in all modern organizations. See Ryan R. Peterson, “Integration Strategies and Tactics for Information Technology Governance,” in Strategies for Information Technology Governance, ed. Wim Van Grembergen (Hershey, PA: Idea Group Publishing, 2004), 37–80.
9. “The most important predictor of top governance performance was the percentage of managers in leadership positions who could accurately describe their enterprise’s IT governance.” Weill and Ross, IT Governance, 124.


EDUCAUSE CENTER FOR APPLIED RESEARCH 101
IT Governance ECAR Research Study 5, 2008
©2008 EDUCAUSE. Reproduction by permission only.
In Chapter 3, we reported that 81% of our respondents said that IT governance was per-ceived to be the responsibility of the senior IT leader at their institutions. That and the other duties of the job surely leave CIOs with a great vantage point for observing the workings of IT governance. But in Chapter 4, we also re-ported that participation in IT governance was widespread and that cabinet-level executives had the highest involvement in decision mak-ing among non-IT participants. Do these offi-cers and other non-IT participants, with serious institutional responsibilities of their own, see IT governance in the same way as CIOs?
To find out, we conducted a secondary survey of non-IT participants in IT governance at a group of participating institutions, asking selected questions (mostly drawn from the primary CIO survey) about IT governance maturity, performance, and outcomes. In this chapter, we examine the results and compare CIO responses with those of other officers at our partner institutions.
Overview of the Executive Survey
With the assistance of several consortia and higher education systems, we asked CIOs
7CIOs and Executives
As long as the reason of man continues fallible, and he is at liberty to exercise it, different opinions will be formed.
—James Madison
Key FindingsNon-IT participants in IT governance gave high ratings to their ability to describe ITG accurately. They also tended to see institutional IT governance as more mature than CIOs at the same institutions.CIOs and executives both tended to agree that IT was aligned with business and academic goals, though executive agreement about IT/business alignment was somewhat weaker than that of CIOs. Although both groups rated incorporation of measurement and reporting into ITG lower than alignment, executives had a more positive view than CIOs.Executives and CIOs rated overall ITG effectiveness in similarly positive ways, and, although there were some differences between their assessments of some factors of ITG performance, mean institutional ITG performance scores did not differ signifi-cantly between the two groups.
◆
◆
◆

102
IT Governance ECAR Research Study 5, 2008
at institutions belonging to those organiza-tions both to fill out our primary survey and to invite up to five non-IT participants in IT governance to respond to a shorter survey focusing mainly on perceptions of ITG perfor-mance and outcomes. Though the invitations could be sent to any ITG participants at the CIO’s discretion, the most numerous group held executive positions in their institutions, and so for convenience we refer to the non-IT survey as the executive survey and the respon-dents as executives.
The organizations taking part in the execu-tive survey were
the California State University,the Common Solutions Group (CSG),the Consortium for Liberal Arts Colleges (CLAC),the NorthEast Regional Computing Program (NERCOMP), andthe University of California.
In addition, a few institutions not affiliated with consortia or systems participated. For a complete list of participating institutions, see Appendix B.
◆
◆
◆
◆
◆
Respondent Institution Demographics
We received executive responses from 216 individuals at 59 institutions, but because some of the executive responses came from institutions where no CIOs responded, we report here on the results from the 45 institu-tions providing one CIO response and at least one executive response. Within this group, there were 177 executive respondents. The mean number of executive respondents per institution was 3.93, and the median was 4.1
Figure 7-1 shows the distribution of the 45 executive survey respondent institutions by Carnegie class. (Note that this presents the proportion of discrete institutions, not individual respondents.) For comparison, we also show the category totals for respondents to the primary CIO survey, as presented elsewhere in this study. The CIO and executive surveys received responses from roughly similar proportions of doctoral (24% CIO survey, 29% executive survey) and MA (30% versus 27%) institutions, but BA institutions were proportionately more
106
129
77
62
42
2213 12 15
1 40
0
25
50
75
100
125
150
DR MA BA AA Other Canada
Carnegie Class
Numb
er of
Insti
tution
s
CIO survey (N = 438)
Executive survey (N = 45)
Figure 7-1.
Institutions
Participating in
CIO and Executive
Surveys, by
Carnegie Class

EDUCAUSE CENTER FOR APPLIED RESEARCH 103
IT Governance ECAR Research Study 5, 2008
plentiful in the executive responses (18% versus 33%). AA institutions, on the other hand, were much more numerous for the primary CIO survey (14% versus 2%). There were similar differences in the number of institutions by FTE enrollment size (Figure 7-2); institutions of 4,001–8,000 students were proportionately more plentiful among the total CIO survey respondent population than among the executive group, while institutions with more than 15,000 students made up a greater proportion of the execu-tive survey respondents.
Executive Respondent Position and Involvement
As we noted earlier, the respondents to the executive survey were chosen at the institutional CIO’s discretion. Though the mix of respondents was diverse (see Figure 7-3), half were executives such as presidents/chancellors and cabinet-level or executive officers, and about another one-fourth held senior academic positions, including deans,
college or university librarians, and other academic officers. Finally, 15.3% described themselves as faculty members, and 11.9% held other positions.
Asked their level of agreement with the statement “I am personally very involved in IT governance at my institution,” 61.6% of executive respondents agreed or strongly agreed, for a mean response of 3.63 (SD = 1.170). The difference between this result and the mean 3.91 (SD = 1.703) response of the CIOs at the same set of institutions was not statistically significant.
IT Governance Maturity and Context
Differing roles, viewpoints, and goals can lead individuals to different perceptions about IT governance even when everyone is taking part in the same processes. That’s why we begin our evaluation of CIO and executive responses with a look at some factors that set a context for respondent views on IT governance performance.
88
97
8479 76
9 105 8
12
0
20
40
60
80
100
120
1–2,000 2,001–4,000 4,001–8,000 8,001–15,000 More than 15,000
FTE Enrollment
Numb
er of
Insti
tution
s
CIO survey (N = 424)
Executive survey (N = 44)
Figure 7-2.
Institutions
Participating in
CIO and Executive
Surveys, by FTE
Enrollment

104
IT Governance ECAR Research Study 5, 2008
Ability to Describe IT Governance
In Chapter 6, we noted that the ability of relevant executives, deans, and department heads to describe IT governance accurately (as reported by CIO survey respondents) had the strongest association with overall ITG effectiveness of any nonoutcome variable in this study (see Table 6-6). We also reported there and in Chapter 3 (Table 3-3) that our CIO respondents were less than enthusiastic in their assessments, averaging responses lower than neutral.
As Table 7-1 shows, the CIO respon-dents from the executive survey institutions responded in a similar way, averaging a below-neutral 2.76 on our 5-point agreement scale. However, when we asked executive respon-dents about their own ability to describe ITG accurately, they were quite positive, averaging 4.05 (“agree”).
These two questions are not directly comparable, since the CIOs were asked to characterize “all relevant” parties, while the executive respondents were asked only about their personal ability. Furthermore, because CIOs chose which ITG participants to invite,
they may well have chosen the most knowl-edgeable colleagues. Still, juxtaposing the two results leads to some interesting observations. Most of the executive results presented in this chapter were not significantly different from the corresponding CIO results, and most of the exceptions consisted of more rather than less optimistic executive assessments. One cheerful implication that might result from this finding is that many of our CIO participants have found well-informed colleagues in IT governance who generally agree with their views and perhaps see themselves as taking part in a common enterprise. At the same time, if the contrast between CIOs’ overall characterization of participant knowledge and the executive respondents’ self-assessments is real, it may mean that outside the circle of those represented in the executive survey results, ITG participant agreement with CIOs is not as great.
MaturityExecutive survey respondents tended to
characterize IT governance at their institutions as more mature than their CIO colleagues did (see Figure 7-4). While no one among either
President/chancellor, 7.3%
Cabinet-level/executiveofficer, 42.4%
Dean/other academic officer,18.1%
College or university librarian,5.1%
Faculty member, 15.3%
Other, 11.9%
Figure 7-3.
Executive Survey
Respondent
Position (N = 177)

EDUCAUSE CENTER FOR APPLIED RESEARCH 105
IT Governance ECAR Research Study 5, 2008
group said that their institution’s ITG matu-rity was nonexistent, well over half of CIOs (57.7%) placed it in the next two categories, initial and repeatable, compared with only 32.2% of executives. (For a detailed descrip-tion of the maturity categories, see Chapter 3, Figure 3-1 and associated text.) Two-thirds of executives (67.9%) chose the top three of the six categories, and executives were almost four times as likely as their CIO counterparts to choose the highest category (“optimized”).
Is this a good thing? Keeping in mind that executive respondents generally characterized themselves as knowledgeable about ITG, it
suggests that they see the governance process as better documented and coordinated, more monitored and measured, and more attuned to best practices (to name some of the criteria for the upper levels of maturity) than CIOs. It may be that CIOs, swamped with the details and complexities of managing IT across the enterprise, and doomed by job description to hear about every occasion when things don’t go right, underestimate the degree of maturity that their ITG processes present to participants. Another possibility, though, is simply that CIOs have more at stake in IT governance and feel more painfully any short-
Table 7-1. Ability to Describe ITG Accurately, CIOs and Executives
CIOs: At my institution, ITG can be accurately described by all relevant
executives, deans, and department heads.
Executives: I can accurately describe IT governance at my
institution.
Mean* 2.76 4.05
N 42 45
Std. Deviation 1.055 0.498
*Scale: 1 = strongly disagree, 2 = disagree, 3 = neutral, 4 = agree, 5 = strongly agree
Figure 7-4.
Maturity of IT
Governance at
Institution, CIOs
and Executives
0.0
24.4
33.3
26.7
11.1
4.4
0.0
9.2
23.0
29.9
21.3
16.7
0%
5%
10%
15%
20%
25%
30%
35%
Nonexistent Initial Repeatable Defined Managed Optimized
Maturity Level
Perce
ntage
of R
espo
nden
ts
CIOs (N = 45)
Executives (N = 174)

106
IT Governance ECAR Research Study 5, 2008
comings in coherence and rigor. At any rate, CIOs who want to communicate an urgent message of underdeveloped IT governance maturity should not assume that their most knowledgeable governance partners will see things the same way.
Alignment and Policy Development
CIOs and executives broadly agreed that IT is aligned with the institution’s business and academic goals and that their institutions were able to develop important IT policies that apply throughout the institution. On all of these measures, mean agreement hovered close to “agree” (= 4; see Table 7-2). Slight differences in means for IT alignment with academic goals and for policy development were not statistically significant within the parameters that we applied to this analysis, but the 0.33-point difference relating to IT alignment with business goals was. Though it was not large, this was the only statistically significant difference between the two groups in which executives averaged a less positive response than the CIOs. Perhaps, like CIOs looking at IT maturity, the executive survey respondents were relatively more likely to take into account shortcomings in areas closely related to their own positions. This modest difference, however, should not obscure the
fact that executives generally gave positive ratings to IT/business alignment.
MeasurementAmong the items we reported as strongly
associated with good ITG outcomes in Chapter 6, the use of performance measurement and review was one of the most important. Our CIO–executive comparative results indicate that both groups had a somewhat lower opinion of institutional use of these items in ITG than they did about alignment and policy development (see Table 7-3).
Though agreement among both CIOs and executives that their institutions agreed on measurable goals for IT was above neutral, it didn’t reach the halfway point to agree. The slight difference in CIO and executive means for this question was not significant, but the much greater difference between them on whether their institutions incorpo-rated measurement and reporting in the IT governance process was. Executives were much more optimistic on average than CIOs, crossing the midway point between a neutral and an agree response, while the mean CIO response fell short of neutral. Also, executives rated the incorporation of measurement into ITG slightly higher than agreement on measur-able goals, while CIOs responded the other way around.
Table 7-2. IT Alignment and Policy Development, CIOs and Executives
At my institution...
Business goals and IT are aligned.
Academic goals and IT are aligned.
We are able to develop important IT policies that apply
throughout the institution.
CIOs
Mean* 4.20 3.87 4.24
N 45 45 45
Std. Deviation 0.726 0.991 0.883
Executives
Mean* 3.87 3.93 4.05
N 43 45 45
Std. Deviation 0.589 0.654 0.489
*Scale: 1 = strongly disagree, 2 = disagree, 3 = neutral, 4 = agree, 5 = strongly agree

EDUCAUSE CENTER FOR APPLIED RESEARCH 107
IT Governance ECAR Research Study 5, 2008
Small numbers of respondents in some categories make it difficult to interpret differ-ences between assorted executive positions, but it’s noteworthy that the lowest mean rating for agreement on measurable goals for IT came from our eight college/university librarians, while the highest came from our 11 presidents/chancellors. Cabinet officers and deans tended to report closer to the overall mean.
We can only speculate on why executives tended toward a more positive view of the incorporation of measurement and reporting in ITG. Perhaps, as we suggested regarding the maturity findings reported above, CIOs are just more aware of deficiencies across the whole range of IT governance, or they expect more of ITG. It may also be that many execu-tive departments see things from the stand-point of their own units’ metrics and reporting protocols, which may be more mature than those in IT units. As with ITG maturity, CIOs may find an exploration of these issues with their key ITG participants a worthwhile way to uncover unrecognized assumptions and differing perceptions.
Performance and Outcomes
Despite the differences between CIOs and executives noted earlier in perceptions
of ITG maturity, IT/business alignment, and incorporation of measurement into ITG, we didn’t find a lot of differences relating to IT governance outcomes. Where we did find them, they related to differing views about the factors contributing to ITG performance, rather than to performance itself.
IT Governance Performance Score
In our executive survey, we used the same IT governance performance scoring method that we did in the primary CIO survey. We asked respondents to rate the importance of four institutional outcomes (cost-effective use of IT, and effective use of IT to enhance teaching and learning, research, and admin-istrative processes) as well as the influence ITG had on producing each outcome at their institution. We then used these responses to calculate an ITG performance score that ranged from a low of 20 to a high of 100. (For more details about how the scoring method worked, see Chapter 6, Figures 6-1 and 6-2 and associated text.)
We found more differences between CIOs and executives in the way they assessed the performance score input factors than we did in the scores themselves. Not that even these differences were dramatic; the means for each group were similar in most cases for
Table 7-3. Measurement Goals and Incorporation into ITG, CIOs and Executives
At my institution...
We agree on measurable goals for IT.
We incorporate measurement and reporting in our IT governance
process.
CIOs
Mean* 3.16 2.93
N 45 45
Std. Deviation 1.107 1.074
Executives
Mean* 3.37 3.54
N 44 44
Std. Deviation 0.654 0.621
*Scale: 1 = strongly disagree, 2 = disagree, 3 = neutral, 4 = agree, 5 = strongly agree

108
IT Governance ECAR Research Study 5, 2008
both importance and influence (Figure 7-5). The main exception was in the influence results, where executives tended to rate ITG’s influence on enhancing teaching/learning and research significantly more highly than did CIOs. Even though executives rated ITG influ-ence on enhanced research higher than CIOs did, like CIOs, they gave this factor the lowest ratings of the four different outcomes.
As Table 7-4 shows, these factor differ-ences did not carry over into the overall ITG performance score, where CIOs and execu-tives averaged similar institutional scores. (The 6.67-point difference evident in Table 7-4 was not statistically significant.)
IT Governance Characteristics and Overall Effectiveness
In addition to our ITG performance score, we asked a number of questions relating to the success of IT governance, including timeliness of decisions, ability to build IT support through inclusiveness, balance of local/departmental and central IT needs, and overall effective-ness. On all these measures, executive mean responses fell just short of an agree (= 4) response, and none was significantly different from the corresponding CIO response (see Table 7-5). Taken in conjunction with the performance score results, these findings indicate that among our respondent institu-
4.36
3.27
4.13
3.22 3.27
2.47
4.40
3.80
4.29
3.60
4.47
3.73 3.66
3.12
4.25
3.74
1.0
2.0
3.0
4.0
5.0
Importance Influence Importance Influence Importance Influence Importance InfluenceEnhance administrative
processes
Mean
Rati
ng
CIOs (N = 45)
Executives (N = 45)
Cost-effective use of IT Enhance teaching and learning Enhance research
Figure 7-5.
Importance of
Outcome, and
Influence of ITG
on Outcome, CIOs
and Executives
Table 7-4. ITG Performance Score, CIOs and Executives
ITG Performance Score
Mean* N Std. Deviation
CIOs 66.21 45 22.654
Executives 72.88 45 9.403
*Scale: 20 (low) to 100 (high)

EDUCAUSE CENTER FOR APPLIED RESEARCH 109
IT Governance ECAR Research Study 5, 2008
tions, CIOs and the ITG participants they called on to assess institutional IT governance share a common sense that ITG, if not perfect, is performing well across a variety of indicators.
Summary and Implications
Even IT leaders who interact all the time with colleagues in other business and academic units have to worry from time to time about whether they live in the same universe as their associates. Norms and interests differ, sometimes radically, in different parts of the institution, and IT is easily typecast as a culture apart, obsessed with technical arcana and insulated from the “real” work of the institution. CIOs, for their part, can be forgiven if they sometimes suspect that people who participate in IT governance do so mainly from a standpoint of self-interest.
In our executive survey, however, execu-tives and CIOs seemed to see things in broadly similar terms. Executives rated ITG overall effectiveness at about the same (positive) level that CIOs did, and in one measure that might have uncovered tensions between IT and other units—ITG balance of institutional and local/departmental needs—their mean responses were nearly identical. Likewise,
although a multifactor performance score showed executives more positive about ITG’s influence on enhancing research, the mean performance scores from the two groups did not differ significantly.
There were two noteworthy exceptions that have some implications for the way IT leaders think about, and interact with, colleagues involved in IT governance. Our executive respondents saw ITG as more mature than did CIOs, and they were consid-erably more positive in their agreement that their institutions incorporated measure-ment and reporting into the IT governance process—itself a marker of maturity. Both were strongly associated with IT governance success in the full (438-respondent) CIO survey, and both were items that many CIOs seem to feel need improvement.
And that leads to the potential downside of apparently satisfied ITG executive participants. However sincere these participants may be, the stakes of ITG success are likely to be lower for most of them, and their involvement in the process narrower, than for CIOs. IT leaders who want to carry IT governance to higher levels of maturity need the cooperation of colleagues motivated by a sense of urgency, and paradoxi-cally, “customer satisfaction” with the status quo could be an obstacle to establishing it.
Table 7-5. IT Governance Outcomes, CIOs and Executives
At my institution, IT governance...
Makes timely decisions.
Builds support for IT through
inclusion.
Balances institutional and
local/departmental needs.
Is effective overall.
CIOs
Mean* 3.64 4.13 3.95 4.02
N 45 45 44 44
Std. Deviation 0.857 0.786 0.680 0.762
Executives
Mean* 3.78 3.89 3.90 3.89
N 45 45 45 45
Std. Deviation 0.606 0.694 0.484 0.628
*Scale: 1 = strongly disagree, 2 = disagree, 3 = neutral, 4 = agree, 5 = strongly agree

110
IT Governance ECAR Research Study 5, 2008
Thus, while our findings may ease some of the concerns CIOs have about how other executives perceive IT governance, they also suggest ways in which IT leaders might inquire more deeply into the assumptions and perceptions of their IT governance partners. Do they agree that institutional IT processes are relatively mature, and if so, what does that mean to them? When they think about the metrics that should inform IT governance, do they look beyond the measures that relate to their own business or academic units? Are institutional leaders “satisficing” when they evaluate IT governance—that is, accepting suboptimal but “good enough” performance as a rational response to competing priorities and limited resources—or are they following the standard of excellence that most CIOs will wish to apply in a process so intimately tied to IT strategic alignment and success?
Because our executive respondents were selected by their CIO counterparts, of course, it may be that our results reflect a selection bias favoring participants with whom CIOs enjoy good collaborative relationships. Like-mindedness is not a surprising result in such situations. Yet it’s also worth remembering that our CIO respondents gave personal factors high priority when selecting reasons
for both successful and unsuccessful ITG outcomes (see Chapter 6, Figures 6-4 and 6-5). This implies that many CIOs rely on a somewhat selective circle of participants as key players in IT governance. As IT leaders look for ways to improve ITG, they should inquire closely into the nuances that may make apparently shared goals and evaluations less similar than they seem to be.
Endnote1. Because of the smaller number of responding institu-
tions involved in these CIO/executive comparisons, we apply a less restrictive, though still commonly applied, standard of statistical significance to this chapter’s results (p < .05) than we do in the rest of the study (p < .01). The CIO results in this chapter represent only respondents (one each) from the 45 institutions that provided valid responses to the executive survey. Because different numbers of executives responded at each institution, all of the executive results that are reported as means were produced by first averaging the executive responses at each institution, then calculating the overall mean of all 45 separate institutional executive means. This gave each institution equal weight in contributing to the final result. Note that because of this procedure, the standard deviations we report for the executive results represent variation among institutional means, not variation among individual executive survey responses. Executive results reported as frequencies rather than means were calculated directly from the entire group of 177 executive participants.

EDUCAUSE CENTER FOR APPLIED RESEARCH 111
IT Governance ECAR Research Study 5, 2008
©2008 EDUCAUSE. Reproduction by permission only.
The purpose of IT governance is to make decisions that ensure IT investments help achieve institutional goals. To do that, IT gov-ernance focuses on matters of key strategic value—baseline principles, investment priori-ties, infrastructure and architecture standards, and critical applications choices—and provides both a forum for collecting viewpoints and data, and a process for making decisions.
Nothing about these defining character-istics of IT governance is likely to change in the near future. IT has become so intertwined with the life of higher education institutions, and consumes such substantial resources, that some high-level process for making big decisions has become essential. IT governance is here to stay.
Yet a great deal about IT governance is dynamic. Some issues requiring execu-tive attention or constituent input will dwindle away, to be replaced by others that have suddenly gained new significance. Committees that were appropriate to one set of circumstances will fail when a new set arises. Institutional priorities will change, and shifting economics will affect both the cost-benefit calculus of technologies and the nature of the constituent bases they serve. In general, anything that “politicizes” a tech-nology or a process that depends on IT has the potential to affect IT governance, perhaps by
changing it from a purely operational concern to a community concern.
With the help of eight IT leaders who shared their thoughts on how IT governance is evolving, we look in this chapter at the dynamic aspects of IT governance as we think they’ll unfold over the next 5 to 10 years.1 While the picture is complex, and not all our interviewees agreed on all matters, one point stands out clearly: In the 21st century, ITG in higher education will have to serve the needs of a growing and increasingly diverse body of constituents who will demand more sophisti-cated services and more options in how they obtain and use them.
Catalysts for ITG ChangeOur investigation of coming changes and
challenges in IT governance uncovered both centrifugal forces that tend to send services outward to departments and users, and centripetal ones, which imply their move-ment toward central IT or other parts of the institutional core. The theme that cuts across all of them is that IT governance will deal with a constituent community with increas-ingly complex needs, providing overarching guidance and a degree of institutional (and extra-institutional) “glue” to hold the activities of an empowered and collaboration-minded user community together. In this section, we
8The Future of IT Governance
To become truly great, one has to stand with people, not above them.—Charles-Louis de Secondat, Baron de Montesquieu

112
IT Governance ECAR Research Study 5, 2008
look at four particular areas that interviewees described as critical: the growing impact of commodified services and consumer choice, research cyberinfrastructure, data manage-ment, and the increasing difficulty of funding innovation.
The Democratization of IT Services
Minicomputers, PCs, and servers have long since enabled users at many levels of the insti-tution to strike out on their own and provide independent IT services. But a new genera-tion of commodified services is now taking the sourcing granularity of sophisticated, networked solutions down to the individual user level, lowering the bar of independence still further for schools and departments. Today, individuals or groups can find their own solutions (often free of charge) for e-mail, calendaring, work-group collaboration, office applications, web hosting, storage and backup, and many other things traditionally supplied by the institution. Courses can be delivered and evaluated independently of any institutional infrastructure, and social networking tools not only bring constituents together but also increasingly act as platforms with portal-like integration capabilities. Heavy-duty computing services can be ordered from the “cloud” on a usage-fee basis with no up-front capital investment and no need for housing or routine system updates.
To Internet theorists like Yochai Benkler, this emerging cloud of commodified, collabor-ative services facilitates a new mode of “social production,” helping talent and resources to flow to interesting problems, opening new forms of creativity and new social relation-ships, and permitting fast, effective collabora-tion.2 Its impact on higher education is already clear, from the intense effort students put into their social networks to the highly collabora-tive, globalized, and technologically enabled ways that research teams now work in many disciplines. It has also affected IT politics on
campus, as every CIO responding to open source or peer-to-peer file-sharing communi-ties knows. What remains unclear is the extent to which institutions will supply such services themselves, integrate with them in what Benkler calls a “permeable” environment, or allow consumer choice to prevail.
Such questions have begun to make their way into the visions our interviewees’ institu-tions have developed of their future strategic goals, most notably in the priority given to technologically enabled collaboration. At Princeton, Vice President for Information Technology and CIO Betty Leydon used the occasion of an institutional strategic plan-ning process to develop a strategic direction document for IT in which collaboration plays a prominent part. “What we did was translate the [institutional] priorities into the central IT initiatives,” Leydon says. The document calls for an information infrastructure that supports collaboration and a services infrastructure “comprised of a set of integrated online services that will facilitate people-to-people interactions by simplifying and standardizing interactions between people and informa-tion.”3 As a concrete example, Leydon notes that Princeton has recently decided to offer a “bridge year” for admitted Princeton undergraduates who choose to delay their freshman year in order to pursue international service opportunities. “We have to figure out how we’re going to stay in touch with these students,” Leydon says. “Those business initiatives translate into IT needs.”
Similarly, the University of California’s system-wide Information Technology Guidance Committee, in a two-year initiative sponsored by the University of California Office of the President Provost, produced a report noting among other things that “Collaboration is the way forward.... The University should deploy IT infrastructure, tools and services to support collaboration within the UC community.” As at Princeton, this recommendation reflected university, not IT, goals. “The intent [of the

EDUCAUSE CENTER FOR APPLIED RESEARCH 113
IT Governance ECAR Research Study 5, 2008
ITGC report] was not to develop a detailed operational strategic plan,” says Kristine Hafner, former associate vice president, infor-mation resources and communication, at UC Office of the President. “It was to surface the high priorities for strategic investment in IT. It has been shared with the regents and has led to requests for investments in the future.”4
Our interviewees also saw strategic possibilities in the new services-oriented technologies that apply to more traditional business concerns. In particular, some thought that this more lightweight and commodified approach to IT could reinvigorate discussions about outsourcing noncore functions. “If we’re going to continue to be able to provide new services, we have to start shedding some of the old ones,” says James Hilton, vice president and CIO at the University of Virginia. “The successful IT unit in the future is going to be the one that figures out how to source commodity services as efficiently as possible and focus internally sourced talent on helping students and faculty directly.” Hafner agrees. “I feel like every university should be looking into these things,” she says. “We need to figure out how to take cost out of the business. The university has to acknowledge that it should not care about differentiation in certain things, and then there are things above the line that are academic related in nature, and there you need to preserve the flexibility and uniqueness.”
What’s lacking from the picture of commodified, consumer-oriented services as promoted by vendors (and often by their champions in the user community) is the sense of enterprise vision that is one of institutional IT’s key areas of competence and concern. As Princeton’s emphasis on “simplifying and standardizing interactions” suggests, some institutional role will be necessary to ensure that users really can connect with one another in straightforward and secure ways. End users of commodity services in many cases have little sense of how systems interact, where
security threats may come from, or how the convoluted rules that increasingly apply to institutional records and other sensitive data apply to them. Yet IT cannot just unilaterally make all the decisions that make the new environment enterprise friendly.
For one thing, the relevant user commu-nity for any given service can change radically in size and composition, demanding flexibility and responsiveness from IT governance. To Dan Updegrove, consultant on IT in higher education, a particular challenge for IT governance is anticipating and responding to “contagion phenomena” caused when a sudden upward inflection of a new tech-nology results in large-scale user expectations of support and performance. Contagion can be triggered by successful university pilot projects, such as early explorations of web-based course materials publishing that led, in very short order, to demands for robust course management platforms integrated with student information systems. In other cases, “community choice of consumer electronics and Internet services influences demand for enterprise-level services,” Updegrove says. “Users expect administrative systems to be as convenient as Amazon.com, instructional systems to be as compelling as Second Life, and lectures to be downloadable to their iPods.”
One example is the sudden shift in user expectations for ubiquitous wireless, which arrived hard on the heels of major invest-ments in Ethernet connectivity in dormito-ries. “Nothing fell out of the CIO budget to fund deployment of 1,500 wireless access points,” says Updegrove. Looking to the future, Updegrove points to the emerging universe of networked consumer devices, especially mobile phones. “Vendors want to sell hot new stuff to individuals,” he says, “but many of those individuals on day two will want to connect that piece of consumer electronics to the infrastructure.” At the University of Cincinnati, Vice President and

114
IT Governance ECAR Research Study 5, 2008
CIO and Professor of Information Systems Fred Siff concurs and has spearheaded an institutional cell phone initiative featuring UC-centric applications designed for students and faculty. “Mobility happens to be a big deal in my book,” says Siff, adding that “it’s not yet a big deal on a lot of campuses.”
To really exploit emerging IT services, however commodified, will still require the institutional viewpoint, the cross-organi-zational scrutiny and give-and-take that IT governance provides. “An obvious focus of IT governance is setting priorities and determining resource allocations,” says Dan Updegrove. “Implicit in this is campus expecta-tions-setting.” With effective communication between IT and the community, Updegrove adds, “there can be broader understanding that just because a new product became available yesterday, it’s not reasonable for the community to expect to be able to call the help desk today about it.”
This is not to say that IT governance won’t have to take into account the reality that local units can and will wish to serve their own interests. Yet the central/local divide is already getting fuzzier. To leverage the full range of available resources and sourcing options, institutions will increasingly wish to deliver IT in the form of services whose component sources—central, local, or commodity—are of no concern to the user.
At UCLA, Jim Davis, associate vice chan-cellor for IT and chief information officer, says that “we have a basic need to get out of the business of central versus decentralized kinds of deployment for many IT infrastructure services, especially those at or supportive of the frontlines of research, education, and the academic environment.” Instead, the univer-sity tries to identify services that benefit from both an enabling institutional layer and local layers that can be built on top of it. In addi-tion, UCLA looks at the academic implications of the service, balancing discipline-specific and interdisciplinary objectives, institutional
and local operational requirements, and academic and administrative priorities by getting input from different (and carefully chosen) groups. “One of the most impor-tant tasks for our governance structure is to resolve when, where, and how a service should be balanced,” says Davis. “It also speaks to where that balance point is as seen from strategic, functional, deployment, and investment standpoints.”
Research CyberinfrastructureOur interviewees unanimously stressed
research support as a key challenge of the near future, one driven by both strategic importance and the growing role of IT in all facets of scholarship. “The fabric of inquiry is changing,” says Virginia’s Hilton. “Computation, simulation, visualization, and communication technologies are fundamen-tally changing the way that knowledge is discovered and transmitted.”
These changes will be especially evident in the provision and support of cyberinfra-structure—the National Science Foundation’s term for the advanced computing, network, and storage resources that support research, and the applications and collaboration tools that investigators use to get work done. An example of a broad cyberinfrastructure effort rooted in the strategic imperative of research excellence can be found in the report of the University of California’s IT Guidance Committee, mentioned earlier. The committee placed cyberinfrastructure items in the fore-front of its recommendations, advising that the university invest in network connectivity, connect all of its institutions to a grid archi-tecture, and plan for next-generation data centers to permit larger-scale and more flex-ible hosting of high-performance hardware, as well as investing in tools and services to support collaboration.
These recommendations involve a breath-taking range of initiatives and partnerships, ranging from upgrading local campus

EDUCAUSE CENTER FOR APPLIED RESEARCH 115
IT Governance ECAR Research Study 5, 2008
networks so that they match the speeds of the external backbone, to investing in California’s regional network provider, CENIC, to working with national and international networking partners. Hafner describes these proposals collectively as “the blueprint for how we move on research cyberinfrastructure to serve the community using new models.”
The most transformative aspect of cyber-infrastructure is challenge to the tradition of “cottage industry” science conducted by isolated investigators who use grant funds to buy (and often jealously guard) the resources they need for their own research, even if they use only a small fraction of their capacity. In a recent ECAR study of IT and cyber-infrastructure in higher education, survey respondents (mostly CIOs) gave low marks to their institutions for the collaborative use of research cyberinfrastructure and for the existence of incentives to collaborate.5 Yet creating and supporting cyberinfrastructure implies sharing, attention to economies of scale, and a degree of the kind of central-ization researchers have historically gone to great lengths to avoid. It requires, in short, a multilevel approach to governance that can cross professional cultures and decide on priorities that serve institutional, and often extra-institutional, interests.
At Princeton, Betty Leydon describes a research IT governance model that triangu-lates between a research computing advisory group—“which is faculty who are major users of high-performance computing in their research and some of the technical people from their departments”—a senior advisory group on IT composed of university executives, and central IT. The process helped Princeton assemble a variety of central administration, central IT, and research funds to establish its Tigress Computing Center for hosting high-performance computing, and it has recently enabled the university to add shared storage for high-performance computing clusters. “The researchers put in money to help pay
for the machine itself,” Leydon says, “but my belief is that the infrastructure pieces should be paid for by the central adminis-tration.” (For a detailed look at Princeton’s approach to high-performance computing, see the ECAR case study “Supporting Research Computing through Collaboration at Princeton University.”6)
Other interviewees described more informal mechanisms that nonetheless emphasize faculty involvement and mobiliza-tion of their passion for research. James Hilton frankly concedes that “I often have a hard time figuring out what to do with the univer-sity committee on information technology” when it comes to academic, and especially research, issues. “So what I have started doing is creating informal advisory groups where I see a focused need—I go out and recruit a set of faculty.” Hilton has created advisory groups in computationally intensive science, digital humanities, and course management and collaboration software. He also has turned over resources typically controlled by central IT, such as cluster upgrade funds, to faculty for allocation decisions. “I reserve the right somewhere downstream to take them back if it’s not working,” he says, “but I go with these advisory committees because I get a group of people who share a vision in a particular area—they aren’t blind, loyal fans, but they care.”
The need to rethink IT/researcher rela-tionships is highlighted in some conflicting impulses revealed in ECAR’s recent study of IT and cyberinfrastructure. Asked what might help central IT support more effective use of cyberinfrastructure, respondents gave high ratings to improved communication and outreach between researchers and central IT, but were much less likely to name inclusion of researchers in institutional IT governance.7 This may simply reflect a preference for a broader principle than a more specific one, but it’s hard not to infer as well a certain willingness among CIOs to keep researchers at arm’s length. As

116
IT Governance ECAR Research Study 5, 2008
cyberinfrastructure becomes more tightly bound to research in diverse fields, however, the relative segregation of the IT and research worlds will become harder to justify.
No amount of governance tweaking or researcher passion, however, can change the fact that cyberinfrastructure investment is a highly competitive game, both within and between institutions. Costs are high, funding is limited, and a certain amount of conflict is unavoidable. Updegrove puts it bluntly: “Advanced research cyberinfrastructure is frightfully expensive.” For all its promise, Updegrove points out, today relatively few faculty members make use of it and benefit from it. Institutions intensively dedicated to science and engineering may find it easy to define cyberinfrastructure as a strategic priority, but “at a more multidisciplined institution you have to come up with some governance process, some review that asks are we starving the humanities and the social sciences here in this headlong commitment to be at the bleeding edge of infrastruc-ture in support of collaborative sciences.” Another dimension of cyberinfrastructure governance, Updegrove adds, is what he calls “co-opetition.” Two institutions may, at one point, be in competition to recruit the best scientists and win the most research funding, while at another point they may wish to see their researchers collaborate effectively. “The governance question is at two levels,” Updegrove says. “How much of what we need can we do ourselves, and how much of what we need do we have to collaborate with others to achieve?”
Data ManagementClosely related to cyberinfrastructure, but
perhaps still more daunting as a challenge to traditional research and IT practices, is the question of data management. Modern science produces huge quantities of data, which investigators may guard even more jealously than their grant-funded apparatus,
and which are often stored in inaccessible locations and formats without regard to security or long-term preservation. Add to that the mass digitization projects that are revo-lutionizing arts and humanities research, and the abundant transactional data that institu-tions collect in their administrative and online learning systems, and the sheer quantity of data being generated is staggering. The value that might be harvested by better access and integration is hardly less impressive. Finally, information in many areas, including student records, employment, health care, and human subjects research, is increasingly regulated. It’s not surprising, then, that a recent ECAR study found that data storage and management was the cyberinfrastructure technology whose importance CIOs thought was most likely to increase during the next three years.8
Data management is especially critical because of the growing expectations relating to quick, ubiquitous access to information of all kinds. “Google wants to digitize the surface of the earth and all the information that’s out there,” says Pat Burns, vice president for IT at Colorado State University. “That’s incredibly compelling. We have to figure out better ways not only of quantifying information from web resources, but qualifying it and vetting it, teaching students how to go to different sources of information. I think that’s going to come to roost in the academic environment.” Hilton argues that “Universities are no longer gateways to information. Knowledge is what you do with information through critique, reflection, collaboration. Universities have always been in the knowledge business, but we’ve profited a lot by looking like we were gateways to information. Now we live in a world where access to information is pretty much ubiquitous.”
Developing this ability to produce knowl-edge rather than just information—to organize and connect data, and deliver it to those who need it—means mastering higher education’s embarrassment of data riches. Simply making

EDUCAUSE CENTER FOR APPLIED RESEARCH 117
IT Governance ECAR Research Study 5, 2008
more data technically accessible will not be enough. Indiana University Vice President for Technology and CIO Brad Wheeler argues in a recent EDUCAUSE Review article that higher education is confronting an emerging “era of certitude” that succeeds earlier publishing and participatory models by addressing “higher thresholds of certitude through authenticity of source, credibility, and even dialogue for refinement of answers across time and distance.” In this environment, access to data will be supplemented by value-adding services such as immediacy, personalization, inter-pretation, and authenticity. Value creation, Wheeler writes, will shift “from content access to intelligent matching of questions with answers that meet an information seeker’s threshold of certitude at the moment and place of need.”9
Both the problems and the possibilities of data management are making their way into campus IT planning. “We are drowning in data,” Princeton’s IT strategic directions report notes, yet it adds as well that “we want online access to everything, anytime and anywhere.” The report calls for a “data life-line” providing mechanisms for searching and archiving institutional data, along with policies for retention and disposal. The most critical need, the report says, is for “integrated data repositories that allow people to store, access, and share data [that] will help the University respond to emerging judicial data-reporting requirements and reduce the widespread data duplication and proliferation of ‘shadow’ systems on campus.”10 Likewise, the University of California’s IT Guidance Committee has recommended that “the University should create the capacity to manage scholarly digital assets” in part by ensuring that research and instructional information “is effectively secured, managed, preserved, and made avail-able for appropriate use by others.”11
To a greater or lesser degree, all higher education institutions are likely to feel a similar need to tame the data beast and put it to work.
Doing so will demand not only technical skill but also a great deal of investigation, collabo-ration, and negotiation. Simply knowing what data resources an institution has on hand is a huge challenge, while legal requirements relating to ownership, fair use, privacy, and retention are difficult to determine and even harder to communicate to all relevant commu-nities. As ECAR research has found, even in the relatively narrow confines of academic analytics and identity management, different people often have different definitions for the same data, and technical issues can block effective use even when rights and access issues are clear.12 Nor is business ownership of information easily determined. At Griffith University in Australia, Pro-Vice Chancellor (Information Services) Janice Rickards says that data management issues touch on a number of strategically critical areas, including a new customer relationship management system, a national research quality framework initia-tive, and a data warehouse project that will support learning assessment. Yet responsi-bility for information remains a cloudy area looking for a governance solution. “Overall coordination of knowledge management at the enterprise level is not a defined area of anybody’s portfolio at the moment,” Rickards says. “It’s an area where the vice chancellor and I are having some conversations about whether to make this more explicit some-where in the organization, even if it means modifying some roles.”
Finally, new data often implies new processes, which in turn must be reconciled with old cultures. Whether in academic disci-plines or administrative departments, the incor-poration of new information can upset interests and relationships that many would rather leave undisturbed. ECAR research has shown that institutions are a lot better at collecting infor-mation than absorbing it; few make sophisti-cated management use of the abundant data contained in their transaction systems,13 and this study has found CIOs less than enthusiastic

118
IT Governance ECAR Research Study 5, 2008
about their institutions’ use of measurement and reporting in IT decision making.
Some of our interviewees thought that this brewing concoction of research, instruc-tional, and administrative information issues will require IT to fortify its relationship with a natural partner: the library. “Both the IT and library worlds are changing,” says Hilton, “and the difference is becoming blurred. I don’t know that you have to bring them into one organi-zation, but making sure that they are coordi-nated and collaborating is critical.” Updegrove believes IT can learn governance lessons from the library. “In some institutions there is a very well defined governance process for the library that is very plugged in to the faculty,” observes Updegrove. “There is a formal, well-respected process for engaging the community and allo-cating resources, whereas IT may not be as well connected to the faculty, or as legitimate from an academic point of view.”
All of these trends promise to bring a multitude of data-management-related issues into contention, requiring adjudication and prioritization by governance processes, IT and otherwise. As with services-oriented computing and cyberinfrastructure, such issues are likely to mobilize a diverse body of constituents and to politicize questions that could once be handled in smaller, more intimate communities of interest. Governance, Wheeler writes, will be crucial to shaping a holistic institutional response to the demands of “certitude.” “Shifts to leveraged platforms require gaining trust, giving up control, and ensuring quality service delivery,” he argues. “Since such shifts may represent a cultural discontinuity, leadership is essential in pressing through the many obstacles and objections that reinforce the status quo.”14
The Innovation ChallengeNot everything that our interviewees saw
looming large on the IT governance horizon was something new. Funding, a perennial issue, was on everyone’s mind. An ECAR
study in 2004 highlighted a troubling trend in institutional IT budgets: the growing predomi-nance of fixed costs over the discretionary spending that feeds innovation.15 Since then, the portfolio of IT services has only expanded, and demand for services, already almost universal in extent of constituents involved, has grown in intensity. As a key forum for aligning IT to institutional strategy and for prioritizing investment, IT governance seems destined to play a large role in carving out the space for IT innovation.
“The critical factor in my experience with IT governance is that there is potentially infinite demand for two related products,” says Dan Updegrove. “One is ubiquitous and highly reli-able infrastructure and services, and the other is continuous innovation.” Updegrove notes that hypothetically all available resources could be devoted just to keep utility services functioning at high levels. “Yet we could not possibly stop all innovation, because universi-ties are fundamentally innovative. The twin pressures of doing what we’ve been doing better, and doing new things, is a critical issue for governance.”
James Hilton makes much the same point when he notes a distinction between the essential and the strategic, which in turn is related to what he sees as a shift in emphasis from administrative and regulatory concerns to academic ones. “Essential is like oxygen—you have to have it but it does not give you any competitive advantage,” Hilton explains. “Strategic investments are the things that give you a competitive advantage. My number-one priority is how to improve and align the funding that we spend on IT with the actual strategic value that it could have. Against that backdrop is the great danger that compliance trumps strategy every time.”
Because of its role in aligning IT with strategic priorities, IT governance is the appropriate tool for cutting through the fog of conflicting interests and achieving an appropriate balance between (to use

EDUCAUSE CENTER FOR APPLIED RESEARCH 119
IT Governance ECAR Research Study 5, 2008
Updegrove’s categories) infrastructure and innovation. At present, though, ITG is often connected loosely or not connected at all to institutional budget processes; only 58% of our survey respondents reported such involve-ment. No doubt real budget influence varies among even these, though we did find that institutions reporting ITG budget involve-ment tended to rate ITG overall effectiveness significantly more highly than those that did not (see Chapter 6, Table 6-3).
Kristine Hafner notes that IT governance can help raise awareness of IT among the executives who control resources, but even so it remains a challenge to fund governance-identified priorities. “The next barrier we have to break through,” she says, “is getting the funding entities to acknowledge what the community has set forth in the plan and allo-cate resources. We don’t have a mechanism for resolving that yet.” Improving coordination with and influence over the budget process should be a top priority for CIOs who want to build IT governance structures that effectively drive institutional strategic goals.
IT Governance in the Next Generation
None of our discussions with IT leaders uncovered really radical new forms of IT gover-nance likely to emerge in the near future—no all-powerful IT tsars, no proponents of IT anarchy or appropriation of the means of information. They did, however, converge on a number of themes that cut across the various specific challenges that interviewees saw unfolding during the next 5 to 10 years. In this section we look at the characteristics IT governance will require in the next generation of higher education IT.
Improving IT Governance Maturity
Taken together, the forces that we’ve identified in this chapter make a strong case for taking institutional IT governance beyond
its current relatively low levels of maturity (see Chapter 3, Figure 3-1), even where more informal structures currently function adequately. Whether it’s engaging with a more diverse and independent user commu-nity, supporting an increasingly IT-intensive research mission, managing the data explo-sion, or making difficult choices that favor innovation, IT leaders will need processes and relationships robust enough to facilitate stra-tegically oriented decision making. This will mean paying more attention to the structural qualities associated with greater ITG maturity, such as documenting, communicating, moni-toring, and measuring ITG processes. But it also means creating governance equipped to address issues on an institution-wide (or broader) basis.
These are, after all, qualities associated with institutional governance of all types, and indeed, greater governance maturity is one way to assert that IT has the level of strategic significance already recognized in such areas as financial management, curriculum develop-ment, and capital planning. “What it comes down to is this contention: Is IT an executive function?” says Fred Siff. “It really helps to not just think about IT governance but financial governance, facilities governance. IT gover-nance is the least mature; it’s been around for the shortest period of time. I think the job of the CIO is to put it in place and be an equal member of the institutional governance.”
To highlight that idea, and to incorporate IT more fully into institutional governance, Siff insists that cabinet officers chair each of his three key IT governance committees. In addition, he adds, his own membership on the cabinet provides many opportunities to present IT in a strategic light. “When the four of us get together as an executive group, it carries weight,” he says. “When IT is suffering, it’s not executive enough; it’s plumbing.” At Griffith University, Janice Rickards credits the creation of a series of executive-chaired program boards dedicated to strategically

120
IT Governance ECAR Research Study 5, 2008
critical areas with improving stakeholder engagement in IT. “There’s still scope for more stakeholder involvement and real ownership,” Rickards says, but “having this much more structured approach with program boards, and then underneath that project boards with well-defined roles, we’re starting to get more clarity about who the business owner is.”
But enhancing IT maturity won’t require just executive sponsorship and participation in IT governance; it will demand flexible, respon-sive structures up and down hierarchies and across departmental lines, to give a voice to concerned communities and bring coherence to emerging issues in ways that decision makers can act on. At UCLA, Jim Davis cites the university’s use of management oversight groups—project-oriented, cross-unit entities that inform high-level governance decisions and develop broad priorities into concrete proposals or actions. One such group helps UCLA address the sensitive issue of moving to a standard, campus-wide collaboration and learning environment; another identi-fies research priorities and funding strate-gies, then guides IT in delivering appropriate support. Similarly, management oversight groups have been established for campus services such as campus data warehouse and identity management.
Davis thinks that a governance structure that distributes the respective endorsement responsibilities for strategy and policy, invest-ment priorities, functional and programmatic objectives, and technology deployment with different groups, far from creating confusion, helps make IT governance more responsive and decisive. The distributed structure helps focus discussions, responsibilities, and align-ment with the right people and ensures that when decisions are made, they are ultimately driven by functional need and programmatic priority. It also helps find the level of detail and the strategic message appropriate to each stage in the decision-making process. “The successful governance meeting at a
particular stage depends on the ability to have real questions on the table and, at the same time, recommendations developed enough for a substantive discussion and then deci-sion,” he says, “but not so much that it is a rubber-stamping process.”
What’s more, Davis thinks that the power to create such structures is vital to CIO success. “Management and oversight of the gover-nance structure and process by the campus Office of Information Technology,” he says, “is a most important way to have substantive influence over IT on a campus-wide basis.”
Inclusivity and ParticipationOur survey of IT governance identified a
positive association between higher levels of participation in ITG and better ITG effec-tiveness (see Chapter 6, Table 6-4). On a qualitative level, our interviewees agreed wholeheartedly. As some of the examples mentioned earlier suggest, again and again they told us that emerging issues in IT gover-nance demanded outreach to an ever more diverse constituent base, especially in the academic community. As IT increasingly moves from a stark central/local division of respon-sibilities to one in which users access services that integrate many different resources, the competence of connecting with the right communities, already important, will become essential to effective IT leadership.
Intricate institutional politics and a tendency to favor consensual decision making are both, of course, longtime characteristics of higher education. In a more complex and politicized IT environment, their impact will grow, and active efforts at inclusion are one way to minimize the surprises these cultural tenden-cies can inflict on an unsuspecting CIO. One of the things that keeps Davis awake at night, he confesses, is “how to achieve real accep-tance of a decision so the decision process continues to move forward.” Too often, he notes, a lone voice or pocket of dissent will arise suddenly after the ITG process has appar-

EDUCAUSE CENTER FOR APPLIED RESEARCH 121
IT Governance ECAR Research Study 5, 2008
ently reached an agreement, “and essentially one ‘no’ vote holds up the process.” Working with all affected groups and taking great care with developing background information that builds responsively on the progression of discussions among the ITG entities; using and documenting explicit voting processes; and documenting actions and decisions at each meeting are ways that Davis has found effective in preventing such situations.
But there’s more to inclusivity than protecting your back; it also offers a way to share the burdens and responsibilities of IT leadership—in effect, to distribute them in ways that parallel the mix of interests inherent in a hybrid central/local/commodity IT envi-ronment. “Part of my goal,” says James Hilton of his outreach efforts with faculty, “is to move governance out of the committee that sits back and critiques to a community that actually has a joint stake and joint account-ability in this stuff.” Making a similar point, Fred Siff notes that users’ passion about their IT needs translates into a desire to contribute to the decision-making process—and an expectation that they’ll be included. “My take is that everybody in the university cares about what’s happening in computing,” Siff says. “Whatever you do affects them. So you want to keep them engaged. Part of that is having a governance process that allows them to feel that they’re not being told [to do some-thing]—they’re being given an opportunity to direct the course of action.”
Communicating GovernanceInclusivity, of course, implies communica-
tion, but our interviewees emphasized it’s only the beginning of a more substantial process of effective communication with IT governance participants. As more technology decisions call for some kind of communal input and decision making, and especially as technologies get ever more deeply imbedded in the academic life of the campus, IT leaders will have to sharpen still further their ability
to articulate the strategic implications and community interests that governance partici-pants should consider.
This will involve a much more nuanced understanding of user concerns than the tradi-tional task of explaining how the technology works. “For the longest time folks in IT talked about ‘how do you speak in laymen’s terms?’” says Siff. “I think we’re past that. The real trick is how do you engage these folks, how do you get them involved in the business?”
For all of our interviewees, the answer to that question is engaging with constituents on their own terms, shaping the discussion around business and academic issues, and presenting technology as an enabler rather than an end in itself. “To me, IT governance is really busi-ness governance,” says Betty Leydon, noting that at Princeton she successfully urged the institution’s leadership to eliminate a standing IT committee of the board of trustees in order to carry IT discussions into other strategically oriented venues. Though she also maintains IT advisory committees for enterprise systems and research computing, as well as a top-level senior advisory group chaired by the provost, she is careful to ensure that IT-related issues get on the agenda of other university gover-nance bodies. “If you want to talk about IT, you should be talking in the academic affairs committee about how IT can improve the learning process,” she says, “or in the financial committee about how we can improve audit.” At Colorado State, Pat Burns points to a task force discussing how to implement blended learning as an example of how IT governance is getting more deeply involved in traditional academic decision making. Burns says that “IT governance is going to play a central role with our university curriculum committee and faculty council in terms of how we change our environment from a residential to a blended environment.”
Siff extends the point, arguing that CIOs will increasingly be required to take on the responsibility for making IT initiatives “compel-

122
IT Governance ECAR Research Study 5, 2008
ling and interesting to the entire community.” At the University of Cincinnati, Siff says, “we’re not talking about how many megs of bandwidth we have, we’re talking about our approach to plagiarism, or our approach to vulnerable systems. We want to make [the topic] policy, not operations.” Siff especially emphasizes the importance of mobilizing users’ self-interest, while also getting them to recognize institutional trade-offs and priorities as they participate in governance. By way of example, Siff notes, an institutional discus-sion of business continuity is likely to “bore people to death. But if you say you’re going to take all the systems and rank-order them in importance of protection, that gets people interested, because they want their systems to be number one.”
The CIO: More Vital Than EverSome of the issues we’ve identified as
emerging challenges for IT governance have been interpreted as the swan song of institu-tional IT in general and the CIO in particular. In the well-known formulation of Nicholas Carr, developments like software as a service and cloud computing will transform IT into a utility service dominated by commodity suppliers, thus eliminating strategic advantages in the way IT is deployed. IT leaders, Carr suggests, need to reconcile themselves to this trend: Most companies “would be best served by adopting the view that IT should be managed as a commodity input, not a strategic asset.... CIOs’ ultimate professional goal may well be to render themselves obsolete.”16
The overwhelming response of our inter-viewees was to reject this idea. “I think that’s all crap,” was Siff’s especially blunt, but not otherwise atypical, opinion. Reduced demand for institutional IT services was simply not a factor in our IT leaders’ current or anticipated experience, while recognition of IT’s strategic value, if not universal, appears to be gaining. “IT has been growing in importance,” Siff says, “and I don’t see that somehow reversing itself.
Even if it doesn’t become any more important than it is now, it’s important enough that it should be cabinet level, and there should be a well-defined governance process.”
While the interviewees did recognize many potentially transformative possibilities in the new IT environment, they pointed out that decisions related to new products and services would actually make IT governance more important well into the future. James Hilton envisions “a central IT unit going forward that is supremely good at managing relationships and provisioning from whatever source is the best deal at the time—you become more of an integrating unit than a source unit.” Yet that change implies some way to orchestrate the complex interests, resource demands, and technical dependencies of a more virtualized IT environment. “I could not imagine making [an e-mail outsourcing] decision without thor-ough review by the IT steering committee,” Dan Updegrove says. “What are the cost implications? What are the behavioral impli-cations? What do the attorneys have to say? You can crunch on this for months.”
This need for institutional review, in turn, implies a need for CIOs to take on the role of orchestra conductor. To Jim Davis, this is both a necessity and an opportunity for institutional IT leaders. “I think that the CIO is the ideal place to manage and run the governance structure for IT,” says Davis, adding that this constitutes one of his strongest, most recog-nized leadership roles on campus. “As we go down the path of dramatically changing how services are provisioned, responding to rapidly changing priorities and expectations, dealing with escalating policy and regulatory requirements, looking at truly transformative changes such as cloud computing or what-ever, it becomes even more important that the CIO is there and managing this process.”
ConclusionFrom time to time, most higher education
IT leaders probably long for what may look

EDUCAUSE CENTER FOR APPLIED RESEARCH 123
IT Governance ECAR Research Study 5, 2008
like the simpler, less political lives of their counterparts in private industry. Top-down decision making, crystal-clear performance goals, consensus about the importance of efficiency and economies of scale—wouldn’t these qualities of corporate life make it easier, and in some ways more satisfying, to oversee an enterprise’s IT governance?
Yet as IT governance researcher Ryan Peterson points out, commercial industries in the developed world have increasingly abandoned old models of vertical integration and authoritarian command-and-control management for more market-respon-sive structures that possess the strategic flexibility to survive and exploit turbulent change. In large organizations, strategic initiatives often involve acquisitions, start-up ventures, and partnerships, and international growth introduces regional complexities, all of which lead to integration challenges and central/local conflicts.
“Contemporary organizations do not have single goals,” Peterson writes; they must adopt “simultaneous strategic thrusts, in rapid and surprising manners, in order to offset competitors and satisfy customer needs.”17 IT in such organizations must provide basic, reliable infrastructure services. But IT is also called on to deliver solution integrations that leverage resources and enhance the customer experience, and to foster strategic innovations that deliver new kinds of value. Sacrificing clear hierarchical lines in favor of synergy and creativity, such organizations typically address core/periphery conflict with “federal” IT governance arrangements that balance local business unit autonomy and enterprise needs.
IT governance in this regime, Peterson argues, demands both “formal” integra-tion—the rule-based processes and struc-tures that define decision making—and “relational” integration—the participa-tory and collaborative activities that allow stakeholders to recognize differences and
solve problems. Achieving complementarity between business and IT through these means is far more important to effective IT governance than determining hierarchical control. “This emerging paradigm for IT governance,” Peterson concludes, “is based on a philosophy of collaboration where the need for distinct competencies [is] recognized and developed, and shared adaptively across functional, organizational, cultural, and geographic boundaries.”18
Sound familiar? Seen from this vantage point, higher education institutions are neither as unique as they sometimes seem nor as doomed to muddling through the governance of a peculiarly ungovernable domain. Indeed, higher education’s innova-tion-optimized, service-centered, collabora-tive practices look positively progressive when considered in the light of modern strategic imperatives, and their tolerance for messy but vital interactions can be seen as a source of strength.
The question is whether higher educa-tion institutions can take these traditional competencies to the next level, adapting to a world where “social production” makes collaboration even more intense and evanes-cent, where all systems have some of the characteristics of enterprise systems, and the enterprise itself has permeable boundaries extending around the globe. With funding likely to be permanently tight and demand always outstripping supply, IT governance that effectively harnesses the creative power of the campus community—through mature governance structures, wise and purposeful inclusivity, refined communication, and strong IT leadership—may be higher education IT’s best chance to advance a proud tradition of innovation and service.
Endnotes1. We are grateful to George Lorenzo of Lorenzo
Associates for conducting the interviews and for contributing additional material that appears in this chapter.

124
IT Governance ECAR Research Study 5, 2008
2. Yochai Benkler, The Wealth of Networks: How Social Production Transforms Markets and Freedom (New Haven, CT: Yale University Press, 2006). See espe-cially pp. 91–127.
3. Princeton University, “Information Technology at Princeton in the 21st Century: A Strategic Direction,” http://www.princeton.edu/itstrategicplan.
4. Information Technology Guidance Committee (ITGC), “Creating a UC Cyberinfrastructure: Report of the University of California” (December 2007), http://www.universityofcalifornia.edu/itgc/supdocs/welcome.html.
5. Mark C. Sheehan, Higher Education IT and Cyberinfrastructure: Integrating Technologies for Scholarship (Research Study, Vol. 3) (Boulder, CO: EDUCAUSE Center for Applied Research, 2008), available from http://www.educause.edu/ecar.
6. Judith A. Pirani, Donald Z. Spicer, and Ronald Yanosky, “Supporting Research Computing through Collaboration at Princeton University” (Case Study 2) (Boulder, CO: EDUCAUSE Center for Applied Research, 2006), available from http: / /www .educause.edu/ecar.
7. Sheehan, Higher Education IT and Cyberinfrastructure, Chapter 5.
8. Ibid., Chapter 3.9. Brad Wheeler, “In Search of Certitude,” EDUCAUSE
Review 43 (May/June 2008): 15–34; quotes p. 19.
10. Princeton University, “Information Technology,” 3.11. ITGC, “Creating a UC Cyberinfrastructure,” 6.12. Philip Goldstein, with Richard N. Katz, Academic
Analytics: The Uses of Management Information and Technology in Higher Education (Research Study, Vol. 8) (Boulder, CO: EDUCAUSE Center for Applied Research, 2005), available from http://www .educause.edu/ecar; and Ronald Yanosky, Identity Management in Higher Education (Research Study, Vol. 2) (Boulder, CO: EDUCAUSE Center for Applied Research, 2006), available from http: / /www .educause.edu/ecar.
13. Goldstein, Academic Analytics.14. Wheeler, “In Search of Certitude,” 32, 34.15. Philip Goldstein, Information Technology Funding in
Higher Education (Research Study, Vol. 7) (Boulder, CO: EDUCAUSE Center for Applied Research, 2004), available from http://www.educause.edu/ecar.
16. Nicholas G. Carr, Does IT Matter? Information Technology and the Corrosion of Competitive Advantage (Boston: Harvard Business School Press, 2004), 135, 134.
17. Ryan R. Peterson, “Integration Strategies and Tactics for Information Technology Governance,” in Strategies for Information Technology Governance, ed. Wim Van Grembergen (Hershey, PA: Idea Group Publishing, 2004), 37–80; quote p. 50.
18. Ibid., 73.

EDUCAUSE CENTER FOR APPLIED RESEARCH 125
IT Governance ECAR Research Study 5, 2008
©2008 EDUCAUSE. Reproduction by permission only.
Acadia UniversityAdelphi UniversityAlbion CollegeAngelo State UniversityAnne Arundel Community CollegeAppalachian State UniversityAquinas CollegeArizona State UniversityArmstrong Atlantic State UniversityAuburn UniversityAuburn University at MontgomeryAzusa Pacific UniversityBabson CollegeBarnard CollegeBates CollegeBenedictine UniversityBerry CollegeBethany Lutheran CollegeBig Bend Community CollegeBinghamton UniversityBlack Hawk CollegeBlack Hills State UniversityBluefield CollegeBoard of Regents of the University System
of GeorgiaBoise State UniversityBoston Architectural CollegeBradley UniversityBrandeis UniversityBridgewater State CollegeBristol Community College
British Columbia Institute of TechnologyBroome Community CollegeBrown UniversityBucknell UniversityCaldwell CollegeCalifornia College of the ArtsCalifornia Institute of TechnologyCalifornia Institute of the ArtsCalifornia Polytechnic State University, San
Luis ObispoCalifornia State Polytechnic University,
PomonaCalifornia State University, Channel IslandsCalifornia State University, ChicoCalifornia State University, Dominguez HillsCalifornia State University, East BayCalifornia State University, FullertonCalifornia State University, Long BeachCalifornia State University, NorthridgeCalifornia State University, SacramentoCalifornia State University, San BernardinoCalifornia State University, San MarcosCalifornia State University, StanislausCalvin CollegeCanisius CollegeCapilano CollegeCardinal Stritch UniversityCarleton CollegeCarnegie Mellon UniversityCase Western Reserve UniversityCatawba College
Appendix A
Institutional Respondents to the Online CIO Survey

126
IT Governance ECAR Research Study 5, 2008
Central Connecticut State UniversityCentral Michigan UniversityCentral Piedmont Community CollegeCerro Coso Community CollegeChadron State CollegeCharles R. Drew University of Medicine &
ScienceCincinnati State CollegeCity University of New YorkClackamas Community CollegeClemson UniversityCleveland Institute of ArtCleveland State Community CollegeClovis Community CollegeColby-Sawyer CollegeCollege MisericordiaCollege of DuPageCollege of Mount Saint JosephThe College of New Jersey College of Southern NevadaCollege of the Holy CrossCollin County Community College DistrictColorado CollegeColorado State UniversityCommunity College of Rhode IslandConcordia University ChicagoConcordia University, St. PaulConnecticut State University SystemCoppin State UniversityCornell UniversityDakota County Technical CollegeDalton State CollegeDartmouth CollegeDavis & Elkins CollegeDelaware State UniversityDelgado Community CollegeDelta State UniversityDominican University of CaliforniaDouglas CollegeDrew UniversityDuke UniversityEast Tennessee State UniversityEastern Connecticut State UniversityEastern Oregon UniversityEastern Washington UniversityEdinboro University of Pennsylvania
Elmhurst CollegeElms CollegeElon UniversityEmerson CollegeEmory UniversityEmpire State College SUNYEmporia State UniversityThe Evergreen State CollegeFerris State UniversityFerrum CollegeFlorence-Darlington Technical CollegeFlorida State UniversityFordham UniversityFort Lewis CollegeFranklin and Marshall CollegeFranklin UniversityFrederick Community CollegeFurman UniversityGenesee Community CollegeGeorge Fox UniversityGeorgia College & State UniversityGeorgia Institute of TechnologyGeorgia State UniversityGeorgian Court UniversityGermanna Community CollegeGlendale Community CollegeGonzaga UniversityGraduate Theological UnionGrand Valley State UniversityGranite State CollegeGrant MacEwan CollegeGreensboro CollegeHamilton CollegeHarford Community CollegeHarrisburg University of Science and
TechnologyHendrix CollegeHillsdale CollegeHoly Family UniversityHouston Community CollegeHudson Valley Community CollegeHumber College Institute of Technology &
Advanced LearningIdaho State UniversityIllinois State UniversityIllinois Wesleyan University

EDUCAUSE CENTER FOR APPLIED RESEARCH 127
IT Governance ECAR Research Study 5, 2008
Indiana State UniversityIndiana University KokomoIndiana University-Purdue University
IndianapolisIndiana University SoutheastIthaca CollegeJohn Tyler Community CollegeThe Johns Hopkins UniversityJohnson County Community CollegeKalamazoo CollegeKern Community College DistrictKeyano CollegeKutztown University of PennsylvaniaLake Forest CollegeLake Superior CollegeLander UniversityLawrence Technological UniversityLawrence UniversityLee CollegeLesley UniversityLewis & Clark CollegeLewis UniversityLincoln Memorial UniversityLinn-Benton Community CollegeLipscomb UniversityLorain County Community CollegeLouisiana State UniversityLoyola Marymount UniversityLuther CollegeLycoming CollegeLynchburg CollegeLyon CollegeMacomb Community CollegeMansfield University of PennsylvaniaMaricopa Community College DistrictMarist CollegeMarygrove CollegeMarylhurst UniversityMassachusetts College of ArtMcDaniel CollegeMedical College of GeorgiaMedical University of South CarolinaMedicine Hat CollegeMercer County Community CollegeMercyhurst CollegeMessiah College
Metropolitan Community CollegeMiami UniversityMichigan State UniversityMid-America Christian UniversityMiddle Tennessee State UniversityMiddlebury CollegeMiddlesex County CollegeMillikin UniversityMills CollegeMillsaps CollegeMinnesota State Colleges and UniversitiesMinot State UniversityMississippi University for WomenMonmouth CollegeMontana State University–BillingsMontana State University–BozemanMontana State University–Great Falls,
College of TechnologyMontgomery CollegeMoody Bible InstituteMoraine Park Technical CollegeMorgan State UniversityMount Mary CollegeMount Royal CollegeMurray State UniversityNashville State Community CollegeNevada System of Higher EducationNew College of CaliforniaNew College of FloridaNipissing UniversityNorth Dakota State UniversityNorth Idaho CollegeNortheast State Technical Community
CollegeNortheastern State UniversityNortheastern UniversityNorthern Arizona UniversityNorthern Illinois UniversityNorthern Michigan UniversityNorthwestern UniversityNova Southeastern UniversityOakland UniversityOberlin CollegeOccidental CollegeThe Ohio State University at NewarkOkanagan College

128
IT Governance ECAR Research Study 5, 2008
Oklahoma State UniversityOrange County Community CollegeOregon Health & Science UniversityOregon Institute of TechnologyOregon State UniversityOtterbein CollegeOuachita Technical CollegePacific Lutheran UniversityPeirce CollegePennsylvania College of TechnologyPepperdine UniversityPhillips Exeter AcademyPhoenix CollegePima County Community College DistrictPlymouth State UniversityPoint Loma Nazarene UniversityPomona CollegePrairie State CollegePresbyterian CollegePrince George’s Community CollegePrinceton UniversityRhode Island CollegeRhode Island School of DesignRoane State Community CollegeRochester Institute of TechnologyRockford CollegeRoosevelt UniversityRutgers, The State University of New JerseyRutgers, The State University of New
Jersey–NewarkRyerson UniversitySaint Louis Community CollegeSaint Mary’s College of CaliforniaSaint Mary’s University of MinnesotaSalisbury UniversitySam Houston State UniversitySamford UniversitySamuel Merritt CollegeSan Diego State UniversitySanta Fe Community CollegeSaskatchewan Institute of Applied Science &
TechnologySchool of the Art Institute of ChicagoSchreiner UniversitySeattle Pacific UniversitySeattle University
Shepherd UniversityShippensburg University of PennsylvaniaSiena CollegeSierra Nevada CollegeSimmons CollegeSinclair Community CollegeSmith CollegeSolano Community CollegeSonoma State UniversitySouth Carolina State UniversitySouth Dakota School of Mines &
TechnologySouth Dakota State UniversitySouthern Methodist UniversitySouthwest Baptist UniversitySpringfield Technical Community CollegeSt. Bonaventure UniversitySt. Cloud State UniversitySt. Francis CollegeSt. Lawrence UniversitySt. Mary’s College of MarylandStanford UniversityState Fair Community CollegeSUNY College of OptometrySweet Briar CollegeSyracuse UniversityTennessee State UniversityTexas A&M University at GalvestonTexas Lutheran UniversityTexas State University–San MarcosTexas Tech University Health Sciences CenterTexas Woman’s UniversityTidewater Community CollegeTri-State UniversityTrinity UniversityTulane UniversityUCLAUnion County CollegeUnited States Air Force AcademyUniversite de MontrealUniversity at Albany, SUNYUniversity of Alabama in HuntsvilleUniversity of Alaska SoutheastUniversity of AlbertaUniversity of Arkansas at Little RockUniversity of Baltimore

EDUCAUSE CENTER FOR APPLIED RESEARCH 129
IT Governance ECAR Research Study 5, 2008
The University of British ColumbiaUniversity of CalgaryUniversity of California Office of the
PresidentUniversity of California, BerkeleyUniversity of California, DavisUniversity of California, IrvineUniversity of California, MercedUniversity of California, San DiegoUniversity of Central FloridaUniversity of ChicagoUniversity of CincinnatiUniversity of Colorado at BoulderUniversity of ConnecticutUniversity of DelawareUniversity of DenverUniversity of Detroit MercyUniversity of GeorgiaUniversity of HawaiiUniversity of IndianapolisThe University of IowaUniversity of KansasUniversity of La VerneUniversity of LouisvilleUniversity of Maine at Presque IsleUniversity of Maine SystemUniversity of ManitobaUniversity of Mary WashingtonUniversity of MarylandUniversity of Maryland University CollegeUniversity of Maryland, BaltimoreUniversity of Maryland, Baltimore CountyThe University of MemphisUniversity of Michigan–Ann ArborUniversity of MinnesotaUniversity of Minnesota–CrookstonUniversity of Minnesota DuluthUniversity of MississippiUniversity of Missouri–RollaThe University of MontanaUniversity of NebraskaUniversity of Nebraska at KearneyUniversity of Nebraska–LincolnUniversity of Nevada, Las VegasUniversity of Nevada, RenoUniversity of New Brunswick
University of New HampshireUniversity of New MexicoUniversity of North Carolina at AshevilleUniversity of North Carolina at Chapel HillUniversity of North Carolina at PembrokeUniversity of North Carolina at WilmingtonUniversity of North DakotaUniversity of North FloridaUniversity of OregonUniversity of PennsylvaniaUniversity of ReginaUniversity of RichmondUniversity of San DiegoThe University of ScrantonUniversity of South CarolinaUniversity of South DakotaUniversity of Southern MaineUniversity of Southern MississippiUniversity of St. FrancisUniversity of St. ThomasUniversity of Tennessee at ChattanoogaUniversity of Tennessee at MartinThe University of Texas at ArlingtonUniversity of Texas at DallasUniversity of Texas Medical BranchUniversity of the Incarnate WordUniversity of the PacificUniversity of the Sciences in PhiladelphiaUniversity of Washington BothellUniversity of West FloridaUniversity of West GeorgiaUniversity of WindsorUniversity of Wisconsin CollegesUniversity of Wisconsin–MadisonUniversity of Wisconsin–MilwaukeeUniversity of Wisconsin–PlattevilleUniversity of Wisconsin–River FallsUniversity of Wisconsin–WhitewaterUniversity System of MarylandUniversity System of New HampshireUrbana UniversityValparaiso UniversityVassar CollegeVermont Law SchoolVermont State CollegesVillanova University

130
IT Governance ECAR Research Study 5, 2008
Virginia Military InstituteVirginia TechWagner CollegeWalters State Community CollegeWashington CollegeWashington University in St. LouisWeber State UniversityWebster UniversityWest Virginia School of Osteopathic
MedicineWest Virginia University
Western Carolina UniversityWestern Kentucky UniversityWestern Washington UniversityWhitman CollegeWichita State UniversityWilliam Woods UniversityWilliams CollegeWisconsin Lutheran CollegeYork UniversityYoung Harris CollegeZane State College

EDUCAUSE CENTER FOR APPLIED RESEARCH 131
IT Governance ECAR Research Study 5, 2008
©2008 EDUCAUSE. Reproduction by permission only.
Albion CollegeBabson CollegeBates CollegeBrown UniversityBucknell UniversityCalifornia Polytechnic State University, San
Luis ObispoCalifornia State Polytechnic University,
PomonaCalifornia State University, Channel IslandsCalifornia State University, ChicoCalifornia State University, Long BeachCalifornia State University, NorthridgeCalifornia State University, San BernardinoCalifornia State University, San MarcosCalifornia State University, StanislausCentral Connecticut State UniversityCharter Oak State CollegeColgate UniversityCommunity College of Rhode IslandCornell UniversityDartmouth CollegeDickinson CollegeEarlham College and Earlham School of
ReligionFranklin and Marshall CollegeHamilton CollegeLawrence UniversityLouisiana State UniversityMassachusetts College of ArtMassasoit Community College
Middlebury CollegeMITNorth Carolina State UniversityOberlin CollegeOccidental CollegePhillips Exeter AcademyRensselaer Polytechnic InstituteRhodes CollegeRochester Institute of TechnologySimmons CollegeSmith CollegeSonoma State UniversitySt. Lawrence UniversitySyracuse UniversityUCLAUnited States Coast Guard AcademyThe University of ArizonaUniversity of California, BerkeleyUniversity of California, DavisUniversity of California, San FranciscoUniversity of California, Santa CruzUniversity of ChicagoUniversity of DelawareUniversity of New HampshireThe University of South DakotaUniversity of Southern CaliforniaUniversity of Wisconsin–MadisonVassar CollegeVermont State CollegesWashington CollegeWilliams College
Appendix B
Institutional Respondents to the Online Executive Survey

EDUCAUSE CENTER FOR APPLIED RESEARCH 133
IT Governance ECAR Research Study 5, 2008
©2008 EDUCAUSE. Reproduction by permission only.
Adelphi UniversityJack Chen, Chief Information Officer
Black Hills State UniversityWarren Wilson, Chief Information Officer
California State Polytechnic University, PomonaDebra Brum, Vice President, Instructional and Information Technology and Chief Information Officer
College of DuPageChuck Currier, Vice President of Information Technology
Colorado State UniversityPat Burns, Vice President for Information Technology
Emory UniversityLinda Erhard, Coordinator, IT Governance and Strategic Planning
Griffith UniversityJanice Rickards, Pro-Vice Chancellor (Information Services)
Johnson County Community CollegeWayne Brown, Executive Vice President of Administration
Princeton UniversityBetty Leydon, Vice President for Information Technology and Chief Information Officer
Roosevelt UniversityBrad Reese, Vice President for Technology and Chief Information Officer
Appendix C
Interviewees in Qualitative Research

134
IT Governance ECAR Research Study 5, 2008
St. Francis CollegeGuy Carlsen, Chief Information Officer
St. Lawrence UniversitySondra Smith, Co-Chief Information Officer, Information Technologies and Director for Educational Technologies
St. Mary’s CollegeJanice Thomasson, Chief Information Officer
Sinclair Community CollegeKenneth Moore, Senior Vice President and Chief Information Officer
Springfield Technical Community CollegeEileen Cusick, Chief Information Technology Officer
Texas A&M at GalvestonSteven M. Conway, Director of Computing and Information Services
UCLAJim Davis, Associate Vice Chancellor for Information Technology and Chief Information Officer
University of California Office of the PresidentKristine Hafner, Former Associate Vice President, Information Resources and Communication
University of Central FloridaJoel L. Hartman, Vice Provost for Information Technologies and Resources
University of CincinnatiFred Siff, Vice President, Chief Information Officer, and Professor of Information Systems
University of DelawareSusan Foster, Vice President for Information Technologies
University of DenverKen Stafford, Vice Chancellor of Technology
University of MemphisDouglas E. Hurley, Vice President for Information Technology and Chief Information Officer
University of Minnesota DuluthLinda Deneen, Director of Information Technology

EDUCAUSE CENTER FOR APPLIED RESEARCH 135
IT Governance ECAR Research Study 5, 2008
University of VirginiaJames Hilton, Vice President and Chief Information Officer
University of WindsorRoger Lauzon, Executive Director of IT Services
Villanova UniversityStephen Fugale, Chief Information Officer
Webster UniversityLarry Haffner, Vice President, Information Technology


EDUCAUSE CENTER FOR APPLIED RESEARCH 137
IT Governance ECAR Research Study 5, 2008
©2008 EDUCAUSE. Reproduction by permission only.
Appendix D
Statistical DetailsNote: These tables provide additional detail for the results presented in Chapter 4, Figures 4-1 and 4-2.
Table D
-1. Ho
w O
ften In
stitutio
n Seeks A
dvice
/Receives In
pu
t, by IT G
overn
ance D
ecision
Type
Decision Type
Sr. institutional IT leader/sr.
central IT m
anagers
Cabinet-level
executivesLocal IT
managers
Business unit
leaders
Deans/
academic
unit leaders
President/chancellor
FacultyStudents
Board of
regents/ trustees
IT principles
Mean*
4.413.64
3.853.59
3.442.97
3.092.65
1.84
N437
435435
437435
436436
436437
Std. Deviation
0.8751.058
1.0320.916
0.9171.204
0.9321.016
1.024
IT investment
and prioritization
Mean*
4.583.82
3.603.43
3.193.10
2.522.00
1.99
N434
429430
431429
430431
428429
Std. Deviation
0.7321.117
1.1191.038
1.0491.294
1.0991.020
1.164
Applications
Mean*
4.483.34
3.923.95
3.502.26
3.072.40
1.49
N435
431431
434432
433432
428433
Std. Deviation
0.7871.152
1.0430.976
1.0381.152
1.0911.123
0.845
IT architecture
Mean*
4.562.59
3.952.96
2.642.03
2.401.97
1.51
N436
434433
435431
434434
431435
Std. Deviation
0.8011.312
1.0491.117
1.1181.185
1.0901.055
0.904
IT infrastructure strategies
Mean*
4.632.97
3.913.05
2.772.23
2.381.95
1.54
N437
428435
435433
434431
433435
Std. Deviation
0.7691.258
1.0891.133
1.1511.208
1.0691.022
0.921
*Scale: 1 = very rarely or never, 5 =
very frequently or always

138
IT Governance ECAR Research Study 5, 2008
Tab
le D
-2. H
ow
Oft
en P
arti
cip
ants
Mak
e Fi
nal
Dec
isio
ns
Ind
ivid
ual
ly o
r in
Gro
up
, by
IT G
ove
rnan
ce D
ecis
ion
Typ
e
Dec
isio
n Ty
pe
Sr.
inst
itut
iona
l IT
lead
er/s
r. ce
ntra
l IT
man
ager
s
Cabi
net-
leve
l ex
ecut
ives
Loca
l IT
man
ager
s
Busi
ness
un
it
lead
ers
Dea
ns/
acad
emic
un
it
lead
ers
Pres
iden
t/ch
ance
llor
Facu
lty
Stud
ents
Boar
d of
re
gent
s/
trus
tees
IT
prin
ciple
s
Mea
n*4.
443.
433.
172.
842.
762.
682.
321.
921.
68
N43
342
942
342
842
542
842
242
442
4
Std.
De
viat
ion
0.78
91.
204
1.16
71.
059
1.01
41.
308
0.98
80.
974
1.00
9
IT in
vest
men
t an
d pr
iorit
izatio
n
Mea
n*4.
533.
833.
212.
992.
833.
152.
071.
621.
99
N43
442
842
542
842
442
742
542
442
9
Std.
De
viat
ion
0.78
41.
109
1.18
21.
101
1.09
31.
382
1.02
40.
869
1.16
4
Appl
icat
ions
Mea
n*4.
523.
233.
593.
543.
072.
282.
391.
811.
49
N43
342
642
543
242
842
942
542
542
6
Std.
De
viat
ion
0.79
91.
265
1.21
61.
161
1.13
91.
264
1.12
30.
963
0.88
4
IT
arch
itect
ure
Mea
n*4.
652.
543.
462.
442.
211.
971.
851.
521.
39
N43
642
942
742
942
742
742
742
342
4
Std.
De
viat
ion
0.72
61.
364
1.25
81.
108
1.04
31.
188
0.91
60.
760
0.79
4
IT
infra
stru
ctur
e st
rate
gies
Mea
n*4.
672.
813.
462.
542.
282.
181.
811.
531.
49
N43
642
642
642
942
842
842
842
642
7
Std.
De
viat
ion
0.73
81.
389
1.27
21.
177
1.12
41.
261
0.95
80.
829
0.93
0
*Sca
le: 1
= v
ery
rare
ly o
r ne
ver,
5 =
ver
y fr
eque
ntly
or
alw
ays
EDUCAUSE CENTER FOR APPLIED RESEARCH 139
IT Governance ECAR Research Study 5, 2008
©2008 EDUCAUSE. Reproduction by permission only.
Allison, Debra H., Peter B. DeBlois, and the EDUCAUSE Current Issues Committee. “Current Issues Survey Report, 2008.” EDUCAUSE Quarterly 31, no. 2 (2008): 17, available from http://net.educause.edu/ir/library/pdf/eqm0823.pdf.
American Association of University Professors. “Statement on Government of Colleges and Universities.” http://www .aaup.org/AAUP/pubsres/policydocs/contents/governancestatement.htm.
Association of Governing Boards of Universities and Colleges. “AGB Statement on Institutional Governance.” (Washington, DC: Association of Governing Boards of Universities and Colleges, 1999). http://www.agb.org/user-assets/Documents/about/statements/governance.pdf.
Benkler, Yochai. The Wealth of Networks: How Social Production Transforms Markets and Freedom. New Haven, CT: Yale University Press, 2006.
Blustain, Harvey, with Sandra Braman, Richard N. Katz, and Gail Salaway. IT Engagement in Research: A Baseline Study (Research Study, Vol. 5). Boulder, CO: EDUCAUSE Center for Applied Research, 2006, available from http://www .educause.edu/ecar.
Camp, John S., Peter B. DeBlois, and the EDUCAUSE Current Issues Committee. “Current Issues Survey Report, 2007.” EDUCAUSE Quarterly 30, no. 2 (2007), available from http: / /connect.educause .edu/Library/EDUCAUSE+Quarterly/CurrentIssuesSurveyReport/40026.
Carr, Nicholas G. Does IT Matter? Information Technology and the Corrosion of Competitive Advantage. Boston: Harvard Business School Press, 2004.
Clark, Andrew J. “IT Governance: Determining Who Decides” (Research Bulletin, Issue 24). Boulder, CO: EDUCAUSE Center for Applied Research, 2005, available from http://www.educause.edu/ECAR/ResearchPublications/172.
Dahlberg, Tomi, and Hannu Kivijärvi. “An Integrated Framework for IT Governance and the Development and Validation of an Assessment Instrument.” In Proceedings of the 39th Hawaii International Conference on System Sciences. Los Alamitos, CA: IEEE Computer Society, 2006. http://ieeexplore.ieee.org/Xplore/login.jsp?url=/iel5/10548/ 33368/01579685.pdf?tp=&isnumber=&arnumber=1579685.
Dahlberg, Tomi, and Pirkko Lahdelma. “IT Governance Maturity and IT Outsourcing Degree: An Exploratory Study.” In Proceedings of the 40th Annual Hawaii International Conference on Systems Sciences. Los Alamitos, CA: IEEE Computer Society, 2007. http://ieeexplore.ieee.org/iel5/4076361/4076362/04076859.pdf?isnumber=4076362&prod=CNF&arnumber=4076859&arSt=236a&ared=236a&arAuthor=Tomi+Dahlberg%3B+Pirkko+Lahdelma.
De Haes, Steven, and Wim Van Grembergen. “IT Governance and Its Mechanisms.” Information Systems Control Journal 1 (2004), http://www.isaca.org/Template.cfm?Section=Home&CONTENTID=16700&TEMPLATE=/ContentManagement/ContentDisplay.cfm.
Dewey, Barbara I., Peter B. DeBlois, and the EDUCAUSE Current Issues Committee. “Current IT Issues Survey Report, 2006.” EDUCAUSE Quarterly 29, no. 2 (2006), available from http://connect.educause .edu/Library/EDUCAUSE+Quarterly/CurrentITIssuesSurveyRepo/39971.
Appendix E
Bibliography
140
IT Governance ECAR Research Study 5, 2008
Gayle, Dennis John, Bhoendradatt Tewarie, and A. Quinton White Jr. “Governance in the Twenty-First Century University: Approaches to Effective Leadership and Strategic Management.” ASHE-ERIC Higher Education Report 30, no. 1 (November 2003), http://www.wiley.com/WileyCDA/WileyTitle/productCd-078797174X.html.
Goldstein, Philip. Information Technology Funding in Higher Education (Research Study, Vol. 7). Boulder, CO: EDUCAUSE Center for Applied Research, 2004, available from http://www.educause.edu/ecar.
Goldstein, Philip, with Richard N. Katz. Academic Analytics: The Uses of Management Information and Technology in Higher Education (Research Study, Vol. 8). Boulder, CO: EDUCAUSE Center for Applied Research, 2005, available from http://www.educause.edu/ecar.
Guldentops, Erik, Wim Van Grembergen, and Steven de Haes. “Control and Governance Maturity Survey: Establishing a Reference Benchmark and a Self-Assessment Tool.” Information Systems Control Journal 6 (2002), http://www .isaca.org/Template.cfm?Section=Home&CONTENTID=16122&TEMPLATE=/ContentManagement/ContentDisplay.cfm.
IT Governance Institute. Board Briefing on IT Governance, 2nd ed., 36. Rolling Meadows, IL: IT Governance Institute, 2003, http://www.isaca.org/ContentManagement/ContentDisplay.cfm?ContentID=39649.
IT Governance Institute. COBIT 4.1: Framework, Control Objectives, Management Guidelines, Maturity Models. Rolling Meadows, IL: IT Governance Institute, 2007. http://www.isaca.org/Template.cfm?Section=COBIT6&Template=/TaggedPage/TaggedPageDisplay.cfm&TPLID=55&ContentID=7981.
Larsen, Michael Holm, Mogens Kühn Pedersen, and Kim Viborg Andersen. “IT Governance: Reviewing 17 IT Governance Tools and Analysing the Case of Novozymes A/S.” In Proceedings of the 39th Hawaii International Conference on System Sciences. Los Alamitos, CA: IEEE Computer Society, 2006. http://ieeexplore.ieee.org/iel5/10548/33368/01579689.pdf?arnumber=1579689.
Maltz, Leslie, Peter B. DeBlois, and the EDUCAUSE Current Issues Committee. “Trends in Current Issues, Y2K–2005.” EDUCAUSE Quarterly 28, no. 2 (2005), available from http://connect.educause .edu/Library/EDUCAUSE+Quarterly/TrendsinCurrentIssues2000/39912.
Peterson, Ryan R. “Integration Strategies and Tactics for Information Technology Governance.” In Strategies for Information Technology Governance, edited by Wim Van Grembergen, 37–80. Hershey, PA: Idea Group Publishing, 2004.
Pirani, Judith A., Donald Z. Spicer, and Ronald Yanosky. “Supporting Research Computing through Collaboration at Princeton University” (Case Study 2). Boulder, CO: EDUCAUSE Center for Applied Research, 2006, available from http://www.educause.edu/ecar.
PricewaterhouseCoopers. “IT Governance in Practice: Insight from Leading CIOs.” 2006. http://www.pwc.com/extweb/pwcpublications.nsf/docid/790d48a25a3505008525726d00567783.
Princeton University. “Information Technology at Princeton in the 21st Century: A Strategic Direction.” http://www .princeton.edu/itstrategicplan.
Sheehan, Mark C. Higher Education IT and Cyberinfrastructure: Integrating Technologies for Scholarship (Research Study, Vol. 3). Boulder, CO: EDUCAUSE Center for Applied Research, 2008, available from http://www.educause .edu/ecar.
Spicer, Donald Z., Peter B. DeBlois, and the EDUCAUSE Current Issues Committee. “Fifth Annual EDUCAUSE Survey Identifies Current IT Issues.” EDUCAUSE Quarterly 27, no. 2 (2004), available from http://connect.educause .edu/Library/EDUCAUSE+Quarterly/FifthAnnualEDUCAUSESurvey/39863.
University of California Information Technology Guidance Committee. “Creating a UC Cyberinfrastructure: Report of the University of California Information Technology Guidance Committee.” December 2007. http://www .universityofcalifornia.edu/itgc/supdocs/welcome.html.
Van Grembergen, Wim. “Introduction to the Minitrack IT Governance and Its Mechanisms.” In Proceedings of the 35th Annual Hawaii International Conference on System Sciences. Los Alamitos, CA: IEEE Computer Society, 2002. http://ieeexplore.ieee.org/iel5/7798/21442/00994349.pdf?arnumber=994349.
Van Grembergen, Wim. “The Balanced Scorecard and IT Governance.” Information Systems Journal 2 (2000), http://www.isaca.org/Template.cfm?Section=Home&CONTENTID=17467&TEMPLATE=/ContentManagement/ContentDisplay.cfm.

EDUCAUSE CENTER FOR APPLIED RESEARCH 141
IT Governance ECAR Research Study 5, 2008
Weill, Peter, and Jeanne Ross. IT Governance: How Top Performers Manage IT Decision Rights for Superior Results. Boston: Harvard Business School Press, 2004.
Wheeler, Brad. “In Search of Certitude.” EDUCAUSE Review 43, no. 3 (May/June 2008): 15–34, available at http://connect.educause.edu/Library/EDUCAUSE+Review/InSearchofCertitude/46604.
Yanosky, Ronald. Identity Management in Higher Education (Research Study, Vol. 2). Boulder, CO: EDUCAUSE Center for Applied Research, 2006, available from http://www.educause.edu/ecar.